the role of community participation in water production
TRANSCRIPT

University of South FloridaScholar Commons
Graduate Theses and Dissertations Graduate School
10-14-2015
The Role of Community Participation in WaterProduction and Management: Lessons FromSustainable Aid in Africa International SponsoredWater Schemes in Kisumu, KenyaErick Oniango AnangaUniversity of South Florida, [email protected]
Follow this and additional works at: http://scholarcommons.usf.edu/etd
Part of the Water Resource Management Commons
This Dissertation is brought to you for free and open access by the Graduate School at Scholar Commons. It has been accepted for inclusion inGraduate Theses and Dissertations by an authorized administrator of Scholar Commons. For more information, please [email protected].
Scholar Commons CitationAnanga, Erick Oniango, "The Role of Community Participation in Water Production and Management: Lessons From Sustainable Aidin Africa International Sponsored Water Schemes in Kisumu, Kenya" (2015). Graduate Theses and Dissertations.http://scholarcommons.usf.edu/etd/5900
The Role of Community Participation in Water Production and Management: Lessons
From Sustainable Aid in Africa International Sponsored Water Schemes in
Kisumu, Kenya
by
Erick Oniango Ananga
A dissertation submitted in partial fulfillment
of the requirement for the degree of
Doctor of Philosophy
in Geography and Environmental Science and Policy
School of Geosciences
College of Arts and Sciences
University of South Florida
Major Professor: Ambe Njoh, Ph.D.
Fenda Akiwumi, Ph.D.
Jennifer Collins, Ph.D.
Kamal Alsharif, Ph.D.
Hesborn Wao, Ph.D.
John Daly, Ph.D.
Date of Approval:
September 22, 2015
Keywords: urban-based water schemes, informal settlements, beneficiary satisfaction,
performance factors
Copyright © 2015, Erick Oniango Ananga
DEDICATION
This dissertation is dedicated to my mother Wilfrida Wadede and father Charles Okolo
Ananga, who taught me the importance of higher education; to my wife Vivian, who has been
patient with the process and supported me wholeheartedly; to my daughter Zoe Wadede who
gave me a reason to get out of bed every morning and the urge to set a good example; and to
Eileen Annette Fisher who supported me and gave me a job while undertaking my undergraduate
and graduate studies in England.

ACKNOWLEDGMENTS
First and foremost, I would like to thank my major adviser, Prof. Ambe J. Njoh for
helping me through this endeavor. He has been an inspiration to me. His teaching has motivated
me to love my continent and focus my research on water and sanitation issues in Africa. The
comments and corrections he made in this work, without doubt, have enhanced its quality. I
would also like to extend special thanks and appreciation to my supervising committee. Each
member of the committee provided invaluable support on this journey. Thank you, Dr. Fenda
Akiwumi for always listening to me and encouraging me to work hard and stick to the journey.
Thank you, Dr. Hesborn Wao for helping with the mixed methods section and ensuring the study
adhered to the scientific method. Thank you, Dr. Jennifer Collins, Dr. Kamal Alsharif and Dr.
John Daly for accepting to be on the committee and the faith and trust you have had in me. I
must stress that all the committee members have immensely helped me as a doctoral student here
at USF. I would not have done this without their support and encouragement.
I would also like to acknowledge the support provided by the following people: my best
friend Zuleika De Aguiar for reading, criticizing and adding value to all the work I completed as
a doctoral student in the United States; Sustainable Aid in Africa International for supporting my
data collection efforts; Women groups, water management committee members and water
consumer groups who participated in the focus group discussions; Carolyn Rivera for helping
with the office protocols; my brother George Ananga for helping fund part of this dissertation.

George was also very instrumental in introducing me to the academic world by going through
my undergraduate work while studying at the University of East Anglia in the United Kingdom.
My appreciation also goes to the School of Geosciences, USF, Dr. Kevin Archer, Dr.
Mark Hafen and Dr. Alfred Mbah. Dr. Archer introduced me to the Socratic teaching philosophy.
Dr. Hafen trained me on how to be an effective teacher and Dr. Mbah chaired the examining
committee. Overall, I have learnt a lot from the School of Geoscience. The teaching experience I
have gained will go a long way to help me establish a career in teaching and research.
Finally, my heartfelt appreciation goes to my wife Vivian who is the captain of the house.
I love you and thank you for listening to my constant complaints and demand for perfection in
everything we do.

i
TABLE OF CONTENTS
LIST OF TABLES ......................................................................................................................... iv
LIST OF FIGURES ....................................................................................................................... vi
ABSTRACT ................................................................................................................................. vii
1. INTRODUCTION ....................................................................................................................1
1.1 Theoretical Framework ..................................................................................................6
1.2 Research Objectives and Questions .............................................................................15
1.3 The Study Setting – Kisumu Water Schemes ..............................................................16
1.3.1 Wandiege Water and Sanitation Scheme (WWSP) ......................................19
1.3.2 Obunga Water and Sanitation Scheme (OWSP) ...........................................20
1.3.3 Asengo Water and Sanitation Scheme (AWSS) ...........................................21
1.3.4 Paga Water and Sanitation Scheme (PWSS) ................................................23
1.4 Significance of the Study .............................................................................................26
1.5 Organization of Chapters .............................................................................................28
2. REVIEW OF THE RELATED LITERATURE ......................................................................30
2.1 Historical and Theoretical Foundation of Community Participation (CP) ..................30
2.1.1 Community Participation from the African Perspective ...............................30
2.1.2 CP from the Western Perspective .................................................................33
2.1.3 CP from the Asian Perspective .....................................................................34
2.1.4 Defining Community Participation ...............................................................36
2.1.5 Community Participation Indicators .............................................................38
2.1.6 Key Studies on the Effects of CP in Water Provisioning ............................39
2.2 Gaps in the Literature ...................................................................................................49
3. METHODS ..............................................................................................................................52
3.1 Mixed Methods ............................................................................................................54
3.2 Quantitative Phase – Data Source and Sampling .........................................................57
3.2.1 Surveys ........................................................................................................57
3.2.2 Quantitative Data Analysis ...........................................................................61
3.3 Qualitative Phase – Data Source and Sampling ...........................................................62
3.3.1 Focus Group Discussions (FGDs) ................................................................62
3.3.2 Observation, Transect Walks and Photographic Evidence ...........................66
3.3.3 Qualitative Data Analysis .............................................................................66
3.4 Rationale for Using Mixed Methods............................................................................68
3.5 Selection Criteria for the Studied Schemes .................................................................70

ii
3.6 Data Quality Management Issues ................................................................................72
3.6.1 Qualitative Data ............................................................................................73
3.6.2 Quantitative Data ..........................................................................................74
3.7 Ethical Consideration ...................................................................................................75
4. EMPIRICAL EFFECTS OF CP ON BENEFICIARY SATISFACTION WITH
THE WORK OF THE WATER SCHEMES’ MANAGEMENT COMMITTEES ................77
4.1 Selected Sample Demographic Characteristics ...........................................................78
4.2 Description of Dependent and Independent Variables ................................................81
4.2.1 Beneficiary Satisfaction with the Work of the Management
Committee (DV) ....................................................................................................81
4.2.2 Participation (IV) ..........................................................................................82
4.3 The Models and Results ...............................................................................................84
4.3.1 Bivariate Logit Analysis ...............................................................................85
4.3.2 Multivariate Logit Analysis ..........................................................................86
4.4 Discussion of Findings .................................................................................................90
5. EMPIRICAL RELATIONSHIPS BETWEEN CP AND THE PRODUCTION OF
CLEAN POTABLE WATER SUPPLY IN THE INFORMAL SETTLEMENT ..................95
5.1 Description of the Dependent and Independent Variables .........................................95
5.2 Results of the Relationship between Independent and Dependent Variables ..............96
5.3 Additional Tests – Logistic Regression .....................................................................107
5.4 Discussion of Findings ...............................................................................................110
6. PARTICIPATION- RELATED FACTORS AFFECTING THE PERFOMANCE
OF THE SCHEMES………………. .....................................................................................114
6.1 Introduction ................................................................................................................114
6.2 Contributing Factors to the Success of the Schemes .................................................116
6.2.1 Networking and Collaboration ...................................................................117
6.2.2 Continuous Community Engagement/Participation ..................................119
6.2.3 The Formation of Water Consumer Groups ...............................................119
6.2.4 Coordination and Organizational Management ..........................................123
6.2.5 Extent of Institutional Formalization ..........................................................124
6.2.6 Provision of Dividends to the Community .................................................128
6.3 Impediments to the Schemes Success ........................................................................128
6.3.1 Clanism ......................................................................................................129
6.3.2 Population Increase, Poverty and Community Fatigue ...............................131
6.4 Discussion of Findings ..............................................................................................133
7. CONCLUSION ......................................................................................................................138 140
7.1 Contributions to literature. .........................................................................................138
7.2 Study Limitation ......................................................................................................140
7.3 Avenues for Future Research .....................................................................................141
REFERENCES ............................................................................................................................143

iii
APPENDIX A: IRB APPROVAL LETTER ...............................................................................174
APPENDIX B: INFORMED CONSENT FORM TO PARTICIPATE IN
HOUSEHOLD QUESTIONNAIRE SURVEY ...........................................................................176
APPENDIX C: QUESTIONNAIRE SURVEY ...........................................................................177
APPENDIX D: INFORMED CONSENT FORM FOR WOMEN FOCUS GROUPS ...............188
APPENDIX E: INFORMED CONSENT FORM FOR WATER MANAGEMENT
COMMITTEE FOCUS GROUPS ...............................................................................................190
APPENDIX F: INFORMED CONSENT FORM FOR WATER CONSUMER
FOCUS GROUP DISCUSIONS..................................................................................................192
APPENDIX G: INTRODUCTION SCRIPT AND QUESTIONING ROUTE FOR
WOMEN GROUPS FOCUS GROUP DISCUSSIONS ..............................................................194
APPENDIX H: INTRODUCTION SCRIPT AND QUESTIONING ROUTE
FOR WATER MANAGEMENT COMMITTEES FOCUS GROUP DISCUSIONS .................196
APPENDIX 1: INTRODUCTION SCRIPT AND QUESTIONING ROUTE FOR
WATER CONSUMER GROUP FOCUS GROUP DISCUSIONS ............................................198
APPENDIX J: BACKGROUND INFORMATION FOR ALL FOCUS GROUP
DISCUSION PARTICIPANTS ..................................................................................................200
ABOUT THE AUTHOR ................................................................................................... End Page

iv
LIST OF TABLES
Table 1.1: Summary of the Schemes Key Attributes ....................................................................25
Table 2.1: Key Studies Evaluating the Effect of CP on Water Supply Projects ...........................41
Table 3.1: Summary of the Research Design Employed by the Study .........................................56
Table 3.2: Community Entry Procedure by the Research Team ...................................................60
Table 3.3: Information Matrix of the Focus Group Discussions ..................................................64
Table 3.4: Characteristics of the Focus Group Discussion Participants .......................................65
Table 3.5: Summary of Selection Process of the Studied Water Schemes ...................................71
Table 4.1: Demographic and Economic Characteristics of Sampled Household .........................79
Table 4.2: Household Main Source of Water................................................................................81
Table 4.3: Household Responses to the Question “how satisfied are and your
household with the management work of the committee responsible for
managing your main source of water”.........................................................................82
Table 4.4: Participatory Indicators Used in the Models ................................................................84
Table 4.5: Bivariate Logit Results for Beneficiary Satisfaction with the work of
the Management Committees as Function of Various Participatory
Variables (n = 317) ......................................................................................................88
Table 4.6: Multivariate Logit Results for Beneficiary Satisfaction with the work of the
Management Committees as a Function of Various Participatory Variables
(n = 317) .......................................................................................................................89
Table 5.1: Relationship Between Household Satisfaction with the Smell of Water
(DV) and Main Water Source (IV) ............................................................................101
Table 5.2: Relationship Between Household Satisfaction with the Smell of Water
(DV) and Attendance to WATSAN Meetings (IV) ...................................................101

v
Table 5.3: Relationship Between Cleaning and Covering Water Storage Containers
(DV) and Main Source of Water (IV) ........................................................................102
Table 5.4: Relationship Between Cleaning and Covering Water Storage Containers
(DV) and Attendance to WATSAN Meetings (IV) ...................................................102
Table 5.5: Relationship Between being Diagnosed with Water Borne Related Disease
(DV) and Main Source of Water (IV) ........................................................................103
Table 5.6: Relationship Between Being Diagnosed with Water Borne Related Disease
(DV) and Attendance to WATSAN Meetings (IV) ...................................................103
Table 5.7: Relationship Between Willingness to Protect Areas around Water Points
from Contamination (DV) and Main Source of Water (IV) ......................................104
Table 5.8: Relationship Between Willingness to Protect Areas around Water Points
from Contamination (DV) and Attendance to WATSAN Meetings .........................104
Table 5.9: Relationship between Perception on Current Access to Water (DV) and
Main Source of Water (IV) ........................................................................................105
Table 5.10: Relationship between Perception on Current Access to Water (DV) and
Attendance to WATSAN Meetings (IV) ...................................................................105
Table 5.11: Summary of the Empirical Results between CP and Household
Willingness to Practice Better Water Handling Hygiene in the Settlements .............106
Table 5.12: Logit Results on Willingness to Practice Better Water Handling Hygiene
as a Function of Participation ....................................................................................109
Table 6.1: Percentage of Respondents Positively Reviewing Water Reliability in their
Community since 2013 (n: 317) ................................................................................116
Table 6.2: Percentage of Respondents who reported a Family member having
suffered from Water Borne Related Disease (n: 317) ................................................116
Table 6.3: Contributing Factors to the Success of the Schemes .................................................120
Table 6.4: Factors which Impeded the Success of the Schemes .................................................129
vi
LIST OF FIGURES
Figure 1.1: Map of Study Area showing the Location of Water Points .......................................17
Figure 1.2: Community Water Kiosks in Obunga Kisumu (Source: Author) ..............................18
Figure 1.3: Street in Obunga Kisumu (Source: Author) ...............................................................18
Figure 1.4: Wandiege Water Scheme Service Areas (Source: Author) .......................................20
Figure 1.5: Obunga Water Scheme Service Areas (Source: Author) ...........................................21
Figure 1.6: Asengo Water Scheme Service Areas (Source: Author) ...........................................22
Figure 1.7: Paga Water Scheme Service Areas (Source: Author) ................................................23
Figure 6.1: Asengo Water Scheme Office (Source: Author) .....................................................125
Figure 6.2: Wandiege Water Scheme Office (Source: Author) .................................................126
Figure 6.3: Obunga Water Scheme Office (Source: Author) .....................................................127
Figure 6.4: Focus Group Discussion Meeting at Paga water Scheme (Source: Author) ...........127
vii
ABSTRACT
Few studies have attempted to determine the tenability of Community Participation (CP)
theory is explicating Water Production and Management dynamics in Urban Informal
Settlements. Consequently, several gaps exist in knowledge of the value of this important theory
for efforts to improve water service delivery in such settlements. The main purpose of this study
is to contribute to efforts addressed to filling these gaps. Four water schemes established by
Sustainable Aid in Africa International in partnership with different communities in the informal
neighborhoods of Kisumu Kenya are used as empirical referent. The study is guided by the
following three Research Questions; 1) what is the relationship between community participation
and beneficiary satisfaction with the work of the water management committees in the four
schemes? 2) what are the contributions (positive or negative) of community participation on the
production of clean potable water supply in the informal settlements? 3) what are the
participation-related factors affecting the performance of the schemes?
Uncovering answers to these questions entailed the use of a mixed methods approach.
The approach involved the application of both quantitative and qualitative techniques. The
former was employed mainly to answer the first two Research Questions and latter to deal with
Research Question Three. The quantitative component of data collection involved administering
a survey questionnaire through a simple random sampling technique. Logistic Regression and
Chi-square Tests were employed to analyze the quantitative data. In the qualitative phase, Focus

viii
Group Discussions, Observation, Transect Walks and Photographic evidence was used to collect
data analyzed through Constant Comparison Analytic technique.
For Research Question One, the logistic regression results indicate that five participatory
variables are significantly associated with beneficiary satisfaction with the work of the water
management committees. These are provision of paid or unpaid labor to the water schemes,
household willingness to intervene against pipe vandalism, meeting attendance, willingness to
contribute money or time to the community water scheme and whether a household has ever
made a complaint about water supply/quality issues. For Research Question Two, the chi-square
test shows that households who use community managed water schemes and attend water and
sanitation meetings tend to practice better water handing hygiene in the settlements. For
Research Question Three, the following factors are identified to be either aiding and/or impeding
the success of the schemes; networking and collaboration, continuous community
engagement/participation, the formation of water consumer groups, coordination and
organizational management, extent of institutional formalization, provision of dividends to the
community, clannism, population increase, and poverty and community fatigue.
This dissertation sheds new light on the role played by CP in managing vital resources
such as water in urban informal settlements/neighborhoods. An important policy contribution is
that CP can be used as a viable strategy in the establishment of effective water schemes in urban
informal settlements. Furthermore, it can act as an antidote with regards to water quality
improvements in urban informal settlements/neighborhoods.

1
1. INTRODUCTION
Global population increase continues to create new challenges on the management of
natural resources. Studies by Chitonge (2014), Hopewell and Graham (2014) and Gleick (2014)
suggest that in the coming years the challenge will be phenomenal in emerging cities in Africa. It
is projected that the urban population growth on the continent will double between 2000 and
2030 (Alabaster, 2010). The growth will be more pronounced in cities where the population is
below one million with the majority of the inhabitants living below the poverty line (Torres,
2012; Van der Bruggen et al, 2010). Three factors at the root of this unprecedented growth
include natural increase, reclassification of rural areas as urban centers, and most importantly,
rural-urban migration (Chitonge, 2014; Hardoy et al, 2014; Satterthwaite, 2014). The daunting
task facing local authorities is how to adequately supply clean potable water to the
predominantly poverty stricken urban dwellers (Bakker et al, 2008).
Experts have proposed varied management mechanisms targeted at improving access to
water in the developing world (Ghai et al 2014; Gleick, 2000; 2003; Mitchel, 2005; Pahl-Wostl,
2007; World Bank, 1993; 2004). The most notable among the suggested models is the demand-
responsive approach as opposed to the traditional supply driven interventions (Naiga et al, 2012;
Nicole, 2000; World Bank, 1998). The demand-responsive approach was popularized in Africa
in the 1990s by major development organizations such as the World Bank. The concept is
anchored in the idea of Community Participation (CP) which advocates greater beneficiary
involvement in water service production and management (Whittington et al, 2009). It includes

2
beneficiaries taking the initiative to demand improved water services while at the same time
taking a leading role in project design, implementation, development and sustainability. The
demand-responsive approach requires beneficiaries to own the system by constantly making
meaningful contributions either in the form of cash or labor to community-based water projects
(Sara & Katz, 1998). It is premised on the belief that such involvement ultimately leads to better
designed projects, better targeted benefits and more cost-effective and timely delivery of water.
Most significantly, CP is seen as effective in terms of equitable distribution of water and in
curtailing corruption and other rent-seeking activities (Asian Development Bank, 1998; DFID,
2000; World Water Forum, 2000).
Several water projects in rural villages in Africa and Asia have been established based on
the demand-responsive model with the following studies heralding its success (Engel,
Iskandarani & Useche, 2005; Cleaver, 1996; Isham & Kahkonen, 2002; Isham, Narayan &
Pritchett, 1994; Kleemeier, 1995; 1998; 2000; Manikutty, 1995a; 1995b; 1997; Narayan, 1995;
Prokopy, 2004; 2005; 2009; Russ & Takahashi, 2013). Few studies have attempted to determine
the tenability of CP theory in explicating water production and management dynamics in urban
informal settlements. Consequently, several gaps exist in knowledge of the value of this all-
important theory for efforts to improve water service delivery in such settlements. The main
purpose of this study is to contribute to efforts addressed to filling these gaps. It accomplishes
this objective mainly by exploring and evaluating the effectiveness of CP theory in water
production and management in urban informal settlements/neighborhoods. Specifically, the
study examines the nature and role of CP in water service delivery in urban informal
settlements/neighborhoods in the city of Kisumu, Kenya. Four water schemes established and
3
funded by Sustainable Aid in Africa International (SANA), in partnership with different
communities in the informal settlement of Kisumu, are examined.
SANA is a non-governmental organization (NGO) located in Kisumu. The organization
was established from the Kenyan Rural Domestic Water Supply and Sanitation Program in 2003.
The mission of SANA is to contribute to the improvement of access to safe water and proper
sanitation for people through the promotion of CP and sustainable technologies. SANA has four
main objectives: (1) To promote and be actively engaged in the provision of urban water supplies
and environmental sanitation; (2) To train communities on current health related techniques and
assist them in capacity building for water sustainability at the community level; (3) To promote
overall natural resource management with emphasis on environmental concerns at the
community level; and (4) To mobilize and distribute funds and other resources for the promotion
of water, health and sanitation issues.
Currently, through the use of participatory techniques, SANA has established and funded
several water schemes in Kisumu. This study focuses on examining four schemes. These are
Wandiege Water and Sanitation Scheme (WWSP), Obunga Water and Sanitation Scheme
(OWSP), Asengo Water and Sanitation Scheme (AWSS), and Paga Water and Sanitation
Scheme (PWSS). The four water schemes offer a rare opportunity for examining the tenability of
CP theory in explicating water production and management dynamics in urban informal
settlements/neighborhoods.
Before proceeding it is important and necessary to provide a brief definition of three
important terms used throughout this study. These are Urban Informal Settlement
/Neighborhoods, Water Production and Water Management. There are several definitions for the
term urban informal settlements. The most prominent of these include unplanned settlements,

4
squatter settlements, marginal settlements, unconventional dwellings, non-permanent structures,
inadequate housing and slums (Hofmann et al 2008; Huchzermeyer & Karam, 2006;
Huchzermeyer, 2004). This study adopts the definition advanced by the United Nations (UN).
According to the UN (e.g. 2007), informal settlements/neighborhoods are settlements having the
following characteristics: (1) lack structured planning, (2) has an informal or insecure property
tenure, (3) has limited participation in government activities which leads to inadequate service
provisioning, and (4) has a vulnerability to discrimination for the residents. This definition is
considered apropos for the present study because it encapsulates most of the essential
characteristics of informal settlements. The first two characteristics are based on the physical
and/or the rule of law constraints, while the third and fourth fall under the social constraints
domain. The four schemes used as empirical referents in this study are located in places which
according to the UN definition would be considered as informal settlements.
Equally important are the terms, Water Management and Water Production. Water
management can be considered as an essential component of water production. Generally,
prudent water management techniques has shown to be beneficial to society in regards to
ensuring efficiency, maximizing equity and reducing environmental damage through the
promotion of greater public participation (Brooks, 2006). Unfortunately, a lack of clarity in the
definition of the two terms still remains in existing literature. Water production simply refers to
activities and processes involved in making water available and suitable for human
use/consumption. On the same token, water management can be considered a part of water
production; however, it is a concept which often becomes significant after water is produced.
That is, after all the processes needed to make water available or run through the taps have been
achieved. According to Brooks (2002), water management involves activities or actions geared

5
towards getting the most from the produced water. Deverill (2001) called these actions practical
strategies which are targeted at improving efficiency, distributional equity and sustainable use of
water. Savenjie & van der Zaag (2002) defined water management as the development and
implementation of mechanisms aimed at managing water demands. The outcome is to ensure
efficient and sustainable use of water as a scarce resource.
Brook (2006) goes further in providing a well thought definition of what the term water
management ought to be. He asserts that water management should reflect a series of steps that
bring water from source to use. Thus, water management can be viewed within the prism of any
method, whether technical, economic, administrative, financial or social that will accomplish one
or more of the following four items. (1) Managing the quantity or improving the quality of water
needed in accomplishing a particular task. (2) Reducing the loss in quantity or quality of water as
it flows from its source through use to eventual disposal. (3) Shifting the timing of use from peak
hours to off peak periods for purposes of making water more equitable. (4) Increasing the ability
of the water system to continue to serve society during times when water is limited. Along the
same vein, Crigg (1996, pg. 6) compared water management to the art of building a house. Crigg
asserted that before building a house we need policies, plans, specifications, codes, materials,
builders with specific skills and buyers. As building a house has a set of rules, water
management also has a set of rules. However, they are more complex than building a house. This
is because it involves policies and plans for guidance, rules and codes, materials for construction
and operation, teamwork, skills, customers and water users. It is a complex and multifaceted
undertaking.
From these definitions it is apparent that the term water management and water
production are intertwined. It will be impossible to pick one away from the other. Overall, we

6
can think about water production and management both in terms of technology and policy
(Brook, 2006). These may include issues such as piping, tap installation, chlorination, pricing,
managing expectations, balancing losses and even human emotional issues which might be
related to water. Ultimately, this is where citizen participation becomes an essential element in
water production and management.
As correctly argued by Crigg (1996) in this century managing water resources requires
skills and approaches that goes beyond pure engineering, science, management or law. To ensure
efficiency, equity, and sustainable use of water citizen participation is necessary especially in
developing countries and specifically in cities such as Kisumu where water is considered a scarce
resource. Word Health Organization and Unicef (2006) estimated that in Sub-Saharan Africa
between the year 1990-2004, the number of people without access to clean potable water
increased by 23 percent. At the same time, the region experienced 85% increase in its urban
population with the majority of people having no access to safe drinking water (Ibid). The focus
of this study is to examine the role which citizens can play in water production and management
in urban informal settlements and specifically in Kisumu, Kenya.
The study contains seven chapters. This introductory chapter progresses in the following
order. The next section discusses the broader theoretical framework within which this study is
situated. Following this is a presentation of the study objectives, research questions, study area,
and its significance in environmental policy and planning. It ends with an outline of the
remaining six chapters.
1.1 Theoretical Framework
The management of water resources in the developing world has traditionally been
considered as a government responsibility in accordance with the supply driven model (Lane,

7
2006). Advocates of state-controlled strategies argue that access to water is a human right and
that it is the state’s obligation to ensure its access to the public (Gleick, 1994; Prasad, 2006;
Scanlon, Cassar & Nemes, 2004; Trawick, 2003). More significantly, because of the huge capital
investment required in water supply services, proponents believe that only the state has the
capacity to guarantee its equitable distribution especially in poor neighborhoods. In fact, state-
control advocates stress that water should never be treated primarily as a commodity based on
the market principles. This is because markets are purely driven by profit motives (Prasad,
2006). Overall, such arguments imply that the state has the capacity and duty to provide water
services to everyone (Johnston, Gismondi & Goodman, 2006; Laxer & Soron, 2006). In this
scenario, the state, through municipalities, therefore assumes full responsibility in the production
and management of water resources. This has historically been the case in most developing
countries. A few specific cases include the Kenya Water Resources Management Authority and
the Cameroon National Water Company (Fongong et al, 2004), and the Ghana Water and
Sewerage Corporation before the establishment of the community co-management models
(Fuest, 2005).
In the mid-1980s, water supply systems in many developing countries began
experiencing major problems with regards to quality, reliability, and coverage (Irwin, 1997;
McIntosh, 1997). These problems arose due to the failure by most states in meeting their
obligations (Panayotou, 1997). Several studies reported that local and national governments were
reluctant to invest in improving water infrastructure (Bayliss, 2003; Bakker et al, 2008; Bakker,
2010). Customer care was poor and taps continued to dry up due to spillage and wastage
especially in poor neighborhoods (Savedoff & Spiller, 1999). The situation became worse and
untenable by the early 1990s when most states failed to offer viable solutions to these problems.

8
Under such circumstances policy makers begun to prescribe a series of reforms with the most
notable one being privatization of the water sector (Prasad, 2007).
Private sector participation, although controversial, became fashionable as an alternative
strategy for managing water resources in the developing world in the early 1990s (McGranahan
& Mulenga, 2009). This was after the complete failure of supply-driven interventions
popularized by the state. It was argued that privatization would expand service coverage to the
poor, bring in the needed investment, relieve government from the problems of budget deficits,
and most importantly, lead to improvements in efficiency and performance by reducing red tape
(Cross & Morel, 2005; Davis, 2005; Kerf et al, 1996; Naegele, 2004; Shirley, 2002; UN DESA,
2004). Indeed, the ideological arguments in favor of privatization of the water service delivery in
the developing world were backed by empirical evidence. The most prolific amongst the studies
undertaken on water privatization debate was completed by Estache and Rossi (1999). This study
focused on urban centers in the Asian countries. By using a 1995 survey data assembled by the
Asian Development Bank, the study compared the performance of private water and public water
utilities. The variables of interest were productivity indicators operationalized as simple input-
output relations (e.g. the number of workers per client or connections). A stochastic cost frontier
method was employed to analyze the data. Results from the study showed that privately-operated
water utilities were more efficient than those which were publicly managed.
Another significant study by Estache and Kouassi (2002) analyzed outcomes in water
service delivery in African countries where privatization had taken root as an optional
government policy. Based on panel data sampled from 121 different African water utilities
between 1995 and 1997 and using stochastic and parametric frontiers technique, the study found
that private ownership was associated with a lower inefficiency score than publicly run water

9
utilities. The inefficiency of public water utilities was exemplified by among other things, the
rate of corruption existing in government institutions. Other noteworthy studies which have
shown that private water utilities perform better than publicly owned utilities include Clark
Kosec & Wallsten, 2004; Kirkpatrick et al, 2004; Shirley & Menard, 2002; and the World Bank,
2004.
However, contrary to the foregoing positive findings are studies which show that
privatization has no effect on efficiency, productivity or improvement of water access in poor
neighborhoods. For instance, Clarke and Wallsten (2002) found that while private sector
participation in water service delivery leads to more supplies to poorer households, there may be
offsetting service difficulties and higher charges when supplies are privatized. Similarly, an
empirical study by Bayliss (2002) reported that privatization created negative impacts on the
poor in terms of job losses, decreased earnings, and reduced access to services. Birdsall and
Nellis (2003) found that privatization resulted in income disparity between people thus
expanding the inequality gap between the rich and the poor. A case in Puerto Rico, as reported
by Interpress (1999), deserves mention here. According to Interpress, a state-run water
management system completely collapsed immediately after a privatized French multinational
company, Vivendi, took over. With Vivendi as the managing authority, an audit by Interpress
found that there were deficiencies in management and repairs, financial reporting, addressing
consumer concerns, and water service billing and record-keeping. In an extensive review of
water utility ownership, Braadbaart (2002), found that privately-owned utilities were not more
efficient than their publicly-run counterparts.
The point here is that each side in the debate between privatization versus state delivery
of water supply services presents a passionate argument. Empirical research conducted on the

10
two approaches is inconsistent depending on the type of study or data researchers prefer to
review. It is also important to restate that the two approaches are tethered on the traditional
supply-driven intervention model, which has a somewhat limited role for public participation.
There is a third approach which has been entertained in the water service delivery sector.
This approach, also known as the demand responsive approach calls for CP in water resource
management. Proponents of this approach argue that it can be used as an alternative strategy in
improving water access to the poor. This study focuses mainly on this topic. That is, the demand-
responsive approach subsumed under the CP ideology as an alternative approach in water
resource production and management.
The ideological reasoning behind the acceptance of CP theory in development planning is
varied (Harvey and Reed, 2007). In Africa the idea gained currency in the 1960s and specifically
in the donor funded projects (Wood, 2003). However, as Njoh (2003) and Svendsen and Teisen
(1969) have argued, participation had long been practiced in pre-colonial Africa where it was
common to see community members working together for the purpose of executing local
development projects. In Tanzania, as noted by Svendsen et al. (1969), communities collectively
engaged in activities such as building schools, roads and community village health posts using
their own labor and materials. Similarly, in Kenya under the presidency of Jomo Kenyatta and
leadership of Jaramogi Oginga Odinga, communities in the spirit of participation coined a
Kiswahili term, Harambee, meaning pulling together for purposes of development (Smith, 1992).
The same is documented in South Africa prior to the European colonization era where chiefs
were required to solicit community views before exercising their powers (Mansuri &Rao,
2013).To this Njoh (2003) added, colonial authorities working in Africa had no alternative but to
incorporate CP as a component of their development planning agenda. In fact as further

11
articulated by Njoh (2006; 2010), two factors remain to account for the significance of CP in
Africa tradition and ethos. The first is its contextual relevance in maximizing utility of scare
resources like water or land. The second, Njoh argues is its compatibility with the democratic
principles, a concept widely practiced in the African continent before the arrival of the
Europeans.
Several factors have contributed to the recognition of CP as a major tool for success in
different development projects especially in the water service sector in Africa (DFID, 2006). The
World Bank lists some of the reasons why they promote CP in their projects (Lamb, Varettoni
and Shen, 2005). First, it is recognized that national and local governments have failed to
effectively manage development projects and programs under their charge. The second is based
on the notion that development workers have a moral obligation to listen to the needs of the
beneficiaries. Third is the litany of empirical evidence showing positive outcomes for projects
where CP techniques have been administered. Finally, CP is seen to be effective in terms of
inclusion. In Africa, women overwhelmingly bear the burden of water collection (Kehler, 2013).
Despite this, their voices are often excluded in the decision-making processes which in fact
render them as passive actors in the development process. The process of exclusion does not only
end with women but extends to the chronically poor who are often viewed as short term
maximizers of utilities. In this respect, participation provides an avenue for such groups to
express their opinions, experiences or desires (Bhasin, 1985; Chambers, 1983; Fals-Borda, 1988;
Rahman, 1987).
Besides, arguments presented by the World Bank, there are other reasons validating the
use of CP as an alternative strategy in water production and management. Most prominent
among them, according to McCommon et al (1990), is the spillover effects on other development

12
sectors within the community. These include benefits such as improved health care facilities,
recovery of financial costs or potential financial savings. Mansuri and Rao (2004) argue that,
participation leads to an empowered beneficiary community who are better trained in managing
more complex community services. Thus, the new skills gained by the community through
training will prepare them for participating in other sectorial development activities.
Additionally, the experiences acquired in such trainings increases the community’s power over
local issues thus creating a domino effect on other development initiatives. Carter et al (1999)
reinforces this point, by arguing that the concept of participation was embraced especially by
governments unable to deliver or maintain services to the people. Such governments used the
success of participation in development projects as an opportunity to relinquish their
responsibility of managing public services.
According to Bakker (2008), a significant factor which brought forth the application of
CP in water production and management was the failure of privatization. He asserts that by the
mid-2000s, it had become clear that water privatization initiatives were failing to achieve some
of their declared objectives. This was more visible in poor neighborhoods where the private
sector was reluctant to invest. In fact, field studies in mid-2000 indicated that despite the huge
amount of resources ploughed into the privatization agenda, water access in poor neighborhoods
was deteriorating (Byliss & Fine, 2007; Hukka & Katko, 2003; McDonald & Ruiters, 2005).
Furthermore, most of the large multinational organizations which had embraced the privatization
bandwagon begun to withdraw from the contracts they had earlier committed themselves to. In
order to mitigate such problems, Bakker (2008) contends that participation had to be
reintroduced as a viable tool in solving the quagmire. Bakker’s argument has been advanced
further in a seminal review by Mansuri and Rao (2013) titled Localizing Development- Does

13
Participation work. In this work, the two scholars argue that participation has become popular
because it has provided what the market/the state had failed to achieve. That is, (1) aligning
development priorities with those that reflected beneficiaries’ goals; (2) promoting dialogue
between beneficiaries and their development partners; and (3) expanding resources which were
not previously accessible to the poor. Most importantly, participation as theorized by Mansuri et
al. (2013) or Chambers (1997) is seen as being helpful in checking elite preferences and
replacing them with the desires of the poor.
It is worth noting here that Mansuri’s and Rao’s arguments on the power of CP are
intertwined with those advocated by the decentralization advocates (see, e.g., Adamolekun,
1991; Agrawal & Ribot, 1999; Anderson & Ostrom, 2008; Crook & Manor, 1998; WRI, 2003).
Generally, proponents of the decentralization scholarship promote it on the basis that it reduces
the gap between the government and the people thus creating an avenue for audit. In a
decentralized government, just like in a perfectly operated community water project, the citizens
are able and are allowed to voice their preferences and needs to the overseeing authority. They
are also able to monitor performance, and in so doing, improve transparency and accountability
within the system. Enhanced accountability thus translates to improved service delivery to the
poor and the marginalized. A similar observation was made in a well-argued essay by
McGranahan and Mulenga (2009). They posit that the process of participation is central in
making markets or governments to work better for the people.
The theory of CP as an alternative approach in development planning is, however, not
shared by everybody. Abraham and Platteau (2004) warn that on the basis of power structures
which exist in paternalistic societies, the process of participation may be inherently subject to
elite capture. Mansuri and Rao (2004) extend this observation by noting that the exercise of
14
voice and choice as advocated in participatory development may add some costs to the poor. In
other words, the process of participation may involve financial losses due to the productive time
it takes away from the poor. Fuest (2005) criticized participation based on the ground that it is an
additional burden on the poor to require them to pay users’ fee for water. Atempurgre (1997),
Gary (1996), and Ioris (2007) contented that just like privatization theory, CP is probably a
reflection of the far-fetched neo-liberal Western ideas being exposed through the Bretton Woods
institutions on the vulnerable. Parfitt (2004) puts it vividly that, participation is simply another
seductive method used by development agencies to pursue top down development agendas. This
is the same argument that was advanced by Hickey and Mohan (2004). They noted that at times
the process of participation may mutate with existing power structures and political systems thus
further disenfranchising the poor.
Others like Burkey (1993), Oakley and Mardsen (1984), and Stiefel and Wolfe (1994)
saw participation as a technocratic and paternalistic activity designed to manage natives as
objects or as unpaid hands in self-help schemes. Indeed, in such schemes the roles allocated to
natives, they contend, is often manual and minimal. Locals hardly make decisions and any
involvement serves as a means of indoctrinating them into the values and priorities of the
bureaucrats. More precisely in the African context, Larson and Ribot (2004) drew attention to the
problem of distributional inequality. Participation through elected or traditional authorities is the
same as modern day colonial indirect rule.
Nagle (1992) and Mosse (2002) have advanced some of the strongest empirically-
supported criticisms against participation. In a study of USAID water projects, Nagle found that
the promotion of CP techniques may lead to an increase in management and administrative staff.
This was because organized communities were only happy to interact with staff who were

15
considered high within the management strata. Along the same vein, Mosse found that
participatory exercises are mostly public events and are open ended regarding target groups.
Because of this, they are inherently political and reflect local relations of power and gender.
Despite of the aforementioned criticisms, the concept of CP has been widely used in
establishing rural water schemes in Africa. Yet, it is also accurate to assert that CP’s quantitative
effects remains to be thoroughly researched or documented in African urban space. In fact, very
little attention has been given to monitoring and evaluating community-operated urban water
schemes located in informal settlements. More priority has been accorded to research on public
versus private provisioning of water supply services or the effects of CP in rural water supply
systems. The present study seeks to fill this gap by exploring and evaluating the tenability of
community participation theory in explicating water production and management dynamics in
urban informal settlements.
1.2 Research Objectives and Questions
The primary task in this study is to examine the nature and role of CP theory in water
service delivery in urban informal settlements. Four water schemes established by SANA in
partnership with different communities in Kisumu informal settlements are examined. The study
seeks to attain the following three specific objectives which are guided by three research
questions.
Objectives
1. To examine the relationship between CP and beneficiary satisfaction with the work of the
water management committees in the four schemes established by SANA.
2. To evaluate the contribution (positive or negative) of CP on the production of clean water
supply in informal settlements in Kisumu.

16
3. To evaluate the participation-related factors affecting the performance of the schemes.
Research Questions
1. What are the relationship between CP and beneficiary satisfaction with the work of the water
management committees in the four schemes?
2. What are the contributions (positive or negative) of CP on the production of clean potable
water supply in the informal settlements?
3. What are the participation-related factors affecting the performance of the schemes?
The responses to these questions are guided by the following hypotheses which hinge on
well-established knowledge on the theory of CP in development planning.
H1 CP will lead to increased beneficiary satisfaction with the work of the water management
committees.
H2 Households participating in water meetings and relying on community managed water
schemes will tend to practice better water handling hygiene than households who do not.
H3 There are several participation-related factors which may affect the performance of
urban-based community operated water schemes.
1.3 The Study Setting - Kisumu Water Schemes
The four water schemes examined in this study are located in informal settlements in
Kisumu, Kenya (Figure 1.1). The city of Kisumu is situated in western Kenya, adjacent to Lake
Vitoria, the second largest fresh water lake in the world. Its proximity to this large body of
freshwater notwithstanding, Kisumu faces significant water shortage problems. Yet, water is not
the city’s only problem. It faces problems arising from poor town planning (Kisumu City
Development Strategies 2004-2009). This problem is more acute in the informal areas of the city.
Here, more than anywhere else in the city, buildings are congested with heaps of garbage and

17
streams of raw sewage flowing along narrow alleyways (Figure 1.2 & 1.3). Approximately 75
percent of informal settlement residents live in temporary and semi-permanent structures
(Maulidi, 2012).
Figure 1.1 Map of Study Area Showing the Location of Water Points
The water problem in Kisumu presents a unique challenge. According to a report by the
Kisumu City Development Plan (2014), tap water service is irregular in the informal settlements.
Consequently, most residents depend on water vendors, nearby rivers and water from private
boreholes to meet their fresh water needs (Otieno, 2013; Owuor et al, 2012). These alternative
freshwater sources present significant health risks. They are poorly planned and are often located
close to known agents of ground water pollution such as pit latrines. In fact, the frequent
outbreaks of waterborne diseases such as cholera and typhoid in Kisumu are arguably a function
of the city’s poorly planned water supply system (Maoulidi, 2011).

18
Figure 1.2 Community Water Kiosks in Obunga Kisumu (Source: Author)
Figure 1.3 Street in Obunga Kisumu (Source: Author)
19
Over the years, there have been many, sometimes disparate initiatives aimed at
addressing the city’s water problematic. During the last ten years SANA has played a leading
role in this regard. It has worked with communities in Kisumu on various water schemes.
Serving mainly in a funding and technical capacity, SANA’s aim has been to improve water
service delivery. Sustainable Aid in Africa International (SANA) has funded four water schemes
in the city. The four schemes are: (1) Wandiege Water and Sanitation Scheme, (2) Obunga Water
and Sanitation Scheme, (3) Asengo Water and Sanitation Scheme and, (4) Paga Water and
Sanitation scheme. This study primarily focuses on examining the effectiveness of these schemes
which were established under the auspices of CP. The hope of SANA was that the schemes if
properly managed by the communities would reduce the burdens of acute water shortages in the
informal settlements. A description of each scheme is in order.
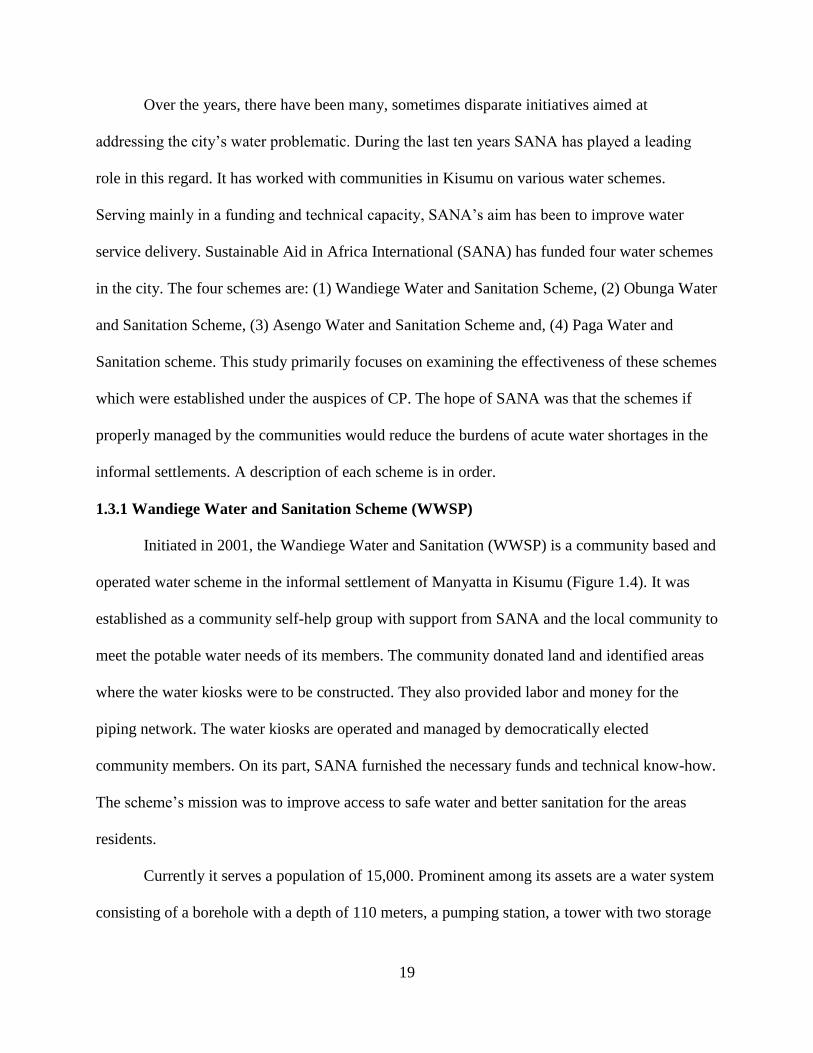
1.3.1 Wandiege Water and Sanitation Scheme (WWSP)
Initiated in 2001, the Wandiege Water and Sanitation (WWSP) is a community based and
operated water scheme in the informal settlement of Manyatta in Kisumu (Figure 1.4). It was
established as a community self-help group with support from SANA and the local community to
meet the potable water needs of its members. The community donated land and identified areas
where the water kiosks were to be constructed. They also provided labor and money for the
piping network. The water kiosks are operated and managed by democratically elected
community members. On its part, SANA furnished the necessary funds and technical know-how.
The scheme’s mission was to improve access to safe water and better sanitation for the areas
residents.
Currently it serves a population of 15,000. Prominent among its assets are a water system
consisting of a borehole with a depth of 110 meters, a pumping station, a tower with two storage

20
tanks of 10,000 liters each, a pipeline system of 10 kilometers, 24 water kiosks, 148 metered
connections, a chlorine dozer for water treatment and an office building (SANA, 2014).
Figure 1.4 Wandiege Water Scheme Service Areas (Source: Author)
1.3.2 Obunga Water and Sanitation Scheme (OWSP)
Established in 2003, the Obunga Water and Sanitation Project (OWSP) is also a
community operated scheme (Figure 1.5). It was initiated under the Kenyan Government Water
Reform Act of 2002. The Act accorded autonomous companies the responsibility of providing
water and sanitation services in urban areas. However, it gave them a list of principles to abide
by which included considering water both as a social and an economic good. In this spirit, the
Kisumu Water and Sewerage Company (KIWASCO) collaborated with SANA to implement a
community water management model in Obunga. The model known as the delegated

21
management model (DML) involves selling water to the community in bulk at a subsidized
price. In turn, beneficiaries are responsible for pipe layout and repairs, tariff collection, policing
of pipes and revenue submission to KIWASCO. Presently OWSP serves a population of 30,000.
Its assets include three water storage tanks, 60 water points and several water kiosks.
Figure 1.5 Obunga Water Scheme Service Areas (Source: Author)
1.3.3 Asengo Water and Sanitation Scheme (AWSS)
Asengo Water and Sanitation Scheme (AWSS) is a part-gravity and part-diesel operated
scheme located in the north of Kisumu (Figure 1.6). It was established in 2005 as a joint venture
between SANA and the community. Specifically, SANA provided the initial financial support
for upgrading the spring water which the community previously relied on. They also provided

22
the necessary technical support. The community provided labor, land and furthermore identified
construction locations for the intake tanks. What makes this project unique is that the initial
financial assistance of $40,000 USD from SANA was advanced to the community as a soft loan.
The community has been able to steadily repay the loan.
Figure 1.6 Asengo Water Scheme Service Areas (Source: Author)
Today the scheme is under the direct management of a community elected board of
trustees. Its assets include two intake tanks and six water kiosks. It serves a population of over
20000 members (SANA, 2014).

23
1.3.4 Paga Water and Sanitation Scheme (PWSS)
Located on the western side of Kisumu, the Paga Water and Sanitation Scheme (PWSS)
was established in 1989 (Figure 1.7). The original funding for the scheme was sourced from the
Kenyan Government under the Kisumu City Slums and Peri-Urban Poverty Alleviation Program.
Initially, the funds were used to build a 10,000 liter tank, a 3 kilometer pipe line and to purchase
a diesel pump intended for pumping water from Lake Victoria to the feeder tank. The scheme
served the community for two years until the diesel pump was stolen resulting in the project’s
interruption in 1992.
Figure 1.7 Paga Water Scheme Service Areas (Source: Author)
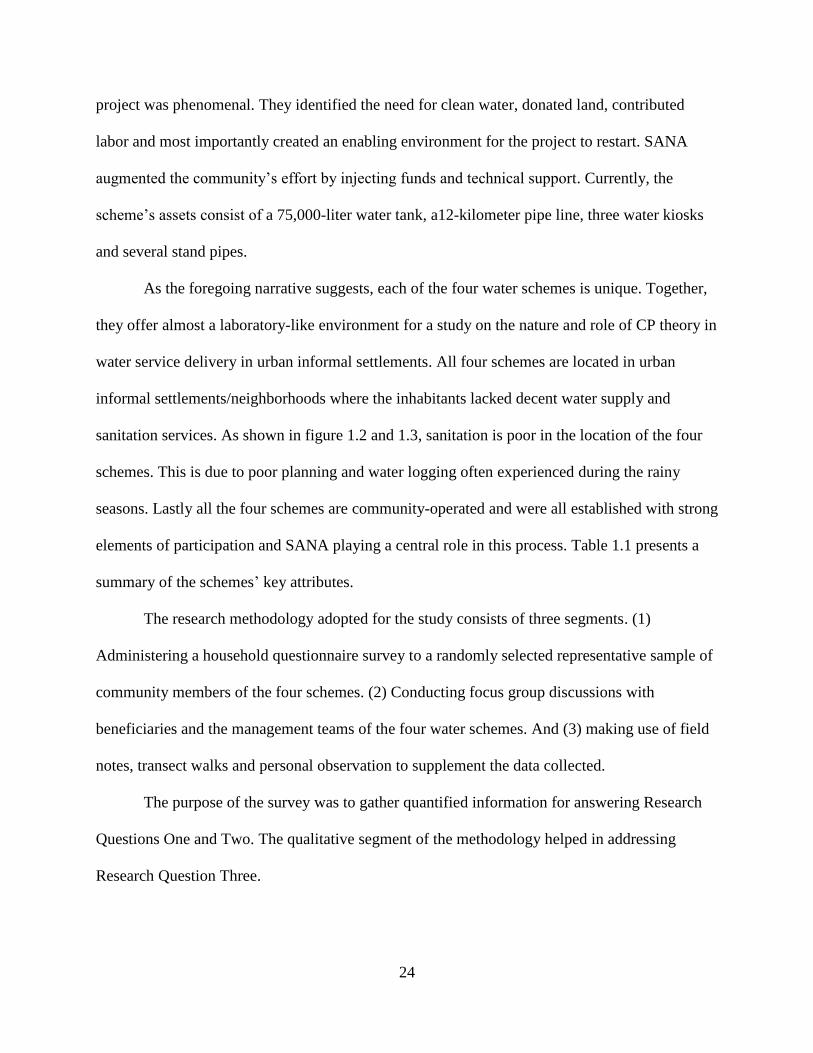
In partnership with SANA, the community revived the project in 2007 and today is serves
a population of 17000 people. The role played by the community’s members in reviving the
24
project was phenomenal. They identified the need for clean water, donated land, contributed
labor and most importantly created an enabling environment for the project to restart. SANA
augmented the community’s effort by injecting funds and technical support. Currently, the
scheme’s assets consist of a 75,000-liter water tank, a12-kilometer pipe line, three water kiosks
and several stand pipes.
As the foregoing narrative suggests, each of the four water schemes is unique. Together,
they offer almost a laboratory-like environment for a study on the nature and role of CP theory in
water service delivery in urban informal settlements. All four schemes are located in urban
informal settlements/neighborhoods where the inhabitants lacked decent water supply and
sanitation services. As shown in figure 1.2 and 1.3, sanitation is poor in the location of the four
schemes. This is due to poor planning and water logging often experienced during the rainy
seasons. Lastly all the four schemes are community-operated and were all established with strong
elements of participation and SANA playing a central role in this process. Table 1.1 presents a
summary of the schemes’ key attributes.
The research methodology adopted for the study consists of three segments. (1)
Administering a household questionnaire survey to a randomly selected representative sample of
community members of the four schemes. (2) Conducting focus group discussions with
beneficiaries and the management teams of the four water schemes. And (3) making use of field
notes, transect walks and personal observation to supplement the data collected.
The purpose of the survey was to gather quantified information for answering Research
Questions One and Two. The qualitative segment of the methodology helped in addressing
Research Question Three.

25
Table 1.1 Summary of the Schemes Key Attributes
Attributes Wandiege
Obunga Asengo Paga
Year started
2001 2003 2005 1989
Role played by
the community
1. Donated land
2. Identified
locations for
water kiosks
1. Management of water kiosks
2. Identified locations for water
kiosks
3. Provide security to the
schemes assets
1. Provided labor and
land
2. Identified sites for
the intake tanks
1. Identified the need to clean
potable water
2. Donated land and labor
Role played by
SANA
Provided funds and
technical know how
1. Provided funds and technical
support
2. Sourced for collaboration
between the community and
Kisumu Water and Sewerage
Company
1. Provided funds for
upgrading the
spring water
2. Provided technical
support
1. Provided Funds
2. Provided Technical
support
Population
served in 2014
15,000 people 30,000 people 20,000 people 17,000 people
Schemes
Assets
A borehole
Two storage
tanks
A pipe line
system
24 water kiosks
148 metered
connections
Chlorine dozer
Three water storage tanks
60 water points
10 water kiosks
Several individual water
connections
2 intake tanks
6 water kiosks
Several individual
water connections
75,000 liter water tank
12 kilometer pipe line
3 water kiosks
Several stand pipes

26
1.4 Significance of the Study
This study seeks to fill a gap in Knowledge on the role of CP in water service delivery in
developing countries in Africa in general and Kenya in particular. Despite evidence of success of
CP in rural water production and management, few studies have attempted to evaluate its
effectiveness in urban water delivery especially in the informal settlements. In fact, evidence on
monitoring and evaluation is very scarce. The water management model which has been
promoted in urban centers is privatization. However, in Africa, privatization has failed to achieve
the benefits previously lauded especially for the poor who most often live in urban informal
settlements. It is worth noting that informal settlements account for roughly 30 to 60 percent of
the urban population (Uitto and Biswas, 2000; UNCHS, 2006). Those who live in these
settlements are poor and most governments or private companies give lower priorities to issues
affecting them. Indeed, in terms of water delivery and planning, the settlements are congested
making it almost impossible to provide in house water or basic sanitation facilities. For these
reasons and coupled with the neoliberal notion of cost recovery, urban planners and private
companies have been hesitant to invest in slum-based water infrastructure. Consequently,
millions of people are denied access to clean potable water. Specifically for Kenya, the available
data from UN-Habitat (2005) reported that over 50% of those living in slums have no access to
drinking water.
The study is also important from an environmental policy and urban planning
perspective. In this regard, it showcases the role of communities in managing vital resources
such as water. Participation reduces wastage and encourages better water handling hygiene. As
articulated by Hardoy and Ruete (2013), the installation of more water infrastructure alone is not

27
enough. Complex urban environmental problems need more community involvement in order to
support the structural and non-structural interventions.
In addition, the study is important from economic and development perspectives. To
appreciate this, consider the fact that one of the greatest challenges still facing developing
countries is how to finance the Millennium Development Goals (MGDs) in regards to water
provisioning. According to Banerrjee and Morella (2011), the price tag for reaching the MDG
target on water access is estimated at $22.6 billion per year. This equals 3.5 percent of Africa’s
gross domestic product (GDP). The money needed for operation and maintenance alone stands at
1.1 percent of Africa’s overall GDP. The findings of this study are potentially useful in
demonstrating, the value of incorporating CP in the water delivery process in poor communities.
In addition an argument can be made that economic growth is intertwined with access to water.
In other words, industries and people living in cities like Kisumu require water. As shown in
Chapter Four, access, reliability and the effectiveness of the water infrastructure can be greatly
improved through CP mechanisms.
Furthermore, the study is significant from a public health perspective. Unsafe water and
poor sanitation are major causes of disease worldwide. According to a report by UN-Habitat
(2012), over half of the world’s hospital beds are occupied by people suffering from illnesses
associated with contaminated water and currently more people die as a result of polluted water
than are killed by all forms of violence including wars. In a recent study, Norton (2014) observed
that every year lack of adequate drinking water and poor sanitation causes 5 to 10 million deaths.
At least 1.6 million of the victims are children under the age of five years with most of them
living in the developing world. Chapter Six demonstrates that CP is an antidote for better
hygiene in water handling. Finally, findings from this study confirm the need for policymakers to
28
incorporate CP in urban water management in informal settlements. As persuasively argued by
Koundouri (2004), water scarcity whether quantitative, qualitative or both, simply emanates from
users inefficiency and poor management. The contribution of physical constraints is marginal
and the crisis lies mostly at the heart of inefficient management (ibid). Water problems can be
ameliorated if policy makers communicate clearly and develop working partnership with the
poor. Indeed, they need to take into account the views and perceptions of the poor.
1.5 Organization of Chapters
This study is divided into seven chapters. Chapter One begins with an introduction and
overview of the theoretical framework for the entire study. Also included in the chapter are study
objectives, research questions, description of the study area and significance of the study in
reference to environmental policy and planning. In Chapter Two, a review of the related
literature is presented. The central issues raised in the review are the historical and theoretical
roots on the definition of CP theory, indicators used in ascertaining participation, key studies
which have examined the impacts of CP in water provisioning and management. The chapter
concludes by highlights of gap in literature which the research hopes to fill. Chapter Three
contains a presentation of the methodological issues. These include a definition of the mixed
methods approach, the rationale for adopting the approach, potential shortfalls and how they are
addressed.
Chapter Four presents findings on the relationship between participation and beneficiary
satisfaction with the work of the management committees which can be used as a reflection for
sustainability. Chapter Five presents findings on the relationship between participation and clean
water supply in the settlements. Chapter Six presents findings on the major participation-related

29
factors influencing the performance of the schemes. Finally, Chapter Seven consists of general
conclusions, contribution to literature, study limitation and suggestions for future research.

30
2. REVIEW OF THE RELATED LITERATURE
This dissertation is intended to contribute to the broader research on community
participation (CP) in water production and management in developing countries. The goal in this
chapter is three-fold. The first is to trace the roots and theoretical foundation of the concept of
CP. The second is to highlight indicators which have been used to measure CP in development
projects. The third is to survey some key empirical studies which have examined the effects of
CP in water service delivery. The gap in literature that provides the rationale for this inquiry is
discussed in the conclusion.
2.1 Historical and Theoretical Foundations of Community Participation (CP)
The history and debates that surrounds CP theory in development planning are long and
theoretically unique. Mansuri and Roa (2013) confirm this by suggesting that the origin of CP,
alternatively referred to in literature as “public participation,” “community- driven
development,” or “citizen participation”, is as old as the idea of democratic governance. More
worthy of note, CP has existed and evolved in many cultures over the years.
2.1.1 Community Participation from the African Perspective
In Africa, Njoh (2003) contends that participation had long been practiced by the
indigenous communities before the arrival of the Europeans. Specifically, in a book titled Self-
help water supply in Cameroon, Njoh stated that in precolonial Africa, it was common for
communities to join hands in local development projects. Such projects included building chiefs’
palaces, market centers, erecting village bridges, or building community centers. In some cases

31
the partnerships extended in carrying out duties such as hunting or slaughtering of animals for
communal consumption. Additionally during planting and cultivation seasons, communities in
Africa used to work alternately in each other’s farms. These activities have since continued and
currently operate alongside modern institutions and systems. Julius Kambarage Nyerere (1968)
can be credited as the first African leader to coherently articulate, align and incorporate
traditional African participatory ethos into the mainstream development agenda.
Nyerere advocated a model of development planning in Tanzania which was entrenched
on the foundations of Ujamaa, a Kiswahili word for family-hood (Nyerere, 1968). Ujamaa is
what Njoh (2003) referred to in his book as well-defined organized village groupings. In Swahili
the word Ujama can be distinguished by one key characteristic. That is, a person becomes
successful by collectively working and pursuing ideals which are deemed beneficial for all.
In Nyerere’s philosophy inscribed in the Arusha Declaration (1967) the idea of Ujamaa
villages was translated into a communal political-economic management model guided by the
following principles: (1) managing community natural resources (e.g. land, water or wealth)
collectively at the village level with the aim of maximizing productive capabilities to the benefit
of everybody that draw dependence on it; (2) Cultivating and fostering a kind of self-reliance by
transforming economic and cultural attitudes of the masses in the villages. These involved
encouraging people to develop a positive attitude towards work as a means of uniformly serving
the individual, the community and the nation which is referred to in Swahili as Kujenga taifa
(Nyerere, 1967).
To summarize Nyerere’s vision, the core African participatory perspective was that
African nations had to depend on themselves by investing in community collectivism. This was
later to be known as villagization which in Kiswahili meant Kushirikiana. Nyerere advised

32
African leaders to listen to their people and embrace communal work ethic through cooperation.
For Nyerere, this was the best path to achieving sustainable development. In this extract from the
Arusha Declaration, Nyerere used thought-provoking terms in rooting for local initiative and CP
in development planning. He stated that
At the root of the whole problem is our failure to understand and apply to our own
activities the concept of self-reliance. We are still thinking that big schemes and orthodox
methods will solve our problems. We do not approach a people by asking how we can
solve it by our own efforts with the resources we have in front of us (these include local
labor, knowledge and community network and cooperation – my own emphasis
added)….. Indeed, local initiatives are often scorned, as not being modern enough…….
When even any problem is being tackled or any new development is being proposed, our
first question should be: what can as a village or district or region or nation do to solve
the problem ourselves (Nyerere, 1967, p. 20).
Later on Nyerere’s call for the use of local knowledge became a powerful concept within
the academy of international development. Organizations such as the United Nations, United
States Agency for International Development, and World Health Organizations subscribed to CP
ethos in their work in the previously colonized nations (Njoh, 2003). In fact, studies by
Chambers (1983), Cohen and Uphoff (1977), Crouch and Chamala (1979), Elliot (1976), Pearse
and Stiefel (1979) and Roling (1978) attest to the foregoing assertion. These studies
demonstrated that in many parts of the developing world, the majority of people had been
excluded from the benefits of socio-economic development. For this, reason the concept of CP,
as emulated in traditional African ethos, had to be reintroduced as a viable strategy for redressing
the experience of underdevelopment in Africa.

33
2.1.2 CP from the Western Perspective
On the Western hemisphere, the modern theory of CP as illustrated by Mansuri et al
(2013) can be traced to the classical works of Rousseau and Mill. In his famous book The Social
contract or principles of political right (1762), Rousseau equated CP with the contemporary
liberal democratic principles, a political model where people make interdependent decisions that
take into account the will of everybody. That is, communities establishing policies based on a
plethora of views with benefits and burdens equally shared by the masses. To Rousseau, CP was
more than a method of involvement or decision-making. Instead it was a practical process by
which individuals expressed empathy for one another, and in doing so, accommodated the public
interest. Participation from this perspective, Mansuri et al (2013) stated, served an important
educational function. In other words, the individual learned how to become a citizen by first
having a sense of belonging in a community. Indeed, many scholars today would agree with
Wraight (2008) in contending that Rousseau view of citizen participation has had remarkable
influence on the Western political, philosophical and educational thought.
Within this framework, it is necessary to introduce the pioneering work of John Stuart
Mill (1859, 1879). It has been argued that Mill’s ideologies which are anchored in the work of
Rousseau, also profoundly shaped the contemporary view of participation. To be specific,
Mansuri et al (2013) argued that Mill basically rooted for CP based on the premise that a
centralized form of governments was too intrusive on people’s lives. In fact such fears led Mill
to warn that universal suffrage and participation in national government were of little use if
citizens were not prepared to be fully involved at the grassroots. For these reasons, Mill argued
that collective management through community involvement would make people appreciate
public over individual interest.

34
According to Mansuri et al (2013), Rousseau and Mill’s ideas about participation were
later refined in the eighteenth century by leading thinkers such as Henry Maine (1876) and
George Howard Douglas Cole (1921). Maine, for instance, vouched for CP out of the recognition
that it prepared people to be good active citizens. That is, the process of involving people in local
development projects trained them to think in terms of the public good rather than individual
interest. Moreover, for Maine, participation helped people in developing the ability to hold the
State or the markets accountable. Notwithstanding, it also influenced the decisions that affected
people’s lives. In the Western political and philosophical growth participation therefore evolved
into two main branches. This includes the Rousseau form of participation with tethered focus on
building collective identity, and Mill’s participation which was interested in the election of
representative governments (Mansuri et al, 2013).
2.1.3 CP from the Asian Perspective
From the Eastern, or more specifically, the Asian perspective, the concept of CP was
greatly popularized by the legendary work of Mahatma Gandhi (Mansuri & Rao, 2004). In a
monograph titled Village Swaraj, first published in (1962), Gandhi strongly argued for the
promotion of community/citizen participation as a viable strategy in development planning
through the organization of village Panchayats. Panchayats was a kind of local community-
controlled self-government at the village level. Gandhi’s view on the creation of the Panchayats
system was that, if organized along scientific lines, would ensure a greater participation of the
people. Consequently, this led to a more effective and robust mechanism for implementing rural
development projects such as village agriculture, health and hygiene, transportation, irrigation
and cattle welfare. Gandhi dedicated most of his work to the cause of rural reconstruction
through the promotion of CP as the center piece of management.

35
Mishra (2002) contends that for Gandhi, the utilization of the energy of the vast army of
the rural unemployed through CP was the only viable antidote for mitigating some of the
negative economic impacts created by the decade-long British rule in India. In Gandhi’s terms,
genuine involvement of ordinary citizens in all development activities including actual planning
was key for economic growth of nations in the Southern hemisphere.
Overall, even though the evolution of the concept is quite long, the foundations of CP
theory is further articulated in the contemporary works of scholars such as Bhasin (1985), Fals,
Borda (1988), Fuglesang and Chandler (1986), Galjart (1981, 1982), Gran (1985), Rahman
(1984, 1985), and Roling (1987). The common argument advanced by these scholars is that any
effective model of development should adapt to the social, economic and political contexts of the
people involved in the process. Indeed, two important assertions are made by all these scholars.
First, they contend that poverty is structured and has its roots in the economic and political
conditions of the people it affects. To combat poverty, it is important to develop the capacity of
the people it affects so that they can have a say in, and have influence on the forces which
control their lives. Second, that development programs or projects have largely ignored the vast
majority of poor people. Thus, there is a need to re-think new forms of development
interventions to ensure that the neglected majority have a chance to benefit from development
initiatives. The idea emerging from these assertions is that there is a need for more grassroots
public involvement in the development process.
The foregoing narrative suggests that community participation theory as an approach in
social development has a common intellectual interconnectedness across all cultures. Despite
this, there is no consensus on how the concept of CP should be defined. Instead, different
analysts have proposed varying definitions for the concept.
36
2.1.4 Defining Community Participation
The roots of CP as an approach in social development can be traced to different cultures
across the globe. For this reason, CP has many definitions. The Oxford English dictionary, for
instance defines CP as “having a share in as in benefits or profits” or “taking part in”. This
implies that the rights of people to get involved in any activity that affect their lives are upheld.
Brager, Specht and Torczyner (1987) defined CP as a means of theoretically, intellectually or
physically educating a community in order to increase their competence on issues that affect
their own lives. From these two definitions participation can be viewed as a vehicle for
influencing decisions that affect people’s lives. It can also be viewed as a tool for transferring
power to the powerless.
Building on the aforementioned definitions, Armitage (1988) describe CP as a process by
which individuals take action in responding to public concerns. These may include people
voicing their opinions about decisions they may disagree with and living with the consequences
of their choices. Mathbor (2008) suggested that CP may be as simple as a response to the
traditional sense of powerlessness felt by the general public about decisions emanating from
authorities. This view of community participation is shared by Njoh (2002) who noted that
participation is a process which enables grassroots mobilization, which in turn, empowers the
poor. Similarly, Bridgen (2004) contends that participation simply entails community
involvement in and influence over the local decision making process. Within Njoh’s and
Bridgen’s theoretical context, CP is seen as an instrumental process in which communities
influence and become genuine partners in development initiatives or resource mobilization.
Westergaard (1986) defined CP as a uniform undertaking by the marginalized meant to increase
their control over resources whose distribution they would otherwise have no say. Similarly, the
37
World Bank Learning Group on Participatory Development (1995) defined participation as a
process through which stakeholder’s influence and share control over development initiative,
and the decisions and resources which affect them. The United Nations Economic and Social
Council Resolution (1929) defined CP as process which entailed voluntary or democratic
involvement of the citizenry in: (1) contributing to the development effort, (2) sharing equally
the benefits accrued from the process, and (3) decision-making in respect of setting goals,
formulating policies and planning and implementing economic and social development.
All these definitions advanced by different scholars seem related. However, within the
broader context of this inquiry and for the purpose of clarity, Paul’s (1987) still prevails. Paul’s
definition incorporates most of the indicators which have been used to operationalize the act of
community involvement. For this reason it will be adopted in this inquiry. Paul defined CP as an
active process through which communities are able to influence the direction and execution of
development projects. The purpose is to enhance their overall well-being rather than merely
targeting the share of project dividends accrued at the end.
Paul’s definition is based on the following four tenets. First, he stressed that the context
of participation should be de-linked from political involvement. Second, that community, and not
government bureaucrats or donor staff, should be at the forefront of participation. Third, that the
success of CP should be measured through joint collaboration mechanisms employed in
conjunction with the implementers and benefactors (which are the communities involved in the
development process). Fourth, that CP should be seen as a process of achieving an outcome. Paul
cautioned that this definition does not imply that there will be uniformity in all community
development projects where CP mechanisms are applied. He stressed the necessity of
considering factors such as project implementation methods and the scope in which beneficiaries

38
are integrated into the projects. This means the adoption of measures which are designed to
enable participation of ordinary citizens at all levels of the development process. This definition
is remarkable because, it extends the concept of community participation beyond the
development of policy to decision making, implementation and finally evaluation (Stoker, 1997).
Based on Paul’s definition and the theoretical foundation within which this study is
situated, it is therefore important to pay special attention to indicators which can be used to
measure participation. Indicators provide the foundations from which progress; effectiveness or
outcome of development projects can be grounded or explained (Morrisset, 2000).
2.1.5 Community Participation Indicators
Participatory indicators are parameters used in ascertaining whether a project was
implemented and/or is being operated through a participatory approach. In the community water
services provisioning sector some of the major indicators which have been used to measure
community participation were reviewed by Kabila (2002). Most of these indicators have featured
in the work of leading CP analyst such as Awortwi (2012), Bowen (2008), Cornwall (2008),
Harvey and Reed (2007), Khan and Anjum (2013), Prokopy (2005), Sara and Davis (2012),
Wright (1997), Yacoob and Walker (1991) and Yohalem (1990). As outlined by Kabila (2002),
such indicators include: (1) participation in decision making, (2) informed choice, (3) economic
contributions, (4) representation, (4) responsibility, (5) authority, (6) control, and (7) partnership.
Participation in decision making refers to the fact that for a project to be considered as
having been implemented or functioning under a CP paradigm, ideas emanating from the
beneficiaries should be given preference. These include elements such as the incorporation of
women’s views into project implementation and operations. As Postel (1997) has argued, women
are among the majority of people affected by water issues in the developing world.

39
Informed choice as a participatory indicator refers to the understanding that beneficiaries
are adequately informed of the choices available to them. This furnishes them with the ability of
managing projects upon their completion. Economic contribution refers to the act of
beneficiaries willingly accepting to contribute money, labor, or materials to projects.
Contribution can also take the form of participating in project activities such as meetings.
Representation refers to the notion that diversity within the beneficiary community should be
reflected in project management teams. Elections to position of leadership should be democratic.
Minorities such as women or the chronically poor should be given equal opportunity for
management roles. Responsibility means that the community should be made aware of the
burden of responsibility. They should know that the project belongs to them and its failure or
success falls on their shoulders. Authority as an indicator means that the government and donor
agencies involvement in the decision making and operational mechanisms should be minimal.
Involvement of such secondary agencies should only occur if requested by the beneficiaries.
Finally, Control means that the community should be empowered to carry out major decisions
and determine their outcome. The role of the government or donor agencies should remain
consultative.
2.1.6 Key Studies on the Effects of CP in Water Provisioning
Several studies have been conducted to evaluate the impact of CP on the outcome of
water supply projects. Table 2.1 shows a summary of these studies.
Narayan (1995) reviewed 121 rural water supply projects in 48 different countries. The
data used in the study were generated from the project report evaluations. The main objective of
the study was to understand the effect of beneficiary participation on project effectiveness. To
accomplish this task a multivariate regression model was used with projects as the unit of

40
analysis. Participation was quantified on a 7-point scale. A score of one meant there was no
participation while a score of seven meant there was a significant level of participation. The
study also clustered stages of participation as projects progressed, for example through planning
stages, construction, operation and maintenance. Using factor analysis, the statisticians
determined that overall beneficiary participation could be used as the main measure of
participation. Again by using factor analysis on the performance results of 20 projects an overall
measure of project effectiveness was generated. Results from this study showed that beneficiary
participation was more significant than any other factor i.e. appropriate technology or availability
of repair technicians in achieving well-functioning water systems. Narayan’s study has received
two main criticisms on how it used statistical evidence to account for a causal impact of
participation in project performance. The first is that it used subjective measures to gauge
participation. Critics argue that this may not be accurate in statistical analysis (Verbeek, 2002).
The second criticism came out of concern of the “halo effects” which is the potential bias in
project rankings which might have emanated from project evaluators who could have been
participatory proponents or vice versa (Prokopy, 2002).
A similar research to Narayans’ study though qualitative in nature was undertaken in two
regions in Kerala India by Manikutty (1997). The objective of this study was to investigate the
impacts of CP on rural water projects funded by different development agencies. The study was
based on a set of two projects identified as project I and project II. Participatory techniques were
applied in project I but not in project II. Some of the participatory techniques applied in project I
included making beneficiaries select stand pipe locations, asking beneficiaries to provide land in
which stand pipes were to be erected, labor provision and maintenance. Some of the community
members with medical knowledge were also requested to provide sanitation and health

41
Table 2.1 Key Studies Evaluating the Effect of CP on Water Supply Projects
Study Objective/Focus of the
Study
Operationalization of
Participation
Operationalization of
Success
Main Results/Findings
1. Narayan (1995)
Study carried in
48 countries with
data generated
from project
evaluations
Analyzed the effect of
beneficiary
participation on
project effectiveness
Through factor
analysis “overall
beneficiary
participation on a
scale of 1 to 7”
Overall project
effectiveness: results of
factor analysis on 20
performance outcomes
CP found to be a significant indicator
of overall project success
2. Manikutty
(1997) – Two
rural water
projects in India
Investigated the
relationship between
CP and outcome in
two rural water
projects – one
implemented under
the CP regime and the
other not – compare
and contrast
Beneficiary voice in
choice of system and
equipment like pipes,
willingness to
contribute resources
such as land, labor, &
lastly level of women
involvement in the
water management
committees
(a) Technological
outcome
(b) Percentage use of
water source
(c) Changes in health
habits
(d) Level of
community
commitments
(e) Satisfaction of
beneficiaries
Comparative results showed that CP
led to better project outcome based on
all the five variables used to measure
success
3. Sara and Katz
(1998) Reviewed
125 community
based water
projects in 6
countries
Primary hypothesis
“water supply services
which are demand
responsive are more
likely to be sustainable
than services which
are less demand
responsive”
Demand
responsiveness
operationalized as (i)
Willingness to pay,
(ii) Prioritization and
(iii) informed
decisions
(a) Physical condition
(b) Consumer
satisfaction
(c) O&M practices
(d) Financial
management
(e) Willingness to
sustain the system
Demand-responsiveness increases
sustainability. Put differently
sustainability is higher in
communities when projects followed
a demand-responsive approach
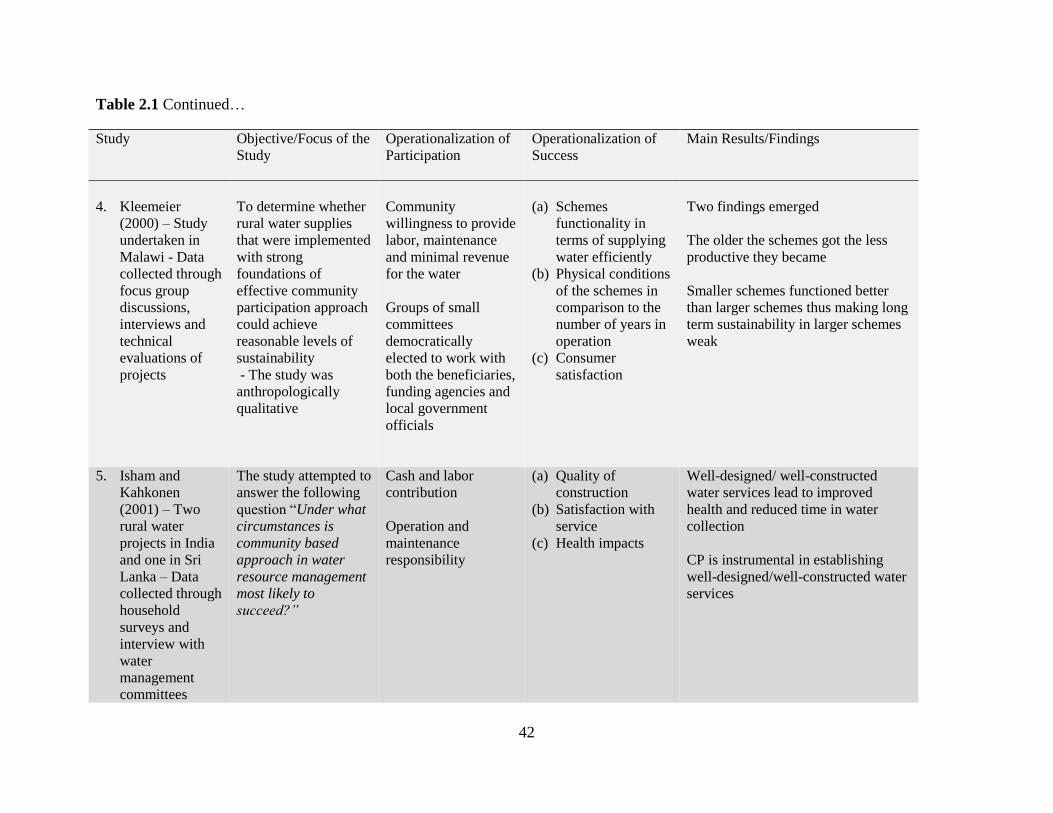
42
Table 2.1 Continued…
Study Objective/Focus of the
Study
Operationalization of
Participation
Operationalization of
Success
Main Results/Findings
4. Kleemeier
(2000) – Study
undertaken in
Malawi - Data
collected through
focus group
discussions,
interviews and
technical
evaluations of
projects
To determine whether
rural water supplies
that were implemented
with strong
foundations of
effective community
participation approach
could achieve
reasonable levels of
sustainability
- The study was
anthropologically
qualitative
Community
willingness to provide
labor, maintenance
and minimal revenue
for the water
Groups of small
committees
democratically
elected to work with
both the beneficiaries,
funding agencies and
local government
officials
(a) Schemes
functionality in
terms of supplying
water efficiently
(b) Physical conditions
of the schemes in
comparison to the
number of years in
operation
(c) Consumer
satisfaction
Two findings emerged
The older the schemes got the less
productive they became
Smaller schemes functioned better
than larger schemes thus making long
term sustainability in larger schemes
weak
5. Isham and
Kahkonen
(2001) – Two
rural water
projects in India
and one in Sri
Lanka – Data
collected through
household
surveys and
interview with
water
management
committees
The study attempted to
answer the following
question “Under what
circumstances is
community based
approach in water
resource management
most likely to
succeed?”
Cash and labor
contribution
Operation and
maintenance
responsibility
(a) Quality of
construction
(b) Satisfaction with
service
(c) Health impacts
Well-designed/ well-constructed
water services lead to improved
health and reduced time in water
collection
CP is instrumental in establishing
well-designed/well-constructed water
services

43
Table 2.1 Continued...
Study Objective/Focus of the
Study
Operationalization of
Participation
Operationalization of
Success
Main Results/Findings
6. Prokopy (2005)
– Two water
supply projects
in India analyzed
- Data collected
through
household and
village surveys
The study examined
which variables within
the participatory
pantheon were
instrumental in
establishing successful
water projects
Capital contribution
Household
involvement in
decision making
Transparency in water
committee operations
(a) Consumer
satisfaction
(b) Tariff payment
(c) Equal success
(d) Time saving in
water collection
(e) Belief in the system
Positive relationship between the
number of households in a village that
contributed towards capital and better
project outcome
Positive association between more
involvement in decision making and
better project design
7. Priyan Das
(2009) – study
completed in
fulfillment of a
dissertation
research at the
University of
California in Los
Angeles – Data
was collected
through
household
surveys,
interview and
personal
observations
Attempted to
investigated how
collective action by
different actors
particularly women
influenced project
effectiveness in
community managed
urban water supply
systems in three cities
in India
Community water and
sanitation committee
(CWASC) was
formed in each city
With help different
agencies the
committee was
responsible for the
planning, designing
and implementing the
water supply system
The user committee
was also responsible
for collecting user fee
for O&M
(a) Attitudes, behaviors
and experiences both of
providers and users
(b) Assessment of
water supply situation
in the three study areas
(c) Agency user
relations
(d) Level of women
participation
Institutional management either
impedes or facilitate collective action
at the community level thus
influencing project effectiveness
Government and community
partnership does lead to a boost in
project effectiveness
Women participation was found to be
crucial within collective action
institutions such as user committees
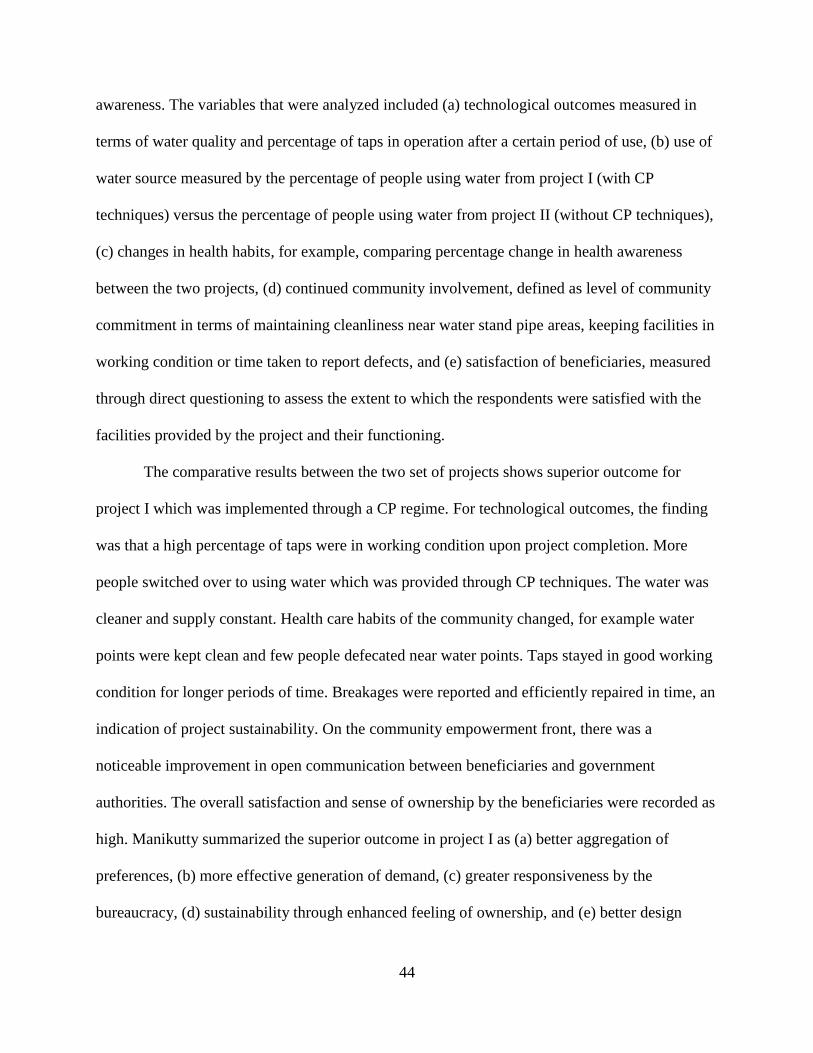
44
awareness. The variables that were analyzed included (a) technological outcomes measured in
terms of water quality and percentage of taps in operation after a certain period of use, (b) use of
water source measured by the percentage of people using water from project I (with CP
techniques) versus the percentage of people using water from project II (without CP techniques),
(c) changes in health habits, for example, comparing percentage change in health awareness
between the two projects, (d) continued community involvement, defined as level of community
commitment in terms of maintaining cleanliness near water stand pipe areas, keeping facilities in
working condition or time taken to report defects, and (e) satisfaction of beneficiaries, measured
through direct questioning to assess the extent to which the respondents were satisfied with the
facilities provided by the project and their functioning.
The comparative results between the two set of projects shows superior outcome for
project I which was implemented through a CP regime. For technological outcomes, the finding
was that a high percentage of taps were in working condition upon project completion. More
people switched over to using water which was provided through CP techniques. The water was
cleaner and supply constant. Health care habits of the community changed, for example water
points were kept clean and few people defecated near water points. Taps stayed in good working
condition for longer periods of time. Breakages were reported and efficiently repaired in time, an
indication of project sustainability. On the community empowerment front, there was a
noticeable improvement in open communication between beneficiaries and government
authorities. The overall satisfaction and sense of ownership by the beneficiaries were recorded as
high. Manikutty summarized the superior outcome in project I as (a) better aggregation of
preferences, (b) more effective generation of demand, (c) greater responsiveness by the
bureaucracy, (d) sustainability through enhanced feeling of ownership, and (e) better design

45
through incorporation of local knowledge. Generally the result from this study indicated that CP
is beneficial in delivering successful water project outcomes.
Building on Manikutty’s work, Sara and Katz (1998) examined the relationship between
CP and sustainability aspects of water projects. They hypothesized that water supply services
which were more demand- responsive were more likely to be sustainable at the community level
than services which were less demand-responsive. In this study a project was defined as being
more or less demand-responsive to the degree that users make choices and commit resources in
support of such choices. The dependent variable, sustainability was an index composed of factors
such as consumer satisfaction, operation and maintenance practices, financial management and
willingness to sustain the system.
The findings from this study indicated a statistically significant relationship between
demand-responsiveness and project sustainability. Firstly, sustainability was found to be higher
in communities where projects followed a demand-responsive approach. However, most projects
were found to be lax in applying rules in the communities they worked. Secondly, sustainability
was found to be higher when demand was expressed directly by household members instead of
traditional chiefs or community representatives. Lastly, a designated community organization
was a necessary bridge in ensuring the success of a project. This latter study has received a few
criticisms since its publication. Some critics such as Thorsten (2007) have argued that the study
relied on a very small sample size and therefore could not adequately demonstrate causal
relationships. Furthermore the study has been criticized for relying excessively on additive
approach for factors and indicators of sustainability using ordinal scoring (Ibid). It is argued that
this method dwells heavily on subjective measurements thus limiting the degree of variation
present among variables (Thorsten, 2007).

46
The findings in the Sara et al (1998) study are somewhat similar to the findings of
Kleemeier (2000) whose work was anthropological in nature. Kleemeier examined a Malawi
rural piped water scheme. Her primary goal was to determine whether rural water supplies
implemented with strong foundations of effective participatory mechanisms could achieve
reasonable levels of sustainability. The Malawi piped water scheme often presented model of
success for the participatory approach.
Kleemeier concluded that CP is more robust in setting up community organizations
capable of managing very small rural piped water projects. However, she contended that CP does
not entirely address the needs of larger schemes thus making long term sustainability weak in
such schemes. In this regard Kleemeier’s suggestion is to introduce contribution as an incentive
to promote sustainability. The management committee can utilize that extra revenue to solve
problems whenever they arise. The study is among the few that have compared the effects of
participation in both large and small communities.
Next, Isham and Kahkonen (2001) analyzed two rural water projects in India and one in
Sri Lanka. Using quantitative and qualitative data from 1,088 households and 50 water
committees, they examined circumstances under which a community-based approach in water
resource management is most likely to succeed. They employed an econometric statistical
technique in answering this question. Results from the econometric models came out in three
interacting layers. First, it confirmed that well-designed and well-constructed water services lead
to improved household health and reduced time of water collection. Secondly, well-designed and
well-constructed water services could be better attained by involving more community members
in the design process and also by allowing beneficiaries not outsiders to make final decisions
about the type of services needed. Lastly they revealed that a community-based approach in

47
water resource production and management is most likely to succeed in communities with
existing active community groups and associations. The project design in such communities was
better and participation robust because households were already accustomed to working together.
Indeed this was the researchers’ most significant contribution in the study. The fact that social
capital was instrumental for the success of community operated water projects. In terms of policy
recommendations, the authors asserted that it is necessary for development workers to allocate
some investment for social capital enhancement when constructing water projects under the CP
regime.
Extensions of the findings by Isham et al (2001) are echoed in a quantitative study
conducted by Linda Stalker Prokopy (2005) in India. This study extended the participatory
dialogue by examining variables within the participatory domain are instrumental in establishing
successful water projects. Two World Bank-assisted rural water and sanitation projects were
used as a case study. The study employed data collected at both household and village levels, and
used three distinct measures to gauge participation. These measures included capital
contribution, household involvement in decision making, and transparency in water committee
operations. Regression models were used to analyze the data with a view of quantifying project
outcomes. The outcomes were indexed as follows (a) consumer satisfaction, (b) tariff payment,
(c) equal access, (d) time saving and (b) belief in the system. Results generated from the study
revealed that higher capital cost contribution was associated with higher beneficiary satisfaction
with the working of the water system. Prokopy asserted that the high level of satisfaction could
have been generated presumably by the fact that households having helped to pay for the system
felt a sense of ownership. The second finding was that the more households felt they participated
in decision making in a village the better the outcome from the project in terms of design and

48
operation. This supported the general conception that a voice in decision making is an indicator
of genuine participation. Prokopy’s study has been influential in promoting an understanding on
the relationships between household participation and the performance of village level water
supply projects.
Prior to Prokopy’s study, an extensive literature review by Mansuri and Rao (2004)
provided mixed results on the effectiveness of community participation in development projects.
Included in the review are over 100 studies published in peer reviewed journals within the last
decade. The general conclusions made in Mansuri and Rao’s (2004) extensive review are as
follow:1) projects which adopt participatory techniques have not all been very successful in
enhancing the livelihoods of the poor, 2) while several studies demonstrate the power of
participation in creating effective community infrastructure, no study has managed to establish
direct causal relationships between any outcome and participation, 3) most community
development projects tend to be captured by elites and more so in communities where there is a
high inequality gap between the rich and the poor, 4) the sustainability of community-based
initiatives depend mostly on the existence of supporting institutional framework within the
community, 5) collaboration between the community and external agents are essential for the
success of projects however external facilitators are often poorly trained to make this happen,
and 6) the naïve application of complex contextual concepts like participation, social capital and
empowerment often lead to poor design and substandard implementation of development
projects.
Another review by Lockwood (2003) also provides important insights on the effects of
post-construction support and the sustainability of village water projects. The primary objective
of Lockwood’s review was to test the hypothesis that sustainability is linked not only to the

49
existence of specific conditions and factors before and during construction of water supply or
sanitation system, but also to specific factors well beyond the end of construction. His findings
are that from existing literature there is a lack of adequate evidence on the effectiveness of post-
construction support. His reasoning for the lack of evidence is that most studies have mainly
focused on measuring sustainability using pre-construction variables. For Lockwood, certainly
there are other post-construction factors which may influence sustainability. These include the
quality of project implementers and the existence of supportive policy environments.
The most recent study which is similar to this inquiry was undertaken by Priyan Das
(2009) in India. Priyan Das’s study is unique in two ways. First, it is among the few that have
attempted to investigate the impact of CP in water production and management in a peri-urban
setting. Secondly, it attempted to unravel how collective action by actors and specifically women
affect success in community operated water schemes. The study also employed mixed methods
to analyze the data which were collected through household surveys, in-depth interviews, and
personal observations. The findings reveal that, institutional arrangement either impeded or
facilitated collective action at the community level, thereby influencing project effectiveness.
Secondly, a direct partnership for service delivery between users and the government boosted
project effectiveness as it has the potential to transform agency user relations. Finally, although
women participation in the project is not a significant factor for project effectiveness, in general,
their participation in decision-making roles was found to be crucial within collective action
institutions such as the user committees.
2.2 Gaps in the Literature
A survey of the relevant literature shows that the concept of community participation has
a rich history. CP has been applied in water service production and management for decades in

50
the developing world. Based on existing empirical evidence, providing water to those living in
rural areas has somewhat improved by the introduction of participatory techniques. Most of the
studies reviewed in Table 2 support this assertion.
In urban centers adequate water provisioning still remains an elusive goal especially for
those living in informal settlements (Gulyani et al, 2010). Evidence suggests that poor
maintenance and management of water infrastructure plus inefficient resource allocation are the
main causes of inept service delivery (Franceys, 2008). From both theoretical and practical
standpoints, development workers and urban planners have often responded by pursuing policies
aimed at urban water commoditization (Gleick et al, 2006; UN Environmental Programme, 2002;
Young & MacDonald 2003). The arguments advanced by privatization scholars are based on the
premise that pure monetization of water in urban centers (which include informal
settlements/neighborhoods) leads to a reduction in cost and demand (Petrova, 2006). Decreased
demand creates changes in consumption preferences which will make consumers less wasteful.
In short the commoditization of water in urban centers as advocated by neoliberals is
premised on the belief that it would make water resources more efficient, economically
sustainable and most importantly, equitable (Postel, 1997). That is to say, investors will have the
incentive to expand water service delivery to places located at the fringes of urban peripheries
often characterized by informality (Hung & Chie, 2013; Olmstead & Stavins 2007; Rogers, De
Silva & Bhatia, 2002; Valinas, 2005). Several municipal councils in the developing world
therefore adopted or were forced by major development organizations to incorporate
privatization as the best strategy for improving urban water service delivery (Budds &
McGranahan, 2003). However, it is now time to recognize that despite all the efforts made to
privatize urban water services, management has not improved to the scale required especially in

51
the urban informal settlements. In many cities across the developing world water supply system
are still characterized by intermittent water supply, corruption and high levels leakages (Postel,
1997; Stottmann, 2000). In fact water leakage alone in selected African cities is estimated to
have an equivalent cost of USD1 billion per year (Banerjee & Morella, 2011). It is thus clear that
there is a problem in theory and practice necessitating a study.
This study will provide further evidence on the nature and role of CP theory in
explicating water production and management dynamics in urban informal settlement. It is
important to acknowledge the fact that informal settlements have unique characteristics which
privatization or public provisioning of water have somewhat failed to address. One of these
characteristics is the fact that infrastructure in informal settlements/neighborhoods are cramped
and precariously constructed. The settlements are often located in flood prone areas. Sanitation is
poor and this results to physical constraints with regards to water infrastructure development.

52
3. METHODS
This chapter begins with description of the mixed-methods approach, a well-known
approach in the social science, which is seldom employed in development planning research.
This is followed by two broad sub-sections discussing the quantitative and qualitative aspects of
the study respectively. The last section contains a discussion of some data quality and
management issues encountered in the study. However, before proceeding with the description of
the mixed methods approach, it is necessary to briefly expand on the two most dominant research
approaches often used in development planning. These are the quantitative or qualitative
research design/approach.
Leading scholars in the field of development planning have attempted to define
qualitative and quantitative research designs by offering a wide range of working definitions.
Others have done the same by identifying a set of key characteristics found in the two
approaches. Denzin and Linclon (2000:3) defined qualitative research approach as a situated
activity that locates the observer in the world. Put differently, it consists of a set of interpretive
and material practice that makes the world visible. These practices Denzin et al. (2003)
contended turn the world into a series of representations depicted through field notes, interviews,
conversations, photographs, recordings and memos to the self. Within this framework, Denzin et
al. (2003:3) observed that qualitative research involves “an interpretive, naturalistic approach to
the world where researchers study things in their natural settings, attempting to make sense of,
or interpret phenomena in terms of the meanings people bring to them”. Some of these

53
characteristics are echoed by Bryman (1988:8) who stated that “the way in which the individuals
being studied understand and interpret their social reality is one of the central motifs of
qualitative research”. Indeed, some of the words used in the foregoing definitions are also
reflected in the work of other theorists (see e.g., Hammersley and Atkinson, 1995; Miles and
Huberman, 1994; Patton, 2002). In the field of data collection, the main aspects of qualitative
research identified by these experts include observational methods, in-depth interviewing, focus
group discussions, narratives and analysis of documentary evidence (Ritchie & Lewis, 2003). In
the development planning and especially in the water production and management sector, the
following studies some of which have been reviewed in chapter two adopted the qualitative
research strategy (see e.g, Chambers, 1983; Kleemeier, 2000; Manikutty, 1997; Njoh, 2002;
Oakley, 1991; Prokopy, 2002; Smith, 1994; Social Policy & Development Center, 1996).
Quantitative research design is another approach often used in the development planning
arena. Generally it is viewed as being associated with the positivist/post-positivist paradigm
where data is objectively collected and converted into numerical forms (Onwuegbuzie et al,
2004).The aim is to draw generalizations of results from a sample to an entire population of
interest (Babbie, 2004). According to Aliaga and Gunderson (2000), quantitative research
involves “explaining phenomena by collecting numerical data that are analyzed using
mathematical based methods and specifically statistics”. Creswell (2004) asserted that
quantitative research approach is generally based on the following five pillars. 1) Ontological
assumption which implies that reality is objective and singular from the researcher. 2)
Epistemological assumption meaning the researcher is different from that being researched. 3)
Axiological assumption which calls for a bias free research where there is a separation of
emotions from the process of scientific inquiry. 4) Rhetorical assumption meaning an involved

54
investigator. 5) Methodological assumption meaning a deductive process based on cause and
effect. Quantitative research approaches mainly rely on surveys and different statistical
techniques to gather and analyze data respectively. In the development planning arena and
specifically in water production and management sector, the following studies have employed
quantitative research design (see, e.g. Dayal et al, 2000; Esman & Uphoff, 1984; Finsterburch &
van Wicklin, 1989; Isham & Kahkonen, 2002; Khawja, 2002; Prokopy, 2005; Sara & Katz,
1998).
Combining qualitative and quantitative research approaches is now becoming common.
This approach also known as the mixed method approach was employed in this inquiry. The
study will now turn to focus on this approach. It is important to note that it has rarely been
employed in development planning research with exception of the following studies (see e.g.
Narayan, 1995; Das, 2009).
3.1 Mixed Methods
The mixed methods approach was employed in this study to collect and analyze both
primary and secondary data. Axim and Pearce (2006) define mixed methods as a research
approach characterized by the application of both qualitative and quantitative techniques into one
study. This definition is consistent with that advanced by Creswell et al (2003), Green et al
(1989) and Tashakkori et al. (1998). The mentioned scholars refer to mixed methods as the
“pragmatic approach” because it is a practical, yet philosophically-grounded research approach.
Onwuegbuzie and Leech (2009) noted that the approach falls into two broad categories, namely
fully and partially mixed methods. The difference between the two is that in fully mixed methods
both qualitative and quantitative techniques are mixed within one or more stages of the research
process or across stages. However, in partially mixed methods, both the quantitative and

55
qualitative elements are conducted either concurrently or sequentially in their entirety before the
data interpretation stage.
The partially mixed methods design is further divided into four components based on
time orientation and emphasis status (Onwuegbuzie et al, 2009). These are: (1) partially mixed
concurrent equal status design, (2) partially mixed concurrent equal dominant status design, (3)
partially mixed sequential equal status design, and (4) partially mixed sequential dominant status
design.
In the present inquiry, a partially mixed concurrent equal status design is employed. The
model involved collecting quantitative and qualitative data simultaneously with all phases having
equal weight (Caracelli & Green, 1997; Onwuegbuzie et al, 2009). Data integration took place
after the analysis of each strand was completed. Questionnaire surveys were used to collect
quantitative data. Focus group discussions (FGDs), archival inquisition, transect walks and
observations were used to gather qualitative data.
Quantitative data were used to investigate the possible impacts of CP on beneficiary
satisfaction with the work of the management committees in the water schemes. They were also
use to examine the contribution of CP on the production of clean potable water supply in the
informal settlement/neighborhoods (see, table 3.1). The qualitative data were used in showcasing
the participatory-related factors affecting the performance of the schemes. However, in some
instances both data sources were used to corroborate/triangulate findings in some qualitative and
quantitative sections (Green et al, 1989; Morgan, 1998). According to Bryman (1998) the
concept of complementarity is one of the strengths of mixed methods approach. Table 3.1
provides a summary of the research design employed by the study. Included in the design are
data collection techniques, sampling criteria and the techniques employed in data analysis.
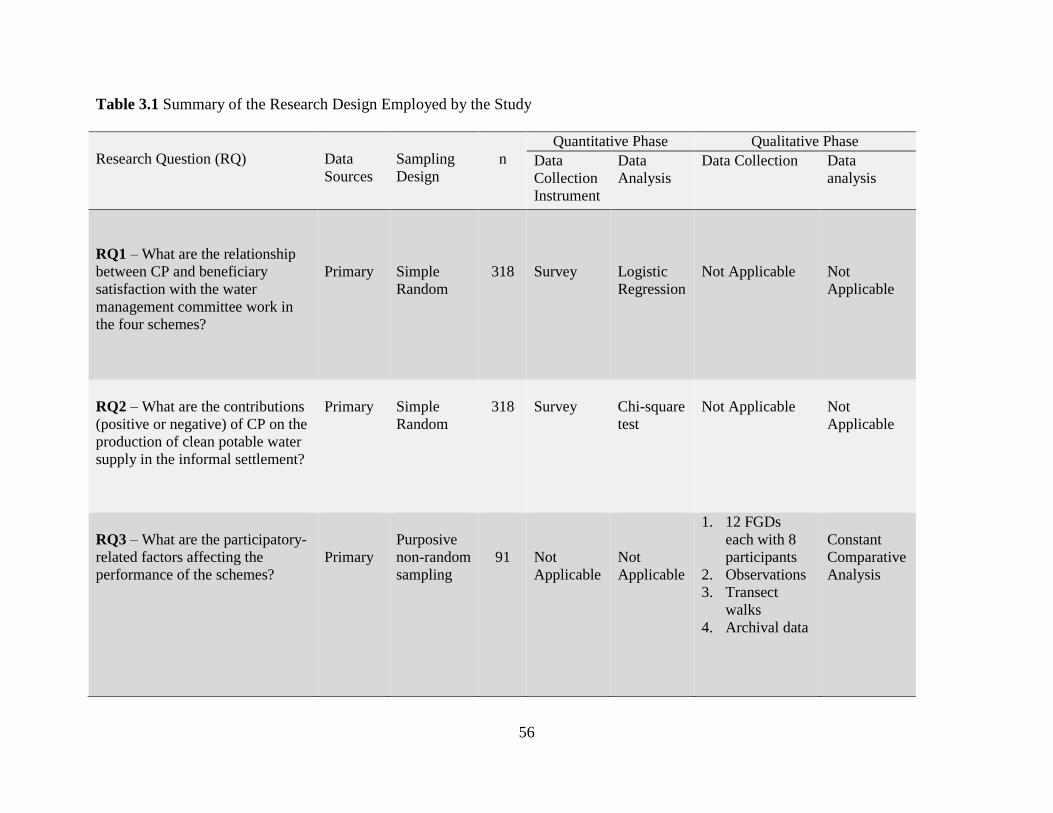
56
Table 3.1 Summary of the Research Design Employed by the Study
Research Question (RQ)
Data
Sources
Sampling
Design
n
Quantitative Phase Qualitative Phase
Data
Collection
Instrument
Data
Analysis
Data Collection Data
analysis
RQ1 – What are the relationship
between CP and beneficiary
satisfaction with the water
management committee work in
the four schemes?
Primary
Simple
Random
318
Survey
Logistic
Regression
Not Applicable
Not
Applicable
RQ2 – What are the contributions
(positive or negative) of CP on the
production of clean potable water
supply in the informal settlement?
Primary
Simple
Random
318
Survey
Chi-square
test
Not Applicable
Not
Applicable
RQ3 – What are the participatory-
related factors affecting the
performance of the schemes?
Primary
Purposive
non-random
sampling
91
Not
Applicable
Not
Applicable
1. 12 FGDs
each with 8
participants
2. Observations
3. Transect
walks
4. Archival data
Constant
Comparative
Analysis

57
A detailed discussion of these techniques thus follows under two main sub-headings namely the
quantitative phase and qualitative phase.
3.2 Quantitative Phase – Data Source and Sampling
3.2.1 Surveys
As shown in Table 3.1, the study relied on data collected through surveys to answer RQ1
and RQ2. Survey methods were adopted because it allowed us to collect a large amount of data
in a short period of time. Moreover, as compared to other data collection techniques, surveys
tend to be less expensive considering the fact that this is a PhD dissertation with limited time
frame and resources. Lastly, to answer RQ1 and RQ2 we needed original numerical data from
individuals in the communities which were too large to directly observe. The survey was
administered through simple random sampling technique to households living in the settlements
where the schemes are located. The Kenya Independent Voter Register (KIVR) was used as the
sampling frame for the survey. The KIVR contains all the names of all registered voters living
within defined geographical areas in Kenya. In Kenya, all persons over the age of eighteen must
have a national identification card and must be a registered voter in their location of residence
(Laws of Kenya, The Constitutions of Kenya, 2010).
After obtaining the KIVR the research team approach was simple. To ensure fair
representation of the target population, we used excel software to randomly select 100 people
from each schemes locality. That is Obunga, Asengo, Wandiege and Paga. The selected sample
size corresponds to guidelines provided by Onwuegbuzie et al (2004). In reference to
correlational and causal-comparative research designs, they recommend a minimum sample size
of 64 participants for one-tailed hypotheses and 82 participants for two-tailed hypotheses tests.

58
The next task was locating the houses where the randomly selected people lived. With the
help of the local chiefs and SANA staff, the research team which comprised of the Principal
Investigator (P1), one supervisor and three research assistants, we were able to locate and survey
the eldest member of each household. For households who were not present during the first visit,
a second survey was arranged. In cases where the research team was unable to locate a
household member a replacement was sourced using simple random sampling criterion. To
ensure fair representation of male and female respondents, interviews were both carried out in
the morning and late evening. The reason for this is that, in Kenya most men tend be at work
during the day.
The questionnaire survey had a total of 57 items (see, Appendix C). These included
informed consent section, household demographic details, water situation in the household and
lastly household water and sanitation situation. Using simple random sampling technique a total
of 360 households were surveyed out of a total population of approximately 75,000 people. The
response rate was 86 percent. The survey was carried out by the principal investigator, one
supervisor and three research assistants. This constituted the research team for the entire study
including the qualitative data collection phase. The supervisor works as a program coordinator
for a local NGO in Kisumu. She was well conversant with the city geography and different water
and sanitation programs in the city. The three research assistants were all graduate students at
Nairobi University, Kisumu campus. The supervisor was recommended by the team leader of
SANA. The three research assistants were recruited through a rigorous interview process. They
all had prior experience with data collection techniques. In fact they were able to demonstrate
prior data collection knowledge during the interviewing process. Moreover, they produced
documentary evidence indicating their previous data collection work experience with different

59
internationally recognized organizations such as Care International Kisumu Office, USAID and
Action Aid.
The role of the P1 and the supervisor included overseeing the administration of the
questionnaire survey, checking the completed questionnaires for errors or omissions and lastly
helping with data entry in SPSS. The reason for choosing SPSS was due to the fact that it was the
only statistical package which P1 was well conversant with. The three research assistants were
responsible for face to face administration of the questionnaire survey. They were also tasked
with making observation and taking notes on the conditions of water sources, water storage
facilities and sanitation conditions of households interviewed. Before embarking on the field, the
research assistants were properly trained by the P1. The training covered administrative details
such as, interview duration, number of interviews expected to be completed in a day, Luo
traditional protocol approaches. Most importantly, the principal investigator and the supervisor
went through all the items in the questionnaire survey and ensured that they were well
understood by the three research assistants. This process included practicing reading the
questions loud and rephrasing any words or questions that appeared ambiguous. The data
collection time was between 8.00am and 5.00pm. During this time the supervisor and the
principal investigator were available for consultation for any further queries/or problems which
the research assistants may have encountered.
The research team (that is, the PI, a supervisor and three research assistants) gained entry
in the community through the help of local chiefs and two SANA employees. The chiefs made
local announcements of the impending research activity and purpose in community weekly
meetings. Before this took place the chiefs were adequately briefed on the purpose of the study
and how its findings may be useful in improving water service delivery in Kisumu’s informal

60
settlements. Table 3.2 summarizes activities undertaken as part of community entry process. This
is in compliance with University of South Florida IRB ethics guidelines. The USF IRB requires
researchers to ensure that they establish relationships with community members prior to
commencing their research. They must also adhere to community customs and protocols during
the entire research process. These actions are important because they helped in promoting trust
being the research team and the subjects. In addition they also helped in promoting public
support and ensuring that moral and social values of the community were upheld.
Table 3.2 Community Entry Procedure by the Research Team
Step
Activity
1
Initial visit made to the community Chiefs Office
2
Chiefs briefed on the research objectives and potential benefits to the community and the city
3
Data collection period announced in community weekly meetings
It is important to note that during the actual data collection time most of the residents
were very receptive to the research team. This is because the community was well acquainted
with SANA’s work in the settlement. All the research assistants were also fluent in Luo and
Kiswahili which are the dominant languages in Kisumu. The approximate length of each survey
was 50 minutes. The survey took a total of 10 days with each research assistant completing
approximately 9 questionnaires per day.

61
3.2.2 Quantitative Data Analysis
The purpose of the quantitative analysis was two-fold. (1) To explore what impacts CP
has had on beneficiary satisfaction with the work of the management committees in the four
water schemes. (2) To investigate what kind of contribution (positive or negative) CP has made
in the production of clean potable water supply in the informal settlement. Primary data from the
survey (N =318) were used to perform descriptive and logistic regression analysis. The main aim
was to establish if there was an association between the dependent variable (DV) and
independent variables (IV). Logistic regression analysis was appropriate for this type of
investigation because the dependent variable (beneficiary satisfaction with the work of the
management committee) had a binary outcome. Moreover, as stipulated by Pohlmann and
Leitner (2004), logistic regression is superior in providing accurate estimates especially in
studies where dependent data violets the assumptions found in ordinary least squares regression.
To explore the relationship between CP and beneficiary satisfaction with the work of the
water management committees in the four schemes, both the bivariate and multivariate logistic
regression models were employed (RQ1). The DV (beneficiary satisfaction with the work of the
management committee) and IV (participatory variables) originated from direct questions on the
survey instrument. Beneficiary satisfaction was attained by the question “overall, how satisfied
are you and your household with the management work of the committee responsible for
managing your main source of water?”
The IV consisted of a series of participatory indicators which have been used in previous
studies. In the bivariate model, each independent variable (participation) was regressed against
the dependent variable (beneficiary satisfaction with the management committee’s work. In the

62
multivariate model participatory variables were regressed against the dependent variable
beneficiary satisfaction with the management committee’s work.
To explore what kind of contribution (positive or negative) that CP has made in the
production of clean potable water supply in the informal settlement (RQ2), the study developed
five models. The five models contained five DV each independently regressed against two IV.
The DV and IV originated from direct questions in the questionnaire survey and are aided by
what is contained in previous literature (see, e.g. IRC, 1999, Kleemeier, 2000; Manikutty, 1997).
They were operationalized as follows:
DV = (1) satisfaction with the smell of water.
DV = (2) cleaning and covering water storage containers.
DV = (3) visited doctor’s clinic.
DV = (4) willing to protect areas around water points.
DV = (5) perception of current access to clean portable water.
The two IV were:
IV = (1) main source of water
IV = (2) attended WATSAN meeting
3.3 Qualitative Phase – Data Source and Sampling
3.3.1 Focus Group Discussions (FGDs)
Data from FGDs were used to answer research RQ3. Participants were selected by
purposive non-random sampling (Onwuegbuzie & Collins, 2007). They included water
management committees, women groups and water consumer groups. The assumption made was
that the selected participants who have lived in the settlement for many years have in-depth

63
knowledge on the functionality of the schemes. Patton (1990) would refer to this as an
information rich-group.
A total of 12 FGDs were carried out with approximately eight participants in each group.
Each FGD took approximately one hour twenty minutes. Table 3.3 provides a summary of the
information matrix of the FGDs. Table 3.4 provides a summary of the demographic
characteristics of the FGDs. As can be seen from the table, each FGD consisted of between eight
to twelve participants. The rationale for the range stems from the recommendation provided by
(Johnson & Christensen, 2004; Onwuegbuzie, Jiao & Bostick, 2004). They advise that focus
groups should consist of enough participants capable of yielding diverse information. However,
they should not include too many people as these may make some participants uncomfortable
thus refraining from sharing their opinions.
The FGDs were carried out at the community water offices. The location choice was
based the fact that they were the most accepting environment where participants would be free
and thoughtful when expressing their opinions and ideas (Krueger & Casey, 2000). The FGD
data were collected using a questioning route. The questioning route included the following. (1)
Two introductory questions (e.g., “since the establishment of the scheme what impacts do you
think the scheme has created in this settlement in regards to water service delivery”. (2) Three
transition questions (e.g., “what participatory related factors do you think have contributed to the
management success of this water scheme”. (3) Five key questions (e.g., “reflect back and make
a list of four most important factors you think have influenced the management success of your
scheme”. (4) A concluding question where participants were welcomed to add any comments
they may have wished to express.

64
The FGDs were conducted in the local Luo language in order to accommodate all the
audience. With the participants’ consent, all discussions were taped. The tape-recorded materials
were necessary to complement the long-hand notes thereby reinforcing the validity of the data
(Maxwell, 1992). We explained the purpose of the study, potential benefits and assured
participants that the study posed no risks to them. To ensure confidentiality, participants were
made aware that our discussions would remain private.
Table 3.3 Information Matrix of the Focus Group Discussions
Scheme
Women
group
Water consumer group
Management committee
Total
Wandiege
1
1
1
3
Obunga
1
1
1
3
Asengo
1
1
1
3
Paga
1
1
1
3
Total 4 4 4 12

65
Table 3.4 Characteristics of the Focus Group Discussion Participants
Water
scheme
Discussion
subgroup N
Mean age
(years)
House-
hold size
> 7 (%)
Residency > 5
years (%)
Scheme
membership >
3 years (%) Education Source of Income
At least
Primary (%)
At least
Secondary (%)
Trader/
small
Business
(%)
Salaried
(%)
Wage
(%)
Wandiege women 8 34 13 88 25 100 50 75 0 0
consumer 8 30 13 38 0 100 86 88 0 13
Asengo women 7 29 0 71 71 100 29 71 14 0
consumer 5 31 20 80 60 100 40 40 20 20
Paga women 7 34 0 86 86 100 43 71 14 14
consumer 5 36 40 100 80 100 100 20 40 0
Obunga women 12 37 8 75 33 100 33 75 25 0
consumer 8 30 0 63 50 100 63 75 13 0
All Management 11 52 9 100 91 100 91 55 36 0

66
3.3.2 Observation, Transect Walks and Photographic Evidence
Personal observation and transect walks were also employed as supplementary tools for
qualitative data collection. Transect walks are a series of leisure-like trips designed to familiarize
the research team with the target communities. The reason for using this approach was to the
acquisition of critical knowledge of the water and sanitation conditions within the settlements.
They were also used to confirm and cross-check which water points were operating optimally
and beneficiary water consumption practices. Most of the observation occurred during
community water meetings. Occasionally the research team which consisted of the principal
investigator, a supervisor and three research assistants also made unannounced visits to the
schemes where they freely interacted with the beneficiaries. On such occasions the team took
notes and photographs which helped in strengthening the validity of the findings. In fact, the
photographic evidence enabled the research team to gather factual evidence on the state of each
water scheme and those frequently attending community water meetings.
The team also took photographs of the location of the water offices and community water
points in the settlement. Language was not a problem because all members of the research team
spoke Luo and Kiswahili fluently. Generally, observation and transect walks offered unique and
valuable insights into how the schemes operated and how the beneficiaries interacted with each
other. These variables may be hard to quantify or when quantified may fail to provide accurate
information on what is actually taking place on the ground.
3.3.3 Qualitative Data Analysis
The main purpose in qualitative analysis was to obtain insights on the major
participatory-related factors accounting for/and or impeding success of the schemes. Data
analysis was based on an inductive research strategy. Specifically, constant comparison analysis
67
technique was employed. That is, themes (codes) which emerged from the focus group
discussions were processed and then corroborated with supporting evidence from survey data,
observation, transect walks and photographs.
The FGD’s were conducted in the local Luo language. Data analysis was conducted in
seven stages. The first stage involved transcribing the FGD data from Luo to English. Because of
potential translation drawbacks, great effort was made in preserving the original statements and
ideas of the participants. The second stage involved reading the transcripts aloud and classifying
the statements made by the FGD participants into smaller meaningful chunks. Upon completion
the codes were then attached to the chunks whereby each code corresponded with a unique non-
repetitive statement. In the third stage the research team listened to the audio tapes again and
classified more statements into codes. Listening to the tapes was very helpful. It enabled the
team to glean more information and verify additional quotations of interest. The fourth stage
involved grouping the codes by similarity and identifying themes. The fifth stage involved
classifying the themes into those that facilitated versus those that impeded the schemes’ success.
The last two stages involved the cross-case analysis of the themes and legitimization of the
findings.
The findings were legitimized by observing the following protocol. One, the classified
themes were corroborated with notes gathered through observation; transect walks and
photographic evidence (data triangulation; Denzin, 1978). Second, before classifying the themes
the research team went back and undertook member checking with the participants. Also known
as descriptive triangulation, this technique involved reading the themes and asking FGD
participants if they accurately depicted their statements (Janesick, 2000; Merriam, 1998).
Finally, in order to improve rigor, secondary data generated from peer reviewed articles were

68
also used to cross-validate the findings (Onwuegbuzie & Teddlie, 2003; Greene, Caracelli &
Graham, 1989).
3.4 Rationale for Using Mixed Methods
Arguments supporting the use of mixed methods in research design and analysis abound
in the relevant literature. In chapter 6 of his book on “Quantity and quality in social research”
Bryman (1988) discusses a list of claims supporting the adoption of the mixed methods
approach. They include: (a) the logic of triangulation, (b) appropriateness in solving the problem
of generality, (c) the idea of complementarity, (d) structure and process and (e) further
interpretation of relationships.
The logic of triangulation is the notion that one type of inquiry can be used to crosscheck
the findings of another study or within a single study. This enhances validity. Solving the
problem of generality is an argument based on the premise that addition of quantitative evidence
may help mitigate the fact that it is not often possible to generalize qualitative findings. In
supporting this assertion, Green (2007) noted that the use of mixed method provides a researcher
with the techniques to probe the contested and challenge the given by engaging in multiple
perspectives.
The concept of complementarity is the belief that findings generated by qualitative
techniques can be used to patch up gaps left unattended by quantitative techniques or vice versa.
According to sociologist Lieberson (1992), the foundations of good research rest on “building
blocks of evidence” from a variety of perspectives and methods. Structure and process is the idea
that quantitative research is considered to be better at getting to the semantic features of social
life. On the same note qualitative studies are usually stronger in terms of detailing aspects of
social life. By building on the idea of complementarity, an argument can be made that the

69
strength from both branches can help in improving quality and accuracy. Lastly, further
interpretation of relationships is the notion that quantitative research is known for allowing
researchers to analyze and compare different variables or for establishing relationships.
However, they are weak in exploring reasons for the existence of such relationships. In such
cases qualitative methods can be employed to help explain the broad relationships established by
quantitative data.
Morgan (2007) showcased through examples two specific benefits of the mixed methods
approach. First, he noted that many researchers would describe the process of theory
development in qualitative research as being very inductive and quantitative research as being
very deductive. However, few qualitative studies start without any sense of a research question
or theoretical foundations. On the same token, few quantitative studies move from theory to
hypothesis test and then stop. The truth Morgan (2007:10) notes is that all research projects make
several moves between theory reconstruction and data analysis. For Morgan, “a strong mixed
methods approach call for abduction, the complementary and constant dialectic between
inductive and deductive theoretical development rather than a reliance on one of the other”.
In the present study the application of the mixed methods approach was expected to yield
complementary results and also support further interpretation of relationships. Specifically, the
quantitative data were designed to help in establishing a relationship between participation and
beneficiary satisfaction with the work of the water management committees in the schemes.
They were also vital in highlighting the relationship between participation and clean water
service delivery in the settlements. In short, the approach enabled the study to tease out
associations between quantifiable variables as opposed to those that can-not be easily quantified.
Sydenstricker-Neto (2004) asserts that a strong mixed method way of thinking is a promising
70
means to generate a better understanding of complex problems. It has the potential to offer more
venues for producing outcomes that are more meaningful to both audiences and stakeholders.
Despite its strengths and potential benefits, the mixed methods approach has shortfalls.
One pitfall for using mixed methods in this study was the fear of data incompatibility (Brannan,
1992). To address this problem before it occurred, the research questions in this study were
modelled and framed to complement each other. The research questions were also subjected to a
review by experts in the field before data collection phase. Johnson and Onwuegbuzie (2004)
observed that the foundation of study is the research questions. The methods are secondary and
should follow research questions in a way that offers the best chance in obtaining useful answers.
3.5 Selection Criteria for the Studied Schemes
The journey for selecting the schemes examined in this dissertation inquiry begun in the
summer of 2013. In June 2013, the Principal Investigator (P1) traveled to Kenya to review
several potential water projects for the present study. The P1 visited several organizations
working in partnership with different communities in the water service sector in Kisumu. After
two weeks of consultation and observation the work of SANA in the water service delivery
sector in Kisumu stood out. They had well-established water projects in Kisumu urban informal
settlements. Accordingly, the P1 approached SANA and arranged to meet their director to begin
the process of sampling different water schemes for a case study in this dissertation.
Table 3.5 is a summary of activities involved in the selection process. The first meeting
between the P1 and SANA’s director took place on 20th
July 2013. In this meeting the director
described their work in the water service provisioning in Kisumu. He also introduced the P1 to
his staff and on the same day made available some vital organization document for any future
perusal. These included financial reports, memorandum of understandings between SANA and

71
Table 3.5 Summary of Selection Process of the Studied Water Schemes
Task Step 1 Step 2 Step 3
1
List all Non-Governmental
Organizations (NGOs) working
in the water sector in Kisumu
Sampled all NGOs
known to be
involved in the water
service provision in
Kisumu, Kenya
Selected SANA
2
Arranged and interviewed the
team leader of SANA
Arranged for a
meeting with SANA
staff members
Visited 7 water
schemes established by
SANA in collaboration
with different
communities around
Kisumu
3
After consultation and review of
available secondary data, four
schemes were purposively
sampled. That is (Paga,
Wandiege, Asengo and
Obunga)
Arranged and made
a second visit to the
four sampled
schemes
Began writing the then
proposal and three
months later
successfully defended a
proposal and the study
got approved by the
dissertation committee
and IRB
the communities they were working with in Kisumu, minutes of community meeting attendance
and history on the establishment of different water schemes. The second meeting took place
three days later. During the course of this meeting, one of the staff was instructed to show the
Principal Investigator different water schemes SANA had established in the city. During the
visits the P1 was introduced to the water project management teams and the project beneficiaries
who were responsible for daily maintenance and operation of the schemes. The P1 also used this
opportunity to know the schemes better and take some insightful personal observations on the
schemes functionality. In total seven schemes were visited.
The next task involved the selection process of the examined schemes. The four schemes
were purposively sampled based on three parameters: (1) history and available operational

72
evidence, (2) recommendation from SANA and the schemes management team, and (3) the
research questions of interest in this dissertation. With regards to the evidence, the four chosen
schemes had detailed and sufficient secondary data. They were also located in strategic random
sections of the city. The strategic location of the schemes was good because it enabled the
research team to generate diverse responses thus improving the credibility of the findings. With
regards to Parameter Number 2, SANA’s reason for choosing the four schemes was based on the
premise that the two schemes were performing really well, one just average, while the forth
one’s performance was abysmal. For these reasons they were more interested in knowing the
underlying reasons behind the difference in performance in order to improve their intervention
tactics. On Parameter Number 3, the primary goal of Research Question Number One was to
investigate the relationship between CP and beneficiary satisfaction with the work of the
management committee of the schemes. For this reason consideration had to be given to schemes
which had been in operation for a significant length of time. Additionally, the third research
question concerned factors which affect the performance of the schemes. In this regard, we
sampled schemes which were performing well and those which were perceived to be performing
poorly.
3.6 Data Quality Management Issues
Previous studies point out that there are many errors which may arise in a research
process. According to Babbie (2004) potential errors might occur during data collection, methods
used to store the data collected or during the time of data analysis. Data quality management
should, therefore, be observed during the entire research process. Data quality management
refers to the establishment and deployment of roles, responsibilities and policies and procedures
concerning data acquisition, maintenance, dissemination and disposition (Babbie, 2004). The

73
following techniques were employed to enhance data quality in both the qualitative and
quantitative phase.
3.6.1 Qualitative Data
One way in which data quality can be compromised is when researchers or their
assistants are not properly trained (Alkin et al, 1979). To ensure data quality in this inquiry the
research teams were adequately trained on data collection and storage techniques. This applied to
both the qualitative and quantitative phases. The P1who moderated most of the FGDs have taken
research methods courses at the University of South Florida which prepared him for the task.
Moreover audio tapes were used for the FGDs. These were later transcribed verbatim and
formatted before analysis. All FGDs were conducted in privacy thus respecting the
confidentiality of all the participants. Notes and audio tapes did not contain any personal
identifies of the participants and were kept in locked filing cabinets.
According to Sikes (2000) one major threat to qualitative data is the fear that at some
point participants lied and researchers used the information as facts. To enhance credibility and
reliability of the qualitative findings in this inquiry, triangulation and prolonged engagement
techniques were employed (Denzin, 1978; Lincoln & Guba, 1985). Triangulation included both
investigator triangulation (i.e. using different personnel to moderate the FGDs) and data
triangulation (i.e. the FGDs was composed of a variety of people that is women groups, water
management committees and water consumer groups). By using triangulation the research team
was able to cross-check statements made by all the participants for similarities and differences.
By applying the prolonged engagement technique all the FGDs took place within a three-month
period. This enabled the team to informally interact further with the participants thus gaining
more insightful information about factors affecting the performance of the schemes. The research

74
team also made sure that there was fair representation of both women and men among FGD
participants. In fact this is the reason why we included women groups as a unit within the FGD
participants. Table 3.3 shows the number of women groups who participated in the FGDs.
The application of the aforementioned techniques enabled the research team avoid what
Denzin and Licoln (2005) have called a crisis of representation. This implies the difficulty in
capturing the phenomena or attributes we intended to via text. Indeed we are confident to assert
that the qualitative findings in this study have theoretical generalizability (Ryan et al, 2002) and
empirical applicability (Babbie, 2004).
3.6.2 Quantitative Data
In quantitative studies validity of the findings is always an issue. This study is no
exception. The concept of validity refers to the extent to which the information collected
accurately depicts the phenomena being studied (Babbie, 2004). One can argue that it is closely
linked to how the research was conceptualized (i.e. variables operationalization), data collection
procedures and the techniques used to interpret the findings.
To ensure validity in the quantitative part of this study, the research questions were
modeled with the aid of current literature dwelling on CP in water service delivery. This
assertion is reinforced by the theoretical framework shown in chapter one and the related
literature reviewed in chapter two. Furthermore, the research questions (RQ1 & RQ2) which
were mostly addressed by the survey data were evaluated and re-adjusted accordingly by experts
in the field. Similarly, the variables pursued in the questionnaire survey are complemented by
what is contained in current literature. Furthermore a simple random sampling technique was
used in collecting the survey data. The research team used the latest Kenya Independent Voter
register (2012) to draw a sample for the study. This document contains the names of all

75
registered voters in Kenya who by law must be over the age of eighteen and must possess a
national identification card (Laws of Kenya, The New Constitution, 2010). Voting is mandatory
for all persons over the age of eighteen in Kenya (Laws of Kenya, The New Constitution, 2010).
This meant that everybody over the age of eighteen living within the location of the sampled
schemes had an equal chance of being surveyed for the study. Put together the rigorous process
helped in solving the potential errors such as instrumentation problems or researchers bias.
Tashakkori and Teddlie (1998) observe that instrumentation issues or researchers bias are major
problems in quantitative analysis. The former occurs when the results from a measure lack the
appropriate level of consistency or inadequate results. The latter happens when the research
personnel favors one technique over another technique thus resulting in statistical testing errors.
In this study logistic regression was employed in answering research question one and two. So
far it is considered as one of the best techniques in analyzing studies where the dependent
variable has a binary outcome. This implies that those analysis where the assumptions of linear
regression are not valid, i.e. where the relationship between x and y is nonlinear, error terms are
heteroscedastic and lastly error terms are not normally distributed (Cabrera, 1994; Cox & Snell,
1989; Tabachnick & Fidell, 2001). Overall, this study followed the scientific method in
sampling the participants. The variables analyzed are anchored on those formulated in previous
peer reviewed articles. The logistic regression analysis used in answering research question one
and two is considered one of the most rigorous analytical techniques in studies similar to this.
That is, those analysis where the dependent variable has a binary outcome.
3.7 Ethical Consideration
Before undertaking this study the principal investigator applied for an approval with
University of South Florida Institutional Review Board (IRB). An IRB is a board charged with

76
protecting the rights and welfare of people involved in research. IRB reviews plans for research
involving human subjects. In the United States of America, institutions that accept funding from
the federal governments are required to have an IRB charged with reviewing all research
involving human subjects (see, Appendix A). This requirement is mandatory for all studies even
if the research is not funded by the federal government. In this study, University of South Florida
Institutional Review Board ensured that it was carried out in accordance to policies which are
designed to protect humans participating in a research.
Moreover while in the field all the participants were asked to voluntarily sign an
informed consent form prior to participation (see, Appendix B, C, D, E, F, G, H, & I). The
survey informed consent form included the principal investigator information, the study
objectives and its benefits, confidentiality issues and any related risks. The FGD informed
consent form also addressed the same issues. Throughout the data collection period the research
team continually re-evaluated sampling designs and procedures for ethical and scientific
appropriateness (Onwuegbuzie et al, 2007). All the data collected were confidentially stored and
have only been used in this dissertation study. Nobody was coerced into participating in this
study.

77
4. EMPIRICAL EFFECTS OF CP ON BENEFICIARY SATISFACTION WITH
THE WORK OF THE WATER SCHEMES’ MANAGEMENT COMMITTEES
This chapter presents the findings for Research Question One. The question is concerned
with the relationship between participation and beneficiary satisfaction with the work of the
water management committees in the four schemes. Consumer satisfaction with the work of the
management committees can be used as a reflection on these projects effectiveness in regards to
water service delivery in Kisumu informal settlements. Included in the findings are household
demographic characteristics, descriptive statistics of the dependent and independent variables,
bivariate and multivariate logistic regression results. The chapter concludes with a discussion of
how the results reported here relate to previous studies.
Overall, the results from both logistic regression models indicate an association between
participatory variables and beneficiary satisfaction with the work of the water management
committees. A measure for consumer satisfaction was attained in the questionnaire survey item
40, by the question “Overall, how satisfied are you and your household with the management
work of the committee responsible for managing your main source of water?” The respondents’
answers were regressed against a series of participatory indicators. These were questions which
originated from the questionnaire items. The findings reveal that households which were actively
participating in the schemes’ activities tended to be more satisfied with the work of the water
management committees. In other words, the management committees were doing everything
possible to ensure that the schemes were continually supplying water, beneficiary complaints
were effectively resolved thus making them more willing to provide labor to the schemes. Most

78
importantly, beneficiaries were also more willing to continue paying for water drawn from the
schemes or intervene against pipe vandalism in their community whenever they encountered it.
4.1 Selected Sample Demographic Characteristics
Table 4.1 contains a summary of the economic and demographic characteristics of the
sampled households. As can be seen in the table over 65 percent of households sampled have
lived in the settlements for more than two years. Most participants, therefore, had a clear sense of
how the schemes operated. This information is consistent with the FGD data culled from the
Introductory Questions (See, Appendix I). The water consumer group FGD participants observed
that majority of the beneficiaries they represent had lived in the settlements for a significant
period of time. Furthermore, majority of them have relied on the community managed water
scheme as their main source of water.
Household size in the settlement averages between 4 and 5 people. These consist mostly
of father, mother, children and sometimes relatives. This is a common characteristic in the
African urban space. Most often, young people move to urban centers with their families in
search of jobs. Unfortunately they end up living in informal settlements/neighborhoods when
they are unable to gain fulltime employment. In some isolated cases, supplementary data
gathered through observation and transect walks reveal that there are polygamous families and
orphaned children present in the four settlements. Some of the orphan children live together as
families and most of depend on food assistance from well-wishers.
Level of education varies across the settlements. Primary and secondary education is the
peak level. Specifically, Paga leads at 56 percent with respondents reporting their highest level of
education as primary. For secondary level education, Obunga leads at 44 percent while Paga
come at a distant fourth with 27 percent of the respondents reporting as having achieved

79
secondary level education. Most of the residents in the settlements are poor, which accounts, at
least in part, for the low level of education. However, Asengo seems to be an exception with
regards to education level. Sixteen percent of respondents in Asengo reported their highest level
of education as University. This corresponds with monthly income where Asengo has the lowest
number of people reporting their monthly income as below Kshs 20,000 (equivalent USD 230).
Generally, in Kenya just like in any other country around the world income is highly correlated
to education level.
Table 4.1 Demographic and Economic Characteristics of Sampled Household
Demographic Characteristics
Wandiege
Obunga
Asengo
Paga
Total number of households surveyed 79 80 79 79
% of respondents who are female 69 72 59 84
% of respondents who are male 32 28 41 16
Average households size 5 4 4 4
Number of females living in a household 223 157 187 175
Number of males living in a household 197 163 168 156
% of respondents highest level of education no formal education 6 8 3 11
% of respondents highest level of education primary 31 9 24 56
% of respondents highest level of education secondary 38 44 34 27
% of respondents highest level of education diploma 23 32 23 4
% of respondents highest level of education university 3 8 16 3
% of household main source of income Wage employment 20 28 23 37
% of household main source of income Artisan/Blacksmith 1 11 0 8
% of household main source of income salaried employment 28 23 44 16
% of household main source of income is trading/small business 51 38 33 39
% of household monthly income below Kshs 20,000 (USD 230) 79 89 68 79
% of household monthly expenditure below Kshs 20,000 ($ 230) 90 94 87 71
% of respondents number of years lived in the settlement > 2yrs 67 65 77 85

80
Being in low income areas, most residents in the locale of the studied schemes depend
on meagre income-generating activities. As compared to other sources of income listed in the
survey, majority of the residents depend on trading and small business as their main source of
income. Percentages of household whose main source of income are trading and small businesses
are reported as follows, 51 percent in Wandiege, 38 percent in Obunga, 33 percent in Asengo
and 39 percent in Paga. Trading and small business include activities such as women selling
second-hand clothing, vegetables, charcoal and fish mongering, and men operating small kiosks,
video shows and welding workshops.
In the developing world, water vending is an activity which is most often carried out by
women (Kjellen, 2000; Kjellen & Mc Granahan, 2006; Whittington et al, 1989). As can be seen
from the table, the respondents were predominantly women. Specifically, in Wandiege 69
percent of the participants were women while 32 percent were men. Similar patterns are reflected
in Obunga (72 percent), Asengo (59 percent) and Paga (84 percent).
To provide baseline data and for control purposes, it is important to note that there are
different sources of water in the settlements. This is illustrated in the study setting section. The
selection of respondents’ surveyed was done randomly. This meant that regardless of the
respondent’s main source of water everyone living in the settlements locale had the same chance
of being chosen to participant in the survey.
Table 4.2 presents a summary of household’s main source of water. As can be seen from
the table, in Wandiege 65 percent of households depend on community managed water kiosk, 48
percent in Obunga, 37 percent in Asengo and 75 percent in Paga. Those who rely on piped
individual community managed are however few. In Wandiege 29 percent of households depend
on piped individual community managed water schemes, 28 percent in Obunga, 42 percent in

81
Asengo and none in Paga. Probably financial reasons contribute to this observation. Most people
in the settlement cannot afford individual water connection to their homes.
Table 4.2 Household Main Source of Water
% of household who reported main source of
water as
Wandiege
n:79
Obunga
n:80
Asengo
n:79
Paga
n:79
Total
n:317
Community managed water kiosk
65
48
37
75
56
Piped individual community managed 29 28 42 0 25
Private vendor 4 3 5 0 3
Borehole 3 13 0 6 5
Rain Harvesting/roof catchment 0 1 3 0 1
Well 0 9 4 8 5
Spring 0 0 10 5 4
River 0 0 0 6 2
4.2 Description of Dependent and Independent Variables
In the following section descriptive statistics of the dependent (beneficiary satisfaction
with the work of the management committee) and independent variables (participation) are
presented.
4.2.1 Beneficiary Satisfaction with the Work of the Management Committee (DV)
Table 4.3 contains the descriptive statistics of households’ response to the question, how
satisfied are you and your household with the management work of the committee responsible for
managing your main source of water. Overall, the table indicates that 57.4 percent of the
households surveyed reported being satisfied with the committee responsible for managing main
source of water. However, there are some variations amongst the individual schemes.

82
Table 4.3 Household Responses to the Question “how satisfied are you and your household with
the management work of the committee responsible for managing your main source of water”
% of household who reported being
Wandiege
n:79
Obunga
n:80
Asengo
n:79
Paga
n:79
Total
n:317
Satisfied
81
73.8
58.2
16.5
57.4
Not Satisfied
19
26.3
41.8
83.5
42.6
4.2.2 Participation (IV)
Different analysts have suggested several indicators which can be used to measure
participation. Most of these indicators as employed by previous studies have already been
covered in the literature review section. Yacoob and Walker (1991) used upfront cash
contribution and labor as primary indicators of participation in development projects. Manikutty
(1997) suggested three indicators which can be used to ascertain participation. These are
beneficiary voice in choice of the water system, resource contribution and the level of women
involvement in management committees. Sara and Katz (1998) specify beneficiary willingness to
pay and contribution in decision making as a basis for operationalizing participation. Isham et al
(2001) measured participation in terms of cash contribution, labor provision and beneficiaries
taking responsibility in terms of operation and maintenance.
83
Cash contribution has extensively been used as a measure of participation. However, it
has been criticized by scholars such as Agarwal (2001), Cooke et al (2001) and Schouten et al
(2003). Specifically, Agarwal (2001) has classified cash contribution as a form of low level
participation. This is because; in most development projects beneficiaries are hardly given a
choice to make decisions once they contribute money. Anti-liberalization proponents such as
Peet, 2003 and Roy, 2002 have also criticized cash contribution purely on the basis that the poor
should not pay for water. These arguments have prompted scholars like Prokoby (2005) to
suggest other indicators which can be used alongside cash contribution in ascertaining
participation. These are (1) meeting attendance, (2) contribution in meetings, and (3) beneficiary
involvement in managerial work.
Building on Prokoby’s (2005) work, this study employed the following indicators of
participation;
(1) Provision of paid labor to the scheme.
(2) Payment of water bills in time.
(3) Willingness to pay water bills in time.
(4) Willingness to contribute money/ time for an expansion of the community managed
water scheme,
(5) Willingness to intervene in case of pipe vandalism.
(6) Attendance to public meeting where water and sanitation issues are discussed, and
(7) Complaints about water supply and quality issues.
Table 4.4 contains the descriptive statistics for household level measures of participation
used in the modeling.

84
Table 4.4 Participatory Indicators Used in the Models
% of households who reported
Wandiege
n:79
Obunga
n:80
Asengo
n:79
Paga
n:79
Total
n:317
Having provided paid/unpaid labor to the
community managed water scheme
57
61.3
34.2
1.3
38.5
Always paying their water bills in time 93.7 81.3 83.5 82.3 85.2
Still willing to continue paying their water
bills in time
93.7
82.5
81
84.8
85.5
Willing to contribute money or time for an
expansion of the community managed
water scheme
67.1
80
83.5
43
68.5
Willing to intervene if they experience
pipe vandalism in their community
68.4
82.5
97.5
15.2
65.9
Having attended a public meeting in the
last two years where water and sanitation
service provisioning issues were discussed
60.8
70
40
17.7
47.3
Have or any member of their household
made a complaint about water
supply/quality issues over the last three
years
50.6
37.5
49.4
81
54.6
Presented next are the results of the univariate and multivariate logistic regression
models.
4.3 The Models and Results
The question being explored in both the models is what is the relationship between CP
and beneficiary satisfaction with the work of the water management committees in the four
schemes? The dependent variable (DV) and the independent variables (IV) originated from direct
questions in the questionnaire survey. The DV is household satisfaction with the work of the
85
management committee responsible for managing their main source of water. The responses
were coded as 1 if a respondent said “satisfied” and 0 if a respondent said “not satisfied”.
The IVs are LABOUR, PAYBILL, WILLTOPAY, INTERVENE, ATTMEET,
CONTRIBUTION and COMPLAINT. LABOUR refers to whether the respondent has ever
provided paid or unpaid labor to the community managed water scheme in his settlement.
PAYBILL refers to whether the respondents pay their water bills in time. WILLTOPAY refers to
whether the respondent is still willing to continue paying their water bills in time. INTERVENE
refers to whether the respondents is willing to intervene if they ever experience water pipe
vandalism in their community. ATTMEET refers to whether the respondents have ever attended a
public meeting where water and sanitation service provisioning issues were discussed.
CONTRIBUTION refers to respondent’s willingness to contribute money or time for an
expansion of the community managed water scheme. COMPLAINT defined as whether the
respondent or any member of his/her household has ever made a complaint about their water
supply/quality issues over the past three years.
4.3.1 Bivariate Logit Analysis
Table 4.5 presents the results of the bivariate model. All the independent variables are
significantly associated with the dependent variable (p = 0.01). Specifically for LABOUR the
results indicate that the odds of being satisfied with the work of the management committee is
6.2 times higher for households that had provided paid or unpaid labor to the community
operated water scheme. For PAYBILL the result shows that the satisfaction level of household
with the management work of the committee responsible for managing main source of water was
2.3 times higher among households who always paid their water bills in time.

86
The same trend is evident in variables WILLTOPAY, INTERVENE, ATTMEET,
CONTRIBUTION and COMPLAINT. Among the aforementioned variables the result for
INTERVENE is quite robust. The findings indicate that the odds of being satisfied with the work
of the management committee is 7.4 times higher for households who were willing to intervene
if they ever experienced pipe vandalism in their community.
For CONTRIBUTION the findings indicate that the odds of being satisfied with the work
of the water management committee is 5.4 times higher for those households who showed
willingness to contribute money or time for the expansion of the community managed water
scheme. Contribution of money and time has frequently featured in CP literature as an indicator
of high level participation. Another notable variable in the model is COMPLAINT. Recall this
variable was earlier defined as whether the respondent or any other member of his/her household
have ever made a complaint about their water supply/quality issues over the past three years. The
results for this variable indicate that the satisfaction of households with the management work of
the committee responsible for managing main source of water reduced by 72% if the household
did not complain about water supply/quality issues in the past 3 years compared to those that
complained.
4.3.2 Multivariate Logit Analysis
The base equation tested in the multivariate analysis was as follows
Logit (SATISFACTION) = β0 + β1 (LABOUR) + β2 (PAYBILL) + β3 (WILLTOPAY) + β4
(INTERVENE) + β5 (ATTMEET) + β6 (CONTRIBUTION) + β7 (COMPLAINT).
Where Dependent variable
Logit (SATISFACTION) = Satisfied or not satisfied with the management committee (0 or 1)

87
Independent variables
Labor = provided paid or unpaid labor to community water scheme (0 or 1)
Paybill = payment of water bills in time (0 or 1)
Willtopaybill = Still willing to continue paying water bills in time (0 or 1)
Intervene = willing to intervene if ever experience pipe vandalism (0 or 1)
Attmeet = Ever attended public meeting where water and sanitation issues are discussed (0 or 1)
Contribution = Willingness to contribute money or time for an expansion of community (0 or 1)
managed water scheme
Complaint = Ever complaint about water supply/quality issues over the past 3 years (0 or 1)
Reported in Table 4.6 are the results of the multivariate model. The model fit was good
with a significant chi-square value. The model indicated that there is an association between
some participatory variables and beneficiary satisfaction with the work of the committee
responsible for managing their main source of water.
The five independent variables which were significantly associated with the dependent
variable LABOUR, INTERVENE, ATTMEET, CONTRIBUTION and COMPLAINT.
For LABOUR the results suggested that holding other variables constant, the odds of
being satisfied with the work of the management committees was 2.4 times higher for
households who had provided paid or unpaid labor to the community managed water scheme.
For INTERVENE the results indicated that holding other variables constant, the odds of
being satisfied with the work of the management committee was 2.6 times higher for respondents
who were willing to intervene if they ever experienced pipe vandalism in their community. The
same trend was seen in variables ATTMEET, CONTRIBUTION and COMPLAINT.

88
Table 4.5 Bivariate Logit Results for Beneficiary satisfaction with the work of the Management Committees as Function of Various
Participatory Variables (n = 317)
Model Statistics
Independent
Variables
Log-odds (β)
Wald
df
Odds ratio (еβ)
95% CI for odds ratio
Nagelkerke R
Square
Percentage
Predicted
Correct
Labour
1.835
44.007***
1
6.264
3.643 – 10.771
0.203
67.2
Paybill
0.643
7.199***
1
2.374
1.262 – 4.465
0.031
61.5
Willtopay
0.842
6.862***
1
2.322
1.236 – 4.360
0.030
61.5
Intervene
2.007
56.323***
1
7.443
4.406 – 12.572
0.245
73.2
Attmeet
1.716
45.996***
1
5.564
3.388 – 9.136
0.2
69.1
Contribution
1.697
41.377***
1
5.456
3.254 – 9.150
0.179
70
Complaint
-1.270
27.230***
1
0.281
0.174 – 0.453
0.117
64
Notes ***Significant at the 0.01 level

89
Table 4.6 Multivariate Logit Results for Beneficiary satisfaction with the work of the Management Committees as Function of
Various Participatory Variables (n = 317)
Independent Variables
Log-odds (β)
Wald
df
Odds ratio (еβ)
95% CI for odds ratio
Labour
0.899
7.308**
1
2.456
1.280 - 4.712
Paybill
0.078
0.020
1
1.081
0.370 - 3.158
Willtopay
0.808
2.082
1
2.243
0.749 - 6.717
Intervene
0.966
7.966**
1
2.627
1.343 - 5.139
Attmeet
1.085
10.959**
1
2.960
1.557 - 5.629
Contribution
0.624
3.125*
1
1.867
0.934 - 3.731
Compalint
-1.480 21.510** 1 0.228 0.122 - 0.425
Notes **Significant at 0.05 level
*Significant at 0.10 level
Nagelkerke R Square 0.449
90
For ATTMEET the results indicated that holding other variables constant, the odds of
being satisfied with the management committee was 2.9 times higher for respondents who had
attended water and sanitation meeting in the last three years. Meetings provide a venue for
raising complaints about water issues. One assertion is that households often attend meetings
when they feel that the management is addressing their concern about water issues.
4.4 Discussion of Findings
A principle finding in this chapter is that there is an association between specific
participatory variables and beneficiary satisfaction with the work of the management committee
responsible for managing main source of water. This implies that participation influences
beneficiaries’ satisfaction with the management team. A high level of beneficiary satisfaction
with the management is a significant variable in water resource management because it can be
used as a proxy for reflection on the projects effectiveness with regards to service delivery. In
fact, Prokoby (2005) reinforces this assertion by conceptualizing project effectiveness through
the following five key variables; 1) beneficiary satisfaction with the service provided by the
management, 2) tariff payments, 3) equal access, 4) time savings in water collection, and 5)
consumers belief in the system. Nance and Ortolano (2007) also view participation as a double
edge sword. First, it enhances beneficiary satisfaction with the service which in turn leads to
better performance in water service delivery sector.
Rogers and Hall (2003:27) provided a broad list of principles for effective water service
governance as follows; i) Open and Transparent, ii) Inclusive and Communicative, iii) Coherent
and Integrative, iv) Equitable and Ethical, v) Accountable, vi) Efficient and vii) Responsive and
Sustainable. Openness and transparency implies that water institutions should operate in an open
manner by using a language that is accessible and understandable to the people. Policy decisions

91
should be done in a transparent way with all users aboard. Inclusive and communicative means
that the effectiveness and success in water service delivery depend on beneficiary participation in
policy formulation from conception to implementation and final delivery. Coherent and
integrative means, policies and action should be coherent. Coherency requires political
leadership to ensure a consistent approach within a complex system. Equitable and ethical mean
that water systems should be guided by ethical principles with are based on the rule of law.
Accountable means, rules and consequences for violation should be clearly spelt out. A well-
built arbitration system should be in place to ensure that conflicts are peacefully resolved.
Efficiency means that, the economic cost of water should be balanced against social, political and
environmental costs. Responsive and sustainable implies that the managing institution should be
built with an eye towards long-term sustainability. Water governance should strive to serve the
future generations as well as present users.
One can argue that the above listed principles can be better accomplished in water
systems where there is a well-structured functioning management team. The best way to measure
whether the management team is optimally functioning is through beneficiary satisfaction with
their overall work. As the logistic regression results suggest, a high percentage of beneficiaries
who were participating in the schemes activities reported being satisfied with the work of the
water management team. This implies that the water schemes are effectively operating with
regards to water service delivery in the informal settlements. The participatory variables worth
highlighting in this regard are labor and meeting attendance. The bivariate model reveal that the
odds of being satisfied with the work of the management committee is high among households
who have provided paid or unpaid labor to the community operated scheme compared to those
who have not. An argument can be made that provision of paid or unpaid labor are important

92
variables for project effectiveness. This is because for water to continue flowing, the system
needs adequate maintenance. In urban informal settlements where there is limited structural
planning, maintaining water projects require a great deal of unskilled labor. These include
activities such as ensuring that water tanks are regularly cleaned, tracing breaks and leaks,
keeping the pipelines clear and covering exposed pipes (Kleemeier, 2000). The more households
show their trust in the management committee the more they will be willing to provide free or
cheap labor as shown by the bivariate model.
In addition, both the bivariate and multivariate models also indicate a strong association
between meeting attendance and household satisfaction with the management. Households who
report having attended community water meetings tend to be more satisfied with the
management than households who have never attended community water meetings. One can
argue that meeting attendance can be recipe for project effectiveness from three different angles.
One speculation in literature is that households who regularly attend meetings will most often
report defects whenever they occur (Paul, 1987). They are also more likely to use meetings as a
venue to voice their opinions and call for improvements. Most importantly they will also be more
knowledgeable on how the management spends revenue collected from water sale. The more
beneficiaries take such action the more the project will become effective in term of technical
performance and improved service delivery.
Beneficiary satisfaction with the management committee is not only good for
effectiveness in water service delivery. As suggested by different analysts, it can also aid in the
establishment of sustainable community operated water schemes. According to WASH technical
report (1994) sustainable projects are seen as those which are able to maintain a flow of benefits
for a significant specified period of time after external funding stops. In such projects

93
sustainability is evaluated based on the following seven criteria. 1) Functionality of the
management committees (that is whether the management committees periodically meet and
maintain constant support and communication with the beneficiaries). 2) Whether most of the
beneficiaries covered by the project are using the facility (often 50% usage is considered
adequate for establishing sustainability. 3) Functionality of the facilities (for example 75% of
the water systems should be delivering water at any given time of the assessment for it to be
considered sustainable). 4) Existence of a vibrant relationship between the management and
other officials. 5) Availability of technical repair operators and spare parts. 6) Existence of
partnership between the facility and government agencies. 7) Existence of adequate financial
resources.
Similarly, the World Health Organization handbook (WHO, 1994) views sustainability as
the creation and maintenance of conditions that ensure adequate technical performance and
financial success of projects. The handbook also calls for the necessity of information sharing
between the community and agencies as prerequisites for sustainability. The UN’s Agenda 21
definition of sustainability is broad. It views sustainable development as a way of reversing
poverty by giving the poor more access to the resource they need to live. Agenda 21’s definition
of sustainability includes economic development, social development and environmental
protection.
Harvey and Reed (2007) suggest that most of these principles of sustainability are
attainable in societies/communities/schemes where there is a functioning system/overseeing
body. In fact this is rarely recognized in existing literature apart from the WASH (1994) report
which documents that sustainability of water systems is mostly dependent on the performance of
institutions. In this analysis the overseeing institution is the management team since the schemes

94
are entirely managed by the community. According to WASH (1994) a functioning management
team can help water schemes avoid issues which may impede long term sustainability especially
after the project’s completion. These include issues such as technical hitches which lead to
wastage or revenue loss. In this regard one can argue that consumer satisfaction is a variable
which policy makers can use when reflecting on items which augments sustainability.
The findings reported here are consistent with those revealed by previous studies. Some
of these studies show correlation or associations between participation and better outcome in
water supply projects (see in Chapter Two, e.g. Briscoe & Ferranti, 1988; Isham & Kahkonen,
2001; Manikutty, 1997; Narayan, 1995; Prokopy, 2005; Sara &Katz, 1998). In this study, the
results indicate that there is an association between participation and beneficiary satisfaction with
the work of the management committee. Consumer satisfaction as the results suggest is essential
for the projects effectiveness and in aiding long-term sustainability. Lockwood (2003) argued
that sustainability is not linked only to the existence of specific conditions and factors before and
during construction of water supply or sanitation system, but also to specific factors well beyond
the end of construction.

95
5. EMPIRICAL RELATIONSHIP BETWEEN CP AND THE PRODUCTION OF
CLEAN POTABLE WATER SUPPLY IN THE INFORMAL SETTLEMENT
In this chapter, quantitative techniques are employed to examine the link between CP and
the production of clean water supply in the settlements. The primary concern is with Research
Question Two: What are the contributions (positive or negative) of CP to the production of clean
potable water supply in informal settlements. It is hypothesized that households that rely on
community-managed water schemes and at least attend WATSAN meetings practice better water
handling hygiene in the settlement. In other words CP contributes positively to the production of
clean potable water supply in the informal settlement as evidence by households’ overall
perceptions and water handling behaviors. The chapter is divided into three sections. Part One
presents the descriptions of the dependent and independent variables analyzed. Part Two presents
the results of the chi-square tests on relationships between the two independent and the five
dependent variables. Part Three presents logistic regression analysis results of each of the two
independent variables regressed against the five dependent variables. Part four is a summary and
discussion of the overall findings.
5.1 Description of the Dependent and Independent Variables
The literature review section in chapter Two sheds light on how previous studies have
operationalized participation. In the present study, participation assumed the independent
variables (IV) status and was measured by two actions. These are (1) Household main source of
water (Remember there are other sources of water in the informal settlements apart from the

96
four community managed water schemes) and (2) Attendance to community water and sanitation
meeting in the last two years.
The dependent variable DV, willingness to practice better water handling hygiene, was
measured by the following five indicators:
1. Household satisfaction level with the smell of water: Percentage of households that report
being satisfied on not satisfied with the smell of their main source of water.
2. Water storage containers cleaned and covered: Percentage of households who clean and
cover or not clean and cover their water storage containers.
3. Doctor’s office/clinic visits in the last six months and diagnosed with the following water
borne related diseases (Cholera, Typhoid, Scabies or Bilharzia): Percentage of households
who have visited a doctors clinic or not visited a doctors clinic in the last six month and
diagnosed with water borne related disease.
4. Willingness to protect areas around water points in their community from contamination:
Percentage of households reporting willing to protect or not protect areas around water points
from contamination.
5. Perception of current access to water: Percentage of households who report current access
to water in their community being accessible or not accessible.
5.2 Results of the Relationship between Independent and Dependent Variable
The five unique measures of the dependent variables are each modeled individually
against each of the two independent variables using chi-square test. The primary goal was to find
out if willingness to practice better water handling hygiene as conceptualized by the five unique
measures is associated with participation. This goal hinges on the hypothesis that households
who rely on community managed water schemes as their main source of water and attend

97
WATSAN meetings will practice better water handling hygiene in the settlements. The results
are presented in tables 5.1, 5.2, 5.3, 5.4, 5.5, 5.6, 5.7, 5.8, 5.9, 5.10 and 5.11. Note the numbers in
parentheses are total number of respondents in each category.
Table 5.1 contains the chi-square test result on the association between household
satisfaction with the smell of water (DV) and main water source (IV). The computed chi-square
test indicate that the association is statistically significant at the p = 0.01 level. According to the
table, 61% of households whose main water source was community managed kiosk were satisfied
with the smell of water compared to with 39% of households that were not satisfied. Similarly,
87.2% of households whose main water source was piped individual community managed
reported being satisfied with the smell of water compared to 12.8% that were not. On the other
spectrum only a meagre 37.5% of households who draw water from the well reported being
satisfied with the smell compared to 62.5% who were not. The same trend can be observed
among those households who rely on spring and river as their main source of water. In fact only
40% of those household who rely on river as main source of water indicated being satisfied with
the smell of their water compared with 60% that were not. Further scrutiny of the data shows
that, of the 317 households surveyed, a total of 176 who reported being stratified with the smell
of their water rely on community managed schemes.
In Table 5.2 the chi-square test results on the association between households satisfaction
with the smell of water (DV) and attendance to WATSAN meetings is significant at p = 0.01.
Specifically, as showcased in the table 82.7% of households that reported having attended
WATSAN meeting were satisfied with the smell of water compared with 50.3% of households
that did not. Similarly, 49.7% of households that did not attend WATSAN meeting were not
satisfied with the smell of water compared with 17.3% of households that attended.
98
Table 5.3 indicates that the association between cleaning and covering of water storage
containers (DV) and main source of water (IV) is strong. The statistically significance is at p =
0.01with an associated chi-square value of 37.572. As the table reveals 97.7% of households
whose main water source was community managed water kiosk carried out cleaning and covering
of water storage containers compared with only 2.3% of households that did not. Along the same
vein, all households who reported main source of water being piped individual community
managed cleaned and covered their water storage containers. These results indicate a somewhat
different behavioral pattern with those households who rely on other sources of water such as
borehole, spring and river. Indeed, as can be seen from the table, the percentage of households
who report not cleaning and covering their water containers are slightly high for borehole
(23.5%), well (18.8%), and spring (8.3%). This finding is significant as several studies show that
access to an improved water source does not always ensure use of clean water. In fact it has been
noted that microbiological quality of water in household storage containers is frequently lower
than at the source (Lindskog & Lindskog, 1988). This indicates that water contamination often
occurs during collection, transportation and storage.
In Table 5.4 the chi-square test results indicate a statistically insignificant association
between cleaning and covering water storage containers and attending WATSAN meetings. The
p value is 0.074 and the accompanying chi-square value is very low at 3.196. However, in table
5.5 the test shows a statistical significant pattern (p = 0.048) between being diagnosed with water
borne related disease (DV) and main source of water (IV). According to the table, only 33.9% of
households whose main source was community managed water kiosk visited a doctor’s clinic
compared with 66.1% who did not. Similarly, a staggering 67.9% of households who rely on
piped individual community managed as main source of water report not visiting a doctor’s

99
clinic compared to 32.1 who did. The statistics appears to be different at the other end of the
table. In particular, households who rely on other sources seem to be visiting doctor’s clinic
more than their counterparts who rely on community managed schemes. In these categories those
who rely on river as the main water source is leading. That is 80% of households whose main
water source was river reported visiting a doctor’s clinic with water borne related disease
compared with only 20% of households that did not. This is followed by spring with 66.7%
visiting a doctor’s clinic compared with 33.3% that did not, borehole 47.1% compared with
52.9% and lastly well at 43.8% compared with 56.3% respectively.
The chi-square p value in table 5.6 equals 0.539. This is an indication that there is a
statistically insignificant relationship (p = 0.01) between visiting a doctor’s clinic with water
borne related disease and attendance to WATSAN meeting.
Moving on to table 5.7, the results here confirms the existence of an association between
willingness to protect areas around water points from contamination (DV) and main source of
water (IV). The statistical significance of this relationship is 0.003. This means that there is a
99% probability that willingness to protect areas around water points from contamination is
related to households’ water source. Specifically, as can be seen from the table, 98.9% of
households who reported main water source as being community managed water kiosk were
willing to protect areas around water points from contamination. Among these households, only
1.1% reported unwillingness to protect areas around water points from contamination.
Similarly, 98.7% of households whose main source of water was piped individual community
managed were willing to protect areas around water points compared to 1.3% of households that
were not willing in this category. Protecting areas around water points from contamination
includes activities such as removing rubbish around water points or discouraging defecation
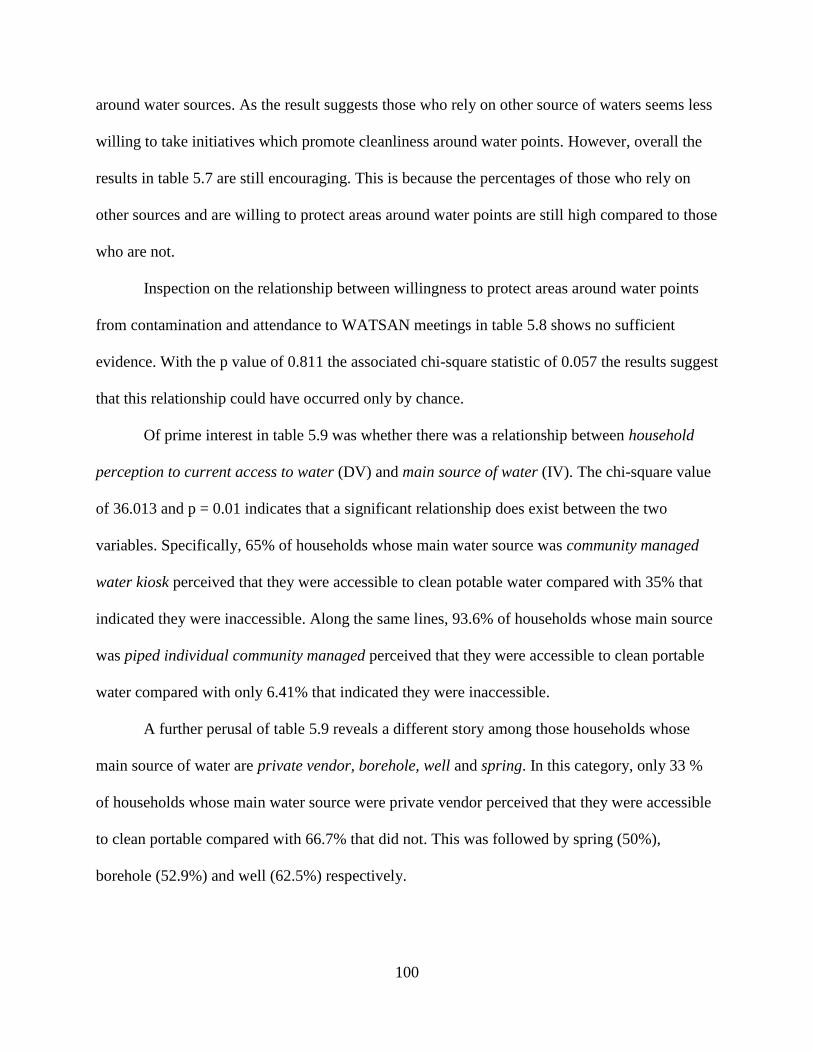
100
around water sources. As the result suggests those who rely on other source of waters seems less
willing to take initiatives which promote cleanliness around water points. However, overall the
results in table 5.7 are still encouraging. This is because the percentages of those who rely on
other sources and are willing to protect areas around water points are still high compared to those
who are not.
Inspection on the relationship between willingness to protect areas around water points
from contamination and attendance to WATSAN meetings in table 5.8 shows no sufficient
evidence. With the p value of 0.811 the associated chi-square statistic of 0.057 the results suggest
that this relationship could have occurred only by chance.
Of prime interest in table 5.9 was whether there was a relationship between household
perception to current access to water (DV) and main source of water (IV). The chi-square value
of 36.013 and p = 0.01 indicates that a significant relationship does exist between the two
variables. Specifically, 65% of households whose main water source was community managed
water kiosk perceived that they were accessible to clean potable water compared with 35% that
indicated they were inaccessible. Along the same lines, 93.6% of households whose main source
was piped individual community managed perceived that they were accessible to clean portable
water compared with only 6.41% that indicated they were inaccessible.
A further perusal of table 5.9 reveals a different story among those households whose
main source of water are private vendor, borehole, well and spring. In this category, only 33 %
of households whose main water source were private vendor perceived that they were accessible
to clean portable compared with 66.7% that did not. This was followed by spring (50%),
borehole (52.9%) and well (62.5%) respectively.

101
Table 5.1 Relationship between Household Satisfaction with the Smell of Water (DV) and Main Water Source (IV)
respondents main water source
Community
managed
kiosk
Piped
individual
community
managed
Private
vendor
Borehole Rain
Harvesting
Well Spring River Total
Water
smell
satisfying
Yes
(108)
61
(68)
87.2
(6)
66.7
(10)
58.8
(2)
66.7
(6)
37.5
(6)
50
(2)
40
(208)
65.6
No
(69)
39
(10)
12.8
(3)
33.3
(7)
41.2
(1)
33.3
(10)
62.5
(6)
50
(3)
60
(109)
34.4
Total
(177)
100
(78)
100
(9)
100
(17)
100
(3)
100
(16)
100
(12)
100
(5)
100
(317)
100
Pearson Chi-square = 26.446 d.f. = 7 p = 0.000* n = 317
Table 5.2 Relationship between Household Satisfaction with the Smell of Water (DV) and Attendance to WATSAN Meetings (IV)
ever attended water and sanitation meeting
Yes No Total
Water smell satisfying
Yes
(124)
82.7
(84)
50.3
(208)
65.6
NO
(26)
17.3
(83)
49.7
(109)
34.4
Total
(150)
100
(169)
100
(317)
100
Peason Chi-square = 36.694 d.f. = 1 p = 0.000* n=317

102
Table 5.3 Relationship between Cleaning and Covering Water Storage Containers (DV) and Main Source of Water (IV)
Respondents main water source
Community
managed
kiosk
Piped
individual
community
managed
Private
vendor
Borehole Rain
Harvesting
Well Spring River Total
Storage
containers
cleaned and
covered
Yes
(173)
97.7
(78)
100
(9)
100
(13)
76.5
(2)
66.7
(13)
81.3
(11)
91.7
(5)
100
(304)
95.9
No
(4)
2.3
(0)
0
(0)
0
(4)
23.5
(1)
33.3
(3)
18.8
(1)
8.3
(0)
0
(13)
4.1
Total
(177)
100
(78)
100
(9)
100
(17)
100
(3)
100
(16)
100
(12)
100
(5)
100
(317)
100
Pearson Chi-square = 37.572 d.f. = 7 p = 0.000* n = 317
Table 5.4 Relationship between Cleaning and Covering Water Storage Containers (DV) and Attendance to WATSAN Meetings (IV)
ever attended water and sanitation meeting
Yes No Total
Storage containers
cleaned and covered
Yes
(147)
98
(157)
94
(304)
95.9
No
(3)
2
(10)
6
(13)
4.1
Total
(150)
100
(167)
100
(317)
100
Pearson Chi-square = 3.196 d.f. = 1 p = 0.074 n = 317

103
Table 5.5 Relationship between Being Diagnosed with Water Borne Related Disease (DV) and Main Source of Water (IV)
Respondents main water source
Community
managed
kiosk
Piped
individual
community
managed
Private
vendor
Borehole Rain
Harvesting
Well Spring River Total
Visited a
doctors clinic
diagnosed
water borne
disease
related illness
Yes
(60)
33.9
(25)
32.1
(5)
55.6
(8)
47.1
(0)
0
(7)
43.8
(8)
66.7
(4)
80
(117)
36.9
No
(117)
66.1
(53)
67.9
(4)
44.4
(9)
52.9
(3)
100
(9)
56.3
(4)
33.3
(1)
20
(200)
63.1
Total
(177)
100
(78)
100
(9)
100
(17)
100
(3)
100
(16)
100
(12)
100
(5)
100
(317)
100
Pearson Chi-square = 14.202 d.f. = 7 p = 0.048* n = 317
Table 5.6 Relationship between Being Diagnosed with Water Borne Related Disease (DV) and Attendance to WATSAN Meetings (IV)
ever attended water and sanitation meeting
Yes No Total
Visited a doctors clinic
diagnosed water borne
disease related illness
Yes
(58)
38.7
(59)
35.3
(117)
36.9
No
(92)
61.3
(108)
64.7
(200)
63.1
Total
(150)
100
(167)
100
(317)
100
Pearson Chi-square = 0.378 d.f. = 1 p = 0.539 n = 317
104
Table 5.7 Relationship between Willingness to Protect Areas around Water Points from Contamination (DV) and Main Source of Water (IV)
Respondents main water source
Community
managed
kiosk
Piped
individual
community
managed
Private
vendor
Borehole Rain
Harvesting
Well Spring River Total
Will to protect
areas around
water from
contamination
Yes
(175)
98.9
(77)
98.7
(9)
100
(14)
82.4
(3)
100
(15)
93.8
(12)
100
(5)
100
(310)
97.8
No
(2)
1.1
(1)
1.3
(0)
0
(3)
17.6
(0)
0
(1)
6.3
(0)
0
(0)
0
(7)
63.1
Total
(177)
100
(78)
100
(9)
100
(17)
100
(3)
100
(16)
100
(12)
100
(5)
100
(317)
100
Pearson Chi-square = 21.893 d.f. = 7 p = 0.003* n = 317
Table 5.8 Relationship between Willingness to Protect Areas around Water Points from Contamination (DV) and Attendance to WATSAN
Meetings
ever attended water and sanitation meeting
Yes No Total
Will to protect areas
around water from
contamination
Yes
(147)
98
(163)
97.6
(310)
97.8
No
(3)
2
(4)
2.4
(7)
2.2
Total
(150)
100
(167)
100
(317)
100
Pearson Chi-square = 0.057 d.f. = 1 p = 0.811 n = 317

105
Table 5.9 Relationship between Perception on Current Access to Water (DV) and Main Source of Water (IV)
Respondents main water source
Community
managed
kiosk
Piped
individual
community
managed
Private
vendor
Borehole Rain
Harvesting
Well Spring River Total
Perception of
current access
to water
Acc
(115)
65
(73)
93.6
(3)
33.3
(9)
52.9
(2)
66.7
(10)
62.5
(6)
50
(5)
100
(223)
70.3
Not
Acc
(62)
35
(5)
6.4
(6)
66.7
(8)
47.1
(1)
33.3
(6)
37.5
(6)
50
(0)
0
(94)
29.7
Total
(117)
100
(78)
100
(9)
100
(17)
100
(3)
100
(16)
100
(12)
100
(5)
100
(317)
100
Pearson Chi-square = 36.013 d.f. = 7 p = 0.000* n = 317
Table 5.10 Relationship between Perception on Current Access to Water (DV) and Attendance to WATSAN Meetings (IV)
Ever attended water and sanitation meeting
Yes
No Total
Perception of current
access to water
Accessible
(134)
89.3
(89)
53.3
(223)
70.3
Not accessible
(16)
10.7
(78)
46.3
(94)
29.7
Total
(150)
100
(167)
100
(317)
100
Pearson Chi-square = 49.204 d.f. = 1 p = 0.000* n = 317

106
Table 5.11 Summary of the Empirical Results between CP and Household Willingness to Practice Better Water Handling Hygiene in the
Settlements
Dependent variables (DV) Independent Variables (IV) Results
Water smell satisfying
Main source of water
Significant at p<0.01 (Chi-square = 26.446)
Water smell satisfying
Attendance to WATSAN meeting
Significant at p<0.01 (Chi-square = 36.696)
Storage containers cleaned and covered
Main source of water Significant at p<0.01 (Chi-square = 37.572)
Storage containers cleaned and covered
Attendance to WATSAN meetings Not significant at p<0.01
Visited a doctors clinic and diagnosed with
water borne related illness
Main source of water Significant at p<0.01 (Chi-square = 14.202)
Visited a doctors clinic ad diagnosed with
water borne related illness
Attendance to WATSAN meetings Not significant at p<0.01
Willingness to protect areas around water
from contamination
Main source of water Significant at p<0.01 (Chi-square = 21.893)
Willingness to protect areas around water
from contamination
Attendance to WATSAN meetings Not significant at p<0.01
Perception of current access to water
Main source of water Significant at p<0.01 (Chi-square = 36.013)
Perception of current access to water
Attendance to WATSAN meetings Significant at p<0.01 (Chi-square = 49.204)

107
Table 5.10 above also shows a significant association between household perceptions of
current access to water and attendance to WATSAN meetings. The chi-square value is high at
49.204 with a p = 0.01. That is 89.3% of households that attended WATSAN meeting perceived
that they were currently accessible to clean portable water compared with 10.7% who indicated
they were inaccessible. Similarly, 53.7 of households that did not attend WATSAN meeting
perceived that they were currently accessible to clean portable water compared with 46.3% that
indicated they were inaccessible.
Finally, table 5.11above displays the summary of the empirical results between CP and
household willingness to practice better water handling hygiene in the settlements. As can be
seen from the table there is a significant relationship p = 0.01 between water smell satisfying and
main source of water. The relationship between water smell satisfying and attendance to
WATSAN meeting is also significant at p = 0.01. Similar results can also be seen on the
relationship between cleaning and covering water storage containers and main source of water p
< 0.01, doctors clinic visits and main source of water p = 0.01, willingness to protect areas
around water points from contamination and main source of water p = 0.01, perception of current
access to water and main source of water p = 0.01, and, lastly perception of current access to
water and attendance to water and sanitation meetings p = 0.01.
5.3 Additional Tests - Logistic Regression
To validate the foregoing results logistic regression analysis tests were performed
between the DVs and IVs. The two IVs are household main source of water and attendance to
WATSAN meetings regressed on each DV. However unlike the situation in the previous case
household main source of water was collapsed to constitute two categories. These include, those
whose main source of water are community management and those who rely on other sources

108
such as private vendor, borehole, rain harvesting, well, spring and river. The general
representation of each of the 10 models was follows;
𝐿𝑛 [𝑝(𝑦=1)
𝑝(𝑦=0)] = 𝛽𝑜 + 𝛽𝑥 + ε, where Ln [
𝑝(𝑦=1)
𝑝(𝑦=0)] refers to the probability that an event will
occur to the probability that it will not; 𝛽0 = intercept, 𝛽 = vector of model coefficients, 𝑥 =
vector of independent covariates and factors and lastly ε = error term.
Table 5.12 contains a summary of the results obtained. As the table shows, there is a
statistically significant relationship between the dependent variables and independent variables in
seven cases. These are, (1) households who report being satisfied or not satisfied with the smell
of water and main source of water at p value <0.01; (2) Households who report being satisfied or
not satisfied with the smell of water and attendance to WATSAN meeting p value <0.01; (3)
Households who clean and cover or not clean and cover their water storage containers and main
source of water p value <0.01; (4) Households who have visited a doctor’s clinic or not visited a
doctor’s clinic in the last six month and diagnosed with water borne related disease and main
source of water; (5) Households reporting willing to protect or not protect areas around water
points from contamination and main source of water p value <0.05; (6) Households who report
current access to water in their community being accessible or not accessible and main water
source; (7) Households who report current access to water in their community being accessible
or not accessible and attendance to WATSAN meeting p value <0.01.
These results complement those obtained by the chi-square test. The result which
indicated that there is an association between some participatory variables and willingness to
practice better water handling by households living in the informal settlements of Kisumu,
Kenya.

109
Table 5.12 Logit Results on Willingness to Practice Better Water Handling Hygiene as a Function of Participation
Dependent variable
Independent variable
Results Model statistics
Wald
Odds
ratio (eβ)
Nagelkerke
R square
% Predicted
correct
Water smell satisfying
Main source of water 6.541*** 2.089 0.028 65.6
Water smell satisfying
Attendance to WATSAN meeting 34.097*** 4.712 0.157 65.6
Storage containers cleaned and covered
Main source of water 14.481*** 10.656 0.169 95.9
Storage containers cleaned and covered
Attendance to WATSAN meeting 2.901 3.121 0.037 95.9
Visited a doctors clinic and diagnosed with
water borne related illness
Main source of water
6.981***
0.469
0.030
63.7
Visited a doctors clinic and diagnosed with
water borne related illness
Attendance to WATSAN meeting 0.233 1.154 0.002 63.1
Willingness to protect areas around water
from contamination
Main source of water 5.104** 5.792 0.081 97.8
Willingness to protect areas around water
from contamination
Attendance to WATSAN meeting 0.057 1.202 0.001 97.8
Perception of current access to water
Main source of water 6.946*** 2.165 0.030 70.3
Perception of current access to water Attendance to WATSAN meeting 42.261*** 7.340 0.218 70.3
Notes *** Significant at the 0.0l level ** Significant at 0.05 level
110
5.4 Discussion of Findings
Analysis of the empirical relationship between CP and the production of clean potable
water supply in Kisumu informal settlements produce some very insightful results. Among the
variables examined, the findings demonstrate that there is a statistically positive association
between participation and clean water supply. Specifically households that use community
managed water schemes as their main source of water tend to (1) be satisfied with the smell of
water, (2) clean and cover their water storage containers, (3) rarely report being diagnosed with
water borne related diseases, (4) are more willing to protect areas around water points from
contamination, and (5) have a positive perception of current access to water. Similarly,
households that participant in water-related activities such as attending water and sanitation
(WATSAN) meetings tend to be (1) satisfied with the smell of their water, (2) are more willing
to protect areas around water points from contamination, and (3) have a positive perception of
current access to water. These findings complement the theory of community participation in
many ways. Most importantly, the overall finding that participation leads to better outcome in the
water service delivery (Briscoe & Ferranti, 1988; Finsterburch & Van Wicklin, 1987; Isham,
Narayan & Pritchett, 1995). In this case, the production of clean potable water supply in the
informal settlements/neighborhoods of Kisumu Kenya.
Unlike in previous studies the variables examined in this chapter add a new dimension to
participation in water service delivery. While earlier studies have used main source of water and
meeting attendance as indicators of participation, they have failed to directly link these variables
to household sanitary behaviors. Indeed a study by Manikutty, Mavalankar & Bhatt (1996) is one
of the only few studies which have attempted to link participation to changes in beneficiary
health habits. The variables used in operationalizing changes in health habits in this study

111
included using a tumbler to draw water from the containers and washing of hands with soap or
no soap after defection. The results from this inquiry indicated that there was a reduction in
water-borne related diseases in villages where households actively participated in health
education seminars. That is, beneficiaries in those villages tended to wash their hands with soap
after defecation thus leading to a reduction in water borne related diseases.
Overall the results uncovered in this study indicate a strong positive association between
household participation and willingness to practice better water handling hygiene. This
demonstrates that household participation should be encouraged in the water service delivery
sector in the informal settlement/neighborhoods. This is because the level of water quality meant
for consumption is well documented as the main cause of most infectious diseases (WHO 1992).
However, despite this knowledge, millions of people around the world still experience severe
health problems due to contaminated drinking water (WHO/UNICEF, 2008). Postel (1997)
estimated that around 80 percent of illnesses in the developing world are attributed to waterborne
diseases. In fact, a study by the World Health Organization in (2010) reported that over 2.6
billion people live under improper sanitary conditions. The same report documents that almost
900 million people have no access to clean potable water. Pruss et al (2008) reported that almost
10 percent of the total burdens of diseases globally are attributed to unsafe water and unhygienic
sanitation. In Kisumu, the main focus of this study, it is estimated that 80 percent of cholera
transmissions and deaths are attributed to lack of access to safe potable water. Gleick (2002)
document that by 2020 approximately between 34 and 76 million people will perish from
waterborne related diseases. The level of water quality is one of the most serious public health
crises facing humanity. For these reasons it requires keen attention from both policy makers and
academic theorists. Furthermore access to clean potable water and better sanitation is important

112
because as argued by different scholars, it is the foundation for healthier and economically viable
communities (Hutton et al 2007).
Chattopadhyay and Duflo (2004) contended that one of the major obstacles to the
provision of safe drinking water is the fact that governments and international organizations have
been slow in engaging local communities and utilizing their capacity through participatory
methods. They advise that the engagement of local people is essential for promoting better
management practice in natural resource utilization. In terms of clean potable water supply,
tapping the capacity of local communities can be accomplished through various methods. For
example introducing them to new skills while at the same time augmenting the knowledge they
already posses with current scientific knowledge, introducing them to water filtering techniques,
encouraging families to boil water before usage, using proper storage techniques, promoting
hygiene and cleanliness around water points, and periodically cleaning water storage facilities
such as tanks. It should not be assumed that water quality can only improve through more
infrastructural investment. Community participation in the form of hygiene education and better
management practice are all powerful techniques which could be used for improving water
quality.
Thompson et al (2003) acknowledges that the use of technology to improve water quality
is best accomplished when supported by participatory mechanisms. In communities where
participation is absent, improving water quality can be difficult. Several studies attest to this
assertion. A dissertation study by Stigler (2013) employed mixed methods techniques to examine
health and cultural outcomes of new water infrastructure projects in two indigenous communities
in Baja, Mexico. The results from the study revealed that after receiving new water infrastructure
in both communities, neither saw a reduction in rates of gastrointestinal illness. Household point-

113
of-use water quality was still poor despite the introduction of the new infrastructure.
Beneficiaries failed to accept the new infrastructure and the reason cited for doing so was the
cultural significance of the previous water source from the community point of view. The
recommendation made by the study was that it is important to incorporate CP into the planning
and implementation of water improvements.
A review of 57 public health studies by Wright (2004) identified households as active
agents that play a significant role in water contamination after collection. Clasen and Bastable
(2003) also reported a similar occurrence in Sierra Leone where there was a difference in the
level of water quality between the source and households storage facilities. In Clasen et al (2003)
study out of the 100 homes sampled, 92.9% of the samples were contaminated with fecal
coliforms at levels higher than those found at the source.
In a study carried out in South Africa and Zimbabwe (Conroy, 2006), 24 households in
low-income communities were surveyed and water samples were taken, finding that more than
40% of samples taken from homes were unsafe even though the water had come from improved
sources. These evidences suggest that improvements of water infrastructure alone do not lead to
clean water supply. Better sanitary behaviors/improvements are needed at household level in
order to improve clean potable water supply. In fact this chapter has statistically demonstrated
that community participation can fulfill this role. Specifically it shows that there is an empirical
link between participation and clean potable water supply at least in the case of Kisumu informal
settlements.

114
6. PARTICIPATION-RELATED FACTORS AFFECTING THE PERFOMANCE OF
THE SCHEMES
6.1 Introduction
Presented in this chapter are findings associated with Research Question Three. The
question read thus: “What are the participation-related factors affecting the performance of the
schemes?” The chapter is divided into four sections. The introduction deals with the concept of
success. Section Two and Three focus on factors the FGD participants perceived to have
contributed to the success/or impeded success of the schemes respectively. The chapter
concludes with a discussion on how the results relate to previous literature.
Much debate has taken place on how to define or conceptualize success in projects. The
Oxford English dictionary defines success as the accomplishment of an aim or a favorable
outcome. However, reviewing of literature reveals the ambiguity and multidimensional nature of
the term success. Belout (1998) asserts that the term essentially connotes two things: efficiency
and effectiveness. In economics, Ducker (1998) described efficiency as to do things right, or to
improve results by maximizing outputs. On the one hand, effectiveness is defined as the ability
to attain project goals and objectives. Ika (2009) considers project success as the ability of a
project to fall within the time, cost and quality constraints. This definition is reflected in
Atkinson (1999) and Westerveld (2003) works. These authors advanced the idea that to be
considered successful; a project must fall within the golden triangle of time, cost and quality.
However, it is worth noting that a project may fall within this triangle but fail upon its
completion or fail to deliver expected results after several years in operation.
115
Shenhar et al (1996) discussed the term project success within the following criterion: a)
internal project objectives, b) benefit to customers, c) direct contribution, and d) future
opportunity. Crawford (2005) described project success based on the perception of the
beneficiaries. That is, if the project met the technical performance specifications and/or its
mission from the beneficiary’s perspective. A second criterion is the extent to which a project’s
outputs, operating procedures, and interaction with its proximate environment are considered
satisfactory by the project’s primary beneficiaries (cf., Crawford, 2005). This is essentially the
notion of success employed in this study.
The FGD participants were asked whether they considered the four schemes as having
been successful (FGD interview protocol in the appendix section). The FGD participants
uniformly expressed satisfaction with the projects as far as their; technical performance, years of
operation, health benefits and improvement in water access were concerned. All the four
schemes apart from Paga had operated for over 12 years since their establishment. The FGD
participants also acknowledged that schemes had met their mission of improving access to safe
clean water and better sanitation to the residents. They further observed that improvement in
water service delivery came with other associated health benefits such as a decrease in water
borne diseases.
Table 6.1 is a summary of percentage of households who felt that there has been an
improvement in water reliability in their community since 2013. Table 6.2 is a summary of
percentage of households who have suffered from water borne related diseases in the settlement
in the last six months. This information was generated from the survey data. Both tables
corroborate the information coming from the FGD data. As can be seen from the two tables,
majority of the beneficiaries feel that there has been a dramatic improvement in water reliability

116
in the settlement. Similarly few respondents report having suffered from any of the four major
water borne diseases in the last six month.
Table 6.1 Percentage of Respondents Positively Reviewing Water Reliability in their Community since
2013 (n: 317)
Scheme
% main water source reliable % main water source not reliable
Wandiege 94.9 5.1
Obunga 71.3 28.8
Asengo 62 38
Paga 14 65
Total 61.5 38.5
Table 6.2 Percentage of Respondents who reported a Family member having suffered from Water Borne
Related Disease (n: 317)
% any household member suffered any of the following waterborne related diseases
Cholera
Typhoid
Scabies
Bilharzia
None
Wandiege 2.5 24 1.3 3.8 68
Obunga 21.3 35 3.8 0 40
Asengo 5.1 30.4 0 1.3 63.3
Paga 2.5 34.2 1.3 1.3 60.8
Total 7.9 30.9 1.6 1.6 58
Presented next are the participatory related factors which were deemed by the FGD as
having contributed to the success of the schemes.
6.2 Contributing Factors to the Success of the Schemes
The analysis reveals that six factors (Table 6.3) beginning with the most dominant to the
least dominant contributed to the success of the schemes. These included networking and
collaboration, continuous community engagement/participation, the formation of water consumer
groups, coordination and organizational management, extent of institutional formalization and
provision of dividends. Some of these factors such as networking and collaboration, continuous
community engagement/participation and coordination and organizational management have
featured in previous studies as determinants of success (see e.g. Botes & van Rensburg, 2000;

117
Khwaja, 2003; McGowan & Burns, 1988; Njoh, 2002; 2006, Rondinelli, 1991; Tendler, 1993;
Uphoff, 1996).
6.2.1 Networking and Collaboration
Comments from the (FGDs) indicated that networking and collaboration with other
organizations have played a key role in the success of all the four schemes. For instance, SANA
provided a 40, 000 US dollar loan to the Asengo Water and Sanitation Scheme (AWSS). This
loan has enabled the scheme to be financially sustainable. They used it to lay extra pipes, erect
two extra water kiosks and build two additional storage tanks. The additional pipes invariably
improved water access in the community. Prior to the completion of the SANA-supported water
schemes, members of the community depended on the same source of water as cattle. Currently
the majority of people in the community rely on the newly constructed community water kiosks.
It is also worth noting that improved piping network came along with the new bathing places for
women thereby resulting in improved sanitation.
Apart from the loan provision, SANA has been at the forefront in human resource
mobilization in AWSS. They have brought in different donors who have provided vocational
training on sanitation and its importance. Such training has ushered in quality and
professionalism in the general management of water both as a commodity and a basic human
need. In the words of one participant from AWSS “The training we have received from working
with other partners like SANA has really helped us make this scheme a success. We started this
project as lay men who believed that water should be given for free. However, the financial
management seminars arranged by SANA has enabled us to prudently manage our finances”.
Results from FGDs with the other schemes also point to better outcome which came as a
result of having partnered and collaborated with different organizations. A case worth noting is

118
the benefits which Obunga Water and Sanitation project (OWSP) have generated as a result of its
cooperation with organizations like Umande trust, Pamoja and Secode. The Umande Trust is a
rights based organization headquartered in Kisumu. It specializes in designing and building bio-
centers. These are toilets modelled to convert human wastes into biogas and liquid fertilizers.
Through its partnership with OWSP, Umande Trust has been able to build a bio-center for the
community. The biogas produced by the center is sold to community members who use it as a
source of fuel for cooking. The extra revenue from the venture is ploughed back into the scheme.
The second organization which has partnered with OWSP is Secode (Sustainable
Environment and Community Development Project). Its partnership with the scheme has led to
improved efficiency in service delivery. As observed in one of our transect walks, the most
significant problem which OWSP has battled with for years was meter chamber vandalism. The
majority of people living in the settlement are youths who are poor and unemployed. Most of
them depend on stealing and selling meter chambers to scrap metal traders. For this reason,
OWSP partnered with Secode who then sponsored the reinforcement of meter chambers with
concrete blocks. Today the problem of meter chamber vandalism has reduced.
Similarly, the WWSP management team also partially credited the organization’s success
to partnership fostered with various organizations. These included the Millennium cities
initiative, KIWASCO and Pamoja trust. As noted by their chairman the three organizations have
always responded to the community needs. For example, they built a community hall and toilets
which the community is renting for additional income. Through negotiation, KIWASCO has
accepted to work with Wandiege by closing some of the water kiosks they were operating in the
informal settlements. As previously mentioned KIWASCO is a privatized water company with

119
huge capital investment within the city of Kisumu. As a result of its monopolistic tendencies it
has been providing stiff competition to Wandiege water scheme.
6.2.2 Continuous Community Engagement/Participation
The OWSP participants stated that continuous community participation and engagement
have been instrumental to their survival as an actor in the water service provisioning domain. As
the secretary of their management team put it “When we initiated this project in the year 2003,
we had many water vendors who were operating in this slum. When we came in they resented
our initiative because water vending was their only source of income. However most people in
the community came to our rescue and supported us in carrying out the project”. This statement
is further reinforced by the secondary evidence documented in their books of accounts. They
indicate that 90 percent of beneficiaries who draw water from OWSP pay their water bills in time
(OWSP, 2014).
It is important to acknowledge that the timely payment of bills in any organization is a
pertinent factor in ensuring continuity. In the case of the OWSP, timely payment of water bills
has enabled the management to judiciously carry out its operations with limited hitches. For
instance they have been able to repair and maintain the water pump and pay their employees on
time. Most importantly, the timely payment of the water bills has facilitated the repayment of
loans advanced to the scheme by SANA International. These were loans secured by the scheme
for initial pipe extensions during the projects initiation.
6.2.3 The Formation of Water Consumer Groups
A comparison of all the FGDs data suggest that the formation of the water consumer
group did play a role in the success of the studied schemes. A participant of WWSP listed three
distinct responsibilities of their water consumer group to be as follows. First, dissemination of

120
Table 6.3 Contributing Factors to the Success of the Schemes
Factor Components
1. Networking and
collaboration
Benefits generated through attraction of more revenues
Sharing of new skills and training which help the project
meet its goal and mission
Additional labor if requested
Limit to losses coming from water pipe vandalism
2. Continuous community
engagement/participation
Creating a strong sense of community ownership
Generation of constant revenue to the schemes
Provision of additional security to the schemes assets
Goodwill to the scheme i.e. timely payment of bills
3. Formation of water
consumer groups
Facilitate in operation and maintenance processes
Bridging the gap between beneficiaries and the management
Improvement of transparency and fairness
A show of adherence to democratic principles
Expanding networking and collaboration among water users
or with other related agencies
4. Coordination and
organizational management
Monitoring and evaluation i.e. performance evaluation
Quick response/solution to technical glitches such as bursting
pipes or vandalism
Efficient, transparent and accountable revenue management
Better containment of beneficiary expectation
5. Extent of institutional
formalization
Enabling order
Better planning since beneficiary information are kept in a
central place
Easy way to reach the management
Quick response rate to issues such as pipe breakages
Central location for meeting attendance and carrying out
procurements. Other partners will also have easy access to
the management team
6. Provision of dividends
Creation of a stronger sense of ownership
Generation of additional revenue
Expansion of the service through additional revenue
Community empowerment through additional financial
liberation

121
information – that is, ensuring that the beneficiaries are well informed about any new water
service reforms. They achieve this by convening periodic public awareness forums. In
Wandiege, the positive benefit generated by the forum is manifested by the fact that most
residents are aware of their rights and obligations as water consumers. Second, there has been a
marked improvement in cooperation and partnership between water service providers throughout
Kisumu County. This has provided a platform where stakeholders in the water industry can
exchange ideas and experiences with the hope of improving service delivery. Finally, water
consumer groups, a manifestation of cooperation, provide relevant feedback by acting as the
“community voice” on issues which require management and stakeholder consultation.
Specifically in the case of WWSP, their water consumer group monitors community experiences
and provides feedback to the management. For example, as pointed out by one committee
member the water consumer group has been very vocal in water price negotiation. Two years ago
five liters of water used to cost three Kenyan Shillings (Kshs 3) but due to high electricity cost
the price had to be adjusted to Kshs 5. Before this change took effect beneficiaries had to be
consulted. Credit for this innovation goes to the scheme’s water consumer group. This is yet
another mark of cooperation-for facilitating smooth transition.
The instrumental roles of the water consumer groups are also evident in the other three
schemes. The responses from PWSS showed that its consumer group has achieved three
important results. First, they have ensured that members of the community know their right to
quality water. Second, they have ensured that these members are aware of their right to regular
water supply. Finally, they have supported the community in demanding and obtaining accurate
periodic audited books of accounts from the management committee. As confirmed by the
chairman this knowledge and awareness is what has kept them up-to-task with their roles.

122
The same can be said of OWSP where the consumer group has ensured that the
community knows its responsibility in helping the scheme meet its goals and objectives. They
have done this by making beneficiaries pay their water bills on time. Moreover they have
ensured that unauthorized usage or interference with water facilities are accurately reported to
the management committee.
Cooperation articulated in terms of water consumer groups also played an indispensable
role in the Asengo Water and Sanitation sheme (AWSS). Note that water for AWSS scheme
originates from a spring from Nandi Hills. As a result of human population growth and poverty,
human activities especially stone harvesting and charcoal burning have increased around the
Nandi hills area thus lowering water quality. However, as revealed by the FGD participants, the
water consumer group has fought the negative human activities around the Nandi hill watershed
with vigor. They have pressurized both the management team and local government authorities
to ensure that water quality does not deteriorate to unusable levels. In the last two years their
efforts have yielded positive returns because as compared to the other three water schemes the
quality of Asengo water is higher. The color of the water is clearer and the community boasts
relatively low incidences of water borne diseases.
Note that the scheme has two main supply lines, the upper and the lower lines. The
former is powered by electricity while the latter is gravity operated. Because of high electricity
bills, the water service for beneficiaries relying on the upper line can be classified as averagely
below standards. In one of our transect walks, the community living along the upper line
vehemently complained of the poor service and lack of water during dry seasons. However,
because each community has a representative in the water consumer group team, they have been
able to advocate for equal distribution of water without favoring any group.

123
6.2.4 Coordination and Organizational Management
Good coordination and organizational management played a significant role in Asengo
Water and Sanitation Scheme (AWSS). A participant from this scheme stated that their
management team is composed of men and women of integrity who respond quickly to
complaints about water service delivery or technical glitches. Sometimes members of the
management team contribute their own money to supplement financial contributions by members
of the community. As noted by another FGD participant, at the beginning of 2014 the AWSS
management contributed their own money to repair the main meter chamber. For the community,
this confirmed that the team was leading by example. Another community member stated that
they act as true custodians of their property which is water.
When asked why he thought the management team had done a good job in ensuring the
project’s success, one participant stated “In Obunga our management committee has established
a transparent and accountable system. We receive our water bills in time and these bills reflect
the amount of water we use. The bills are never exaggerated as compared to the early 1990s
when the Kisumu municipal council was in charge of the water systems in this city. When the
management team wants to adjust the water prices they do involve us in the process and our
views are expressed through our water consumer group. We get reliable water even though
sometimes the pipes are dry and we have to rely on the water vendors. Still we are happy with
their work”.
The foregoing narrative however contradicts findings for PWSS. In fact, almost all the
FGD participants in this scheme associated the problem of infrequent water supply and lack of
success to the management team. The team was seen as passive participants consisting of retirees
out of touch with the reality in urban water service provisioning. As stressed by the chairman of

124
the water consumer group team, in this scheme, the management has neither convened any
community water meetings for the last year nor organized any elections during the last five
years. For these reasons there is limited trust in the management team.
The beneficiaries in PWSS do not even trust SANA. This is captured by a statement
made by one woman FGD participant – “SANA International failed to provide our management
team with good technical advice. For example we were lukewarmly consulted when the project
was being initiated. From this point we knew that we were starting on shaky ground and this is
the reason for the schemes abysmal performance”. Such views were prevalent throughout the
entire community. They charge the leadership with corruption and feel the need for more
elections and consultations on matters relating to the scheme. Contrary to the community, the
management of PWSS attributed inefficiency in the scheme to a lack of political goodwill. There
has been political rivalry in the community between the area member of parliament and some
community elders. According to the chairman, another reason which has contributed to a
hindrance in their performance is geographical constraints. The scheme is located in a hilly and
rocky land thus making it difficult to lay pipes. Some of the pipes are exposed over the ground
which attracts thieves thereby increasing operation costs. Additionally, human settlements in this
area are sparsely distributed. This means that the pipe network has to cover long distances which
come with extra costs.
6.2.5 Extent of Institutional Formalization
Most community based water schemes in the developing world are operated from
beneficiary houses, under trees, in schools or churches. Often they lack centralized office spaces
and most of the work are done on voluntary basis (Paul, 1987).
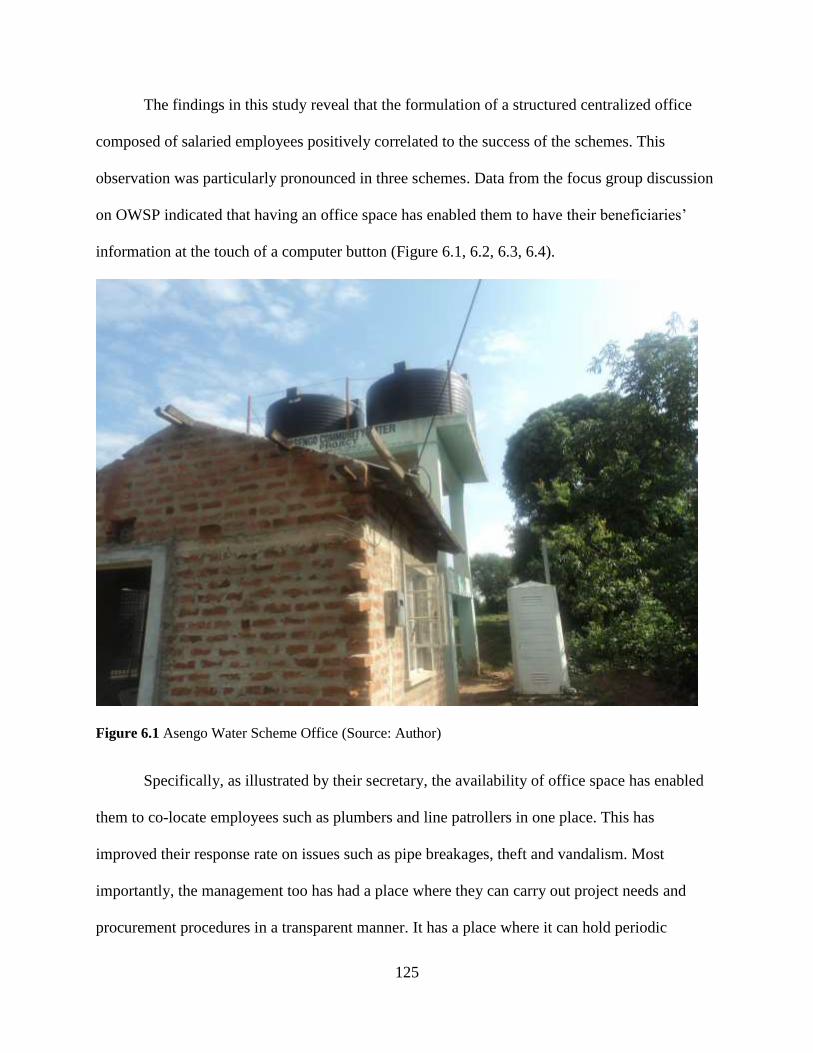
125
The findings in this study reveal that the formulation of a structured centralized office
composed of salaried employees positively correlated to the success of the schemes. This
observation was particularly pronounced in three schemes. Data from the focus group discussion
on OWSP indicated that having an office space has enabled them to have their beneficiaries’
information at the touch of a computer button (Figure 6.1, 6.2, 6.3, 6.4).
Figure 6.1 Asengo Water Scheme Office (Source: Author)
Specifically, as illustrated by their secretary, the availability of office space has enabled
them to co-locate employees such as plumbers and line patrollers in one place. This has
improved their response rate on issues such as pipe breakages, theft and vandalism. Most
importantly, the management too has had a place where they can carry out project needs and
procurement procedures in a transparent manner. It has a place where it can hold periodic

126
meetings. Other partners such as SANA and other organizations also have a central location
where they can reach the community. The foregoing view was also shared by the other two
schemes apart from Paga Water and Sanitation Scheme (PWSS) which does not have a central
office and salaried staff. Work in this scheme is done purely on voluntary basis. The water kiosks
are managed by the women group and whenever there are issues of pipe breakages the
management has to hire a private plumber to address the problem. Indeed in this study we carried
out a total of 12 FDGs thus culminating to 3 per community. Most of these discussions took
place in the community offices apart from Paga where we held out FDG under a tree due to lack
of a designated office space (see, figure 6.4).
Figure 6.2 Wandiege Water Scheme Office (Source: Author)

127
Figure 6.3 Obunga Water Scheme Office (Source: Author)
Figure 6.4 Focus Group Discussion Meeting at Paga Water Scheme (Source: Author)

128
6.2.6 Provision of Dividends to the Community
The Wandiege Water and Sanitation Scheme (WWSS) have a unique arrangement with
its beneficiaries. Although the project is community-operated, it has adopted a business model
that almost rivals that of blue chip companies in the western world. After being in operation for
four years the management in consultation with the community decided to securely float the
water scheme’s shares. Community members were invited to buy a limited number of shares
which ranged from Kshs 100 to Kshs 10,000 (1 USD equals Kshs. 84) per share. Many people
from the community bought these shares and today as showcased by the FGDs participants, the
community is receiving benefits accrued from this venture.
The money raised from the sale of the shares has effectively been utilized in extending
the pipe network and in building build more water kiosks. Some part of the money has been used
to construct a bio-center and the community ablution block complete with payable public
showers. Apart from these investments the community now receives yearly dividends which are
pegged on the profits generated by the water scheme. The following remark by one of the male
participants exemplifies beneficiaries contentment with the dividend payments; “Because we
receive yearly dividends from this scheme we feel we own the project and therefore ready to
protect it from any invaders. It acts as a source of income for us while at the same time providing
us with clean water. Some of us have used the money we get from the dividends in starting new
businesses”.
6.3 Impediments to the Schemes Success
The results indicate that four factors were perceived by the participants as having slowed
the success in the schemes. These included clanism, population increase, and poverty and
community fatigue. Refer to Table 6.4 for a summary of the aforementioned impediments.

129
Table 6.4 Factors which Impeded the Success of the Schemes
Factor
Components
Clanism Biased representation in the management committee
Diminishes the community sense of ownership
Inefficient management (poor resource mobilization, poor policy implementation)
Limit the community the available skills needed to effectively operate the system
Lead to a week or lack thereof democratic principles
Financial constraints due to diminished community sense of ownership
Population
increase,
poverty &
community
fatigue
Pressure on water system delivery
Diminished community sense of ownership
Destruction to watersheds due to population and increased human activities around
water catchment areas
6.3.1 Clanism
Clanism played a significant role in impeding success in two schemes, including AWSS
and PWSS. The AWSS is located in the urban district of Kisumu. However, historically before
the expansion and immigration of different communities into the area, it has always been
perceived that the area belonged to the Kaduong clan. Prior to Kenya’s independence in 1963,
the Kaduong clan had settled in the area where AWSS is currently located. The surrounding
clans like Katieno and Kokuku had always been viewed as foreigners in the area.
Indeed, despite Kisumu’s expansion and the dilution of the Kaduong clan by different
communities, the perception that the AWSS belongs to the Kaduong clan remains prevalent. In
fact, this view is supported by the composition of the scheme’s executive committee. In spite of
different communities living in the area the executive committee is generally composed of
people from the native Kaduong clan. Yet, as a community-owned water scheme, the board
should be representative of the people it serves. In one of the transect walk, a female FGD

130
participant noted that the water needs of persons from outside Kaduong the so called foreigners
are typically ignored by the management.
Traces of clanism were also apparent in the Paga Water and Sanitation Scheme (PWSS).
The PWSS was meant to serve three sub-locations along the Nyanza gulf which are the Osiri,
Kanyawegi and Ojolla administrative sub-locations. After its completion the scheme was
networked through the three sub-locations. As per its constitution the management composing of
twelve committee members is to be recruited equally from within the three sub-locations.
However because of clanism, this requirement has not been periodically honored. The FGD
participants observed that whenever there are elections each community always wants to have a
majority in the management committee. The following statement by one participant clearly
captures how clanism has played a detrimental role in the general operations of the scheme. “The
element of clanism has prevented our water project from getting the right and dedicated people
who are prepared to manage this project. Every clan from the three sub-locations wants to have
a majority in the management committee. Unfortunately some of the people who vouch for the
available twelve posts are driven by the expectation of financial gain. After being in the
committee for a few months, they realize that there is no money and thus leave the project
hanging”.
Data from the FGDs further point out that clanism has also affected the effectiveness of
the scheme on other fronts. For instance, it has led to poor turnout during meetings, poor policy
implementation and poor resource mobilization. In terms of meeting attendance as lamented by
one participant, it is imperative to recognize that meetings provide a venue where community
members iron out matters affecting their project. However when there is a sense of “our” project
as often seen in PWSS then not all members will see the project as a community owned project.

131
On the contrary, they will view it as a given clan’s project and hence find no incentive for
actively participating in its development. With this policy in place the community felt that only a
certain clan from within the community was being targeted for water disconnection. They
contend that the policy was never implemented across the board thus making them feel
victimized.
Lastly in PWSS, information from our FGDs suggests that unlike the other schemes the
element of clanism has made it very difficult for the management to mobilize a new resource
base. In our discussions, one of the constraints mentioned as limiting optimal functioning of the
scheme was lack of financial capital needed for expansion and improvement. The group
mentioned that at one point the main water intake pump from Lake Victoria was damaged and
did not operate for six months. When they approached the community for additional financial
contribution to repair the pump most of the members were reluctant to participate. However our
further in-depth inquiries revealed that the community members were dissatisfied with the
structural composition of the management team. Quite a majority of the residents living in the
three sub-locations felt that the management team was not democratically elected as per the
scheme’s constitution. This fact made them feel disenfranchised and for this reason they were
reluctant to contribute additional resources.
As observed by various community development scholars’ resource mobilization in
community operated projects must start with its members. Paul (1987) contended that when that
does not take place such projects are bound to fail.
6.3.2 Population Increase, Poverty and Community Fatigue
These three factors can be merged into one theme. As exposed by the FGDs they appear
to might have impeded success in the four schemes. PWSS was designed to serve a population of

132
10,000 people. Currently the population in the area has increased three fold making it impossible
to secure sufficient water service delivery to the new ballooned population. The same problem
has been experienced in the other three schemes which as of today have a population of 20000,
40000 and 50000 people respectively (SANA, 2014). At their onset these projects were modeled
to serve human populations of no more than 15000 people each (SANA, 2014).
Specifically for AWSS, population increase has come along with other problems such as
stone and firewood harvesting around Riat hill which is the main watershed for the scheme.
Currently, the area is experiencing deforestation which is mainly fueled by poverty,
unemployment and the need for firewood. This problem and how it affects the schemes progress
was accurately captured in the statement made by the chairman during FGD discussions. He
observed that, “One of the major obstacles which has hindered our growth as a community water
service delivery scheme is population increase which is associated to poverty and
unemployment. High rate of unemployment in this area has forced people to depend on the water
catchment area for survival. They harvest stones from Riat hills watershed which they sell for
Kshs 1500 per seven ton truck. Besides this, the youths also engage in charcoal burning which
has devastating effects on the forests. The forest cover in Riat hills is getting destroyed up-to the
roots because the youths go as far as digging out the tree stumps. For the women, they fetch
firewood for sale. These activities if not curtailed is affecting the well-being of our water
scheme.”
Another notable impediment, as perceived by the participants, was community fatigue. In
the case of the PWSS, water consumer group FGD participants observed that in the initial stages
the project had taken too long to be operational. As a result some members lost interest in the
project and were reluctant to contribute money or labor which curtailed the growth of the

133
scheme. The same problem somewhat manifested in the OWSP and WWSP. In the two schemes
community fatigue came as a result of some members becoming dissatisfied with the amount of
meetings and the time the meetings were convened. Women felt that there have been too many
meetings thus interfering with their daily activities like cooking. On top of this they complained
that most meetings were held in the evenings making it difficult for them to attend. At this time
of the day they are busy preparing evening meals for their husbands while at the same time
preparing children for bed.
6.4 Discussion of Findings
The afore-reported findings echo those of previous researchers. The findings on
community partnerships and collaboration provide some empirically-grounded support for the
commonly held notion that community partnership and collaboration with other organizations
can be a recipe for success in development projects (cf., Uphoff, 1996). Rondinelli and Cheema
(1988) observed that community self-help projects have rarely succeeded in places where there is
limited support from public agencies or lack of collaboration with other non-governmental
organizations. For Rondinelli and his colleagues, such agencies serve several important purposes.
Apart from giving additional revenue, they provide skilled training for community leaders. This
in turn helps them meet project goals. On their part, Egunjobi and Maro (1985) presented
evidence showing how a community drinking water project in Igboho, Nigeria benefited from
the additional financial help from the Ministry of Information and Social Development. The
community used the money to build additional water reservoir dams. Further support to the
findings comes from a study of the Kumbo community water supply project in Cameroon by
Njoh (2006). According to Njoh, the project benefited from technical and financial support by
the Canadian Development Agency and the Catholic Church.

134
The revelations on communal ownership of public works are also in concert with those
of previous studies. Some of the studies have suggested that at the core of sustainability or
success in any community-operated water scheme is the existence of a sense of ownership (see
e.g., Kleemeier, 1995, 1998, 2000; Manikutty, 1995a, 1995b). One way to ascertain a community
sense of ownership in projects is through active involvement which can be measured through
various mechanisms. Most prominent among these are meeting attendances and cash or in-kind
contributions (Prokoby 2004, 2005, 2009; Sara & Davis, 2012). Our FGDs data reaffirmed that
continuous active community engagement/participation was one of the key variables which
influenced success in the four schemes. To begin with, in the case of WWSP most participants
contended that at the onset of the project residents were mobilized to contribute funds. All of
them responded to this request without resentment or hesitation. They continue to play a big role
in providing security to the project assets such as pipes and water kiosks. Because of this, there is
a significant reduction in pipe vandalism.
The observation with respect to consumer group formation also echoes previous findings.
For instance, Rondinelli (1991) stated that to ensure success in self-help projects, appropriate
and effective processes must be developed for water system operations and maintenance and the
process must be institutionalized within the community. A study by Narayan-Parker (1998)
indicated that a five-step process for organizing village water committees contributed to the
success of the Mombasa South Coast Hand-pump Project. The first and the second stage
involved getting residents to elect water committees who were to act as pump caretakers. This
was followed by training the elected committees on pump repair and installation. Lastly,
equipping beneficiaries with appropriate operation and maintenance skills which involved
helping them know how to balance their accounts books.
135
Robert Chambers (1994) identified monitoring, evaluations and feedback as important
tools, which if appropriately implemented in self-help projects, have the potential for
guaranteeing success. These tools can better be presented and/or implemented in water schemes
where the management committees possess a high level of sophistication, organizational skills
and commitment. Blakely and colleagues (1985) provided an example where good organizational
skills and commitment from the committee contributed to the success of the Wonging’ombe
rural water supply project in Tanzania. The committee in this project was efficient in dealing
with practical matters such as complaints, providing constant feed-back to the funding agency or
enticing beneficiaries into owning the project.
Similar observations can be reported in the present study. The findings suggest that
another notable contributor to the success of the schemes is good coordination and prudent
organization emanating from the management committees. This observation is supported by
statements made by the FGDs participants. The treasurer of WWSP commented that the
management team has been aggressive in implementing changes in the application process for
individual water connection. The process has been made easy, transparent and quicker. In a study
which used Mutengene self-help water project as empirical referent, Njoh (2002) discussed
barriers to CP in development planning. By using a study by Botes and van Rensburg (2000) as a
platform, Njoh identified almost a dozen barriers to CP in development planning. One barrier
which hindered success was internal conflicts between members of the native population and
non-native population (Njoh, 2002).
In another study in Yemen, Hodgkin (1989) report that maintenance of water points
became problematic in communities where there was rampant ethnic and/or class conflict. As a
result of such conflicts, communities which shared the same water points found it difficult to
136
share maintenance responsibilities. Indeed, for some villages water vendors opposed the
introduction of community system. A previously stated in this study clanism mainly had negative
effects on the success of two schemes namely Paga Water and Sanitation Scheme (PWSS) and
Asengo Water and Sanitation Scheme (AWSS). These schemes are located at the edge of the
Kisumu municipal urban boundary. The location factor might play a possible role in why in
comparison to the other two schemes they are greatly affected by the problem of clanism.
Specifically, the main water source in AWSS sits at a region which has been inhabited by the
Kaduong clan for over a century and the region somewhat still has a rural outlook. For this
reason the community has developed a strong traditional bond with the water source. In fact, as
articulated by their chairman, the community sees the main source of water located at the foot of
Riat hills as a spiritual gift from God to them. They feel that they ought to guard it and protect it
from intruders often considered as foreigners. They have been able to express this feeling
through their election patterns which indicates that out of the six executive committee members
all of them emanate from the Kaduong clan. Similar attitudes and patterns exist in the PWSS
where clanism has also played a negative detrimental role. As showcased by the FGD data,
clanism in this scheme has led to poor turnout in community water meetings thus affecting
policy implementation and resource mobilization.
Overall, the findings in this chapter has have exposed some of the factors which might
have contributed to the success of the studied water schemes. Also identified in the chapter are
factors which might have slowed/impeded success. Ideally the issues listed here should be
considered for reflection by urban water development specialist in the ever mushrooming
informal settlements in Africa. It is however important to recognize the fact that while these

137
Kisumu informal settlements have some issues that may be unique to their water production and
social structure; they can still be used as a generalized example.

138
7. CONCLUSION
This chapter consists of three sections. Section One discusses the study’s contribution to
the literature on community participation in water production and management. Section Two
discusses the study’s limitation. The final section identifies and discusses directions for further
research in the field of community participation in urban water production and management.
7.1 Contributions to Literature
The findings from this study make the following contribution to the field of community
participation in water service delivery. It build on previous works by employing mixed methods
approach and household level data to demonstrate; 1) individual relationships between different
participatory variables and beneficiary satisfaction with the work of water management
committees which is essential for effective water service delivery, 2) relationships between
participation and clean water supply in the informal settlements of Kisumu Kenya which is
necessary for waterborne related disease mitigation, and 3) highlight important participation-
related factors which affect performance in urban based community operated water schemes.
Previous studies have rarely used mixed methods approach and household level data to
interrogate the effect of CP in urban water service delivery. Exceptions are the following, White
et al (1972) research in East Africa; Briscoe et al (1981; 1990) studies in Bangladesh and Brazil;
Asante et al (2002) research in the Ghanaian Volta Basin; Bohm et al (1993) study in the
Philippines; Dayal et al (2000) global methodological assessments of rural water supplies in 15
countries; Prokopy (2002) research on rural water supplies in India and lastly Isham & Kahkonen

139
(1999). It is important to note that most of the afore-listed studies focused their analysis in rural
and not urban informal environments.
The second contribution made by this inquiry is that previous studies have used clusters
of indicators in ascertaining CP and better outcome in water supplies projects around the world
(see, e.g. Kleemeier, 2000; Lockwood, 2003; Narayan, 1995; Prokoby & Thorsten, 2005; Sara &
Katz, 1998; WASH, 1994). It is important to acknowledge that such measurement while valid
may be masked by the effects of other variables. This study has specifically used beneficiary
satisfaction with the work of the management committee responsible for managing their main
source of water as an indicator of project effectiveness. The responses were then regressed
against specific participatory variables in the bivariate model test. The objective was to ascertain
which among the variables were associated with consumer satisfaction. The results indicate that
households who participate/involved in the schemes activities tend to be more satisfied with the
overall work of the management committee responsible for managing their main source of water.
To the principle investigators knowledge this is the first attempt to use some direct measures of
participation on beneficiary satisfaction with the work of the water management committees.
Third, this study has addressed the fact that despite evidence showing the success of CP
in rural water service provisioning, very few studies have evaluated its effects in urban water
delivery especially in informal settlements. The broader management model which has often
been promoted in urban centers is privatization. However, in the Southern hemisphere it has
failed to achieve the benefits previously anticipated and specifically in the case of urban informal
environments. It is important to note that informal neighborhoods account for roughly 30 to 60
percent of the urban population. Those who live in these environments are poor and most
governments or private companies give lower priorities to issues affecting them. Millions of

140
people are therefore denied access to clean potable water. Generally, the findings from this study
demonstrate that CP can be used as a viable strategy in establishing more effective urban based
community managed water schemes tested through consumer satisfaction with the management
committee’s work. It can also be used as a strategy for enhancing the delivery of clean potable
water in urban informal settlement.
Finally, the study shed light into some of the new participation-related factors which may
potentially aid or impede the establishment of community urban-based operated water schemes.
Previous studies (i.e. Botes & van Rensburg, 2000; Cooke and Kothari, 2001;Njoh, 2002, 2006;
Dukeshire & Thurlow, 2002; Platteau & Abraham, 2002; Platteau, 2004; Ngnikam, 2008;
Mohammadi, 2010; Swapan, 2014) have highlighted factors such as intra group conflicts,
population increase, lack of collaboration and active participation as factors which may aid or
impede community operated water projects.The new factors which this study brings to the table
are, 1) provision of yearly dividends to the beneficiary community, 2) the formation of water
consumer groups, and 3) the establishment of a structured community office complete with
salaried staff.
7.2 Study Limitation
The first potential limitation of this inquiry is that it mostly relied on information given
by the respondents. However, the four projects used as empirical referent have been in operation
for over ten years. There is a possibility that some of the respondents’ accounts of events could
have been lost due to human forgetfulness.
Another limitation is that most of the respondents were females because during the time
of data collection most of the possible male respondents were out working. This might have
resulted to some aspects of biasness. However, on the positive side and as argued elsewhere most
141
of the water related activities are performed by females i.e. fetching of water, washing of storage
containers or cooking. In this regard women are an information rich group in studies like this.
The other limitation was the rare incidences of respondent being hesitant to answer some
specific survey questions. These included the number of people living in a house, income or
level of education. Some respondents felt that these are private questions and should not be
disclosed to the public. For this reason the socioeconomic factors which might have been used
for further analysis on consumer satisfaction questions have been omitted. Time constraint was
another problem which hindered the scope of this study. The research team had three months to
collect both quantitative and qualitative data concurrently. The dissertation had to be completed
within a tight time schedule. Moreover because of limited time the research team was not able to
return to the field to collect additional information after initial data analysis. Despite the
limitations, two main possibilities for future research within the academy of community
participation in urban water production and management will be put forth.
7.3 Avenues for Future Research
Based on the findings from this dissertation more studies are needed to help in validating
the application of community participation as a viable strategy in urban water management. The
quantitative results from this study indicate that CP has been very instrumental in the
establishment of sustainable community based water schemes in Kisumu informal
neighborhoods. Furthermore CP has also been effective in enhancing the delivery of clean
potable water supply by promoting better water handling habits among households. In
evaluating these benefits, one key question which remains is that more evidence is needed across
cities in Africa with similar characteristics like Kisumu.

142
Other options for interested researchers may include carrying out comparative studies on
the effects of CP in urban water provisioning between cities in Africa, Asia or Latin America. A
comparative analysis between such cities would help enrich the sharing of knowledge and
experiences between different communities. Furthermore such analysis could yield some
interesting results considering the cultural differences between communities across the three
continents.

143
REFERENCES
Abraham, A., & Platteau, J. P. (2004). Participatory development: When culture creeps. In: Rao,
V., & Walton, M. (Eds), Culture and public action: A cross-disciplinary dialogue and
development policy (pp. 210-233). Palo Alto, CA: Stanford University Press.
Adamolekun, L. (1991). Promoting African decentralization. Public Administration and
Development, 11(3), 285-286.
Agarwal, B. (2001). Participatory exclusions, community forestry, and gender: an analysis for
South Asia and a conceptual framework. World Development, 29(10), 1623-1648.
Agrawal, A., & Ribot, J. C. (1999). Accountability in decentralization: A framework with South
Asia and African cases. Journal of Developing Areas, 33(4), 473-502.
Alabaster, G. (2010). Urbanization and water management – trends, challenges and perspectives.
Presentation at World Water Week Stockholm (online
http://www.worldwaterweek.org/documents/WWW_PDF/2010/tuesday/T5/Graham_Ala
baster.pdf - accessed 1/4/2015)
Aliaga, M., & Gunderson, B. (2002). Interactive statistics, New Jersey: Prentice Hall.
Alkin, M. C., Daillak, R., & White, P. (1979). Using evaluation: Does evaluation make a
difference? Beverly Hills, CA: Sage Publications.
Anderson, K. P., & Ostrom, E. (2008). Analyzing decentralized resource regimes from
polycentric perspectives. Policy Sciences, 41(1), 71-93.

144
Asante, F., Berger, T,. Engel, S., & Iskandarani, M., (2002). Water security in the Ghanaian
Volta Basin: Patterns, determinants and consequences. Quarterly Journal of International
Agriculture, 41(1), 145-167.
Asian Development Bank (1998) (Consultation Draft online). The Banks Policy on Water:
Working Paper. Consultation Draft 3.
Atampugre, N. (1997). Aid, NGOs and grassroots development: Northern Burkina Faso. Review
of African Political Economy, 24(71), 57-73.
Atkinson, R. (1999). Project management: cost, time and quality, two best guesses and a
phenomenon, its time to accept other success criteria. International Journal of Project
Management, 17(6), 337-342.
Awortwi, N. (2012). The riddle of community development: factors influencing participation and
management in twenty-nine African and Latin American communities. Community
Development Journal, 48(1) 89-104.
Axinn, W. G., & Pearce, L.D. (2006). Mixed method data collection strategies. New York:
Cambridge University Press.
Babbie, E. (2004). The practice of social research. Belmont California: Wadsworth Thomson
Learning.
Bakalian, A., & Wakeman, W. (2009). Post-construction support and sustainability in
community-managed rural water supply, case studies in Peru, Bolivia and Ghana. World
Bank Netherlands Water Partnership.
Bakker, K. (2008). The ambiguity of community: Debating alternatives to private-sector
provision of urban water supply. Water Alternatives, 1(2), 236-252.

145
Bakker, K. (2010). Privatizing water: Governance failure and the world’s urban water crisis.
Ithaca: Cornell University Press.
Bakker, K., Kooy, M., Shofiani, N. & Ernst-Jan, M. (2008). Governance failure: Rethinking the
institutional dimensions of urban water supply to poor households. World Development,
36(10), 1891-1915.
Banerjee, G. S., & Morella, E. (2011). Africa’s water and sanitation infrastructure, access,
affordability and alternatives, Washington DC: World Bank Publications.
Bayliss, K. (2003). Utility privatization in Sub-saharan Africa: A case study of water. The
Journal of Modern African Studies, 41(4), 507-531.
Bayliss, K. (2002). Privatization and poverty: The distributional impact of utility privatization.
Annals of Public and Co-operatives Economics, 73(4), 603-625.
Belout, A. (1998). Effects of human resource management on project effectiveness and success:
toward a new conceptual framework. International Journal of Project Management,
16(1), 21-26.
Bhasin, K. (1985). Towards empowerment. Rome FAO.
Bhatt, A., Carino, L.V., Shams, K., Siedentopf, H., & Sosmena, Jr., G.C. (eds) (1987). Building
from below: Local Initiatives for decentralized development in Asia and Pacific. Kuala
Lumpur: Asian and Pacific Development Center.
Blakely, I. A., Mwqanganila, M. G., Ngwalje, C. D., & Swai, C. L. (1985). UNICEF assisted
Waning’ombe projects: Gravity water supply and rural sanitation, in Ince, M. (ed) Water
and Sanitation in Africa, 11th
Water and Engineering for Developing Countries (WEDC)
Conference, Dar es Salaam, Tanzania.

146
Birdsall, N., & Nellis, J. (2003). Winners and losers: Assessing the distributional impact of
privatization. World Development, 31(10), 1617-1633.
Bohm, R., Essenburg, T., & Fox, W. (1993). Sustainability of potable water services in the
Philippines. Water Resources Research, 29(7), 1955-1963.
Botes, L., & van Rensburg, D. (2000). Community participation in development: Nine plagues
and twelve commandments. Community Development Journal, 35(1), 41-58.
Bowen, G. A. (2008). An analysis of citizen participation in anti-poverty programmes.
Community Development Journal, 43(1) 65 – 78.
Braadbaart, O. (2002). Private versus public provision of water services: does ownership matter
for utility efficiency? Journal of Water Supply Research and Technology-Aqua, 51(7),
375-388.
Brager, S., & Torczyner (1987). Community Organizing. Columbia University Press.
Brannen, J. (1992). Mixing Methods: Qualitative and quantitative research. Aldershot England:
Ashgate Publishing Limited.
Bridgen, P. (2004). Evaluating the empowering potential of community-based health schemes:
the case of community health policies in the UK since 1997. Community Development
Journal, 39(3), 289 -302.
Briscoe, J. (2005). India’s Water Economy: Bracing up for a turbulent future, keynote address at
the 4th
annual partners meet of IWMI-Tata water policy research program. Institute of
Rural Management Anand, 26-29.
Briscoe, J., & de Ferranti. (1988). Water for rural communities: Helping people help themselves.
World Bank: Washington DC.

147
Briscoe, J. Chakraborty, M., & Ahmed, S. (1981). How Bengali villagers choose sources of
domestic water. Water Supply and Management, 5(2), 165-181.
Brooks, D. B. (2002). Water: Local-level Management (Ottawa: International Development
Research Centre), aussi disponible en francais comme L’ eau: gerer localement
Brooks, D. B. (2006). An operational definition of water demand management. International
Journal of Water Resource Development 22(4), 521-528.
Bryman, A. (1988). Quantity and quality in social research. London: Unwin Hyman.
Budds, J., & McGranahan, G. (2003). Are the debates on water privatization missing the point?
Experiences from Africa, Asia and Latin America. Environment and urbanization, 15(2),
87 – 114.
Burkey, S. (1993). People first: a guide of self-reliant participatory rural development. Zed
Books Ltd.
Byliss, K., & Fine, B. (2007). Privatization and alternative public sector reform in sub-saharan
Africa: Delivery on electricity and water. London: Palgrave MacMillan.
Cabrera, A.F. (1994). Logistic regression analysis in higher education: An applied perspective.
Higher Education: Handbook of Theory and Research, Vol 10, 225-256.
Calderon, C., & Serven, L. (2004). The effects of infrastructure development on growth and
income distribution. Policy Research Working Paper 3400. World Bank, Washington,
D.C.
Campbell, D. T., & Fiske, D. W. (1959). Convergent and discriminant validation by the
multitrait-multimethod matrix. Psychological Bulletin, 56(2), 81-105.

148
Caracelli, V. J., & Green, J. C. (1997). Crafting mixed method evaluation designs. In J.C. Greene
& V.J. Caracelli (Eds.) Advances in mixed methods evaluation: The challenge and
benefits of integrating diverse paradigms (New Directions for Evaluation No. 74 pp. 19-
32). San Francisco, CA: Jossey-Bass.
Carter, R. C., Sean F. Tyrrel., & Howsam, P. (1999). The impact and sustainability of
community water supply and sanitation programs in developing countries. Water and
Environmental Management Journal, 13(4), 292-296.
Chambers, R. (1983). Rural development: Putting the last first. London: Routledge.
Chambers, R. (1994). Participatory rural appraisal (PRA): Challenges, potentials and paradigm.
World Development, 22(10), 1437-1454.
Chambers, R. (1997). Whose reality counts? Putting the first last. Intermediate Technology
Publication Ltd.
Chattopadhyay, R. & Duflo, E. (2004). Women as policy makers: Evidence from a randomized
policy experiment in India. Econometrica, 72(5), 1409-1443.
Chitonge, H. (2014) Cities beyond networks: The status of water services for the urban poor in
African cities. African Studies, 73 (1), 58 – 83.
Clasen, T., Cairncross, S., Haller, L., Bartram, J., & Walker, D. (2007). Cost-effectiveness of
water quality interventions for preventing diarrhoeal disease in developing countries.
Journal of Water and Health, 5(4), 599 - 608.
Clasen, T., & Bastable, A. (2003). Feacal contamination of drinking water during collection and
household storage: the need to extend protection to the point of use. Journal of Water
Health, 1, 109 -115.
149
Clarke, G., Kosec, K., & Wallsten, S. (2004). Has private participation in water and sanitation
improved coverage? Empirical evidence from Latin America. Policy Research Working
Paper 3445, World Bank, Washington, DC.
Clarke, R. G., & Wallsten, S. J. (2002). Universal(ly Bad) Service: Providing Infrastructure
Service to Rural and Poor Urban Consumers (Vol. 2868). World Bank, Development
Research Group, Regulation and Competition Policy.
Cleaver, F. (1996). Community management of rural water supplies in Zimbabwe, unpublished
PhD Thesis, University of East Anglia, Norwich.
Cohen J. M., & Uphoff, N. (1977). Rural development participation. Cornell University.
Cole, G. (1921). The future of local government. London. Cassell and Company Ltd.
Conroy, R. (2006). Contamination of drinking water between source and point-of-use in rural
households of South Africa and Zimbabwe: Implications for monitoring the Millennium
Development Goal for water. Water Practice & Technology, 1(2).
Cornwall, A. (2008). Unpacking participation; models, meaning and practices. Community
Development Journal, 43(3), 269 – 283.
Cox, D. R., & Snell, E. J. (1989). The analysis of binary data (2nd
ed.). London: Chapman and
Hall.
Crawford, L. (2005). Senior management perceptions of project management competence.
International Journal of project management, 23(1), 7-16.
Creswell, J. W., Plano C.V., Guttmann, M. L., & Hanson, E.E. (2003). Advanced mixed methods
research design. In A. Tashakkori and C. Teddlie (Eds.), Handbook of mixed methods in
social and behavioral research. Thousand Oaks, CA: Sage.

150
Crigg, N. S. (1996). Water resources management, principles, regulation and cases. New York:
McGraw-Hill.
Crook, R., & Manor, J. (1998). Democracy and decentralization in South Asia and West Africa.
Cambridge UK: Cambridge University Press.
Cross, P., & Morel, A. (2005). Prop-poor strategies for urban water supply and sanitation service
delivery in Africa. Water Science & Technology, 51(8), 51- 57.
Crouch, B., & Chamala, S. (1979). Agricultural extension and education. United Kingdom: John
Wiley.
Das, P. (2009). Promise or compromise? Community managed water supply for the urban poor
in Madhya Pradesh, India, Unpublished PhD dissertation at the University of California,
Los Angeles.
Davis, J. (2005). Private-sector participation in the water and sanitation sector. Annu. Rev.
Environ. Resour. 30, 145-183.
Dayal, R., van Wijk, C., & Mukherjee, N. (2000). Methodology for participatory assessments –
Linking sustainability with demand, gender and poverty. Water and Sanitation Program,
World Bank, IRC, Washington.
Denzin, N. (1978). The research act: A theoretical introduction to sociological methods. New
York, NY: Praeger.
Denzin, N., & Lincoln, Y.S. (Eds.) (2005). The sage handbook of qualitative research. Thousand
Oaks, CA: Sage.
Deverill, P. (2001). Sharing it our – introducing water demand strategies for small towns
(London and Loughborough, UK: Water and Environmental Health).

151
DFID, (2000). Strategies for achieving the International Development Targets: Addressing the
Water Crisis – Healthier and more productive lives for the people.
Ditcher, T.W. (1992). Demystifying popular participation (Institutional Mechanics for popular
participation). Paper presented at the workshop on participatory development,
Washington, DC 26-27 February.
Doe, R.S, & Khan, S.M. (2004). The boundaries and limits of community management: Lessons
from the water sector in Ghana. Community Development Journal, 39(4), 360 – 371.
Drucker, P. F. (1998). Peter Drucker on the profession of management. Harvard Business Press.
Dukeshire, S., & Thurlow, J (2002). Challenges and Barriers to community participation in
policy development. Rural Communities Impacting Policy Project.
Egunjobi, L., & Maro, P. (1985). Community self-help in the provision of drinking water in Ince,
M. (ed) Water and Sanitation in Africa, 11th
Water and Engineering for Developing
Countries (WEDC) Conference, Dar es Salaam, Tanzania, pp.44-47.
Elliot, C. (1976). Patterns of poverty in the Third World. London: Praeger.
Engel, S., Iskandarani, M., & del Pilar Useche, M. (2005). Improved water supply in the Engel
Ghanaian Volta Basin: who uses it and who participates in community decision making,
Intl Food Policy Re Inst.
Esman, M. J., & Uphoff, N. (1984). Local Organization: Intermediaries in Rural Development.
London: Cornell University Press.
Estache, A., & Kouassi, E. (2002). Sector organization, governance and the inefficiency of
African water utilities. (Vol. 2890) Governance, Regulation, and Finance Division,
World Bank Institute.

152
Estache, A., & Rossi, M (1999). Comparing the performance of public and private water
companies in the Asia and Pacific region: What a stochastic cost frontier shows, (Vol.
2152). World Bank Publications.
Estache, A., & Rossi, M.A. (2002). How different is the efficiency of public and private water
companies in Asia? The World Bank Economic Review 16(1), 139 -149.
Fals-Borda, O. (1988). Knowledge and people power. New Dehli: Indian Social Institute.
Finsterbusch, K., & Van W. (1987). The contribution of beneficiary participation to development
project effectiveness. Public Administration and Development, 7(1), 1-23.
Finsterbusch, K., & Van W. (1989). Beneficiary Participation in Development Projects:
Empirical Test of Popular Theories. Economic Development and Cultural Change 37(3),
573-593.
FAO, (1987). The impact of development strategies on the rural poor, Rome.
Fonjong, L., Emmanuel, N., & Fonchingong, C. (2005). Rethinking the contribution of
indigenous management in small-scale water provision among selected rural
communities in Cameroon. Environment, Development and Sustainability, 6(4), 429 –
451.
Franceys, R. (2008). Water and Sanitation for the urban poor. In Franceys, R. & Gerlach, E.
(Eds.), Regulating Water and Sanitation for the poor. London: Earthscan.
Fuest, V. (2005). Demand-oriented community water supply in Ghana: Policies, Practices and
outcomes (Vol. 2): LIT Verlag Munster.
Fuglesang, A., & Chandler, D. (1986). Participation as process: What we can learn from
Grameen bank, Bangladesh. Olso: NORAD.
153
Galjart. B., & Buijs, D. (eds) (1982). Participation of the poor in development. Leiden:
University of Leiden, Institute of Cultural and Social studies.
Galjart. B. (1981). Participatory development projects: Some conclusions from research,
Sociologia Ruralis (Assen, Netherlands), 21(2), 142-159.
Gamble, D. N., & Weil, M.O. (1995). Citizen participation, In R.I Edwards (Ed.). Encyclopedia
of social work (19th
ed.), pp. 483-494, Washington, DC: NASWP Press.
Gandhi, M. K. (1962). Village Swaraj. Ahmedabad India: Navajivan Publishing House.
Gary, I. (1996). Confrontation, co-operation or co-optation: NGOs and the Ghanaian state during
structural adjustment. Review of African Political Economy, 23(68), 149 – 168.
Gaynor, N. (2013). The tyranny of participation revisited: international support to local
governance in Burundi. Community Development Journal, May 31.
Ghai, D., & Vivian, J. (2014). Grassroots environmental action: people’s participation in
sustainable development. London: Routledge.
Gleick, P. (2000). A look at twenty-first century water resources development. Water
International, 25(1), 127-138.
Gleick, P. (2003). Global freshwater resources: soft-path solutions for the 21st century. Science,
302(5650), 1524-1528.
Gleick, P. (2014). The World’s water volume 8. The Biennial report on freshwater resources
(Vol 8). Island Press.
Gleick, P., Cooley, H., Katz, D., & Lee, E. (2006). The world’s water 2006 – 2007: The biennial
report on freshwater resources. Washington, DC: Island Press.
Gran, G. (1985). Development by people. New York: Praeger.
Green,J. (2007). Mixed Methods in Social Inquiry. San Francisco: Jossey Bass.

154
Greene, J., Caracelli, V., & Graham, W. (1989). Toward a conceptual framework for mixed-
method evaluation designs. Educational Evaluation and Policy Analysis, 11(3), 255 -
274.
Guyani, S., Talukdar, D., Jack, D., (2010). Poverty, Living Conditions, and Infrastructure
Access. The World Bank, Africa Region.
Hammersley, M., & Atkinson, P. (1995). Ethnography: Principles in Practice, 2nd
edition,
London: Routledge.
Hanson, B. (2008). Wither qualitative/quantitative? Grounds for methodological convergence.
Quality and Quantity, 42(1), 97 - 111.
Hardoy, J., Mitlin, D., & Satterthwaite, D. (2014). Environmental problems in an urbanizing
world: finding solutions in cities in Africa, Asia and Latin America. London: Routledge.
Hardoy, J., & Ruete, R. (2013). Incorporating climate change adaptation into planning for a
liveable city in Rosario, Argentina. Environment and urbanization, 25(2), 339 – 360.
Harvey, P., & Reed, R. (2007). Community-managed water supplies in Africa: Sustainable or
dispensable? Community Development Journal, 42(3), 365 - 378.
Hickey. S., & Mohan, G. (2004). Towards participation as transformation: Critical themes and
challenges, in S. Hickey and G. Mohan, eds Participation: From Tyranny to
Transformation. London and New York: Zed Books.
Hofmann, P., Strobl, J., Blaschke, T., & Kux, H. (2008). Detecting informal settlements from
Quickbird data in Rio de Janeiro using an object based approach. In Object-based image
analysis (pp. 531-553). Springer Berlin Heidelberg.

155
Hopewell, M., & Graham, J. (2014). Trends in access to water supply and sanitation in 31 major
sub-Saharan African cities: an analysis of DHS data from 2000 to 2012. BMC public
health, 14(1), 2008.
Hosmer Jr, D. W., & Lemeshow, S. (2004). Applied logistic regression. John Wiley & Sons.
Huchzermeyer, M., & Karan, A. (2006). Informal settlements, a perpetual challenge? Juta and
Company Ltd.
Huchzermeyer, M. (2004). Unlawful occupation: Informal settlements and urban policy in South
Africa and Brazil. Africa World Press.
Hukka, J., & Katko, I. (2003). Refuting the paradigm of water services privatization. Natural
Resource Forum, 27(2), 142 – 155.
Hung, M. F., & Chie, B. T. (2013). Residential water use: efficiency, affordability, and price
elasticity. Water Resources Management, 27(1), 275-291.
Hutton, G., Haller, L., & Bartram, J. (2007). Global cost benefit analysis of water supply and
sanitation interventions. Journal of Water Health 5, 481-502.
Ika, L. A. (2009). Project success as a topic in project management journals. Project
Management Journal, 40(4), 6 - 19.
Ioris, A. R. (2007). The troubled Water of Brazil: Nature commodification and social exclusion.
Capitalism and Nature Socialism, 18(1), 28 – 50.
IRC, (1999). Integrated Water Resource Management in Water and Sanitation Projects, Lessons
from Projects in Africa, Asia and South America, IRC International Water and Sanitation
Centre, Deft, The Netherlands.
Isham, J., & Kahkonen, S. (2001). Institutional determinants of the impact of community-based
water services: Evidence from Sri Lanka and India.

156
Isham, J., & Kahkonen, S. (2002). How do participation and social capital affect community-
based water projects? Evidence from Central Java, Indonesia. The role of social capital in
development: An empirical assessment 155-87.
Isham, J., Narayan, D., & Pritchett, L. (1995). Does participation improve project performance?
Establishing causality with subjective Data. The World Bank Economic Review, 9(2),
175-200.
Janesick, V. J. (2000). The choreography of qualitative research design: Minutes, improvisations,
and crystallization. In N.K. Denzin & Y.S. Lincoln, (Eds.) Handbook of qualitative
research (2nd
ed.). Thousand Oaks.
Jean-Jacques, Rousseau (1762). Du contrat social ou principes du droit politiqu. France.
Johnson, J., Gismondi, M., & Goodman, J. (2006). Nature’s Revenge: Reclaiming Sustainability
in an age of corporate globalization. Broadview Press.
Johnson, R., & Onwuegbuzie, A. (2004). Mixed Methods Research, A research Paradigm whose
times has come. Educational Researcher, 33(7), 14-26.
Johnson, R., & Christensen, L. (2004). Educational research: Quantitative, qualitative and
mixed methods approaches. Boston: Allyn and Bacon.
Kabila, R. (2002). Participation evaluation of community based water and sanitation programs;
The case of central Tanzania, unpublished PhD Thesis, Kansas State University,
Manhattan Kansas.
Kerf, M., & Smith, W. (1996). Privatizing Africa’s infrastructure: Promise and challenge (Vol.
337). World Bank Publications.
Khan, S., & Anjum, G.A. (2013). Role of citizen community boards in promoting participatory
development in Muzaffargah District Pakistan. Pak J. Engg. & Appl. Sci, 12, 43 – 59.

157
Khawja, A. I. (2002). Can good projects succeed in bad communities? Collective action in
public good provision. Harvard University Press.
Kirkpatrick C., Parker, D., &Ying-Fang Zhang (2004). State versus private sector provision of
water services in Africa, A statistical, DEA and Stochastic cost frontier analysis. The
World Bank Economic Review, 20(1), 143 -160.
Kisumu City Development Strategies (2009). Lake Victoria Region City Development Strategies
for Improved Urban Environment and Poverty Reduction, Prepared by Kisumu City
Council and Center for Development & Planning Management [online -
http://www.unhabitat.org/downloads/docs/3589_41974_kisumu_cds.pdf - accessed 8
May 2013).
Kjellen, M. (2000). Contemporary water systems in Dar es Salaam, Tanzania: the case of water
vending. International Journal of Water Resources Development 16(1), 14 -154
Kjellen, M., & McGranaham, G. (2006). Informal water vendors and the urban poor. London,
UK: International Institute for Environment and Development.
Kleemeier, E. (1995). From supply driven to demand driven provision of rural drinking water. A
Tanzanian Case Study of the Arguments for a Transition. Center for Udviklingsforkning.
Kleemeier, E. (1998). The operation and maintenance of small rural piped gravity schemes in
Malawi. Center for Development Research, Copenhagen.
Kleemeier, E. (2000). The impact of participation on sustainability: An analysis of the Malawi
Rural Piped Scheme Program. World Development, 28(5), 929 - 944.
Korten, F.F. (1981). Community participation: A management Perspective on obstacles and
options in David C. Korten and Felipe B. Alfonso (eds) Bureaucracy and the Poor:
Closing the Gap: Singapore: McGraw-Hill.

158
Kok, P., & Gelderblom, D. (1994). Urbanization South Africa’s Challenge, volume 11 planning,
Human Science Research Council, Pretoria, South Africa.
Koundouri, P. (2004). Current issues in the economics of groundwater resource management.
Journal of Economic Surveys, 18(5), 703 – 740.
Krueger, R., & Casey, M. (2000). Focus groups: A practical guide for applied researchers (3rd
ed.). Thousand Oaks, CA: Sage.
Lane, J. (2006). Improving water and sanitation services in rural areas: Lessons learned from
Ghana, Lesotho and South Africa. In L. Fox & R. Liebenthal (Eds.), Attacking Africa’s
Poverty: Experience from the Ground (pp.257-284). Washington: The World Bank.
Larson, A. M., & Ribot, J.C. (2004) Democratic decentralization through a natural resource lens:
An introduction. European Journal of Development Research, 16(1), 1-25.
Laxer, G., & Soron, D. (2006). Not for sale: Decommodifying Public life. University of Toronto
Press.
Laws of Kenya, (2010). The constitution of Kenya, Published by the National Council for Law
Reporting with the Authority of the Attorney General. [Online
https://www.kenyaembassy.com/pdfs/The%20Constitution%20of%20Kenya.pdf]
Leech, N. L., & Onwuegbuzie, A. J. (2009). A typology of mixed methods research designs.
Quality & Quantity, 43(2), 265-275.
Lincoln, Y. S., & Guba, E. G. (1985). Naturalistic inquiry. Beverly Hills, CA: Sage.
Lindskog, R. U., & Lindskog, P. A. (1988). Bacteriological contamination of water in rural
areas: an intervention study from Malawi. The Journal of Tropical medicine and hygiene,
91(1), 1 -7.

159
Lieberson, S. (1985). Making it count. The improvement of social research theory. Berkeley:
University of California Press.
Lieberson, S. (1992). Einstein, Renoir and Greeley: Some thoughts about evidence in sociology.
American Sociological Review, 57(1) 1-15.
Lockwood, H. (2003). Post-project sustainability: Follow-up support to communities. Daft,
World Bank, Washington DC.
Maine, H. (1876). Village communities in the East and West. London: John Murray.
Manikutty, S. (1995a). Community participation in water and sanitation projects: Kerala Case
Study. Available from UNDP/World Bank Regional Water and Sanitation Group, New
Delhi.
Manikutty, S. (1995b). Community participation in Water and Sanitation Projects: Karnataka
case study. Available from UNDP/World Bank Regional water and sanitation group,
New Delhi.
Manikutty, S. (1997). Community participation: So what? Evidence from a comparative study of
two rural water supply and sanitation projects in India. Word Development Policy review,
15(2), 115-140.
Manikutty, S., Mavalankar, D., & Bhatt, A. (1996). Community participation in rural drinking
water and sanitation projects: A comparative study of five projects in India. New Delhi:
UNDP/World Bank Regional Water and Sanitation Group.
Mansuri, G., & Rao, V. (2004). Community-Based and Driven Development: A critical Review.
World Bank Research Observer, 19(1), 1 – 39.
Mansuri, G., & Rao, V. (2013). Localizing Development – Does Participation Work? World
Bank Publications.

160
Maoulidi, M. (2011). Health needs assessment for Kisumu, Kenya MCI Social Sector Working
Paper Series No 19/2011.
Maoulidi, M. (2012). Kisumu Millennium Development Goals multi-sector household survey.
Mathbor, G. (2008). Effective community participation in coastal development. Lyceum Books.
Maxwell, J. A. (1992) Understanding and validity in qualitative research. Harvard Educational
Review, 62, 279-299.
McCommon, C., Warner, D., & Yohalem, D. (1990). Community Management of rural water
supply and sanitation services. In Community management of rural water supply and
sanitation services.
McDonald, D., & Ruiters, G. (2005). The age of commodity: Privatizing water in Southern
Africa. London: Earthscan.
McGranahan, G., & Mulenga, M. (2009). Community Organization and alternative paradigms
for improving water and sanitation in deprived settlements. Water and Sanitation
Services: Public Policy and Management 173.
McIntosh A., & Yniguez C. (1997). Second Water utilities data book Asian and pacific region.
Asian Development Bank.
Merriam, S. (1998). Qualitative research and case study application in education (2nd
Ed.). San
Francisco: Jossey-Bass.
Miles, M. B., & Huberman, A. M. (1994). Qualitative Data Analysis: An Expanded Sourcebook,
London: Sage
Mill, J. S. (1859). On liberty. London: John W. Parker and Son.
Mill, J. S. (1879). Chapters on Socialism. Forthrightly Review 25(February): 217-37; March:
373-82; April: 513-30.
161
Mishra. A. D. (2002). Rediscovering Gandhi. New Delhi: A Mittal Publication.
Mitchell, B. (2005). Integrated water resource management, institutional arrangements, and land-
use planning. Environment and Planning, 37(8), 1335 – 1352.
Mohammadi, H. (2010). Citizen participation in urban planning and management. The case of
Iran, Shiraz city, Saadi community, Kassel.
Morgan, D. L. (1998). Practical strategies for combining qualitative and quantitative methods:
Application to health research. Qualitative Health Research, 8(3), 362-376.
Morgan, D. L. (2007). Paradigms lost and pragmatism regained. Methodological implications of
combining qualitative methods. Journal of Mixed Methods Research, 1(1), 48 – 76.
Morrissey, J. (2000). Indicators of citizen participation: Lessons from learning teams in rural
EZ/EC communities. Oxford University Press and Community Development Journal,
35(1), 59 – 74.
Mosse, D. (2002). “People’s Knowledge, Participation and Patronage: Operations and
Representations in Rural Development.” In Empowerment and Poverty Reduction: A
sourcebook, ed D. Narayan, Washington DC: World bank.
Myers, G.A. (2003). Verandas of Power: Colonialism and Space in Urban Africa. Syracuse, NY:
Syracuse University Press.
Naegele, J. (2004). What is wrong with full-fledged water privatization? Journal of Law &
Social Challenges, 6, 99 – 130.
Nagle, J. W. (1992). Policy and practice of community participation in the U.S. Agency for
International Development. Harvard Institute for International Development.
Naiga, R., Penker, M., & Hogl, K. (2012). From supply to demand driven water governance:
challenging pathways to Safe Water Access in Rural Uganda.

162
Nance, E., & Ortolano, L. (2007). Community Participation in Urban Sanitation Experiences in
Northeastern Brazil. Journal of Planning Education and Research, 26(3), 284 – 300.
Narayan, D. (1995).The contribution of people’s participation: evidence from 121 rural water
supply projects. In Environmentally Sustainable Development Occasional Paper Series
No. 1. The World Bank.
Narayan-Parker, D. (1988). People, pumps and agencies: the South Coast Handpump Project.
PROWESS/UNDP, United Nations Development Programme. New York.
Ngnikam, E. (2008). Water supply in Cameroon: Case study of Limbe Town. Power-point slides
presented at the conference on Water and Urban Services in Africa held in Barcelona, 20-
22 November 2008.
Nicole, A. (2000). Adopting a sustainable livelihoods to water projects: Implications for policy
and practice. OD1 Working paper 133, Overseas Development Institute, London UK.
Njoh, A. J. (2003). Self-help water supply in Cameroon- Lessons on community participation in
public works projects. The Edwin Mellen Press.
Njoh, A. J. (2002). Barriers to community participation in development planning; Lessons from
Mutengene (Cameroon) self-help water project. Community Development Journal, 37(3),
233 – 248.
Njoh, A. J. (2003). Planning in contemporary Africa: The state, Town Planning and Society in
Cameroon. Aldeshot: Ashgate.
Njoh, A. J. (2006). Determinants of success in community self-help projects: the case of the
Kumbo water supply scheme in Cameroon. International Development Planning Review,
28(3), 381 – 406.

163
Njon, A. J. (2010) Municipal councils, International NGOs and citizen participation in public
infrastructure development in rural settlements in Cameroon. Habitat International 36(1),
101-110.
Norton, M. R. (2014). Water security: pipe dream or reality? A global perspective from the UK.
Wiley Interdisciplinary Reviews: Water, 1(1), 11-18.
Nyerere, J. K. (1967). The Arusha Declaration, in Nyerere (1968) 231-250.
Nyerere, J. K. (1968). Freedom and socialism: A selection from Writings and Speeches. 1965-
1967. Oxford: Oxford University Press.
Oakley, P., & Marsden, D. (1984). Approaches to participation in rural development,
International labor Office, Geneva.
Oakley, P. (1991). Projects with people: The practice of participation in rural development,
International Labor Office, Geneva.
Olmstead, S. M., & Stavins, R. N. (2007). Managing Water Demand: Price vs. Non-Price
Conservation Programs. A pioneer institute white paper, (39).
Onwuegbuzie, A. J., & Johnson, R. B. (2004). Mixed method and mixed model research. In R.B
Johnson & L.B. Christensen, Educational research: Quantitative, qualitative and mixed
approaches (pp. 408-431). Needham Heights, MA: Allyn & Bacon.
Onwuegbuzie, A. J., & Collins, K. M. (2007). A typology of mixed methods sampling designs in
social science research. Qualitative Report, 12(2), 281 – 316.
Onwuegbuzie, A. J., Jiao, Q. G., & Bostick, S. L. (2004). Library anxiety: Theory, research and
application. Lanham, MD: Scarecrow.

164
Onwuegbuzie, A. J., & Teddlie, C. (2003). A framework for analyzing data in mixed methods
research. In A. Tashakkori & C. Teddlie (Eds.), Handbook of mixed methods in social
and behavioral research (pp. 351-383). Thousand Oaks, CA: Sage.
Owuor, S. 0., & Foeken, D. (2012). from self- help group to water company: The Wandiege
Community Water Supply Project (Kisumu, Kenya) Transforming innovations in Africa:
Explorative studies on appropriation in African societies, 127-147.
Pahl-Wostl, C. (2007). Transitions towards adaptive management of water facing climate and
global change. Water Resources Management, 21(1), 49 – 62.
Panayotou, T. (1997).The role of the private sector in sustainable infrastructure development. In
Bridges to Sustainability: pp. 46-68. New Haven, CT: Yale School for Environmental
studies.
Parfitt, T., (2004). The ambiguity of participation: a qualified defense of participatory
development. Third World Quarterly, 25(3), 537-555.
Pateman, C. (1976). Participation and democratic theory. Cambridge, UK. Cambridge
University Press.
Patton, M. Q. (1990). Qualitative research and evaluation methods (2nd ed.) Newbury Park, CA:
Sage.
Patton, M. Q. (2002). Qualitative Research and Evaluation Methods, 3rd
edition, Thousand
Oaks, CA: Sage.
Paul, S. (1987). Community participation in development projects: the World Bank experience.
The World Bank Discussion Papers, No.6. The World Bank, Washington DC.
Pearse, A., & Stiefel, M. (1979). Inquiry into participation, Geneva UNRISD.
Peet, J. (2003). Priceless: a survey of water. The Economist, 3-5.

165
Perry, G. K. (2009). Exploring occupational stereotyping in the new economy. The intersectional
tradition meets mixed methods research. In M.T. Berger and K. Guidroz (Eds.), The
Intersectional Approach: Transforming the Academy through Race, Class and Gender.
Petrova, V. (2006). Note. At the frontiers of the rush for blue gold: Water privatization and the
human right to water. Brooklyn Journal of International law, 31, 577 – 613.
Platteau, J. P. (2004). Monitoring elite capture in Community-Driven development. Development
and Change, 35(2), 223 – 246.
Platteau, J. P., & Abraham, A. (2002). Participatory development in the presence of endogenous
community imperfections. Journal of Development Studies, 39(2), 104 – 136.
Pohlman, J. T., & Leitner, D. W. (2003). A comparison of ordinary least squares and logistic
regression. Ohio Journal of Science 103(5), 118 – 125.
Postel, S. (1997). Last Oasis, facing water scarcity. New York: Norton and Company.
Prasad, N. (2006). Privatization results: Private sector participation in water services after 15
years. Development Policy Review, 24(6), 669-692.
Prasad, N. (2007). Privatization of Water: A historical perspective. Law, Environment and
Development Journal 3, 217 [online http://www.lead-journal.org/content/07217.pdf -
accessed 1/2/2014].
Prokopy, L. S. (2004). Women participation in rural water supply projects in India: is it moving
beyond tokenism and does it matter? Water Policy, 6(2), 103 - 116.
Prokopy, L. S. (2002). The relationship between participation and project outcomes: A study of
rural drinking water projects in India. Department of City and Regional Planning, UNC
Chapel Hill.
166
Prokopy, L. S. (2005).The relationship between participation and project outcomes: Evidence
from rural water supply projects in India. World Development, 33(11), 1801-1819.
Prokopy, L. S. (2009). Determinants and benefits of household level participation in rural
drinking water projects in India. The Journal of Development Studies, 45(4), 471-495.
Prokopy, L. S., & Thorsten, R. (2005). An evaluation of rural drinking water projects in Cuzco,
Peru: The role of Post Construction Support. Report to the World Bank.
Pruss-Ustun, A.,Bos, R., Gore, F., & Bartram, J. (2008). Safer water, better health; cost, benefits
and sustainability of interventions to protect and promote health. Geneva: World Health
Organization.
Rahman,M. A. (1985). Participation of the rural poor in development. Geneva, ILO
Mimeographed.
Rahman,M. A. (1987). Theoretical and methodological questions in the promotion of people’s
participation in rural development. Geneva, ILO. Mimeographed .
Ritchie, J., & Lewis, J. (2003). Qualitative Research Practice, A Guide for Social Science
Students and Researchers. London: Sage Publication.
Robson, C. (2002). Real World Research, second ed. Blackwell, Oxford.
Rogers, P., Silva, R. D., & Bhatia, R. (2002). Water is an economic good: How to use prices to
promote equity, efficiency, and sustainability. Water policy, 4(1), 1-17.
Rogers, P., & Hall, A. W. (2003). Effective water governance. Stockholm: Global Water
Partnership.
Roling, N. (1987). “Extension and the development of human resources: The other tradition in
extension education” in G.E. Jones (ed): Investing in rural extension: Strategies and
goals. New York and London, Elsevier.

167
Rondinelli, D. A. (1991). Decentralizing water supply services in developing countries: factors
affecting the success of community management. Public administration and
development, 11(5), 415 - 430.
Roy, B. (2002). Villagers dump role in water supply. The Times of India, (September, 2 2002).
Russ, L. W., & Takahashi, L. M. (2013). Exploring the Influence of Participation on Programme
Satisfaction: Lessons from the Ahmedabad Slum Networking Project. Urban Studies,
50(4), 691-708.
Ryan, B., Scapens, R.W., & Theobald, M. (2002) Research Method & Methodological in
Finance & Accounting, 2nd edition. Thomson, London.
SANA. (2014). End year Report 2014, Water Development Area, Kisumu City, Submitted by
Francis Ndiso, Kisumu City.
Sara, J., & Davis, J. (2012). Does user participation leads to sense of ownership for rural water
systems? Evidence from Kenya. World Development, 40 (8), 1569 – 1576.
Sara, J., & Katz, T. (1998). Making rural water supply sustainable: Report on the impact of
project rules. Washington DC. The World Bank.
Satterthwaite, D. (2014). Urbanization in low-and-middle-income nations in Africa, Asia and
Latin America. The companion to development studies, 279.
Savedoff W. D., & Spiller, P. T. (1999). Spilled water: Institutional Commitment in the
provision of water services. Washington, DC: Inter-Am. Dev. Bank .
Savenije, H. H. G., & van der Zaag, P. (2002). Water as an economic good and demand
management: paradigms and pitfalls, Water International, 27(1), 98-104
Scanlon, J., Cassar, A., & Nemes, N. (2004). Water as a human right, IUCN, Gland, Switzerland
and Cambridge, UK.

168
Schouten, T, & Moriarty, P. (2003). Community water, community management: From system to
service in rural areas. London. International Technology Development Group.
Secor, A. (2010). Social Surveys, Interviews and Focus Groups. In Research Methods in
Geography by B. Gomez and J. Jones 111, 194-206. Oxford: Blackwell.
Shenhar, A. J., & Wideman, R. M. (1996, May). Improving PM: Linking success criteria to
project type. In Project Management Institute Symposium: Creating Canadian Advantage
through Project Management, Calgary.
Shirley, M. (2002). Thirsting for efficiency: The economics and politics of urban water system
reform. London: Elsevier.
Shirley, M., & Menard, C. (2002). Cities Awash: Reforming Urban Water Systems in
Developing Countries. In M. Shirley, ed., Thirsting for efficiency: the Economics and
Politics or Urban Water System Reform. Elsevier Press.
Sikes, P. (2000). Truth and Lies Revisited. British Educational Research Journal, 26(2), 257-
270.
Smith, J. (1991). A methodology for twenty-first century sociology. Social forces, 70(1) 1-17.
Smith, K. (1994). Community management in rural water supply in Indonesia: Some lessons
from Indonesia. World Bank Workshop on Participatory Development, Washington D.C.
Social Policy and Development Center, (1996). NGO Capability and Community Participation in
the Rural Water Supply Sector in Pakistan, December 1996, Karachi.
Solomon, S. (2010). Water, the epic struggle for wealth, power and civilization. Harper Collins
Publishers.
Stigler, P. E. (2013). Water, culture and environmental health: Understanding community based
planning to improve health outcomes in vulnerable populations (Order No. 3609393).

169
Stiefel, M., & Wolfe, M., (1994). A voice for the excluded. Popular participation in
development: Utopia or necessity. Zed Books.
Stoker, G. (1997). Local Political Participation in Hambleton, R et al New Perspectives on local
governance: reviewing the research evidence, Joseph Rowntree Foundation pp 157-196.
Stottmann, W. (2000). The role of the private sector in the provision of water and wastewater
services in urban areas in Uitto, J. & Biswas, K. (eds) Water for urban areas: Challenges
and perspectives. Tokyo: United States University Press.
Swapan, M. H. (2014). Realities of community participation in metropolitan planning in
Bangladesh: A comparative study of citizens and planning practitioner’s perception.
Habitat International, 43(2014), 191-197.
Sydenstricker-Neto, J. M. (2004). Land-cover change and social organization in Brazilian
Amazonia. Unpublished doctoral dissertation, Department of Rural Sociology, Cornell
University, Ithaca, NY.
Tabachnick, B. G., & Fidell, L. S. (2001). Using multivariate statistics (4th
ed.). Needham
Heights, MA: Allyn & Bacon.
Tashakkori, A., & Teddlie, C. (1998). Mixed methodology: Combining qualitative and
quantitative approaches (Vol. 46). Sage.
Therkildsen, Ole. (1988). Water White Elephants? Lessons from Donor Funded Planning and
Implementation of Rural Water Supplies in Tanzania. Scandinavian Institute for African
Studies.
Thompson, T., Sobsey, M., & Bartram, J (2003). Providing clean water, keeping water clean: an
integrated approach, International Journal of Environmental Health research 13(S1) 89-
94.

170
Thorsten, R. (2007). Predicting sustainable performance and household satisfaction of
community-oriented rural water supply projects – A quantitative evaluation of evidence
from Ghana and Peru, PhD dissertation submitted at the University of North Carolina at
Chapel Hill.
Torres, C. (2012). Urban access to water supply and sanitation in Sub-Saharan Africa:
Background Report. Available online.
Trawick, P. (2003). Against the privatization of water: An indigenous model for improving
existing laws and successfully governing the commons. World Development 31(6), 977 -
996.
Uitto, J., & Biswas, A. (2000). Water for urban areas: Challenges and perspectives. United
Nations University Press.
UN DESA, (2004). OECD Global forum on sustainable development; financing water and
environmental infrastructure for all. Background paper 6. Available online.
UN Environmental Programme (2002). Global environmental outlook 3: Past, present and future
perspectives. New York: Earthprint.
UNCHS, (2006). Meeting development goals in small urban centers: Water and sanitation in the
world’s cities 2006. London: Earthscan.
UN-ESA, (2008). World urbanization prospects – the 2007 revision highlights. United Nations,
Department of Economic and Social Affairs, New York.
UN-Habitat Global report, (2012). State of Water and Saniation in the World cities – Looking
ahead to 2050 – Patel School of Global Sustainability and UN-Habitat.
UNICEF, (2010). Water, Sanitation and Hygiene.

171
Uphoff, N. T. (1996). Learning from Gal Oya: Possibilities for participatory development and
post-Newtonian social science. Ithaca: Cornell University Press.
Valinas, G. (2005). Efficiency and equity in natural resources pricing: a proposal for urban water
distribution service. Environmental & Resource Economics, 32(2), 183 - 204.
Van der Bruggen, B., Borghgraef, K., & Vinckier, C. (2010). Causes of Water Supply Problems
in Urbanized Regions in Developing Countries. Water Resources Management, 24(9),
1885 – 1902.
Verbeek, M. (2002). A Guide to Modern Econometrics, John Wiley & Sons, UK.
Water and Sanitation for Health Project, (1994). The sustainability of donor-assisted rural water
supply projects. WASH Technical Report. 94.
Westergaard, K. (1986). People participation, local government and rural development: The
case of West Bengal, India. CDR Research Report – Copenhagen Center for
Development Research.
Westerveld, E. (2003). The Project Excellence Model: Linking success criteria and critical
success factors. International Journal of Project Management, 21(6), 411 - 418.
White, G., Bradley, D., & White, A. (1972). Drawers of Water: Domestic Water Use in East
Africa, University of Chicago Press.
Whittington, D., Lauria, D. T., Okun, D. A., & Mu, X. (1989). Water vending activities in
developing countries: a case study of Ukunda, kenya. International Journal of water
Resources Development, 5(3), 158-168.
World Bank (1993) WATER Resources Management. A world Bank Policy Paper. The World
Bank, Washington, D.C.

172
World Bank (1996). The World Bank Participation Sourcebook, the International Bank for
reconstruction and development. Washington D.C.
World Bank (1998). Demand Responsive Approaches to community water supply; Moving from
policy to practice, East and Southern Africa World Bank.
World Bank (2004). Towards water secure Kenya: Water Resources Sector Memorandum,
Washington D.C.
World Bank (2006). Managing water resources to maximize sustainable growth: A country water
resources assistance strategy for Ethiopia, Washington D.C.
World Bank Water and Sanitation Program (2001). Multi-village Rural Water Supply Schemes:
An emerging Challenge .
World Health Organization (1994). Financial Management of Water Supply and Sanitation: A
Handbook.
World Health Organization/UNICEF (2008). Progress on drinking water and sanitation: special
focus on sanitation. New York: UNICEF, Geneva: WHO.
World Health Organization (1992). Our Planet, Our Health: Report of the WHO commission on
Health and Environment, Geneva, World Health Organization.
World Water Forum, (2000). Ministerial Declaration on The Hague on Water Security in the 21st
Century. http://www.worldwaterforum.coin/journalist/frameset.html.
Wraight, C. D. (2008). Rousseau’s The Social Contract: A reader’s Guide. London: Continuum
Books.
WRI (World Resources Institute) (2003). World Resources: 2002-2004. Washington, DC. World
Resources Institute.

173
Wright, A. M. (1997). Toward a strategic sanitation approach: Improving the sustainability of
urban sanitation in developing countries. UNDP/World Bank Water and Sanitation
Program, Washington D.C.
Wright, J., Gundry, S., & Conroy, R. (2004). Household drinking water in developing countries:
a systematic review of microbiological contamination between source and point‐of‐use.
Tropical Medicine & International Health, 9(1), 106-117.
Yacoob, M., & Walker, J (1991). Community management in water supply and sanitation
project: Cost and implication. Aqua: journal of the International Water Supply
Association, 40(1), 30 – 44.
Young, M. D., & MacDonald, D. H. (2003). An opportunity to improve water trading in the
south east catchment of South Australia. Water policy , 5(2), 127 – 146.

174
APPENDIX A:
IRB APPROVAL LETTER

175

176
APPENDIX B:
INFORMED CONSENT FORM TO PARTICIPATE IN HOUSEHOLD
QUESTIONNAIRE SURVEY
Please read this form carefully and ask any questions you may have before agreeing to take
part in this study.
Overall this study is interested in evaluating the role of community participation in water production and
management in urban informal settlement. It is part of a dissertation study for Erick Oniango Ananga who
is a PhD candidate at the University of South Florida, Tampa Florida United States. If you choose to take
part in this study, we will ask you a few questions about water and sanitation services in your community.
The total amount of time for you to take part in this study is approximately 30 minutes.
We do not know of any risks from taking part in this research. If we learn of any we will let you
know. We do not expect you to individually benefit from taking part in this research and your
participation in this study is completely voluntary. You may choose not to take part. If you decide to take
part now, you can change your mind at any time. You are free to stop taking part in this study at any time
for any reason without penalty. If you decide you do not want to stay in the study, all data related to your
participation will be destroyed.
In regards to confidentiality, your name will not appear in any report or publication of the
research. Your informed consent form will be safely stored in a locked facility and only the researchers
will have access to this information. There is no compensation for participating in this study. If you have
questions about the research in general or about your role in the study, please feel free to contact Erick
Oniango Ananga telephone number 254722805810 or email [email protected]. If you have any
questions about your rights as a participant in the study you can call Research Integrity and Compliance at
the University of South Florida at 813-974-5638. The USF ID number for this study is Pro00015949. By
signing this form you as a participant hereby do accept that you understand the nature of this project and
its risks and benefits and have had the opportunity to ask questions and to have your questions answered
to your satisfaction. You hereby freely give consent to take part in this research.
_______________________ _________________ _______________
Signature of Participant Name of Participant Date
_______________________ ____________________ _______________
Signature of Investigator Name of Investigator Date

177
APPENDIX C:
QUESTIONNAIRE SURVEY
THE ROLE OF COMMUNITY PARTICIPATION IN WATER PRODUCTION AND
MANAGEMENT: LESSONS FROM SUSTAINABLE AID IN AFRICA INTERNATIONAL
SPONSORED WATER SCHEMES IN KISUMU, KENYA
I am …………………………………………. collecting data on behalf of Erick Oniango Ananga who is
a PhD candidate at the University of South Florida, Tampa Florida, United States of America. Erick is
undertaking a research on the effectiveness of community participation theory in water production and
management. Specifically his proposed study will seek to analyze the relationship between community
participation and outcomes in the water domain in urban informal settlements in the city of Kisumu,
Kenya.
This questionnaire survey will help the study in understanding the context specific effects of
community participation in water production and management. Where you live fall within his study area
which is serviced by a community water service scheme supported by Sustainable Aid in Africa
International (SANA). We would therefore like to request to ask you a few questions about water and
sanitation services in your community. Your house has been selected randomly for this survey. The fact
that you have been chosen is thus quite coincidental. The information you give to us will be kept strictly
confidential and are basically for the study purpose only. Your personal details such as your name and
your address will not be shared by anyone else. The interview will take about 30 minutes of your time.
Date of Interview Day Month Year
Time interview
commenced
Interviewer ID
Time interview ended
Data entry ID

178
PART 1 – HOUSEHOLD DETAILS
Q1. Water scheme serving the respondent community
1. Wandiege Water and Sanitation Scheme
2. Obunga Water and Sanitation Scheme
3. Asengo Water and Sanitation Scheme
4. Paga Water and Sanitation Scheme
Q2. Gender of the respondent
1. Male
2. Female
Q3. Who is the head of this Household?
1. Husband
2. Wife
3. Female single headed
4. Male single headed
5. Child headed
Q4. How many people live in this house?
1. 1 person
2. 2 persons
3. 3 persons
4. 4 persons
5. 5 persons
6. 6 persons
7. 7 persons
8. More than 7 persons
Q5. How many are
(a) Male………………..
(b) Female……………...
Q6. How many of your household members belong to these age categories?
Age Brackets (Years) No
(a) Day 1 – 10
(b) 11 - 20
(c) 21 - 30

179
(d) 31 - 40
(e) 41 - 50
(f) Above 50
Q7. What is the respondent highest level of education?
1. No formal education
2. Primary level
3. Secondary level
4. Diploma level
5. University level
Q8. What is the respondent spouse highest level of education?
1. No formal education
2. Primary level
3. Secondary level
4. Diploma level
5. University level
6. Not applicable
Q9. How many years have you been living in this settlement
1. Less than one year
2. 2 – 5 years
3. 6 – 10 years
4. Above 10 years
Q10. What is the household main source of income?
1. Wage employment
2. Artisan/ Blacksmith
3. Salaried employment
4. Trading /small business
5. Other specify…………………………
Q11. What is the household monthly income?
1. Kshs. 5,000 and below
2. Kshs. 5,001 – 10,000
3. Kshs. 10,001 – 15,000
4. Kshs. 15,001 – 20,000
5. Kshs. 20,001 – 25,001
6. Kshs. Over 25,001
7. Don’t know

180
Q12. What is the household monthly expenditure?
1. Kshs. 5,000 and below
2. Kshs. 5,001 – 10,000
3. Kshs. 10,001 – 15,000
4. Kshs. 15,001 – 20,000
5. Kshs. 20,001 – 25,001
6. Kshs. Over 25,001
7. Don’t know
PART 11 – WATER SITUATION IN THE HOUSEHOLD
Please can you tell me the different sources and uses of water for your household, indicate how you
perceive its quality and how satisfied you are with the management committee of the water source you
often use.
Q13. What is your main source of water?
1. Community managed water kiosk
2. Piped individual community managed
3. Private vendor
4. Borehole
5. Rain Harvesting/roof catchment
6. Well
7. Spring
8. River
9. Lake
10. Other specify………….…………………
Q14. If your main source of water is community managed water kiosk or piped individual community
managed scheme then what was your main source of water prior to the implementation of the community
water scheme
1. Private vendor
2. Borehole
3. Rain Harvesting/roof catchment
4. Well
5. Spring
6. River
7. Other specify………………………………….
Q15. If your main source of water is community managed water kiosk or piped individual community
managed scheme then averagely how long does it take you to fetch water now?
1. 0 – 10 minutes

181
2. 11 – 20 minutes
3. 21 – 30 minutes
4. More than 30 minutes
5. Don’t know
Q16. How long did it used to take you to fetch water prior to the implementation of the community
managed water scheme?
1. 0 – 10 minutes
2. 11 – 20 minutes
3. 21 – 30 minutes
4. More than 30 minutes
5. Don’t know
Q17. Between 2013 and 2014, what is your perception about water reliability in your community?
1. Improved
2. Same
3. Worse off
Q18. Averagely how much do you pay for water per month?
1. Kshs. 500 and below
2. Between Kshs. 501 and 1,000
3. Between Kshs. 1,001 and 1,500
4. Between Kshs, 1,501 and 2,000
5. Between Kshs, 2,001 and 2,500
6. Between Kshs. 2,501 and 3,000
7. Between Kshs. 3,001 and 3,500
8. Over Kshs. 3,500
9. Free (I don’t pay for my water)
Q19. Are you conversant with water tap handling?
1. Yes
2. No
Q20. Is your main source of water reliable?
1. Yes
2. No
Q21. If main water source is not reliable, what is your alternative source?
1. Use storage/reservoir
2. River water
3. Borehole

182
4. Other (specify)…………………………………..
Q22. What do you mainly use water for?
1. Domestic
2. Industrial
3. Both
Q23. Have you ever provided paid or unpaid labor to the community managed water scheme in your area?
1. Yes
2. No
Q24. Do you always pay your water bills in time?
1. Yes
2. No
Q25. Are you still willing to continue paying your water bills in time?
1. Yes
2. No
Q26. Are you willing to contribute money or time for an expansion of the community managed water
scheme?
1. Yes
2. No
Q27. Has your water supply been interrupted over the past year?
1. Yes
2. No
Q28. If answer to Q27 is yes, how frequently has it been interrupted?
1. More than once a week
2. Once a week
3. Once a month
4. Once in six months
5. Once a year
6. Not applicable

183
Q29. How long was the interruption the last time it occurred?
1. A few hours
2. A day
3. A few days
4. A week
5. More than a week
6. Not applicable
Q30. What was the cause of interruption?
1. Broken Pipes
2. Dry spell
3. Power disconnection
4. Any other
5. Not applicable
Q31. Have you ever experience pipe vandalism in your community?
1. Yes
2. No
Q32. Are you willing to intervene if you ever experience pipe vandalism in your community?
1. Yes
2. No
Q33. Have you ever attended a public meeting during the last 2 years where water and sanitation service
provisioning issues were discussed?
1. Yes
2. No
Q34. Who organized the public meeting?
1. County Government bodies
2. Local municipality
3. Political party/ ward councilors / members of parliament
4. SANA International
5. Local groups
6. Not applicable
Q35. What was the main theme of discussion in the meetings you have ever attended? (Interviewer: Do
not read out options. Let the respondent answer then tick)
1. Water pricing
2. Addressing consumer complaints

184
3. Water conflict resolution
4. Improvement of water sources
5. Regulation of the water management committees
6. Developing sustainable and transparent incentives for community water users
7. Water conflict resolution
8. Any other
9. Not applicable
Q36. Did the public meeting lead to any improvement in the water service within the informal settlement?
1. Yes
2. No
Q37. Have you or any member of your household made a complaint about your water supply/quality
issues over the past 3 years?
1. Yes
2. No
Q38. Who did you or your household made a complaint to?
1. Municipality
2. Water vendors
3. Landlord/employer
4. SANA International
5. Our selves
6. Not applicable
Q39. What was the result of the complaint?
1. Action taken in a day
2. Action taken in a few days
3. Action taken in a week
4. Action took several weeks
5. Action took more than a month
6. No action taken
7. Not applicable
Q40. Overall, how satisfied are you and your household with the management work of the committee
responsible for managing your main source of water?
1. Satisfied
2. Not Satisfied
Q41. Do you have confidence in the people/institution involved in the supply of water and sanitation
service in your settlement?
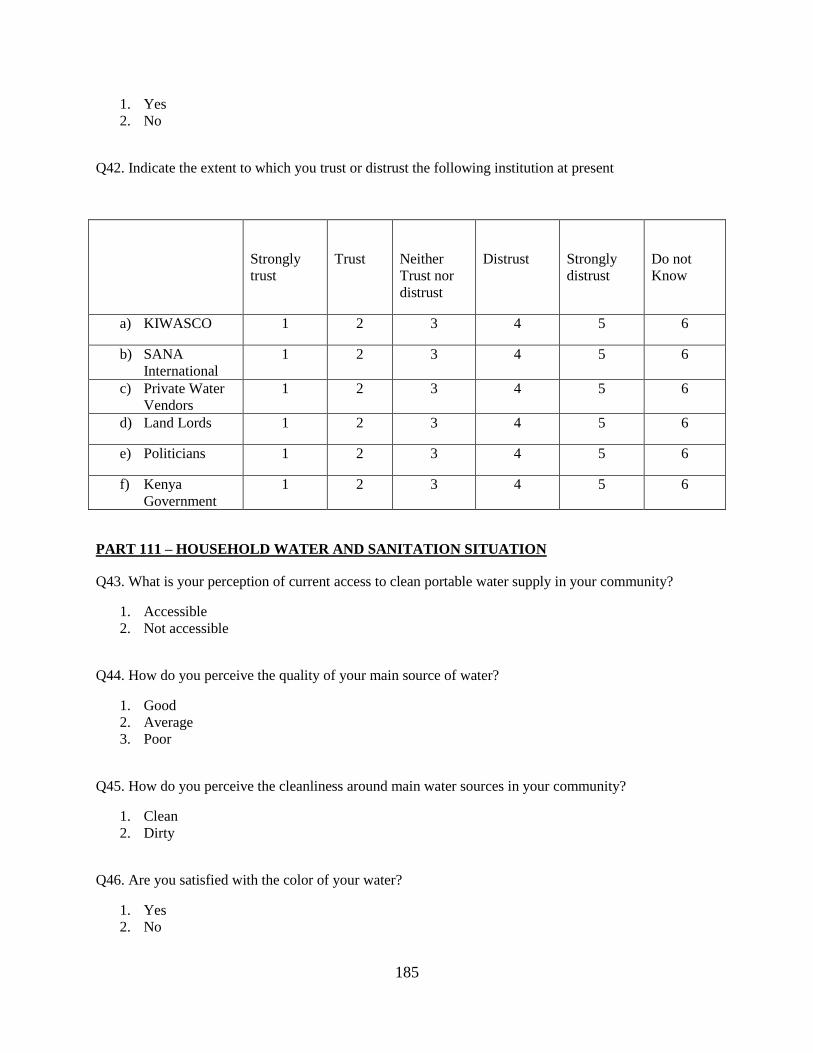
185
1. Yes
2. No
Q42. Indicate the extent to which you trust or distrust the following institution at present
Strongly
trust
Trust
Neither
Trust nor
distrust
Distrust
Strongly
distrust
Do not
Know
a) KIWASCO 1 2 3 4 5 6
b) SANA
International
1 2 3 4 5 6
c) Private Water
Vendors
1 2 3 4 5 6
d) Land Lords 1 2 3 4 5 6
e) Politicians 1 2 3 4 5 6
f) Kenya
Government
1 2 3 4 5 6
PART 111 – HOUSEHOLD WATER AND SANITATION SITUATION
Q43. What is your perception of current access to clean portable water supply in your community?
1. Accessible
2. Not accessible
Q44. How do you perceive the quality of your main source of water?
1. Good
2. Average
3. Poor
Q45. How do you perceive the cleanliness around main water sources in your community?
1. Clean
2. Dirty
Q46. Are you satisfied with the color of your water?
1. Yes
2. No

186
Q47. Are you satisfied with the smell of your water?
1. Yes
2. No
Q48. Do you clean and cover your water storage containers?
1. Yes
2. No
Q49. Has any member of your household suffered from any of the following water related
disease/condition recently (past 6 months prior to data collection)?
1. Cholera
2. Typhoid
3. Scabies
4. Bilharzia
5. None
Q50. If yes did you visit a doctor’s clinic?
1. Yes
2. No
Q51. Are you willing to protect areas around water points in your community from contamination?
1. Yes
2. No
Q52. What is your main source of information on water safety system (storage, handling, treatment)?
1. Ministry of water
2. Government of Kenya
3. SANA International
4. Media
5. Other (Specify)
Q53. Do you have a toilet in your household?
1. Yes
2. No
Q54. If yes what type of toilet do you have?
1. Pit latrine outside the house
2. Flush latrine

187
3. Communal latrine
4. Not applicable
Q55. What is your perception about the status of your toilet?
1. Clean
2. Fair
3. Dirty
4. None
Q56. If your response in Q55 above in NO, then where do you go when you need a toilet?
1. Bush
2. Flying toilet
3. Dig small hole and cover
4. Neighbors toilet
5. Not applicable
Q57. Is there any general comment you may want to add to water situation in your area?
THANK YOU FOR YOUR TIME

188
APPENDIX D:
INFORMED CONSENT FORM FOR WOMEN FOCUS GROUPS
Major participatory related factors which have influenced or can potentially
influence management success or failures of the water schemes
Overall this study is interested in evaluating the role of community participation in water
production and management in urban informal settlement. It is part of a dissertation study for
Erick Oniango Ananga who is a candidate at the University of South Florida. Specifically for this
session we are interested in learning the major participatory related factors which have
influenced or can potentially influence management success or failures of the schemes. Having a
better understanding of these factors will enable policy makers to devise strategies that will lead
to better management of urban based community operated water resources. You are being asked
to participate in this discussion because you belong to one of the women groups in the four water
schemes selected for the case study. If you choose to take part in this inquiry, we will ask you to
engage in a discussion in the form of a focus group of approximately 8 people. You will be
required to share your experiences regarding the major participatory related factors which have
influenced or can potentially influence management success or failures of the scheme in your
community. The focus group will be audio taped and later transcribed for analysis.
We do not know of any risks from taking part in this research. If we learn of any we will
let you know. We do not expect you to individually benefit from taking part in this research and
your participation in this inquiry is completely voluntary. You may choose not to take part. If
you decide to take part now, you can change your mind at any time. You are free to stop taking
part in this study at any time for any reason without penalty. If you decide not stay in the study,
all data related to your opinion will be destroyed. In terms of confidentiality, your name will not
appear in any report or publication of the research. Your consent form will be safely stored in a
locked facility and only the researchers will have access to this information. There is no
compensation for participating in this study. If you have questions about the research in general
or about your role in the study, please feel free to contact Erick Ananga telephone number
+254722805810 or email [email protected]. If you have any questions about your
rights as a participant in the study you can call Research Integrity and Compliance at the
University of South Florida at 813-974-5638. The USF ID number for this study is Pro00015949.
By signing this form you as a participant hereby do accept that you understand the nature of this
project and its risks and benefits and have had the opportunity to ask questions and to have your

189
questions answered to your satisfaction. You hereby freely give consent to take part in this
research.
_______________________ _________________________ _______________
Signature of Participant Name of Participant Date
_______________________ _________________________ _______________
Signature of Investigator Name of Investigator Date

190
APPENDIX E:
INFORMED CONSENT FORM FOR WATER MANAGEMENT COMMITTEE FOCUS
GROUPS
Major participatory related factors which have influenced or can potentially influence
management success or failures of the water schemes
The overall objective of this study is to evaluate the role of community participation in water
production and management in urban informal settlement. It is part of a dissertation study for
Erick Oniango Ananga who is a PhD candidate at the University of South Florida. Specifically
for this session we are interested in learning the major participatory related factors which have
influenced or can potentially influence management success or failures of the schemes. Having a
better understanding of these factors will enable policy makers to devise strategies that will lead
to better management of urban based community operated water resources. You are being asked
to participate in this discussion because you are in the management committee of one of the four
water schemes selected for evaluation. If you choose to take part in this inquiry, we will ask you
to engage in a discussion in the form of a focus group of approximately 8 people. You will be
required to share your experiences regarding the major participatory related factors which have
influenced or can potentially influence management success or failures of the scheme in your
community.
We do not know of any risks from taking part in this research. If we learn of any we will
let you know. We do not expect you to individually benefit from taking part in this research and
your participation in this study is completely voluntary. You may choose not to take part. If you
decide to take part now, you can change your mind at any time. You are free to stop taking part
in this study at any time for any reason without penalty. If you decide that you do not want to
stay in the study, all data related to your participation will be destroyed. In terms of
confidentiality, your name will not appear in any report or publication of the research. Your
consent form will be safely stored in a locked facility and only the researchers will have access
to this information. There is no compensation for participating in this study. If you have
questions about the research in general or about your role in the study, please feel free to contact
Erick Ananga telephone number 254722805810 or email [email protected]. If you
have any questions about your rights as a participant in the study you can call Research Integrity
and Compliance at the University of South Florida at 813-974-5638. The USF ID number for this
study is Pro00015949. By signing this form you as a participant do hereby accept that you

191
understand the nature of this project and its risks and benefits and have had the opportunity to
ask questions and to have your questions answered to your satisfaction.
_____________________ _________________________ _______________________
Signature of Participant Name of Participant Date
_______________________ ______________________ ________________________
Signature of Investigator Name of Investigator Date

192
APPENDIX F:
INFORMED CONSENT FORM FOR WATER CONSUMER FOCUS GROUP
DISCUSIONS
Major participatory related factors which have influenced or can potentially influence
management success or failures of the water schemes
The overall objective of this study is to evaluate the role of community participation in water
production and management in urban informal settlement. It is part of a dissertation study for
Erick Oniango Ananga who is a PhD candidate at the University of South Florida. Specifically
for this session we are interested in learning the major participatory related factors which have
influenced or can potentially influence management success or failures of the schemes. Having a
better understanding of these factors will enable policy makers to devise strategies that will lead
to better management of urban based community operated water resources. You are being asked
to participate in this discussion because you are a member of a water consumer group in one of
the four water schemes selected for evaluation. If you choose to take part in this inquiry, we will
ask you to engage in a discussion in the form of a focus group of approximately 8 people. You
will be required to share your experiences regarding the major participatory related factors which
have influenced or can potentially influence management success or failures of the scheme in
your community. The focus group will be audio taped and later transcribed for analysis.
We do not know of any risks from taking part in this research. If we learn of any we will
let you know. We do not expect you to individually benefit from taking part in this research and
your participation in this inquiry is completely voluntary. You may choose not to take part. If
you decide to take part now, you can change your mind at any time. You are free to stop taking
part in this study at any time for any reason without penalty. If you decide you do not want to
stay in the study, all data related to your opinion will be destroyed. In terms of confidentiality,
your name will not appear in any report or publication of the research. Your consent form will be
safely stored in a locked facility and only the researchers will have access to this information.
There is no compensation for participating in this study. If you have questions about the research
in general or about your role in the study, please feel free to contact Erick Ananga telephone
number +254722805810 or email [email protected]. If you have any questions about
your rights as a participant in the study you can call Research Integrity and Compliance at the
University of South Florida at 813-974-5638. The USF ID number for this study is Pro00015949.
By signing this form you as a participant hereby do accept that you understand the nature of this
project and its risks and benefits and have had the opportunity to ask questions and to have your

193
questions answered to your satisfaction. You hereby freely give consent to take part in this
research.
_______________________ ______________________ _______________
Signature of Participant Name of Participant Date
_______________________ _________________________ _______________
Signature of Investigator Name of Investigator Date

194
APPENDIX G:
INTRODUCTION SCRIPT AND QUESTIONING ROUTE FOR WOMEN GROUPS
FOCUS GROUP DISCUSSIONS
Good morning everybody and welcome to this session of our discussion. My name is Erick
Oniango Ananga. I am a PhD candidate at the University of South Florida and I am here with
Mrs. Rosemary Moi who is a program coordinator at SANA International. We are grateful for
accepting to participate in this Focus Group Discussion (FGD). This study involves gathering
information meant for evaluating the role of community participation in water production and
management in urban informal settlement. Specifically it is our hope that the information
gathered here will increase our knowledge on the major participatory related factors which have
influenced or can potentially influence management success or failures of the water schemes
established by SANA International in this settlement. Our findings will not only benefit the
community here in Kisumu but also other NGOs around the world working on urban water
service provisioning.
As a member of a women group in this scheme your experiences and views are very
important to us. As you are all aware there are several factors which may influence the success or
failures of urban based community managed water schemes so feel free to share your
experiences and views even if they are different from other group members.
In order to moderate this discussion in an orderly manner, I will request all the
participants to speak one at a time. We request that you select the name you would prefer to use
during the entire session of the discussion and place it in front of you. During the discussion if
you want to agree or disagree or add an opinion to what a member is saying then do feel free to
interject. We request that for the entire session of the discussion, refer to fellow group member
with the name they have selected and placed in front of them. The discussion will be audio taped
and we request everyone to respect each other’s privacy by not disclosing the content of issues
addressed here with non-participants. All your views will be confidential and only your chosen
names will be included in the final report. The discussion will last approximately one hour. Jacob
will be taking notes while I will be listening, asking questions and ensuring that everybody get a
chance to participate. Before we proceed I would like everybody to go through the informed
consent form supplied and sign it. The informed consent form provides the overall information
about the study. Before we begin the discussion I would like to ask if any of the group members

195
have a question. Questions are addressed after which the tape recorder turned on then the session
begins.
Women Group FGD Questioning Route
Opening question
We will start with everybody saying their selected names and their role in the women group
serviced by the water scheme.
Introductory questions
I1.How long have you been a member of this women group and what do you enjoy most as a
member of a women group serviced by this water scheme?
I2. Since the establishment of the scheme what impacts do you think the scheme has created in
this settlement in regards to water service delivery?
Transition questions- What are your opinions as a group about this water schemes as to
whether it is a success or failure as a project?
T3. What factors do you think have contributed to the management success of this water
scheme?
T4. What factors do you think have impeded or slowed the success of this water scheme?
T5. What factors do you think could have improved the success of this water scheme?
Key Questions
K6. Reflect back and make a list of four of the most important factors you think have influenced
the management success of your water scheme. In a few minutes you will have an opportunity to
share your views with the other team members.
K7. Again reflect back and make a list of four of the most important factors you think have
impeded the management success of your water scheme. In a few minutes you will have an
opportunity to share your views with other team members.
K8. Again reflect back and make a list of four most important factors you think could have
improved the success of this water scheme
Ending question
E11. Our discussion of today was meant to help us understand factors which have influenced or
can potentially influence management success or failures of the water schemes. Before we
conclude the discussion I would like to invite anyone who may want add anything we may have
missed.

196
APPENDIX H:
INTRODUCTION SCRIPT AND QUESTIONING ROUTE FOR WATER
MANAGEMENT COMMITTEES FOCUS GROUP DISCUSIONS
Good morning everybody and welcome to this session of our discussion. My name is Erick
Oniango Ananga. I am a PhD candidate at the University of South Florida and I am here with
Mr. Jacob Ochola who is a program coordinator at SANA International. We are grateful for
accepting to participate in this Focus Group Discussion (FGD). This study involves gathering
information meant for evaluating the role of community participation in water production and
management in urban informal settlement. Specifically it is our hope that the information
gathered here will increase our knowledge on the major participatory related factors which have
influenced or can potentially influence management success or failures of the water schemes
established by SANA International in this settlement. Our findings will not only benefit the
community here in Kisumu but also other NGOs around the world working on urban water
service provisioning.
Your experiences and views are very important to us because most of you have worked in
this water scheme since its establishment. There are several factors which may influence the
success or failures of urban based community managed water schemes so feel free to share your
experience even if it is different from other group members.
In order to moderate this discussion in an orderly manner, I will request all the
participants to speak one at a time. We request that you select the name you would prefer to use
during the entire session of the present discussion and place it in front of you. During the
discussion if you want to agree or disagree or add an opinion to what a member is saying then do
feel free to interject. We request that for the entire session of the discussion refers to fellow
group member with the name they have selected and placed in front of them. The discussion will
be audio taped and we request everyone to respect each other’s privacy by not disclosing the
content of issues addressed here with non-participants. All your views will be confidential and
only your chosen names will be included in the final report. The discussion will last
approximately one hour. Jacob will be taking notes while I will be listening, asking questions
and ensuring that everybody get a chance to participate.
Before we proceed I would like everybody to go through the informed consent form
supplied and sign it. The informed consent form provides the overall information about the

197
study. Before we begin the discussion I would like to ask if there are any questions. Questions
are addressed after which the tape recorder turned on then the session begins.
Water Management Committee FGD Questioning Route
Opening question
We will start with everybody saying their selected names and their role in the water management
committee in this scheme.
Introductory questions
I1.How long have you been a member of this management committee and what do you enjoy
most as a member of the management committee serviced by this water scheme?
I2. Since the establishment of the scheme what impacts do you think the scheme has created in
this settlement in regards to water service delivery?
Transition questions- What are your opinions as a management committee about this water
schemes as to whether it is a success or failure as a project?
T3. What factors do you think have contributed to the management success of this water
scheme?
T4. What factors do you think have impeded or slowed the success of this water scheme?
T5. What factors do you think could have improved the success of this water scheme?
Key Questions
K6. Reflect back and make a list of four of the most important factors you think have influenced
the management success of your water scheme. In a few minutes you will have an opportunity to
share your views with the other team members.
K7. Again reflect back and make a list of four of the most important factors you think have
impeded the management success of your water scheme. In a few minutes you will have an
opportunity to share your views with other team members.
K8. Again reflect back and make a list of four most important factors you think could have
improved the success of this water scheme
Ending question
E11. Our discussion today was meant to help us understand factors which have influenced or can
potentially influence management success or failures of the water schemes. Before we conclude
the discussion I would like to invite anyone who may want to add anything we may have missed.
198
APPENDIX I:
INTRODUCTION SCRIPT AND QUESTIONING ROUTE FOR WATER CONSUMER
GROUP FOCUS GROUP DISCUSSIONS
Good morning everybody and welcome to this session of our discussion. My name is Erick
Oniango Ananga. I am a PhD candidate at the University of South Florida and I am here with
Mr. Jacob Ochola who is a program coordinator at SANA International. We are grateful for
accepting to participate in this Focus Group Discussion (FGD). This study involves gathering
information meant for evaluating the role of community participation in water production and
management in urban informal settlement. Specifically it is our hope that the information
gathered here will increase our knowledge on the major participatory related factors which have
influenced or can potentially influence management success or failures of the water schemes
established by SANA International in this settlement. Our findings will not only benefit the
community here in Kisumu but also other NGOs around the world working on urban water
service provisioning.
As an official of the water consumer group in this scheme your experiences and views are
very important to us. As you are all aware there are several factors which may influence the
success or failures of urban based community managed water schemes so feel free to share your
experience even if it is different from other group members.
In order to moderate this discussion in an orderly manner, I will request all the
participants to speak one at a time. We request that you select the name you would prefer to use
during the entire session of the discussion and place it in front of you. During the discussion if
you want to agree or disagree or add an opinion to what a member is saying then do feel free to
interject. We request that for the entire session of this discussion you should refer to fellow
group member with the name they have selected and placed in front of them. The discussion will
be audio taped and we request everyone to respect each other’s privacy by not disclosing the
content of issues addressed here with non-participants. All your views will be confidential and
only your chosen names will be included in the final report. The discussion will last
approximately one hour. Jacob will be taking notes while I will be listening, asking questions
and ensuring that everybody get a chance to participate.
Before we proceed I would like everybody to go through the informed consent form
supplied and sign it. The informed consent form provides the overall information about the
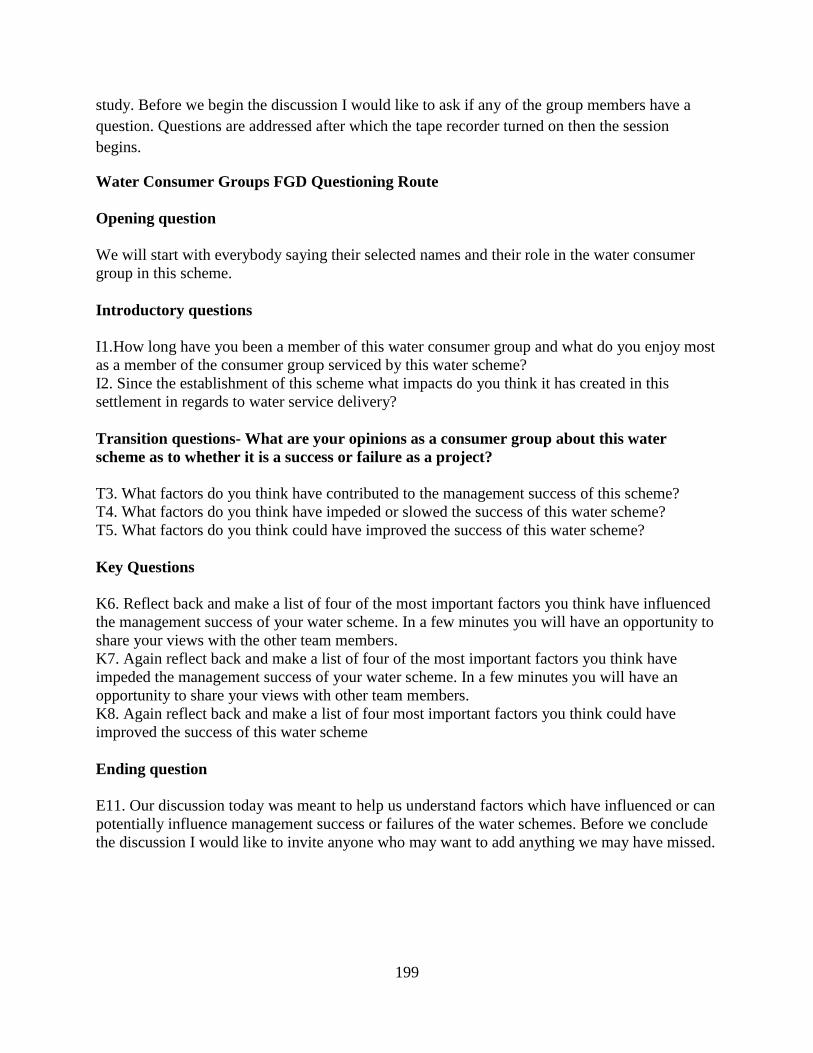
199
study. Before we begin the discussion I would like to ask if any of the group members have a
question. Questions are addressed after which the tape recorder turned on then the session
begins.
Water Consumer Groups FGD Questioning Route
Opening question
We will start with everybody saying their selected names and their role in the water consumer
group in this scheme.
Introductory questions
I1.How long have you been a member of this water consumer group and what do you enjoy most
as a member of the consumer group serviced by this water scheme?
I2. Since the establishment of this scheme what impacts do you think it has created in this
settlement in regards to water service delivery?
Transition questions- What are your opinions as a consumer group about this water
scheme as to whether it is a success or failure as a project?
T3. What factors do you think have contributed to the management success of this scheme?
T4. What factors do you think have impeded or slowed the success of this water scheme?
T5. What factors do you think could have improved the success of this water scheme?
Key Questions
K6. Reflect back and make a list of four of the most important factors you think have influenced
the management success of your water scheme. In a few minutes you will have an opportunity to
share your views with the other team members.
K7. Again reflect back and make a list of four of the most important factors you think have
impeded the management success of your water scheme. In a few minutes you will have an
opportunity to share your views with other team members.
K8. Again reflect back and make a list of four most important factors you think could have
improved the success of this water scheme
Ending question
E11. Our discussion today was meant to help us understand factors which have influenced or can
potentially influence management success or failures of the water schemes. Before we conclude
the discussion I would like to invite anyone who may want to add anything we may have missed.

200
APPENDIX J:
BACKGROUND INFORMATION FOR ALL FOCUS GROUP DISCUSSION
PARTICIPANTS
Participants Information Sheet
1. What is your chosen name for this discussion ………………………………
2. What is the name of the scheme serving your community?
5. Wandiege Water and Sanitation Scheme
6. Obunga Water and Sanitation Scheme
7. Asengo Water and Sanitation Scheme
8. Paga Water and Sanitation Scheme
3. What is your age……………………………….………..…
4. How many people live in your household
1. 1 person
2. 2 persons
3. 3 persons
4. 4 persons
5. 5 persons
6. 6 persons
7. 7 persons
8. More than 7 persons
5. What is your highest level of education?
1. No formal education
2. Primary level
3. Secondary level
4. College level
5. University level
6. What is your main source of income
1. Wage employment
2. Artisan/Blacksmith
3. Salaried employment
4. Trading/Small business
5. Other specify
7. How long have you been a member of this women group/ Water consumer group or Ware
Management Committee in this Scheme?
1. One year and less
2. 2 to 3 year
3. 4 to 50 year
4. Over 5 years
8. How many years have you been living in this settlement
1. One year and less

201
2. 2 - 5 years
3. 6 – 10 years
4. Above 10 years

ABOUT THE AUTHOR
I consider myself an International Development Planner/Human Geographer whose
research focuses on Water and Sanitation issues in the developing world. I received a Bachelor’s
of Arts Degree in International Development Studies with Economics major at the University of
East Anglia Norwich UK. I also hold a Master of Arts in Politics and International Development
from the University of East Anglia. My doctoral dissertation which is reported here involved
examining the tenability of community participation (CP) theory in explicating water production
and management dynamics in urban informal settlements. My research is inspired by the fact that
in the developing world adequate water provisioning in urban centers still remains an elusive
problem.
While pursuing a Ph.D. degree at the University of South Florida, I have also been
involved in several collaborative works. Apart from research, I have also been teaching as well
as being involved in curriculum course development. I have taught World Regional Geography
both the in class and online version of the course. I have also taught introduction to
Environmental Sciences, Global Conservation and Global Environmental Perspectives. The
interdisciplinary nature of my academic background and experience has equipped me well with
the ability to teach courses in different disciplines. I can teach courses in geography,
environmental sciences, international development, public policy, urban planning and politics.