the role of csr on financial performance of...
TRANSCRIPT
34
The Role of CSR on Financial Performance of Companies
Listed at the Nairobi Securities Exchange (NSE)
1John Karori Nyamiobo
2 Willy Mwangi Muturi
3Walter Bichanga Okibo
4Tobias Olweny
1 PhD Candidate, Jomo Kenyatta University of Agriculture and Technology (JKUAT),
Nairobi, Kenya, Email: [email protected] 2-4
Jomo Kenyatta University of Agriculture and Technology (JKUAT), Nairobi, Kenya
ABSTRACT
The relationship between corporate social responsibility (CSR) and firm performance has been a
subject for many extensive studies in the last decade. This study examined the effect of Corporate
Social Responsibility on Performance of listed firms at the Nairobi Securities Exchange (NSE). The
research was designed to use quantitative research method utilizing data collected from companies
listed at the NSE. The study employed simple linear regression analysis to observe the relationship
between the dependent variable (financial performance) of firms listed at NSE and the independent
variable (Corporate Social Responsibility). Questionnaires were used to collect primary data from the
targeted population NSE. The data collected was analysed by use of descriptive and inferential
statistics. The study carried out the analysis of the data with the help of statistical packages including
SPSS and MS-Excel. A correlation and regression analysis was carried out to determine the
relationship between financial performance of companies listed at the NSE and Corporate Social
Responsibility. The findings revealed that, R2 was .452 meaning that CSR contributed 45.2% to the
total variability in the dependent variable (Financial Performance). This demonstrated that Corporate
Social Responsibility had a significant influence on the dependent variable (financial performance).
From the findings the study concluded that, there was a significant positive effect of corporate social
responsibility on performance of listed firms in Nairobi Securities Exchange.
Keywords: Corporate Social Responsibility, Performance, Listed Companies
INTRODUCTION
The role of security exchanges are critical and play an important role in the economic development of
economies. They facilitate corporations and government units to raise capital; allocate capital toward
productive uses; provide opportunity for people to increase saving and investment; reveal investors’
perception about potential earnings capacity of firms. Thus giving guidance to firm managements and
most importantly, securities help to generate employment and increase income (Siljanen, 2012). On
the global scene, the largest Securities are located in the developed economies of the West, mainly in
United States and Europe. In the Eastern African region, the Nairobi Securities Exchange of Kenya
which was established in 1954, is the sub-Saharan Africa’s fourth largest and the largest in Eastern
and Central Africa. It is the most developed in East and Central African Countries (Kamau,
Namusonge & Bichanga, 2016). NSE plays an important role in economic development through
various channels: mobilization of domestic savings shifting critical resources from dormant agents to
active agents; major medium on incoming international capital; and facilitation of government
privatisation programme (Capital Markets Authority, 2012).
According to Carroll (1991) CSR is categorized into four types: economic, legal, ethical and
discretionary, and these are organized into a pyramid where economic responsibility is the most
important and fundamental responsibility. Further, Hasseldine, Salama and Toms (2005) and Toms
(2002) expressed that it is difficult for companies investing in CSR activities to maximize their
reputation without disclosing information of such activities. This scenario is utilitarian and strategic as
the disclosure of related information contribution to financial performance is of importance to firms
(Barnett, 2007; Mackey et al., 2007). Moreover, Patten (1992) suggested that social information in
International Journal of Business & Law Research 5(3):34-45, July-Sept., 2017
© SEAHI PUBLICATIONS, 2017 www.seahipaj.org ISSN: 2360-8986

35
annual reports can influence public policies directly by addressing public or legislative concerns or
indirectly by projecting an image of the company’s social awareness.
Statement of the Problem
The idea of business organisations engaging beyond legal requirements is ethically desirable even
though it appears to take away current resources from the firm’s immediate needs (Jooh, et al.,
2010).The relationship between corporate social responsibility and firm performance has been a
subject for many extensive studies in the last decade (Buiten, 2012). Past studies on the relationship
between CSR and financial performance of companies have not been conclusive. Griffin & Mahon
(1997) mapped several companies in their research in the 1970s, 1980s and 1990s and concluded that
the relationship between CSR and financial performance of firms could be positive, neutral or even
negative. Nkaiwatei (2011) in his study for instance, concluded that financial performance was one of
the important factors that determined CSR. Wanjala (2011) also arrived at similar conclusions for the
banking sector. Although CSR research has been the subject of discussion for firms listed at securities
exchange study for the past few decades, the empirical studies focused more on the developed
Western economies (Tsang & Kwan, 1999). Thus, this paper sought to find out the role of CSR on
financial performance of companies listed at the Nairobi Securities Exchange (NSE).
THEORETICAL AND EMPIRICAL LITERATURE
The study was directed by the following theories: Legitimacy Theory, Capital Structure Theory, and
Agency Theory.
Financial Performance
Financial performance is often measured based on accounting key performance indicators. These
include Return on Assets (ROA), Operating Profit Margin, Earnings before Interest and Income Tax,
Return on Capital Employed, Return of Equity (Itter & Larker, 1997; Fraquelli & Vannoni, 2000;
Crabtree & DeBusk, 2008). The advantage of using these measurements is that they are readily
available. All profit oriented businesses are required to produce annual financial statements where
these measurements can be obtained from (Chenhall & Euske, 2007; Langfield – Smith, 2007). ROA
percentage shows how profitable a company’s assets are in generating income. It is given by the ratio
between net income and total assets. This ratio informs us what the company can do with what it has
got. Thus, how many shillings of earnings the firm can derive from each shilling of assets it controls.
The number will vary widely across industries. Return on assets gives an indication of the capital
intensity of a company, which will depend on the industrial sector. Companies that require large initial
investment will generally have lower returns on assets.
Return on Equity ratio is extensively used in economic literature (Parker & Eilbirt, 1975; Waddock &
Graves, 1997). ROE is the percentage expression of a company’s net income as it is returned as value
to shareholders. It offer investors and analysts an alternative measure of the firm’s profitability and
calculates the efficiency with which the firm generates profit using the funds that shareholders have
invested. In equation form. In calculation of RE; Return on Equity = Net Income shareholders’ equity.
ROE is equal to a fiscal year’s net income (after preferred stock dividends but before common stock
dividends) divided by total equity (excluding preferred shares), expressed as a percentage. It measures
the rate of return on ownership interest (shareholders’ equity) of common stock owners. It measures a
firm’s efficiency at generating profits from every shilling of net assets (assets minus liabilities), and
shows how well a company uses investment shillings to generate earnings growth.
Corporate Social Responsibility
Bowen (1953) defines Corporate Social Responsibility as the obligation of businessmen to pursue
those policies, to make those decisions or to follow those lines of action which are desirable to society.
Thus, CSR can be interpreted to give a concept that firm will voluntarily integrate social and
environmental concerns into their business operations and interactions with stakeholders (Djalil,
2003). The broader understanding of this concept is that social responsibility becomes an integral part
of strategic investment, core business strategy and a management instrument. This concept implies
that CSR is not a cost but an investment for the firm (Kusumadilaga, 2010). Empirical research on the
link between CSR and financial performance has given varied results. Of particular interest is the
great variety in the sign of the relation studied. The relationship between corporate social performance
(CSP) and Corporate Financial Performance (CFP) has received considerable research from scholars
close to a century. There have been divergent opinions on CSR as to whether acting in an ethical and
Nyamiobo et al. ….. ..Int. J. Business & Law Research 5(3):34-45, 2017
Ok

36
socially responsible manner adds any economic value to a firm. According to Friedman (1982), the
primary objective of the firm management should be to maximize shareholder wealth. Other opinions
are to the contrary opinion arguing that companies should try to be socially responsible, and gain
support for their activities from stakeholders. Thus, managers should maximize the well-being of
stakeholders in general. Some argue that in order to maximize profits, CSR may be a path to it
(Donaldson & Preston, 1995; Freeman, 1984; and Mitchell, Agle & Wood, 1997).
Profit making is the necessary reason for an enterprise to extend and grow while social responsibility
is the basic duty of the "state" to focus upon the setting of its stakeholders with social justice. Lai et al.
(2010) study indicate the effect of corporate social responsibility and firm’s profit on its brand equity
in business-to-business markets from the employee’s viewpoints on a sample of industrial purchasers
in Taiwan’s. The results supported their hypotheses that corporate social responsibility and corporate
reputation have positive effects on industrial brand equity and brand performance. The majority of the
companies believe that they should pay attention to corporate social responsibility however, their main
barrier to adopt corporate social responsibility is cost and lack of human resources; a moderate
positive relationship between CSR and performance exist. Mwangi (2013) stated that the relationship
between corporate social responsibility (CSR) practice and firm performance with some studies
showing a positive relationship. It is with this background that this study indicates that the relationship
between corporate social responsibility practice and determinants of financial performance of firms is
inadequate and these form the basis of this study.
On the negative relation, Waddock and Graves (1997) assumed that companies with responsible
behaviour may have a competitive disadvantage, since they incur unnecessary costs. These costs fall
directly on the bottom line and would necessarily reduce shareholder profits and wealth (Preston &
O’Bannon, 1997). CSP and CFP postulates that the fulfilment of CSR will bring competitive
disadvantage to the firm (Aupperle et al., 1985) methods or need to bear costs. According to this view,
when carrying out CSR activities, increased costs will result in little gain if measured in economic
interest. Neglecting some stakeholders like employees or the environment will lead to a lower CSP for
the firm. Hence, Waddock and Graves (1997) indicated that this theory was based on the assumption
of negative correlation between CSP and CFP. Joshi et al. (2007) found that there is a positive
relationship between profit making and social responsibility.
RESEARCH METHODOLOGY
This paper adopted a correlational survey design on all firms listed at NSE. The target population was
the employees of the 65 listed firms in Nairobi Securities Exchange. A stratified sampling was
employed in such a way that the target population was divided into, Top Level Management, Middle
Level Management and Lower Level Management. A representative sample size of 237 respondents
was derived from the target population. The study used primary data that was collected using
questionnaires. To achieve the aims of this study, the researcher employed multiple linear regression
analysis to observe the relationship between the dependent variable (financial performance) of firms
listed at NSE and Corporate Social Responsibility. The data collected was analysed by use of
descriptive and inferential statistics. The study carried out the analysis of the data with the help of
statistical packages including SPSS and MS-Excel. A correlation and regression analysis was carried
out to determine the relationship between Corporate Social Responsibility and financial performance
of companies listed at the NSE.
DATA ANALYSIS AND DISCUSSION OF THE FINDINGS
This paper sought to find out the role of CSR on financial performance of companies listed at the
Nairobi Securities Exchange (NSE). A sample of 237 respondents was used for the study and a
response rate of 72.6% was obtained.
Reliability Check on the Variables
Cho and Kim (2015) observed that Cronbach's alpha is the most common measure of internal
consistency (Reliability). The authors add that Cronbach's alpha is most commonly used when you
have multiple Likert questions in a survey/questionnaire that form a scale and you wish to determine if
the scale is reliable. The researcher carried out a reliability test taking into account a value of 0.7 or
higher as being sufficient (Bonett & Wright, 2015). From the results presented in Table 1, both the
Nyamiobo et al. ….. ..Int. J. Business & Law Research 5(3):34-45, 2017
Ok

37
CSR and the dependent variable (financial performance) were found to be reliable at Cronbach’s
Alphas of .919 and .881 which were higher than the threshold of 0.7.
Table 1: Reliability Analysis of the Variables
Reliability Statistics
Variable Cronbach's Alpha N of Items
CSR Information .919 10
Firm Performance .881 8
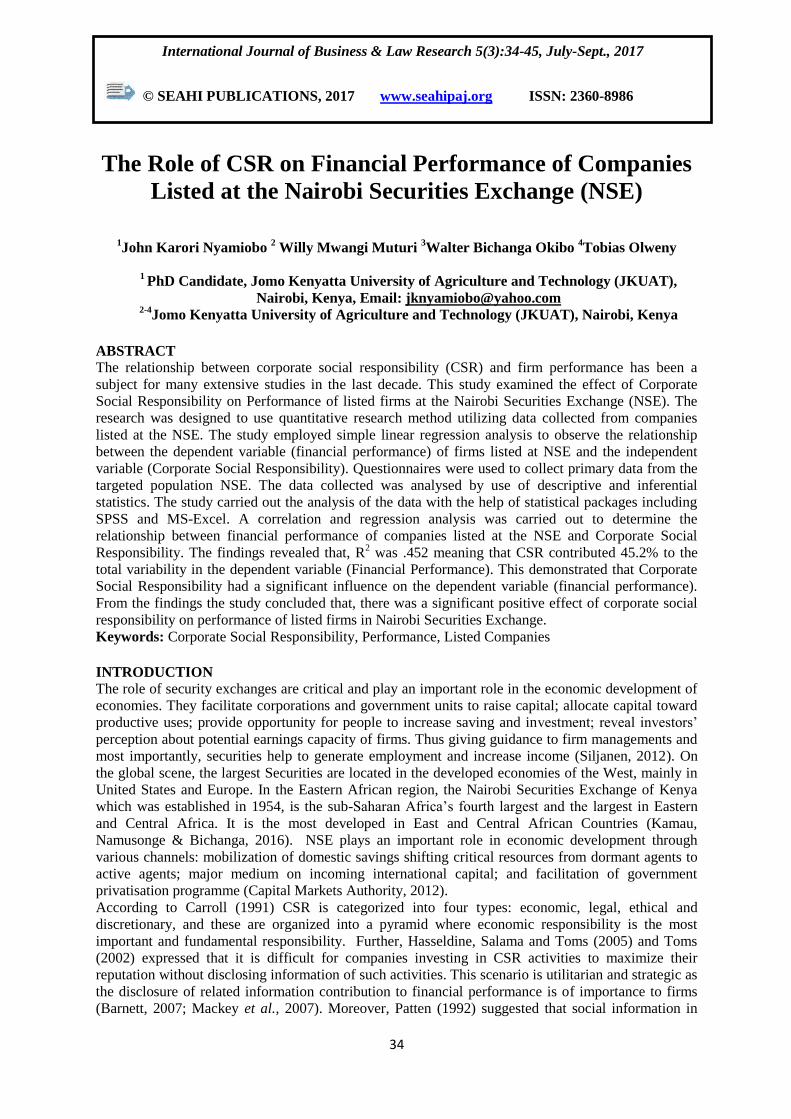
Factor Analysis According to Leech, Barrett and Morgan (2014), variable items should be retained if they are
consistent with the theoretical labels and have factor loadings greater than or equal to 0.4. A factor
analysis on Corporate Social Responsibility was carried out and the findings summarized in Table 2
revealed that none of the factors scored below the threshold of .4 and therefore none was dropped
from the analysis. A similar finding was observed in the dependent variable (Financial Performance)
which showed that all the factors loaded highly as all of them had scores above the threshold of 0.4
(Table 3).
Table 2: Factor Analysis of Corporate Social Responsibility
Component Matrixa
Component
1
The organization donates time, in-kind or financial contributions
to the local community e.g. education and training, cultural and
infrastructure development.
.820
The organization has documented procedures to enable decisions
to be made regarding issues covered by the Global Compact
principles
.820
The organization can demonstrate the impacts of its contribution
and how these are aligned to the organization's core and strategic
issues.
.802
The organization takes action to realise local and/or national
development goals following consultations with the local
community.
.795
The organization's policy includes a commitment to meeting local
legal requirements and international standards. .791
The organization take action in support of broader UN goals and
issues, such as the UN Millennium Development Goals (MDGs)
on combatting HIV, promoting education and women's rights.
.776
The organization has defined and communicated roles and
responsibilities with regard to issues covered by the Global
Compact principles.
.746
The organization has a written policy covering respect for human
rights, occupational health and safety, labour rights,
environmental and anti-corruption issues.
.720
The organization has appointed a senior person(s) responsible for
policies and plans related to issues covered by the Global
Compact principles.
.689
The organization seeks to contribute to community development
by entering partnerships with a range of stakeholders, including
UN agencies, governments, civil society, labour, and other non-
business interests.
.644
Extraction Method: Principal Component Analysis.
a. 1 components extracted.
Nyamiobo et al. ….. ..Int. J. Business & Law Research 5(3):34-45, 2017
Ok
38
Table 3: Factor Analysis on Firm’s Financial Performance
Component Matrixa
Component
1
Net Profit .823
Operating margin .805
Return on Equity .803
Average revenue .798
Asset Base .736
Return on capital employed .705
Gross Profit Margin .689
Return on Assets .564
Extraction Method: Principal Component Analysis.
a. 1 components extracted.
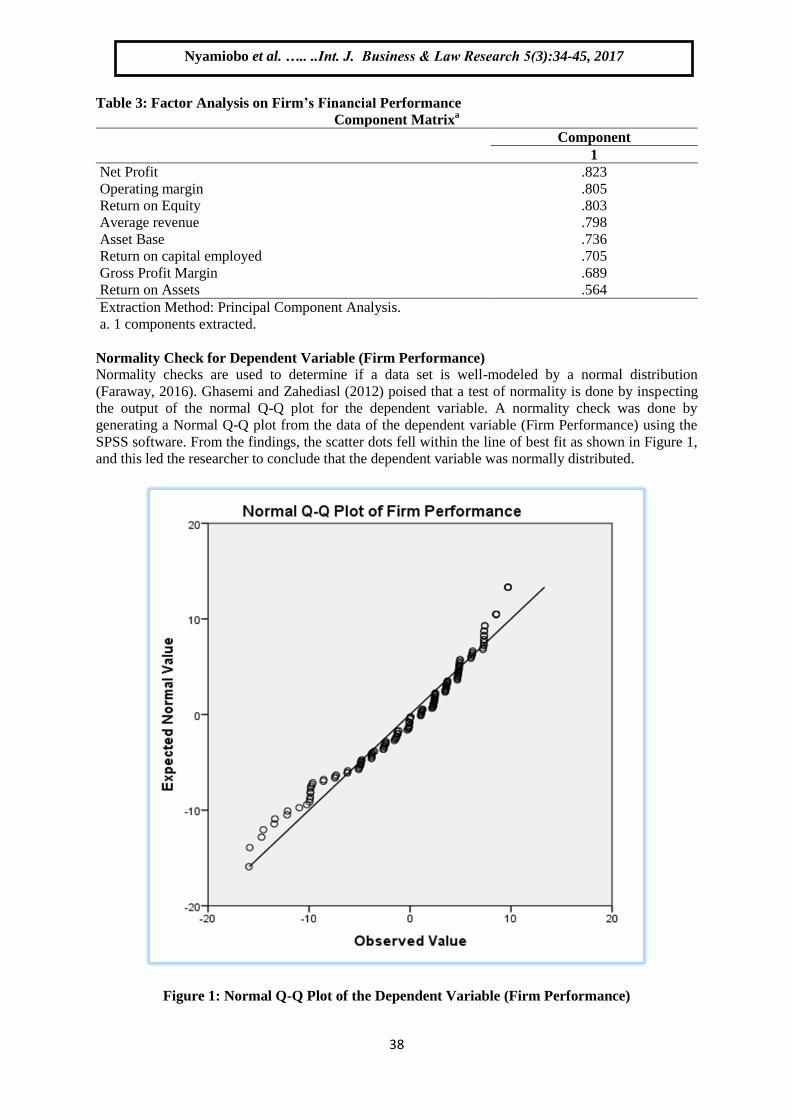
Normality Check for Dependent Variable (Firm Performance)
Normality checks are used to determine if a data set is well-modeled by a normal distribution
(Faraway, 2016). Ghasemi and Zahediasl (2012) poised that a test of normality is done by inspecting
the output of the normal Q-Q plot for the dependent variable. A normality check was done by
generating a Normal Q-Q plot from the data of the dependent variable (Firm Performance) using the
SPSS software. From the findings, the scatter dots fell within the line of best fit as shown in Figure 1,
and this led the researcher to conclude that the dependent variable was normally distributed.
Figure 1: Normal Q-Q Plot of the Dependent Variable (Firm Performance)
Nyamiobo et al. ….. ..Int. J. Business & Law Research 5(3):34-45, 2017
Ok
39
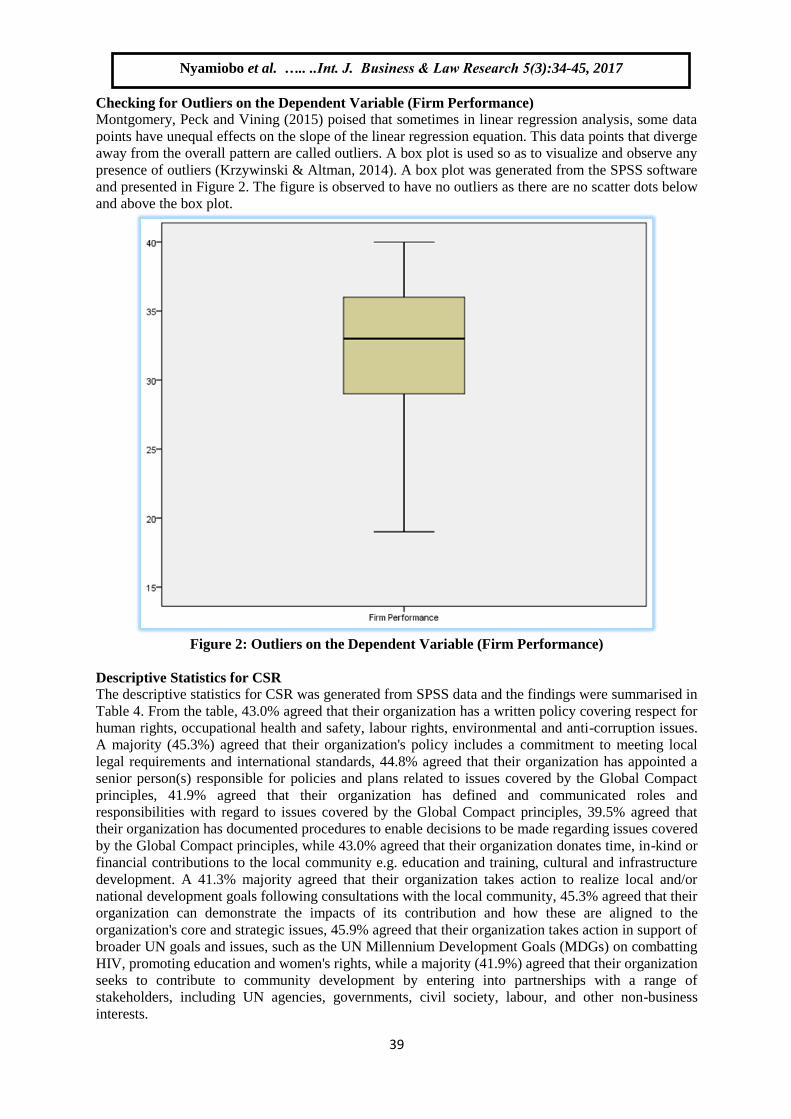
Checking for Outliers on the Dependent Variable (Firm Performance)
Montgomery, Peck and Vining (2015) poised that sometimes in linear regression analysis, some data
points have unequal effects on the slope of the linear regression equation. This data points that diverge
away from the overall pattern are called outliers. A box plot is used so as to visualize and observe any
presence of outliers (Krzywinski & Altman, 2014). A box plot was generated from the SPSS software
and presented in Figure 2. The figure is observed to have no outliers as there are no scatter dots below
and above the box plot.
Figure 2: Outliers on the Dependent Variable (Firm Performance)
Descriptive Statistics for CSR
The descriptive statistics for CSR was generated from SPSS data and the findings were summarised in
Table 4. From the table, 43.0% agreed that their organization has a written policy covering respect for
human rights, occupational health and safety, labour rights, environmental and anti-corruption issues.
A majority (45.3%) agreed that their organization's policy includes a commitment to meeting local
legal requirements and international standards, 44.8% agreed that their organization has appointed a
senior person(s) responsible for policies and plans related to issues covered by the Global Compact
principles, 41.9% agreed that their organization has defined and communicated roles and
responsibilities with regard to issues covered by the Global Compact principles, 39.5% agreed that
their organization has documented procedures to enable decisions to be made regarding issues covered
by the Global Compact principles, while 43.0% agreed that their organization donates time, in-kind or
financial contributions to the local community e.g. education and training, cultural and infrastructure
development. A 41.3% majority agreed that their organization takes action to realize local and/or
national development goals following consultations with the local community, 45.3% agreed that their
organization can demonstrate the impacts of its contribution and how these are aligned to the
organization's core and strategic issues, 45.9% agreed that their organization takes action in support of
broader UN goals and issues, such as the UN Millennium Development Goals (MDGs) on combatting
HIV, promoting education and women's rights, while a majority (41.9%) agreed that their organization
seeks to contribute to community development by entering into partnerships with a range of
stakeholders, including UN agencies, governments, civil society, labour, and other non-business
interests.
Nyamiobo et al. ….. ..Int. J. Business & Law Research 5(3):34-45, 2017
Ok

40
Table 4. Descriptive Statistic for CSR
Strongly
Disagree Disagree Neutral Agree
Strongly
Agree
The organization has a written policy covering
respect for human rights, occupational health and
safety, labour rights, environmental and anti-
corruption issues.
1.2% 7.0% 25.6% 43.0% 23.3%
The organization's policy includes a commitment to
meeting local legal requirements and international
standards.
0.0% 7.6% 26.7% 45.3% 20.3%
The organization has appointed a senior person(s)
responsible for policies and plans related to issues
covered by the Global Compact principles.
1.7% 5.2% 22.1% 44.8% 26.2%
The organization has defined and communicated
roles and responsibilities with regard to issues
covered by the Global Compact principles.
3.5% 15.7% 20.9% 41.9% 18.0%
The organization has documented procedures to
enable decisions to be made regarding issues covered
by the Global Compact principles
2.9% 7.6% 24.4% 39.5% 25.6%
The organization donates time, in-kind or financial
contributions to the local community e.g. education
and training, cultural and infrastructure development.
1.7% 8.7% 22.1% 43.0% 24.4%
The organization takes action to realise local and/or
national development goals following consultations
with the local community.
2.3% 7.6% 19.8% 41.3% 29.1%
The organization can demonstrate the impacts of its
contribution and how these are aligned to the
organization's core and strategic issues.
2.3% 6.4% 19.2% 45.3% 26.7%
The organization take action in support of broader
UN goals and issues, such as the UN Millennium
Development Goals (MDGs) on combatting HIV,
promoting education and women's rights.
2.3% 7.6% 25.0% 45.9% 19.2%
The organization seeks to contribute to community
development by entering partnerships with a range of
stakeholders, including UN agencies, governments,
civil society, labour, and other non-business
interests.
1.7% 8.1% 22.1% 41.9% 26.2%
This findings are in line with Toms (2002) suggestions that firm’s implementation, monitoring and
disclosure of environmental policies in the annual reports make a significant contribution in the
formation of good environmental reputation in the company. In a similar study, Hasseldine, Salama
and Toms (2005) tested the effect of both qualitative and quantitative disclosure on the company’s
reputation, their study revealed that quality of environmental disclosures have a stronger influence on
the creation of good environmental reputation more than merely quantitative disclosure. Another study
by Rettab, Brik and Mellahi (2009) examined the relationship between corporate social responsibility
and reputation of the company; they found a positive relationship between the two variables.
Descriptive statistics for Firm’s Financial Performance
The researcher sought to find the descriptive statistics of Firm’s Financial Performance. The findings
were summarized in Table 5. From the table, 48.8% said their Asset Base was good, 48.3% rated their
Gross Profit Margin as good, 44.8% said their Return on Assets was good, 48.3% rated their average
revenue as good, 48.8% rated their company’s operating margin as good, 49.4% rated their company’s
Return on Equity as good, 38.4% rated return on capital employed in their company as good, while a
44.8% majority said Net Profit was good.
Nyamiobo et al. ….. ..Int. J. Business & Law Research 5(3):34-45, 2017
Ok

41
Table 5: Descriptive statistics for Financial Performance
Poor Fair Average Good Very Good
Asset Base 0.6% 1.2% 19.2% 48.8% 30.2%
Gross Profit Margin 0.6% 4.1% 14.0% 48.3% 33.1%
Return on Assets 1.7% 7.6% 34.3% 44.8% 11.6%
Average revenue 0.0% 4.7% 20.9% 48.3% 26.2%
Operating margin 0.0% 5.2% 16.9% 48.8% 29.1%
Return on Equity 0.0% 2.3% 18.6% 49.4% 29.7%
Return on capital employed 0.6% 4.7% 14.0% 38.4% 42.4%
Net Profit 0.0% 5.2% 14.5% 44.8% 35.5%
Linearity between Firm Performance and Corporate Social Responsibility
Whilst there are a number of ways to check whether a linear relationship exists between the two
variables, Mertler and Reinhart (2016) suggested creating a scatterplot where the dependent variable is
plotted against the independent variable and then the scatterplot is visually inspected to check for
linearity. The researcher sought to find the linearity between Firm Performance and Corporate Social
Responsibility. The findings summarised in Figure 3 show that a strong positive linear relationship
existed between Firm Performance and Corporate Social Responsibility.
Figure 3: The linearity between Firm Performance and Liqudity
Nyamiobo et al. ….. ..Int. J. Business & Law Research 5(3):34-45, 2017
Ok
42
Correlation between the variables
The researcher generated a correlation matrix between the variables. The findings were presented in
Table 6. The table shows that CSR had an above average positive and statistically significant
correlation with firm performance.
Table 6: Correlation between the variables
Correlations
Firm Performance CSR Information
Firm Performance Pearson Correlation 1 .672**
Sig. (2-tailed) .000
N 172 172
CSR Information Pearson Correlation .672**
1
Sig. (2-tailed) .000
N 172 172
**. Correlation is significant at the 0.01 level (2-tailed).
Regression Analysis Regression analysis between the dependent variable (Firm Performance) and Corporate Social
Responsibility (Table 7) revealed that R2 was .452 implying that 45.2% of the total variability in the
dependent variable (Firm Performance) could be explained by Corporate Social Responsibility.
Table 7: Model Summary table of Firm Performance and CSR Information
Model Summary
Model R R Square Adjusted R Square
Std. Error of the
Estimate
1 .672a .452 .449 3.602
a. Predictors: (Constant), CSR Information
The anova Table 8 shows that there was a p-value of .000 meaning that there was statistically
significant influence of Corporate Social Responsibility on Firm Performance as p-value was less than
.05 threshold. This led to rejecting the null hypothesis that there is no significant influence of CSR
Information on financial performance of listed firms in Nairobi Securities Exchange.
Table 8: Anova Table of Firm Performance and CSR Information
ANOVAa
Model Sum of Squares df Mean Square F Sig.
1 Regression 1820.628 1 1820.628 140.308 .000b
Residual 2205.901 170 12.976
Total 4026.529 171
a. Dependent Variable: Firm Performance
b. Predictors: (Constant), CSR Information
From the Coefficients Table 9, Corporate Social Responsibility contributes a positive value of .447
that is statistically significant. This means that for every unit change in the dependent variable (Firm
Performance), Corporate Social Responsibility (X1) contributes a positive value of .447, hence the
model Y = 15.107 + .447X1.
Table 9: Coefficients Table for Returns on Assets and CSR Information
Coefficientsa
Model
Unstandardized Coefficients
Standardized
Coefficients
t Sig. B Std. Error Beta
1 (Constant) 15.107 1.457 10.371 .000
CSR Information .447 .038 .672 11.845 .000
a. Dependent Variable: Firm Performance
Nyamiobo et al. ….. ..Int. J. Business & Law Research 5(3):34-45, 2017
Ok

43
SUMMARY OF FINDINGS AND CONCLUSION
From the findings, 43.0% agreed that their organization has a written policy covering respect for
human rights, occupational health and safety, labour rights, environmental and anti-corruption issues.
A majority (45.3%) agreed that their organization's policy includes a commitment to meeting local
legal requirements and international standards, 44.8% agreed that their organization has appointed a
senior person(s) responsible for policies and plans related to issues covered by the Global Compact
principles, 41.9% agreed that their organization has defined and communicated roles and
responsibilities with regard to issues covered by the Global Compact principles, 39.5% agreed that
their organization has documented procedures to enable decisions to be made regarding issues covered
by the Global Compact principles, while 43.0% agreed that their organization donates time, in-kind or
financial contributions to the local community e.g. education and training, cultural and infrastructure
development. A 41.3% majority agreed that their organization takes action to realize local and/or
national development goals following consultations with the local community, 45.3% agreed that their
organization can demonstrate the impacts of its contribution and how these are aligned to the
organization's core and strategic issues, 45.9% agreed that their organization takes action in support of
broader UN goals and issues, such as the UN Millennium Development Goals (MDGs) on combatting
HIV, promoting education and women's rights, while a majority (41.9%) agreed that their organization
seeks to contribute to community development by entering into partnerships with a range of
stakeholders, including UN agencies, governments, civil society, labour, and other non-business
interests. Correlation analysis showed that CSR had an above average positive and statistically
significant correlation with firm performance at .672. Regression analysis between the dependent
variable (Firm Performance) and Corporate Social Responsibility revealed that R2 was .452 implying
that 45.2% of the total variability in the dependent variable (Firm Performance) could be explained by
Corporate Social Responsibility.
From the findings therefore, the study concluded that corporate social responsibility has a positive
effect on financial performance of listed firms in Nairobi Securities Exchange. In a similar study,
Waddock and Graves (1997) also found a significant positive relation between CSP index and
performance. Further, Joshi et al. (2007) concluded that there is a positive relationship between profit
making and social responsibility. Based on these findings, the study recommends that policy makers
and other stakeholders in the institutions under study identify ways to engage in and promote
meaningful CSR programs and activities for the long terms value of the company, its shareholders and
the community.
REFERENCES
Aupperle, K.E., Carroll, A.B. & Hatfield, J.D. (1985). An empirical examination of the relationship
between corporate social responsibility and profitability. Academy of Management Journal
28(2), pp.446-463.
Barnett, M.L., (2007). Stakeholder Influence Capacity And The Variability of Financial Returns To
Corporate Social Responsibility, Academy Of Management Review, 32(3), pp.794-816.
Belkanoui, A. & Karpik, P.G. (1989). Determinants of Corporate Decision or Disclosure Social
Information, Accounting, auditing and accountability Journal, 2 (1): 36-51.
Bonett, D. G., & Wright, T. A. (2015). Cronbach's alpha reliability: Interval estimation, hypothesis
testing, and sample size planning. Journal of Organizational Behavior, 36(1), 3-15.
Bowen, H.R. (1953). Social Responsibilities of Businessman, Harper & Brothers, New York. NY.
Buiten, M. (2012).The Role of Enforcement Mechanisms for Corporate Governance in India.
Gandhi Institute of Development Research, Mumbai, India.
Capital Markets Authority. (2012). How Does the Stock Market Work? Retrieved from
http://www.cma.or.ke/index.php?option=com_content&task=view&id=10&Itemid=36.
Carroll, A. B. (1991). The Pyramid of Corporate Social Responsibility: Toward the Moral
Management of Organizational Stakeholders, Business Horizon, 34(4), pp.39-48.
Chenhall, R.H. & Euske, K.J. (2007). The Role of Management Control Systems in Planned
Organizational Change: An Analysis of Two Organizations. Accounting, Organizations and
Society, 32, pp. 601-637. Performance measures. European Management Journal, 25(4), pp.
266-282.
Nyamiobo et al. ….. ..Int. J. Business & Law Research 5(3):34-45, 2017
Ok

44
Cho, E., & Kim, S. (2015). Cronbach’s coefficient alpha: Well known but poorly
understood. Organizational Research Methods, 18(2), 207-230.
Cornell, B. & Shapiro, A.J. (1987). Corporate stakeholders and corporate finance. Financial
management, pp. 5-14.
Crabtree, A.D. &DeBusk, G.K. (2008). The effects of adopting the balanced scorecard on shareholder
returns. Advances in Accounting, 24(1), pp. 8 – 15.
Djalil (2003). Good Corporate Governance: Kelemahan Fundamental Makiroekonomi. Indonesia
www.BusinessDictionary.com
Donaldson, T., & Preston, L.E. (1995). The stakeholder theory of the modern corporation: concepts,
evidence and implications. Academy of Management Review, 20, pp. 65-91.
Faraway, J. J. (2016). Extending the linear model with R: generalized linear, mixed effects and
nonparametric regression models (Vol. 124). CRC press.
Fraquelli, G. & Vannoni D. (2000). Multidimensional performance in telecommunications regulation
and competition: Analysing the European major players. Information Economics and policy.
12(1), 27-46.
Freeman, R.E. (1984). Strategic management: A stakeholder perspective. Englewood Cliffs: Prentice
Hall USA.
Friedman, M. (1982). Monetary policy: Theories and practice, The Journal of Money, Credit and
Banking, Vol. 14(1), 98-118.
Ghasemi, A., & Zahediasl, S. (2012). Normality tests for statistical analysis: a guide for non-
statisticians. International journal of endocrinology and metabolism, 10(2), 486-489.
Griffin, J.J., & Mahon, J.T. (1997). The Corporate Social Performance and Corporate Financial
Performance Debate, Business and Society, 36, 5-32. Grossman, S., and Hart, O. (1983).An
Analysis of Principal-Agent Problem. Econometrica 51: pp. 7-45.
Hasseldine, J., Salama, A. I. &Toms J. S. (2005). Quantity versus Quality: The Impact of
Environmental Disclosures On The Reputations Of UK PLCS‟, The British Accounting
Review, 37(2), pp. 231-248.
Itter, C.D., Larker, D.F. & Rajan, M.V. (1997). The choice of performance measure in annual bonus
contracts. The Accounting Review, (April 1997). pp. 231-255.
Jooh, L., Niranjan, P., Roh, J.J. (2010). Relationship between Corporate Sustainability Performance
and Tangible Business Performance: Evidence From Oil and Gas Industry. ISBIT, 3, sp. Iss. 3
January 2011.
Josh, M., Joshi, N., and Joshi, V. (2007). Business War: Competitive Innovation Velocity. Ewing
Marion Kauffman Foundation.
Kamau, C. G., Namusonge, G. S., & Bichanga, W. O. (2016). Creative Accounting among
Corporations Listed in NSE: Sector Analysis. The International Journal of Business &
Management, 4(1), 161.
Krzywinski, M., & Altman, N. (2014). Points of significance: visualizing samples with box
plots. Nature methods, 11(2), 119-120.
Kusumadilaga, R. (2010). Pengaruh Corporate Social Responsibility. Journal FE UNS. Semarang.
Lai, C.S.; Chiu, C.J.; Yang, C.F.; Da. C. (2010). The Effects of Corporate Social Responsibility on
Brand Performance: The Mediating Effect Of Industrial Brand Equity and Corporate
Reputation. Journal of Business Ethics, 95:pp.457-469.
Langfield – Smith, K. (2007). A Review of Quantitative Research in Management Control Systems
and Strategy. In: Chapman, C.S., Hopwood, A.G. Shields, M.D. (Eds.). Handbook of
Management Accounting Research, Vol. 1 Elsevier, Oxford, U.K. pp. 753-784.
Leech, N. L., Barrett, K. C., & Morgan, G. A. (2014). IBM SPSS for intermediate statistics: Use and
interpretation. Routledge.
Mackey, A., Mackey T. B., &Barney J. B. (2007). Corporate Social Responsibility and
Firm Performance: Investor Preference and Corporate Strategies, Academy of Management
Journal, 32(3), pp.817-835.
Mertler, C. A., & Reinhart, R. V. (2016). Advanced and multivariate statistical methods: Practical
application and interpretation. Routledge.
Nyamiobo et al. ….. ..Int. J. Business & Law Research 5(3):34-45, 2017
Ok

45
Mitchell, R.K., Agle, B.R., & Wood, D.K. (1997). Toward a Theory of Stakeholder Identification and
Salience: Defining the Principle of Who and What Really Counts. Academy of
Management Review, 22: 853-886.
Montgomery, D. C., Peck, E. A., & Vining, G. G. (2015). Introduction to linear regression analysis.
John Wiley & Sons.
Mwangi C. I. (2013). The Relationship between Corporate Social Responsibility Practices and
Financial Performance of Firms In The Manufacturing, Construction and Allied Sector Of The
Nairobi Securities Exchange. International Journal Of Business, Humanities And Technology.
Nkaiwatei, A.O. (2011). Relationship between Social Accounting Practices and Profitability: The
Case of Oil Industry in Kenya, Unpublished Thesis, University of Nairobi.
Ocloo, C. E., Akaba, S., & Worwui-Brown, D. K. (2014). Globalization and competitiveness:
Challenges of small and medium enterprises (SMEs) in Accra, Ghana. International Journal
of Business and Social Science, 5(4).
Parker, I.R. & Eilbirt, H. (1975). Social Responsibility: The Underlying Factors, Business Horizon,
18, 4 pp.5-10
Preston, L. E., & O'bannon, D. P. (1997). The corporate social-financial performance relationship: A
typology and analysis. Business & Society, 36(4), 419-429.
Rettab, B., Brik, A. B., & Mellahi, K. (2009). A study of management perceptions of the impact of
corporate social responsibility on organisational performance in emerging economies: the case
of Dubai. Journal of Business Ethics, 89(3), 371-390.
Schmukler, S. L. (2004). Financial globalization: gain and pain for developing countries. Economic
Review-Federal Reserve Bank of Atlanta, 89(2), 39.
Siljanen, M. (2012). The Evolution of Securities Lending and Risk Mitigation: A Finnish Market Case
Study.
Toms, J.S. (2002). Company Resources, Quality Signals and The Determinants of Corporate
Environmental Reputation: Some UK Evidence‟, The British Accounting Review, 34(3),
257-282.
Tsang, E.W.K. and Kwan, K. (1999). Replication and Theory Development in Organizational Science:
A Critical Realistic Perspective. Academy Of Management Review 24(4), 759-780.
Waddock, S.A., Graves, S.B., (1997). The Corporate Social Performance – Financial Performance
Link. Strategic Management Journal, 18(4):303-319.
Wanjala, D.N. (2011). Factors Influencing the Practice of Corporate Social Responsibility by
Commercial Banks in Kenya, Unpublished Thesis, University of Nairobi.
Nyamiobo et al. ….. ..Int. J. Business & Law Research 5(3):34-45, 2017
Ok