the role of customer engagement in innovation adoption · project selection ... the role of...
TRANSCRIPT

THE ROLE OF CUSTOMER ENGAGEMENT IN INNOVATION ADOPTION
THESIS
Scott A. Skiple
DR-III (GS-14), DAF
AFIT-ENV-12-D-01
DEPARTMENT OF THE AIR FORCE AIR UNIVERSITY
AIR FORCE INSTITUTE OF TECHNOLOGY
Wright-Patterson Air Force Base, Ohio
DISTRIBUTION STATEMENT A
APPROVED FOR PUBLIC RELEASE; DISTRIBUTION UNLIMITED.

The views expressed in this thesis are those of the author and do not reflect the official
policy or position of the United States Air Force, the Department of Defense, or the
United States Government. This material is declared a work of the U.S. Government and
is not subject to copyright protection in the United States.
AFIT-ENV-12-D-01
THE ROLE OF CUSTOMER ENGAGEMENT IN INNOVATION ADOPTION
THESIS
Presented to the Faculty
Department of Systems and Engineering Management
Graduate School of Engineering and Management
Air Force Institute of Technology
Air University
Air Education and Training Command
In Partial Fulfillment of the Requirements for the
Degree of Master of Science in Research and Development Management Management
Scott A. Skiple, BS
DR-III (GS-14), DAF
December 2012
DISTRIBUTION STATEMENT A
APPROVED FOR PUBLIC RELEASE; DISTRIBUTION UNLIMITED.

AFIT-ENV-12-D-01
THE ROLE OF CUSTOMER ENGAGEMENT IN INNOVATION ADOPTION
Scott A. Skiple, BS
DR-III (GS-14), DAF
Approved:
_/signed/____________________________ _17 Dec 2012__
Alfred E. Thal, Jr., PhD (Chairman) Date
_/signed/____________________________ _17 Dec 2012__
Alok Das, PhD (Member) Date
_/signed/____________________________ _14 Dec 2012__
David E. Shahady (Member) Date
_/signed/____________________________ _13 Dec 2012__
David Fass, PhD (Member) Date

iv
AFIT-ENV-12-D-01
Abstract
Full knowledge of a customer’s true unmet need should improve the likelihood of
providing that customer with an option that meets the need. Since there is inherent risk in
making any change, that customer will be more likely to accept the risk the more they
understand the option. Both the customer and the solution provider possess knowledge
that the other needs, knowledge which is often highly contextual and difficult to transfer,
and thus a sufficiently close relationship between the customer and the solution provider
should improve this knowledge transfer. It is, however, exceedingly difficult to measure
this relationship, or the level of understanding achieved, and its impact on the adoption of
an innovative solution due the wide range of conditions under which change takes place.
There is a concern that involving the customer will tend to lead to more constraints and
desires being expressed by the customer. Projects conducted under the U.S. Air Force
Core Process Three (CP-3) program, which share a number of common traits, served as
the basis for this research in isolating the effect of customer engagement on innovation
adoption. Technologists in CP-3 projects were surveyed for their assessments of
customer engagement, their own understanding of the customer’s true need, and the risk
they felt the customer was willing to accept. This research showed that customer
engagement does lead to an increase in the understanding of the need and, further, that
higher levels of engagement lead to a convergent customer “voice” that does not result in
an increase in customer requirements.

v
Acknowledgements
I would first like to thank my advisor, Dr. Al Thal, for his continued support over
the past five years and two curriculum changes. Your advice and honesty was always
what I needed, your sense of humor was always appropriate, and your smile was always
welcome.
I sincerely thank the members of my committee: Dr. Alok Das, for his support
and interest in this research; David Shahady, for his rapport and counsel; and Dr. David
Fass, for his insight and always spot-on ideas.
I must also thank Dr. Michael Stallard, without whose assistance, over many long
phone calls and emails, this thesis would have been absolutely impossible.
Two of my previous supervisors, Mr. Frank Albanese and Mr. Chris Remillard,
went well beyond simple encouragement in their support in my pursuit of this degree, and
for that I am eternally grateful.
Finally, of course, to my wife, for putting up with my many moods and
“absences,” just know that when I count my blessings I count you twice.
Scott A. Skiple
“Even if I knew that tomorrow the world would go to pieces,
I would still plant my apple tree.” – Martin Luther

vi
Table of Contents
Page
Abstract .............................................................................................................................. iv
Acknowledgements ..............................................................................................................v
List of Figures .................................................................................................................. viii
List of Tables ..................................................................................................................... ix
I. Introduction ....................................................................................................................1
Background ....................................................................................................................2
Problem Statement .........................................................................................................9
Research Questions ......................................................................................................10
Methodology ................................................................................................................11
Assumptions and Limitations ......................................................................................12
II. Literature Review.........................................................................................................14
Why, when and how customers interact with solution providers ................................14
Dynamics of change (innovation trajectories) .............................................................19
Characterizing the level of customer engagement .......................................................24
The mechanics of bringing customers and solution providers together ......................25
III. Methodology ................................................................................................................31
Survey design ...............................................................................................................31
Survey population ........................................................................................................35
Project selection ...........................................................................................................36
Questionnaire deployment and assessment ..................................................................37
IV. Results ..........................................................................................................................40
Project selection ...........................................................................................................40
Project Manager interviews .........................................................................................42
Questionnaire deployment and response .....................................................................43
Questionnaire results ....................................................................................................44
Discussion ....................................................................................................................51
vii
V. Conclusions and recommendations..............................................................................55
Research insights .........................................................................................................55
Limitations of the research ...........................................................................................58
Future research .............................................................................................................59
Summary ......................................................................................................................60
Bibliography ......................................................................................................................62
Vita .....................................................................................................................................68

viii
List of Figures
Figure Page
1. Iterative Problem-solving Pattern Often Encountered
in New Product and Service Development ..................................................................17
2. S-Curve ........................................................................................................................21
3. The Conventional Technology S-Curve ......................................................................22
ix
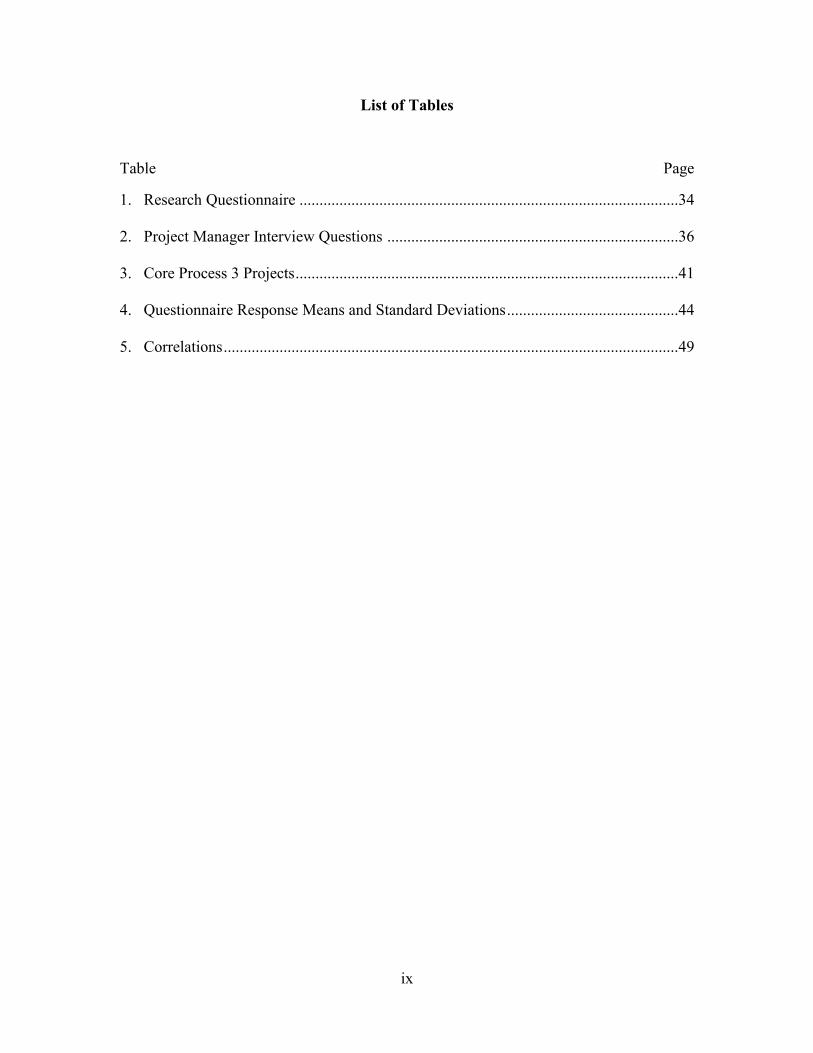
List of Tables
Table Page
1. Research Questionnaire ...............................................................................................34
2. Project Manager Interview Questions .........................................................................36
3. Core Process 3 Projects ................................................................................................41
4. Questionnaire Response Means and Standard Deviations ...........................................44
5. Correlations ..................................................................................................................49
THE ROLE OF CUSTOMER ENGAGEMENT IN INNOVATION ADOPTION
I. Introduction
To innovate is to change, but change is rarely easy, even when the case is
compelling. To abandon the status quo means recognizing that some other option will
provide an improvement and believing that the improvement will justify the cost of
change. Developing those options – that is, providing a solution to a customer’s need – is
the function of every business. The customer must of course be aware that the option
exists and that it may be improved through a better understanding of the true nature of the
need. Therefore, involving the customer in the solution development process should
logically lead to increased awareness of options, improved solutions, and increased
adoption rates. The effect, unfortunately, is difficult to assess since solution development
and adoption often take place under a vast range of conditions, thereby making direct
measures of any aspect of the process problematic at best.
Under the Air Force Research Laboratory (AFRL) Core Process 3 (CP-3)
program, customers and technologists are brought together for short-term projects, to
address documented and important needs, under relatively standard conditions. This
presents an ideal opportunity to characterize a number of specific factors related to the
problem-solution process. This research specifically investigated (1) the relationship
between the level of interaction with the customer and how well the problem is
understood by the project team and (2) the propensity of the customer to accept the
option developed by the team.
2
Background
Innovation means change
Innovation has been defined as invention plus exploitation (Roberts, 1988).
Something can be technologically groundbreaking, but unless and until it is employed by
some end-user to meet a previously unmet need – i.e., it is exploited – it is nothing more
than technology “on the shelf.” The need remains unmet and the potential unrealized.
There is nothing particularly new or modern about the concept. An individual or a group
recognizes, develops, and implements an adaptation to differentiate them from other
groups. If this differentiation confers a competitive advantage, the individual or group is
more likely to be successful. In the natural world, the species reproduces; in the business
world, the firm persists. For example, stone tools set apart Homo habilis from his
contemporaries and Wal-Mart’s logistics model enabled it to vault over every other
retailer in the world.
In the natural world, any adaptation is the result of chance, and the individual is
left to play the hand they are dealt. In contrast, a conscious act of change is required in
the business world if any adaptation is to be exploited. It is more than simply awareness
of the need to change and is more than even the act of making a decision, since deciding
not to change is likely an option. A potential innovation “customer” can be considered to
be an individual or group with some unmet need that also is willing to consider a change
in order to address that need. When considering the necessary change, this customer
must be sufficiently convinced that the change will be worth the cost.
3
Some customers change, some do not
Firms may actively seek to innovate as a means to create value in ways that are
either more efficient than other firms or differentiates them from competing firms. As
such, innovation becomes a means of tilting the playing field. This advantage may be
realized by adopting some change in behavior, utilizing some object which provides
physical leverage, or perhaps nothing more than making some observation that improves
the ability to predict the future. The customer might methodically investigate the
problem and possible solutions or may simply stumble upon a promising adaptation.
The adaptation presents some value proposition for the potential adopter, thereby
promising a competitive advantage or merely survival. As a forecast of some possible
future condition, however, that value proposition contains some degree of uncertainty
and, therefore, must be compelling if it is to convince the customer to change. In short,
moving from simply being aware of a potential solution to making the conscious decision
to adopt that approach requires some leap of faith.
Some options are accepted, some are not
The system in use by the customer at some earlier time likely had a level of
performance superior to that of competitors’ systems, which provided the firm with a
competitive advantage where there had previously been a level playing field. However,
the superior performance of that system naturally leads to competitors either dying out,
adopting the same or similar systems, or developing some innovative approach of their
own. In any case, this eventually leads to a reduction or outright elimination of the
original competitive advantage, and the playing field is again level, if not tilted against
4
the firm. This relative lack of performance exhibited by the incumbent system then
becomes a new “need” necessitating a solution.
There may be some performance margin available to be exploited within the
incumbent system by making small changes in operation, materials, timing, etc. As time
goes on, however, incremental changes to the existing system become less simple and
less cost-effective. With a reduced performance margin available to exploit, viable
solutions will increasingly involve the use of some entirely new system or approach.
This is classic “radical” or discontinuous innovation described by Foster (1986). Being a
new system or approach, however, the user will be to some degree less familiar with it.
Likewise, the manufacturer or supplier of products not previously used in that arena will
likely be unfamiliar with the true needs of these prospective new users and may not know
these potential customers even exist. Any efforts to bring these two parties together, in
order to increase awareness of the other’s perspectives and experiences, should be of
considerable benefit to both parties.
There are two general models by which these perspectives are shared. In the
“requirements pull” model, the customer acknowledges the aspect of their environment is
in need of improvement, generally in performance or efficiency, and investigates the
available options. In contrast, under the “technology push” model, some invention vies
for the attention of prospective adopters in the open marketplace. To become a true
innovation, such novel ideas must actually be exploited. Very few inventions would ever
be considered successes under this metric. The United States (U.S.) Patent and Trade
Office issued 224,505 patents in calendar year 2011 (USPTO, 2012). In rough terms,
there is one idea patented every two and a half minutes. Yet there are estimates that as
5
many as 95% of all patented technologies will never become a marketable product or
process (Chesbrough, 2011).
Engaging the customer to influence change
It is ultimately the user who makes the choice whether or not to adopt a given
innovation. A primary indicator of whether or not the user will make the required leap of
faith will be the level of uncertainty regarding the ability of the proposed solution to
provide the needed performance (Rogers, 2003). This is of course highly subjective, and
in general it would be expected that the likelihood of adopting a proposed solution will
increase as the user’s familiarity with the proposed innovation increases. In incremental
innovation, where the user will be relatively comfortable with the technology and likely
have a good appreciation for the risks and rewards involved in adopting it, the decision to
adopt is more straightforward. However, the user may be able to quantify the cost of
change and the benefit received to a reasonable degree of confidence. The decision to
adopt a discontinuous innovation, which will have much more uncertainty on both sides
of the ledger, may leave the user much less confident that the benefit will be worth the
cost.
The user of any product or process is often well positioned to innovate. In fact,
users have been shown to be very successful innovators in a wide range of fields
(Schreier and Prugl, 2008; von Hippel, 1976; Morrison et al., 2000; Franke and Shaw,
2003). Users possess tacit knowledge – knowledge that cannot easily be codified – of the
operational environment, the shortcomings of the system in use, and trends that may
potentially alter the competitive landscape (von Hippel, 1986, 2005). Faced with a lack
of alternatives, such a user may be highly motivated to physically alter the system or use
6
the system in a manner not originally intended by the manufacturer in order to regain a
competitive advantage.
There is widespread agreement that customer awareness is an important predictor
of new product success (Cooper, 1979; Maidique and Zirger, 1984; van der Panne et al.,
2003). Actively soliciting user feedback has been shown to increase customer
satisfaction (Esteves, 2003), but simple market research often does no more than justify
the direction already taken by the firm (Enkel et al., 2005). Solving problems frequently
involves anticipating patterns based on existing knowledge and leaping ahead to the
answer without a thorough understanding of the problem (Reusser, 1988).
In many instances, firms think they know their customers, and customers think
they know their options. The customer acknowledges some unmet need and is willing to
consider change. The technologist may have a lower-level understanding of the true
nature of the specific need but a higher-level understanding of the performance
limitations of other systems. Bringing the two parties together should improve the
ability of each to more fully communicate their tacit knowledge to each other.
Engaging the customer may have other consequences, however. As the level of
engagement is increased, the technologist may well find that the customer develops a
more divergent “voice,” whereby the customer need becomes less clear; extraneous
details may be brought to light and erroneous information may be more likely to be
introduced into the discussions. The customer may be more apt to dwell on exceptions
and unusual situations than routine operations.
7
Isolating factors that influence change
Characterizing any facet of the innovation process and its impact on adoption is
problematic due to a wide variation in the environments under which innovations take
place. Innovations emerge under a wide variety of business climates and a great deal of
uncertainty. For this reason, there is no standard “timetable” or formula by which an
adaptation will either succeed or fail in propagating itself in the general population.
Novel ideas that succeed can take decades to take hold, or they can “go viral” in very
short order.
Innovations are by their very nature unique events, which are the result of a wide
variety of boundary conditions and variables. Studying the adoption of a given
adaptation is complicated by the wide variation in scope, switching costs, and even
societal norms involved in bringing about changes in behavior. The conditions are never
the same in any two cases. This makes the study of innovation adoption uniquely
challenging.
The literature tends to look at “success stories,” and while characterizing the
variables in these cases may indeed prove useful, such analyses may lead to identifying
characteristics common to success and failure alike (van de Ven, 1986). For example, a
firm successful at innovating may have an organizational climate that is supportive of
creativity, but so might an unsuccessful firm. Such characteristics may very well
represent a “necessary but insufficient” condition and be viewed at best as prerequisites
for success and not differentiators.
There are also political and other factors totally unrelated to the technology that
often influence whether or not a specific solution is adopted. Anecdotal evidence
8
abounds of weapon system development programs in the militaries of the U.S. and other
countries swayed by parties not familiar with the details of either the technology or the
operational environment. In such cases, the end result can be almost totally unrelated to
the adequacy of the proposed solution in meeting the need of the customer.
Information flow can widely vary. In many industries, trade secrets may be so
highly valued that all related information is purposely kept away from customers under
the fear of disclosure to rival firms. In the military, information on threats and specific
weapon vulnerabilities may often be classified and therefore not available to all parties.
In general, a lack of complete and unconstrained access to all the relevant information
will impact the ultimate decision.
Core Process Three (CP-3)
Genetic research involves the comparison of physiological characteristics
separated by generations. Use of the common Fruit Fly, Drosophila melanogaster, in
genetic research dates to the famous “Fly Room” at Columbia University in 1910 where,
despite their obvious limitations as proxies for humans, they were found to be easy and
inexpensive to care for and bred quickly. Similarly, Christensen (1997) was successful in
isolating business adaptations through the study of the computer hard disk drive industry
and states that “if you want to understand why something happens in business, study the
disk drive industry. Those companies are the closest things to fruit flies that the business
world will ever see." Adequately characterizing innovation adoption requires a sample
population as controllable as the fruit fly is in genetic research.
There are no fewer than 34 initiatives in the Department of Defense that address
“urgent warfighter needs.” Among those is the AFRL Enterprise Core Process Three
9
(CP-3). Under this initiative, projects are set up to focus science and technology efforts
in an attempt to accelerate development and demonstration of technology that addresses
near-term warfighter needs (AFLRI 90-104, 2010). These initiatives are constrained in
time and involve both users and technologists in the development of a solution to the
stated need.
Focusing on CP-3 projects in the study of the adoption of innovation offers
advantages akin to those of fruit flies in genetics and disk drives in business. First, all
CP-3 projects are similar in scope. Their costs are relatively small and their timelines are
very consistent, especially when compared to the general population of innovation
stories. Second, CP-3 projects involve motivated users. These projects are established to
address identified “urgent warfighter needs,” which are top priorities of the Air Force
members in the field. Therefore, these needs have been vetted, prioritized, analyzed, and
briefed at high levels in the services. They are not gee-whiz, nice-to-have gadgets or
some other “toy” representing the latest fashionable buzzword. Lastly, CP-3 projects
focus on problems that have avoided conventional solutions. Therefore, it can be safely
assumed that the potential for improvement through incremental, sustaining innovation
has been nearly exhausted. This implies that any solution to the need must lie outside the
status quo and that a radical innovation is the only way forward. This drives a need to
involve both users and technologists working together in an environment that will
facilitate the exchange of tacit information in order to reduce uncertainty.

10
Problem Statement
It is exceedingly difficult to measure customer involvement and assess its impact
on adoption in the innovation process. Involving a motivated customer in the solution
development process should increase the propensity of that customer to adopt a solution
other than an incremental improvement to the current system, however, evidence as to
whether or not this necessarily takes place has not as yet been clearly demonstrated.
Characterizing the salient aspects of customer involvement should confirm the existence
of any links between the level of understanding of the user’s need attained by the
technologist and whether there is any impact on the user’s acceptance of a solution option
which the user was unable to identify and/or develop on their own.
Research Questions
The exchange of tacit information is important to both enhancing the
technologist’s understanding of the user’s true need (whether articulated or unarticulated)
and the user’s understanding of the possibilities and limits of novel technological
approaches. Under CP-3, technologists and users interact, which should facilitate this
exchange of information. Furthermore, these projects are accomplished under a
consistently repeated structure. By defining the following constructs, the efficacy of this
interaction can be assessed.
1. Customer engagement: the technologist’s assessment of the degree to which the
customer was involved during the CP-3 project.
2. Customer unity of voice: the technologist’s assessment of the consistency of the
feedback provided by the customer.
11
3. Problem understanding: the technologist’s assessment of how well they
appreciated the needs of the user.
4. Confidence in solution: the technologist’s assessment of their own confidence
that the option or options provided would adequately meet the user’s need.
5. Level of innovation: the technologist’s assessment of the nature of the option
proposed to the user by the technologists as a departure from the incumbent
system or approach, i.e., how large of a “leap of faith” was required to accept the
proposed solution option.
Through the measurement of these five constructs, relationships can be assessed in order
to identify the specific observed effects within the CP-3 projects. The following
investigative areas were identified.
1. Does an increase in customer involvement within a CP-3 project result in an
increase in the technologist’s understanding of the customer’s need?
2. Does in increase in customer involvement within a CP-3 project result in a more
divergent customer “voice?”
3. Does a more divergent customer “voice” within a CP-3 project result in a
decrease in the technologist’s understanding of the customer’s need?
4. Does an increase in the technologist’s perceived understanding of the customer’s
need within a CP-3 project result in an increase in confidence of the solution
option’s ability to adequately meet the user’s need?
5. Does a more divergent customer “voice” within a CP-3 project result in a
decrease in confidence of the solution option’s ability to adequately meet the
user’s need?
6. What are in effects of customer involvement, convergence/divergence of
customer “voice,” understanding of user need, and confidence in the solution on
the level of technical change proposed and accepted by the customer within a CP-
3 project?
12
Methodology
This research is focused on the 18 CP-3 projects that have been completed to date
by AFRL. These relatively consistently structured projects present an opportunity to
characterize the involvement of users and inventors working toward a common goal and
assess the degree of agreement among members of the team. To that end, a questionnaire
was prepared for the technologists to assess the five constructs defined above. The
working relationship between the technologist and the end-user was analyzed to
determine the degree to which the measured characteristics of that relationship influence
the acceptance of a solution to a stated problem. Specifically, measures of customer
engagement and the degree to which the customer’s voice was unified were correlated
with measures of problem understanding and level of innovation.
Assumptions and Limitations
All CP-3 projects require validated, documented user need. The user, familiar
with the incumbent technology, has therefore previously assessed incremental
innovations and found it lacking. It was assumed, therefore, that the user was sufficiently
motivated and that the technological solution(s) investigated were radical as opposed to
incremental. Furthermore, no attempts were made to judge the wisdom of the user’s
eventual decision.
The CP-3 program has only been in existence for a few years, with only two or
three projects approved per year. Finding the participants involved a fair amount of
legwork, and some participants could understandably not be found or were otherwise
13
unavailable to be interviewed. Overall, a reasonable number of participants were
ultimately contacted and agreed to participate in this research.
It should be noted at this point that no attempt was made to measure the eventual
adoption or diffusion of any innovation. Within the firm, priorities must compete for the
scarce resources needed to field a new system or modify a fielded system. Far too many
variables unrelated to the other merits of the project are involved, and as these are
relatively recent efforts, some may not have had enough time to be fielded.
Finally, this research is not in any way intended to be an evaluation or assessment
of the CP-3 program overall or any specific project under the CP-3 framework. The
projects were investigated in aggregate from the perspective of their unique and relatively
consistent program structure, which provided a means to control for other variables. The
goal was to characterize customer engagement on as normalized of a scale as possible.
Case studies of any individual CP-3 projects were therefore not attempted.
14
II. Literature Review
In defining a customer as the individual or group with some acknowledged unmet
need who is willing to consider change to meet that need, this research is primarily
interested in those factors which influence the ultimate decision of whether or not to
change. The following is presented as a summary the more germane aspects of adoption
models, which consider only a single decision, rather than diffusion models, which view
patterns of adoption through many users (Frambach and Schillewaert, 1999). Topics
addressed include the advantages and implications of direct customer involvement in the
need-solution process, the factors that influence the motivation to innovate (i.e., the “leap
of faith” necessary to abandon the status quo), methods of characterizing customer
engagement, and the process of bringing customers and solution providers together.
Why, when, and how customers interact with solution providers
The importance of customer awareness to firm success is well represented in the
literature. Simply spending increasing amounts of the firm’s resources on research and
development (R&D) is far from a guarantee of increasing profitability; the very act of
measuring and rewarding internal research will tend to encourage the allocation of
resources to internal ideas, thereby resulting in an increase in the size of the research arm
of the firm without necessarily improving innovation performance (Hauser and
Zettelmeyer, 1996). A strong customer focus within and through the firm is often a
competitive advantage in and of itself (Hendard and Szymanski, 2001; van der Panne et
al., 2003). Further, relying only on internal market research does little more than confirm
15
existing biases and does not typically reveal latent, unarticulated customer needs (Enkel
et al., 2005).
In the traditional view of the firm, the only role that a customer has to play in the
innovation process is to have a need. The manufacturer’s responsibility is to identify and
fill that need by producing a new product or improving an existing product (von Hippel,
2005). However, soliciting feedback from users at points during the new product
development process has been shown to be beneficial to success (Rollins and Halinen,
2005; Lettl, 2007; Esteves, 2003).
Specialized knowledge is a key strategic resource of the firm; more to the point,
information asymmetries are exploited by successful firms. Having acquired knowledge
which may lead to a competitive advantage, the firm will in most cases put safeguards in
place, perhaps through patents or otherwise protecting it as a trade secret, in order to keep
that knowledge from being transferred to anyone outside, and often within, the firm. This
is not a universal approach, as there are sources of external knowledge besides the end-
user. In fact, the entire field of open innovation is based on the insight that it is not
always practical for a firm to simply accumulate all the knowledge it needs internally
(Chesbrough, 2003).
A great deal of study has been devoted in recent decades to how readily such
information is transferred. Eric von Hippel coined the term “sticky information” (1994)
to describe information that has a “cost” associated with its transfer from one individual
to another. Tacit information will naturally be more costly to transfer than explicit,
codified information. Especially with cutting edge technologies, knowledge may not be
16
well codified or even able to be codified, in which case it can only be passed on by
example.
There are things that we know but cannot tell. This is strikingly true for
our knowledge of skills. I can say that I know how to ride a bicycle or how
to swim, but this does not mean that I can tell how I manage to keep my
balance on a bicycle or keep afloat when swimming. I may not have the
slightest idea of how I do this, or even an entirely wrong or grossly
imperfect idea of it, and yet go on cycling or swimming merrily. Yet, it
cannot be said that I know how to bicycle or swim and not know how to
coordinate the complex pattern of muscular acts by which I do my cycling
or swimming. It follows that I know how to carry out these performances
as a whole and that I also know how to carry out the elementary acts
which constitute them, but that, though I know these acts, I cannot tell
what they are. (Polanyi, 1962)
Stickiness can also be high, and difficult to transfer, when there is a large amount of
information available, not all of which is germane to the problem but which is not known
beforehand (von Hippel, 2005). For example, the operational environment of a product
may consist of a huge number of variables, many of which influence the performance to
no more than a negligible extent. Vernacular language and “balkanization” along
specializations in both technology and the user communities can further serve to keep
tacit information accessible to only those inside their respective communities (Brown and
Duguil, 2001).
Often the information needed to solve a problem will initially reside in two
distinct locations. For example, information about the need is initially located entirely at
the user’s site, while information pertaining to products resides with the manufacturer or
supplier. A need is encountered, a potential solution is proposed, and the solution tested.
If this information is “sticky,” however, a pattern emerges in which the problem solving
process takes the form of an iterative, trial-and-error proposition, as shown schematically

17
in Figure 1 (von Hippel, 1994). Rather than transferring the sticky information between
the two directly, it is less “costly” to develop a prototype that can be modified until the
user finds it to have acceptable characteristics (von Hippel, 1994).
Figure 1. Iterative Problem-solving Pattern Often Encountered in New Product and
Service Development (von Hippel, 1994)
The term “user” in innovation studies denotes, strictly speaking, the individual or
organization which benefits from using a product, whereas the manufacturer benefits
from selling the product. There are many instances where users have developed products
and processes that became commercially successful (Schreier and Prugl, 2008). For
example, von Hippel (1976) found that over 80% of the innovations in scientific
instruments were made by users and not manufacturers. In fields as varied as library
18
information systems and extreme sports, a significant proportion of innovations have
been shown to be user developed (Morrison et al., 2000; Franke and Shaw, 2003).
The motivation for users to innovate may be strong for a number of reasons. A
small market may not be sufficiently attractive to manufacturers to justify investing in a
new product development project (von Hippel, 2005). The more unique the need, in fact,
the more advantageous it will be for the customer to develop a new product (von Hippel,
2004). Similarly, it has been documented that when available, users are often willing to
pay extra for custom products, as opposed to “one-size-fits-all” offerings (Franke and von
Hippel, 2003).
As a consequence of the stickiness of information discussed above, different
players in the innovation process will each tend to rely upon the knowledge they already
have. As a result, users on their own will tend to develop innovations that provide new
functions. In contrast, manufacturers, who lack the contextual knowledge of the user,
will tend to develop innovations that improve the performance, convenience, or reliability
of existing functions (von Hippel, 2005).
Lead users are a special class of user that exhibit two general qualities. First, they
experience needs or performance issues before the bulk of the marketplace will. Second,
they will benefit substantially from any solution to that need. This makes lead users
much more amenable to innovation (von Hippel, 1988). Lettl (2007) further
differentiates “technology lead users” who will not necessarily benefit more but do,
however, recognize the relevance and benefit of new technology much earlier than
manufacturers and other users. As users involved in innovation rely on their own
experience, there is a natural disposition to focus on improving the product with which
19
they are already familiar, a behavior von Hippel called “user fixedness” (1986).
However, lead users also have the potential to develop radical innovations and possess
the motivation to adopt them (Enkel et al., 2005).
Dynamics of change (innovation trajectories)
As an innovation is new to the end-user, the act of adopting an innovation
involves a conscious action. In other words, the user must decide to abandon the status
quo. In order to achieve a sufficiently high level of motivation, the user will need to be
convinced that the switching costs are lower than the anticipated benefits that will result
from implementing the change (Lettl, 2005). Adoption can then, in essence, be viewed as
the end-result of the decision-making process, beginning at the point in time when an
individual is first aware of an innovation and ending with implementation of the
innovation (Rogers, 2003, 1995).
The differences between innovation, invention, and creativity have been well
established. Innovation has been defined variously as “invention plus exploitation” and
"an idea, practice, or object that is perceived as new by an individual or other unit of
adoption" (Rogers, 2003). Something is only innovative if it adds customer value to the
marketplace. An invention may be novel and the result of brilliant insight, but it is not in
itself an innovation unless it meets and is put into use to address a need (Carlson and
Wilmot, 2006). A product moving from research into production, at the same time
adding some value to the firm (even if only cost savings), would be considered an
innovation. Innovation thus differs from invention in that it “provides economic value
and is diffused to other parties beyond the discoverers” (Garcia and Calantone, 2001).
20
Certainly, creative solutions to both articulated and unarticulated needs abound, but all
such approaches are inconsequential if not adopted.
From the perspective of the firm, which exists only to satisfy the customer
(Drucker, 1967), some competitive advantage is necessary for superior performance
(Porter, 1980). It follows that innovation should be a fundamental determinant of firm
performance (Rogers, 2003). Superior performance, then, is simply the result of
providing superior customer value (Slater, 1997).
A need generally arises due to some performance gap. Over time, the competitive
advantage held by a firm due to the superior performance of its process and/or products
will dwindle due to a host of factors and eventually be completely overtaken by a
competing firm (Rogers, 2003). To regain some of its competitive advantage, the firm
must address this performance issue. Lead users are the first among their peers to
experience this (von Hippel, 1988; Lettl, 2007)
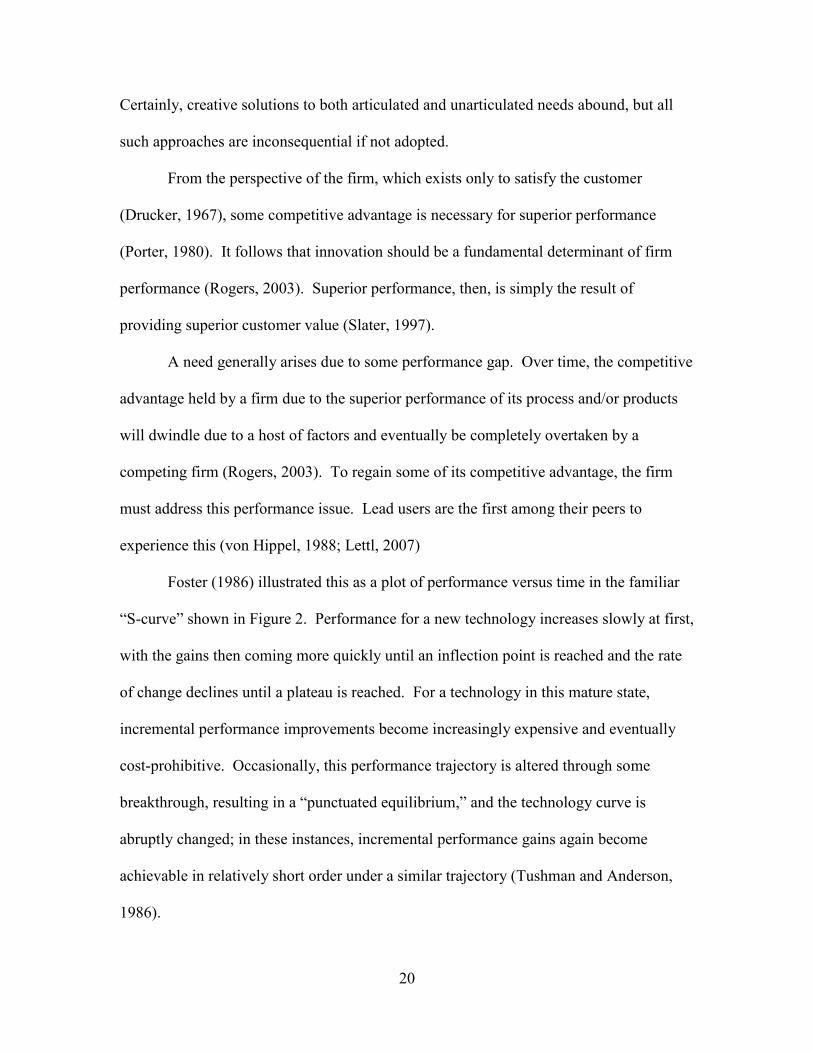
Foster (1986) illustrated this as a plot of performance versus time in the familiar
“S-curve” shown in Figure 2. Performance for a new technology increases slowly at first,
with the gains then coming more quickly until an inflection point is reached and the rate
of change declines until a plateau is reached. For a technology in this mature state,
incremental performance improvements become increasingly expensive and eventually
cost-prohibitive. Occasionally, this performance trajectory is altered through some
breakthrough, resulting in a “punctuated equilibrium,” and the technology curve is
abruptly changed; in these instances, incremental performance gains again become
achievable in relatively short order under a similar trajectory (Tushman and Anderson,
1986).
21
Figure 2. S-Curve (adapted from Foster, 1986)
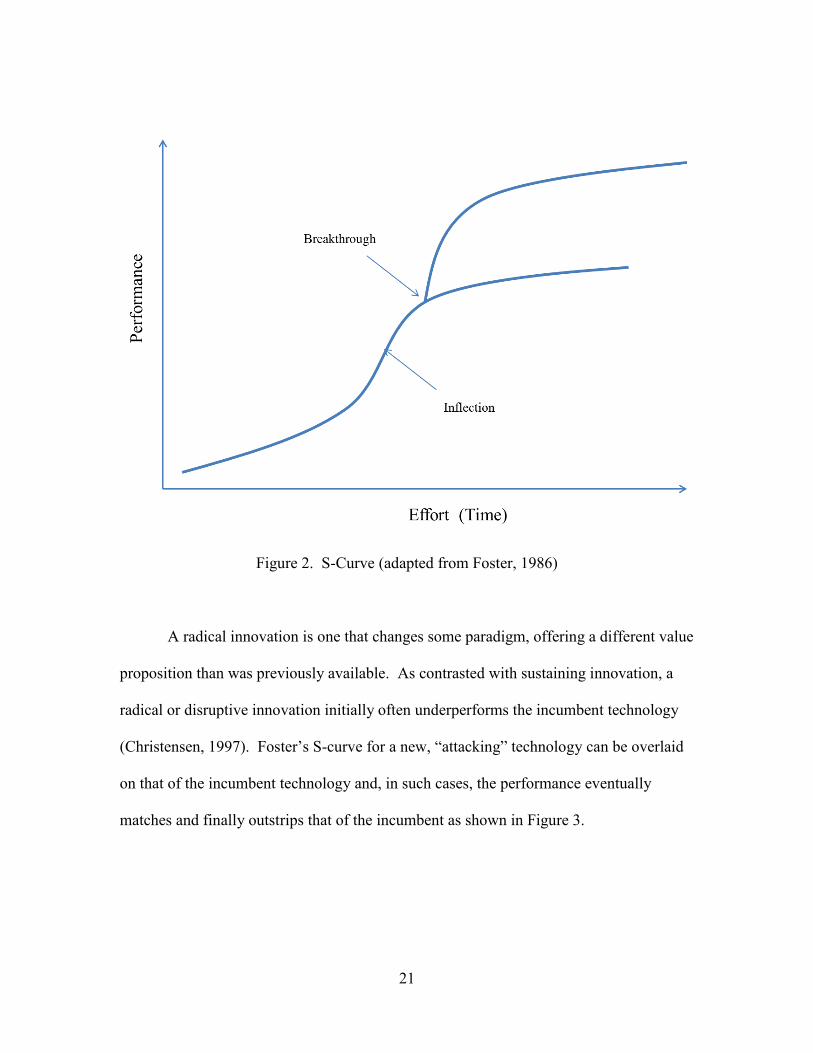
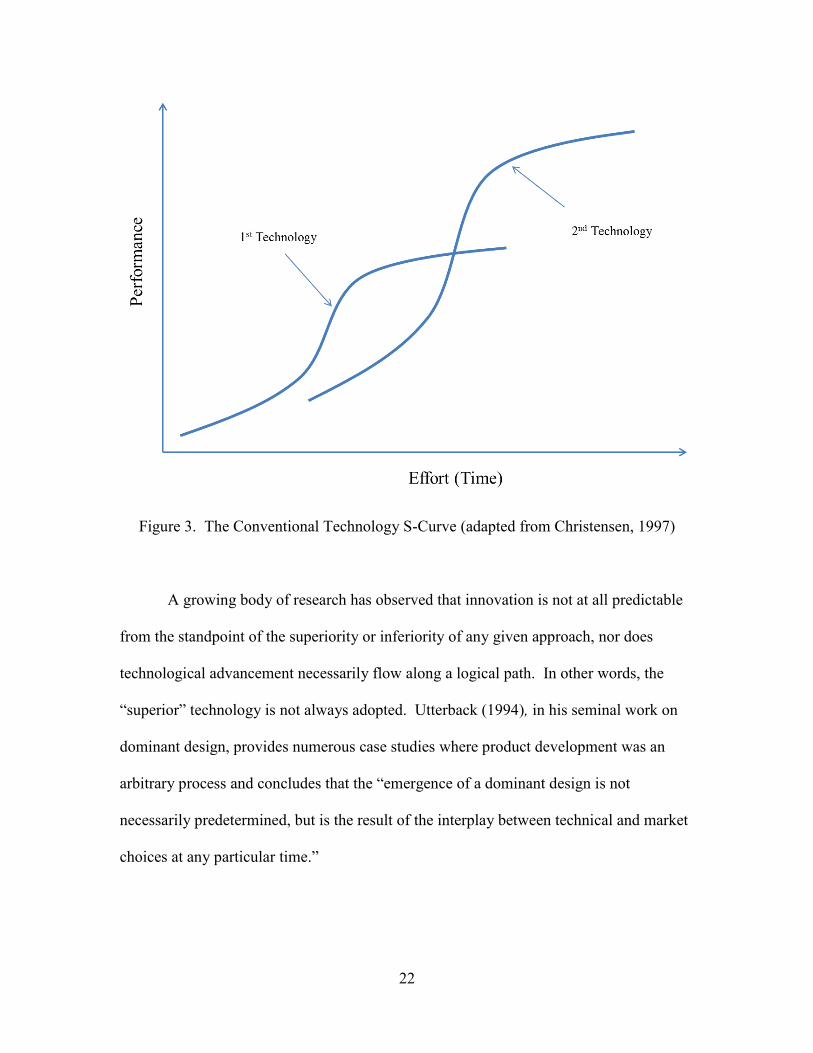
A radical innovation is one that changes some paradigm, offering a different value
proposition than was previously available. As contrasted with sustaining innovation, a
radical or disruptive innovation initially often underperforms the incumbent technology
(Christensen, 1997). Foster’s S-curve for a new, “attacking” technology can be overlaid
on that of the incumbent technology and, in such cases, the performance eventually
matches and finally outstrips that of the incumbent as shown in Figure 3.
22
Figure 3. The Conventional Technology S-Curve (adapted from Christensen, 1997)
A growing body of research has observed that innovation is not at all predictable
from the standpoint of the superiority or inferiority of any given approach, nor does
technological advancement necessarily flow along a logical path. In other words, the
“superior” technology is not always adopted. Utterback (1994), in his seminal work on
dominant design, provides numerous case studies where product development was an
arbitrary process and concludes that the “emergence of a dominant design is not
necessarily predetermined, but is the result of the interplay between technical and market
choices at any particular time.”
23
For example, the so-called QWERTY keyboard layout that persists on today’s
smart phones was developed for early mechanical typewriters to keep them from
jamming. The IBM PC was an assembly of established components – monitor, that same
QWERTY keyboard, a relatively simple operating system – with no real breakthrough
technologies and managed to capture the majority of the market. These products are of a
design that is the end-product of “experiments, technical possibilities, individual choices,
proprietary positions, and – to some extent – sheer inertia” (Utterback, 1994).
Further, technological superiority does not always advance in a continuous, linear
manner. For example, methods of strengthening concrete developed in first century A.D.
Rome were lost until the 19th century (Berkun, 2010). In fact, it can be dangerous to
view history in a completely objective light as it pertains to technological advancements,
as the “winner” in any competitive environment is the result of a wide array of boundary
conditions, serendipity, and coincidence (Utterback, 1994; Christensen 1997; Berkun,
2010; Carlson and Wilmon, 2006).
It is not the firm itself that innovates but the individual members; in other words,
“organizations do not intuit” (Reid, 2004). There is, therefore, a lack of any clear
pathway to a successful innovation simply because humans will always have to be
convinced in the end. Reid (2004) perhaps puts it best: “’invention’ is a cognitive
process, while ‘innovation’ is a social process.” Thus, having access to brilliant, creative
people and a novel idea will not in itself produce a firm which is adept at innovation.
While the producer possesses generic solution information, context-of-use information
resides with the customer, and the exchange of this information is the key to innovative
adoption (von Hippel, 2004).
24
Characterizing the level of customer engagement
Studies conducted in the past several decades are surprisingly inconclusive as to
the degree specific factors positively and negatively influence success, in this case
whether or not a new product (as a proxy for innovation) is accepted by the end-
customer. This inconsistency of conclusions can be attributed to a variety of reasons, not
the least of which is the wide range of measures of “success” (van der Panne et al., 2003).
Still, patterns do emerge from the literature.
One early study, the Scientific Activity Predictor from Patterns with Heuristic
Origins (SAPPHO) research, compared and contrasted successful and unsuccessful
innovations in the United Kingdom and identified 27 explicit factors that influenced
success. In general, success and failure were related to the firms’ understanding of their
customers, their marketing capacity, their product development process, and their ability
to deal with information (Freeman, 1971). Project NewProd was a study of innovation in
Canada which concluded that the marketability of a new product is determined by, among
other things, how well the firm understood future market developments (Cooper, 1979).
In their Stanford Innovation Project, Maidique and Zirger (1984) also found a number of
factors influencing the viability of a new product, including understanding of the
customers and the marketplace.
Henard and Szymanski (2001) found “significant impact on new product
performance” by product advantage, market potential, meeting customer needs, pre-
development task proficiencies, and dedicated resources. In a review of 43 studies on the
determinants of success and failure of innovation, van der Panne et al. (2003) identified
four general classifications for these determinants: the firm itself, the product itself, the
25
market, and the project. More specifically, they found positive impacts from a firm’s
culture, its experience with innovation, and its use of multidisciplinary teams that
possessed “in particular equilibrium between technological and marketing skills.”
Hanssen and Faegri (2006) found close customer engagement to be beneficial, albeit with
certain drawbacks and costs, in a longitudinal case study of a single software firm but did
not characterize the level of engagement. Foss et al. (2010) propose that the link between
customer interaction and innovative performance is mediated through a number of
organizational practices.
Firm performance, as measured by new product success, can vary by the stage in
the new product development cycle that the customer is involved, as well as the
characteristics of the customers involved (Gruner and Homburg, 2000). This link may
also be impacted by the number of customers engaged, especially in early stages. Too
many customers involved in early stages, for example, may lead to less innovation
through the demand for more and more requirements; if there are not enough customers
involved, the group may be less likely to grasp the radicalness of the proposal (Lettl,
2007).
The mechanics of bringing customers and solution providers together
A 2009 Defense Science Board study found over 20 separate initiatives within the
defense department with the explicit intent of responding to urgent warfighter needs.
This same study also found that more than 90 percent of the needs submitted by the Army
were actually urgent requests for additional equipment already available and not a
perceived technology gap at all; the rest fell along a “wide continuum ranging from ill-
26
defined equipment to requests for additional supplies of standard equipment” (DSB,
2009).
Incremental or sustaining innovation provides an increase in performance to the
existing system and brings an improved product to the existing marketplace. Incremental
improvements to the incumbent technology, be it microchips or stone tools, may improve
performance enough to maintain an edge in the early stages, and as the user is familiar
with the incumbent technology, such incremental innovation will result in low levels of
uncertainty. So long as the sustaining innovation can provide sufficient gains, the user
will continue to readily adopt those innovations. Over time, however, incremental
changes come at increasingly higher costs and result in smaller gains. Eventually, there
is no performance margin left to exploit or it is accompanied by increasingly unattractive
trade-offs (Christensen, 1997).
The performance difference between competitors becomes a chronic problem, and
chronic problems defy simple solutions. Yet, regardless of how well the user understands
the technology, if they are confident the problem will ultimately be solved by changing,
they will abandon the status quo if there is sufficient motivation. If the proposed solution
is a radical innovation, the level of uncertainty is higher than for sustaining innovation,
and the required leap of faith will be greater than it would be for incremental innovation.
Different firms will have different ways of dealing with the uncertainty inherent in
searching for solutions to problems. A start-up company, for example, will likely adopt a
cavalier attitude toward risk – bet big, win big. Established firms will likely be more
cautious. Small firms will be able to react more quickly to changes in the environment
and the technology, and large firms will be able to cover more bets.
27
A well-documented and institutionalized approach to such problem solving exists
in the U.S. Department of Defense (DOD), which by most measures is a “large and
established firm.” Under the Joint Capabilities Integration Development System
(JCIDS), a military problem in the form of a gap in capability is identified and validated.
Potential solutions, in the form of some combination of changes to the doctrine,
organization, training, materiel, leadership, personnel, and facilities (DOTMLPF) that
define the incumbent system are then analyzed. Cost-effective solutions are refined and,
eventually, compete for development and procurement resources.
The JCIDS process provides a clear framework for assessing performance gaps
from a strategic perspective and consistent guidance in evaluating options for closing
those gaps. However, it also creates a clear division of labor in materiel development.
Entire organizations are established to develop novel ideas, others to test the
effectiveness of those novel ideas, and still others to assure that those novel ideas can be
safely and effectively employed.
In contrast to the JCIDS approach stands the Garbage Can Model, introduced by
Cohen, March and Olsen (1972), which attempts to explain the decision-making process
in what the authors refer to as “organizational anarchies,” such as university offices. In
these environments, participants vary over time, and are not necessarily aware of a
specific problem, let alone able to articulate it. While decisions emanating from the
JCIDS process are based on rigorous analysis, the decisions that emerge from the
Garbage Can approach may seem utterly irrational. Any decision is the result of several
largely independent streams of events within the organization.
28
From this point of view, an organization is a collection of choices looking
for problems, issues and feelings looking for decision situations in which
they might be aired, solutions looking for issues to which they might be
the answer, and decision makers looking for work. (Cohen, March and
Olsen, 1972)
Under this model, the very existence of a problem is something that emerges gradually;
when it does, it requires attention but may or may not trigger a decision process. In the
organization, a “stream of problems” is characterized by the “energy requirement” of
each problem (i.e., the effort required to make a choice) and all the choices to which each
problem is linked. A solution is “an answer actively looking for a question” where the
question is often not made completely clear until the answer is known. This “stream of
choices” is characterized by the participants who are able to make a given choice (Cohen,
March and Olsen, 1972).
An interesting aspect of the Garbage Can Model is that it presumes that the state
of a decision-making process is almost constantly in flux, with different people
interacting at different energy (motivation) levels at different times. The decision that is
ultimately made (or deferred, which is a decision in itself) will change as technology
matures, as the participants come and go and their energy levels wax and wane, and as
the urgency of the need (or at least the perception thereof) increases and decreases.
The garbage can process is one in which problems, solution, and
participants move from one choice opportunity to another in such a way
that the nature of the choice, the time it takes, and the problems in solves
all depend on a relatively complicated intermeshing of
elements…Problems are worked upon in the context of some choice, but
choices are made only when the shifting combinations of problems,
solutions, and decision makers happen to make action possible. (Cohen,
March and Olsen, 1972)
29
CP-3 projects can arguably be considered finite time slices in a “garbage can model.”
There are participants who either have a solution or have a problem needing a decision.
While the problems are defined from the very start of the project, all parties bring their
own experiences and knowledge to the process at a specific point in time to interact and
arrive at conclusions mutually.
There is a case to be made for directly engaging with customers beyond simple
market research, rather than relying either on the producer to deliver the correct product
through the iterative process described above or the user’s ability to innovate. There is in
fact a theoretical basis for consciously bringing the user into a closer involvement in the
product development process.
When information transfer costs are a significant component of the costs
of the planned problem-solving work, it is reasonable that there will be a
tendency to carry out innovation-related problem-solving activity at the
locus of sticky information, other things being equal – just as, in the case
of production, it is reasonable that a firm will seek to locate its factory at a
location that will minimize transportation costs, other things being equal
(von Hippel, 1994).
Solomon (2008) recommends the implementation of a number of “best practices” to
respond to urgent needs within the Defense Department. Included were a number of key
factors discussed above, including “early customer interaction and feedback” and to
“establish, nurture, and expand social networks and contacts as much as possible.”
Additionally, small teams were explicitly highlighted as key to effective problem-solving
efforts, with a mix of contracting, budget, technical, and program management
experience.
30
A team is, however, more than simply a collection of people. Katzenbach and
Smith (1993) argue that not all groups who work together are teams. People may come
together under focused leadership, individually accountable to some agreed-upon
purpose, but commitment to the task at hand is what defines a team.
A team is a small number of people with complementary skills who are
committed to a common purpose, set of performance goals, and approach
for which they hold themselves mutually accountable. (Katzenbach and
Smith, 1993)
Beyond this shared vision, truly high-performance teams have a strong group culture
built upon mutual trust (Catska et al., 2001). Team performance has been shown to
improve when team members are able to effectively judge nonverbal cues of their
teammates’ emotions (Bender et al., 2010). While diversity among team members
initially invites stereotyping, working on a task that all team members care about results
in decreasing interpersonal conflict and increasing that awareness of coworkers’ feelings
(Hackman, 2011). These factors are all in play within CP-3 projects. The teams are
together for up to one year, providing ample time to develop a healthy group culture, and
are clearly accountable to developing a solution to a defined and difficult problem
(AFRLI 90-104, 2010).
Research suggests that increasing team conflict will have a curvilinear effect on
innovation within the team itself. In one study, teams were found to be more innovative
at lower and higher levels of task conflict. This innovativeness tends, however, to be at
the expense of short-term goal attainment (de Dru, 2006). While de Dru’s (2006) study
focused on internal conflict, the influence of external conflict, such as that imposed by a
customer with a divergent voice, was not addressed.
31
III. Methodology
A natural experiment is a situation in which there has been no intentional
manipulation of treatments to test subjects by the person or persons conducting the
experiment; as a result, the treatments may often be considered randomly assigned,
thereby simulating a well-designed experiment (DiNardo, 2008). The classic example of
a natural experiment, the 1854 London cholera outbreak presented John Snow with the
means to statistically analyze the proximity of cholera cases to specific geographic
locations. Cases of cholera were shown to be related not to “bad air” per the dominant
theory of the day but to exposure to polluted water supplies that was not controlled by
Snow or anyone else.
In similar fashion, Core Process Three (CP-3) projects offer an opportunity to
measure relationships among various treatments and outcomes without handicapping or
helping any given effort. While not as ethically dubious as controlling an individual’s
access to clean water, it would nonetheless be possible but unwise to attempt to
manipulate factors that are theorized as influencing the outcome in any “real-world”
problem-solving endeavor. As in the Cholera outbreak, with the projects already
completed, measurements can be made and appropriate factors correlated ex post facto in
order to identify any possible relationships among those factors.
Survey Design
This research is interested in the relationship between how well the problem (as
previously defined herein) is understood by the CP-3 project members and the level of
32
interaction with the customer (also as previously defined). As an abstract concept, it is
not possible to directly quantify how well a problem or need is understood or how
engaged the user was during the project. These can, however, be inferred from responses
to related questions through statistical analysis. In simple terms, a series of carefully
worded questions may be asked of the respondents, with the hope that patterns will
emerge in the responses. It is then possible to calculate underlying dimensions based on
correlations among these interrelated variables. This results in a smaller set of factors
which explain “the maximum amount of common variance in a correlation matrix using
the smallest number of explanatory constructs” (Field, 2009). To this end, a series of
questions were drafted, with each intended to measure one and only one of the abstract
concepts previously defined and discussed.
1. Customer engagement: the technologist’s assessment of the degree to which the
customer was involved during the CP-3 project.
2. Customer unity of voice: the technologist’s assessment of the consistency of the
feedback provided by the customer.
3. Problem understanding: the technologist’s assessment of how well they
appreciated the needs of the user.
4. Confidence in solution: the technologist’s assessment of their own confidence
that the option or options provided would adequately meet the user’s need.
5. Level of innovation: the technologist’s assessment of the nature of the option
proposed to the user by the technologists as a departure from the incumbent
system or approach, i.e., how large of a “leap of faith” was required to accept the
proposed solution option.
Validated measures are extremely useful tools. Unfortunately, no readily available
measures were found in the literature that would adequately address these constructs.
There are numerous measures for customer satisfaction but a dearth in the specific areas
33
of interest. For that reason, new measures unique to this research were developed and
their statistical validity assessed. Arguably, there may be potential proxies for “level of
innovation,” such as technology readiness level (TRL). However, given the specific
interest in the “leap of faith” required of the customer, it was deemed more judicious to
attempt to develop a unique measure for that construct as well.
Six to eight survey items were initially developed for each of the above
constructs, with each survey item being in the form of a statement. The goal was for each
subject to respond to each statement using a five-point interval (i.e., Likert) scale, with
one being “strongly disagree,” two being “disagree,” three being “neither agree nor
disagree,” four being “agree,” and five being “strongly agree.” Several people not
involved in the research were asked to read each question and categorize them into
groups of related questions. The intent of this exercise was to identify questions which
may have unintentionally mapped into more than one of the higher-level constructs or
into an unexpected construct. After reviewing the resultant categorization, questions that
were shown to be ambiguous or otherwise troubling were removed. Using this process,
each of the five constructs were represented by four individual items, thus forming the
20-question survey shown in Table 1. (The survey also asked respondents to identify the
specific CP-3 project in which they had participated.)
The survey items were labeled with a shorthand notation to identify the higher
latent construct they were designed to assess, e.g., the first item assessing customer
engagement was labeled “CE1” and so forth. In the survey, the questions were
alternated, with a question pertaining to a given construct being followed by a question of
the next construct, and so on. For example, CE1 was immediately followed by UOV1,

34
where “UOV1” was the first question under the unity of voice construct. This notation
was not found on the questionnaire itself and was only used for convenience in dealing
with and presenting the data.
Table 1. Research Questionnaire
Label Question
CE1 The customer was actively involved in the development of the solution.
CE2 The customer offered ideas for improving the technical solution.
CE3 The customer asked meaningful questions.
CE4 The customer was interested in the technical details of the solution.
UOV1 The customer spoke with a single voice.
UOV2 The feedback provided by the customer was consistent.
UVO3 We received the same answers to any questions we had for the customer
regardless of who we asked.
UOV4 The same individuals represented the customer throughout the project.
PU1 I can explain the shortfalls of the existing system.
PU2 The problem we were trying to solve was clear to me by the end of the project.
PU3 I understand the operational limitations of the system used by the customer.
PU4 I have an appreciation for the environment the customer works in.
CIS1 The team felt that the proposed solution was the best solution.
CIS2 There were no dissenting opinions regarding the solution among the team
members.
CIS3 The team believed the proposed solution was adequate.
CIS4 The team was enthusiastic about the solution we proposed.
LOI1 The customer was uncomfortable with the proposed solution the first time it
was presented.
LOI2 It was difficult getting the customer to understand the proposed solution.
LOI3 The customer would have had difficulty explaining the proposed solution to
other users.
LOI4 The proposed solution surprised the customer.
35
Survey Population
The intended survey participants were individual members of the CP-3 projects.
As the projects were carried out as much as six years prior, obtaining contact information
on those individuals was a concern. Fortunately, contact information for the project
managers was available for each of the CP-3 projects. By interviewing these project
managers, as many of the project members as possible were identified.
Initial phone interviews were conducted with the project managers. Although the
primary purpose of interviewing the project managers was to obtain contact information
on the members of the technical teams, there were a number of additional questions
intended to provide additional insight into the projects themselves, a better understanding
of the CP-3 process in general, and identify any unusual circumstances associated with a
given project that would call into question its suitability for this research or explain
otherwise unexpected results. All questions asked of the project managers were provided
ahead of time and are shown in Table 2.
The actual customers were not contacted in this research. While this may
arguably appear contradictory, given that the focus was on the relationship between the
solution provider and the user, their availability for the research was much less consistent
than that of the project team members. Most of the customers were active-duty military
and subject to deployments, job changes, and separation more often than the contractor
personnel who comprised the project teams.

36
Table 2. Project Manager Interview Questions
Label Question
A.1 Names and contact information of contractor personnel involved in the project.
A.2 Scheduled and actual project start and end dates.
A.3 Available documentation (e.g., reports or briefings); if none available,
descriptions of the problem, original system, and proposed solution.
A.4 Was there a TRL (technology readiness level) associated with the proposed
solution? If not, what would it have been, in your estimation?
A.5 Were there any unforeseen circumstances unrelated to the project itself that
caused any appreciable disruptions (e.g., weather-induced delays, change to the
original problem, loss of a team member)?
B.1 How often was the customer briefed?
B.2 Did these briefings tend to be formal or informal?
B.3 How would you characterize the customer’s engagement at these briefings?
B.4 Was the customer involved in the project beyond these briefings? If so, at
what levels?
B.5 How many different “voices of the customer” were there? Can you elaborate?
B.6 In your opinion, did the customer have a vision of a preferred solution prior to
the start of the project?
B.7 Did the customer’s understanding of the problem change over the course of the
project? If so, to what extent?
B.8 Did the customer’s expectations change over the course of the project? If so,
to what extent?
B.9 Was there any turnover in the customer personnel from the start of the project
to the end?
Project Selection
With only 18 CP-3 projects conducted to date, the need to maximize the survey
participants was clear. However, it was deemed equally important to maintain as
homogenous a population as possible. Based on discussions with individuals involved in
the overall CP-3 process, and on information gleaned from the project manager
interviews, judgments were made as to whether any specific project should be excluded
37
from the research. In general, the following considerations formed a somewhat
subjective basis for inclusion of projects.
1. Participants must be able to reasonably assess all the questionnaire items;
while this research was not concerned with adoption rates or other such
measures of success, projects that did not include a proposed solution were
excluded.
2. Any barriers to the interaction between the user/customer and the project team
would likely influence the results; projects in which that interaction was
clearly limited were excluded.
3. Any projects in which the project manager could not be contacted were
excluded.
4. The project team should have been able to work free from oversight or
direction from any group other than the customer/user; if any significant
outside influence was present, the project would be excluded.
Questionnaire Deployment and Assessment
The CP-3 project members were predominantly contractor personnel, and they
proved to be readily accessible by email. The survey instrument was hosted on a
commercial web site and a link to the survey was emailed to all subjects. The web site
directly collected the input to all questionnaires and populated a spreadsheet which
provided easy input into the statistical analysis software. The survey itself was also
included in the email in case the web site was not accessible for some reason; e-mail
responses were manually entered into the spreadsheet. Once the survey was closed to
new input, a variety of statistical measures were assessed to validate the hypothesized
constructs, to possibly derive more meaningful constructs, and to assess any relationships
between and among the constructs. The statistical analysis was accomplished using
SPSS, a well-regarded computer program widely used in behavioral studies.
38
The five constructs (customer engagement, singular voice of the customer,
problem understanding, confidence in solution, and level of innovation) were individually
analyzed for reliability. Reliability is defined by Field (2009) as “the ability of a measure
to produce consistent results when the same entities are measured under different
conditions.” In other words, reliability provides some level of assurance that, as an
aggregate, the questions comprising each construct are measuring the same latent
variable. The most common measure of scale reliability is Cronbach’s α, with values
near or above 0.8 generally indicating acceptable reliability.
Should any or all of the constructs clearly show unacceptable reliability, the
research is not necessarily void. By applying principal component analysis (PCA) to
larger selections of the questionnaire items, more deeply hidden latent variables may be
uncovered. By identifying clusters of high correlations between subsets of variables,
PCA can be used to show where those variables may be measuring the same underlying
dimension (Field, 2009). By reexamining the questions that cluster together, these
underlying dimensions (i.e., latent variables) can be pulled from the data. Depending on
how different these new constructs are from those that were initially proposed, the
research questions are in such cases generally reassessed.
The resulting constructs – be they the original five latent variables or some
combination of emergent variables – are then correlated to determine the extent of any
statistically significant relationships among one another. Correlation is the normalized
(non-dimensional) relationship between two variables. Simply put, it is an indication of
whether or not changes in one variable are accompanied by changes in the other, and it is
not an indication of causality. For instance, a positively correlated relationship between

39
customer involvement and problem understanding does not mean that a higher level of
customer involvement causes a higher level of customer understanding; it only indicates
that they tend to occur together. The significance of each relationship is also measured,
which is an indication of the level of confidence that the observed relationship was not
the result of a random chance. Pearson’s r is a common measure of correlation, and
values near 0.5 indicate a “large” effect (Field, 2009).
40
IV. Results
As one might expect, not all 18 projects were included in the research; the
circumstances behind those that were excluded are discussed below. The project
manager interviews are summarized and the questionnaire deployment is addressed. The
detailed statistical analysis of the survey data and the relationship to the research
questions are discussed.
Project Selection
As discussed in the previous section, consistency in the structure of CP-3 projects
presents the opportunity to assess the influence of customer engagement on the
understanding of the customer need. Any situations that may potentially introduce
confounding factors therefore need to be addressed. Table 3 provides a complete list of
the CP-3 projects, with annotations on the reasons for their inclusion or exclusion.
One project was classified at the Secret level. While it certainly is of interest,
restrictions inherent in dealing with information at any level of classification above
Unclassified will have a direct influence on the ability of all parties to interact and
communicate freely during the project. As stated previously, the exchange of “sticky
information” plays a large role in the theories associated with user innovation and team
performance, and barriers are put in place at higher classification levels to expressly limit
such exchange. Further, insights gleaned from the project manager interview may have
been similarly problematic, which could potentially mask other issues that could have
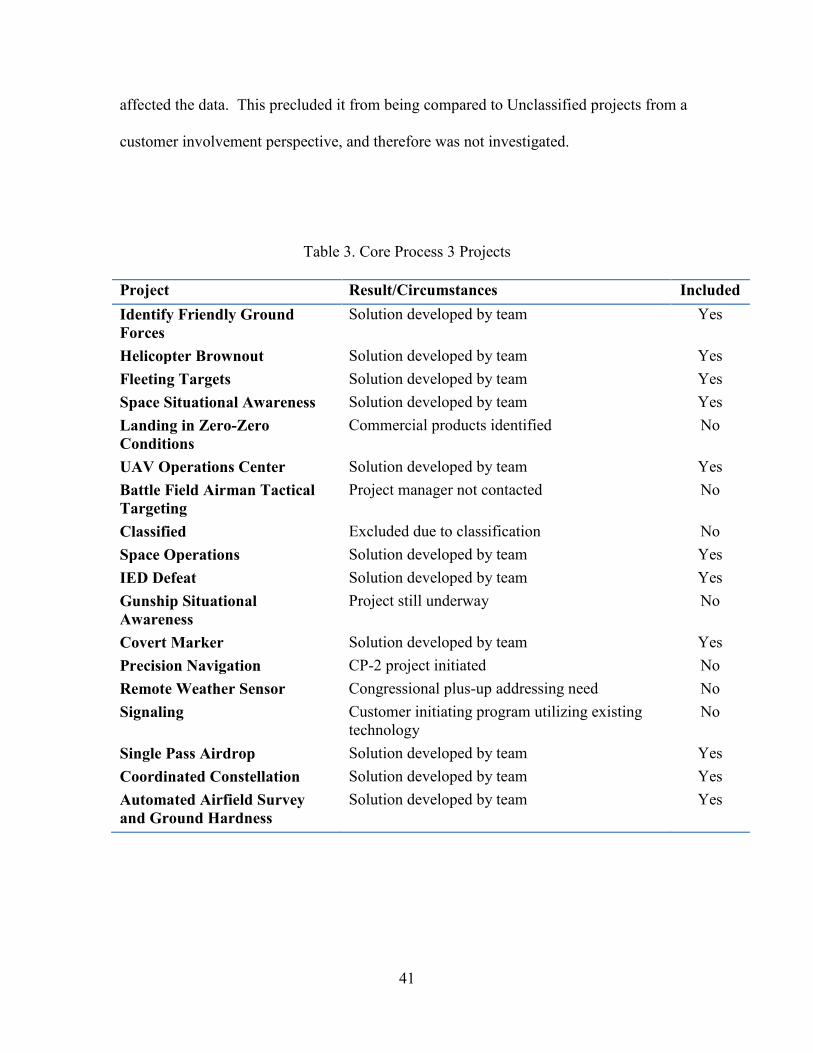
41
affected the data. This precluded it from being compared to Unclassified projects from a
customer involvement perspective, and therefore was not investigated.
Table 3. Core Process 3 Projects
Project Result/Circumstances Included
Identify Friendly Ground
Forces
Solution developed by team Yes
Helicopter Brownout Solution developed by team Yes
Fleeting Targets Solution developed by team Yes
Space Situational Awareness Solution developed by team Yes
Landing in Zero-Zero
Conditions
Commercial products identified No
UAV Operations Center Solution developed by team Yes
Battle Field Airman Tactical
Targeting
Project manager not contacted No
Classified Excluded due to classification No
Space Operations Solution developed by team Yes
IED Defeat Solution developed by team Yes
Gunship Situational
Awareness
Project still underway No
Covert Marker Solution developed by team Yes
Precision Navigation CP-2 project initiated No
Remote Weather Sensor Congressional plus-up addressing need No
Signaling Customer initiating program utilizing existing
technology
No
Single Pass Airdrop Solution developed by team Yes
Coordinated Constellation Solution developed by team Yes
Automated Airfield Survey
and Ground Hardness
Solution developed by team Yes
42
The other projects that were excluded were not ultimately completed under the
auspices of CP-3. These projects were moved to a program of record, a less-focused
laboratory effort to mature needed technology, or a project funded directly by Congress
outside the President’s Budget Request process. In all such cases, certain questions on
the survey would be unanswerable, and therefore these were also removed from the
sample. The remaining 11 projects were deemed sufficiently homogenous for the
purposes of this research and comprised the study sample.
Project Manager Interviews
A total of 15 project managers were solicited for interviews, representing the 11
CP-3 projects (some of the projects had more than one manager). Of these 15 project
managers, 13 agreed to be interviewed and to provide contact information for the
technical team members. All phone interviews were conducted during the period from 9
February to 6 March 2012. These interviews were not intended to form the basis for case
studies of those projects, nor for CP-3 in general, but rather to document any particular
issues or unusual situations which may have arisen during the project that would
potentially preclude it from being included in the sample or otherwise influencing the
data.
As stated above, the earliest CP-3 projects were five and six years ago. Still,
regardless of how long ago their experience was, all the project managers had little
difficulty addressing the questions. All were enthusiastic and clearly felt their
experiences were very positive. The answers provided to the interview questions were
supplemented with unsolicited background information, anecdotes, and offers to provide

43
additional information. As final reports on individual CP-3 projects are difficult to
obtain, the interviews proved to be extremely informative.
Questionnaire Deployment and Response
The project managers who were contacted supplied the names and contact
information for 40 people who worked on one of the retained CP-3 projects. The link to
the questionnaire was sent by email to those individuals on 20 March 2012, and the web
site was closed to new input on 4 April 2012. In all, there were 30 surveys received for a
75% response rate. All but two were submitted directly on the web site; the two provided
directly via email were appended to the data manually. A total of eight projects were
represented by the responses, as three projects received no responses. Of those eight
projects, the average number of responses received per project was 3.75, and the number
for a given project ranged from one to seven. Means and standard deviations for each of
the five sub-scale measures are shown in Table 4.
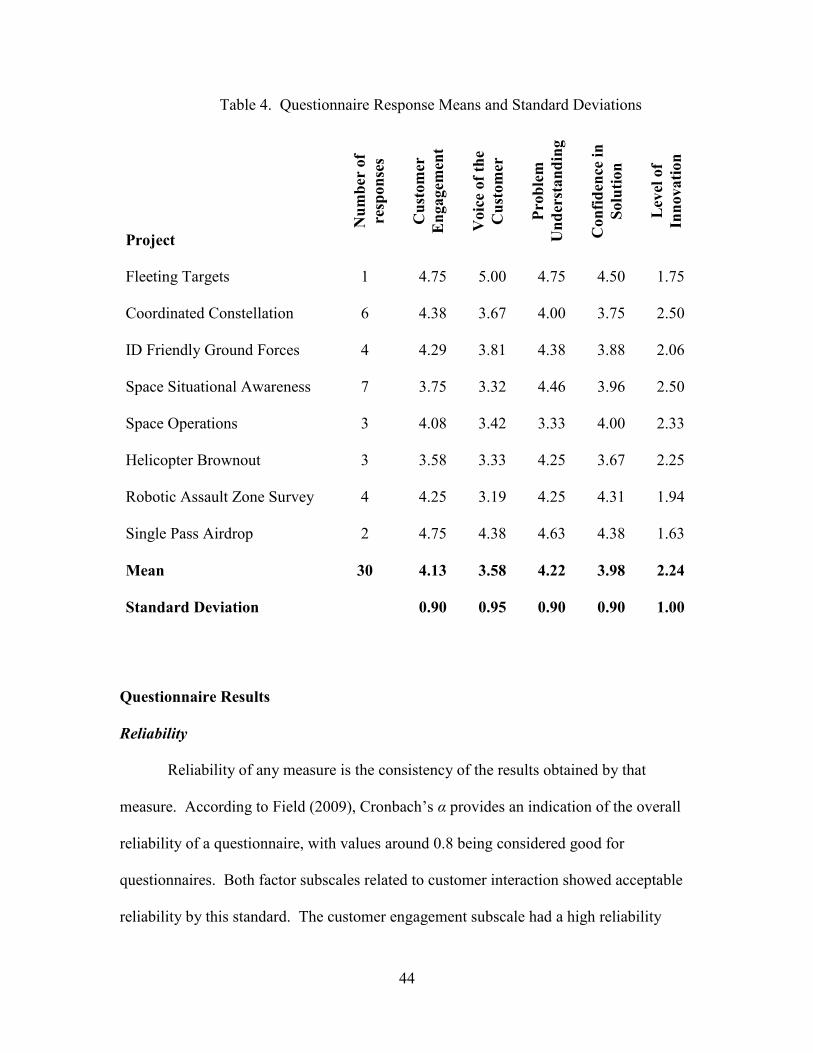
44
Table 4. Questionnaire Response Means and Standard Deviations
Project
Nu
mb
er o
f
resp
on
ses
Cu
stom
er
En
gagem
ent
Voic
e of
the
Cu
stom
er
Pro
ble
m
Un
der
stan
din
g
Con
fid
ence
in
Solu
tion
Lev
el o
f
Inn
ovati
on
Fleeting Targets 1
4.75
5.00
4.75
4.50
1.75
Coordinated Constellation 6
4.38
3.67
4.00
3.75
2.50
ID Friendly Ground Forces 4
4.29
3.81
4.38
3.88
2.06
Space Situational Awareness 7
3.75
3.32
4.46
3.96
2.50
Space Operations 3
4.08
3.42
3.33
4.00
2.33
Helicopter Brownout 3
3.58
3.33
4.25
3.67
2.25
Robotic Assault Zone Survey 4
4.25
3.19
4.25
4.31
1.94
Single Pass Airdrop 2
4.75
4.38
4.63
4.38
1.63
Mean 30 4.13 3.58 4.22 3.98 2.24
Standard Deviation 0.90 0.95 0.90 0.90 1.00
Questionnaire Results
Reliability
Reliability of any measure is the consistency of the results obtained by that
measure. According to Field (2009), Cronbach’s α provides an indication of the overall
reliability of a questionnaire, with values around 0.8 being considered good for
questionnaires. Both factor subscales related to customer interaction showed acceptable
reliability by this standard. The customer engagement subscale had a high reliability

45
(Cronbach’s α = 0.805). The voice of the customer subscale showed lower but still
acceptable reliability, with a Cronbach’s α of 0.756. The factor subscales characterizing
the problem and solution exhibited lower reliability, however. Cronbach’s α for problem
understanding was 0.672, and just 0.487 and 0.432 for confidence in solution and level of
innovation, respectively.
The intent of the questionnaire was to measure five latent variables through four
questions each that were to align to one particular latent variable. If that were the case, as
noted above, each portion of the questionnaire would be expected to exhibit reasonable
reliability; that appears to be the case for the two customer interaction constructs but less
so for the remaining three constructs. Taken as a whole, principal component analysis
(PCA) can be applied to provide insight into the underlying variables that are actually
being measuring and how they may differ from what was intended to be measured.
While PCA is most commonly associated with the social sciences, it can be used in many
situations where a characteristic cannot be directly measured (Field, 2009). No attempt
will be made here to explain the theory and mechanics behind PCA; the reader may refer
to any number of sources for a more thorough understanding (Field, 2009; Joliffe, 2002).
To this end, a PCA was initially conducted on the 12 survey items associated with
the problem and solution characterization, that is, the items that were intended to assess
the three theorized constructs of problem understanding, confidence in solution, and level
of innovation. In this exercise, the level of innovation construct was problematic.
Neither removal of individual questionnaire items nor combinations of items improved
the results of the analysis to the point where any meaningful conclusions could be drawn.

46
In hindsight, the reasons for this are more obvious after having deployed the
questionnaire. The items related to level of innovation differ markedly from problem
understanding and confidence in solution; instead, they focused on the perceived ability
of the customer to understand and fully appreciate the solution. As previously shown in
Table 1, the four items for this construct are shown below.
LOI1. “The customer was uncomfortable with the proposed solution the first time
it was presented.”
LOI2. “It was difficult getting the customer to understand the proposed solution.”
LOI3. “The customer would have had difficulty explaining the proposed solution
to other users.”
LOI4. “The proposed solution surprised the customer.”
Low reliability indicates that these items may be relatively ambiguously worded. In any
case, they are most certainly negatively worded; the intent, as stated previously, was to
quantify the required “leap of faith” that would serve as a proxy for innovativeness.
There unfortunately appears to be little additional statistical manipulation available which
would permit any meaningful conclusions to be drawn from that portion of the
questionnaire. This effectively eliminates the potential of confirming or rejecting the
hypothesized relationship between more radical solutions and the level of customer
involvement.
Upon removal of these four items, the eight remaining items, when taken as a
whole, were intended to ascertain how well the problem was understood and, specifically,
how that understanding translated to a solution acceptable to the customer. A PCA was
conducted on these eight items with orthogonal rotation (varimax). The Kaiser-Meyer-
Olkin measure, KMO = 0.699, verified the sampling adequacy, and Bartlett’s test of

47
sphericity was significant, X2 = 61.115, p < 0.001, indicating that correlations between
items were sufficiently large for PCA (Field, 2009).
Three components had eigenvalues over Kaiser’s criterion of 1 and in
combination explained 66.6% of the variance. The second and third components did not
significantly exceed Kaiser’s criterion, with eigenvalues of 1.199 and 1.022, respectively.
The scree plot showed inflections that would justify up to three components. However,
only the first component showed acceptable reliability (Cronbach’s α = 0.798); for the
second and third components, the reliability values were 0.516 and 0.708, respectively.
Due to the low reliability of the second and third components extracted, only the first
component was considered for further analysis. The following items clustered together to
form this initial component.
PU1. “The problem we were trying to solve was clear to me by the end of the
project.”
PU2. “I understand the operational limitations of the system used by the
customer.”
PU3. “I have an appreciation for the environment the customer works in.”
CIS1. “The team felt that the proposed solution was the best solution.”
CIS3. “The team believed the proposed solution was adequate.”
Three questionnaire items did not cluster with the above, which provides some insight
into the difference with the as-intended constructs of problem understanding and
confidence in solution. The item “I can explain the shortfall of the existing system” was
intended to assess the level of problem understanding. Still, it is conceivable that there
were cases where there was no incumbent system, or where the incumbent system was
not the focus of the solution. In fact, once it becomes apparent that a discontinuous
48
solution is the most viable approach, fully understanding the incumbent system may be
interesting academically but less important, or at least less urgent, than comprehending
the pros and cons associated with a radically different approach. The problem, in other
words, may simply be that the incumbent system does not sufficiently meet the needs of
the user and should be discarded.
Two other items did not cluster with this component: “there were no dissenting
opinions regarding the solution among the team members” and “the team was
enthusiastic about the solution we proposed.” These differ from the other items in that
they are asking for assessments of the viewpoints of others rather than one’s own
viewpoint. Additionally, even if these were expected to measure the team’s confidence
in the solution, this may be more of a measure of a unity of opinion that may or may not
exist in a given team. Again, a variety of potential confounding variables are
conceivable, reflecting perhaps some interpersonal elements of the team, which were not
otherwise measured, directly or indirectly.
The remaining five highly clustered items stated above thus portray a subtly
different characterization from, strictly speaking, either the understanding of the problem
and the confidence that the problem could be solved. Instead, the items seem to address
an empathy with the customer, which requires an appreciation of the challenges faced in
both the technology and the environment. Taken together, these items suggest this “new”
component represents the perceived viability of the proposed solution, which in itself
reflects a more robust self-assessment of problem understanding. Coupled with more
clearly acceptable reliability, this construct offers an alternative to the as-designed
construct of problem understanding.
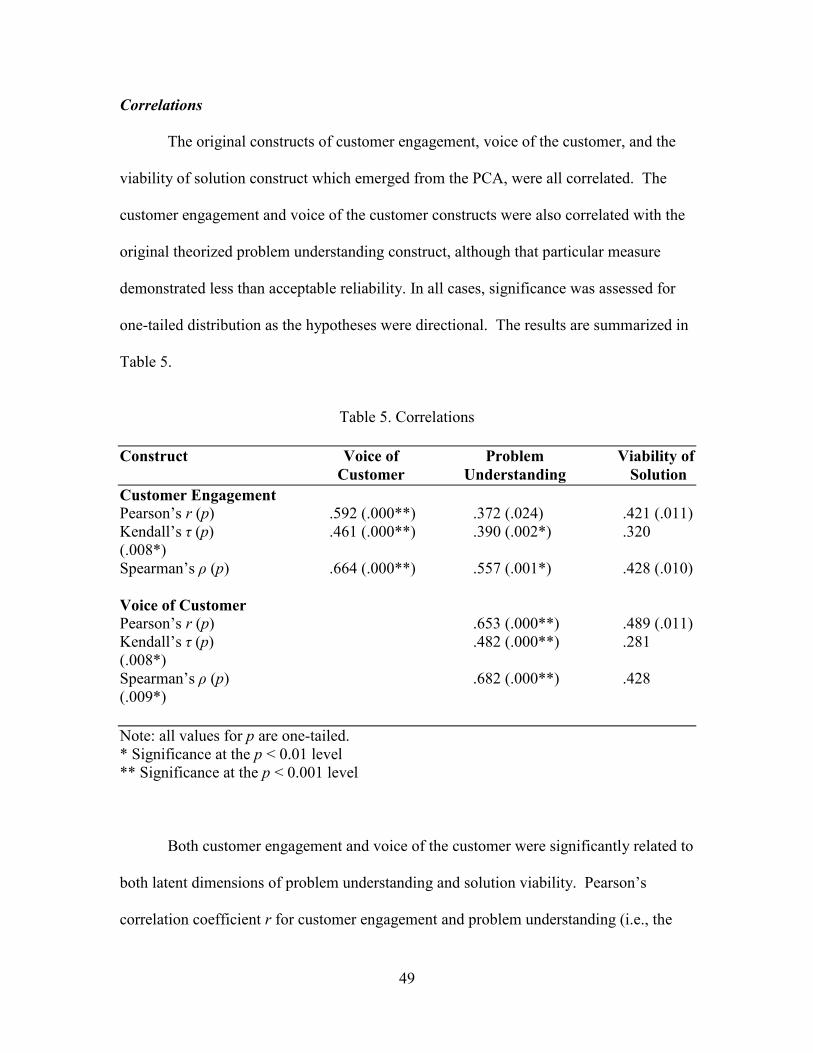
49
Correlations
The original constructs of customer engagement, voice of the customer, and the
viability of solution construct which emerged from the PCA, were all correlated. The
customer engagement and voice of the customer constructs were also correlated with the
original theorized problem understanding construct, although that particular measure
demonstrated less than acceptable reliability. In all cases, significance was assessed for
one-tailed distribution as the hypotheses were directional. The results are summarized in
Table 5.
Table 5. Correlations
Construct Voice of Problem Viability of
Customer Understanding Solution
Customer Engagement
Pearson’s r (p) .592 (.000**) .372 (.024) .421 (.011)
Kendall’s τ (p) .461 (.000**) .390 (.002*) .320
(.008*)
Spearman’s ρ (p) .664 (.000**) .557 (.001*) .428 (.010)
Voice of Customer
Pearson’s r (p) .653 (.000**) .489 (.011)
Kendall’s τ (p) .482 (.000**) .281
(.008*)
Spearman’s ρ (p) .682 (.000**) .428
(.009*)
Note: all values for p are one-tailed.
* Significance at the p < 0.01 level
** Significance at the p < 0.001 level
Both customer engagement and voice of the customer were significantly related to
both latent dimensions of problem understanding and solution viability. Pearson’s
correlation coefficient r for customer engagement and problem understanding (i.e., the

50
original four questions under problem understanding, which showed less than acceptable
reliability according to Field) was 0.372, p (one-tail) < 0.05; for voice of the customer
and the problem understanding the effect was even larger, r = 0.653, p (one-tail) < 0.001.
Customer engagement and voice of the customer were also significantly related to the
more reliable measure of solution viability. For customer engagement, r = 0.421, p (one-
tail) < 0.05. For voice of the customer, the effect was again slightly larger, r = 0.489, p
(one-tail) < 0.01. The two measures of customer involvement – customer engagement
and voice of the customer – were also shown to be related; however, the relationship was
shown to be positive (r = 0.592, p (one-tailed) < 0.001). This was in contrast to the
hypothesized negative relationship.
Although the data appear to be normally distributed and otherwise not in violation
of parametric assumptions, there was a relatively small sample size. Therefore,
correlations were also calculated using well-regarded non-parametric statistics,
Spearman’s ρ and Kendall’s τ. Kendall’s τ is more appropriate in this case, given the
small data set and the use of a Likert scale; Field (2009) further argues that it is a more
accurate measure than Spearman’s ρ. Regardless, both statistics showed significant
relationships in all cases. These results are also summarized in Table 5.
Partial correlations – measuring the relationship between two constructs while
controlling for the effects of the third – were also examined. With voice of the customer
as the control variable, there was no significant relationship between customer
engagement and the two problem understanding constructs. However, with customer
engagement as the control variable, the relationships between voice of the customer and
either of the problem understanding constructs were lower by only a small amount. For
51
the original problem understanding construct, r = 0.579 compared to 0.653 (p in both
cases < 0.001). For the derived construct, viability of solution, r = 0.328 compared to r =
0.489 for the bivariate correlation, although in this case the significance was lower, p <
0.05 versus p < 0.01.
Discussion
The statistical reliability of the theorized latent constructs as-proposed was shown
to be satisfactory only for customer engagement and voice of the customer. Given the
relatively small sample population, reasonable levels of reliability are by no means
assured. It is nonetheless disappointing that three of the five measures demonstrated
inadequate statistical reliability. The concept of the “level of innovation” is problematic
at best, and with the benefit of hindsight, the measure needs much more development to
be meaningful. Thus, no conclusions are proposed relative to any of those hypothesized
relationships.
Combining (or, more correctly, collapsing) the separate constructs of problem
understanding and confidence in solution into a single construct, again in hindsight, is
perhaps less of an issue or concern. The construct that emerged from the PCA, the
perceived viability of solution, can be thought of as “we addressed the customer’s true
need.” This is arguably a more important measure than simply providing a solution.
This derived construct appears to get at the heart of the concept, that is, just how well the
problem, with all of its nuances, is appreciated by an outsider. In any case, it does
present a more straightforward dependent variable and makes for a more parsimonious
52
theory as regards the relationships with the independent variables of customer
engagement and customer voice.
Relationship between customer engagement and problem/solution understanding
Supporting the hypothesized relationship, problem understanding was shown to
be positively related to customer engagement; the observed correlations with both the
original and the derived construct are significant. Engaging the customer clearly
improves the exchange of tacit, “sticky” information in both directions. The technologist,
charged with providing solution options to the customer, gets a clearer understanding of
the problem, and the customer is exposed to and becomes more familiar and comfortable
with new technologies that may provide novel but effective solutions.
Relationship between unity of customer voice and problem/solution understanding
The positive relationship between problem understanding and singular voice of
the customer was also expected. The observed effect is even larger, and of a higher
statistical power, than for customer engagement. Customers who exhibit a “single voice”
should be easier to comprehend. Further, having a single voice works in both directions.
The customer’s explanation of the problem will naturally be clearer, but so will the
feedback provided by the customer on any proposed solutions.
Relationship between customer engagement and unity of customer voice
A positive significant relationship was shown to exist between customer
engagement and voice of the customer, which was not as expected. The hypothesized
relationship was negative, the rationale being that as the level of engagement increased,
the potential for different customer perspectives being expressed would increase.
53
Arguably counterintuitive, this relationship may in fact be understood by considering
situations at each extreme.
At low levels of customer engagement, it is conceivable that multiple perspectives
of the problem experience are still being expressed. The fact that the problems worked
under CP-3 are chronic would likely mean that there are numerous examples available
where the problem manifests itself; conversely, if there were few documented examples
of the given problem, it would be unlikely to ever be worked under CP-3 (or, in the
general case, with resources commensurate with solving a chronic customer problem).
With limited customer perspectives available, there could understandably be fewer
opportunities to ask questions. These examples would be difficult to assess; they could
be anomalies, or the underlying core issue may be too deeply masked to be discovered.
Higher levels of customer engagement, conversely, may provide the technologists
with more opportunity to discuss those documented examples with the users. True
anomalies would be identified and dismissed, improving overall confidence in the
understanding of the incumbent technology and the operational environment.
Additionally, more customer engagement may result in even more examples being
brought to light; this increase in data points may thus serve to more readily reveal
patterns. These patterns would provide evidence of those underlying issues, thus making
the true nature of the (possibly unarticulated) true need more apparent.
Finally, the observed partial correlations, which were also unexpected, may
provide a case for the theoretical basis of any causality between customer engagement
and customer voice. It may be that customers who did speak with a single voice were
inherently more engaged for the same reasons they were more likely to speak with that
54
single voice. It is conceivable that the most engaged customers were highly specialized
groups that largely worked together. Such a group would likely present a consistent face
to outside bodies, particularly when discussing the group’s mission. Conversely, with
customers that come from a wide range of experiences, it may be difficult to find any one
customer willing to engage deeply. Additionally, involving a broader customer base
would limit the amount of time available for specific individuals to interact.
This may be, however, only an interesting distraction from the more compelling
observation that the relationship in fact appears to be positive. This would suggest, at
least arguably, that there is no basis for any curvilinear relationship with customer
engagement. In other words, for these limited-duration projects focused on a specific
technical problem, there is no evidence that engaging the customer necessarily leads to a
more confused relationship between customer and technologist. There is perhaps a
danger in something of a “Stockholm Syndrome” manifesting itself, that is, the
technologists being so tightly coupled with the customer that they lose their outsider’s
perspective. This should, however, be of little concern so long as the project is of some
finite length and the same technologists are not participating on every team.
In short, there is little downside to involving the customer in the solution
development process. At least for relatively small teams who focus their attention on a
single customer need, keeping that customer engaged as the solution evolves may serve
to help the voice of the customer converge rather than diverge. With no evidence in this
admittedly small sample of the hypothesized curvilinear relationship, innovative
problem-solving teams appear to benefit considerably from highly engaged customers.
55
V. Conclusions and Recommendations
The positive effect of customer engagement on problem understanding is clearly
demonstrated. At least in the context of CP-3 projects, which are closed-ended and
focused on a specific user need, it appears that “more is better” when it comes to seeking
user perspective. Information relative to the context, inherently difficult to clearly
express verbally, is key to understanding and appreciating the implications of the trade-
offs required. The information required to address needs in an innovative manner resides
both with the user and the technologist. As this and much previous research shows, such
tacit information is best communicated through direct associations between the
individuals in possession of the information.
Research Insights
Don’t hesitate to get as close to the end-user as possible.
The data suggest there is little reason (competitive concerns or secrecy issues
aside) to limit customer involvement in these short-term, focused, problem-solving
teams. Users can indeed become the innovators themselves, as von Hippel (1986) has
well documented, but they are not always in the position to make physical changes to
hardware, even if they possess the all traits of user-innovators; indeed, many systems,
such as today’s ubiquitous consumer electronics, are designed so that modification is not
possible. Further, particularly in large, bureaucratic systems (such as, but by no means
limited to, the U.S. military), changing the configuration of a system or procuring an
entirely new system may be a highly regulated, frustratingly conservative processes.
56
Likewise, potential solutions to any need must be recognized and understood by
the customer. Even a user who may otherwise be highly motivated to adopt an
innovative solution will often be unaware of potential cutting-edge technologies or of
technologies and approaches that have not previously been applied to their specific need.
Adoption of any change beyond an incremental improvement in performance to the
incumbent system requires that the customer first be able to view the situation from a
different – and unfamiliar – perspective.
These CP-3 projects are well-structured to bring together both elements of the
innovating user. The customer contributes the tacit knowledge of the operational
environment and insight into the trade-offs associated with any potential change in the
status quo. The technologist brings a fresh perspective as well as the knowledge of other
potential substitute technologies. Such a team may well be able to function as a virtual
user-innovator.
Approach the problem-solving process as close to “ethnography” as practical.
The starting point for any attempt to solve a problem or address an unmet need
should be “a day in the life” of the end-user. This can be key to enhancing the
technologists’ understanding of the problem and, more to the point, the trade-offs
involved in any change from the status quo. This immersion need not be carried out to
the degree in which, say, journalists are embedded with deployed military units. Rather,
it can be accomplished largely through face-to-face discussions with actual users,
observing the incumbent system in operation, and being directly involved in the field
tests to see not just the performance of the potential solution but the reaction of the users
as well. Even for technologies that are inherently – and intentionally – dangerous, this
57
can be accomplished without “standing in harm’s way” by keeping the technologists safe
and not compromising the mission.
Provide all technologists opportunities to participate in these teams.
Rather than “round up the usual suspects” each time a need is examined,
organizations should seek to immerse as many researchers as possible into such problem-
solution teams at some point in their careers. Simply relying on a standing cadre to man
these teams will lead to them becoming intermediaries and effectively limiting the
transfer of “sticky” information. In any firm that prides itself on its innovative culture,
having employees who are not only creative but intimately knowledgeable about the
customer can be a tremendous corporate resource. Any and all insight gained by the
researchers into the true nature of customer needs should endure and provide a positive
influence in all future work, with that customer and with others. Finally, increasing the
number of people engaging with customers will logically increase the likelihood of some
novel and effective solution emerging for any given need.
While there may be inefficiencies inherent in establishing a separate process
dedicated to consumer insight, the true value to the organization is in exposing
technologists to the operational environment of technologies with which they are both
familiar and unfamiliar. Particularly in large, bureaucratic firms, where a drive for
efficiency is more likely to lead to specialization, researchers may be isolated from not
only the users but other stakeholders who must be convinced of the merits and the
potential of the technologies proposed. As of this writing, the U.S. Air Force Research
Laboratory (AFRL) has pulled back its representatives co-located with the Major
Commands (MAJCOM) in the name of efficiency. While these representatives provided

58
great insight into the operational customer needs, the cost to AFRL was deemed
excessive relative to the value added. As ad hoc teams are even more resource-intensive
than an individual charged with customer interaction, it is easy to envision even fewer
opportunities for direct interaction between users and researchers. Such retrenchment by
a firm into its core competencies is not unique to the Air Force, and the unfortunate end
result is all too often “core rigidities” leaving the firm more focused on producing
excellent products and less on what products their customers really need (Leonard-
Barton, 1992).
Accept short-term setbacks.
The end-user should remain the focus of the team’s efforts regardless of how
many other “customers” exist. However, multiple stakeholders should be expected in any
seemingly intractable problem. Actually solving the problem will often require changes
that are outside the authority of the user to make. Trade-offs will inevitably be necessary,
but mitigating circumstances may often preclude the adoption of the “best” solution at all.
The true value, then, of assembling such a problem-solving team may not be solving the
specific problem at hand; instead, it may simply be a more sound understanding of the
customer. Solutions to other unmet needs, both existing and future, may then be
addressed even more effectively.
Limitations of the Research
As previously stated, this research covered a large portion of a very small and
very homogenous population. It was aimed at a very specific set of projects to
intentionally limit the influence of as many environmental factors as possible. As such,
59
external validity should not necessarily be presumed. Rather than simply increasing
customer engagement in all new product developments, the reader should consider the
employment of the short-term, focused teams to address specific customers and their
needs.
It was stated previously, but an important caveat is that the involvement of the
customer in many circumstances will be limited in reality by economic and competitive
factors. The need to keep trade secrets and other proprietary information out of the hands
of even the most loyal customers may preclude customer involvement entirely.
Similarly, military users may be unable to present the complete operational context of a
system to anyone without proper clearance.
Future Research
Track assessments of problem understanding as a function of time.
These focused problem-solving teams are not without cost, both in direct expense
as well as the opportunity costs lost when these very talented and creative employees are
not working on something else. If some inflection point exists, where problem
understanding begins to increase at a lower rate with respect to an increase in customer
involvement, it could be considered a possible decision point in the timing of resource
allocation for these teams. Further, it may be of interest to product developers whether or
not the team’s perception of their understanding of the user’s problem varies as the
problem-solving process is carried out. Specifically, does it linearly increase, is there
some inflection point, are there points where it decreases, or are there other
discontinuities in the level of understanding attained? Does the “voice of the customer”
60
converge, diverge, or remain consistent throughout the project? Are any of these
potentially predictable?
Compare and contrast users’ perceptions of interaction with that of the technologists.
A decision was made in this research to not attempt to gauge the views of the end-
users due to a number of practical reasons. Additionally, as previously noted, self-
reported measures are not always reliable and can be skewed towards either positive or
negative perceptions. Using similar techniques to assess the users’ perception as to how
well they feel the technologists understand their problems could help ascertain whether or
not there tends to be general agreement with the self-assessment of the technologists.
Reassess the level of discontinuity of the proposed solutions.
While this research found no observed limit to the positive effect of customer
involvement, the self-reported measure of the level of innovation, as the degree of
comfort the customer felt with a given solution, was found to be difficult to assess. A
more rigorous assessment of the degree of change the proposed solution requires could be
correlated to the specific project team’s assessment of problem understanding. This
would more fully investigate the “leap of faith” that users are willing to accept.
Summary
When economic and practical considerations permit, the use of a focused,
problem-solving team of the model in the U.S. Air Force CP-3 program can provide
technologists with greater insight into persistent, acute user problems and otherwise
unarticulated needs. The close relationship between the technologists and the user is key
to the adequate exchange of pertinent latent information in both directions: the nuances

61
of the operational environment by the user to the technologist, and the capabilities of new
technologies from the technologists to the user. The positive effect of customer
engagement on problem understanding under such a project appears to be significant.
62
References
1. Asplund and Sandpiper (1999). The survival of new products. Review of Industrial
Organizations, Vol. 15, pp. 215-237.
2. Bender, L. Walia, G., Kambhampaty, K., Nygard, K. E., and Nygard, T. E. (2012).
Social sensitivity and classroom team projects: an empirical investigation. In
Proceedings of the 43rd ACM technical symposium on Computer Science Education
(SIGCSE '12). ACM, New York, NY, USA, pp. 403-408.
3. Berkun, S. (2010). The Myths of Innovation. O’Reilly, Sebastopol, CA.
4. Brown, J. S. and Duguid, P. (2001). Knowledge and Organization: A Social-Practice
Perspective. Organization Science. Vol. 12, No. 2, pp. 198-213.
5. Brown, S. L. and Eisenhardt, K. M. (1995). Product development: past research,
present findings, and future directions. Academy of Management Review. Vol. 20,
No. 2, pp. 343-378.
6. Carlson, C. R. and Wilmot, W. (2006). Innovation: the five disciplines for creating
what customers want. Crown Random House, New York, NY.
7. Castka, P., Bamber, C. J., Sharp, J. M., and Belohoubek, P. (2001). Factors affecting
successful implementation of high performance teams. Team Performance
Management. Vol. 7, 7/8;
8. Chan, L. K., Lakonishok, J., and Sougiannis, T. (2001). The stock market valuation
of research and development expenditures. Journal of Finance. Vol. 61, No. 6.
9. Chesbrough, H. W. (2003). The Era of Open Innovation. MIT Sloan Management
Review. Vol. 44, No. 3.
10. Christensen, C. (1997). The innvator’s dilemma. Boston, MA: Harvard Business
School Press.
11. Cohen, M. D., March, J. G., and Olsen, J. P. (1972). A Garbage Can Model of
Organizational Choice. Administrative Science Quarterly. Vol. 17, No. 1, pp. 1-25
12. Cooper, R. G. (1979). The dimensions of industrial new product success and failure.
Journal of Marketing, Vol. 43, Summer 1979, pp. 93-103.
13. Cozijnsen, A. J., Vrakking, W. J., van Ijzerloo, M. (2000). Success and failure of 50
innovation projects in Dutch companies. European Journal of Innovation
Management, Vol. 3, No. 3, pp.150 - 159

63
14. Defense Science Board (2009). Fulfillment of urgent operational needs.
Washington, D.C.: Defense Science Board.
15. Department of the Air Force, Air Force Research Laboratory. AFRL Core Process 3,
Innovative Solutions to Near-Term Needs. AFRL Instruction 90-104, Vol. 3, 26 Mar
2010.
16. DiNardo, J. (2008). Natural experiments and quasi-natural experiments. The New
Palgrave Dictionary of Economics, edited by S. N. Durlauf, and L. E. Blume.
Basingstoke: Palgrave Macmillan
17. Drucker, P. F. (1967). Managing for results. Allied Publishers
18. Enkel, E., Perez-Freije, J. and Gassmann, O. (2005). Minimizing Market Risks
Through Customer Integration in New Product Development: Learning from Bad
Practice. Creativity and Innovation Management, 14: 425–437.
19. Esteves, J. M., Pastor, J., and Casanovas, J. (2003). A goal/question/metric research
proposal to monitor user involvement and participation in ERP implementation
projects. Information Resources Management Association Conference (IRMA),
Philadelphia, PA, May 2003, pp. 325-327.
20. Field, A. (2009). Discovering Statistics Using SPS. Third Edition. SAGE
Publications, London, U.K.
21. Foss, N. J., Laursen, K., and Pederson, T. (2010). Linking customer interaction and
innovation: the mediating role of new organizational practices. Organization Science.
Vol. 22, No. 4, July-August 2011, pp. 980-999.
22. Foster, R. (1986). Innovation: The attacker’s advantage. New York, NY: Simon and
Schuster.
23. Frambach, R.T. and Schillewaert, N.(2002). Organizational innovation adoption: a
multi-level framework of determinants and opportunities for future research. Journal
of Business Research, Volume 55, Number 2, pp. 163-176(14)
24. Franke, N. and Shah, S. (2003). How communities support innovative activities: an
exploration of assistance and sharing among end-users. Research Policy, 32 (1). pp.
157-178.
25. Freeman, C. (1971).Diffusion of technical innovation: Final Scientific Report, 1
December 1969-31 May 1971. Contract E00AR-70-0077. University of Sussex,
Brighton, U.K.

64
26. Garcia, R. and Calantone, R. (2002). A critical look at technological innovation
typology and innovativeness terminology: A literature review. Journal of Product
Innovation Management. Number 19, pp. 110-132.
27. Hackman, J. R. (2011). Collaborative intelligence: Using teams to solve hard
problems. Berrett-Koehler, San Francisco, CA.
28. Henard, D. H. and Szymanski, D. M. (2001). Why some new products are more
successful than others. Journal of Marketing Research, Vol. XXXVIII (August
2001), pp. 362-375.
29. Jollife, I. T. (2002). Principal component analysis. Springer-Verlag, New York,
NY.
30. Katzenbach, J. R., and D. K. Smith (1993). The wisdom of teams. Harvard Business
School Press, Cambridge, MA.
31. Lettl, C. (2005). Users as inventors and developers of radical innovation. Journal of
Customer Behavior, 4, pp. 277-297.
32. Lettl, C. (2007). User involvement competence for radical innovation. Journal of
Engineering and Technology Management. 24, 1-2, 53-75.
33. Maidique, M. A. and Zirger, B. J. (1984). The Stanford innovation project, phase I: a
study of success and failure in high technology innovation. IEEE Transactions on
Engineering Management, EM-31:4, 1984, pp. 192-203.
34. Morrison, P. D., Roberts, J. H. and von Hippel, E. (2000). Determinants of User
Innovation and Innovation Sharing in a Local Market. Management Science. Vol.
46, No. 12., pp. 1513-1527.
35. Oslo Manual (1992, 2005). The measurement of scientific and technological
activities. Proposed guidelines for collecting and interpreting technological
innovation data. OECD, Paris.
36. Polanyi, M. (1962). Tacit knowledge: Its bearing on some problems of philosophy.
Reviews of Modern Physics. No. 34, pp. 601-616.
37. Porter, M. (1980). Competitive Strategy. The Free Press. New York, NY.
38. Prahalad, Reid, S. and de Brentani, U. (2004). The Fuzzy Front End of New Product
Development for Discontinuous Innovations: A Theoretical Model. Journal of
Product Innovation Management. 21, pp. 170-184.
65
39. Reusser, K. (1988). Problem solving beyond the logic of things: contextual effects on
understanding and solving word problems. Instructional Science, Vol. 17, pp. 309-
338.
40. Roberts , E. B. (1988). What we’ve learned: managing invention and innovation.
Research Technology Management. 31, 1. pp. 11-29
41. Rogers, M. (1998). The definition and measurement of innovation. Melbourne
Institute working paper. No. 10/98.
42. Rogers, E. (2003). The Diffusion of Innovations. Fifth Edition. The Free Press. New
York, NY.
43. Rollins, M. and Halinen, A. (2005). Customer Knowledge Management
Competence: Towards a theoretical framework. Proceedings of the 38th
Hawaii
International Conference on System Science, Hawaii, USA.
44. Schreier, M. and Prügl, R. W. (2008). Extending lead user theory: Antecedents and
consequences of consumers’ lead userness. Journal of Product Innovation
Management. Vol. 25, (4), pp. 331-346.
45. Slater, S. F. (1997). Developing a customer value-based theory of the firm. Journal
of the Acadamy of Marketing Science. Vol. 25, no. 2, pp. 162-167.
46. Solomon, C. (2008). An analysis of methodologies and best practices for rapidly
acquiring technologies to meet urgent warfighter needs. Masters Thesis, Department
of Engineering Management, Air Force Institute of Technology, Wright-Patterson Air
Force Base, OH.
47. Tushman, M. and Anderson, P. (1986). Technological discontinuities and
organizational environments. Administrative Science Quarterly. Vol. 31, pp. 439-
465.
48. James M Utterback, J. M. and Abernathy, W. J. (1975). A dynamic model of process
and product innovation, Omega, Volume 3, Issue 6, pp. 639-656
49. Utterback, J. M. (1994). Mastering the dynamics of innovation. Boston, MA:
Harvard Business School Press.
50. U.S. Trade and Patent Office. n. pag. http://www.uspto.gov/about/stats/index.jsp. 17
April 2012.
51. Van de Ven, A. H. (1986). Central problems in the management of innovation.
Managemetn Science, Vol. 32, No. 5, pp. 590-607.
66
52. van der Panne, G., van Beers, C. and Kleinknecht, A. (2003). Success and failure of
innovation: a literature review. International Journal of Innovation Management.
Vol., 7, No. 3, pp. 1-30.
53. von Hippel, E. (1976). The Dominant Role of Users in the Scientific Instrument
Innovation Process. Research Policy. Vol 5, pp. 212-239.
54. von Hippel, E. (1986). Lead Users: A source of novel product concepts.
Management Science. Vol.32, No. 7, pp. 791-805.
55. von Hippel, E. (1988). The Sources of Innovation. Oxford University Press, New
York, NY.
56. von Hippel, E. (1994). Sticky information and the locus of problem solving:
implications for innovation. Management Science, Vol. 40, No. 4, pp. 429–439.
57. von Hippel, E. (2005). Democratizing Innovation. MIT Press. Cambridge, MA.
67
Vita
Mr. Scott Skiple has 29 years of experience in DoD Acquisition with both the
U.S. Army and U.S. Air Force. After graduating from North Dakota State University
with a Bachelor’s Degree in Mechanical Engineering, Scott attended the Army Intern
Training Center at Red River Army Depot, Texas in the Product/Production Engineering
Program before moving to the Army Aviation Systems Command in St. Louis, Missouri,
working as an industrial and aerospace engineer. In 1997, Mr. Skiple moved to the Air
Vehicles Directorate in the Air Force Research Laboratory (AFRL), Wright-Patterson Air
Force Base (WPAFB) as a plans and programs engineer supporting the Joint Aeronautical
Commanders Group. From April 2000 to July 2003, Mr. Skiple worked for the U.S.
Army Research, Development and Standardization Group (USARDG) in London, UK,
serving as the liaison with the U.K. Ministry of Defence for aviation. Since his return to
AFRL and WPAFB in 2003, he has held several positions as a senior planning and
programming engineer in the Air Vehicles Directorate and in AFRL Headquarters.

REPORT DOCUMENTATION PAGE Form Approved OMB No. 0704–0188
The public reporting burden for this collection of information is estimated to average 1 hour per response, including the time for reviewing instructions, searching existing data sources, gathering and maintaining the data needed, and completing and reviewing the collection of information. Send comments regarding this burden estimate or any other aspect of this collection of information, including suggestions for reducing this burden to Department of Defense, Washington Headquarters Services, Directorate
for Information Operations and Reports (0704–0188), 1215 Jefferson Davis Highway, Suite 1204, Arlington, VA 22202–4302. Respondents should be aware that
notwithstanding any other provision of law, no person shall be subject to any penalty for failing to comply with a collection of information if it does not display a currently valid OMB control number. PLEASE DO NOT RETURN YOUR FORM TO THE ABOVE ADDRESS.
1. REPORT DATE (DD–MM–YYYY)
17-12-2012 2. REPORT TYPE
Master’s Thesis 3. DATES COVERED (From — To) Oct 2010 – Dec 2012
4. TITLE AND SUBTITLE
The Role of Customer Engagement in Innovation Adoption 5a. CONTRACT NUMBER
5b. GRANT NUMBER
5c. PROGRAM ELEMENT NUMBER
6. AUTHOR(S)
Mr. Scott A. Skiple, DR-III (GS-14), DAF
5d. PROJECT NUMBER
5e. TASK NUMBER
5f. WORK UNIT NUMBER
7. PERFORMING ORGANIZATION NAME(S) AND ADDRESS(ES)
Air Force Institute of Technology Graduate School of Engineering and Management (AFIT/ENV) 2950 Hobson Way WPAFB OH 45433-7765
8. PERFORMING ORGANIZATION REPORT NUMBER AFIT-ENV-12-D-01
9. SPONSORING / MONITORING AGENCY NAME(S) AND ADDRESS(ES)
INTENTIONALLY LEFT BLANK
10. SPONSOR/MONITOR’S ACRONYM(S)
11. SPONSOR/MONITOR’S REPORT NUMBER(S)
12. DISTRIBUTION / AVAILABILITY STATEMENT
DISTRIBUTION STATEMENT A: APPROVED FOR PUBLIC RELEASE; DISTRIBUTION UNLIMITED
13. SUPPLEMENTARY NOTES This material is declared a work of the U.S. Government and is not subject to copyright protection in the United States.
14. ABSTRACT
Full knowledge of a customer’s true unmet need should improve the likelihood of providing that customer with an Option that meets the need. Since there is inherent risk in making any change, that customer will be more likely to accept the risk they more they understand the option. Both the customer and the solution provider possess knowledge that the other needs, knowledge which is often highly contextual and difficult to transfer, and thus a sufficiently close relationship between the customer and the solution provider should improve this knowledge transfer. It is, however, exceedingly difficult to measure this relationship, or the level of understanding achieved, and its impact on the adoption of an innovative solution due the wide range of conditions under which change takes place. There is a concern that involving the customer will tend to lead to more constraints and desires being expressed by the customer. Projects conducted under the U.S. Air Force Core Process Three (CP-3) program, which share a number of common traits, served as the basis for this research in isolating the effect of customer engagement on innovation adoption. Technologists in CP-3 projects were surveyed for their assessments of customer engagement, their own understanding of the customer’s true need, and the risk they felt the customer was willing to accept. This research showed that customer engagement does lead to an increase in the understanding of the need and, further, that higher levels of engagement lead to a convergent customer “voice” that does not result in an increase in customer requirements.
15. SUBJECT TERMS
Innovation, Adoption, Customer Need
16. SECURITY CLASSIFICATION OF: 17. LIMITATION OF ABSTRACT
UU
18. NUMBER OF PAGES
78
19a. NAME OF RESPONSIBLE PERSON Dr. A.E. Thal
a. REPORT
U
b. ABSTRACT
U
c. THIS PAGE
U
19b. TELEPHONE NUMBER (Include Area Code) (937)255-3636, ext 7401
Standard Form 298 (Rev. 8–98) Prescribed by ANSI Std. Z39.18