the role of departmental absorptive capacities at the r&d ... · the relationship between ......
TRANSCRIPT

Paper to be presented at the
35th DRUID Celebration Conference 2013, Barcelona, Spain, June 17-19
The Role of Departmental Absorptive Capacities at the R&D-Marketing
Interface for Innovation PerformanceJ. Piet HausbergLUISS Guido Carli
Department of Business and [email protected]
AbstractBased on unique data from Italian manufacturing industries, we provide empirical evidence for the influence ofDepartmental Absorptive Capacities on Innovation Performance at the R&D-Marketing interface and its mediating role inthe relationship between (Cross-) Functional Integration Mechanisms and Innovation Performance. We measure theabilities of research and development (R&D) as well as marketing and sales (M&S) departments to absorb knowledgefrom their peer departments and from departments belonging to the respective other, complementary function; hereinFunctional (FAC) and Cross-Functional Absorptive Capacity (CFAC), respectively. We find that there are significant differences between the two functions in terms of effect sizes and significances. Inparticular, we find that R&D departments build CFAC via formal CFI mechanisms, while they build FAC by means ofinformal coordination, which appears to be true vice-versa for M&S departments. However, only for R&D departmentshas CFAC a significant and substantial effect on innovation performance. This corroborates also previous findingsregarding the relevance of market knowledge in the NPD process.This study provides two major contributions to the literature streams of Functional Integration (FI) and AbsorptiveCapacity (AC). Firstly, the concept of CFAC is operationalized and empirically investigated which can also serve infuture studies to reveal meso-foundations of the internal component of firm-level AC. Secondly, a better understandingof the relationship between FI and Innovation Performance is allowed for by introducing departments? ACs as mediatingvariables, which sheds some light on previously contrasting findings in CFI literature. Implications for theory and practiceare discussed.
Jelcodes:M10,-

The Role of Departmental Absorptive Capacities at the R&D-Marketing Interface for Innovation Performance 1
Abstract: Based on unique data from Italian manufacturing industries, we provide empirical evidence for the influence of Departmental Absorptive Capacities on Innovation Performance at the R&D-Marketing interface and its mediating role in the relationship between (Cross-) Functional Integration Mechanisms and Innovation Performance. We measure the abilities of research and development (R&D) as well as marketing and sales (M&S) departments to absorb knowledge from their peer departments and from departments belonging to the respective other, complementary function; herein Functional (FAC) and Cross-Functional Absorptive Capacity (CFAC), respectively. We find that there are significant differences between the two functions in terms of effect sizes and significances. In particular, we find that R&D departments build CFAC via formal CFI mechanisms, while they build FAC by means of informal coordination, which appears to be true vice-versa for M&S departments. However, only for R&D departments has CFAC a significant and substantial effect on innovation performance. This corroborates also previous findings regarding the relevance of market knowledge in the NPD process. This study provides two major contributions to the literature streams of Functional Integration (FI) and Absorptive Capacity (AC). Firstly, the concept of CFAC is operationalized and empirically investigated which can also serve in future studies to reveal meso-foundations of the internal component of firm-level AC. Secondly, a better understanding of the relationship between FI and Innovation Performance is allowed for by introducing departments’ ACs as mediating variables, which sheds some light on previously contrasting findings in CFI literature. Implications for theory and practice are discussed. Keywords: Absorptive Capacity; Cross-Functional Integration; R&D-Marketing Interface; Innovation JEL Codes: M10.
1 I am very thankful for most valuable comments by Peter S. H. Leeflang and Francesco Rullani. All errors
are mine.

2 / 49
1. Introduction
Although several studies find that innovation and performance are positively affected by
Absorptive Capacity (AC) (e.g. Rothaermel & Alexandre, 2009), AC literature lacks explicit
consideration of the knowledge type in focus (Volberda et al., 2010) as well as a consideration
of the construct on the level of functionally specialized departments, only now developed
(Hausberg, 2012). Indeed, rooted in the reasoning of the seminal articles by Cohen &
Levinthal (1989, 1990), AC has almost always at least implicitly on the firm level referred to
technological knowledge. However, in order to direct search activities and render them more
efficient, technological knowledge has to be complemented at least by market knowledge.
This necessity of cross-functional integration (CFI) of technological and market
knowledge is recognized in strategic management since decades (e.g. Iansiti & Clark, 1994),
but found only marginal consideration in an AC literature focused on R&D, although also
Zahra & George (2002) see social integration mechanisms in a key position of their
framework. In their model, social integration mechanisms impact the efficiency of
transformation of potential into realized AC. A notable exception, however, is the empirical
study by Jansen et al. (2005), in which the authors operationalize a multi-item scale for AC on
the sub-unit level and explicitly focus on intra-organizational antecedents and combinative
capabilities as its antecedents. However, the sub-units analyzed by Jansen and colleagues are
not functionally specialized, but appear to be rather full process integrated units, as their data
is based on branches of a single financial services provider. So the issue remains open
whether departmental AC can contribute to explain differentials in the success in
implementation of integration mechanisms in the innovation process.
In fact, an Absorptive Capacity (AC) perspective at functional interfaces on the level of
functionally specialized departments has never been applied so far to the best of my
knowledge, but could shed light on an essential part of the underlying dynamics. This is a

3 / 49
surprising research gap in that it could be shown that the explicit consideration of the nature
of the absorbed knowledge (e.g. market vs. technology knowledge) as well as the analysis of
lower levels of analysis are two important persisting research gaps in AC literature (Volberda
et al., 2010). In particular, Volberda and colleagues (2010:937) claim that “AC is a multilevel
construct and should be studied at the individual, unit, firm, and interfirm level of analysis”,
but find that extant empirical studies are largely limited to the analysis at the business unit or
subsidiary level.
When analyzing AC at this level of analysis, however, the distinction between two types
of AC is fundamental. Just as AC might be specific to a dyadic relationship (Dyer & Singh,
1998) it might be specific to the functional type. Moreover, different integration mechanisms
might have contrasting, partly off-setting influences on the distinct types of departmental AC
and these distinct types of AC might differently mediate or not the relationship between
integration mechanisms and innovation performance. A distinction between AC specific to
peer knowledge – Functional AC (FAC) – and AC regarding non-peer knowledge – Cross-
Functional AC (CFAC) – is hence crucial for a sound understanding of the actual mechanisms
behind the overall impact of integration mechanisms on innovation performance.
As emerged clearly from the long research tradition investigating departmentalization and
integration, the particularly high complementarity of market and technological knowledge can
be regarded as the principal cause of a largely positive effect of integration at the R&D-
marketing interface on innovation performance (e.g. Galbraith, 1974; Griffin & Hauser, 1996;
Gupta, Raj, & Wilemon, 1986; Lawrence & Lorsch, 1967; Ruekert & Walker, 1987).
Similarly, findings from literature on market orientation underline an influential role of the
marketing function that can significantly increase business performance (Jaworski & Kohli,
1993; Verhoef & Leeflang, 2009). On the other hand, however, several examples of negatives
outcomes of cross-functional integration have continuously been put forth (e.g. Bommer,
Delaporte, & Higgins, 2002; Hansen, 2009). Hence substantial divergence in findings persist
4 / 49
regarding the relation between cross-functional integration (CFI) and new product success and
hence ultimately innovation performance (cf. Troy, Hirunyawipada, & Paswan, 2008). The
fundamental relevance of department-level ACs is that these might mediate the relationship
between integration mechanisms and innovation performance.
The research question herein is therefore whether ACs of functionally specialized
departments, in particular the complementary Research & Development and Marketing &
Sales departments, mediate the relationship between different types of integration and
innovation performance and whether these effects differ across the two types of departments.
Hence, the aims of this study are the following. Firstly, we aim at showing the relevance of
two distinct particular capabilities of functional departments for integration and innovation
performance. It is important to know whether one or both of the departmental ACs mediates
the innovation impact of integration mechanisms. Secondly, it shall be shown whether there
are differences between formal and informal integration mechanisms regarding this
mediation. Thirdly, the direction of knowledge flow shall be evidenced by showing
significant differences across the two department types regarding the relevance of cross-
functional AC. Finally, we aim to provide a measurement instrument for future research into
departmental Absorptive Capacities.
The context of our study is the manufacturing industry in Italy. Due to the high
complementarity reported in literature regarding technological and market knowledge and the
related functions, we focus on the integration of R&D and Marketing. The level of analysis is
that of functionally specialized departments. Hence, we collected data via an online survey of
both Research & Development and Marketing & Sales professionals from manufacturing
firms selected from the AIDA database, an almost comprehensive database of Italian firms.
We find that there are significant differences between the two functions for various
effects. In particular, we find that R&D departments build CFAC via formal CFI mechanisms
and CFAC in turn strongly impacts innovation performance. Consequently, we find that

5 / 49
CFAC allows for a significantly positive indirect effect of CFI mechanisms on innovation
performance, while there can be found no direct effect from formal CFI mechanisms on
innovation performance nor an indirect effect of informal CFI. For M&S departments, on the
other hand, only the direct effect between formal CFI mechanisms and innovation
performance is significant. This corroborates also previous findings regarding the relevance of
market knowledge in the NPD process (Song, Xie, & Di Benedetto, 2001; Verhoef &
Leeflang, 2009). Marketing departments’ influence on innovation performance without the
need of capacity to absorb R&D knowledge underlines their role as knowledge deliverers.
In the following section we will discuss briefly the theoretical background and core
concepts. Subsequently the hypotheses of our conceptual model are developed after which we
describe our data and analyses and discuss the results. In the concluding section, implications
for theory and practice are presented along with the limitations of this study.
2. Hypotheses and Model
2.1. Departmental ACs
In extant literature on firm level AC, it has been suggested that it is composed by three or four
distinct sub-dimensions. Initially it was argued that AC is a combination of the ability to
recognize the value of external knowledge, assimilate it, and exploit it to commercial ends
(Cohen & Levinthal, 1990). In the literature strand that developed thereupon, this has been
refined and reconceptualized several times. Most importantly, it has been argued that it might
be distinguished between Potential and Realized AC, where the former is constituted by the
ability to acquire and assimilate external knowledge and the latter by the ability to transform
and exploit it (Zahra & George, 2002). In both conceptualizations of firm level AC arises the
necessarily the question of how organizational antecedents determine these different abilities,
and while a large body of literature developed around AC, there has been still identified a

6 / 49
substantial research gap (Volberda, Foss, & Lyles, 2010). Although Cohen & Levinthal
(1990) clearly defined their construct originally with regard to technological knowledge, it is
surprising how little the AC literature investigated whether an enlargement of the
understanding of AC might be fruitful in general or whether AC can help to explain when
market knowledge has a positive impact on innovation and general business performance. The
literature stream regarding cross-functional integration can cross-fertilize hence the research
strand of AC in this regard.
Hausberg (2012) developed a framework that suggests that the pattern of levels of
different boundaries that exists between departments specialized within the same corporate
function is fundamentally different from the pattern of the levels of these boundaries in case
these departments are from complementary corporate functions. The identified boundaries –
syntactic, sympathetic, teleological, semantic, and pragmatic – relate to three broader
categories of prior related knowledge that enable departments to overcome those boundaries.
However, since the levels of the boundaries are different according to whether knowledge
integration takes place in an inter- or intra-functional context, different types of prior related
knowledge are relevant.
2.2. Functional Integration Mechanisms and departmental ACs
In the extant literature, a broad range of integration mechanisms, both formal and informal
(e.g. Moenaert et al., 1994) as well as both intra- (e.g. Hoegl, Weinkauf, & Gemuenden,
2004) and cross-functional (e.g. Gupta et al., 1986; Olson et al., 2001), have been related
directly to innovation and/or performance. As can be deducted from Daft & Lengel’s (1987)
discussion of knowledge transfer channels, certain processes are inherently formal while
others informal. Moreover, the cumulative implementation of integration mechanisms with

7 / 49
increasing degrees of media richness is claimed to permit significant increases in information
processing capacity of organizational units (Sherman & Keller, 2011).
On the other hand, formalization is far from being considered only as positive for
performance. As March (1991) showed that due to short term benefits firms might tend to
overemphasize rather formalized, exploitative search, while neglecting less formalized and
hence more uncertain explorative search, which becomes detrimental for the ability to
produce radical innovations and for the survival in the long run.
Moreover, formalization can also hamper “good learning”. Firstly, organizational
learning theory suggests that several kinds of detrimental learning can occur in organizations,
such as superstitious learning (Argyris & Schön, 1996). Secondly, organizations can also find
themselves in a learning trap or competency trap (Levitt & March, 1988) or work based on
routines that have become core-rigidities (Leonard-Barton, 1992). If the department’s overall
approach to cross-functional integration becomes more and more rigid, it is less able to react
to substantial changes occurring eventually in the organization and its various departments.
Thus, a balance between formalized integration and spontaneous exchange and collaboration
has to be strived for. Both formal and informal integration mechanisms offer particular
opportunities for integration so that neither one can substitute the other.
Hypotheses 1: The more a department uses formal intra-functional integration mechanisms (FIM), the more FAC it develops.
Hypotheses 2: The more a department uses informal intra-functional integration mechanisms (IIM), the more FAC it develops.
This is different for cross-functional integration mechanisms, however. The order of relevance
of the different types of prior related knowledge is inverted at the cross-functional interface
(Hausberg, 2012). It is argued, that prior related relational knowledge is more important in
this case in order to bridge the sympathetic and teleological boundaries that are present to
higher degrees at this interface.

8 / 49
Hence, different types of departments might develop relational knowledge in different
ways and might profit from the various available integration mechanisms to different degrees.
Informal integration mechanisms can be expected to build relational knowledge also at cross-
functional interfaces. For example, (Pinto & Pinto, 1990) find particularly informal
integration mechanisms to have a significant influence on cross-functional project team
cooperation which in turn is found to impact significantly psychosocial outcomes, which can
be considered to be closely related to relational knowledge.
Hypothesis 3a: The more informal CFI mechanisms are used by M&S departments (IXM), the more CFAC they develop.
Hypothesis 3b: The more informal CFI mechanisms are used by R&D departments (IXM), the less CFAC they develop.
Pinto & Pinto (1990) could not find similar effect for formal integration mechanisms on
cross-functional project team collaboration, however. Moreover, in the particular context at
the R&D-M&S interface, it can be reminded that formal integration mechanisms are used
most successfully at particular stages of new product development and in order to make
market knowledge available to the R&D function (Ernst, Hoyer, & Rübsaamen, 2010; Song,
Thieme, & Xie, 1998). Since it is only the R&D unit, that receives knowledge in this context,
it is only the R&D that is incentivized to learn to integrate with the marketing and sales
departments and thus build relational knowledge.
Hypothesis 4a: The more formal CFI mechanisms (FXM) are used by R&D departments, the more CFAC they develop.
Hypothesis 4b: The use of formal CFI mechanisms (FXM) by M&S departments has no effect on their CFAC.
Another particularity of cross-functional interfaces vis-à-vis functional ones is the impact of
informal integration mechanisms at these former interfaces on the ability to integrate at the
latter ones. The most salient boundaries impeding integration at intra-functional interfaces, are
the semantic and pragmatic boundaries (Hausberg, 2012). As argued in favor of hypotheses 2

9 / 49
and 3, intra-functional informal integration mechanisms increase FAC and informal CFI
mechanisms increase CFAC. However, informal CFI mechanisms bear the potential to get
fast, spontaneous feedback on ideas previously out of search scope that might help to
reconcile conflicting interests.
For example, two R&D departments might disagree about the potential to integrate their
findings. If members of one of these departments have the possibility to use informal channels
to get spontaneous feedback from a complementary function a solution might be found that
either appears promising to both departments or gives a decisive weight to one of the two
conflicting views. This is crucial to bridge the pragmatic boundary that is potentially high
between departments of the same function. Thus, while informal CFI mechanisms positively
impact CFAC through decreasing principally the syntactic boundary (H3), they positively
impact FAC through decreasing the pragmatic boundary at the intra-functional interface:
Hypothesis 5: The more a department uses informal CFI mechanisms (IXM), the more FAC it develops.
FAC and CFAC are closely related. This overlap is due the conceptualization of FAC as kind
of fundamental AC of the department. FAC provides a general ability of knowledge
integration from other departments, while CFAC is a specialized supplement ability.
Therefore, the more FAC is developed the higher also CFAC.
Hypothesis 6: The higher a department’s FAC, the higher its CFAC.
2.3. Direct and Indirect effects on Innovation Performance
Effects of AC have not been observed among departments of different functional
specializations, however, but only within one functional setting or on higher levels, like the
transfer of more or less sticky practices among operational units (e.g. Szulanski, 1996) or
across subsidiaries of MNCs (e.g. Gupta & Govindarajan, 1991, 2000). In fact, the construct
of CFAC itself has not been studied before.

10 / 49
However, it can be argued that the direction of knowledge flow in integration is crucial
for whether a direct effect on innovation performance might be observed or not. In intra-
functional integration, there is no specific direction and departments need to be able to
integrate the knowledge in question. In case of CFI, however, there might be one function that
depends more fundamentally on insights from the other function. Thus only one side has to be
able to really integrate the others knowledge. This is particularly the case at the R&D-
Marketing interface.
Although a correlation has been found also between knowledge flows from R&D to
Marketing and NPD performance (Moenaert et al., 1994), other studies analyzing in-depth the
effect at various stages suggest the role of R&D-Marketing information to lie principally in
the provision of market feedback to the R&D department according to specific stages of the
NPD process (Brettel, Heinemann, Engelen, & Neubauer, 2011; Olson et al., 2001), e.g. in the
stages of market opportunity analysis, development and pretesting (Song et al., 1998), in the
creation of market orientation (Jaworski & Kohli, 1993) or customer connection (Moorman &
Rust, 1999). Therefore, effects analogous to those in hypotheses 7-11 for intra-functional
interfaces do apply at the R&D-Marketing interface only to the R&D function and hence have
to developed separately as follows:
Hypothesis 7a: The use of formal CFI mechanisms (FXM) by R&D departments has no effect on innovation performance (IPO).
Hypothesis 7b: The use of formal CFI mechanisms (FXM) by M&S departments positively affects innovation performance (IPO).
However, the implementation of knowledge integration mechanisms might be
problematic and hence the outcome not always positive for several reasons (cf. Troy et al.,
2008). As Sherman & Keller (2011) show, managers might well misperceive the task
interdependence of their own unit with other functional units and in consequence choose
wrong degrees of integration which lowers performance. Moreover, as has been discussed and
implied by various authors (e.g. Nadler & Tushman, 1978:618), the richness of transmission

11 / 49
channels is closely connected to their complexity, which imposes in turn a cost on the
management and transfer of knowledge. Managers might furthermore also misperceive the
degree of inherent complexity and tacitness of the knowledge sought after. This knowledge
that thus withstands transfer efforts to a considerable degree has been termed “sticky” (Von
Hippel, 1994) and requires different ways and degrees of integration than simple, easy-to-
transfer knowledge.
The potential capacity of specific knowledge integration mechanisms to convey more or
less rich information might not be completely valorized due to a lack of ability to use those
mechanisms. Just as everything people do, integration can be carried out with more or less
mastery and success. Thus the implementation of the processes in itself should not have
significant direct effects on innovation performance. This can be assumed to be the case
equally across functions for intra-functional integration.
Hypothesis 8: The use of formal intra-functional integration mechanisms (FIM) has no direct effect on innovation performance.
Hypothesis 9: The use of informal intra-functional integration mechanisms (IIM) has no direct effect on innovation performance.
Hypothesis 10: The use of informal CFI mechanisms (IXM) has no direct effect on innovation performance.
On the other hand, if this circumstance is recognized by the focal organizational unit, a
learning process might take place as suggested by the previous hypotheses linking the
implementation of integration mechanisms at the different interfaces to departmental ACs. In
fact, the experience with different types of integration mechanisms should enhance an
organizational unit’s understanding of when and how to select, implement and use them. So
departments as collectives with the necessary decision autonomy have to learn to integrate
with other departments in two important and complementary ways. They have to learn which
is the set of integration mechanisms that allows the most efficient integration with particular
other units and how to apply each mechanism most effectively.

12 / 49
This knowledge absorption is crucially important in the innovation process where more
fundamental and explorative discoveries can be made by means of recombination of
knowledge stuck in separated knowledge silos. It can be concluded thus, that FAC positively
impacts innovation performance:
Hypothesis 11: FAC of (a) R&D and (b) M&S departments exhibits a positive direct effect on innovation performance (IPO).
Once the departments developed thus FAC, they can valorize potential synergies and
complementarities that exist between them and other departments of their corporate function
by absorbing their knowledge. In fact, in studies of firms’ sub-unit’s absorptive capacity, the
recipient’s AC has been found also empirically to be a major determinant of the success or
failure of intra-organizational knowledge transfer (cf. Van Wijk et al., 2008). As regards the
department level, Luo et al. (2006) find that interdepartmental “cooperative ability”—defined
by the authors actually by means of absorptive capacity—among departments regarding
market knowledge positively impacts both customer and financial performance.
Hypothesis 12: CFAC of R&D departments exhibits a positive direct effect on innovation performance (IPO).
Hypothesis 12: CFAC of M&S departments exhibits no direct effect on innovation performance (IPO).
From the above discussion, several indirect effects are implied for R&D departments.
One indirect effects indicates that FAC positively mediates the effect of informal CFI
mechanisms. This means that it counterbalances the negative direct effect, potentially
completely neutralizing it. The other two indicate that CFAC mediates both FAC and formal
CFI mechanisms (FXM), thus evidencing the role of CFAC. Since CFI aims at providing the
necessary knowledge laterally directly to those who need in other functions due to task
interdependence, in order to valorize them this knowledge has to be absorbed successfully.
The mere collaboration without understanding is not sufficient for a receiving unit. In this
case, the receiving unit is hypothesized to be the R&D unit, which heavily relies on market

13 / 49
information to direct and orient its work towards current and better future or emerging market
demand. The marketing department as an information provider does not have to understand
technological knowledge that much. Thus, if the data confirms a direct effect of integration
mechanisms as hypothesized above for M&S departments and not for R&D departments,
while it supports the hypothesis of an indirect effect through CFAC, it clearly would support
the intuition of the direction of knowledge flow from marketing and sales towards R&D.
Hypothesis 13: FAC exhibits a positive indirect effect on innovation performance (IPO) via CFAC.
Hypothesis 14: For R&D departments, there is a positive indirect effect from the intensity of use of formal CFI mechanisms (FXM) via CFAC on Innovation Performance (IPO).
Hypothesis 15: For R&D departments, there is a positive indirect effect from the use of informal cross-functional integration mechanisms (IXM) via FAC on CFAC.
The entire set of hypotheses of the conceptual model can thus be summarized as
illustrated in Figure 1.
Figure 1: Conceptual model
Control variables not illustrated in the figure.

14 / 49
3. Methodology
3.1. Research design and Operationalization
3.1.1. General survey design, pretest, and construct validity
With the exception of the newly established construct of departmental ACs, all variables have
been measured based on items previously validated and used in management literature (see
Appendix B: Questionnaire). However, also the measurements for the new concepts FAC and
CFAC have been constructed based on items established in the literature measuring AC on the
organizational or sub-unit level, adapting them slightly to fit the context of the functionally
specialized departments chosen, i.e. Research & Development and Marketing & Sales. This
and all established scales can be found in the appendix together with their respective items
and reliability statistics. In order to avoid any biases related to the sequence of items in a
battery, all item batteries used have been presented in a random order.
Particular care was taken to avoid the creation of an overly lengthy questionnaire that
could have increased the number of interruptions of compilation and thus incomplete
responses. The survey software automatically records response times, but cannot recognize
whether the window is active or just open in the background, which is why there are quite a
few very high values and thus the mean does not make sense here. The median response time,
though, is more informative and was approximately 15 minutes.
Moreover, construct validity was assessed in two steps. In a first step, the questionnaire
was discussed with senior researchers from both innovation management and marketing. In a
second step, a pretest with several professionals was made who where afterwards interviewed
on comprehensibility and validity of the constructs. Both, researchers and professionals have
been Italian mother tongue with excellent comprehension of English and asked also to
confirm the validity of the translation. However, the questionnaire language could be chosen
and changed online by the respondents. Good construct validity can thus be assumed.

15 / 49
3.1.2. Operationalization
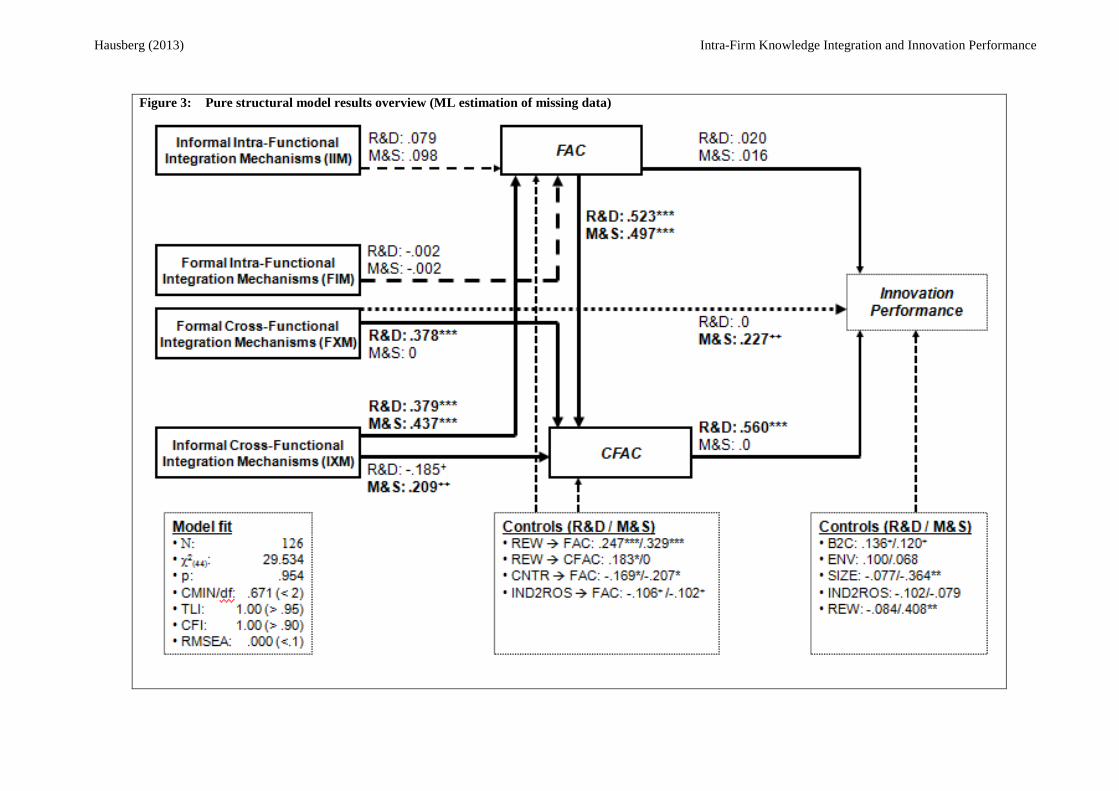
Innovation Performance and new product performance have been measured with a range of
different single- and multi-item scales (Moorman & Rust, 1999; Song, Kawakami, &
Stringfellow, 2010; Song et al., 1998). Herein, a set of items has been chosen to measure
innovation performance based on instruments used in both marketing and management
literature (Atuahene-Gima, Slater, & Olson, 2005; De Luca & Atuahene-Gima, 2007; Foss, Laursen,
& Pedersen, 2010). Innovation Performance was measured relative to the stated objectives
regarding the innovation process on the following four dimensions: market share (IPO1), sales
(IPO2), return on investment (IPO3), and product performance (IPO4).
In order to measure FAC and CFAC at the level of functional departments, items from
literature on Absorptive Capacity and knowledge integration (Flatten, Engelen, Zahra, &
Brettel, 2011; Hansen & Nohria, 2004; Jansen et al., 2005; Szulanski, 1996). A study that
comes particularly close to the measure of departmental AC is that of Luo et al. (2006).
Although the authors name their concept “cross-functional cooperative ability”, they measure
it with variables indicating it as a type of “absorptive capacity” at the department level, rather
than “cooperative ability”. However, their measure does not actually distinguish between the
knowledge domain and hence remains ignorant of the potential distinct natures of FAC and
CFAC. Herein, instead, this distinction is at focus and it was aimed to measure these concepts
as distinct, underlined as discussed below by their good discriminant validity and distinct
effects.
Particular care was taken to select from previous literature only reflective items and that
these were coherent with the theoretic conceptualization of the construct as ability, rather than
a capability or a set of processes and routines; that is, those that do not ask “how extensively
do you apply process X (a process that aims at knowledge absorption)?”, but instead “how
successful are you with Y (an aspect of knowledge absorption)?”. Furthermore, items have
been chosen to represent the four distinct sub-dimensions theorized for both higher level AC

16 / 49
(Zahra & George, 2002) as well as department level ACs (Hausberg, 2012), which have
recently been validated in several studies .
Formal and informal integration mechanisms each at both types of interfaces, thus
obtaining four variables; i.e. Formal (FIM) and Informal (IIM) Intra-functional integration
Mechanisms as well as Formal (FXM) and Informal (IXM) Cross-functional integration
Mechanisms. Informal integration was measured with four items from previous literature
(Zahra & Nielsen, 2002) as a reflective scale, thus indicating the degree of a latent informal
integration. While functional integration has been measured also uni-dimensional in the past,
for example by means of extensiveness of use of cross-disciplinary teams within the R&D
function (Henderson & Clark, 1990), formal integration mechanisms have been adopted from
previous literature treating this as a formative, multi-dimensional scale (Gupta &
Govindarajan, 2000; Jansen, Van den Bosch, & Volberda, 2005). The formative scale of
formal integration mechanisms was also measured with an additional item in order to have a
more complete construct, which is particularly important for formative constructs (Edwards &
Bagozzi, 2000).
3.1.3. Control variables
3.1.3.1. Industry
For industry was controlled because several studies have shown significant differences in both
innovation approaches as well as innovation outcomes across industries which might
consequentially lead to spurious results (Pavitt, 1984). It is controlled for this by means of a
variable computed as the mean of the cost of employees per turnover ratio of all eligible firms
from a particular industry sector in the AIDA database based on the 2 digit ATECO code,
which is the Italian implementation of the European NACE classification. Alternatively, it is
controlled by the industry average Return on Sales (ROS) as calculated based on the 2 digit
ATECO code (e.g. Coombs & Bierly, 2006). Finally, common industry dummies have been
used in simple regression analysis as a final check (e.g. Cassiman & Veugelers, 2006).

17 / 49
3.1.3.2. Firm size
Firm size was included as a further control variable, since it has turned out frequently that
firm size effects innovation performance as well as business performance. Herein, the most
common measure of firm size is applied, i.e. the logarithm of the number of full-time
equivalent employees.
3.1.3.3. Centralization
This argument is closely connected to another variable that we want to control for, that is the
degree of centralization, which has been found an important factor in market orientation
(Jaworski & Kohli, 1993). The same measure is applied herein.
3.1.3.4. B2C/B2B
An important control variable to include is the degree to which the firm or business unit
directly serves end consumers (business-to-consumer, B2C) rather than other businesses
(business-to-business, B2B). As argued for example by Homburg, Workman, & Krohmer
(1999), a higher degree of sales to other business rather than directly to end consumers could
increase the interaction of units from functions other than marketing with customers and
hence decrease the power of the marketing function that derives from its exclusive provision
of market knowledge. The same measure is applied as in previous literature.
3.1.3.5. Environmental turbulence
Several studies find that environmental turbulence impacts the innovation behavior and
outcomes of integration activities (Lawrence & Lorsch, 1967; Olson et al., 2001). A positive
impact on innovation performance is expected. Environmental turbulence is measured by
means of a formative item battery used in previous literature (Verhoef & Leeflang, 2009).
3.1.3.6. Market oriented reward mechanisms
The market oriented reward mechanisms in place have been found to impact significantly on
market orientation (Jaworski & Kohli, 1993), which is closely related to functional integration
success, as well as on NPD performance (Song, Montoya-Weiss, & Schmidt, 1997), which in

18 / 49
turn is closely related to innovation performance. Moreover, rewards might even interact with
market orientation on innovation performance (Wei & Atuahene-Gima, 2009). This shows
that rewards as performance pay might inflate spuriously the relationship between CFAC and
Innovation Performance impacting both positively. They might generally incentivize to try to
improve results wherever possible, i.e. to search harder for knowledge in every direction
(FAC and CFAC) as well as to augment directly innovation performance through increased
engagement. Items previously developed in literature for this purpose have been used
(Jaworski & Kohli, 1993), but not as a reflective scale, but as formative. This specification
appears more appropriate since single measures implemented by the firm do not have to come
necessarily together and reflect a latent reward orientation. At the most it could be argued that
it reflects a latent propensity of top management to implement market oriented reward
schemes. It seems more appropriate thus to assume that each reward mechanism does what it
is implemented for at least to some degree and that they thus cumulatively explain the latent
variable. This choice is justified by empirical observation of inter-item correlations (see
discussion below in results section).
3.2. Sample size and missing data
Even though SEM models have found to possibly perform well even with sample sizes as low
as 50 (Iacobucci, 2010), adequacy of sample size depends on the number of observed
variables and for better convergence and reduction of bias it should be aimed at sample sizes
above 100 cases, preferably even above 200 (Bagozzi & Yi, 2012). The sample here includes
126 subjects and thus is an adequate size, though towards the lower bound.
Although the two models of an SEM, i.e. the measurement model and the structural
model, are often estimated in one-step simultaneously, also two-step approaches testing first
the measurement model alone followed by the estimation of both simultaneously have been
suggested to isolate the goodness of fit of each of the two models (Anderson & Gerbing,

19 / 49
1988). However, since the adequacy of a sample’s size might be connected to the number of
distinct parameters to be estimated by a model, it might be indicated to reduce eventual
problems by estimating the two models comprised by a full SEM separately. However, to
further check robustness to sample size in terms of stable parameter estimates both models,
the measurement and the pure structural model, have been estimated with the first 100 cases
and with the final set of 126 cases with no indication of any substantial changes to overall
model or single parameters.
Missing data can have serious effects on data quality and hence the conclusions that can
be drawn from empirical data. Missing data is commonly distinguished as missing completely
at random (MCAR), missing at random (MAR), and not missing at random (NMAR) (Byrne,
2010; Schafer & Graham, 2002). It seems good practice not to delete listwise if not absolutely
necessary but to impute missing observations and to check for robustness of results applying
different imputation techniques. In this study some cases had to be deleted listwise since in
some cases far more than half of the answers were missing while for the rest of cases with
missing data this could be imputed (see detailed description below in the paragraph on data).
The two most common imputation techniques have been chosen and imputation has been
performed twice, once by dint of variable means and once via ML estimation as available in
AMOS. All analyses of the measurement and structural models have been executed based on
both kinds of imputation techniques. Results do not differ in conclusions, which allows for
higher confidence with the assumption that the missing data meets the MAR condition. In
fact, simulation studies on imputation techniques claiming imputation based on ML being
more efficient are confirmed in that standard errors of parameter estimates of the analyses
with ML imputed data are smaller. This is why principally the results based on this technique
are reported, while it is referred to the alternative analyses only for robustness checks that are
not possible with this technique (like checking SRMR values or examining standardized
residual covariance matrixes).

20 / 49
4. Results and Discussion
4.1. Data
We collected data from the Italian manufacturing industry. In a first step we selected all
Italian manufacturing firms from the AIDA database of Italian public and private firms. This
database has been used in many previous studies and has been described as almost exhaustive,
including not only publicly listed companies but also privately held SMEs. The list then
included 3769 firms with at least 200 employees. From this list, several firms had to be
dropped because they were no longer active. In a second step an online pool of potential
survey participants was accessed that permits to select professionals by firm and department
so that only individuals were selected that worked since at least one year in either an R&D or
M&S department of a firm from the remaining set of firms. Thus 541 individual professionals
could be matched to R&D and M&S departments and firms in which they worked at least one
year. Matches of professionals that worked less than one year in a firm of the sample have
been excluded because their responses cannot be assumed to reliable enough estimations of
department abilities since the process of socialization might take some time. The thus
matched professionals where then contacted with the request to complete our online
questionnaire. As shown in Figure 5, the distribution of experience of survey participants is
inclined towards less than what can be expected as the mean experience, which is however
due to an overrepresentation of younger professionals in the database itself. The effect seems
to be very limited however and industry sector experience should not bias the results of this
particular research question. The questionnaire was hosted on a dedicated server under the
official university domain and password protected in order to further signal careful and
confidential use of the participants’ data. Moreover, in the contact e-mail all participants were
assured not only the confidentiality of their answers, but incentivized also with a personalized
benchmark report. There have been two rounds with reminder e-mails.

21 / 49
The received responses amounted to 140 of which 126 were sufficiently complete not to
be entirely deleted. Although it is preferable to impute missing data (see discussion above),
the cases in question were so early interrupted or so incomplete that less than half of answers
were filled in so that deleting them altogether was the only viable option. From the remaining
126, a small amount of missing item values has been imputed by ML estimation as provided
for in AMOS as well as by group variable means as a robustness check (cf. Byrne, 2010).
Although the missing values are largely distributed arbitrarily across cases and variables
which is indicated by the high number of cases per variable (mostly about 124 out of 126) but
low number of listwise valid cases (85), two variables, FXM and IXM, exhibit a higher
number of missing values for all its items (descriptive statistics are reported Table 4).
However, these missing values appear together casewise which indicates a problem of
comprehension of the questionnaire design where the two scales appeared in two columns
next to each other. In fact, individual feedback from practitioners reviewing again the
questionnaire confirmed that the fact that the scales where juxtaposed could be interpreted as
asking to respond only in one column instead of both, i.e. only in that with the headline
mentioning the own corporate function, which would result in answering only for FIM and
IXM, which are in fact as complete as the other variables. Since this problem of
understanding can be assumed to appear randomly, this allows for application of either one of
the imputation techniques, variable mean imputation as well as ML estimation. However,
even in these cases, less than 10% of cases are missing, which would still sufficiently limit
potential bias (Schafer & Graham, 2002).
Thus overall we achieved a response rate of almost 24%, which is a good rate for online
surveys of managers. These 126 complete questionnaires came from 51 marketing or sales
professionals while 75 came from research and/or development departments. The sectors
present in our final sample are automotive and suppliers, food and beverage, consumer
electronics and home appliances, telecommunications equipment, instruments and industrial

22 / 49
machinery, chemicals, etc. As indicated in Figure 4, the difference in sectoral composition is
not too different between the respondents and non-respondents. However, it was tested for
non-response bias using the financial data from the AIDA database. Since this was available
for both groups it was possible to test for significant differences in key variables potentially
related to the issue, above all performance indicators, but also indicators of differences
between sectors. This was done by means of a paired-sample t-test on mean differences for
each of the selected key variables for the overall groups as well as for the two sub-samples of
respondents from R&D and M&S departments. At no point significant differences could be
found thus indicating that it can be confidently assumed that non-response bias has not been a
major issue (cf. Table 3).
Common method bias (CMB) was checked for by means of Harman’s single factor test
that is commonly applied in cross-sectional studies (e.g. Verhoef & Leeflang, 2009). Thus, a
principal component analysis (PCA) on all items of the survey extracting factors with
eigenvalues above 1, which resulted in many factors explaining about 75% of total variance
and another PCA constraining the extraction of one single factor of the unrotated solution.
This single factor could explain only about 23.8% of total variance. We found thus no
indication that common method bias is a major problem. Although this method is the most
commonly used test, it can only potentially confirm that common method bias might be a
major problem, not proof the absence of less strong common method variance (cf. Podsakoff,
MacKenzie, Lee, & Podsakoff, 2003). Therefore, to avoid potential biases related to the
survey method several further measures were taken. To reduce the potential of social
desirability bias, particular care was taken signaling absolute anonymity of both individuals
and firms. In order to avoid biases due to the order of items, the items of all multi-item scales
have been presented in random order each time the site was accessed.

23 / 49
4.2. Measurement model
4.2.1. Reflective scales
A first check applied to every scale was that for sufficiently high inter-item correlations (cf.
Table 5 through Table 8). All have been found correlated at least above .45 and significant,
mostly at the 1%-level, with exception of some of the reversed coded items of the FAC and
CFAC scales. This is in line with the pattern of factor loadings identified by the exploratory
factor analysis, where all items of the reflective scales load together on their respective factors
with the exception of a few items of the FAC and CFAC scales.
Finally, the confirmatory factor analysis (CFA) for the entire measurement model was
run. An item purification process led to the elimination of several items from the original
scales because of too low factor loadings (< .55). The final model specification is illustrated
in Figure 2 together with factor loadings and inter-construct correlations. The model results in
terms of standardized estimates of factor loadings, item r-squares, as well as reliability and
validity measures of scales are reported in Table 1.
The model fit can be judged as fairly good notwithstanding a relatively high chi-square
value, because this value begins to be inflated from hundred cases upwards and all other
indicators show a good fit. Both the Tucker-Lewis-Index (TLI) and the comparative fit index
(CFI) are over .9 with values of .921 and .941, respectively, the root mean square error of
approximation (RMSEA) is with .063 in a well acceptable range (<.1 moderate; <.05 good),
and chi-square/d.f. is far below the conservative threshold of 2 with a value of 1.491.

24 / 49
Figure 2: Measurement model for reflective scales
Model fit is at least as good also for the solution with variable means imputed data for
which also the estimate of SRMR was well below the threshold of .08 (Hu & Bentler, 1999) 2.
Moreover, no indication of problems with model fit could be found based on a check of the
matrix of the standardized residual covariances available for the analysis with mean imputed
variable means3, since no value is larger than 2.58 (cf. Byrne, 1999:86).
2 SRMR is not reported by AMOS for data with missing values that are imputed by ML estimation. 3 Residual moments are not available in AMOS for data with missing values since different sample moments
are possible and residual moments are defined as the difference between implied and sample moments.

25 / 49
Table 1: Measurement model results (ML estimation of missing data)
��������� AB�C DE
F�B��B������
�����B��
���������
D���B������ ��� �F� �F�
����� � ����� �AA� �B�C� ��D�
� ����� EFFF� ����� ����� ������������ � � � �
� ������ EFFF� ����� �B�C� ��CC���� � � � �
� ������� EFFF� ����� ���A� ��C����� � � � �
���� � �AD�� ��AA� �B�C� ���C�
� ���� EFFF� ���� ��D� ��D�������� � � � �
� ���A� EFFF� ���� ����� �������� � � � �
� ����C� EFFF� ���� ����� ������� � � � �
� ������ EFFF� ���� ���C� ��D����� � � � �
� ����D� EFFF� ���� ��C�� ��BA���� � � � �
���� � ����� ����� ��B�� �C���
� ����� EFFF� ���� ��CD� ��B��������� � � � �
� ���B� EFFF� ���� ��DC� �AC����� � � � �
� ����� EFFF� ���� ��DD� ��C���� � � � �
���� � ��DC� ��C�� ��A�� ��CB�
� ����� EFFF� ���� �B�� ��B��������� � � � �
� ���D� EFFF� ���� ��D� ��AC���� � � � �
� ���B� EFFF� ���� ����� ��C���� � � � �
���� � ���A� ���� ����� ��C��
� ���B� EFFF� ���� ���A� ��AA�������� � � � �
� ����� EFFF� ���� ��DB� �AC����� � � � �
����� � ����� ���� ��D�� �C���
� ������ EFFF� ����� ��CA� ���D�������� � � � �
� ����D� EFFF� ����� �BA� ��B����� � � � �
� ������ EFFF� ����� ��AB� ��BB���� � � � �
� ����� EFFF� ����� ���A� �������� � � � �
������������D� �����E��CC�!����������"#$�#%#&��&'�(')'(��*+��,,(#&�-('�+*�%#.'/�,�0�1'+'0" ��D��������
DA�B�A �,����CCC ��D2/�%�������A� ��3�����AD� ��������A�� ���45�����C�B��AC6�&*�%#/'�&'�#�+'0)�(7�
�C������C��� �4�������*+�/'%#�'/�%*0�/�+��8#+9�1#""#�$�)�(:'"��
The values for composite reliability (CR) of all scales were largely above the .7 threshold
(Bagozzi & Yi, 1988). Moreover, for all variables convergent and discriminant validity is
achieved with average variance extracted (AVE) always smaller than CR and always greater
than both maximum shared squared variance (MSV) and average shared squared variance
(ASV).
Finally, it was tested for configural and metric invariance between the two sub-groups
R&D and M&S departments (cf. Byrne, 2009:197-230), both confirming full invariance
across the groups R&D and M&S (Table 11). Since the model exhibits a good fit, all
constructs are indicated as highly reliable and valid and measurement invariance has been

26 / 49
confirmed, values for all latent construct could be imputed to be used in the subsequent
separate estimation of the structural model4.
4.2.2. Formative Scales
For all formative scales, it is arguable whether to treat these indicators as reflective or as
formative. In fact, some of those scales argued to formative herein have been previously
treated as reflective (see discussion above in the corresponding paragraphs on the specific
scales). An important criterion is the logic of causal direction theorized, which should be
confirmed by high the inter-item correlations in case of reflective scales (Edwards & Bagozzi,
2000), because if there is a common latent factor influencing the items they have to be
correlated to some degree, while there is no such constraint if the indicators “form” the latent
variable. That means, in turn, that low inter-item correlations are good indicators for
formative measures, while high inter-item correlations are not per se indicative of either
direction. Indeed, for all scales herein argued to be formative the correlations, although quite
significant, are not as high as one should expect if they were reflective scales (Table 9 and
Table 10).
While commonly formative scales are simple, i.e. non-weighted averages of the equally
scaled items, formal integration mechanisms have been differently summed in extant
literature. In previous studies using the same items to measure cross-functional integration or
interfaces, these have been combined into a weighted average in previous studies, with
weights 1 for liaison personnel, 2 for temporary task forces and 3 for permanent teams (e.g.
Gupta & Govindarajan, 2000; Jansen et al., 2005). The same weights have been applied
4 It should be reminded that AMOS does likewise not report the estimate for multivariate normality for data
with missing values, but it has to be assumed that the multivariate normality assumption was violated, because it appears to be violated as reported for the data with missing values imputed by dint of variable means. Mardia’s coefficient (for multivariate kurtosis) is with a value of 29.810 much too high (< 3) and with a critical ratio of 4.351 also significantly so. Mahalanobis’ d-squared distance does not reveal any particular outliers. This could also explain the relatively high chi-square. To correct for a bias in the chi-square estimate a Bollen-Stine bootstrap with 2000 random samples has been performed on the mean imputed data. Only three random samples failed to yield a solution and had to be redrawn. The adjusted p-value was .640 (>.05) and suggests that we cannot reject the null that the model is correct.

27 / 49
herein, while the additional indicator, job rotation, is weighted with one, because it is closest
in nature to liaison personnel, since it involves only single individuals.
4.3. Structural model
The structural model is based on the above developed hypotheses and includes the described
control variables. As can be seen from the estimation based on the variable mean imputed
data, multivariate normality remains an issue for the R&D sub-sample, for which Mardia’s
coefficient was with a value of 13.750 (< 3) not acceptable (c.r. = 3.015), whereas there was
no such indication for the M&S sub-sample (kurtosis: 1.970, c.r.: .356). However, chi-square
statistic appear to be downward biased by this as it is exceptionally good (.910) as is the chi-
square/d.f. value (.731).
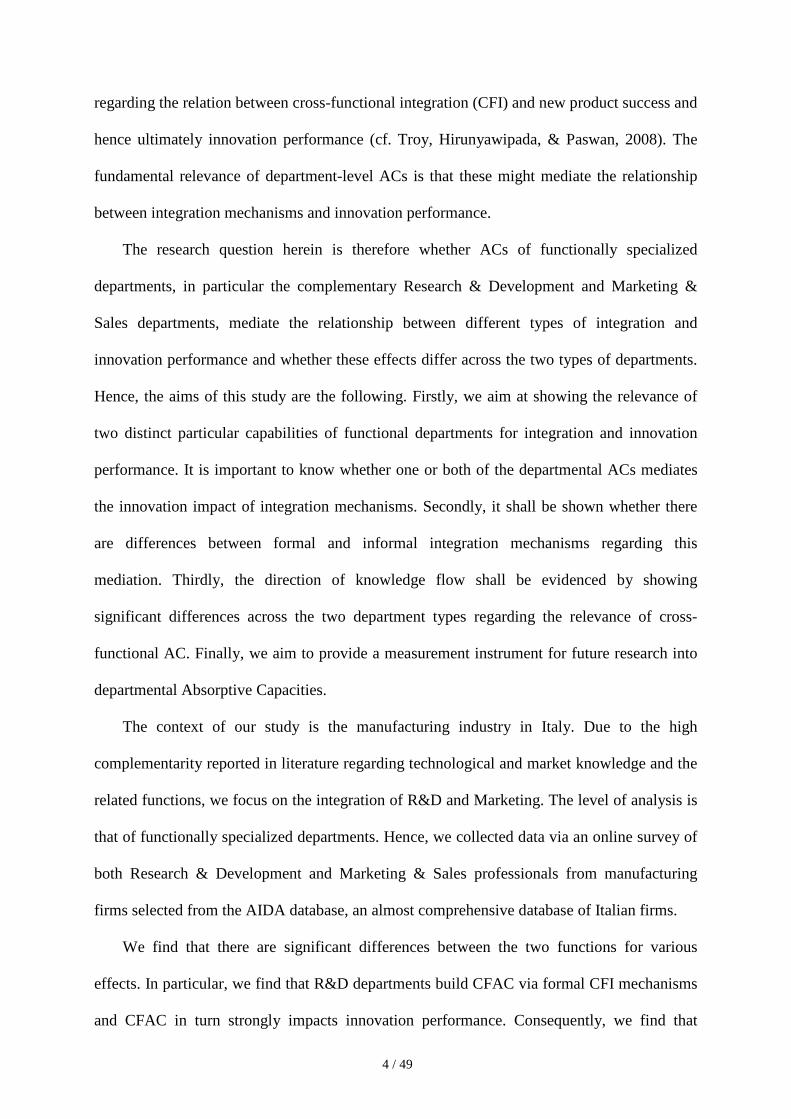
Examining the estimates (Table 2 and Figure 3) we could confirm several of our
hypotheses. First of all it can be stated that a good part of variance is explained by the model
for all three endogenous variables as R-squares for all three are between .35 and .59. Most of
the control variables load as predicted, with the exception of market oriented incentives and
firm size on innovation performance in case of R&D departments. Industry sectors as
measured by average return on sales of the sector has no effect, which is confirmed by mostly
not significant industry dummies in OLS regressions (see paragraph on further robustness
checks below).
As regards the main hypotheses, it can be highlight that CFAC significantly positively
impacts innovation performance as expected. This effect is robust across diverse model
specifications and all models that specify a direct effect of integration mechanisms onto
innovation performance had to be rejected due to bad model fit. On the other hand, however, I
cannot find evidence for the hypothesized direct effect of FAC on innovation performance.
Nonetheless, the hypothesized indirect effects through CFAC on innovation performance are
highly significant.

28 / 49
Table 2: Structural model results (ML estimation of missing data)
��
�� �!
�C���� AB�C DE
F�B��B�����������B����
�" ����� D������;<� �;4�
������;<��
������;4��
�B��
�AC� � �
=�7� ���� EFFF� ���� � F!CCD� F!CCD� >� �*+�&*�%#01'/�
=D7� ���� EFFF� ���� � !C�A� !CA�� >� �*+�&*�%#01'/�
=7� ���� EFFF� ���� � !B�A���� !�B����� >� &*�%#01'/�
�7� ���� EFFF� ����� � F!��A�� F!DC��� F� &*�%#01'/�
�7� ���� EFFF� ��<D��4� � F!�C�>� F!�CD
>� F� -*0/'0(#�'�
�7� ���� EFFF� �5?� � !D������ !BDA���� >� &*�%#01'/�
�������;<��
�������;4��
�DA�
��C��
� �
=B�7� ����� EFFF� �����;<�� � F!��>�
�F� -*0/'0(#�'�
=B-7� ����� EFFF� �����;4�� ��
!DCA>>
� >� -*0/'0(#�'�
=��7� ����� EFFF� �����;<�� � !B������ 2� >>� &*�%#01'/�
=�-7� ����� EFFF� �����;4�� ��
C� C� &*�%#01'/�
=�7� ����� EFFF� ���� � !DB���� !�A����� >>� &*�%#01'/�
�7� ����� EFFF� �5?��;<�� � !��B���
>� &*�%#01'/�
�7� ����� EFFF� �5?��;4�� ��
C� C� &*�%#01'/�
������;<��
������;4��
�B�D�
�B�� � �
=��7� ���� EFFF� �����;<�� � C��
C� &*�%#01'/�
=�-7� ���� EFFF� �����;4�� ��
!DD�>>
� >� -*0/'0(#�'�
=�7� ���� EFFF� ���� � C� C� C� &*�%#01'/�
=A7� ���� EFFF� ���� � C� C� C� &*�%#01'/�
=�C7� ���� EFFF� ���� � C� C� C� &*�%#01'/�
=��7� ���� EFFF� ���� � !CDC� !C��� >� �*+�&*�%#01'/�
=�D�7� ���� EFFF� ������;<�� � !�C�����
>>� &*�%#01'/�
=�D-7� ���� EFFF� ������;4�� ��
C� C� &*�%#01'/�
�7� ���� EFFF� @D�� � !�B�>� !�DC
>� >� -*0/'0(#�'�
�7� ���� EFFF� 5�A� � !�CC� !C��� >� �*+�&*�%#01'/�
�7� ���� EFFF� 4�B5��;<�� � F!C����
F� �*+�&*�%#01'/�
�7� ���� EFFF� 4�B5��;4�� ��
F!B����� F� &*�%#01'/�
�7� ���� EFFF� ��<D��4� � F!�CD� F!C�A� F� �*+�&*�%#01'/�
�7� ���� EFFF� �5?��;<�� � F!C����
>� �*+�&*�%#01'/�
�7� ���� EFFF� �5?��;4�� ��
!�C���� >� &*�%#01'/�
��/#0'&+�5%%'&+"7� � � �
� ����� EFFF� ����EFFF ����� � ��A����� F� >� &*�%#01'/�
� ���� EFFF� ����EFFF� ���� � �DC���� F� >� &*�%#01'/�
� ���� EFFF� ����EFFF ����� � �D�B���� F� >� &*�%#01'/�
������������D� �>�E����!�
>>�E��C�!���E��C!�����E��C������E��CC� ��
D�������DA�B� �,����A� ��
D2/�%�������� �
�3��������� ���������CC ���45�����CCC �4�������*+�/'%#�'/�%*0�/�+��8#+9�1#""#�$�)�(:'"��4#$�#%#&��&'�
(')'("�*%�#�/#0'&+�'%%'&+"�-�"'/�*��+8*F+�#('/�4*-'(F+'"+��
=C,*+9'"'"�0'$�0/#�$�D'0*�'%%'&+"�9�)'�-''��+'"+'/�-C�&*�"+0�#�#�$�+9'�,�0�1'+'0"�#��E:'"+#*��+*�
D'0*���/�&�(&:(�+'�+9'�&9#F"E:�0'�/#%%'0'�&'�+'"+�"+�+#"+#&�+*�&*1,�0'�#+�8#+9�+9'�:�&*�"+0�#�'/�
1*/'(���&&',+��&'�-�"'/�*��&9#F"E:�0'�/#%%'0'�&'�+'"+��(8�C"�&*#�&#/'/�8#+9�/'&#"#*��#%�-�"'/�*��
�F�#F'G"���%*01�+#*���0#+'0#*���������
Hausberg (2013) Intra-Firm Knowledge Integration and Innovation Performance
Figure 3: Pure structural model results overview (ML estimation of missing data)

Intra-Firm Knowledge Integration and Innovation Performance
30 / 49
For R&D departments it can be confirmed that formal CFI mechanisms (FXM) highly
significantly, positively impact CFAC, while informal CFI mechanisms (IXM) have an
slightly significant, negative effect on CFAC, and neither one impacts innovation
performance directly. This and all other zero-effect hypotheses were tested by chi-square
difference tests of the nested models. Moreover, evidence I find that these effects of formal
and informal CFI mechanisms are as predicted partly inversed when considering M&S
departments. Constraining the of formal CFI mechanisms (FXM) on CFAC of M&S
departments significantly improves model fit and the effect of informal mechanisms has a
positive rather than negative effect that is significant at 7%. Furthermore, we find support also
for the interrelation of FAC and CFAC in that FAC impacts significantly and highly positive
on CFAC. However, neither formal nor informal intra-functional integration mechanisms,
FIM and IIM respectively, could be confirmed as positive antecedents of FAC. However, the
positive effect of informal integration across functional domains (IXM) is found highly
significant for both R&D and M&S departments. In case of the R&D department, the fact that
the indirect effect from IXM through FAC on CFAC is highly significant and positive
compensates for the negative direct effect of IXM on CFAC, making for an total effect close
to zero. Together with the confirmation that the hypothesis of zero effects cannot be rejected
for direct paths of IXM onto innovation performance, this might explain previous contrasting
results that do find negative, no, or positive effects of integration on innovation performance.
Finally, and maybe most importantly, I can confirm that formal CFI mechanisms (FXM)
have the expected significant, positive direct effect on innovation performance for M&S
departments while they do not exhibit such an effect for R&D departments, where as
described above, the direct effect is zero but the indirect one is highly significant and positive.
This is evidence for the direction of knowledge flow between departments, i.e. that M&S
departments do not need CFAC to increase innovation performance because they deliver the
required knowledge without the necessity to absorb in turn R&D knowledge. R&D

31 / 49
departments on the other hand can use all formal integration mechanisms as much as possible,
but without learning how to use them to foster knowledge absorption the effect on innovation
performance will remain zero.
4.4. Further robustness checks Several competing models have been tested confirm the hypothesized model. Due to limited
space only three major competing models are reported here (Table 13). Most importantly, it
could be argued for reversed causality. That is, a higher degree of innovation performance
could increase the perception of managers of how able their department is in absorbing new
external knowledge. While this model performance better than the other competing model, it
still performance significantly worse than the other based on comparison of the AIC
(363.604) and the other model fit indicators.
Finally, OLS regression has been applied to confirm the principal hypotheses above. This
permits to check for robustness not only in terms of model configuration, but also in terms of
an alternative and more common way for industry effects, i.e. by means of the usual industry
dummies. All other controls and composite variables are those used in the structural model.
Contemporaneously, OLS permits also to check for multicollinearity issues by means of
inspection of the variance inflation factors (VIF). Here, all have been found between 1 and 2.
Finally, visual inspection for heteroskedasticity does not suggest such an issue for any of the
discussed OLS models.
A major hypothesis is supported by the OLS models. A two-tailed Sobel-test on the
indirect effect shows that it is slightly significantly different from zero at 6.5%. Following
established practice in testing for mediation effects (Baron & Kenny, 1986; Judd & Kenny,
1981), it can be concluded in conjunction with the finding that the initially direct positive
effect of FXM on innovation performance is crowded out in model 3 by CFAC it can be
concluded that this is not a simple indirect effect, but completely mediates the relation
between FXM and innovation performance.

32 / 49
5. Conclusion, Limitations and Future Research
I can conclude that in this study several contributions to seemingly mature research strands
are made based on an online-survey amongst R&D and M&S professionals from the Italian
manufacturing industry. Firstly, I succeeded to establish a valid and reliable empirical
measurement instrument for the previously only theorized (see first paper in this thesis)
constructs of Functional and Cross-functional Absorptive Capacity (FAC and CFAC
respectively). A refinement would be still desirable since it does not yet reflect the theorized
multi-dimensionality, but it is an important first step both for research and practice. Research
can use already these simpler scales for further inquiries while practitioners might already be
able to benchmark their departments based on this scale in order to judge the need to align
CFAC with FAC and learn how to learn. This is important since resources are always scarce
and if CFAC is already sufficiently high focus can be put on other likewise important issues.
On the other hand, if the R&D department costly developed a high degree of FAC and
integration mechanisms are in place to direct research activities but CFAC is low a good part
of potential the potential innovativeness from cross-functional integration is lost. In fact, it is
therefore the second important contribution of this empirical research is that the significant
positive mediation of the effect from formal cross-functional integration mechanisms on
innovation performance by departmental CFAC could be supported for R&D departments.
A third important contribution is to put forth evidence of a contrasting effect of informal
cross-functional integration on CFAC. In fact, it is important to note that informal cross-
functional integration mechanisms have a highly significant positive effect on FAC, which is
most congruent to a department-level version of higher level AC, while it has
contemporaneously a negative effect on CFAC. That is, it improves generally the ability to
understand what types of external knowledge from within the own functional domain are most
valuable due to the complementarity with other functional domains, but it likewise adds

33 / 49
confusion and too much potentially contradictory information that hinders integration from
these other functional domains. Since the indirect effect of informal cross-functional
integration via FAC on CFAC is highly significant and positive while the direct is
significantly negative, the total effect on CFAC and hence innovation performance is close to
zero. For innovation management theory this is an important deeper understanding of the
integration process in that it might explain previously contrasting results in the literature on
cross-functional integration and innovation performance. For management practice this shows
that informal, spontaneously communication might have serious pitfalls for R&D departments
that might be however avoided if managers are aware of them.
This study suffers also several limitations, however. Firstly, while the relatively limited
sample size appears not be a major issue as discussed above, results are limited so far to the
Italian context and a cross-national replication would add to the reliability of the
generalization of the results. Secondly, the fact that the data is cross-sectional data makes the
causal directions hinge fundamentally on the developed theory. It would add to the strength of
the causal inference to survey a follow up in one or two years time in order to actually
observe the evolution of departmental FAC and CFAC and their impact on innovation
performance.
Besides the proposed remedies to the limitations of this study, future research could
fruitfully address the issue of intra-firm heterogeneity in the development of these abilities
and what that means for example in the context of multinational corporations and globally
dispersed innovation activities. On close examination, the application of AC in form of FAC
and CFAC on the department level might thus open an important future research strand.

34 / 49
Appendix A: Figures & Tables Figure 4: Manufacturing industry sectors in final sample by 2-digit ATECO code

35 / 49
Table 3: Respondents / Non-respondents mean comparison 3')'�'H"��'"+� +F+'"+�%*0�5E:�(#+C�*%��'��"�
��� ���� �� 4#$�� +� /%�
4#$���DF
+�#('/��
�'���
<#%%'0'�&'�
4+/��500*0�
<#%%'0'�&'�5��3� ���� ����� �DD� D�� ��C�� A������ B���DB����
���<� �B�� �C� �B��� BA� ��C�� �CC�AC��A� D������AC�
4�354� �BB�� ��� �B��� BA� ��C�� A�A��CAD� D�AA����
5@��<�� ��A�C� ����� ����� BA� ��BB� B�B��C�� ������A�
5@��� �A�D� �BD� ��� BA� ��D� �CA����B� �D���CCA�
���� �C�� ��BD� F�B�C� BA� ��B�� F�DBA��� ��C���
��4� ���A� ���� F�B�A� BA� ��C� F�DD�C�� ��C�B��
��5� �D�� ���A� ��DD� B�� ����� ��BD��� ��������
�#F �� 4#$�� +� /%� 4#$���DF+�#('/��
�'���
<#%%'0'�&'� 4�5��<#%%'0'�&'�
5��3� �D�D� ���� FC�B��� D�D� ��D� FDC����� �����A��
���<� �C��� ���C� FC�CC� D�� �A�C� FDD����BC�� �B��C�A�C�
4�354� �C�� ���B� FC�C�� D�� �A�� FD��A��D�� �B��C���BA�
5@��<�� �C��� ��A� FC���B� D�� ��A� F�BAA��C� �C�B��DC�
5@��� �CCC� �AA�� FC�C�� D�� �A��� FD��C�� ������DB�
���� �CA�� ���� FC���A� D�� ���B� FC���C� ������
��4� ��AC�� ���A� F��D�C� D�� �D��� F��B�A� ��C���
��5� �BA�� �DA� C����� D�� ����� ��D�C� B�CDD�
D#�� �� 4#$�� +� /%� 4#$���DF+�#('/��
�'���
<#%%'0'�&'�
4+/��500*0�
<#%%'0'�&'�
5��3� D�CC�� ���� C����� D��� �C�� BDC��D�� ��A���A�
���<� ��D��� �D��� C��B�� D�B� �D�� DCA��C�C�B� BD�CA��C���
4�354� ��DB�� �D��� C���� D�B� ��A� DCB�B���B� B���B�����
5@��<�� B�CA�� �C�C� ��C�B� D�B� �DA�� �C������ �CB����B��
5@��� ���A�� ���D� C���� D�B� ����� ����C�C� AD��C�A�
���� �CC�� �A�C� C�DA�� D�B� ����� �D�D� �A���
��4� �CB�� ����� C��D�� D�B� �BB� �AC� �A��
��5� ��BD� ����� C����� D��� ��B�� ���D� D�B���
EMPL = number of employees; PROD = total value of production; SALES = turnover from sales; EBIT(DA) = Earnings before interests tax (depreciation and amortization); ROA = Return on assets; ROS = Return on sales; ROE = Return on equity
Figure 5: Histograms: Industry Experience of respondent (EXPI), left, and ROS, right.
EXPI40,030,020,010,00,0
Freq
uenc
y
20
15
10
5
0
EXPI
�Mean =13,3�Std. Dev. =7,723
N =123
ROS30,0020,0010,000,00-10,00-20,00
Fre
qu
ency
25
20
15
10
5
0
�Mean =3,95�Std. Dev. =7,117
N =124

36 / 49
Table 4: Descriptives N Min. Max. Mean Std. Dev. Skewness Kurtosis 126 Statistic Std. Error Statistic Std. Error FAC1 125 1,00 7,00 4,3120 1,59847 ,005 ,217 -,839 ,430 FAC2 124 1,00 7,00 3,1694 1,49101 ,333 ,217 -,637 ,431 FAC3 124 1,00 7,00 3,6694 1,61155 ,174 ,217 -1,102 ,431 FAC4 124 1,00 7,00 3,6532 1,74395 ,164 ,217 -,960 ,431 FAC5 124 1,00 7,00 4,1694 1,54983 -,048 ,217 -,697 ,431 FAC6 124 1,00 7,00 4,2903 1,44140 -,126 ,217 -,613 ,431 FAC7 124 1,00 7,00 4,1532 1,59799 ,073 ,217 -,877 ,431 FAC8 124 1,00 7,00 3,8790 1,67037 ,120 ,217 -,917 ,431 FAC9 123 1,00 7,00 4,3740 1,50626 -,236 ,218 -,586 ,433 FAC10 124 1,00 7,00 4,5887 1,50885 -,166 ,217 -,710 ,431 FAC11 124 1,00 7,00 4,5161 1,52744 -,045 ,217 -,815 ,431 FAC12 124 1,00 7,00 4,1855 1,32129 ,081 ,217 -,549 ,431 CFAC1 125 1,00 7,00 3,9040 1,49420 -,025 ,217 -,495 ,430 CFAC2 124 1,00 7,00 3,6855 1,59454 ,151 ,217 -,567 ,431 CFAC3 125 1,00 7,00 3,5120 1,66373 ,374 ,217 -,863 ,430 CFAC4 126 1,00 7,00 3,5238 1,60855 ,132 ,216 -1,044 ,428 CFAC5 126 1,00 7,00 4,1032 1,43571 ,212 ,216 -,476 ,428 CFAC6 124 1,00 7,00 3,9435 1,45559 -,077 ,217 -,569 ,431 CFAC7 126 1,00 7,00 4,1032 1,44681 -,167 ,216 -,691 ,428 CFAC8 125 1,00 7,00 4,0400 1,58318 -,129 ,217 -,722 ,430 CFAC9 126 2,00 7,00 4,1508 1,36860 ,142 ,216 -,810 ,428 CFAC10 126 1,00 7,00 4,2698 1,50950 -,244 ,216 -,642 ,428 CFAC11 126 1,00 7,00 4,1270 1,46415 ,165 ,216 -,824 ,428 CFAC12 124 1,00 7,00 3,9597 1,34587 ,013 ,217 -,781 ,431 FIM1 124 1,00 7,00 3,9435 1,77747 -,116 ,217 -,927 ,431 FIM2 125 1,00 7,00 4,0080 1,86000 ,011 ,217 -,997 ,430 FIM3 124 1,00 7,00 4,3226 1,85905 -,282 ,217 -,897 ,431 FIM4 126 1,00 7,00 2,9762 1,88240 ,591 ,216 -,790 ,428 IIM1 124 1,00 7,00 3,7177 1,85910 ,159 ,217 -1,026 ,431 IIM2 124 1,00 7,00 4,4274 1,79961 -,237 ,217 -1,002 ,431 IIM3 126 1,00 7,00 4,7143 1,69166 -,498 ,216 -,530 ,428 IIM4 122 1,00 7,00 4,6148 1,62850 -,243 ,219 -,881 ,435 FXM1 114 1,00 7,00 3,5175 1,98326 ,251 ,226 -1,156 ,449 FXM2 115 1,00 7,00 3,2783 1,94010 ,405 ,226 -1,020 ,447 FXM3 115 1,00 7,00 3,6609 2,03861 ,124 ,226 -1,285 ,447 FXM4 117 1,00 7,00 2,0171 1,37077 1,542 ,224 2,060 ,444 IXM1 116 1,00 7,00 3,0603 1,79995 ,673 ,225 -,509 ,446 IXM2 116 1,00 7,00 3,5259 1,90405 ,267 ,225 -1,144 ,446 IXM3 114 1,00 7,00 4,0526 1,84267 ,008 ,226 -,950 ,449 IXM4 114 1,00 7,00 4,0175 1,83372 -,096 ,226 -1,100 ,449 IPO1 121 1,00 7,00 4,3719 1,25255 -,118 ,220 -,290 ,437 IPO2 121 1,00 7,00 4,3388 1,22851 ,037 ,220 -,455 ,437 IPO3 122 1,00 7,00 4,3525 1,37223 -,095 ,219 -,478 ,435 IPO4 121 1,00 7,00 4,4711 1,42638 -,230 ,220 -,629 ,437 B2C 118 0 9 3,70 3,779 ,373 ,223 -1,607 ,442 ENV1 121 1 7 4,01 1,739 ,151 ,220 -1,066 ,437 ENV2 121 2 7 4,89 1,347 -,238 ,220 -,790 ,437 ENV3 121 1 7 4,76 1,571 -,277 ,220 -,717 ,437 ENV4 120 2 7 5,27 1,430 -,692 ,221 -,205 ,438 ENV5 118 1 7 4,65 1,458 -,165 ,223 -,811 ,442 REW1 118 1 7 3,70 1,878 ,086 ,223 -1,078 ,442 REW2 117 1 7 3,18 1,878 ,482 ,224 -,978 ,444 REW3 120 1 7 2,87 1,768 ,781 ,221 -,315 ,438 CNTR1 119 1 7 3,35 1,825 ,457 ,222 -,915 ,440 CNTR2 119 1 7 3,23 1,902 ,585 ,222 -,889 ,440 CNTR3 120 1 7 2,97 2,021 ,742 ,221 -,773 ,438 CNTR4 120 1 7 2,69 1,674 ,708 ,221 -,678 ,438 CNTR5 120 1 7 3,11 1,828 ,568 ,221 -,880 ,438 lgEMPL 123 2,33 4,40 3,0771 ,41531 ,955 ,218 1,064 ,433 IND2ROS 126 -,96 6,78 3,4077 1,49751 -,990 ,216 ,948 ,428 Valid N (listwise) 85

Intra-Firm Knowledge Integration and Innovation Performance
37 / 49
Table 5: Inter-Item Correlations FAC and CFAC FAC1 FAC2 FAC3 FAC4 FAC5 FAC6 FAC7 FAC8 FAC9 FAC10 FAC11 FAC12 CFAC1 CFAC2 CFAC3 CFAC4 CFAC5 CFAC6 CFAC7 CFAC8 CFAC9 CFAC10 CFAC11 CFAC12 FAC1 1 -,388(**) -,138 -,436(**) ,595(**) ,675(**) ,583(**) -,256(**) ,579(**) ,637(**) ,612(**) ,559(**) ,402(**) -,082 -,084 -,300(**) ,259(**) ,429(**) ,488(**) -,158 ,236(**) ,202(*) ,219(*) ,301(**) ,000 ,127 ,000 ,000 ,000 ,000 ,004 ,000 ,000 ,000 ,000 ,000 ,367 ,355 ,001 ,003 ,000 ,000 ,079 ,008 ,024 ,014 ,001 125 124 124 124 124 124 124 124 123 124 124 124 124 123 124 125 125 123 125 124 125 125 125 123 FAC2 -,388(**) 1 ,358(**) ,432(**) -,382(**) -,360(**) -,386(**) ,449(**) -,380(**) -,439(**) -,417(**) -,350(**) -,227(*) ,230(*) ,208(*) ,420(**) -,180(*) -,235(**) -,255(**) ,329(**) -,216(*) -,171 -,155 -,120 ,000 ,000 ,000 ,000 ,000 ,000 ,000 ,000 ,000 ,000 ,000 ,012 ,011 ,021 ,000 ,045 ,009 ,004 ,000 ,016 ,057 ,085 ,190 124 124 124 124 124 124 124 124 123 124 124 124 123 122 123 124 124 122 124 123 124 124 124 122 FAC3 -,138 ,358(**) 1 ,361(**) -,179(*) -,154 -,160 ,329(**) -,305(**) -,307(**) -,211(*) -,231(**) -,254(**) ,362(**) ,448(**) ,467(**) -,219(*) -,181(*) -,069 ,362(**) -,219(*) -,051 -,182(*) -,129 ,127 ,000 ,000 ,046 ,087 ,076 ,000 ,001 ,001 ,019 ,010 ,005 ,000 ,000 ,000 ,015 ,046 ,448 ,000 ,015 ,576 ,042 ,156 124 124 124 124 124 124 124 124 123 124 124 124 123 122 123 124 124 122 124 123 124 124 124 122 FAC4 -,436(**) ,432(**) ,361(**) 1 -,474(**) -,484(**) -,401(**) ,424(**) -,513(**) -,472(**) -,466(**) -,561(**) -,337(**) ,329(**) ,116 ,487(**) -,315(**) -,357(**) -,353(**) ,359(**) -,371(**) -,297(**) -,227(*) -,389(**) ,000 ,000 ,000 ,000 ,000 ,000 ,000 ,000 ,000 ,000 ,000 ,000 ,000 ,200 ,000 ,000 ,000 ,000 ,000 ,000 ,001 ,011 ,000 124 124 124 124 124 124 124 124 123 124 124 124 123 122 123 124 124 122 124 123 124 124 124 122 FAC5 ,595(**) -,382(**) -,179(*) -,474(**) 1 ,695(**) ,597(**) -,341(**) ,760(**) ,666(**) ,674(**) ,703(**) ,374(**) -,083 ,031 -,358(**) ,438(**) ,446(**) ,465(**) -,163 ,326(**) ,433(**) ,387(**) ,366(**) ,000 ,000 ,046 ,000 ,000 ,000 ,000 ,000 ,000 ,000 ,000 ,000 ,364 ,735 ,000 ,000 ,000 ,000 ,072 ,000 ,000 ,000 ,000 124 124 124 124 124 124 124 124 123 124 124 124 123 122 123 124 124 122 124 123 124 124 124 122 FAC6 ,675(**) -,360(**) -,154 -,484(**) ,695(**) 1 ,626(**) -,218(*) ,755(**) ,627(**) ,655(**) ,706(**) ,480(**) -,024 ,031 -,347(**) ,464(**) ,563(**) ,507(**) -,241(**) ,360(**) ,388(**) ,371(**) ,375(**) ,000 ,000 ,087 ,000 ,000 ,000 ,015 ,000 ,000 ,000 ,000 ,000 ,792 ,737 ,000 ,000 ,000 ,000 ,007 ,000 ,000 ,000 ,000 124 124 124 124 124 124 124 124 123 124 124 124 123 122 123 124 124 122 124 123 124 124 124 122 FAC7 ,583(**) -,386(**) -,160 -,401(**) ,597(**) ,626(**) 1 -,243(**) ,678(**) ,667(**) ,710(**) ,579(**) ,280(**) ,037 ,027 -,277(**) ,342(**) ,316(**) ,456(**) -,041 ,332(**) ,296(**) ,233(**) ,283(**) ,000 ,000 ,076 ,000 ,000 ,000 ,007 ,000 ,000 ,000 ,000 ,002 ,690 ,770 ,002 ,000 ,000 ,000 ,649 ,000 ,001 ,009 ,002 124 124 124 124 124 124 124 124 123 124 124 124 123 122 123 124 124 122 124 123 124 124 124 122 FAC8 -,256(**) ,449(**) ,329(**) ,424(**) -,341(**) -,218(*) -,243(**) 1 -,314(**) -,262(**) -,297(**) -,277(**) -,235(**) ,249(**) ,157 ,331(**) -,028 -,090 -,258(**) ,328(**) -,110 -,102 -,078 -,136 ,004 ,000 ,000 ,000 ,000 ,015 ,007 ,000 ,003 ,001 ,002 ,009 ,006 ,083 ,000 ,754 ,324 ,004 ,000 ,225 ,261 ,392 ,135 124 124 124 124 124 124 124 124 123 124 124 124 123 122 123 124 124 122 124 123 124 124 124 122 FAC9 ,579(**) -,380(**) -,305(**) -,513(**) ,760(**) ,755(**) ,678(**) -,314(**) 1 ,665(**) ,731(**) ,744(**) ,349(**) -,066 -,040 -,404(**) ,342(**) ,440(**) ,435(**) -,173 ,381(**) ,309(**) ,311(**) ,349(**) ,000 ,000 ,001 ,000 ,000 ,000 ,000 ,000 ,000 ,000 ,000 ,000 ,469 ,663 ,000 ,000 ,000 ,000 ,056 ,000 ,000 ,000 ,000 123 123 123 123 123 123 123 123 123 123 123 123 122 121 122 123 123 121 123 122 123 123 123 121 FAC10 ,637(**) -,439(**) -,307(**) -,472(**) ,666(**) ,627(**) ,667(**) -,262(**) ,665(**) 1 ,689(**) ,650(**) ,208(*) -,131 ,004 -,470(**) ,381(**) ,378(**) ,421(**) -,213(*) ,308(**) ,310(**) ,253(**) ,288(**) ,000 ,000 ,001 ,000 ,000 ,000 ,000 ,003 ,000 ,000 ,000 ,021 ,152 ,962 ,000 ,000 ,000 ,000 ,018 ,001 ,000 ,005 ,001 124 124 124 124 124 124 124 124 123 124 124 124 123 122 123 124 124 122 124 123 124 124 124 122 FAC11 ,612(**) -,417(**) -,211(*) -,466(**) ,674(**) ,655(**) ,710(**) -,297(**) ,731(**) ,689(**) 1 ,685(**) ,394(**) -,047 -,022 -,375(**) ,401(**) ,440(**) ,500(**) -,162 ,427(**) ,374(**) ,383(**) ,373(**) ,000 ,000 ,019 ,000 ,000 ,000 ,000 ,001 ,000 ,000 ,000 ,000 ,605 ,810 ,000 ,000 ,000 ,000 ,074 ,000 ,000 ,000 ,000 124 124 124 124 124 124 124 124 123 124 124 124 123 122 123 124 124 122 124 123 124 124 124 122 FAC12 ,559(**) -,350(**) -,231(**) -,561(**) ,703(**) ,706(**) ,579(**) -,277(**) ,744(**) ,650(**) ,685(**) 1 ,411(**) -,058 ,002 -,378(**) ,447(**) ,412(**) ,405(**) -,195(*) ,345(**) ,420(**) ,328(**) ,407(**) ,000 ,000 ,010 ,000 ,000 ,000 ,000 ,002 ,000 ,000 ,000 ,000 ,526 ,982 ,000 ,000 ,000 ,000 ,030 ,000 ,000 ,000 ,000 124 124 124 124 124 124 124 124 123 124 124 124 123 122 123 124 124 122 124 123 124 124 124 122 CFAC1 ,402(**) -,227(*) -,254(**) -,337(**) ,374(**) ,480(**) ,280(**) -,235(**) ,349(**) ,208(*) ,394(**) ,411(**) 1 -,269(**) -,262(**) -,384(**) ,496(**) ,594(**) ,391(**) -,264(**) ,432(**) ,425(**) ,535(**) ,509(**) ,000 ,012 ,005 ,000 ,000 ,000 ,002 ,009 ,000 ,021 ,000 ,000 ,002 ,003 ,000 ,000 ,000 ,000 ,003 ,000 ,000 ,000 ,000 124 123 123 123 123 123 123 123 122 123 123 123 125 124 125 125 125 124 125 125 125 125 125 124 CFAC2 -,082 ,230(*) ,362(**) ,329(**) -,083 -,024 ,037 ,249(**) -,066 -,131 -,047 -,058 -,269(**) 1 ,406(**) ,334(**) -,111 -,176 -,043 ,149 -,197(*) -,122 ,019 -,188(*) ,367 ,011 ,000 ,000 ,364 ,792 ,690 ,006 ,469 ,152 ,605 ,526 ,002 ,000 ,000 ,218 ,051 ,637 ,100 ,028 ,176 ,837 ,037 123 122 122 122 122 122 122 122 121 122 122 122 124 124 124 124 124 123 124 124 124 124 124 123 CFAC3 -,084 ,208(*) ,448(**) ,116 ,031 ,031 ,027 ,157 -,040 ,004 -,022 ,002 -,262(**) ,406(**) 1 ,243(**) -,112 -,098 -,127 ,200(*) -,209(*) -,016 -,167 -,096 ,355 ,021 ,000 ,200 ,735 ,737 ,770 ,083 ,663 ,962 ,810 ,982 ,003 ,000 ,006 ,215 ,277 ,157 ,025 ,019 ,862 ,062 ,290 124 123 123 123 123 123 123 123 122 123 123 123 125 124 125 125 125 124 125 125 125 125 125 124 CFAC4 -,300(**) ,420(**) ,467(**) ,487(**) -,358(**) -,347(**) -,277(**) ,331(**) -,404(**) -,470(**) -,375(**) -,378(**) -,384(**) ,334(**) ,243(**) 1 -,425(**) -,487(**) -,367(**) ,520(**) -,530(**) -,362(**) -,341(**) -,375(**) ,001 ,000 ,000 ,000 ,000 ,000 ,002 ,000 ,000 ,000 ,000 ,000 ,000 ,000 ,006 ,000 ,000 ,000 ,000 ,000 ,000 ,000 ,000 125 124 124 124 124 124 124 124 123 124 124 124 125 124 125 126 126 124 126 125 126 126 126 124 CFAC5 ,259(**) -,180(*) -,219(*) -,315(**) ,438(**) ,464(**) ,342(**) -,028 ,342(**) ,381(**) ,401(**) ,447(**) ,496(**) -,111 -,112 -,425(**) 1 ,518(**) ,576(**) -,331(**) ,574(**) ,570(**) ,728(**) ,441(**) ,003 ,045 ,015 ,000 ,000 ,000 ,000 ,754 ,000 ,000 ,000 ,000 ,000 ,218 ,215 ,000 ,000 ,000 ,000 ,000 ,000 ,000 ,000 125 124 124 124 124 124 124 124 123 124 124 124 125 124 125 126 126 124 126 125 126 126 126 124 CFAC6 ,429(**) -,235(**) -,181(*) -,357(**) ,446(**) ,563(**) ,316(**) -,090 ,440(**) ,378(**) ,440(**) ,412(**) ,594(**) -,176 -,098 -,487(**) ,518(**) 1 ,456(**) -,279(**) ,541(**) ,451(**) ,452(**) ,614(**) ,000 ,009 ,046 ,000 ,000 ,000 ,000 ,324 ,000 ,000 ,000 ,000 ,000 ,051 ,277 ,000 ,000 ,000 ,002 ,000 ,000 ,000 ,000 123 122 122 122 122 122 122 122 121 122 122 122 124 123 124 124 124 124 124 124 124 124 124 123 CFAC7 ,488(**) -,255(**) -,069 -,353(**) ,465(**) ,507(**) ,456(**) -,258(**) ,435(**) ,421(**) ,500(**) ,405(**) ,391(**) -,043 -,127 -,367(**) ,576(**) ,456(**) 1 -,360(**) ,469(**) ,430(**) ,556(**) ,500(**) ,000 ,004 ,448 ,000 ,000 ,000 ,000 ,004 ,000 ,000 ,000 ,000 ,000 ,637 ,157 ,000 ,000 ,000 ,000 ,000 ,000 ,000 ,000 125 124 124 124 124 124 124 124 123 124 124 124 125 124 125 126 126 124 126 125 126 126 126 124 CFAC8 -,158 ,329(**) ,362(**) ,359(**) -,163 -,241(**) -,041 ,328(**) -,173 -,213(*) -,162 -,195(*) -,264(**) ,149 ,200(*) ,520(**) -,331(**) -,279(**) -,360(**) 1 -,222(*) -,159 -,328(**) -,125 ,079 ,000 ,000 ,000 ,072 ,007 ,649 ,000 ,056 ,018 ,074 ,030 ,003 ,100 ,025 ,000 ,000 ,002 ,000 ,013 ,076 ,000 ,167 124 123 123 123 123 123 123 123 122 123 123 123 125 124 125 125 125 124 125 125 125 125 125 124 CFAC9 ,236(**) -,216(*) -,219(*) -,371(**) ,326(**) ,360(**) ,332(**) -,110 ,381(**) ,308(**) ,427(**) ,345(**) ,432(**) -,197(*) -,209(*) -,530(**) ,574(**) ,541(**) ,469(**) -,222(*) 1 ,611(**) ,533(**) ,521(**) ,008 ,016 ,015 ,000 ,000 ,000 ,000 ,225 ,000 ,001 ,000 ,000 ,000 ,028 ,019 ,000 ,000 ,000 ,000 ,013 ,000 ,000 ,000 125 124 124 124 124 124 124 124 123 124 124 124 125 124 125 126 126 124 126 125 126 126 126 124 CFAC10 ,202(*) -,171 -,051 -,297(**) ,433(**) ,388(**) ,296(**) -,102 ,309(**) ,310(**) ,374(**) ,420(**) ,425(**) -,122 -,016 -,362(**) ,570(**) ,451(**) ,430(**) -,159 ,611(**) 1 ,509(**) ,443(**) ,024 ,057 ,576 ,001 ,000 ,000 ,001 ,261 ,000 ,000 ,000 ,000 ,000 ,176 ,862 ,000 ,000 ,000 ,000 ,076 ,000 ,000 ,000 125 124 124 124 124 124 124 124 123 124 124 124 125 124 125 126 126 124 126 125 126 126 126 124 CFAC11 ,219(*) -,155 -,182(*) -,227(*) ,387(**) ,371(**) ,233(**) -,078 ,311(**) ,253(**) ,383(**) ,328(**) ,535(**) ,019 -,167 -,341(**) ,728(**) ,452(**) ,556(**) -,328(**) ,533(**) ,509(**) 1 ,384(**) ,014 ,085 ,042 ,011 ,000 ,000 ,009 ,392 ,000 ,005 ,000 ,000 ,000 ,837 ,062 ,000 ,000 ,000 ,000 ,000 ,000 ,000 ,000 125 124 124 124 124 124 124 124 123 124 124 124 125 124 125 126 126 124 126 125 126 126 126 124
** Correlation is significant at the 0.01 level (2-tailed). * Correlation is significant at the 0.05 level (2-tailed).

Intra-Firm Knowledge Integration and Innovation Performance
38 / 49
Table 6: Inter-Item Correlations IIM & IXM scales
IIM1 IIM2 IIM3 IIM4 IXM1 IXM2 IXM3 IXM4 IIM1 Pearson’s 1 ,371(**) ,412(**) ,550(**) ,522(**) ,239(*) ,202(*) ,273(**) Sig. ,000 ,000 ,000 ,000 ,010 ,032 ,004 N 124 123 124 121 114 114 114 112 IIM2 Pearson’s 1 ,559(**) ,509(**) ,309(**) ,471(**) ,213(*) ,271(**) Sig. ,000 ,000 ,001 ,000 ,023 ,004 N 124 124 121 115 115 114 113 IIM3 Pearson’s 1 ,634(**) ,203(*) ,192(*) ,420(**) ,250(**) Sig. ,000 ,029 ,039 ,000 ,007 N 126 122 116 116 114 114 IIM4 Pearson’s 1 ,303(**) ,283(**) ,325(**) ,476(**) Sig. ,001 ,002 ,000 ,000 N 122 112 112 111 112 IXM1 Pearson’s 1 ,582(**) ,592(**) ,615(**) Sig. ,000 ,000 ,000 N 116 116 114 114 IXM2 Pearson’s 1 ,644(**) ,691(**) Sig. ,000 ,000 N 116 114 114 IXM3 Pearson’s 1 ,729(**) Sig. ,000 N 114 112 IXM4 Pearson’s 1 N 114
** Correlation is significant at the 0.01 level (2-tailed). * Correlation is significant at the 0.05 level (2-tailed). Table 7: Inter-Item Correlations ENV, REW, and CNTR scales
ENV1 ENV2 ENV3 ENV4 ENV5 REW1 REW2 REW3 CNTR1 CNTR2 CNTR3 CNTR4 CNTR5 ENV1 1 ,491(**) ,461(**) ,305(**) ,402(**) ,201(*) ,124 ,164 -,043 -,113 ,122 -,005 ,026 ,000 ,000 ,001 ,000 ,029 ,183 ,074 ,639 ,222 ,185 ,958 ,778 121 121 121 120 118 118 116 119 119 119 119 119 119 ENV2 1 ,661(**) ,382(**) ,388(**) ,146 ,202(*) ,214(*) -,007 -,112 ,134 ,034 ,016 ,000 ,000 ,000 ,115 ,030 ,020 ,939 ,224 ,147 ,717 ,863 121 121 120 118 118 116 119 119 119 119 119 119 ENV3 1 ,378(**) ,408(**) ,237(**) ,336(**) ,251(**) -,204(*) -,306(**) -,068 -,148 -,153 ,000 ,000 ,010 ,000 ,006 ,026 ,001 ,460 ,109 ,097 121 120 118 118 116 119 119 119 119 119 119 ENV4 1 ,711(**) ,254(**) ,131 ,202(*) -,138 -,152 -,062 -,202(*) -,124 ,000 ,006 ,162 ,028 ,136 ,101 ,505 ,029 ,181 120 118 117 116 118 118 118 118 118 118 ENV5 1 ,168 ,233(*) ,234(*) -,065 -,078 ,059 -,049 -,009 ,073 ,013 ,012 ,487 ,404 ,527 ,599 ,926 118 115 114 116 116 116 116 116 116 REW1 1 ,290(**) ,397(**) -,349(**) -,387(**) -,247(**) -,243(**) -,221(*) ,002 ,000 ,000 ,000 ,007 ,008 ,016 118 116 118 118 118 118 118 118 REW2 1 ,529(**) -,250(**) -,262(**) -,106 -,057 -,047 ,000 ,007 ,005 ,255 ,541 ,612 117 117 116 116 117 117 117 REW3 1 -,191(*) -,274(**) -,088 -,105 -,097 ,037 ,003 ,338 ,254 ,292 120 119 119 120 120 120 CNTR1 1 ,648(**) ,528(**) ,692(**) ,707(**) ,000 ,000 ,000 ,000 119 119 119 119 119 CNTR2 1 ,621(**) ,607(**) ,593(**) ,000 ,000 ,000 119 119 119 119 CNTR3 1 ,605(**) ,615(**) ,000 ,000 120 120 120 CNTR4 1 ,728(**) ,000 120 120 CNTR5 1 120
** Correlation is significant at the 0.01 level (2-tailed). * Correlation is significant at the 0.05 level (2-tailed).
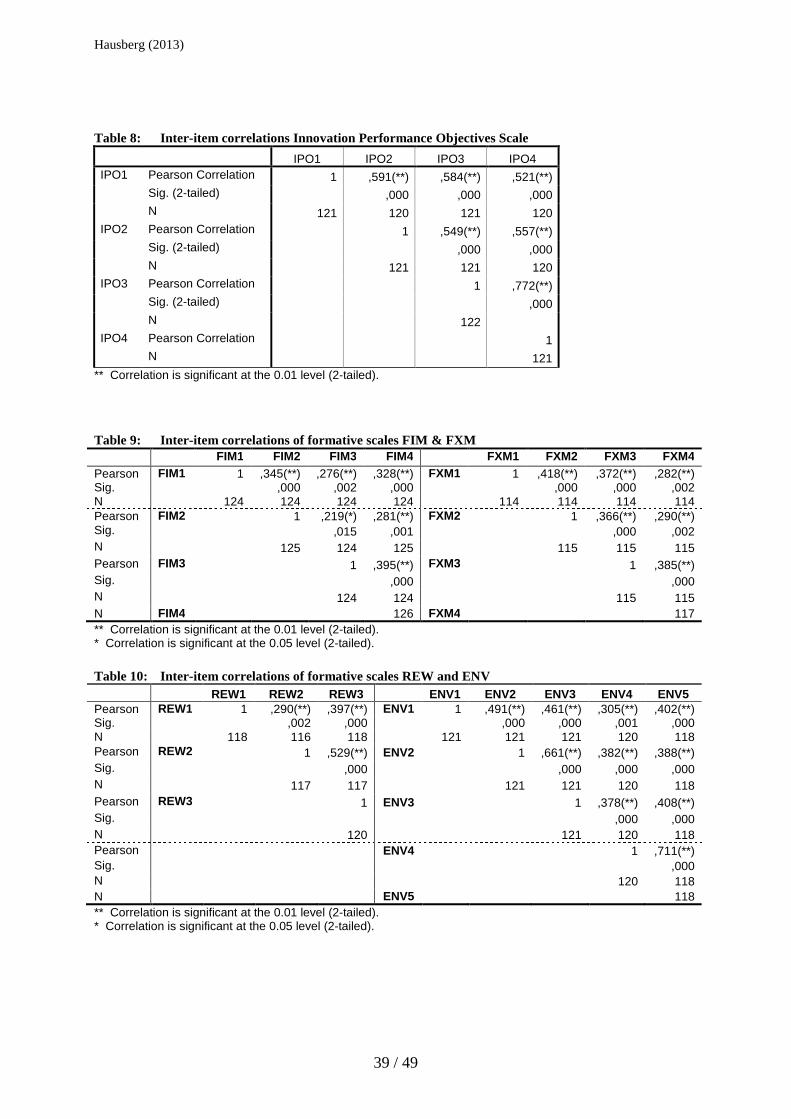
Hausberg (2013)
39 / 49
Table 8: Inter-item correlations Innovation Performance Objectives Scale
IPO1 IPO2 IPO3 IPO4 IPO1 Pearson Correlation 1 ,591(**) ,584(**) ,521(**)
Sig. (2-tailed) ,000 ,000 ,000 N 121 120 121 120 IPO2 Pearson Correlation 1 ,549(**) ,557(**)
Sig. (2-tailed) ,000 ,000 N 121 121 120 IPO3 Pearson Correlation 1 ,772(**)
Sig. (2-tailed) ,000 N 122 IPO4 Pearson Correlation 1
N 121 ** Correlation is significant at the 0.01 level (2-tailed).
Table 9: Inter-item correlations of formative scales FIM & FXM FIM1 FIM2 FIM3 FIM4 FXM1 FXM2 FXM3 FXM4 Pearson FIM1 1 ,345(**) ,276(**) ,328(**) FXM1 1 ,418(**) ,372(**) ,282(**) Sig. ,000 ,002 ,000 ,000 ,000 ,002 N 124 124 124 124 114 114 114 114 Pearson FIM2 1 ,219(*) ,281(**) FXM2 1 ,366(**) ,290(**) Sig. ,015 ,001 ,000 ,002 N 125 124 125 115 115 115 Pearson FIM3 1 ,395(**) FXM3 1 ,385(**) Sig. ,000 ,000 N 124 124 115 115 N FIM4 126 FXM4 117 ** Correlation is significant at the 0.01 level (2-tailed). * Correlation is significant at the 0.05 level (2-tailed).
Table 10: Inter-item correlations of formative scales REW and ENV REW1 REW2 REW3 ENV1 ENV2 ENV3 ENV4 ENV5 Pearson REW1 1 ,290(**) ,397(**) ENV1 1 ,491(**) ,461(**) ,305(**) ,402(**) Sig. ,002 ,000 ,000 ,000 ,001 ,000 N 118 116 118 121 121 121 120 118 Pearson REW2 1 ,529(**) ENV2 1 ,661(**) ,382(**) ,388(**) Sig. ,000 ,000 ,000 ,000 N 117 117 121 121 120 118 Pearson REW3 1 ENV3 1 ,378(**) ,408(**) Sig. ,000 ,000 N 120 121 120 118 Pearson ENV4 1 ,711(**) Sig. ,000 N 120 118 N ENV5 118 ** Correlation is significant at the 0.01 level (2-tailed). * Correlation is significant at the 0.05 level (2-tailed).

40 / 49
Table 11: Configural and metric invariance tests
������� �� �A� BC�
D� EF�� ��F���A� ��F� ����E� ����� BC��D�
�3�#1,:+�+#*�� � � � � � � � � �
�*�%� �;<� DC�D��� �� �CC�� � ��BD�� �AB�� �C��� F� F�
�*�%� �;4� DC��CDA� �� �CCB� � ��B�D� �AC�� �C�B� F� F�
�� I�&*�F
"+0�#�'/�
��B���� B�C� �CCC� ��B� ��BB�� �ADB� �CD� F� F�
@� �:((�1'+0#&�
#�)�0#��&'�
�DD����� BD�� �CCC� �A�� ��BC� �AD�� �CC� F� F�
� ��)"��@� A��BA� ��� ��DD� � � � � � �
�'���#1,:+�+#*�� � � � � � � � � �
�*�%� �;<� �A������ �� �C�B� � ��D�C� �A��� �C�C� �C�D�� ��D�
�*�%� �;4� DC��C� �� �CC� � ��B��� �A�A� �C�C� �C��� ��BA�
�� I�&*�F
"+0�#�'/�
�C��DCB� B�C� �CCC� �D�� ��DA�� �AB� �C�A� �C�D�� ��C��
@� �:((�1'+0#&�
#�)�0#��&'�
��C�C��� BD�� �CC�� �CD� ��D��� �ABA� �C��� �C���� ���C�
� ��)"��@� ������ ��� ��BA� � � � � � �

Hausberg (2013) Intra-Firm Knowledge Integration and Innovation Performance
41 / 49
Table 12: Correlation Matrix of Constructs in Model (for results with mean imputed data) ��� D�$ %&' ��(D ))* ))+ *)*' *)*� *)+� *)+' )A' �*�� *�� D'� D'F D'�
�5?� C!B���
� � � � � � � � � � � � � � � �
� C!CCC� � � � � � � � � � � � � � � �
JK�� C!BB��
� C!�CC� � � � � � � � � � � � � � �
� C!CCC� C!D��� � � � � � � � � � � � � � �
����� FC!��B� FC!BCD��
� FC!DDC�� � � � � � � � � � � � � �
� C!���� C!CC�� C!C��� � � � � � � � � � � � � �
���� C!BDA��
� C!B�C��
� C!D�C�� FC!B�A
��� � � � � � � � � � � � �
� C!CCC� C!CCC� C!C�A� C!CCC� � � � � � � � � � � � �
���� C!BB��
� C!DCD�� C!BBB
��� FC!C�B� C!���
��� � � � � � � � � � � �
� C!CCC� C!CD�� C!CCC� C!��A� C!CCC� � � � � � � � � � � �
����� C!D�B��
� C!DB��
� C!��� FC!����� C!��
��� C!BC
��� � � � � � � � � � �
� C!CC�� C!CC�� C!C�� C!CB�� C!CCC� C!CC�� � � � � � � � � � �
����� C!BC���
� C!D�D��
� C!DC��� FC!�AB
�� C!��
��� C!DAA
��� C!A�D� � � � � � � � � �
� C!CC�� C!CCD� C!CD�� C!CB�� C!CCC� C!CC�� C!CCC� � � � � � � � � �
����� C!DD��� C!��D
�� C!DA�
��� FC!C��� C!D�
��� C!�B�
��� C!�A�� C!���
��� � � � � � � � �
� C!C��� C!C�B� C!CC�� C!���� C!CC�� C!CCC� C!CCC� C!CCC� � � � � � � � �
����� C!DBD��
� C!���� C!D����
� FC!CD�� C!DB��
� C!�����
� C!���� C!���
� C!AAB��
� � � � � � � �
� C!CCA� C!C�B� C!CC�� C!���� C!CC�� C!CCC� C!CCC� C!CCC� C!CCC� � � � � � � �
���� C!D��
� C!BDC��
� C!D�C��
� FC!�BC� C!DAC��
� C!��C�� C!D�� C!D�
��� C!DD�
�� C!DCD
�� � � � � � �
� C!CC�� C!CCC� C!CCD� C!��A� C!CC�� C!C��� C!CC� C!CC�� C!C�D� C!CD�� � � � � � �
����� C!BA��
� C!B����
� C!B���
� FC!���� C!D���
� C!�B��
� C!���� C!D�C�� C!B��
��� C!BA
��� C!�C�
��� � � � � �
� C!CCC� C!CCC� C!CCC� C!�CB� C!CC�� C!CCC� C!C��� C!C�A� C!CCC� C!CCC� C!CCC� � � � � �
���� C!�D��
� C!�����
� C!D���� FC!D�
��� C!��D
��� C!�A�
��� C!DB�
��� C!D�D
��� C!BBC
��� C!BDD
��� C!B��
��� C!���
��� � � � �
� C!CCC� C!CCC� C!C�� C!CC�� C!CCC� C!CCC� C!CC�� C!CC�� C!CCC� C!CCC� C!CCC� C!CCC� � � � �
���� C!C��� C!�DB� C!C�A� C!CC�� C!C��� FC!CB� C!�CC� C!���� FC!CB� FC!C�C� C!���� C!C�D� C!C�� � � �
� C!B��� C!���� C!BDB� C!AD�� C!���� C!�A�� C!D��� C!DC� C!�C� C!��C� C!C��� C!�A� C!D�� � � �
��4� C!��C� C!���� C!�DD� C!CCA� C!�CB� FC!C��� C!CAC� C!���� FC!C�� FC!CB�� C!��D�� C!CAA� C!��C� C!��C
��� � �
� C!DDD� C!DC� C!���� C!ADB� C!DD� C!AC�� C!BDC� C!DC�� C!B� C!���� C!C�D� C!D�D� C!DDB� C!CCC� � �
��5� FC!CCA� FC!CDB� FC!�C�� C!�� C!�B�� FC!���� C!��B� C!��A� FC!�D� FC!���� FC!C�B� FC!��D�� FC!C��� C!BBD
��� C!DAD
��� �
� C!AD�� C!�AA� C!D�C� C!C�B� C!�D�� C!�CB� C!C�A� C!C�C� C!��� C!�A�� C!B�C� C!C�D� C!BA�� C!CCC� C!CC�� �
5��3� C!CC�� FC!CA�� FC!C��� FC!C�D� C!C��� C!C�C� C!CD�� C!C��� C!CC���
� FC!CCD� FC!DBD��
� FC!CD�� C!�D�� FC!DB���
� FC!��� C!CA��
� C!AAD� C!DA�� C!BB� C!�A�� C!��� C!�B�� C!��� C!AC�� C!A��� C!A�C� C!CCA� C!�� C!��A� C!CC�� C!C��� C!D�B���
�*00'(�+#*��#"�"#$�#%#&��+��+�+9'�C�C��(')'(��DF+�#('/�� ���*00'(�+#*��#"�"#$�#%#&��+��+�+9'�C�C�(')'(��DF+�#('/��

42 / 49
Table 13: Competing models compared
Model �2 d.f. p(�2) �
2/d.f. CFI TLI RMSEA AIC
(0) Main model 30.191 44 .944 .686 1.000 1.137 .000 358.191
(1) no FAC�CFAC 69.807 45 .010 1.551 .941 .760 .067 395.807
(2) FXM�FAC 29.381 42 .929 .700 1.000 1.131 .000 361.381
(3) Reverse causality 29.642 42 .924 .706 1.000 1.128 .000 361.642
Table 14: Multiple OLS Regression models for core hypotheses
Model nr.: Dependent Variable:
(0) IPO
(1) IPO
(2) IPO
(3) IPO
(4) IPO (R&D)a
(5) CFAC (R&D)
Intercept (n.s.) (n.s.) (n.s.) (n.s.) (n.s.) (n.s.)
(industry dummies)
1 sig. at 5%
2 sig. at 5%
0 sig. at 5%
0 sig. at 5%
0 sig. at 5%
0 sig. at 5%
SIZE -.116 (.213)
-.110 (.228)
-.098 (.283)
-.095 (.29)
.052 (.679)
-.126 (.250).
REW .199 (.045)
.172† (.077)
.134 (.182)
.128 (.20)
.014 (.923)
.130 (.285)
ENV .134 (.160)
.094 (.347)
.064 (.507)
.066 (.50)
.103 (.440)
-.033 (.778)
CNTR -.064 (.48)
-.078 (.380)
-.047 (.602)
-.057 (.520)
-.014 (.899)
.000 (.998)
B2C .039 (.674)
.023 (.803)
.054 (.545)
.040 (.654)
.105 (.361)
-.089 (.377)
FXM .266*
(.019) .228
(.040) .180
(.237) .273* (.036)
IXM -.036
(.757) -.114 (.359)
-.294† (.091)
-.030 (.841)
FAC .007
(.958) .013
(.921) -.018
(.910) .526***
(.000)
CFAC .299**
(.008) .262*
(.020) .573** (.001)
R2 ,543 ,586 .602 ,623 .541 ,636
Adj. R2 ,295 ,343 .362 ,389 .333 ,482
F Chng. 2, 192** (,006)
2, 449** (,001)
2,658*** (,000)
2,674*** (,000)
2.610** (.002)
4,135*** (,000)
Table shows standardized coefficients with p-values in parentheses. Significance levels: †10% * 5%; ** 1%; *** 0.1% a The F-statistic for this model is not significant for the M&S subgroup.

43 / 49
Appendix B: Questionnaire Table 15: Informal and Formal, Intra- and Cross-Functional Integration Mechanisms Scales Coding: Items: Item-total
correlations: Informal Integration (II M & IX M Scales) (reflective) (Zahra & Nielsen, 2002)
To what extent does your department use … IIF IIX IIM1/ IXM1 (a) free exchange of operating and financial information,
with other departments of the (own/other function+) † .662
IIM2/ IXM2 (b) bypassing of formal communication channels, as needed, with other departments of the (own/other function+)
† .684
IIM3/ IXM3 (c) informal relationships for getting things done, with other departments of the (own/other function+)
.673 .726
IIM4 / IXM4 (d) maintains open communication channels in its operations with other departments of the (own/other function+).
.673 †
Cronbach’s Alpha: Composite reliability:
.804
.810 .831 .832
Formal Integration (FIM & FXM Scales) (formative) (Gupta & Govindarajan, 2000; Jansen, Van den Bosch, & Volberda, 2005) To what extent does your department use:
Weights Extant
scale Extended
scale (FIM/ FXM)
FIM)1 / FXM1
(e) liaison personnel with other departments of the (own/other function+)
1 1
FIM2 / FXM2
(f) temporary task forces with other departments of the (own/other function+)
2 2
FIM3 / FXM3
(g) permanent teams with other departments of the (own/other function+)
3 3
FIM4 / FXM4
(h) job rotation with other departments of the (own/other function+)
N.A. 1
(1) “No or very little extent” … (7) “Very large extent” † Item deleted. + (own function) replaced with “R&D function” for R&D departments and “M&S function” for M&S departments (IIF); (other
function) replaced with “M&S function” for R&D departments and “R&D function” for M&S departments (IIX). Table 16: Innovation Performance Coding Items
(Atuahene-Gima et al., 2005; De Luca & Atuahene-Gima, 2007; Foss et al., 2010) (reflective)
Cronbach’s Alpha if
item deleted
Item-Total corr.:
IPO1
Rate how your business unit is performing on the following new product development objectives relative to your firm's stated objectives:
- Market share .870 .601 IPO2 - Sales † † IPO3 - ROI .695 .785 IPO4 - Profitability .745 .737 Cronbach’s Alpha:
Composite Reliability: .840 .848
Items measure on the following scale: 1 – “much worse” … 7 – “much better”.

44 / 49
Table 17: Intra- and Cross-Functional Absorptive Capacity Scales Coding: Item:
Members of our department…**
Based on: Cronbach’s Alpha if item deleted:
Item-Total correlations:
FAC CFAC FAC CFAC
FAC1/ CFAC1
... find and access without problems useful information and expertise of other departments.
Hansen & Nohria (2004)
† † † †
FAC2 / CFAC2
... experts with useful knowledge are difficult to locate in the other departments. (r)
Hansen & Nohria (2004)
† † † †
FAC3 / CFAC3
... have difficulties to find useful documents and information in the company's databases and knowledge-management systems. (r)
Hansen & Nohria (2004)
† † † †
FAC4 / CFAC4
... are slow to recognize shifts in our «technological»/«market» environment (e.g. recent discoveries, emerging «technologies»/«markets», new trends). (r)
Jansen, et al. (2005)
† † † †
FAC5 / CFAC5
... quickly analyze and interpret changing opportunities of «technologies»/«markets».
Jansen, et al. (2005)
.916 .676 .808 .704
FAC6 / CFAC6
... structure and integrate new external knowledge with ease.
Jansen, et al. (2005)
.918 .811 .791 .573
FAC7 / CFAC7
... quickly recognize the usefulness of new external knowledge even if this contests existing convictions and ways of thinking.
† † † †
FAC8 / CFAC8
... laboriously grasp the opportunities from the kind of new external knowledge that requires a fundamental change in our way of working. (r)
Jansen, et al. (2005)
† † † †
FAC9 / CFAC9
... recognize timely the consequences of new external knowledge to our mode of operation.
Flatten, Engelen, Zahra, & Brettel, (2011)
.912 † .841 †
FAC10 / CFAC10
... are able to apply new external knowledge in their practical work.
Flatten, et al. (2011)
.922 † .763 †
FAC11 / CFAC11
... regularly reconsider their knowledge and adapt it according to new external knowledge.
Jansen, et al. (2005)
.920 .702 .778 .680
FAC12 / CFAC12
... know to share and apply new external knowledge with those in our department who is most apt.
Szulanski (1996)
.917 † .804 †
Cronbach’s Alpha: Composite Reliability:
.93 .931
.804
.811
** Items measure on the following scale: 1 – “No or very little extent” … 7 – “Very large extent”. * The first value indicates the individual item SMCs for the R&D sub-group, the second value those for the M&S sub-group. (r) Reversed item. † Item deleted.
45 / 49
Table 18: Control Variables
Items
Cronbach’s Alpha if
item deleted
Item-Total corr.:
Centralization (CNTR) Javorski & Kohli (1993) (reflective) Please indicate how much you agree or disagree with the
following statements: (1= No or very little extent … 7= Very large extent)
CNTR1 - There can be little action taken here until a supervisor approves it.�
.839 .780
CNTR2 - A person who wants to make his own decision would be quickly discouraged here.�
.877 .684
CNTR3 - Even small matters have to be referred to someone higher up for a final answer.�
† †
CNTR4 - I have to ask my boss before I do almost anything.� .846 .768
CNTR5 - Any decision I make has to have my boss' approval.� .844 .768
Cronbach’s Alpha: �*1,*"#+'��'(#�-#(#+C7
.884
.887
Rewards and Incentives (REW) (formative) To what extent do you agree or disagree with the following
statements: REW1 - No matter which department they are in, people in this
business unit get recognized for being sensitive to competitive moves.
REW2 - Customer satisfaction assessments influence senior managers' pay in this business unit.�
REW3 - Formal rewards (i.e. pay raise, promotion) are forthcoming to anyone who consistently provides good market intelligence.�
Environmental turbulence (ENV) Verhoef & Leeflang (2009) (formative) ENV1
Can you indicate the level of change in the last three years in the most important market where your firm was active on the following elements - production/process technology - introduction of new products/services - R&D activities - Competitive intensity - Customer preferences
(1=no change … 7= very frequent changes)
ENV2 ENV3 ENV4 ENV5
Business-to-Consumer-Scale (B2C) Verhoef & Leeflang (2009) Please indicate the percentage of your turnover that arise from
B2B or B2C markets: B2C … (10) B2B

46 / 49
Bibliography Anderson, J. C., & Gerbing, D. W. (1988). Structural equation modeling in practice: A review and
recommended two-step approach. Psychological Bulletin, 103(3), 411–423. doi:10.1037//0033-2909.103.3.411
Argyris, C., & Schön, D. A. (1996). Organizational Learning: A Theory of Action Perspective (p. 356). Reading, MA: Addison-Wesley.
Atuahene-Gima, K., Slater, S. F., & Olson, E. M. (2005). The Contingent Value of Responsive and Proactive Market Orientations for New Product Program Performance. Journal of Product Innovation Management, 22, 464–482.
Bagozzi, R. P., & Yi, Y. (2012). Specification, evaluation, and interpretation of structural equation models. Journal of the Academy of Marketing Science, 40(1), 8–34. doi:10.1007/s11747-011-0278-x
Baron, R. M., & Kenny, D. A. (1986). The moderator-mediator variable distinction in social psychological research: Conceptual, strategic and statistical considerations. Journal of Personality and Social Psychology, 51, 1173–1182.
Bommer, M., Delaporte, R., & Higgins, J. (2002). Skunkworks Approach to Project Management. Journal of Management in Engineering, (January), 21–28.
Brettel, M., Heinemann, F., Engelen, A., & Neubauer, S. (2011). Cross-Functional Integration of R&D, Marketing, and Manufacturing in Radical and Incremental Product Innovations and Its Effects on Project Effectiveness and Efficiency. Journal of Product Innovation Management, 28(2), 251–269. doi:10.1111/j.1540-5885.2011.00795.x
Byrne, B. M. (2010). Structural Equation Modeling with AMOS (Second Edi., p. 418). New York, NY: Routledge.
Cassiman, B., & Veugelers, R. (2006). In Search of Complementarity in Innovation Strategy: Internal R&D and External Knowledge Acquisition. Management Science, 52(1), 68–82. doi:10.1287/mnsc.l050.0470
Cohen, W. M., & Levinthal, D. A. (1989). Innovation and learning: the two faces of R&D. The Economic Journal, 99(September), 569–596.
Cohen, W. M., & Levinthal, D. A. (1990). Absorptive Capacity�: A New Perspective on Learning and Innovation. Administrative Science Quarterly, 35(1), 128–152.
Concepts, B. (n.d.). Structural Equation Modeling with AMOS. Coombs, J. E., & Bierly, P. E. I. (2006). Measuring technological capability and performance.
Management. De Luca, L. M., & Atuahene-Gima, K. (2007). Market Knowledge Dimensions and Cross-
Functional Collaboration: Examining the Different Routes to Product Innovation Performance. Journal of Marketing, 71(1), 95–112. doi:10.1509/jmkg.71.1.95
Dyer, J. H., & Singh, H. (1998). The Relational View: Cooperative Startegy and Sources of Interorganizational Competitive Advantage. Academy of Management Review, 23(4), 660–679.
Edwards, J. R., & Bagozzi, R. P. (2000). On the nature and direction of relationships between constructs and measures. Psychological methods, 5(2), 155–74. Retrieved from http://www.ncbi.nlm.nih.gov/pubmed/10937327
Ernst, H., Hoyer, W. D., & Rübsaamen, C. (2010). New Product Development Stages�: Journal of Marketing, 74(September), 80–92.
Flatten, T. C., Engelen, A., Zahra, S. A., & Brettel, M. (2011). A measure of absorptive capacity: Scale development and validation. European Management Journal, 29(2), 98–116. doi:10.1016/j.emj.2010.11.002

47 / 49
Foss, N. J., Laursen, K., & Pedersen, T. (2010). Linking Customer Interaction and Innovation: The Mediating Role of New Organizational Practices. Organization Science, 22(4), 980–999. doi:10.1287/orsc.1100.0584
Galbraith, J. R. (1974). Organization design: An information processing view. Interfaces, 4(3), 28–36.
Griffin, A., & Hauser, J. R. (1996). Integrating R&D and Marketing: A Review and Analysis of the Literature. Journal of Product Innovation Management, 13, 191–215.
Gupta, Anil K., & Govindarajan, V. (2000). Knowledge flows within multinational corporations. Strategic management journal, 21(4), 473–496.
Gupta, Ashok K, Raj, S. P., & Wilemon, D. (1986). A Model for Studying R & D- Marketing Interface in the Product Innovation Process. Journal of Marketing, 50(April), 7–17.
Hansen, M. T. (2009). When internal collaboration is bad for your company. Harvard Business Review, 87(April), 83–88. Retrieved from http://ehis.ebscohost.com/ehost/detail?sid=8b8d2455-daa3-42f2-a6f8-80ab8770b270@sessionmgr114&vid=2&hid=109&bdata=JnNpdGU9ZWhvc3QtbGl2ZQ==#db=buh&AN=37021742
Hansen, M. T., & Nohria, N. (2004). How To Build Collaborative Advantage. MIT Sloan Management Review, 46(1), 21–30.
Hausberg, J. P. (2012). Departmental Cross-Functional Absorptive Capacity. Paper to be presented at the DRUID Summer Conference 2012 (p. 33). Copenhagen, Denmark.
Henderson, R. M., & Clark, K. B. (1990). Architecturai Innovation�: The Reconfiguration of Existing Product Technologies and the Failure of Established Firms. Administrative Science Quarterly, 35, 9–30.
Hoegl, M., Weinkauf, K., & Gemuenden, H. G. (2004). Interteam Coordination, Project Commitment, and Teamwork in Multiteam R&D Projects: A Longitudinal Study. Organization Science, 15(1), 38–55. doi:10.1287/orsc.1030.0053
Homburg, C., Workman, J. P., & Krohmer, H. (1999). Marketing’s Influence Within the Firm. Journal of Marketing, 63(April), 1–17.
Iacobucci, D. (2010). Structural equations modeling: Fit Indices, sample size, and advanced topics. Journal of Consumer Psychology, 20(1), 90–98. doi:10.1016/j.jcps.2009.09.003
Iansiti, M., & Clark, K. B. (1994). Integration and Dynamic Capability: Evidence from Product Development in Automobiles and Mainframe Computers. Industrial and Corporate Change, 3(3), 557–605.
Jansen, J. J. P., Van den Bosch, F. A. J., & Volberda, H. W. (2005). Managing Potential and Realized Absorptive Capacity: How do Organizational Antecedents Matter? Academy of Management Journal, 48(6), 999–1015. doi:10.5465/AMJ.2005.19573106
Jaworski, B. J., & Kohli, A. K. (1993). Market Orientation: Antecedents and Consequences. Journal of Marketing, 57, 53–70.
Judd, C. M., & Kenny, D. A. (1981). Process analysis: Estimating mediation in treatment evaluations. Evaluation Review, 5, 602–619.
Lawrence, P. R., & Lorsch, J. W. (1967). Differentiation and Integration in Complex Organizations. Administrative Science Quarterly, 12(1), 1–47.
Levitt, B., & March, J. G. (1988). Organizational Learning. Annual Review of Sociology, 14, 319–340.
Luo, X., Slotegraaf, R. J., & Pan, X. (2006). Simultaneous Role of Cooperation. Journal of Marketing, 70(April), 67–80.
Moenaert, R. K., Souder, W. E., De Meyer, A., & Deschoolmeester, D. (1994). R&D-Marketing Integration Mechanisms, Communication Flows, and Innovation Success. Journal of Product Innovation Management, 11, 31–45.
Moorman, C., & Rust, R. T. (1999). The Role of Marketing. Journal of Marketing, 63, 180. doi:10.2307/1252111

48 / 49
Olson, E. M., Walker, O. C. J., Ruekert, R. W., & Bonner, J. M. (2001). Patterns of cooperation during new product development among marketing, operations and R&D: Implications for project performance. Journal of Product Innovation Management, 18(4), 258–271. doi:10.1111/1540-5885.1840258
Pavitt, K. (1984). Sectoral patterns of technical change�: Towards a taxonomy and a theory. Research Policy, 13, 343–373.
Pinto, M. B., & Pinto, J. K. (1990). Project Team Communication and Cross-Functional Coop in New Program Development. Journal of Product Innovation Management, 7, 200–212.
Podsakoff, P. M., MacKenzie, S. B., Lee, J. Y. J.-Y., & Podsakoff, N. P. (2003). Common method biases in behavioral research: a critical review of the literature and recommended remedies. Journal of Applied Psychology, 88(5).
Rothaermel, F. T., & Alexandre, M. T. (2009). Ambidexterity in Technology Sourcing: The Moderating Role of Absorptive Capacity. Organization Science, 20(4), 759–780. doi:10.1287/orsc.1080.0404
Ruekert, R. W., & Walker, O. C. J. (1987). Marketing’s Interaction with Other Functional Units: A Conceptual Framework and Empirical Evidence. Journal of Marketing, 51(January), 1–19.
Schafer, J. L., & Graham, J. W. (2002). Missing data: Our view of the state of the art. Psychological Methods, 7(2), 147–177. doi:10.1037//1082-989X.7.2.147
Sherman, J. D., & Keller, R. T. (2011). Suboptimal Assessment of Interunit Task Interdependence: Modes of Integration and Information Processing for Coordination Performance. Organization Science, 22(1), 245–261. doi:10.1287/orsc.1090.0506
Song, X. M., Kawakami, T., & Stringfellow, A. (2010). A Cross-National Comparative Study of Senior Management Policy, Marketing-Manufacturing Involvement, and Innovation Performance. Journal of Product Innovation Management, 27(2), 179–200. doi:10.1111/j.1540-5885.2010.00709.x
Song, X. M., Montoya-Weiss, M. M., & Schmidt, J. B. (1997). Antecedents and Consequences of Cross-Functional Cooperation: A Comparison of R&D, Manufacturing, and Marketing Perspectives. Journal of Product Innovation Management, 14(14), 35–47.
Song, X. M., Thieme, R. J., & Xie, J. (1998). The Impact of Cross-Functional Joint Involvement Across Product Development Stages: An Exploratory Study. Journal of Product Innovation Management, 15, 289–303.
Song, X. M., Xie, J., & Di Benedetto, C. A. (2001). Message and Source Factors, Market Uncertainty, and Extrafunctional Information Processing: Hypotheses and Empirical Evidence. IEEE Transactions on Engineering Management, 48(2), 223–238.
Szulanski, G. (1996). Exploring Internal Stickiness: Impediments to the Transfer of Best Practice Within the Firm. Strategic Management Journal, 17(SI Winter: Knowledge and the Firm), 27–43.
Troy, L. C., Hirunyawipada, T., & Paswan, A. K. (2008). Cross-Functional Integration and New Product Success: An Empirical Investigation of the Findings. Journal of Marketing, 72(November), 132–146. doi:10.1108/03090569410061169
Van Wijk, R., Jansen, J. J. P., & Lyles, M. A. (2008). Inter- and Intra-Organizational Knowledge Transfer: A Meta-Analytic Review and Assessment of its Antecedents and Consequences. Journal of Management Studies, 45(4), 830–853. doi:10.1111/j.1467-6486.2008.00771.x
Verhoef, P. C., & Leeflang, P. S. H. (2009). Understanding the Marketing Department’s Influence Within the Firm. Journal of Marketing, 73(March), 1–42.
Volberda, H. W., Foss, N. J., & Lyles, M. A. (2010). Absorbing the Concept of Absorptive Capacity: How To Realize Its Potential in the Organization Field. Organization Science, 21(4), 53. doi:10.1287/orsc.1090.0503
Von Hippel, E. (1994). Sticky Information and the Locus of Problem Solving�: Implications for Innovation. Management Science, 40(4), 429–440.

49 / 49
Wei, Y. (Susan), & Atuahene-Gima, K. (2009). The moderating role of reward systems in the relationship between market orientation and new product performance in China. International Journal of Research in Marketing, 26(2), 89–96. doi:10.1016/j.ijresmar.2008.11.001
Zahra, S. A., & George, G. (2002). Absorptive Capacity: A Review, Reconceptualization, and Extension. Academy of Management Review, 27(2), 185–203.
Zahra, S. A., & Nielsen, A. P. (2002). Sources of capabilities, integration and technology commercialization. Strategic Management Journal, 23(5), 377–398. doi:10.1002/smj.229