the role of fiscal policy in response to the financial crisis · pdf file ·...
TRANSCRIPT
The role of fiscal policy in response to the financial crisis
Joshua Aizenman [UCSC and the NBER] and Yothin Jinjarak [University of London]
Background paper World Economic Situation and Prospects 2011

2
October, 2010
The role of fiscal policy in response to the financial crisis1 Joshua Aizenman [UCSC and the NBER] and Yothin Jinjarak [University of London]
Abstract
The dire outlook of the global economy in the second half of 2008 propagated unprecedented
fiscal expansions of most OECDs and EMs countries. The fiscal stimulus and the coordinated monetary expansion stabilized the global economy in the aftermath of the financial meltdown in the U.S., preventing an employment collapse of the type experienced during the great depression. The sense of urgency and the will to move policies in tandem during the peak of the crisis has been replaced with extensive debates among countries regarding the future course of macro policies, and growing ‘fiscal fatigue.’ Fiscal skeptics are concerned that a further increase in public debt may lead to a higher interest rate down the road, thereby increasing the burden of serving the future debt - the cost channel. Other observers point out that a proper fiscal stimulus may lead to a faster resumption of growth, mitigating the future cost concern, and minimizing the costs of employment slack and the underutilization of human capital.
A constructive way of studying the cost channel is to evaluate the flow cost of serving the public debt as a percentage of the GDP, equals to (the real interest rate – real GDP growth rate) times the public debt/GDP. Applying this perspective, we point out that the past record of the OECD suggests that the fiscal space needed for a countercyclical policy in the U.S. and in several big Western European countries has not been exhausted. In so far as the future growth may depend on short term stabilization during or in the aftermath of a financial crash and a deep recession, the additional debt incurred for such stabilization may not translate into excessively high future flow costs of public debt. However, we also emphasize that the uncertainty of a future debt burden is likely to increase with the size of the future debt/GDP ratios. Prudent fiscal policy therefore may involve both short term stabilization and forward looking fiscal reforms.
The higher projected growth rate of emerging markets implies that the flow costs of public debt are lower in these countries, increasing their fiscal space. Emerging markets with modest public debt may use this fiscal space to accommodate the adjustment needed in the face of a lower demand from the OECD countries associated with the Great Recession. The case for fiscal policy in emerging markets is particularly strong for countries with a shallower safety net, and greater infrastructure deficits. Yet, the notion of fiscal space is country specific -- the case for a countercyclical policy is stronger in countries with better adjustment capacities, lower debt overhang relative to the tax capacity, and a greater willingness to rationalize and broaden their tax base.
1 Prepared for the United Nations' Development Policy and Analysis Division, DESA
3
Introduction:
The global economy is coming out of the most severe world recession in the post World
War II era. The downside risk associated with the melt down of in US and the global financial
system induced the OECD and EMs to move in tandem during the 2008-9 crisis to counter the
prospects of another great depression. This has been accomplished by unprecedented fiscal
stimuli, and a massive liquidity infusion to the banking system. Large scale swap lines offered
by the FED to the ECB, and 4 emerging markets mitigated the dollar shortage propagated by the
flight to quality during the peak of the crises. These efforts were successful in preventing even
deeper collapses of the global GDP and of employment. The common threat facing countries led
to a common response, inducing positive spillover effects, and limiting beggar-your-neighbor
policies. Avoiding the worst outcome, the global macro stance in 2010 shifted, and various
OECD countries started cutting down their fiscal stimuli, moving towards fiscal consolidation,
focusing on narrower national agendas. Regrettably, the stabilization of 2008-9 has not led yet
to a robust recovery of global growth. The risk of a slow and protracted recovery of the US and
Europe remains a looming threat, impacting adversely the prospects of the poorer countries, as
well as those of the low and middle classes in richer countries. These circumstances raise the
likelihood that the benefit of premature termination of fiscal stimuli exceeds the cost of the
forgone growth. This paper overviews the role of fiscal policy in response to the financial crisis,
outlining the challenges associated with a too pessimistic assessment of fiscal capacities at a time
of stagnant growth.
Table 1 overviews the crisis related fiscal stimulus /GDP, 2009-2010, in OECD
countries and emerging markets, subject to data availability. The crisis propagated a significant
fiscal stimulus in the U.S., Japan, and Germany, the magnitude of which increased from 2009 to
2010, reflecting various lags associated with fiscal policy. It also induced massive “bailout”
transfers to the banking system in the U.S., Germany and the UK, attempting to stabilize the
financial panic. It is noteworthy that the size of the transfers to the financial systems exceeded
the non financial sector fiscal stimulus in Germany and the UK. Similar trends, though in
varying intensity, were observed in emerging markets. China, South Korea and Russia provided
front loaded fiscal stimulus at rates that were well above the one observed in the OECD
countries. Notable is the greater agility of the emerging markets’ response relative to that of the
4
OECD countries, reflecting possibly faster policy response capacity of several emerging markets.
The deeper safety net of the OECD [unemployment insurance, food stamps, social security,
socialized medical care, etc.] provides automatic stabilizers that work to cushion the economy in
addition to crisis related stimulus. Dolls et al (2010) reported that “We find that automatic
stabilizers absorb 38 per cent of a proportional income shock in the EU, compared to 32 per cent
in the U.S. In the case of unemployment shock 47 percent of the shock are absorbed in the EU,
compared to 34 per cent in the U.S. This cushioning of disposable income leads to a demand
stabilization of up to 30 per cent in the EU and up to 20 per cent in the U.S. There is large
heterogeneity within the EU. Automatic stabilizers in Eastern and Southern Europe are much
lower than in Central and Northern European countries.” In contrast, emerging markets with
more limited safety net but with fiscal space tends to benefit by more aggressive crisis related
fiscal stimulus, compensating partially for the absence of deeper social insurance.
The debate regarding the use of fiscal policy during the crisis puts to the fore pertinent
questions regarding the efficacy of fiscal stimulus. An increase in government expenditure on
goods and services in a close economy would deliver maximum “bang for the buck” if
- it would not crowd out private sector activities,
- it would not increase interest rates, and would not raise concerns about the future fiscal
and monetary stability of the country.
- it would target projects with high social marginal product, and would take place before
the onset of the recovery, contributing thereby towards shortening the recession.
Fiscal stimulus in an open economy involves further considerations, as the incipient
appreciation under a flexible exchange rate may induce crowding out of export demand. Under a
fixed exchange rate with capital mobility, fiscal policy tends to involve positive spillover effects,
inducing higher demand for imports and incipient monetary expansion. These considerations
imply that, at times of global recession, properly coordinated fiscal expansion would mitigate
most exchange rate appreciation concerns, inducing mutually reinforcing positive spillover
effects that would increase the ultimate stimulus. Similar considerations apply for fiscal
stimulus in the form of transfer income.
5
Fiscal skeptics worry frequently about the crowing out, and the growing costs of
prolonged fiscal stimulus. As there is no way to conduct controlled experiments about these key
issues, views about fiscal multiplier diverge. The conventional wisdom has been that developing
countries have limited fiscal space – their limited tax capacity and possibly sizable debt overhang
imply that fiscal stimulus may backfire by increasing the interest rate and the risk premium
facing the country, including down the road an Argentinean, vintage 2000-2 type funding crisis
[see Heller (2005) for further analysis of fiscal space]. The deeper taxation capacity of the
OECD countries suggests wider fiscal space. However, growing debt overhang associated with
lucrative safety nets, unfunded liabilities, aging population and demographic transitions may
crowd out most of the fiscal space of OECD countries. These considerations suggest that, while
short term fiscal stimulus following a deep crisis would be supported by most OECD countries,
prolonged fiscal stimulus would induce vigorous debate that probably would constrain policy
makers. These dynamics have been vividly played out in the last two years.
The dire outlook of the global economy in the second half of 2008 propagated
unprecedented fiscal expansions of most OECD and EMs. Arguably, the fiscal stimulus and the
coordinated monetary expansion stabilized the global economy in the aftermath of financial
meltdown in the U.S. The monetary policy included unprecedented quantitative easing, and the
provision of elastic swap lines by the FED to most of the OECD countries. The deleveraging
and the flight to quality led to sharp increase in the demand for dollar liquidity, partially met by
unprecedented quantitative easing and the provision of elastic swap lines by the FED to most of
the OECD countries, some via FED’s large swap line to the ECB. Thus, the fiscal stimulus and
the monetary expansions complemented each other, preventing employment collapses of the type
experienced during the great depression.
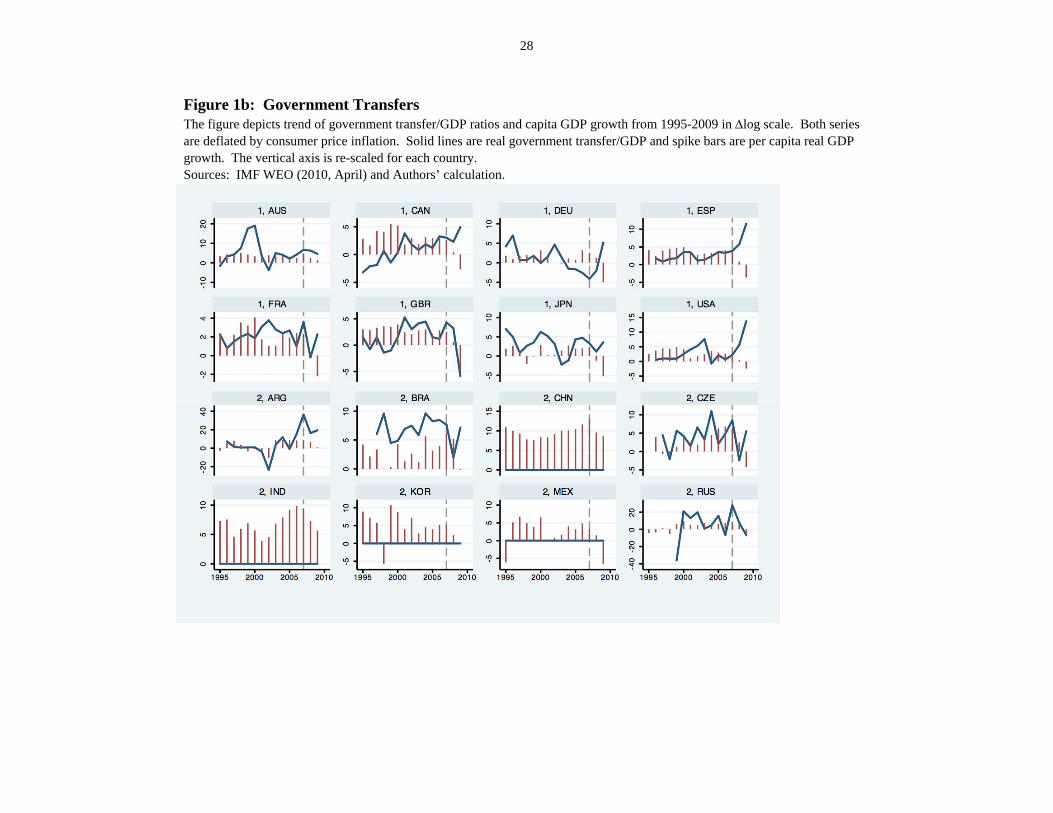
Figures 1a, 1b and 1c overview the patterns of government expenditure, government
transfers and growth of key OECD and emerging markets during the last 15 years. While there
is significant variation, these figures illustrate the significant importance of the countercyclical
fiscal policy during the crisis. Note that all stimulus introduced during the crisis are meant to be
nonrenewal. Among the OECD countries, Australia has been less affected by the crisis, yet
injected 2.8 (1.8) percent of crisis-related stimulus in 2008 (2009). Due to the ensuing budget
6
deficits, most of the large OECD countries intend to restraint their government spending as the
economy will start to recover. The restraining measures include, for example, holding real
growth in spending to 2 percent until the budget returns to surplus for Australia; consolidating
measures initiated before the crisis (civil service reductions and restrictions on tax loopholes) for
France; tougher marginal income tax rates and allowances of high-income earners as well as
increasing fuel duty for UK. Consistent with the stimulus of 2008-09 reported in Table 1,
Figures 1a and 1b show significant increase of both government expenditures/GDP and
transfers/GDP in France, Germany, Japan, and U.S. The increase of spending in UK is relatively
smaller (and transfer/GDP even falls) as the net cost of financial sector support/GDP there is the
largest, 5.4 percent (in 2009, comparing to 4.4 percent of Canada and 3.6 percent of U.S.).
Several large EMs embarked on a significant increase of government expenditures/GDP
in 2008, including in Argentina, China, Korea, Mexico and Russia. As crisis-related stimulus
was mostly front loaded, the expenditures/GDP figures in 2009 fell relative to 2008, except for
China where the stimulus spending increased in 2009. Data on government transfers in
Emerging Markets is limited, therefore there is only mixed evidence on its trends since the crisis.
Transfers fell in 2008 then increased in 2009 for Argentina, Brazil and Czech Republic, whereas
the pattern is opposite for Russia. Similar to the OECD countries, several emerging markets
stated fiscal restraining measures, like targeting primary surplus to reduce public debt/GDP ratio
for Brazil; setting annual balanced budget rule for Mexico; reducing overall fiscal and non-oil
balances for Russia.
In the U.S., the federal fiscal expenditure stimulus managed to prevent the collapse of
consolidated fiscal expenditures at the local, state and the federal levels. The importance of the
federal stimulus reflects the nature of the fiscal union in the U.S. – a highly centralized federal
union, where most of the tax revenue is ‘owned’ by the federal center, unlike the situation in the
Euro block [See von Hagen and Eichengreen (1996)]. This in turn implies that states and local
governments in the U.S. frequently face binding constraints on their borrowing capacity. Under
such circumstances, collapsing tax revenues drastically reduce most of the local and states
government demands resulting in pro-cyclical fiscal stimulus provided by U.S. states and local
governments, implying a negative State’s fiscal stimulus during recessions. Consequently, in
7
order to provide net counter-cyclical stimulus, the federal system needs to overcompensate for
the pro-cyclicality of states and local governments. On this account, the federal fiscal stimulus
failed to deliver robust and sustainable stimulus, and the net fiscal expenditure stimulus, beyond
supporting the financial system, has been rather modest. Aizenman and Pasricha (2010b)
pointed out that the aggregate fiscal expenditure stimulus in the United States, properly adjusted
for the declining fiscal expenditure of the fifty states, was close to zero in 2009. While the
Federal government stimulus prevented a net decline in aggregate fiscal expenditure, it did not
stimulate the aggregate expenditure above its predicted mean. Private consumption and
investment in the U.S. remains weak due to the lingering recession and lackluster demand, and
also due to the limited access of small and medium size businesses to the financial system.
Exports remain the only (relatively) viable sector, helped by the weakness of the dollar.
However, sluggishness of the global recovery limits the capacity of the export sector to lead
towards a robust future U.S. recovery.
The literature pointed out the difficulty of calculating the net fiscal multipliers, as there is
now simple way to control the ‘fiscal experiment.’ The estimates of the fiscal multipliers vary,
depending on the methodology, period, and controls applied [see Barro and Redlick (2009),
Eichenbaum, Christiano, and Rebelo (2009)]. More recent work found that that the size of the
multiplier varies considerably over the business cycle: between 0 and 0.5 in expansions and
between 1 and 1.5 in recessions [see Auerbach and Gorodnichenko (2010)]. Applying the
history of the U.S. during the Second War, Gordon and Kerrn (2010) inferred that when capacity
constraints are absent across the economy, the fiscal multiplier is about 1.8, higher than most
previous estimates.
While optimist observers took the success of the stabilization during the first year as a
sign that the worst is over, fragility abounds, and it’s premature to declare that enduring
stabilization and the resumption of sustainable growth has been accomplished. The sense of
urgency and the will to move policies in tandem during the peak of the crisis has been replaced
with growing debates among countries regarding the future course of macro policies. There has
been also contentious dialog among political constituency in key countries regarding the role of
fiscal stimulus and tax policies beyond 2009. The Greek crisis shaken confidence about the
sustainability of the Euro project; propagating doubts about the fiscal soundness of European
countries. Gaps between France [more pro-fiscal stimulation stance] and Germany [more pro-
8
fiscal consolidation and belt tightening] are indicative of the tension within Europe. The deeper
safety net in Europe in comparison to the U.S. leads to further complications -- the U.S.
administration opts for greater fiscal stimulus due to growing concerns regarding stagnating
employment rates in the U.S., and the absence of solid sign of labor market recovery. In
contrast, Germany does not share the U.S. administration impetus for fiscal stimulus, making the
task of coordinating fiscal policy between Europe and the U.S. much harder. Concerns about the
possible impact of further increase in the public debt/GDP in the U.S. have reduced the political
support for a sizable future fiscal stimulus in the U.S. Ironically, the net fiscal expenditure
stimulus in the U.S. at the level of all public sector [local, state and federal] has been close to
zero. Yet, as the counterfactual is hard to contemplate, political debates about the fiscal and
monetary stance of the U.S. led to policy fatigue, and the prospect for large net fiscal stimulus
seems presently bleak.
We overview now key issues about the efficacy of the initial stimulus, and the desirability of
prolong sizable fiscal expansions.
The cost channel: Fiscal skeptics point out that, possibly with a lag, fiscal stimuli tend to
increase the cost of servicing the public debt. Yet, the evidence about powerful links between
the public debt/GDP and the cost of public funds in the matured, the high income OECD is
scanty.
- In the present crisis, the real interest rate remains low and declining in the U.S. and in the core
countries of the Euro block. Past history provides limited support for the cost channel: the
percentage U.S. public debt/GDP at the end of World War II was at the three digits level, without
inducing major increase in interest rates. Indeed, U.S. public debt/GDP declined during 1945-
1970 due to a combination of rapid economic growth and mild inflation that exceeded the
expected inflation. Furthermore, over the period 1946-2008, there is a robust positive and
significant relationship between debt maturity and the debt/GDP ratio in the U.S., but there is no
significant relationship between debt maturity and inflation. Even when one experiments with
various inflation lags, inflation does not influence the maturity of U.S. debt [see Missale and
Blanchard (1994) and Aizenman and Marion (2009)].
9
- In contrast, the case of weaker underbelly of the Euro block illustrates the fiscal cost channel in
Greece, Spain and Portugal and several other weaker countries in Eastern Europe. In recent
quarters, the interest on the sovereign debt of these countries increased sharply relative to that of
Germany, inducing the ECB and the IMF to embark on an unprecedented financial support
package. Some suggest that, beyond being part of the Euro block, countries like Greece, Spain
and Portugal still share characteristics of developing countries with limited tax capacity, where
the cost channel of public debt may be quite powerful. These concerns applies also to several in
Eastern European countries, which probably benefited before the financial crisis of 2008-9 from
easier access to the capital market, in anticipation of their future status as members of the Euro
block.
- A constructive way to approach the cost channel of public debt is to trace the flow costs of
serving the public debt, as percentage of the GDP.2 A commonly used measure of fiscal burden
is the funding flow needed to keep public debt/GDP constant. Specifically, a public debt/GDP
ratio, d, would grow overtime at a rate equal to the gap between the real interest rate on the debt,
r, minus the growth rate of the economy, g, assuming a primary fiscal balance of zero.
Henceforth we refer to the gap (r – g) as the flow cost of public debt. The fiscal burden
associated with a given public debt/GDP ratio, d, equals (r-g)*d . Consequently, annual taxes of
(r-g)*d (as a fraction of the GDP) assures that the public debt/GDP would remain stable
overtime as long as the a primary fiscal balance is zero [for more details, see Obstfeld and
Rogoff (1996)]. As such, the present cost of public debt in the U.S. and the core of Europe have
been very low during the crisis. Some observers are concerned that further increase in the public
debt may lead to higher interest rate down the road. Other observes point out that proper fiscal
stimulus may lead the faster resumption of growth, mitigating the future cost concern. Fiscal
skeptics put greater weight on the first concern [higher interest rate around the corner]. In
contrast, economists concerned about the growing employment slack and the underutilization of
human capital call for greater fiscal stimulus at times when the flow cost of public debt is close
2 The discussion on the flow cost of public debt in this section draws on Aizenman and Pasricha (2010a), where these arguments are more fully developed.

10
to zero in the U.S. and the core of Europe. The case of the fiscal expansion in the U.S. may be
strengthen by the observation that monetary expansions in the U.S. induced low interest rates on
U.S. bonds, but so far failed to invigorate new credit to the private sector.
The global crisis has brought to the fore the fiscal vulnerabilities of OECD countries.
There is a growing recognition of the fiscal vulnerabilities of some countries of the Euro block
(Greece, Portugal, Spain, Italy, Ireland and others). The ability of the U.S. to obtain relatively
cheap funding of its debt delays, but does not negate the fiscal challenges facing the U.S. While
the crisis added to the debt burdens, these fiscal vulnerabilities are not new. Rather, they were
built up gradually before the crisis, as a result of demographic transition (aging population and
declining fertility) affecting OECD countries, and the commitments made by the welfare states.
The “great moderation” (i.e., the drop in volatility and risk premium during the late 1990s and
early 2000s), and the growing belief that this great moderation was here to stay, mitigated fiscal
concerns. During that period, the sharp decline in the price of risk and in the risk free interest rate
allowed a growing sense of complacency in Europe and the U.S. regarding the exposure to fiscal
challenges. The current global crisis made clear that the spell of great moderation was a
transitory hiatus.
Projections of fiscal vulnerability the IMF and other international institution frequently
focus on the expected future pattern of the public debt/GDP, d. Such projections portray the
future path of public debt/GDP by adjusting the present debt/GDP according to the projected
future of taxes and fiscal commitments, for a given path of the real interest rate (r) and economic
growth (g). Yet, projecting accurately the future r and g is impossible, as these variables are
highly volatile. Therefore, it’s useful to supplement the fiscal vulnerability approach with
robustness analysis, based on what the past data says about (r-g). While there is no obvious
threshold indicating a funding crisis, higher burden of public debt as a fraction of the GDP, [(r –
g)*d] increases the need for fiscal adjustment in the form of some combination of lower
government expenditure and transfers, and higher taxes. Looking at the past to provide insight
about the future has been a neglected perspective since before the crisis. The low real interest
rate and the moderate growth of OECD countries during the era of the “great moderation”
implied very low fiscal burden. Perceiving the great moderation as an enduring state instead of a
lucky draw induced fiscal laxity in the years preceding the global crisis. Arguably, derailing
short term economic stabilization based on projections of permanent gloomy growth rates today

11
may be an equally invalid perspective. Taking the past decades as guidance for possible future
developments helps in avoiding the fallacy of framing the future in terms of a unique scenario, a
strategy that may lead to either too optimistic or too pessimistic priors, possibly magnifying the
resultant macro volatility. Looking at the past data is useful, as it indicates that growth rates and
real interest rates are highly unstable over time, with low correlations across decades (Easterly et
al., 1993; Mishkin, 1981).
Fiscal projections may be alarmist if one jumps from the priors of great moderation to the
prior of permanent high future burden. Yet, the importance of both r and g in determining the
actual debt burdens as well as the range of scenarios faced by OECD countries in the past
suggests that countries exposed to heightened vulnerability may consider both short term
stabilization and forward looking fiscal reforms. In order to evaluate the various outlooks for the
future debt burdens for OECD countries, Aizenman and Pasricha (2010a) applied IMF’s World
Economic Outlook (WEO) projections of gross general government debt/GDP ratio, d, for each
country, for the year 2015. A majority of the OECD countries are expected to have debt/GDP
ratios exceeding 60% by 2015. For the projected debt/GDP ratios, we computed the implied debt
burdens for each country, for scenarios driven from the history of the OECD countries during the
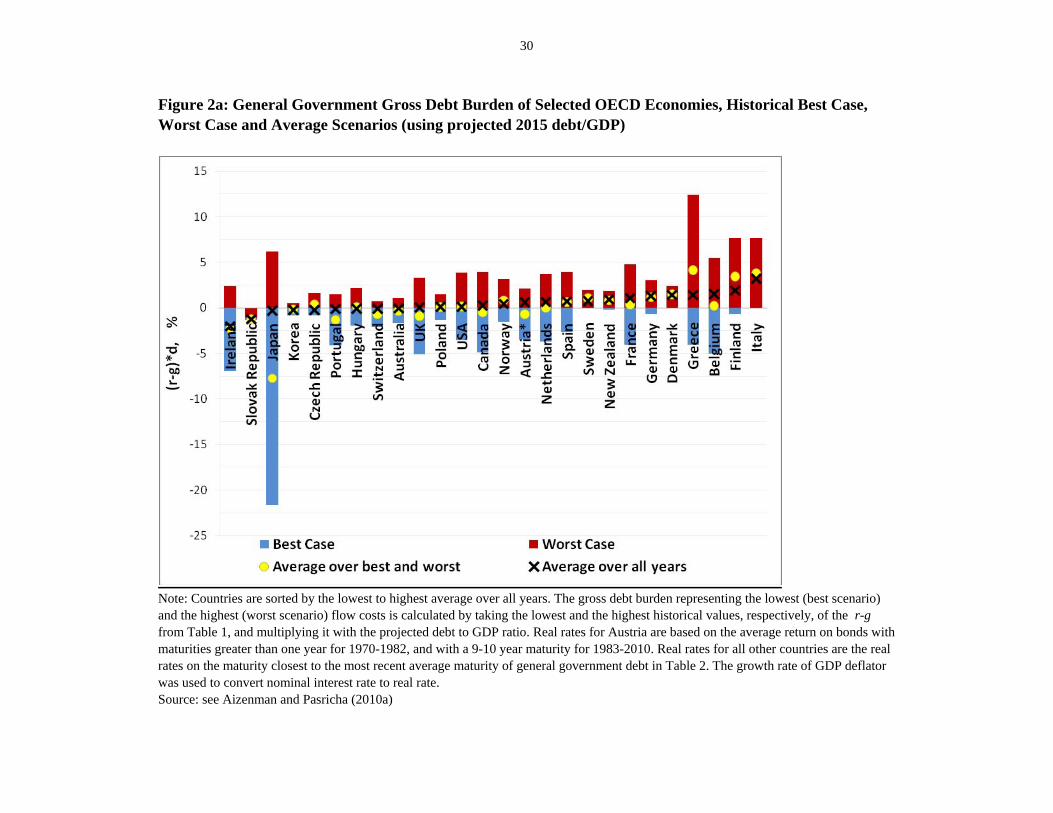
last forty years. Figure 2a report the projected debt burden of 26 OECD countries, using the
projected 2015 public debt/GDP, and the average and the difference between the historical worst
and best case scenarios of r – g, during the last four decades. Intriguingly, for most the
countries the projected debt burden, defined in terms of the flow cost of serving the debt, is
below 2%, the exception being Greece, Italy and Finland. For most of the OECD countries,
including the US, the projected expected public debt burden is zero or negative [conditional on
the assumption of stable stochastic structure of r – g]. The country with the greatest uncertainty
in the future debt burden is Japan, followed by Greece, Belgium, Ireland, France and Canada.
The U.S. has the 11th highest uncertainty in terms of (worst-best) scenarios. While most
countries that have low projected debt ratios occupy the lower end of the scale, that is, they have
lower uncertainty in future debt burdens, this uncertainty does not increase monotonically with
the size of projected debt. The U.S. projected debt for 2015 is higher than the projected debt of
seven of the countries that face greater uncertainty in debt burden than the U.S. Similar results
apply relying on other measures of future fiscal uncertainty.

12
Using this perspective, Aizenman and Pasricha (2010a) concluded that, in so far as the
future growth may depend on short term stabilization during or in the aftermath of a financial
crash and a deep recession, the additional debt incurred for such stabilization may not translate
into excessively high future flow costs of public debt for a significant portion of the OECD
countries. However, we also emphasize that the uncertainty of future debt burden is likely to
increase with the size of the future debt/GDP ratios. Prudent fiscal policy therefore may involve
both short term stabilization and forward looking fiscal reforms. This is illustrated by looking at
the OECD countries’ worst fiscal scenario. Taking this perspective, we found that most OECD
countries have worst-case projected debt burdens over 2 percent of GDP. This public debt
burden level, if realized, would likely be onerous, given OECD countries’ population dynamics
and the commitments of the welfare state. The U.S. has an above-average debt burden in the
worst case scenario, of about 3.9 percent of GDP. Greece by far has the highest debt burden in
the worst case scenario, of about 12.4 percent of GDP. In the worst case scenario, a Greek
default is not a far-fetched possibility.
Admittedly, accomplishing fiscal stabilization and forward looking fiscal reforms
simultaneously has challenged the political capacities of the U.S. and Europe. Yet, going
overboard with only one of the two adjustments (i.e., focusing only on short term stabilization, or
on forward looking fiscal reforms in the form of early belt tightening) may increase
vulnerabilities. Focusing only on stabilization in the form of fiscal stimulus and monetary easing
raises concerns about the cost of government borrowing and the possibility of future sovereign
defaults (see the interest rates facing Greece and the weaker underbelly of the Euro area in recent
quarters). Focusing only on belt tightening today may delay the global recovery. Finding the
proper balance remains a work in progress. This is especially the case in countries with lower
fiscal space, where high public debt/GDP and low tax collection rate may require greater
emphasis on belt tightening and tax enforcement policies, or in relatively high tax burden
countries (which seems to be the case in the EU relative to the U.S.).
Fiscal stance in emerging markets. Emerging Markets are projected to grow at much faster
rate than the OECD, matured countries. The April 2010 WEO’s updated projection is that
advanced countries will grow in the next year at about 2.5%, whereas Emerging Markets and
developing countries at about 6.5%. The projected GDP growth for China and India is much
13
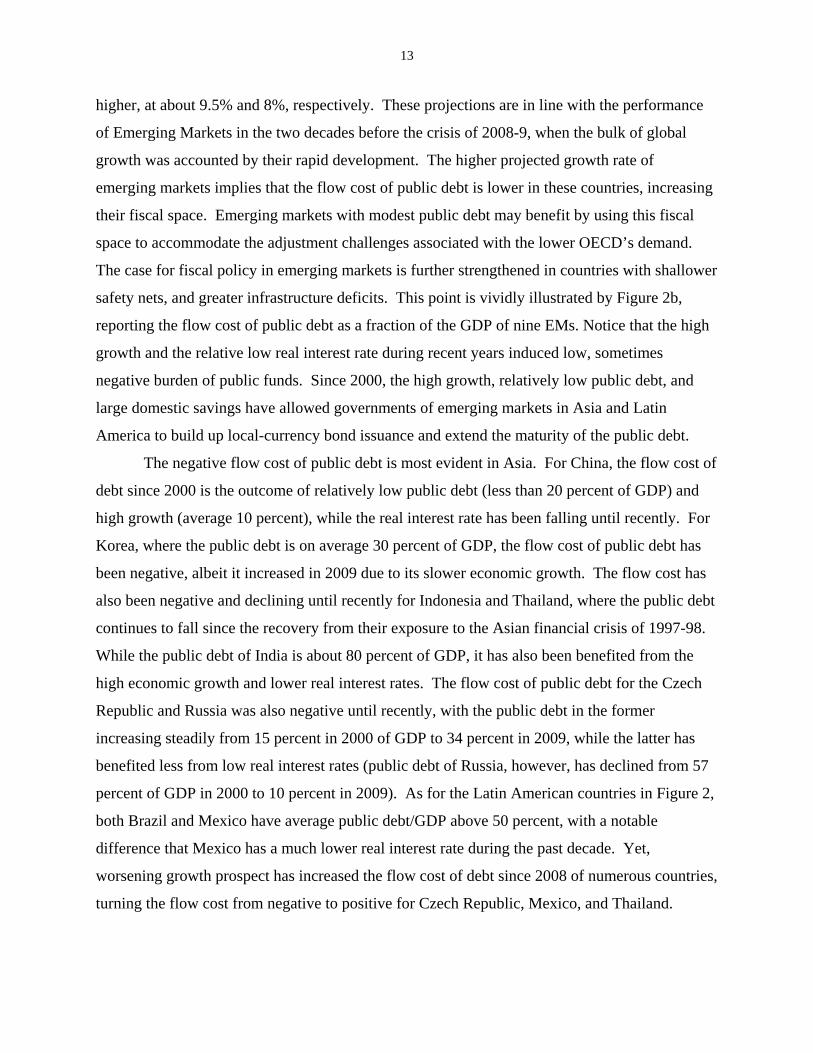
higher, at about 9.5% and 8%, respectively. These projections are in line with the performance
of Emerging Markets in the two decades before the crisis of 2008-9, when the bulk of global
growth was accounted by their rapid development. The higher projected growth rate of
emerging markets implies that the flow cost of public debt is lower in these countries, increasing
their fiscal space. Emerging markets with modest public debt may benefit by using this fiscal
space to accommodate the adjustment challenges associated with the lower OECD’s demand.
The case for fiscal policy in emerging markets is further strengthened in countries with shallower
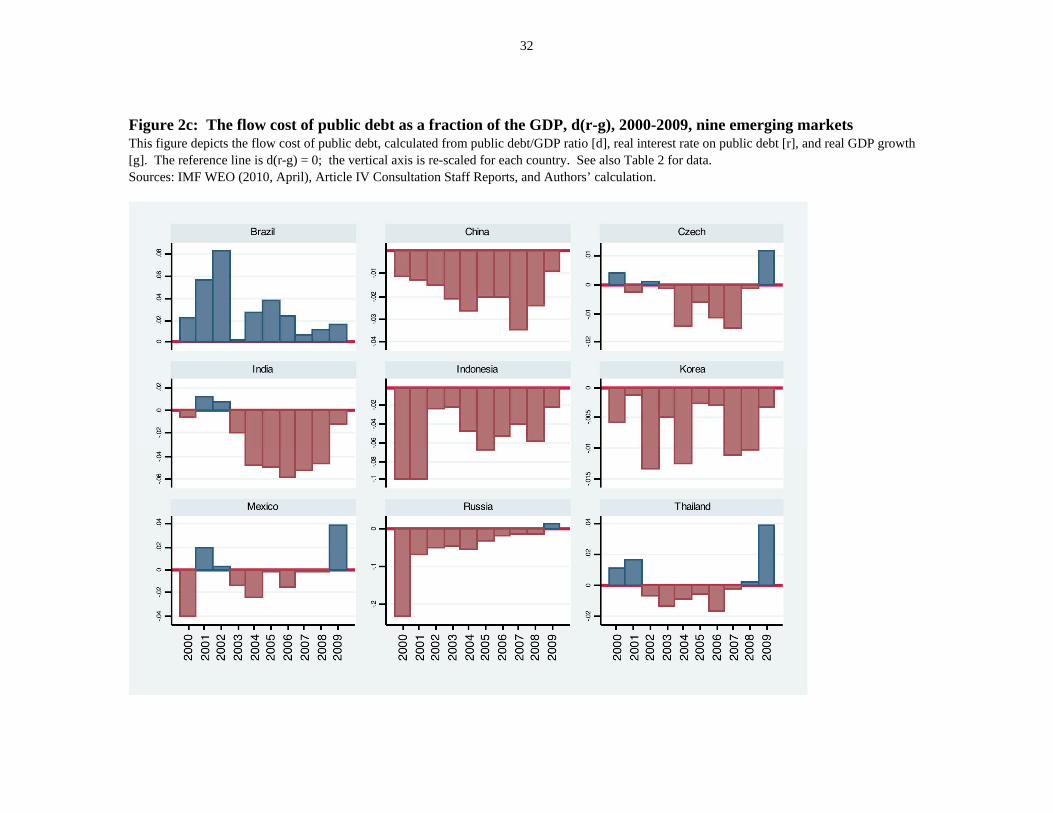
safety nets, and greater infrastructure deficits. This point is vividly illustrated by Figure 2b,
reporting the flow cost of public debt as a fraction of the GDP of nine EMs. Notice that the high
growth and the relative low real interest rate during recent years induced low, sometimes
negative burden of public funds. Since 2000, the high growth, relatively low public debt, and
large domestic savings have allowed governments of emerging markets in Asia and Latin
America to build up local-currency bond issuance and extend the maturity of the public debt.
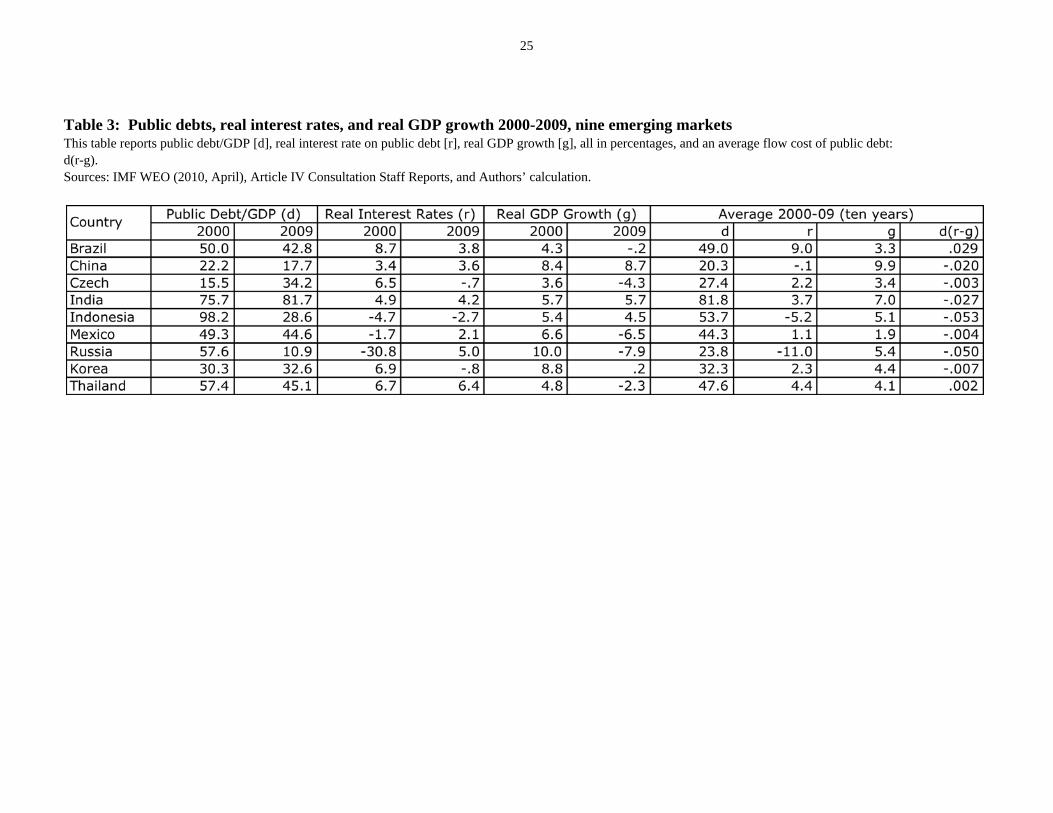
The negative flow cost of public debt is most evident in Asia. For China, the flow cost of
debt since 2000 is the outcome of relatively low public debt (less than 20 percent of GDP) and
high growth (average 10 percent), while the real interest rate has been falling until recently. For
Korea, where the public debt is on average 30 percent of GDP, the flow cost of public debt has
been negative, albeit it increased in 2009 due to its slower economic growth. The flow cost has
also been negative and declining until recently for Indonesia and Thailand, where the public debt
continues to fall since the recovery from their exposure to the Asian financial crisis of 1997-98.
While the public debt of India is about 80 percent of GDP, it has also been benefited from the
high economic growth and lower real interest rates. The flow cost of public debt for the Czech
Republic and Russia was also negative until recently, with the public debt in the former
increasing steadily from 15 percent in 2000 of GDP to 34 percent in 2009, while the latter has
benefited less from low real interest rates (public debt of Russia, however, has declined from 57
percent of GDP in 2000 to 10 percent in 2009). As for the Latin American countries in Figure 2,
both Brazil and Mexico have average public debt/GDP above 50 percent, with a notable
difference that Mexico has a much lower real interest rate during the past decade. Yet,
worsening growth prospect has increased the flow cost of debt since 2008 of numerous countries,
turning the flow cost from negative to positive for Czech Republic, Mexico, and Thailand.
14
Fiscal Space
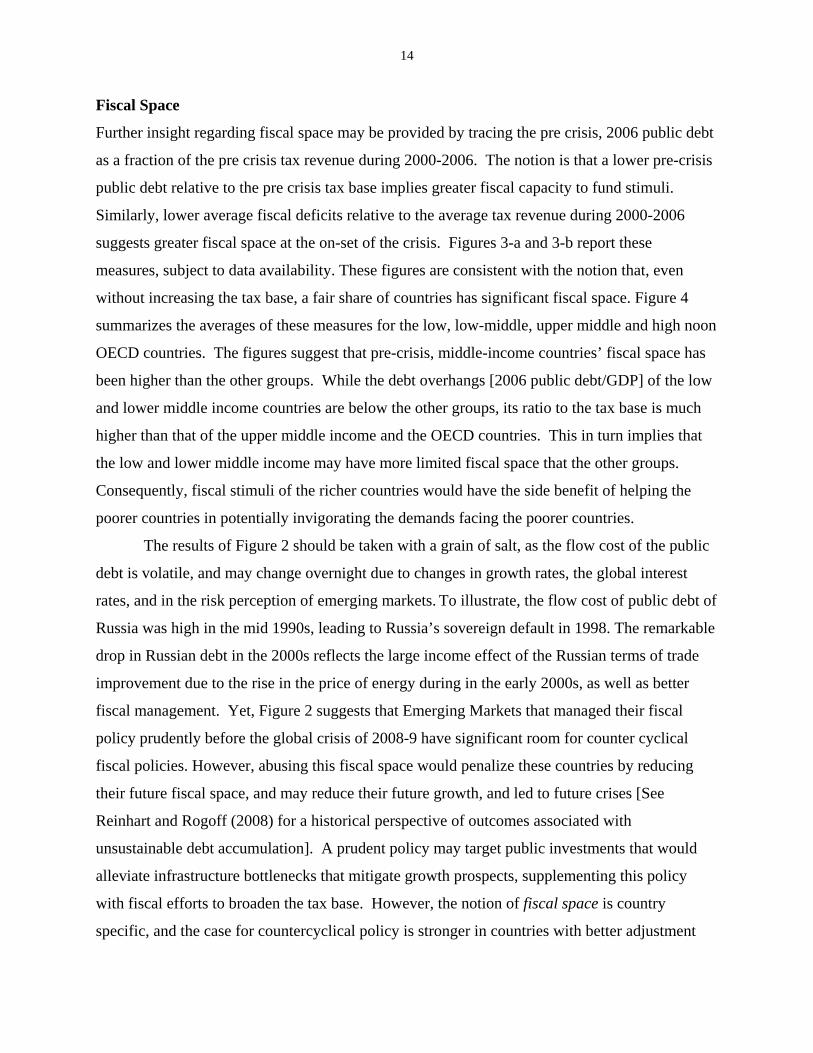
Further insight regarding fiscal space may be provided by tracing the pre crisis, 2006 public debt
as a fraction of the pre crisis tax revenue during 2000-2006. The notion is that a lower pre-crisis
public debt relative to the pre crisis tax base implies greater fiscal capacity to fund stimuli.
Similarly, lower average fiscal deficits relative to the average tax revenue during 2000-2006
suggests greater fiscal space at the on-set of the crisis. Figures 3-a and 3-b report these
measures, subject to data availability. These figures are consistent with the notion that, even
without increasing the tax base, a fair share of countries has significant fiscal space. Figure 4
summarizes the averages of these measures for the low, low-middle, upper middle and high noon
OECD countries. The figures suggest that pre-crisis, middle-income countries’ fiscal space has
been higher than the other groups. While the debt overhangs [2006 public debt/GDP] of the low
and lower middle income countries are below the other groups, its ratio to the tax base is much
higher than that of the upper middle income and the OECD countries. This in turn implies that
the low and lower middle income may have more limited fiscal space that the other groups.
Consequently, fiscal stimuli of the richer countries would have the side benefit of helping the
poorer countries in potentially invigorating the demands facing the poorer countries.
The results of Figure 2 should be taken with a grain of salt, as the flow cost of the public
debt is volatile, and may change overnight due to changes in growth rates, the global interest
rates, and in the risk perception of emerging markets. To illustrate, the flow cost of public debt of
Russia was high in the mid 1990s, leading to Russia’s sovereign default in 1998. The remarkable
drop in Russian debt in the 2000s reflects the large income effect of the Russian terms of trade
improvement due to the rise in the price of energy during in the early 2000s, as well as better
fiscal management. Yet, Figure 2 suggests that Emerging Markets that managed their fiscal
policy prudently before the global crisis of 2008-9 have significant room for counter cyclical
fiscal policies. However, abusing this fiscal space would penalize these countries by reducing
their future fiscal space, and may reduce their future growth, and led to future crises [See
Reinhart and Rogoff (2008) for a historical perspective of outcomes associated with
unsustainable debt accumulation]. A prudent policy may target public investments that would
alleviate infrastructure bottlenecks that mitigate growth prospects, supplementing this policy
with fiscal efforts to broaden the tax base. However, the notion of fiscal space is country
specific, and the case for countercyclical policy is stronger in countries with better adjustment

15
capacities, lower debt overhang, and greater willingness to rationalize their tax base. To
illustrate, in the 1980s Argentina and Brazil were fiscally challenged by their weak federal
systems, and shallow tax bases, where provincial states engaged in overspending, shifting the
debt burden to a weak federal center. That situation provided very little fiscal space in the
1980s, inducing high inflation and periodic crises. In the last two decades, Brazil rationalized
and broadened its tax base, taming the fiscal excesses of local governments, improving its fiscal
space. Argentina has been lagging relative to Brazil in its fiscal reform efforts, suggesting more
limited fiscal space there.
The low income developing countries were less exposed to the first phase of the crisis, by
virtue of their more limited financial integration, and thereby by limited exposure to the pressure
induced by capital outflows. Yet, the drop of commodity prices had a major adverse effect on
the commodity based economies that rely heavily on these exports. The coordinated fiscal and
monetary stimuli among most countries in the first phase of the crisis contributed to these
countries by preventing a deeper collapse of the demand for primary products, and setting in
motion the partial recovery of demand in recent quarters. Yet, these countries are painfully
exposed to the looming uncertainty regarding the global growth rate following the phasing out of
fiscal and monetary stimuli. Ideally, one should opt for a gradual phasing out of the fiscal and
monetary stimuli, at rates that are linked to the capacity of the private sector to resume
investment and consumption in the US and the OECD countries. Too optimistic assessment of
the capacity of the private sector in the U.S. and Europe to recover, and too alarmist take on the
costs of gradual phasing out of fiscal stimuli, increases the downside risk of protracted global
recovery, with growth below potential, with major possible adverse effects on Africa and the
weaker, low income countries in Latin America and Asia. Our discussion below will illustrate
that, while there is no escape from the need for fiscal consolidation down the road, at times of
global slack with very low interest rates, the cost of sustaining fiscal stimuli is low relative to the
risk of too abrupt fiscal consolidation. Indeed, WEO [2010, October, p 93] confirmed the
message of macro text books:
“fiscal consolidation typically reduces output and raises unemployment in the short term. At the same time, interest rate cuts, a fall in the value of the currency, and a rise in net exports usually soften the contractionary impact. Consolidation is more painful when it relies primarily on tax
16
hikes; this occurs largely because central banks typically provide less monetary stimulus during such episodes, particularly when they involve indirect tax hikes that raise inflation. Also, fiscal consolidation is more costly when the perceived risk of sovereign default is low. These findings suggest that budget deficit cuts are likely to be more painful if they occur simultaneously across many countries, and if monetary policy is not in a position to offset them. Over the long term, reducing government debt is likely to raise output, as real interest rates decline and the lighter burden of interest payments permits cuts to distortionary taxes.”
The political economy channel: greater income and wealth inequalities tend to reduce the
willingness to support fiscal stimulus due to the greater uncertainty of the future tax burden, and
the uneven incidences of the beneficiaries of fiscal stimulus. Occasionally, powerful groups may
prefer the status quo with growing stagnation to bolder fiscal steps that may entail redistribution,
locking the political system in a war of attrition. Arguably, this perspective provides a possible
interpretation for the recent fiscal history of the U.S. – in the 1980s, throughout the great
moderation there was greater zeal to cut taxes than to cut overall public expenditure and
transfers. The relative shallowness of the safety net of the U.S. relative to most other OECD
countries implies that the automatic fiscal stabilizers associated with safety nets are less potent in
the U.S., at times where the net fiscal stimulus of the consolidated government in the U.S. is
winding down. Recalling that the U.S. has been the epic center of the crisis, it’s too bad that the
U.S. seems to provide meager fiscal leadership in the coming years. By default, this may put
greater burden on policies and the fiscal stance of emerging markets.
The global crisis of 2008-9 raised the prospect of growing tension impacting the social
contract in the US and Europe, with possible adverse repercussions to lower income countries.
To a large extent, this was private-sector-created crisis amplified by the willingness of the US
policy makers to indulge in rapid deregulation and dismantling of financial regulations. The
sheer size of the crisis implied that, unlike the LTCM crisis of 1998, there was no way to provide
a ‘private bailout’, implying that the bulk cost of bailouts has been socialized, fully transferred to
the public sectors. Similar patterns took place in most other big OECD countries [UK, Germany,
France, etc…], as well as a fair share of the smaller once [Ireland, Spain, etc…]. The few
exceptions are mostly countries characterized by conservative financial management by their
Central Banks and financial regulators [Australia, Canada, Israel etc…]. Consequently, for most
countries, the crisis of 2008-9 led to growing tension between relatively wealthy and better
17
organized 'crisis creators' and more vulnerable public sectors and the poorer beneficiaries of
public sector supports.
In countries where the regulator is cozy with and not independent from dominant banks
and other financial institutions, there is the risk that the coming financial regulations will be too
timid. As was effectively articulated before the crisis by Rajan (2005), problematic incentives
and under-regulation in the US encouraged excessive risk taking, leading financial managers to
overlook the growing tail risk. As the 2008-9 crisis illustrated, this resulted with ex-post
socialization of the resultant risk exposure. The degree to which the burden of servicing the
resulted public debt would be shared by the wealthier tax payers in the US remains an open
question. This situation is ironic, as the US is among the OECD countries with the weakest
safety net, and with relatively low tax burden. In the 1980s-1990s, this situation was viewed
frequently as a virtue of the US, propagating a higher growth rate, a growth that down the road
supposes to provide a trickling down effect, alleviating poverty and improving the lots of the
weaker segments of the US economy. This notion has been severely challenged by the crisis, as
well as by the overall growing income and wealth gaps in the US before the crisis.
Fiscal challenges facing the U.S. Weak aggregate demand from the private sector in the U.S.
implies that, short of a new net fiscal stimulus and faster recovery of bank-lending to the private
sector, GDP growth rate would be anemic in the future quarters, with the downside risk of a
double dip recession. The continuation of the real estate weaknesses affecting the prime
mortgage market due to the high unemployment rate provides a further drag on the real
economy. There seems to be no end in sight for the continuation of sizable foreclosures. Facing
close to double digit unemployment, stagnating employment rates, and the uncertainty regarding
the strength of the economic recovery, the case for a second U.S. federal fiscal stimulus package
has been vigorously debated. Apprehension regarding a second round of fiscal stimulus stems
from “moral hazard” concerns in a fiscal union. Transferring federal resources to states with
deeper tax revenue shortfalls will ‘reward’ states that are less prudent, and penalize states that
have designed a more stable tax base as well as a precautionary pool of “saving for rainy day”.
While valid, this moral hazard concerns may call for designing the federal fiscal stimulus in
ways that would not reward states for their past fiscal mistakes. This can be done by channeling
funds to states on a per-capita base, such that each state will get allocation proportionate to its
18
population, as long as the state government is committed to spend these funds and not use them
to repay past debt.
A second concern restraining public support for greater federal stimulus deals with the
long run implications of a net stimulus that will increase future debt overhang. Observers noted
that even before the crisis, the public debt trajectory had been unsustainable, requiring a fiscal
reform down the road [see Auerbach and Gale (2009)]. Recognition of the gravity of the
recession induced by the financial crisis may call for combining any federal fiscal stimulus with
outlining a credible way to service the growing debt overhangs in the post crisis period. While
potentially desirable, political constraints may challenge the feasibility of a package-deal that
will combine present fiscal stimulus with future tax hikes and lower the provision of public
services and fiscal expenditure. These factors suggest that, in the absence of a burst of new
economic actives (like another technology or export driven boom), future growth prospects of
U.S. remain murky. The U.S. public debt/GDP ratio is projected to reach well above 100%
within the next ten years. The fundamental factors contributing to the burgeoning debt constitute
undertaxation of the U.S. consumers relative to past as well as projected government liabilities.
While these factors pre-date the crisis, the added debt overhang induced by the financial crisis of
2008-9 may add urgency to the need for fiscal reforms. The above-mentioned challenges suggest
that the road ahead is rampant with downside risks, and uncertainty.
Against this background, it is plausible to argue that the days of the U.S. being the global
‘demander of last resort’ are now over. The pace of the U.S. recovery will affect directly and
substantially the U.S. current account and indirectly the global balances, and the consequent net
effect remain uncertain. In the aftermath of the current financial crisis, U.S. private saving has
increased by about 5%, while U.S. public deficits have also increased rapidly, reaching a double
digit figure in 2009. On the other hand U.S. investments have declined. The net effect has been a
significant reduction of the U.S. current account deficit-GDP ratio. Current account constitutes
less than 3% of U.S. GDP in 2009. U.S. recovery may mitigate several of these factors, probably
increasing the U.S. current account deficit/GDP from the 2009 level. Yet, as long as the growth
of U.S. economy remains well below that of the emerging markets, the prospect of returning to
pre-crisis patterns of global imbalances remains dubious, and perhaps undesirable [See
Aizenman and Sun (2010) for further analysis]. This in turn poses new challenges for East and
19
South Asia in particular, and emerging markets in general. As the debate over China’s exchange-
rate policy and the US response intensifies, Chinese adjustment would not negate the need for
US adjustment, and would not resolve the underemployment challenges in the US in the most
efficient way. As illustrated by Auerbach and Obstfeld (2010), drawing on a theoretical cost-
benefit analysis, if the US wants to create jobs at the lowest costs, it should first consider further
fiscal expansion.
Concluding remarks
The illusive “great moderation” period had been a period when the global growth was dominated
by the emerging markets. The growing club of emerging markets moved towards growing
financial integration during the 1990s and 2000s. This had been a remarkable transition,
dominated by accelerating growths of the most populous countries [China and India]. The
growing financial integration exposed emerging markets to fast moving, but deep crises, starting
with the Mexican 1994-5 Tequila, continuing with the East Asian, Russian, Brazilian and other
crises. These events forced emerging markets to deal with fundamental deficiencies,
consolidating their fiscal positions, reducing their overall balance sheet exposure, and buffering
their positions with remarkable accumulation of reserves. Consequently, emerging markets
earned the drop in their risk premium in the old fashion way: solidifying their tax base and
rationalizing their public expenditure. In contrast, the U.S. and Europe avoided thought choices
during the great moderation, presuming that the “great moderation” would be more than a hiatus,
allowing the rich countries access to relatively cheap refinancing of public debt.
These trends, and the higher growth rate of emerging markets, put them in a position that
allowed most emerging markets to provide significant counter cyclical fiscal stimuli during the
2008-9. The challenges facing the U.S. and Europe suggests that emerging markets should
solidify their tax base, whilst continuing their fiscal stimulus aimed at improving the physical
and the human infrastructure. The need for EMs policies is magnified by the declining role of
the U.S. as the demander of last resort. To recall, in the decade before the crisis, the U.S. current
account deficit exceeded 1% of the global GDP, while the current account of Europe was on
average close to zero. This implied that prior to the crisis, rich countries (mostly the U.S.)
provided net stimulus in the form of large excess demand for the traded goods, supplied mostly
20
by the emerging markets. The forced saving induced by the real estate crisis and the drop in
private pensions in the U.S., the lackluster employment prospect in the U.S. and the limited
capacity to support large net fiscal stimulus of the U.S., all suggest that U.S. and other rich
countries would play a declining role as net sources of demand facing emerging markets. The
GDP growth prospect of emerging markets in the next decades continues to be superior to that of
the OECD by a sizable margin. Hence, projected future growth trends imply increasing GDP
share of emerging markets, and declining current account deficits/GDP of the rich countries.
These trends pose a challenge to emerging markets. Ideally, they would benefit from
coordinated adjustment of domestic policies, including fiscal policies, finding ways to
compensate for the declining role of the demand stemming from the rich countries by increasing
their domestic demand [see Feenstra and Hang (2010) and Prasad (2009) for further discussion
of policy options].
21
References
Aizenman J. and G. Pasricha. (2010a) "Fiscal Fragility: What the Past may say about the
Future", NBRE Working paper # 16478, September 2010.
__________"On the Ease of Overstating the Fiscal Stimulus in the U.S., 2008-09", SCIIE
Department working paper, (2010b).
Aizenman J. and N. P. Marion (2009) “Using Inflation to Erode the U.S. Public Debt,” NBER
WP 15562.
Aizenman J. and Y. Sun (2010) “Globalization and the Sustainability of Large Current Account
Imbalances: Size Matters,” Journal of Macroeconomics, 32, 1:35-44.
Auerbach, A. and W. Gale (2009) “An update on the economic and fiscal crises: 2009 and
beyond,” (October), Brookings Papers.
Aueerbach, A. and M. Obstfeld (2010), “Too much focus on the yuen?” Vox.
Auerbach, A. and Y. Gorodnichenko (2010), “Measuring the Output Responses to Fiscal
Policy,” NBER Working Paper 16311.
Barro, R. J. and C. J. Redlick (2009). “Macroeconomic Effects from Government Purchases and
Taxes,” Harvard University working paper, November.
Christiano, L., M. Eichenbaum, and S. Rebelo (2009). “When is the Government Spending
Multiplier Large?” NBER Working Paper 15394, October.
Dolls, M., C. Fuest, and A. Peichl. (2010) “Automatic Stabilizers and Economic Crisis: U.S. vs.
Europe NBER Working Paper No. 16275.
Easterly, William, Michael Kremer, Lant Pritchett, and Lawrence Summers (1993), “Good
Policy or Good Luck? Country Growth Performance and Temporary Shocks” Journal Of
Monetary Economics 32:459-83, December.
Feenstra, R. C. and C. Hong. (2010), “China’s exports and employment,” Chapter 5, pp. 167-199
in Feenstra, R. C. and S.J. Wei (eds.), China’s Growing Role in World Trade, University
of Chicago Press.
Fiscal Monitor (2010) “Navigating the Fiscal Challenges Ahead,” Fiscal Affairs Department,
IMF.
Gordon J. R. and R. Krenn (2010) “The end of the Great Depression 1939-41: policy
contributions an fiscal multipliers,” NBER WP No. 16380.
22
von Hagen, Jürgen and Barry Eichengreen (1996) “Federalism, fiscal restraints, and European
Monetary Union” The American Economic Review, Vol. 86, No. 2: 134-138.
Hall, Robert E. (2009). “By How Much Does GDP Rise if the Government Buys More Output?
Brookings Papers on Economic Activity. No. 2, forthcoming. Also NBER Working Paper
15496, November.
Heller, S. P. (2005) “Understanding fiscal space,” No 05/4, IMF Policy Discussion Papers.
Horton, M., M. Kumar, and P. Mauro (2009) “The State of Public Finances: A Cross-Country
Fiscal Monitor,” IMF Staff Position Note, SPN/09/21.
Missale, A. and O. J. Blanchard (1994). “The Debt Burden and Debt Maturity,” American
Economic Review Vol. 84, No. 1 (March), 309-319.
Mishkin, Frederic S. (1981) “The Real Interest Rate: An Empirical Investigation”, in The Costs
and Consequences of Inflation, Carnegie-Rochester Conference Series on Public Policy,
Vol. 15, (Autumn 1981), pp. 151-200 and 21 3-218.
Obstfeld M. and K. Rogoff (1996), Foundations of International Macroeconomics, MIT
Prasad, E. S. (2009) “Rebalancing Growth in Asia,” NBER Working Paper No. 15169.
Rajan R. (2005) “Has financial development made the world riskier?” Proceedings, Federal
Reserve Bank of Kansas City, issue Aug, pages 313-369.Reinhart, M. C. and K. K.
Rogoff K. (2008). “This Time is Different: A Panoramic View of Eight Centuries of Financial
Crises,” manuscript.
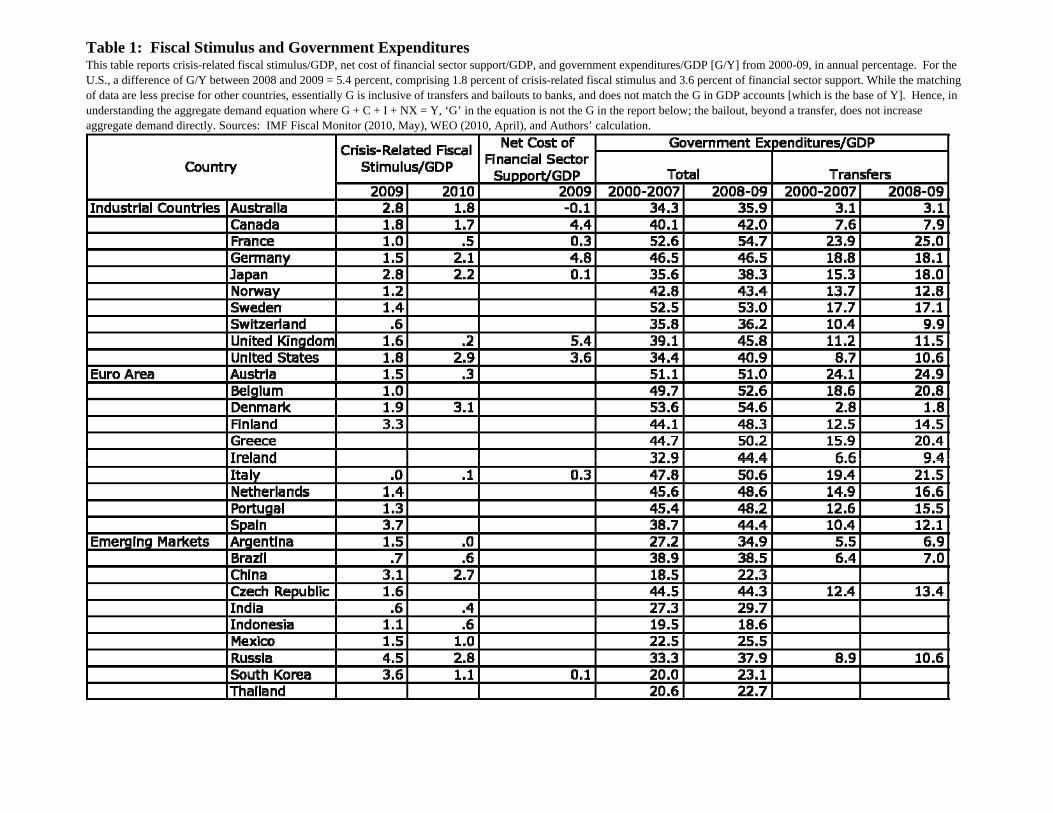
Table 1: Fiscal Stimulus and Government Expenditures This table reports crisis-related fiscal stimulus/GDP, net cost of financial sector support/GDP, and government expenditures/GDP [G/Y] from 2000-09, in annual percentage. For the U.S., a difference of G/Y between 2008 and 2009 = 5.4 percent, comprising 1.8 percent of crisis-related fiscal stimulus and 3.6 percent of financial sector support. While the matching of data are less precise for other countries, essentially G is inclusive of transfers and bailouts to banks, and does not match the G in GDP accounts [which is the base of Y]. Hence, in understanding the aggregate demand equation where G + C + I + NX = Y, ‘G’ in the equation is not the G in the report below; the bailout, beyond a transfer, does not increase aggregate demand directly. Sources: IMF Fiscal Monitor (2010, May), WEO (2010, April), and Authors’ calculation.
24
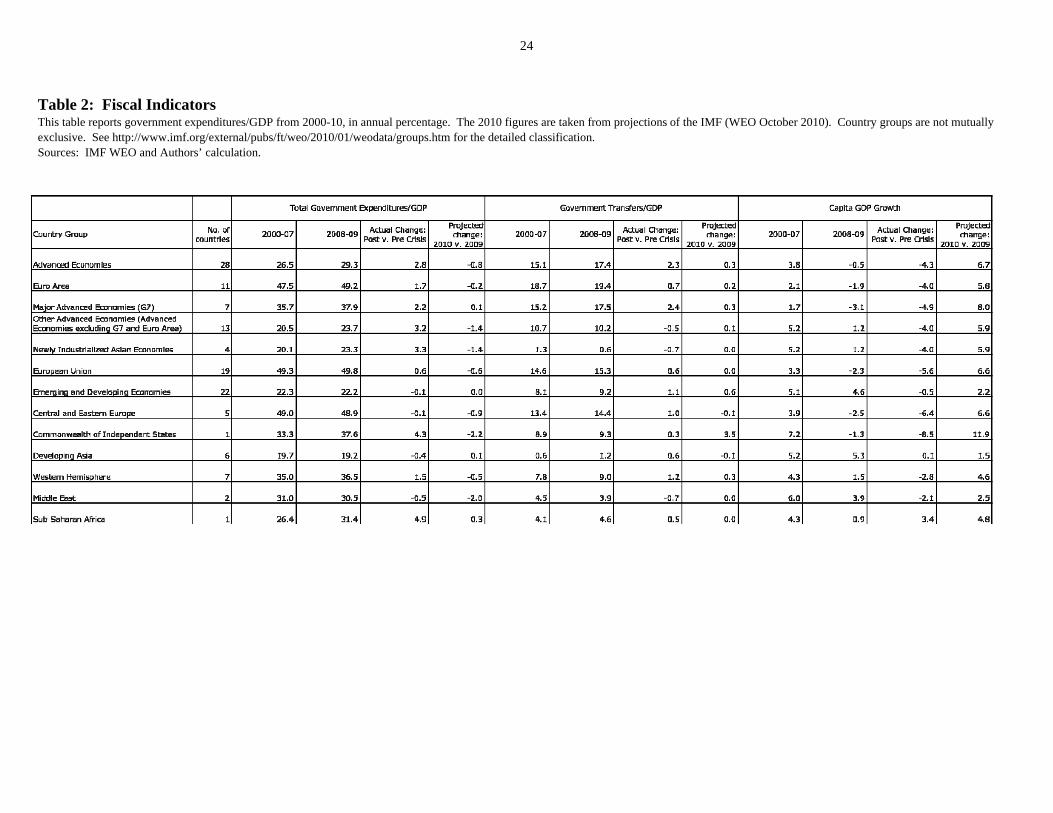
Table 2: Fiscal Indicators This table reports government expenditures/GDP from 2000-10, in annual percentage. The 2010 figures are taken from projections of the IMF (WEO October 2010). Country groups are not mutually exclusive. See http://www.imf.org/external/pubs/ft/weo/2010/01/weodata/groups.htm for the detailed classification. Sources: IMF WEO and Authors’ calculation.
25
Table 3: Public debts, real interest rates, and real GDP growth 2000-2009, nine emerging markets This table reports public debt/GDP [d], real interest rate on public debt [r], real GDP growth [g], all in percentages, and an average flow cost of public debt: d(r-g). Sources: IMF WEO (2010, April), Article IV Consultation Staff Reports, and Authors’ calculation.

26
Table 4: Fiscal Space This tble presents the measures of fiscal space based on 2000 to 2006 data. Tax is the average tax revenue/GDP from 2000-06. Debt is government/GDP as of 2006. Deficit is the average fiscal deficit/GDP from 2000-06. Source: World Bank WDI and authors’ calculation.
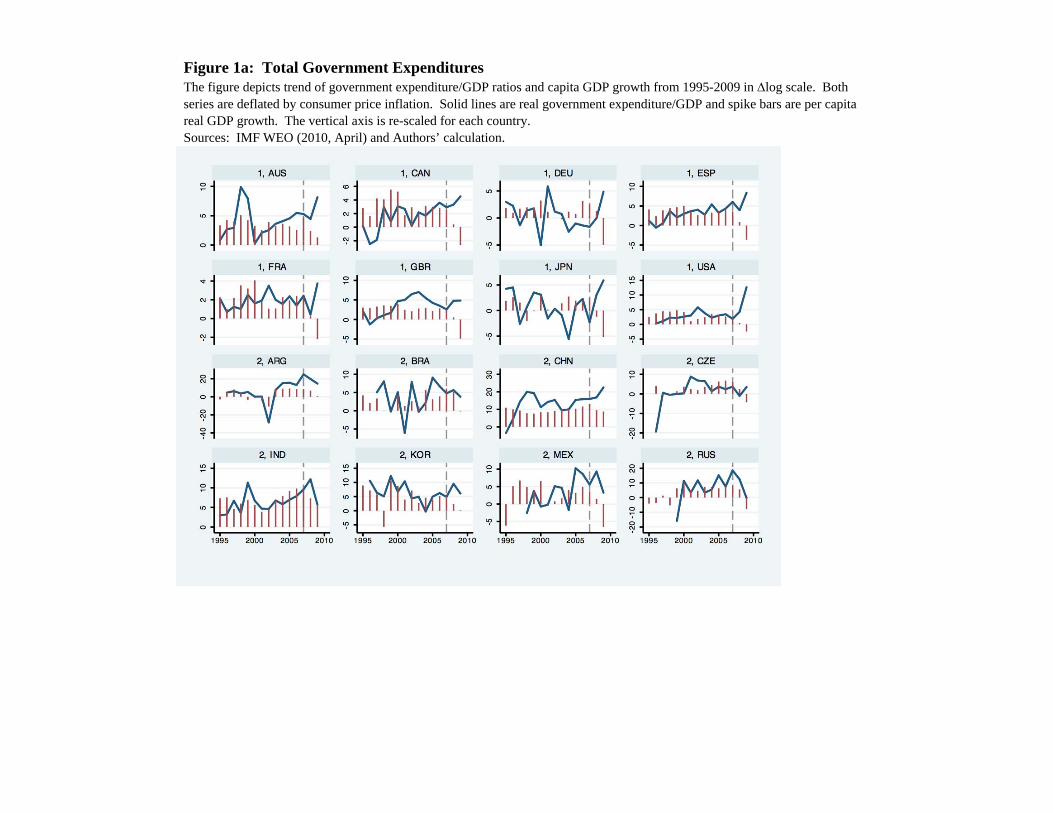
Figure 1a: Total Government Expenditures The figure depicts trend of government expenditure/GDP ratios and capita GDP growth from 1995-2009 in log scale. Both series are deflated by consumer price inflation. Solid lines are real government expenditure/GDP and spike bars are per capita real GDP growth. The vertical axis is re-scaled for each country. Sources: IMF WEO (2010, April) and Authors’ calculation.
28
Figure 1b: Government Transfers The figure depicts trend of government transfer/GDP ratios and capita GDP growth from 1995-2009 in log scale. Both series are deflated by consumer price inflation. Solid lines are real government transfer/GDP and spike bars are per capita real GDP growth. The vertical axis is re-scaled for each country. Sources: IMF WEO (2010, April) and Authors’ calculation.

29
Figure 1c: Gross Domestic Product The figure depicts trend of GDP growth and capita GDP growth from 1995-2009 in log scale. Both series are deflated by consumer price inflation. Solid lines are real GDP and spike bars are per capita real GDP growth. The vertical axis is re-scaled for each country. Sources: IMF WEO (2010, April) and Authors’ calculation.
30
Figure 2a: General Government Gross Debt Burden of Selected OECD Economies, Historical Best Case, Worst Case and Average Scenarios (using projected 2015 debt/GDP)
Note: Countries are sorted by the lowest to highest average over all years. The gross debt burden representing the lowest (best scenario) and the highest (worst scenario) flow costs is calculated by taking the lowest and the highest historical values, respectively, of the r-g from Table 1, and multiplying it with the projected debt to GDP ratio. Real rates for Austria are based on the average return on bonds with maturities greater than one year for 1970-1982, and with a 9-10 year maturity for 1983-2010. Real rates for all other countries are the real rates on the maturity closest to the most recent average maturity of general government debt in Table 2. The growth rate of GDP deflator was used to convert nominal interest rate to real rate. Source: see Aizenman and Pasricha (2010a)

31
Figure 2b: The flow cost of public debt as a fraction of the GDP, d(r-g), 2000-2009, nine emerging markets This figure depicts the flow cost of public debt, calculated from public debt/GDP ratio [d], real interest rate on public debt [r], and real GDP growth [g]. The reference line is d(r-g) = 0; the vertical axis is re-scaled for each country. See also Table 2 for data. Sources: IMF WEO (2010, April), Article IV Consultation Staff Reports, and Authors’ calculation.
32
Figure 2c: The flow cost of public debt as a fraction of the GDP, d(r-g), 2000-2009, nine emerging markets This figure depicts the flow cost of public debt, calculated from public debt/GDP ratio [d], real interest rate on public debt [r], and real GDP growth [g]. The reference line is d(r-g) = 0; the vertical axis is re-scaled for each country. See also Table 2 for data. Sources: IMF WEO (2010, April), Article IV Consultation Staff Reports, and Authors’ calculation.
33
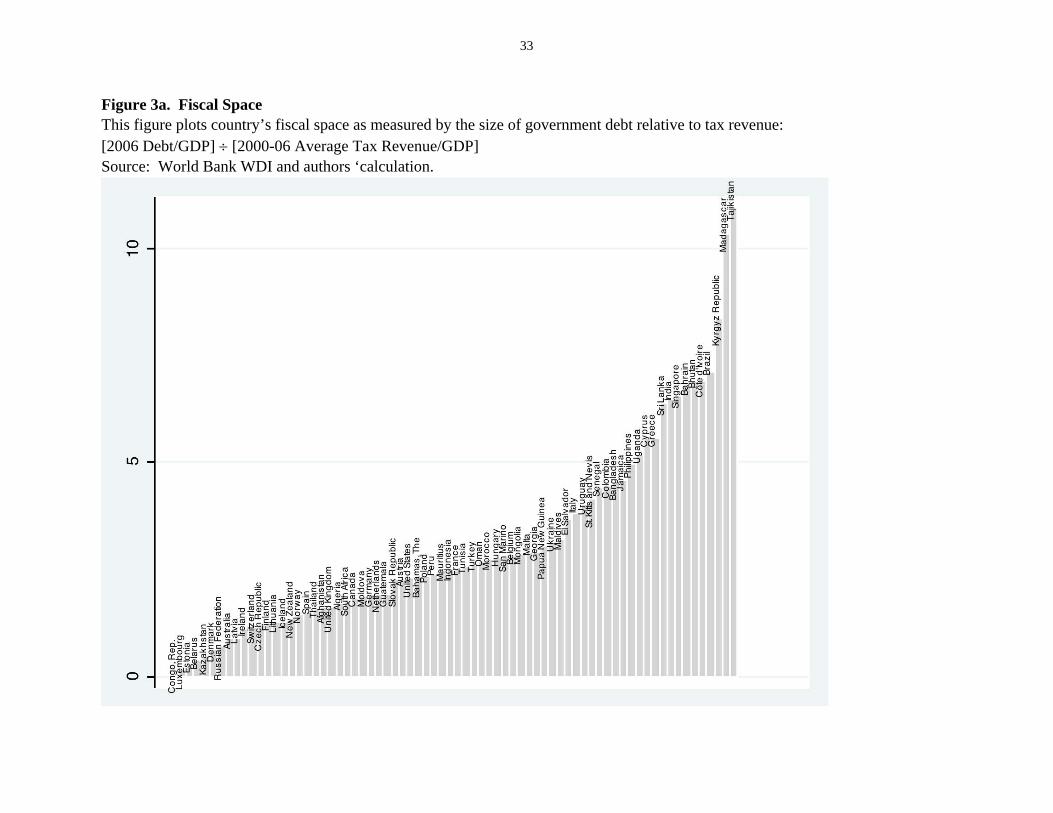
Figure 3a. Fiscal Space This figure plots country’s fiscal space as measured by the size of government debt relative to tax revenue: [2006 Debt/GDP] [2000-06 Average Tax Revenue/GDP] Source: World Bank WDI and authors ‘calculation.
34
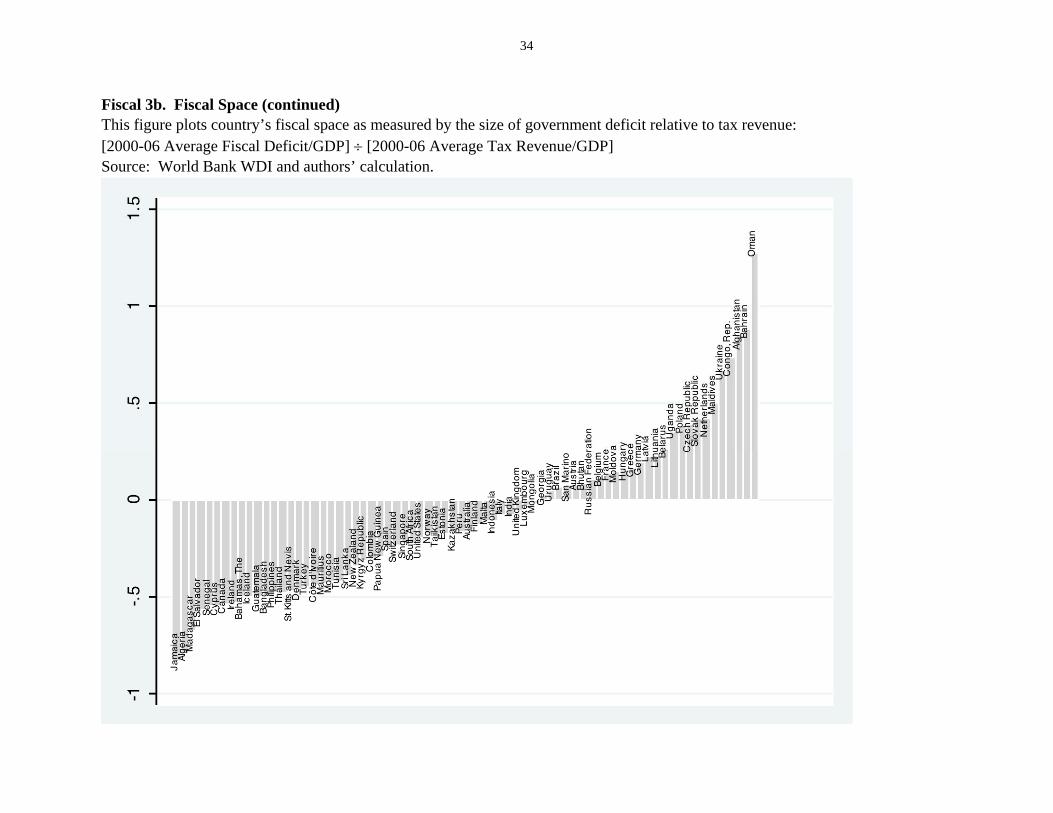
Fiscal 3b. Fiscal Space (continued) This figure plots country’s fiscal space as measured by the size of government deficit relative to tax revenue: [2000-06 Average Fiscal Deficit/GDP] [2000-06 Average Tax Revenue/GDP] Source: World Bank WDI and authors’ calculation.
35
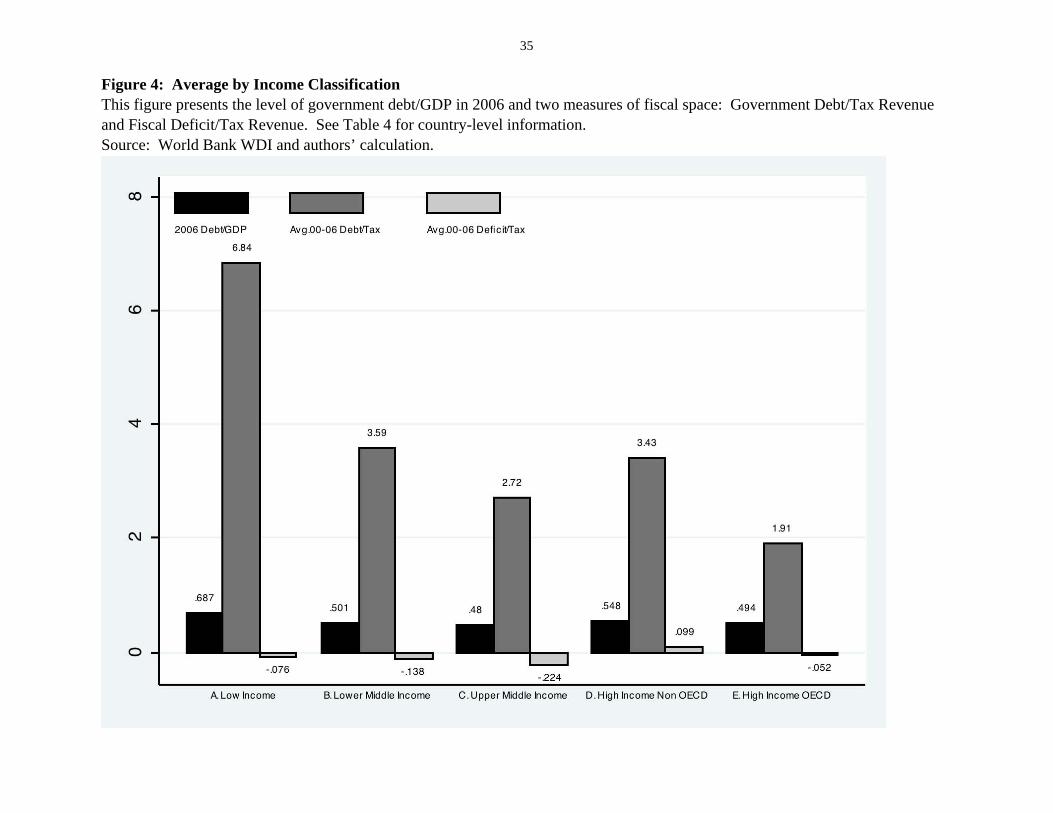
Figure 4: Average by Income Classification This figure presents the level of government debt/GDP in 2006 and two measures of fiscal space: Government Debt/Tax Revenue and Fiscal Deficit/Tax Revenue. See Table 4 for country-level information. Source: World Bank WDI and authors’ calculation.
Note for Table 2: Table 2 overviews government’s spending and growth across regions. Note that the country groups are not mutually exclusive: Germany is in both “Advanced Economies”, “Euro Area,” “Major Advanced Economies (G7),” as well as “European Union.” Subject to data availability, we calculate for Total Government Expenditures/GDP, Transfers/GDP and Capita GDP growth four indicators: pre-crisis average (2000-07), post-crisis average (2008-09), the difference between pre- and post-crisis, and a projected change from 2009 to 2010. As shown in the table, Post crisis, government expenditures and transfer increased in advanced economies more than in emerging-market Asia and Europe. The increase in government spending in the advanced economies reflects the declining growth in 2008-09. Emerging markets, particularly the ones in Asia, were mostly unscathed by the crisis, possibly explaining their relatively mild fiscal adjustment. The project increase in 2010 of capita growth rates across regions is rather high, essentially due to its lower growth base in 2008 and 2009. Notes for Table 4 and Figures 3-a and 3-b and Figure 4 Table 4 presents two “fiscal space” measures, both based on country’s pre-crisis fiscal stance (2000 – 2006). The measures are constructed from four indicators:
(i) pre-crisis average tax revenue/GDP (2000-2006); (ii) public debt/GDP in 2006; when the 2006 data are not available, we use an average
from 2000-06 (18 low-income and middle-income countries). (iii) pre-crisis average fiscal deficit/GDP (2000-2006) [fiscal deficit = expenditures plus
transfers minus tax revenue]. Countries with lower (ii)/(i) and (iii)/(i) are countries that at the on-set of the crisis should have higher “fiscal space,” as their average tax base is higher relative to the average pre-crisis average deficits, and the overall debt overhang. Figures 3-a and 3-b rank these “fiscal space” measures. The debt/tax and deficit/tax ratios suggest that, pre-crisis, middle-income countries’ fiscal space has been higher than the high-income (OECD and non OECD). The unfavourable demographic changes and extensive social welfare in the high-income countries suggest challenges to the future fiscal space of high income countries.