the role of forward capacity markets in increasing demand ... · forward capacity markets in...
TRANSCRIPT

The Role of Forward Capacity Markets in Increasing Demand-Side and Other Low-Carbon Resources
Experience and Prospects
May 2010
Forward capacity markets create a revenue stream for resources that can commit to being available at
times of system peak several years in the future mdash but this financial incentive is clearly not the only
factor driving the mix of resources in the power sector and their
resulting carbon footprint
1
The Role of Forward Capacity Markets in Increasing Demand-Side and Other Low-Carbon Resources
Experience and Prospects
by Meg Gottstein and Lisa Schwartz1
Auction-based capacity markets held several years
ahead of need mdash called ldquoforwardrdquo capacity markets
mdash are a relatively new approach for addressing
resource adequacy in the power sector Early experience in
the United States (US) suggests that these markets have the
potential to play a supporting role in delivering capacity
from low-carbon demand-side resources including energy
efficiency However auction results to date also suggest that
these markets encourage the construction or continued
operation of high-emitting supply-side resources to meet
reliability targets Market design improvements and
additional policies can serve to better align these capacity
markets with carbon reduction goals
1 The authors gratefully acknowledge technical assistance from Paul Peterson and Doug Hurley Synapse Energy Economics Inc
RegulatoRy assistance PRoject
2
Introduction and Summary
For most of the US power sectorrsquos history the quantity and mix of resources built to meet customer demand for electricity was determined or ldquoplannedrdquo by utilities and regulators using a
range of analytical tools and methods The revolution in computing technologies during the 1970s and lsquo80s made possible the development of sophisticated planning models that were used to identify the least-cost mix of resources to meet demand for electricity given a specified level of reliability In the mid-1990s ndash with the emergence of electric industry restructuring in some parts of the US ndash came the expectation that competitive markets would now determine both the optimal amount and the optimal mix of resources The result was a move away from involvement of regulators in the planning and procurement of electricity toward almost exclusive reliance upon markets for deciding how much and what kind of generating capacity would be available to meet customer demand
Real world experience quickly demonstrated that early market designs were not going to deliver the amount of generating capacity required for reliability needs Stated another way these markets were not eliciting sufficient investment in plant capacity to meet resource adequacy requirements The response in parts of the US was to introduce a regional planning and procurement process into organized power markets2 to address this shortcoming Regional system operators using traditional planning studies were now tasked with determining the level of capacity needed for resource adequacy several years into the future They also became responsible for procuring the required amount of capacity by augmenting existing energy markets with a forward looking capacity auction
More specifically in these auctions the system operators solicit bids to meet the level of resource commitment they estimate will be needed to meet future peak demand on the system and then provide market-based revenues to resources that can fulfill that commitment The revenues take the form of a stream of capacity payments3 mdash at a
price determined through a regional competitive auction Only those resources bidding at or under the market clearing price of the auction receive capacity commitments and payments for being available and for measured and verified performance when called upon during the expected system peak hours This particular approach to planning and procurement in the power sector became generally referred to as a ldquoforward capacity marketrdquo
Forward capacity markets are a development to watch because they combine traditional planning with organized markets into a unique formula that based on experience to date in the US appears to overcome the limitations of earlier energy-only or capacity market designs in meeting resource adequacy needs4 More important they represent the first time that energy efficiency resources have been expressly designed into organized power markets and permitted to compete directly with supply-side power generators
2 ldquoOrganized power marketsrdquo refers to power markets with an Independent System Operator (ISO) or Regional Transmission Organization (RTO) that operates a regional energy market capacity market or both This paper does not distinguish between RTOs and ISOs mdash which provide equivalent reliability services mdash and we refer to these entities generically as regional ldquosystem operatorsrdquo in the following sections
3 Capacity payments are in US$megawatt (MW)-day or US$kilowatt (kW)-month Conversion $100MW-day asymp $3kW-month
4 An overview of that experience is presented above
Demand-Side ResourcesDemand-side resources (also referred to as demand
resources) are customer-based resources that reduce energy needs at various times of the day and year mdash across some or many hours They are generally defined as follows
1) Energy efficiency mdash installing more efficient equipment or using more efficient processessystems to achieve a continuous and permanent reduction in energy use without reducing the quality of service
2) Demand response mdash changing a customerrsquos electricity demand in response to dispatch instructions or price signals
3) Distributed generation mdash generating electricity at the customer site in some cases using the waste heat produced in the electric generation process to also deliver useful heat or steam (combined heat and power)
3
the Role of foRwaRd caPacity MaRkets in incReasing deMand-side and otheR low-caRbon ResouRces
Two organized markets in the US mdash PJM5 and ISO New England (ISO-NE)6 mdash now conduct forward capacity auctions that permit a wide range of demand-side resources to compete with supply-side resources in meeting the resource adequacy requirements of the region (See Figure 1 below) The response of demand-side resources in the PJM and ISO-NE auctions is impressive and their participation is clearly demonstrating that reducing consumer demand
for electricity is functionally equivalent to mdash and cheaper than mdash producing power from generating resources for keeping supply and demand in balance One study suggests that participation of these resources in the first New England auction potentially saved customers as much as $280 million by lowering the price paid to all capacity resources in the market7 And in the most recent PJM auction demand-side resources are credited with reducing the unit clearing price from $17878 to $1646 in unconstrained zones mdash a savings of $16232MW- day8 Detailed results for the PJM and ISO-NE forward capacity auctions are presented in Appendix 1
There are two additional capacity markets in the US ndash one run by the New York ISO and the other (as of June 2009) by the Midwest ISO9 However only PJM and ISO-NE run auctions several years in advance of need and permit energy efficiency along with other demand-side resources to compete with generation to meet future reliability requirements They also offer the longest track record for forward capacity markets covering multiple states Brazil is the only other country with a forward capacity market but it does not permit demand-side resources of any kind to compete10 Therefore our discussion focuses on the forward capacity markets run by PJM and ISO-NE
This paper examines how auction-based forward capacity markets address resource adequacy with particular focus on their potential to increase the availability of
5 PJM Interconnection is an RTO that operates a competitive wholesale electricity market and manages the high-voltage electricity grid for all or parts of Delaware Illinois Indiana Kentucky Maryland Michigan New Jersey North Carolina Ohio Pennsylvania Tennessee Virginia West Virginia and the District of Columbia
6 ISO-NE oversees New Englandrsquos bulk electric power system serving the states of Connecticut Maine Massachusetts New Hampshire Rhode Island and Vermont
7 Cheryl Jenkins Chris Neme and Shawn Enterline Vermont Energy Investment Corporation (VEIC) ldquoEnergy Efficiency as a Resource in the ISO New England Forward Capacity Marketrdquo ECEEE 2009 Summer Study Proceedings
8 Joseph Bowring Monitoring Analytics ldquoAnalysis of the 20122013 RPM Base Residual Auctionrdquo Sept 10 2009 Table 20 ldquoUnconstrainedrdquo zones do not experience any distribution or transmission bottlenecks for the delivery of electricity to the end-user whereas ldquoconstrainedrdquo zones experience such limitations and pay clearing prices that reflect those constraints to capacity available during peak hours in those zones Accordingly the reduction in prices due to demand resources for any individual constrained zone will be higher or lower than $16232 per MW per day for this auction depending in part on the quantity of demand-side resources located in that zone
9 For more information on these capacity markets see Paul Peterson and Vladlena Sabodash Synapse Energy Economics Inc ldquoEnergy Efficiency in Wholesale Markets ISO-NE PJM MISOrdquo ACEEE 5th National Conference mdash Energy Efficiency as a Resource Sept 29 2009 and New York ISO ldquoInstalled Capacity Manual 4rdquo October 2009
10 Sam Newell Kathleen Spees and Attila Hajos The Brattle Group Midwest ISOrsquos Resource Adequacy Construct An Evaluation of Market Design Elements prepared for the Midwest Independent System Operator January 2009 httpwwwbrattlecom_documentsuploadlibraryupload832pdf
Arizona
California Colorado
Idaho
Kansas
Montana
NebraskaNevada
New Mexico
NorthDakota
Oklahoma
Oregon
SouthDakota
Texas
Utah
Washington
Wyoming
ME
MA
RICTNY
NJPA
WV VA
NC
SCGA
FL
ALMS
TN
KY
OHDEMD
INIL
WI
MI
MO
IA
MN
AR
LA
ME
VTNH
Figure 1
ISO New England and PJM Territories
ISO New England territory
PJM territorymdashcovers all or most of the state
PJM territorymdashcovers part of the state
RegulatoRy assistance PRoject
4
demand resources to meet future capacity requirements However experience to date also makes a strong case that more is needed in a carbon-constrained world where the total mix of resources is as important as the total quantity both in the short- and long-term In particular construction and continued operation of high carbon-emitting supply-side resources dominate the mix of capacity clearing these auctions and therefore these resources are receiving the bulk of market incentives (capacity payments) The results of recent studies mdash as well as market experience mdash also suggest that carbon pricing alone is unlikely to reduce this dominance in forward capacity markets (or in energy-only markets) at the pace or scale required to meet aggressive carbon reduction targets
In light of these observations we pose the following question to policymakers How can the planning and procurement process through forward capacity markets be strengthened to work in concert with carbon reduction goals and policies rather than at cross purposes This paper suggests a menu of options that could reduce carbon emissions from the power system by
bull Providing premium capacity payments to low-carbon resources
bull Selecting auction winners based on level of carbon emissions as well as bid price
bull Making capacity payments only to those resources with low- or zero-carbon emissions
bull Phasing out capacity payments to existing high-emitting resources
bull Allowing a longer price commitment or establishing fixed-capacity floor prices for low-carbon resources
bull Properly considering energy efficiency in load forecasts that set auction capacity needs
bull Refining existing market rules as needed to ensure that energy efficiency can fully compete on an equal basis with power generators including distributed generation11
More generally forward capacity markets create market incentives in the form of capacity payments for resources that can commit to being available at times of system peak beginning several years into the future But these capacity
payments are clearly not the only factor driving the mix of resources to meet customersrsquo current and future electricity needs Existing market rules and procurement policies that affect the mix of resources meeting the systemrsquos energy requirements mdash as well as policies and regulations that affect access location and cost recovery for transmission and distribution facilities mdash have enormous impact on both the short- and long-term resource mix in the power sector
It is beyond the scope of this paper to fully explore how market rules regulations and policies can be harmonized and strengthened to meet customersrsquo energy needs reliably in a carbon-constrained world Nonetheless we observe that many states in the US including those where forward capacity markets and carbon pricing currently exist have made large and long lasting commitments to demand-side and renewable resource procurement through additional policies and regulations These include
bull Strong energy efficiency codes and equipment standards
bull Stable and sustained funding to provide audits financial incentives and financing for home and business efficiency improvements including through carbon auction revenues
bull Energy efficiency resource standards that require achievement of specified energy-saving targets
bull Renewable energy standards that require meeting a percentage of energy consumption with renewable resources along with long-term contracting requirements in some cases
bull Decoupling of utility profits from revenues financial incentives for shareholders or both where the utility is the efficiency portfolio manager mdash or performance contracting with third-party administrators to deliver comprehensive large-scale efficiency programs
bull Complementary resource planning and procurement practices designed to increase the mix of demand-side and renewable resources that can meet resource adequacy requirements
Finally we recognize that not all regions will create capacity markets for the purpose of addressing resource
11 For example energy efficiency resources that clear the PJM auction cannot receive capacity payments for more than four delivery years whereas under the ISO-NE market rules these resources are eligible to receive payments over the full life of the installed measures All other resources are eligible to participate in these capacity markets for as long as their ability to reduce demand or generate power continues
5
the Role of foRwaRd caPacity MaRkets in incReasing deMand-side and otheR low-caRbon ResouRces
adequacy needs and we do not attempt to evaluate in this paper whether they should The evolution of capacity markets in certain regions of the US has its own and unique history (See text box) Establishing forward capacity markets and their associated auctions involves complex market rules and a myriad of market design choices along the way all with major implications for the relative costs and benefits to consumers and resource providers Options for addressing resource adequacy needs that do not involve the development of a capacity market should also be explored by policymakers particularly in the context of a carbon-constrained power sector The starting point of this paper however is that such markets already exist (or are in the planning stages) It is within this context that we offer our observations and recommendations
Resource Adequacy in the US
In the US resource adequacy refers to the ldquoability of the electric system to supply the aggregate electrical demand and energy requirements of the end-use customers at all timesrdquo mdash in effect to provide reliable supply 9997 percent of the time12 This high standard of reliability reflects the unique ldquoserve all or serve nonerdquo nature of the electric system If it falls short in meeting even one customerrsquos power needs all customers relying on that electric circuit are literally left ldquositting in the darkrdquo Contrast this with other goods and services sold to consumers mdash for example milk sold at a grocery store If there are only 15 cartons of milk on the shelf and 16 customers come in at the same time to purchase milk only one customer walks away empty handed (and that person could at least find a substitute product at the store to quench hisher thirst) In contrast if that product were kilowatt-hours and peak demand (or peak load) exceeds the ability of the system to generate electricity at that time then the store ldquoshuts downrdquo and all customers walk away empty-handed
To ensure against such an outcome utilities and other companies that sell electricity in the US and in many other power markets in the world are obligated to own or purchase enough capacity to reliably meet their customersrsquo peak demands (ldquoloadsrdquo) We call them ldquoload-serving entitiesrdquo or ldquoLSEsrdquo and unless otherwise noted do not distinguish between regulated LSEs (eg distribution utilities) and non-regulated LSEs (retail electricity suppliers) In either case the LSErsquos resource obligation in a forward capacity market is expressed in terms of its share of projected capacity needs for the region several years in the future
An electric system must perform three functions well to ensure resource adequacy mdash that is to ensure that there is sufficient capacity committed to meeting customersrsquo peak loads at all times These are
1) Estimate when the peak loads are likely to occur and the level of capacity commitment needed to reliably meet them13
2) Obligate LSEs to have sufficient capacity available to them during those projected periods of peak loads
3) Put policies and rules in place to ensure that sufficient resources will commit capacity to operate (or to reduce loads) during these periods both in the short- and long-run
In other words ensuring resource adequacy involves a planning process (what level of capacity commitment is needed and when) and a procurement process (how to acquire it) that focus on the quantity and timing of resources but not the mix of resources required to meet system reliability The attribute a resource is required to demonstrate for resource adequacy purposes is that its obligated capacity will be available when called upon during the projected hours of peak system loads Resource adequacy rules are indifferent to other attributes including environmental attributes of resources
12 North American Electric Reliability Corporation Glossary of Terms Used in Reliability Standards April 20 2009 at httpwwwnerccomdocsstandardsrsGlossary_2009April20pdf Put another way resource adequacy means having sufficient electric supply resources in place to maintain the ldquoone day in 10 yearsrdquo standard of reliability (which translates to reliable supply 9997 percent of the time) See also N Jonathan Peress and Kenneth A Colburn ldquoConnecting Market Design From Carbon to Electric Capacityrdquo October 2005 Vol 3 No 1 Energy Committee Newsletter American Bar Association
13 The level and timing of peak loads are estimated before the fact and the projections are less reliable the farther out in time they are made
RegulatoRy assistance PRoject
6
Forward capacity markets in the US evolved as a way of ensuring resource adequacy at reasonable costs to electricity consumers through a combination of system planning and organized markets Prior to the development of organized markets in parts of the US15 power ldquopoolsrdquo established a reserve margin requirement and each participating LSE was responsible for acquiring installed capacity to meet its individual loads plus that margin or face financial penalties The setting of capacity requirements for the pool as a whole meant however that each LSErsquos reserve requirements were significantly lower than they would otherwise be if it were a stand-alone entity that is participants in the pool benefited from the greater diversity of loads and supply resources that characterized the combined system The pools also facilitated the trading of capacity through bilateral agreements which had particular value in those pools where individual system peaks were temporally differentiated (as in New England whose northern states peaked in the winter and southern states in the summer) After market restructuring LSEs also could trade capacity in auctions run by the system operator responsible for the reliability of the regionrsquos electric grid In those early days of competitive wholesale markets auctions generally were held just a few days before the one-month delivery period
These nascent capacity markets provided insufficient incentives for plants to be available when called on The result was ldquobipolar pricingrdquo If there was a supply surplus capacity prices were effectively zero If there was any shortfall capacity prices rose to the price cap (if any) Moreover short time horizons for the auctions
limited offers for new capacity In addition market power16 concerns surfaced after utilities sold their power plants under electric industry restructuring particularly in areas with significant transmission constraints The Federal Energy Regulatory Commission (FERC) responded with price caps for the energy market that as a side effect limited scarcity price signals Thus ldquoenergy-onlyrdquo power markets mdash that is markets that pay clearing prices for energy on a day-ahead or shorter basis mdash were not paying high enough prices for investors to build sufficient peaking resources to meet future reliability needs
Meanwhile merchant generators were buckling under high fuel prices for new natural gas-fired plants and owners of older less efficient plants filed requests for retirement To maintain system reliability federal regulators approved expensive ldquoreliability must-runrdquo contracts to keep needed plants going and then mandated the development of a more systematic approach for paying for capacity The resulting process produced a mechanism to make capacity payments to all generators not just those applying for retirement and to develop more efficient capacity where it was most needed But the high price tag of such contracts for the New England states led to legal action that ended with a novel settlement in 2006 a capacity market run by ISO-NE that allows energy efficiency and other demand-side resources to compete with generation to meet reliability requirements several years in advance of need In 2007 much of the Mid-Atlantic and Midwest region adopted a similar capacity market run by PJM
How Forward Capacity Markets Evolved in the US14
14 This description draws upon Robert Stoddard and Seabron Adamson CRA International ldquoComparing Capacity Market and Payment Designs for Ensuring Supply Adequacyrdquo Proceedings of the 42nd Hawaii International Conference on System Sciences 2009 and Sandra Levine Doug Hurley and Seth Kaplan ldquoPrime Time for Efficiencyrdquo Public Utilities Fortnightly June 2008
15 See footnote 2 for a definition of ldquoorganized marketsrdquo Southern and western states except for California have not developed organized power markets
16 Such as withholding power to extract higher prices
7
the Role of foRwaRd caPacity MaRkets in incReasing deMand-side and otheR low-caRbon ResouRces
How Forward Capacity Markets Work
A forward capacity market is an administrative market run by a regional system operator who collects supply bids to meet planning targets for regional peak capacity needs runs a competitive auction to establish capacity prices and then procures capacity at the market clearing price to meet the resource adequacy requirements of the region The regional system operator is the sole buyer in this market LSEs are individually responsible for meeting their customersrsquo peak loads and are allocated a pro-rata share of the capacity costs incurred by the system operator to meet those loads
In forward capacity markets LSEs must demonstrate on a ldquoforwardrdquo basis that they will have sufficient capacity to meet their own customersrsquo peak loads (plus required reserves) several years into the future As discussed further below LSEs have the option to meet this requirement through bilateral contracting or LSE-owned generation referred to as ldquoself-suppliedrdquo or ldquoself-scheduledrdquo resources depending on the market However the ISO-NE and PJM capacity markets are mandatory for LSEs in the sense that the system operator will procure any residual needed capacity17 through the auction and assign cost responsibility to LSEs In addition all existing capacity must be offered into the auction along with new demand- or supply-side capacity offerings with certain exceptions
The forward auctions in both PJM and ISO-NE are held three years before the delivery year And the LSEsrsquo ldquoforwardrdquo capacity obligations and amount of capacity put out to bid are
established in advance of each auction Three years was selected to roughly match the minimum lead time required for the construction or development of new capacity once demand- and supply-side resources receive a price commitment from the auction In particular it was chosen to reflect a reasonable construction period for new peaking (eg gas-fired) power plants as well as a reasonable ldquoramp uprdquo period for energy efficiency projects18
For each auction the system operator establishes the level of capacity needed for the delivery year by forecasting (with input from the LSEs and other stakeholders) regional resource adequacy requirements mdash peak loads plus required reserves PJM performs this planning function by developing a downward-sloping demand curve with built-in price elasticity for each auction whereas ISO-NE establishes a single price-inelastic quantity of demand that it auctions in successive rounds of bidding
The capacity bid into the market (the ldquosupply curverdquo) is comprised of capacity commitments (MW) offered by existing and new resources These markets and associated auction rules are designed to allow new resources when needed to set the clearing price Existing resources are generally ldquoprice-takersrdquo in the sense that they are unlikely
to set price unless there is over-supply of existing capacity in the region
The market clearing price becomes the uniform price for all capacity that clears the auction That is the market clearing price is paid to all capacity committed by existing resources and all new resources that have bid into the auction at or below that clearing price There are separate auctions for constrained zones ndash locations
17 The system operator determines the level of residual capacity that it needs to procure to ensure system reliability and purchases that quantity it also must approve the LSErsquos showing of the level of capacity commitment it can meet through owned resources and bilateral contracts
18 See Jenkins et al p 178 and Johannes Pfeifenberger Samuel Newell Robert Earle Attila Hajos and Mariko Geronimo The Brattle Group Review of PJMrsquos Reliability Pricing Model June 30 2008 at httpwwwbrattlecomExpertsExpertDetailaspExpertID=67
19 See PJM Reliability Pricing Model Demand Response and Energy Efficiency at httpwwwpjmcommarkets-and-operationsdemand response~mediamarkets-opsrpm20090406-dr-ee-in-rpm-collateralashx
Sample Calculation of Revenue for a Successful Bidder19
Assume a service provider cleared 20 MW of demand-side resources in a capacity auction that had a clearing price of $100MW-day and that the provider delivered the 20 MW as contracted during the year The annual revenue stream for the year would be 20 MW $100MW-day 365 days = $730000
RegulatoRy assistance PRoject
8
that are experiencing distribution or transmission bottlenecks for the delivery of electricity to end-use customers The clearing prices in these auctions reflect congestion costs and in effect pay a locational adder to capacity available during peak hours in those zones
Only resources that clear the market receive capacity
payments However in order to maintain reliability under very limited circumstances out-of-market payments may be made to resources that do not clear The system operator may determine that a resource critical to maintaining reliability for a given locational zone must continue to run even if its cost of operation is higher than the auction
Using simple assumptions the general ldquoworkingsrdquo of a forward capacity market from the perspective of an individual LSE can be described as follows The system operator forecasts the regional capacity requirements for the future delivery year (2012) and plans to hold the capacity auction for that delivery year three years in advance Each LSE knows its forecasted capacity obligation for 2012 some months before the auction Letrsquos assume there are only two LSEs in the region and they each account for 50 percent of the total regional capacity requirement of 10000 MW projected for the delivery year
At the time of the auction the system operator approves LSE 1rsquos showing that it has bilateral contracts in place to meet 3500 MW of its capacity obligation for the delivery year LSE 2 on the other hand has no bilateral contracts (or generation that it owns) to meet any of its capacity obligation for 2012
Herersquos how it works LSE 1 will offer the 3500 MW under its bilateral contracts as ldquoself-suppliedrdquo or ldquoself-scheduledrdquo resources into the auction at a price of zero mdash and they will automatically clear the auction20 However as described below the auction clearing price will have no impact on what LSE 1 actually pays for this resource It will only pay the capacity price negotiated under its bilateral contracts
Now letrsquos flash forward to 2012 and assume that the actual 2012 peak capacity needs of the customers served
by LSE 1 and LSE 2 turn out exactly as the system operator forecasted for that year 21 and that LSE 1rsquos resources under bilateral contracts were available to meet peak capacity needs as expected At the end of 2012 the system operator calculates what it spent to meet the regionrsquos peak capacity needs LSE 2 will get a bill from the ISO for purchasing on its behalf 50 percent of the regional capacity needs (5000 MW) at the auction price for the 2012 delivery year LSE 1 will get a similar bill from the ISO mdash but with an offsetting credit for the 3500 MW of capacity under its bilateral contracts So in effect LSE 1 only pays the auction price for the ldquoresidualrdquo capacity of 1500 MW mdash the capacity that the system operator purchased to meet the remaining capacity obligation of LSE 1
The scenario is similar if actual 2012 peak loads are greater than forecasted levels LSE 2 will still pay the auction price for all of the capacity that was purchased on its behalf to meet its actual peak capacity needs and LSE 1 will pay that auction price for the (now higher) residual amount above its contracted capacity In this way LSEs can elect to use bilateral contracts to hedge against high capacity prices in the capacity auctions just as they can hedge against high prices in energy markets
Appendix 2 presents a series of slides illustrating this numerical example of how forward capacity markets work
Illustration of Forward Capacity Markets From the LSErsquos Perspective
20 Unless the contracts are structured as a contract-for-differences (see discussion of that option further below) The net effect in either case is the same in terms of the LSE only paying the contracted price for that capacity
21 In actual practice the percentage allocation of capacity costs to LSEs for the delivery year is based on the previous yearrsquos actual peak loads (plus reserves) of each LSE relative to the regional totals mdash but as noted this is a simplified example
9
the Role of foRwaRd caPacity MaRkets in incReasing deMand-side and otheR low-caRbon ResouRces
clearing price Under these circumstances the system operator can still require LSEs to pay for reliability must-run contracts at a cost determined outside the auction process To date the amount of MW under reliability must-run contracts in the PJM and ISO-NE regions is very small In the first few auctions almost all reliability must-run contracts were voided Most of the resources previously under reliability must-run contracts however have been retained through the forward capacity auctions and receive the annual market clearing price
Market Rules to Ensure Performance and Competition
To ensure that any successful bidder will have a very high likelihood of performance during the commitment period resources cannot bid capacity into the market unless they are prequalified by the system operator In particular bidders must demonstrate that they can meet their commitment to provide capacity for the delivery year and their bids must satisfy market rules designed to mitigate market power22 They must pay a qualification deposit must provide financial assurance to ensure commercial operation and can be penalized for performance failures
Further to ensure against a condition in which capacity occupies a place in the power system but is withheld from energy markets and drives up prices all generation and demand-response resources committed in the capacity market must offer into the regionrsquos day-ahead energy market whenever available To mitigate excessive profits to resources also receiving capacity payments from the forward capacity market the system operator reduces these payments to reflect the impact of high energy
market prices The ISO-NE makes this reduction on an annual basis to reflect especially high energy prices in the preceding year23 In the case of PJM this reduction is implemented through a built-in adjustment to the auction demand curve described below
The following section describes some of the unique features of the PJM and ISO-NE capacity markets highlighting in particular their differences
PJMrsquos Capacity Market
PJMrsquos current forward capacity market mdash called the ldquoReliability Pricing Modelrdquo mdash was implemented on June 1 2007 replacing an earlier capacity market design in place since 1999 Eligible capacity resources include new and existing demand and supply-side resources (including generators outside the PJM footprint) PJM recently added energy efficiency as an eligible demand-side resource joining demand response and distributed generation
Each year PJM holds a Base Residual Auction three years in advance of a future delivery year (that runs from June 1st to May 31st) PJM establishes the target capacity level and the auction establishes the price and the actual amount of capacity procured A mechanism called the ldquoVariable Resource Requirementrdquo administratively adds demand elasticity into the auction by imposing a downward-sloping demand curve that adjusts resource amounts procured based on auction prices (See Figure 2) If capacity prices are low PJM intentionally purchases capacity in excess of its target but the total payment by load is also lower If capacity prices are high PJM procures less than the target leaving some capacity to be acquired (at potentially lower prices) in incremental auctions for the delivery year24
In PJM resources are eligible only for a one-year capacity
22 For example in the PJM auction suppliers of existing resources are limited to bidding their demonstrated going-forward costs for nearly all capacity and new resources offered below cost because of support from an LSE contract have a limited ability to set the clearing price
23 This adjustment is not currently applied to energy efficiency resources because they are not eligible to participate in the wholesale energy markets
24 The purpose of administratively developing a downward-sloping demand curve rather than relying on a descending clock auction (as described below for the New England auction) is to help stabilize prices over time when supply is price-inelastic Figure 2 and further details on the mechanics of the Reliability Pricing Model are available from PJMrsquos ldquoReliability Pricing Model Trainingrdquo November 2009 at httpwwwpjmcomtraining~mediatrainingcore-curriculumip-rpmrpm-training-section-d-auctionsashx
RegulatoRy assistance PRoject
10
commitment resulting from each annual auction mdash that is the resource is only guaranteed the auction clearing price for a one-year contract period26 However as long as that resource remains listed in the market it is eligible to receive the auction clearing price for each succeeding year27 Capacity that was offered but not cleared in the Base Residual Auction is eligible to bid into incremental auctions for the same delivery year
In general each LSE is obligated to pay its pro rata share of capacity costs acquired by the PJM system operator through a ldquolocational reliability chargerdquo28 However as described above LSEs can enter into bilateral contracts
(or own generation) to hedge these charges and submit the capacity into the auction as a ldquoself-scheduledrdquo resource at a price of zero29 When the monthly billingsettlement is completed the locational reliability charge to the LSE will be offset (credited) for capacity delivered through self-scheduled resources The net effect of these financial transactions within the market is that the LSE pays the contract price for self-scheduled contracts and does not get paid (or charged) for generation it owns and self-schedules into the auction However self-scheduled resources are counted by the system operator in establishing available capacity to meet regional peak demand (plus reserves) and
25 ldquoUCAPrdquo in this figure refers to ldquounforced capacityrdquo Unforced capacity as defined for the PJM auction represents the MW level of a generating unitrsquos capability after removing the effect of forced outage events It excludes outage events outside of management control
26 There is an exception for a new resource that relieves a congestion constraint It can receive a fixed capacity price for more than one year subject to a review of the congestion relief that it is providing
27 As discussed below energy efficiency is not eligible to remain listed in the PJM capacity market after four years
28 This charge is based on the LSErsquos peak loads adjusted for demand response resources and the applicable zonal capacity price
29 See PJM Manual 18 PJM Capacity Market Revision 9 March 1 2010 pp 4 and 38 at httpwwwpjmcom~mediadocumentsmanualsm18ashx
450
400
350
300
250
200
150
100
50
0125000 130000 135000 140000 145000 150000
Pri
ce (
$M
W-d
ay)
MW (UCAP)
Figure 2 Establishing the Market Clearing Price in PJM - 20122013 Base Residual Auction25
20122013 RTO Supply and Demand
RTO Supply
Clearing Price = $1646
RTO Demand
Note To establish the clearing price when the supply and demand curves do not intersect PJM does one of the following depending on the circumstance 1) Short of supply - Extend the supply curve up vertically until it intersects the demand curve 2) Short of demand - Extend the demand curve down vertically until it intersects the supply curve or 3) Supply curve above demand curve - No capacity will be cleared
Reliabilty requirement = 1337324 MW
Cleared capacity = 1361435 MWReserve margin = 212
11
the Role of foRwaRd caPacity MaRkets in incReasing deMand-side and otheR low-caRbon ResouRces
are subject to applicable performance requirementsIn addition to self-scheduling by LSEs PJM provides
a complete ldquoopt outrdquo ndash the ldquoFixed Resource Requirement Alternativerdquo ndash for LSEs that take full resource planning responsibility for all loads in their service area for a five-year period The projected peak capacity needs for LSEs selecting this alternative are not included in the PJM planning process to establish the regionrsquos capacity needs for the auction and the LSErsquos capacity resources (including capacity acquired through bilateral contracts) are not offered into the auction Moreover under this opt-out alternative the LSE cannot bid any excess capacity into the auction or acquire any capacity through it
Capacity suppliers can cover any auction commitment shortages through the bilateral market facilitated by an electronic system at PJM If capacity shortfalls reach triggering conditions PJM can delay deactivation of a generating resource or hold a backstop reliability auction for capacity resources for a term of up to 15 years30
To improve the availability of capacity resources when needed the capacity product in the PJM market is defined to include forced outage rates based on historical performance and penalties are imposed if the plant is not up and running during a shortage
ISO New Englandrsquos Capacity Market
As in PJM eligible capacity resources in New England include both new and existing demand-side and supply-side resources (including generators outside the ISO-NE footprint) From the start ISO-NErsquos forward capacity market allowed energy efficiency demand response and distributed generation to compete with generation on an equivalent basis which meant among other things that new demand resources could set the market clearing price
Like PJM each year ISO-NE holds a capacity auction three years in advance of the delivery period and sets the amount of capacity to be purchased in each auction In addition to the annual forward capacity auction ISO-NE holds voluntary monthly and annual reconfiguration auctions that allow deficient suppliers to procure replacement capacity These auctions also provide the
system operator the opportunity to buy additional capacity if the load forecast increases or to sell capacity if the forecast decreases
However ISO-NE does not establish a downward sloping demand curve (Variable Resource Requirement) for its auctions Rather ISO-NE puts out a single quantity of capacity for bid referred to as the ldquoInstalled Capacity Requirementrdquo Then ISO-NE uses a descending-clock auction in which market prices are reduced until the quantity of available supply bids matches this capacity requirement Bid quantities and prices decline through successive bidding rounds (with bidders withdrawing resources from the auction as prices decrease) as long as excess capacity is still offered or until the floor price is reached To address start-up issues ISO-NE established a temporary price cap (or ldquostarting pricerdquo mdash see figure below)
30 See PJM Open Access Transmission Tariff Section 16 at httpwwwpjmcom~mediadocumentsagreementstariffashx
Contracts for Differences
Instead of a bilateral contract for physical delivery of capacity an LSE and resource owner can sign a ldquocontract-for-differencesrdquo which means that the level of payments (and who makes them) depends on the auction clearing price For example if the contract price is $50 per MW-day and the clearing price is $46 per MW-day the LSE will pay the resource owner the difference of $4 per MW-day But if the auction clearing price is higher than the contract price the resource owner pays the difference (to the LSE) As in the case of self-scheduled bilateral contracts the LSE will end up paying only the contract price for that capacity However in the case of contracts-for-differences the resource underlying the contract will bid into the market and (if cleared) will receive the auction clearing price And the LSE will be allocated the full locational reliability charge receiving no credits for the contracted capacity The reconciliation happens outside the auction between the LSE and resource owner rather than as part of the monthly billingsettlement process
RegulatoRy assistance PRoject
12
and price floor for the auction The most recent auction for ISO-NE ran seven rounds over two days concluding when the auction reached the floor price of $2951kW-month31
However by rule the load only pays Installed Capacity Requirement times the clearing price so the floor price is further reduced (pro rata) to achieve that effect32 Figure 3 below illustrates the descending clock auction process for ISO-NErsquos first forward capacity market auction
Therersquos another key difference To encourage investment ISO-NE allows new resources to lock in a capacity price for up to five years (with a one-year minimum term)
regardless of clearing prices in subsequent auctions The capacity price is indexed for inflation after the first year and the bidder must select the proposed contract term in advance of the auction Existing resources including existing demand-side resources are eligible only for a one-year price commitment mdash as is the case for PJM
While ISO-NE also permits LSEs to meet their capacity requirements with self-supplied resources (owned resources and resources under bilateral contracts) ISO-NE does not provide an ldquoopt outrdquo alternative as described above for PJM Similar to PJMrsquos ldquoself-scheduledrdquo option the
31 The caps and floors were originally scheduled to be eliminated following the third forward capacity auction However a recent filing by ISO-NE to implement the results of a stakeholder process proposes to continue these mechanisms for the next three auctions For more information on how the descending clock auction functions and how these capsfloors are established see ISO-NE Internal Market Monitoring Unit Review of the Forward Capacity Market Auction Results and Design Elements June 5 2009 at httpwwwiso-necomcommitteescomm_wkgrpsothrfcmwgmtrls2009aug720096-05-09_market_monitor_report_for_fcmpdf
32 With some exceptions resources have the option to pro-rate their cleared MW (rather than take a lower price)
33 Jenkins et al p 178
40000
39000
38000
37000
36000
35000
34000
33000
32000
31000
30000 Start 1 2 3 4 5 6 7 Close
Final Results of ISO-NE FCM Auction 1
$900
Start at $1500
$800 $700$600
$5625
$525 $4875 $450
End-of-round price
Round
Su
pp
ly a
vail
able
(M
W)
at e
nd
of
rou
nd
Final Capacity Needed (ICR)
Figure 3Example of Descending Clock Auction for ISO-NErsquos Forward Capacity Market33
Note Prices are in $USkW-month By rule the load only pays Installed Capacity Requirement times the clearing price so the floor price is further reduced (pro rata) to achieve that effect
13
the Role of foRwaRd caPacity MaRkets in incReasing deMand-side and otheR low-caRbon ResouRces
LSErsquos full capacity obligation (including that portion met through self-supply) is included in the Installed Capacity Requirement put out to bid and the self-supplied resources are also counted towards the resources available to meet that requirement (at a price of zero) in the auction process The net effect for the LSE is also the same The capacity committed as self-supply does not receive any capacity revenue and the LSErsquos capacity obligations satisfied through self-supply are not subject to capacity charges Further the LSErsquos self-supplied resources are subject to applicable penalties and the LSE is subject to capacity charges for any needed residual capacity that the ISO purchases through the auction on its behalf
The penalty provisions in the two regions also differ While both PJM and ISO-NE impose stiff penalty charges if a unit fails to perform when obligated to run ISO-NE also reduces payments to units that are not producing energy at their full capacity level during shortage events mdash similar to the mechanism it uses to reduce capacity payments when prices in the energy market reach very high levels
Role and Eligibility of Demand-Side Resources in FCMs
As discussed above electric systems face a reliability challenge not faced by other commodity markets Because customers are physically interconnected because electricity cannot be meaningfully stored and because electric service is central to economic and social well-being the balance between demand and supply is critical at all times and this balance must be assured over a sustained period of time The FCM design described in this paper recognizes that actions taken on the demand side of the market can effectively moderate price spikes and enhance reliability in a comparable manner as capacity commitments from supply-side generation mdash through short-term customer demand responsiveness during system peak or through permanent and continuous reductions in peak demand (energy efficiency) This market design recognizes that demand-side resources broadly defined to encompass demand response energy efficiency and distributed generation can meet system needs lower costs and add
value to power markets in a variety of circumstances The most important opportunities include34
bull Lowering the cost of power delivery reducing congestion and improving the reliability of the delivery system
bull Enhancing regional power system reliability by using a broad range of demand-side resources to meet planning and operational reserves
bull Economically balancing supply and demand in wholesale power markets through demand-side bidding and market transactions for energy supply released through demand reduction
bull Cost-effectively reducing long-term demand and lowering throughput through energy efficiency resources both on the power grid as a whole and within the resource portfolio of power suppliers
To capture these benefits energy efficiency and demand response (including distributed generation) can now compete on a level playing field with generation in the ISO-NE and PJM forward capacity markets Like generating resources demand-side resources must meet market rules for eligibility and availability including demonstrating they will be available at the start of the proposed delivery year Each type of demand-side resource has a specific set of performance hours across which load reductions are required To be eligible for the auction service providers must demonstrate in advance their ability to perform during those hours Like other resources demand-side resources are subject to penalties if there is a mismatch between their capacity commitment and their performance
Demand-side resources must meet comprehensive standards for measurement and verification (MampV) Failure to comply with MampV protocols makes the resource ineligible for the auction failure to submit post-installation MampV reports results in a final capacity offering of zero for the delivery year plus penalties Generally penalties cannot exceed the revenue that would have been collected if the resource performed as specified in the contract Energy efficiency resources also are audited for compliance Although the capacity obligations and associated penalties for non-performance among supply-side and demand-
34 Richard Cowart Regulatory Assistance Project and Jonathan Raab Raab Associates Ltd Dimensions of Demand Response Capturing Customer-Based Resources in New Englandrsquos Power Systems and Markets Report and Recommendations of the New England Demand Response Initiative July 23 2003 at httpwwwraponlineorgdocsRAP_Cowart_DemandResponseAndNEDRI_2003_07_23pdf
RegulatoRy assistance PRoject
14
side resources are not identical in these capacity markets they are designed and intended to provide comparable incentives to perform during specified hours35
Currently the key difference in eligibility requirements for demand-side resources in the ISO-NE and PJM capacity auctions is the circumstances under which energy efficiency resources may participate Under PJMrsquos rules energy efficiency resources may participate in Base Residual Auctions only up to four years This means that efficiency measures are limited to receiving compensation for their capacity contribution to four years of their measure life rather than their full measure life Demand response resources (including distributed generation) can participate in the PJM capacity market for as long as their ability to reduce demand continues In contrast all demand-side resources in ISO-NE are eligible to bid capacity for their full measure life an approach that recognizes the
full contribution of these resources to regional resource adequacy requirements and that encourages long-lived energy efficiency assets Further description of eligible demand-side resources and performance requirements in these markets is presented in Appendix 3
Forward Capacity Auction Results
In the following sections we summarize the overall level of capacity cleared from existing and new resources in the PJM and ISO-NE auctions the level of incremental capacity successfully bidding into these markets and how different types of resources have fared to date mdash with particular focus on demand resources More detailed results for the PJM and ISO-NE forward capacity markets are provided in Appendix 1
Some stakeholders claim that demand resources are not as available as generation yet they get paid the same price for capacity (implying that they should receive a lower price) A closer examination of the ISO-NE rules reveals several problems with this generalization In particular generation availability can actually vary quite widely because these resources are excused from performing if they are on scheduled maintenance (eg nuclear plants are paid their full monthly capacity payment even when they are shut down for weeks of re-fueling) And other generation resources are ldquoallocatedrdquo a specific number of hours for annual maintenance and are paid as if they are providing capacity services when they are off-line Demand resources have pre-established hours they must be available and are penalized for performance failures differently than traditional generationmdashsome argue more severely For example a demand resource that fails to perform is assessed a penalty for that month and its capacity value is reduced going forward (for all future months) While it is possible to re-establish the capacity value
through future performance (demand response) or with updated MampV (energy efficiency) the process is a slow one that can take many months or more A generation unit that fails to perform is assessed a penalty for that month but its capacity value is either unchanged or can be reestablished with a test run at anytime and the monthly capacity payments continue with no reduction Generation plants with long notice requirements (eg 24 to 48 hoursrsquo notice for coal-fired plants if the system operator wants them on-line and actually providing energy) are paid the same as a demand response resource that is required to be dispatchable by the system operator within 30 minutes throughout the year to address shortage events (See Appendix 3) Clearly there are individual rules that stakeholders can argue work to the advantage of supply-side over demand-side resources and vice versa Overall the intent of such variations should be to make obligations penalties and payments for demand and supply resources roughly comparable while recognizing the unique operational issues associated with all resources
Performance Incentives Demand- vs Supply-Side Resources
35 Nonetheless there continues to be debate among stakeholders over whether the appropriate balance has been reached See text box
15
the Role of foRwaRd caPacity MaRkets in incReasing deMand-side and otheR low-caRbon ResouRces
Auction Results for PJM36
PJM has held five Base Residual Auctions including the most recent May 2009 auction for the 20122013 delivery year PJM serves a large market The 20122013 Base Residual Auction cleared a total of 1361436 MW of capacity While generating resources account for nearly all of this committed capacity (1285274 MW) demand response resources (including distributed generation) represent 5 percent of the total (70472 MW) New for the 20122013 delivery year 5689 MW of energy efficiency also cleared the market Table 1 in Appendix 1 lists capacity resources offered and cleared to date As indicated in that table the vast majority of demand-side resources offered into the market cleared each PJM base residual auction
Figure 4 below illustrates the increasing role of demand-side resources in PJM
Renewable generating resources also are gaining some traction in the capacity market although not anywhere near the magnitude of demand-side resources in terms of their overall contribution to resource adequacy requirements This is due to the predominance of wind resources and their variable nature PJM applies a 13 percent on-peak capacity factor to these resources mdash for every 100 MW of wind resources only 13 MW are eligible to meet capacity requirements Some 3234 MW of wind capacity resources cleared in the most recent Base Residual Auction mdash 95 percent of the amount offered While this capacity level is miniscule compared to the total capacity clearing the auction it translates to a large nameplate rating mdash 2488
12000
10000
8000
6000
4000
2000
0
Active Load Management
Prior to RPMImplementation RPM Implemented
Interruptible Load for Reliability
Energy Efficiency RPM Offered Demand Response
Figure 4 Demand-side Participation in PJMrsquos Reliability Pricing Model (RPM) Auctions
Note Demand-side resources included Active Load Management prior to the 20072008 delivery year Interruptible Load for Reliability and Demand Response were first eligible for the 20072008 delivery year Energy Efficiency resources were first eligible for the 20122013 delivery year (May 2009 auction) The large increase in demand response participation in the 20122013 delivery year is in large part due to the elimination of PJMrsquos ILR program
200506 200607 200708 200809 200910 201011 201112 201213
36 Except where noted information and figures in this section and referenced tables in Appendix 1 are from PJM ldquo20122013 RPM Base Residual Auction Resultsrdquo at httpwwwpjmcom~mediamarkets-opsrpmrpm-auction-info2012-13-base-residual-auction-report-document-pdfashx
RegulatoRy assistance PRoject
16
MW of wind resourcesPJM reports that the Base Residual Auctions have
attracted 150294 MW of incremental capacity in the region to date Incremental capacity refers to new generation resources capacity upgrades to existing generation resources new demand response resources upgrades to existing demand response resources and new energy efficiency resources37 Natural gas- and coal-fired plants account for most of the incremental capacity with nuclear plants (from uprates) also making a sizable contribution Tables 2 and 3 in Appendix 1 provide details on the incremental capacity procured It is important to note that the figures in these tables represent resources new to the capacity market including uprates mdash not all are newly built However they include a new merchant coal plant built for the PJM market38
True to one of the original goals the PJM capacity market also has been successful in retaining existing capacity from power plants that were originally under high-cost reliability must-run agreements39 Since FERC approved the Reliability Pricing Model existing capacity that would otherwise have been deactivated or retired has accounted for 32768 MW of procured capacity Table 4 in Appendix 1 shows these changes in resource deactivation and retirement
Market clearing prices for resources in PJMrsquos Base Residual Auctions to date have ranged from $1646 to $17429 per MW-day not including any locational price adders for constrained areas (See Table 5 in Appendix 1) Importantly the $1646MW-day clearing price for the 20122013 delivery year represents a decrease of $9354MW-day from the previous Base Residual Auction due in part to significant increases in capacity from demand response and the introduction of energy efficiency resources into the bidding process Moreover the participation of demand-side resources is estimated to have reduced the market clearing price for the 20122013 delivery year by an astonishing $16232MW-day in unconstrained zones (ie from a clearing price of $17878MW-day without these resources in the bid stack to the actual clearing price
of $1646MW-day) Table 6 in Appendix 1 shows the calculation by PJMrsquos independent market monitor
Auction Results for ISO-NE
ISO-NErsquos forward capacity market is about a quarter of the size of the PJM capacity market mdash the Installed Capacity Requirement set by ISO-NE for the 20122013 delivery year was 31965 MW ISO-NE has held three forward capacity auctions to date and all of them cleared at the administratively set floor price ($450kW-month $360kW-month and $295kW-month respectively) with surplus capacity above the Installed Capacity Requirement set by ISO-NE to meet reliability needs The first auction secured 1772 MW above the requirement the second auction cleared 4755 MW of excess capacity and the third auction cleared 4649 MW of excess capacity (See Table 7 in Appendix 1)
Demand resources have consistently represented about 8 percent of the resources cleared in the three auctions (2554 MW 2937 MW and 2898 MW respectively) an amount that exceeded expectations Energy efficiency accounted for about a quarter of the demand resources in the first auction and about a third in more recent auctions Real-time demand response comprises the largest share of demand resources Emergency generation (ie distributed generation whose state air quality permit limits operation to ldquoemergencyrdquo conditions) also makes a sizeable contribution Non-emergency distributed generation however comprises a negligible amount of the total Table 8 in Appendix 1 shows detailed results for demand resources
Figure 5 shows the growth in demand resources offered and cleared in the first two ISO-NE auctions by type There has been a steady growth in demand-side resources in New England since the first demand-response programs operated by ISO-NE The forward capacity auctions have contributed to and solidified these gains
Participation of demand-side resources in the ISO-NE forward capacity auction has been credited with making the clearing price lower than it would have been otherwise
37 The increase is partially offset by capacity de-ratings to existing generation resources
38 See Pfeifenberger et al at 27
39 As discussed above these contracts have not been dispensed with altogether however
17
the Role of foRwaRd caPacity MaRkets in incReasing deMand-side and otheR low-caRbon ResouRces
as it has in the PJM region Analysis of the first auction bids for example suggests that the participation of these resources saved ratepayers as much as $280 million by lowering the price paid to all capacity resources in the market40
Moreover by contributing to the excess capacity that kept capacity payments at relatively low floor prices in New England the participation of demand-side resources has
also contributed to lower overall market revenues inducing some inefficient oil-fired generating units to shut down at least temporarily Nonetheless existing and new fossil-fuel resources continue to dominate the capacity commitments in this region as is the case for PJM
Overall renewable generating resources (primarily wind resources) are making some headway in the regionrsquos forward capacity market but as in PJM they are not
40 See Cheryl Jenkins et al This calculation reflects what the market clearing price would have been in the auction given the Installed Capacity Requirement put out to bid by the system operator which assumes no impact of energy efficiency programs on loads (because energy efficiency is bidding) Therefore the calculated reduction in clearing price represents a theoretical maximum mdash excluding demand resources from the market would likely have been at least partially offset by a lower amount of capacity put out to bid As a result the difference in the market clearing price (and savings to consumers) would likely have been smaller than the number calculated here although it is difficult to say by how much However even if demand-side resources were not permitted to bid they would contribute to lower prices for consumers by lowering the total quantity of capacity required
41 Internal Market Monitoring Unit ISO-NE June 5 2009
4500
4000
3500
3000
2500
2000
1500
1000
500
0
New UnclearedTotal Uncleared1375 MW
Total Uncleared1159 MW
Total Cleared2279 MW
Total Cleared2778 MW
New Cleared
Existing Delisted Uncleared
Existing Cleared
FCA 1 FCA 1
Figure 5 Demand-Side Participation in ISO-NE Capacity Auctions by Type41
copy ISO New England Inc
Note Activerdquo resources include demand response and emergency generation energy efficiency is considered a ldquopassiverdquo resource Clearing amounts reflect ISO-NErsquos maximum limit of 600 MW of Real-Time Emergency Generation In contrast Table 8 in Appendix 1 shows the actual amount of such resources that cleared the auction Capacity payments to these resources are pro-rated if cleared levels exceed 600 MW
Cap
acit
y (M
W)
Active
Active
Active
Active
Active
Active
Active
Active
Passive
Passive
Passive
Passive
Passive
RegulatoRy assistance PRoject
18
a major contributor to the regionrsquos resource adequacy requirements at this time In the most recent (third) auction 166 MW of wind capacity cleared the auction mdash with a nameplate rating an order of magnitude larger42
Unlike PJM ISO-NE does not apply a deemed on-peak capacity factor to wind and other variable generation resources Instead all such resources must provide data that demonstrate the claimed summer and winter qualified capacity The capacity factor is adjusted over time based on actual performance during specified hours
Forward Capacity Markets in the Context of Carbon Constraints
Power market rules are not constructed in a vacuum rather they are designed to address specific public policy goals As described above forward capacity markets in the US were developed to ensure resource adequacy in the power system at a reasonably competitive price In the face of growing carbon constraints however power market rules need to be redesigned to work in concert with carbon reduction goals and policies rather than at cross purposes The challenge of substantially de-carbonizing the power sector in the coming years is too great to ignore this interaction In particular policymakers should carefully consider what elements of the current planning and procurement process to achieve resource adequacy contribute to the following effects ndash and then work to revise the market rules accordingly
bull Do the market rules encourage new investments in high-emitting resources (including repowering) at the expense of low-carbon alternatives
bull Do they encourage the continued (or increased) operation of existing high-emitting power plants
bull Will they result in a build-out of capacity and cumulative emissions that conflict with the level of de-carbonization required in the power sector mdash or make attainment of that level more costly to the economy
This paper is not intended to evaluate the PJM and ISO-NE capacity markets and auction rules in any depth with respect to these issues However we offer below general observations based on the auction design and results to date in these regions and other studies Following that we provide policy recommendations related design options and additional actions for consideration
General Observations on Forward Capacity Markets and Results
Based on our review of FCM auctions to date and related studies we offer the following observations
bull The ISO-NE and PJM forward capacity markets are meeting their resource adequacy objectives Sufficient levels of capacity have cleared the market to meet each regionrsquos anticipated peak demand and adequate resources are now committed on a forward basis to ensure reliable coverage in future years (up to the 20122013 delivery year) But in a carbon-constrained world the mix of resources is as important as the quantity in both the short-term and the long-term Most resources that are available during peak demand hours also produce electricity or reduce consumption during many more (or all) hours of the year and the carbon intensity of that mix of resources will drive the level of cumulative emissions in the power sector43 As discussed in this paper capacity markets as currently designed provide compensation based on the level of available capacity not the mix of resources providing that capacity It is worth repeating here that the only (non-price) attribute a resource needs to demonstrate for resource adequacy purposes is that it will be available when called upon during the projected hours of peak system loads In a carbon-constrained world policy makers should ask whether the planning and procurement process for acquiring a sufficient level of capacity at a reasonable price is also moving the resource mix in the right direction mdash towards zero or low carbon-emitting demand- and supply-side resources
42 Compiled from auction results at httpwwwiso-necommarketsothrmkts_datafcmcal_resultsccp13fca13indexhtml
43 With the exception of gas-fired peaking units or demand response resources that are dispatched to meet (or reduce) loads only during peak system hours
19
the Role of foRwaRd caPacity MaRkets in incReasing deMand-side and otheR low-caRbon ResouRces
bull Expressly designing demand-side resources into forward capacity markets appears key to achieving all three objectives ndash resource adequacy low-carbon resource mix and reasonable price Energy efficiency and demand response resources are faring well in auction-based capacity markets mdash and this is a positive outcome for several reasons First energy efficiency and other demand-side resources can substitute for existing and planned generation that have a higher carbon footprint thereby reinforcing carbon reduction policies and targets for the region Second demand-side resources can dramatically reduce the costs of meeting the regionrsquos resource adequacy requirements mdash as evidenced by the results of the PJM and ISO-NE auctions In addition the increase in demand-side resources facilitated by capacity auctions can reduce market power because more suppliers and more resources means individual generators have less ability to affect bid offers and clearing prices And because demand-side resources lighten the load at the end of the supplydelivery chain they enhance the reliability of each link in the chain from fuel supply and generation to the local distribution network
bull Differences in the impact of demand-side resources on carbon emissions should be recognized in capacity markets and associated auction rules Energy efficiency decreases carbon emissions because (by definition) it reduces energy use for an equivalent level of service and at the margin almost all power systems are running higher carbon resources In contrast the net impact of demand response on carbon emissions will depend upon specific circumstances including the mix of
plants serving loads at the margin For example when coal is primarily serving baseload and intermediate needs emissions may increase when customers shift loads from on-peak (when natural gas is on the margin) to off-peak periods44 Elsewhere however demand response mdash including any conservation side-effect mdash may reduce emissions from less efficient peaking plants In addition demand response includes real-time emergency generation which is often fossil-fuel powered (eg by diesel or natural gas) Any analysis of the costs and benefits of demand response resources in capacity markets should account for such effects Policies and market rules for demand response should be aligned with its environmental costs and benefits45
bull Renewable generating resources are beginning to make some headway in forward capacity markets mdash in particular wind resources This is in large part because the markets described here recognize some capacity value for variable renewable resources (wind solar and run-of-river hydro) either through a deemed on-peak capacity factor or a demonstration of claimed capacity for specified on-peak periods Policymakers need to pay attention to how these values are established so they can be confident the committed capacity will be available when called on while at the same time encouraging participation of all low-carbon resources in the market More generally as renewable resources become a more significant part of the resource mix a forward capacity market creates the opportunity to recognize their aggregate capacity value to the system46
44 For example PJM recently released figures on carbon emissions of generating units that operate on the margin during on-peak vs off-peak hours See httpwwwpjmcom~mediaabout-pjmnewsroom2010-releases20100325-pjm-reports-new-carbon-dioxide-emissions-dataashx and httpwwwpjmcomdocuments~mediadocumentsreportsco2-emissions-reportashx
45 See section 316 and Mechanism E in Attachment 1 of Pacific Northwest National Laboratory The Smart Grid An Estimate of the Energy and CO2 Benefits January 2010 (PNNL 19112) at httpenergyenvironmentpnlgovnewspdfPNNL-19112_Revision_1_Finalpdf
46 Variable renewable resources will qualify for higher capacity value if they are bundled with other resources for reliability (eg demand response hydroelectric dams or energy storage) In addition confidence in the capacity value of variable resources increases as their geographic diversity on the system increases See for example the report on the Eastern Wind Integration and Transmission Study at httpwwwnrelgovwindsystemsintegrationpdfs2010ewits_final_reportpdf
RegulatoRy assistance PRoject
20
bull Nonetheless renewable resources are hard-pressed to successfully compete with the thousands of megawatts of existing and new fossil-fuel resources participating in these auctions that are able to bid below the true societal cost of their operations under current market rules In fact capacity auctions as currently designed can breathe new economic life into high carbon-emitting plants that were previously planned for significantly reduced operations or retirement Along with new capacity from fossil-fuel generation allowing such a large amount of existing capacity from high carbon emitters to clear the auction is likely to crowd out renewable resources that are able to address resource adequacy requirements equally well Such results may not represent an ldquoefficientrdquo (or desirable) outcome for a carbon-constrained power sector This is especially true where the carbon costs of a fossil-fuel plant are not fully recognized in the energy market that plant also will be bidding into
The Electric Power Research Institute modeled the effect of various levels of carbon taxes or allowance prices in the upper Midwest (coal-dependent) and in Texas (heavily reliant on natural gas) The study found that close to a doubling of the wholesale prices of electricity in the Midwest region (through carbon-related charges) would produce only a 4 percent reduction in regional emissions given the current generation mix Similar results were observed for Texas where natural gas plants are on the margin49 And in the Northeastern US due to initially low carbon prices and a host of factors that dampen the price signal the Regional Greenhouse Gas Initiative (RGGI) has not yet resulted in generator operational changes50 One of those dampening factors is the single clearing price that is typically set through wholesale energy markets mdash which dilutes the market signal sent by a price on carbon emissions by allowing fossil-fueled plants to recover
most or all of their allowance costs through higher clearing prices reflecting the cost of allowances51
Studies also have shown that the price of carbon must rise (and be maintained) at very high levels to obtain sufficient market pull for the level of new investments in clean generation required For example a recent analysis in California concluded that it would take a carbon price of $100 per tonne52 to make economic investments in renewable resources compared to fossil fuel-fired generation in order to reach carbon reduction targets in the power sector beyond what current state requirements will achieve53 Further price signals may be diluted if a portion of the carbon allowances are allocated in a manner that shields high-emitting power plants from carbon costs or if high-emitters located outside the capped region can sell into the market on a long-term basis
Carbon Pricing Alone Is Insufficient to De-carbonize the Generation Mix
bull A market price for capacity or energy that favors the construction and operation of high carbon-emitting resources over clean resources will lead to increases mdash rather than reductions mdash in the cumulative level of carbon emissions in the power sector A carbon tax or carbon cap-and-trade regime internalizes some or all of the otherwise un-priced carbon costs of electricity production and would improve the relative economics of clean resources in both forward capacity and energy markets However carbon pricing alone may be insufficient to change the dispatch of existing high-emitting power plants or their ability to clear these capacity markets (and be paid additional revenues as a result) in such overwhelming numbers47 In fact the very modest impact of carbon pricing on the performance of fossil-fuel plants has been documented in several reports48 (See text box below)
47 With or without carbon prices policymakers also might want to consider the implications of paying existing power plants the market clearing price for capacity mdash and the potential windfall profits for plant owners mdash for making no changes in plant operations See for example Ezra Hausman Paul Peterson David White and Bruce Biewald Synapse Energy Economics Inc RPM 2006 Windfall Profits for Existing Base Load Units in PJM An Update of Two Case Studies Feb 2 2006 at wwwsynapse-energycom
21
the Role of foRwaRd caPacity MaRkets in incReasing deMand-side and otheR low-caRbon ResouRces
bull Carbon pricing alone will have limited impact on consumer decisions to invest in permanently reducing their peak demand by making cost-effective investments in energy efficiency Well-designed time-varying pricing options can successfully shift demand from high-price hours to lower price hours54 Such shifting also reduces peak demand on transmission and distribution systems Overall energy use will decline somewhat in response to price But long-term reduction in energy use due to price increases is relatively small The numerous market barriers to capturing the full cost-effective potential of energy efficiency ndash through improvements in building construction practices and industrial processes retrofits of existing buildings and installations of high-efficiency appliances and equipment in homes and businesses ndash are well-documented They include lack of information high first-costs consumersrsquo high discount rates and the landlord-tenant split incentive problem among others55 Recent empirical analysis of demand elasticities suggests that the long-term price elasticity of demand for electricity is even lower than earlier studies have indicated for both liberalized and regulated markets (See text box on page 21)
In sum while forward capacity markets are meeting their resource adequacy objectives and clearing an impressive amount of clean low cost demand-side resources on balance these markets (as currently designed) are not working sufficiently in concert with carbon reduction goals and policies in the face of growing carbon constraints For the reasons discussed above carbon pricing alone
48 See Testimony of Richard Cowart Regulatory Assistance Project Before the Committee on Energy and Commerce Subcommittee on Energy and Environment US House of Representatives April 23 2009 ldquoThe Consumer Allocation for Efficiency How Allowance Allocations Can Protect Consumers Mobilize Efficiency and Contain the Costs of GHG Reductionrdquo at httpenergycommercehousegovPress_11120090423testimony_cowartpdf
49 See Victor Niemeyer ldquoThe Change in Profit Climate How Will Carbon-Emissions Policies Affect the Generation Fleetrdquo Public Utilities Fortnightly May 2007 at 20 24
50 See ldquoRGGI marks its first year with success and lesson on effect of market pressurerdquo Electric Utility Week Dec 14 2009 Ten Northeast and Mid-Atlantic states participate in RGGI the first mandatory cap-and-trade program in the US Connecticut Delaware Maine Maryland Massachusetts New Hampshire New Jersey New York Rhode Island and Vermont Nine of them participate in either the ISO-NE or PJM forward capacity markets described in this paper
51 PJM Interconnection ldquoPotential Effects of Proposed Climate Change Policies on PJMrsquos Energy Marketrdquo Jan 23 2009 p 5 See also ldquoBecause Thatrsquos Where the Money Is The FERCrsquos Ability to Reduce the Cost of Slowing Global Warmingrdquo Samuel A Wolfe Chief Counsel New Jersey Board of Public Utilities December 2009 at httpwwwnarucorgpublicationsWOLFE-20Panel203pdf
Demand for Power Is Relatively Price-Insensitive mdash Even Over the Long Term
Modeling by the US Department of Energy suggests that a 10 percent increase in power prices will reduce demand for electricity by just 25 percent to 3 percent over 20 years assuming that the price effects persist over that entire period56 This would only offset the normally expected US load growth in two out of those 20 years57
More recently a 2009 empirical analysis of the demand for electricity in the US concludes that price elasticity of residential demand has actually decreased since retail price deregulation was first introduced in the US The results suggest that a 10 percent increase in power prices will reduce residential electricity demand more on the order of 12 percent to 17 percent based on 2001-2008 data for both deregulated and regulated states58 Price responsiveness is further dampened by the income-elasticity of demand which is positively correlated with consumption As incomes increase consumption of electricity goes up and the conservation impact of any price increase is diminished59 The equivalent historical figure for a 10 percent increase in power prices in the UK residential sector is -23 percent but the income-elasticity is such that a 10 percent increase in income results in an increase of demand of 34 percent ndash ie household income is just as important as energy price in determining energy demand60
RegulatoRy assistance PRoject
22
is unlikely to shift the power sector resource mix at the pace or scale required to meet aggressive carbon reduction targets ndash or correspondingly to substantially change the dominance of high-carbon resources clearing forward capacity auctions under current market rules An increasing number of studies makes a compelling case that our economy and our society cannot afford this dominance to persist much longer if we are to contain climate change to a livable level In fact close to full de-carbonization of the
power sector is being discussed in international forums as the only way to meet essential carbon reduction targets by 205061 While capacity markets alone are unlikely to support the full value of clean energy resources in a carbon-constrained power sector by themselves with appropriate design elements they can serve to reinforce actions taken at federal regional and state levels that provide larger and longer lasting commitments to clean demand-side and renewable resources62
52 A tonne or metric ton is a unit of mass equal to 1000 kilograms (roughly 2205 pounds) or approximately the mass of one cubic meter of water at four degrees Celsius A tonne is not the same as either a ldquoshortrdquo ton (2000 pounds) or a ldquolongrdquo ton (2240 pounds)
53 Energy and Environmental Economics Inc Greenhouse Gas Modeling of Californiarsquos Electricity Sector to 2020 Updated Results of the GHG Calculator Version 3 prepared for the California Public Utilities Commission October 2009 pp 66-67 at httpwwwethreecomdocumentsGHG_102209CPUC_GHG_Final_Report_28Oct09pdf
54 Ahmad Faruqui and Sanem Sergici The Brattle Group ldquoHousehold Response to Dynamic Pricing of Electricity A Survey of the Experimental Evidencerdquo Jan 10 2009 at httpwwwhksharvardeduhepgPapers2009The20Power20of20Experimentation20_01-11-09_pdf
55 See for example American Council for an Energy Efficient Economy ldquoQuantifying the Effects of Market Failures in the End-Use of Energyrdquo pp iii-vi 2007 at httpoldaceeeorgenergyIEAmarketbarrierspdf This study details the various types of market barriers to end-use energy efficiency and reports that up to 50 percent of residential energy use in the US is affected by such barriers
56 The US Department of Energyrsquos National Energy Modeling System (NEMS) has price elasticity built into it The long-run elasticity (assuming price effects remain for 20 years) are ndash031 for residential electric use and ndash025 for commercial electric use See Steven H Wade ldquoPrice Responsiveness in the NEMS Buildings Sector Modelrdquo in Energy Information Administrationrsquos Issues in Midterm Analysis and Forecasting 1999 pp 55 58 table 1 at httpwwweiadoegovoiafissuespdf060799pdf
57 This would require a much larger rate increase just to offset expected load growth over 20 years let alone to reduce demand sufficiently to permit absolute reductions in emissions from the nationrsquos huge generation fleet See Testimony of Richard Cowart
58 T Nakajima and S Hamori ldquoChange in Consumer Sensitivity to Electricity Prices in Response to Retail Deregulation A Panel Empirical Analysis of the Residential Demand for Electricity in the United Statesrdquo Energy Policy (2010) available at wwwsciencedirectcom
59 Ibid
60 John Dimitropoulas Lester C Hunt and Gary Judge ldquoEstimating Underlying Energy Demand Trends Using UK Annual Datardquo at httpuserwebportacuk~judgegAEL_04pdf
61 See for example Meeting Carbon Budgets ndash The Need for a Step Change Progress Report to Parliament Committee on Climate Change October 2009 at httpwwwthecccorgukreportsprogressreports Christopher Jones and Jean-Michel Glachant Why and How the European Union Can Get a (Near to) Carbon-Free Energy System in 2050 MIT Center for Energy and Environmental Policy March 2010 at httpdownloadsthecccorgukdocs2166720CCC20Executive20Summary20AW20v4pdf Roadmap 2050 A practical guide to a prosperous low-carbon Europe The European Climate Foundation April 2010 at wwwroadmap2050eu
62 Without such policies it is unlikely that even RGGIrsquos modest carbon reduction goals will be achieved See Paul Peterson Doug Hurley and David White Synapse Energy Economics Inc ISO New England Scenario Analysis Companion Report Constructing a Future That Meets Regional Goals Aug 8 2007 at wwwsynapse-energycom
23
the Role of foRwaRd caPacity MaRkets in incReasing deMand-side and otheR low-caRbon ResouRces
ISO-NE Rules for Emergency Generators Advance Environmental Goals
Emergency (ldquobackuprdquo) generators typically are diesel-fired and states in New England and elsewhere in the US have restricted the number of hours and days they may be operated through the state permitting process At the time the first regional demand response tariffs were being designed in New England a collaborative of energy regulators environmental regulators the ISO utilities and other stakeholders realized that active demand response programs could lead to substantial incentives for diesel-fired backup generators to operate more often when air quality was at its worst Regulators and the ISO proposed a rule limiting those generators to run for reliability purposes during system emergencies This is a concrete example of reliability rules being written to advance environmental goals as well as power system needs63 In addition a regional working group developed model emissions standards for small generators for statesrsquo consideration64
To reinforce regional air quality policies and goals ISO-NE limits the total amount of emergency generators in the regional capacity market to 600 MW To the extent any excess amount clears the auction capacity payments to these resources are pro-rated
63 See Cowart and Raab p 26
64 See Model Regulations for the Output of Specified Air Emissions From Smaller Scale Electric Generation Resources Oct 31 2002 at httpwwwraponlineorgshowpdfaspPDF_URL=22docsrap_issuesletter-outputbasedemissioninsert_2003_07pdf22
65 Edward S Rubin Carnegie Mellon University ldquoA Performance Standards Approach to Reducing CO2 Emissions for Electric Power Plantsrdquo June 2009 at httpwwwpewclimateorgpublicationsreportcoal-initiative-series-performance-standards-approach-reducing-co2-emissions-ele Also see Chris Simpson and Brenda Hausauer ldquoEmissions Performance Standards in Selected Statesrdquo Regulatory Assistance Project Research Brief November 2009 at httpwwwraponlineorgdocsRAP_Simpson_EPSResearchBrief_2009_11_13pdf
Policy Recommendations and Auction Design Options
We present below recommendations and a menu of auction design options for forward capacity markets that support and enhance carbon policies and carbon reduction targets
bull Power market rules should be constructed to recognize and limit the adverse environmental consequences of power generation The power system and the environment are inextricably linked Explicit consideration of environmental costs and benefits of various electricity resources is not only reasonable but necessary to meet the enormous challenge of climate change
bull Forward capacity markets should reinforce carbon reduction policies which could be accomplished by incorporating one or more of the following into the auction rules
Auction rules could apply an Emissions Performance Standard (EPS) to promote capacity commitments from low-carbon resources and discourage bids from high-emitting power plants An EPS can be expressed as a maximum level of greenhouse gas emissions per unit of electrical output or as a percentage reduction in (annual) plant emissions It can vary with fuel type and incorporate other design variations65 It may be appropriate to adopt an EPS mdash within the auction qualification rules or by regulation mdash particularly if current market signals are not sufficiently
discouraging new construction or repowering of high-emitting generating resources with long lifetimes while forward capacity markets are providing a new revenue stream to keep them running
RegulatoRy assistance PRoject
24
Auction rules could disqualify inefficient generators from participating (and from receiving capacity revenue) or more generally require their retirement through financial incentives regulations or both66 Since 2007 China has been phasing out such plants and intends to retire approximately 50 gigawatts (GW) of small inefficient coal-fired power plants nationwide and 7 GW to 10 GW of small natural gas-fired units as well as halt construction of small inefficient power plants The policy is being put in place three ways the direct rescission of operating permits the transfer of generation rights and price reductions
Capacity payments could vary by the emissions rate of the resource Instead of one price paid to all generation that clears the auction adders could be applied to payments for low-emitting units and deductions could be applied to high-emitting units67 For example a sliding-scale percentage reduction to the per-unit ($kW-month or $MW-day) clearing price could be established based on the average annualized carbon footprint of fossil-fuel resources whereas a price adder above the clearing price could be established for zero-emitting resources
Imputed ldquocarbon addersrdquo could help curtail high-emitting resources Carbon adders are imputed costs that reflect at least a portion of the societal cost of emissions They are generally
used in the context of resource planning and acquisition by a regulated LSE mdash as a way of ensuring that high-carbon risks and low-carbon alternatives are properly valued in the resource selection process But these imputed costs do not get passed on to ratepayers or consumers for every unit of power consumed in contrast to carbon pricing68 Similarly the rules in a forward capacity market could be modified so that carbon adders are applied in determining what resources clear the auction (and will receive the market clearing price for their capacity commitment)
A ldquozero-carbon resource portfolio standardrdquo could establish auctions for separate tranches of resources by emissions level For example one tranche could include energy efficiency and renewable resources The size of each tranche would be based on carbon reduction goals for the region The higher the goals the larger the tranche for energy efficiency and renewable resources These resources decrease carbon emissions because at the margin most power systems are running higher carbon resources
bull Policymakers should consider a longer price commitment in forward capacity markets mdash at least for low-carbon resources The contract period for new capacity in these markets is short (one year in PJM up to five years in ISO-NE) in part so there is greater certainty over forecasts of resource needs for system reliability (to mitigate the risk of over-supply)
66 Small and old coal plants are the most inefficient and polluting both in terms of greenhouse gases and particulate matter By some estimates 50 MW plants may use as much as 200 grams more per unit of electricity output than a plant larger than 300 MW See Frederick Weston Rebecca A Schultz David Moskovitz and Max Dupuy Regulatory Assistance Project ldquoChinarsquos Climate Change Initiatives Do new policies adopted in China offer any guidance for the transformation of the US power sector in a carbon-constrained worldrdquo November 2009 at httpwwwraponlineorgdocsRAP_China20Climate20Initiatives_NARUC_2009_11_01docx
67 See N Jonathan Peress and Kenneth A Colburn ldquoElectrical Connections Aligning Capacity Market Changes With RGGI in the Northeastrdquo Discussion Draft March 2005 at httpwwwpucnhgovEPABSymbiotic202005-03-1820Peress-Colburn20Letter20to20FERC-Woodpdf
68 Both high carbon resources and low carbon resources clearing in power markets (characterized by single-price auctions) are paid the same price So whenever fossil resources are on the margin (most of the time in most places) consumers are seeing the same price for both fossil and clean resources and the cost of carbon allowances (or carbon taxes) for that marginal resource is reflected in the clearing price for all power bought in the market Carbon adders on the other hand are not actually paid to any resource or reflected in prices for all units sold in the market
25
the Role of foRwaRd caPacity MaRkets in incReasing deMand-side and otheR low-caRbon ResouRces
Auction winners can generally participate in future auctions and receive the market clearing price but have no assurance of future prices Moreover under current rules in PJM energy efficiency resources cannot receive capacity payments over the full life of the measures mdash only for four consecutive delivery years This constraint puts energy efficiency on a different footing than other demand resources mdash as well as all supply-side resources mdash which are paid for their capacity as long as they provide the benefit
The short commitment period and lack of price certainty may not provide market signals that are strong and consistent enough to ensure sufficient new generation or encourage plant operators and investors to make efficient choices for the long-term mdash even where carbon prices are expected to increase substantially in the future due to a dramatically declining carbon cap or a high carbon tax Allowing clean resources to opt for a longer period of time over which the price is known would in particular facilitate renewable resources whose typically high upfront capital costs and low operating costs mdash compared to natural gas-fired plants in particular mdash may require such a long-term commitment to procure financing69 Another option might be to establish fixed floor prices for clean energy resources for a long-term period to provide assurance of a minimum revenue stream
bull Regional load forecasting should be reviewed for treatment of demand-side resources acquired outside the capacity market In particular the system operator determines the capacity that will be auctioned for each delivery year (three years hence) based on a 10-year load forecast which is updated on
an annual basis Under the current planning process in forward capacity markets this forecast only reflects the demand-side resources that have cleared in prior auctions The system operatorrsquos load projections do not take into consideration any load reductions from demand-side resources procured outside of the auction such as energy efficiency programs that LSEs have committed (or are obligated) to fund and implement in the coming one to three years or beyond70 If the magnitude of these load reductions is substantial the ISO may be systematically overstating the level of capacity put out to bid for each delivery year Depending upon the existing mix of resources and market conditions in the region this overstatement may have a sizeable impact not only on the level of cleared capacity and the market price but on the resulting resource mix and level of carbon emissions as well
Additional Actions
Careful design of the planning process and auctions undertaken through forward capacity markets can help to ensure that they reinforce and do not work at cross purposes with climate reduction goals and targets However forward capacity market signals (capacity prices) are only one component of a market and regulatory landscape that affects investment and operating decisions in the power sector Market rules and procurement policies that affect system energy requirements ndash as well as policies and regulations that affect access location and cost recovery for transmission and distribution facilities ndash have an enormous impact on both the short- and long-term resource mix
It is beyond the scope of this paper to fully explore how
69 LSEs in PJM and ISO-NE can contract for generating resources through the bilateral market to hedge energy and capacity costs and to meet renewable energy standards Renewable resource projects that successfully negotiate such contracts if they are long term may not need a long-term commitment in the forward capacity market Still a short-term capacity payment stream with uncertain prices thereafter weakens the ability of renewable resources to secure long-term financing
70 Some of the econometric models that the system operators use for their load forecasts may capture the impacts of federal appliance standards and building codes However to our knowledge there has been no explicit accounting to date for the impacts of state and utility energy efficiency programs where the capacity is not bid into the auctions
RegulatoRy assistance PRoject
26
market rules and other policies and regulations can be harmonized and strengthened to meet customersrsquo energy needs reliably in a carbon-constrained world Larger and longer lasting commitments to demand-side and renewable resources are certainly needed to ensure a mix of resources that will significantly reduce greenhouse gas emissions in the power sector This has been the conclusion of US policymakers who have put in place additional policies to facilitate long-term acquisition of low-carbon resources in regions that operate both forward capacity markets and a cap-and-trade program (under RGGI)71
bull States have adopted a variety of mechanisms for sustained and aggressive energy efficiency programs
bull Strong building codes and equipment standards
bull Stable funding through a system benefit charge
bull Third-party administration of programs or where the utility is the efficiency portfolio manager decoupling of utility profits from revenues financial incentives for shareholders or both
bull Recycling of carbon auction proceeds into energy efficiency investments
bull Some states require long-term resource plans or resource procurement plans that must include energy efficiency Therersquos renewed interest in long-term planning and procurement particularly for demand-side and renewable resources following a period
where these efforts were largely abandoned with electric industry restructuring and development of organized markets72
bull Several states have adopted energy efficiency resource standards that require achievement of specified energy-saving targets73
bull Most of the states have renewable energy standards74 and several states require long-term contracting of renewable resources to meet the standards75
bull Connecticut Maryland Pennsylvania and Rhode Island require contract terms of 10 years or longer
bull New York requires central procurement of renewable energy credits by a state agency under long-term contract Illinois is likely to acquire long-term contracts for renewable resources under its central procurement mandate
bull Massachusettsrsquo Green Power Partnership purchases renewable energy credits for up to 10 years using its renewable energy fund
These are just examples and certainly not an exhaustive list of the ways in which careful design of forward capacity markets coupled with additional policies at the federal regional and state level can serve to reinforce both resource adequacy requirements and carbon reduction goals
71 Regulatory Assistance Project policy grids summarize state-by-state requirements for resource planning and energy efficiency at httpwwwraponlineorgFeatureaspselect=116 For a summary of renewable energy standards in the US see Ryan Wiser and Galen Barbose Lawrence Berkeley National Laboratory ldquoState of the States Update on RPS Policies and Progressrdquo State-Federal RPS Collaborative Nov 18 2009 at httpwwwcleanenergystatesorgMeetingsRPS_Summit_09WISER_RPS_Summit2009pdf
72 More broadly 30 states nationwide require integrated resource plans or resource procurement plans that include energy efficiency
73 Includes states with strict energy efficiency standards states with Commission-ordered efficiency targets states that allow efficiency to count toward renewable energy standards and states with a rate cap that triggers a relaxation of requirements See Laura A Furrey Steven Nadel and John A ldquoSkiprdquo Laitner ACEEE Laying the Foundation for Implementing a Federal Energy Efficiency Resource Standard March 2009 at httpaceeeorgpubse091htm
74 Some 29 US states and the District of Columbia have renewable energy standards five other states have non-binding goals See Wiser and Barbose
75 For a US database of state incentives for renewable energy and energy efficiency see httpwwwdsireusaorg
27
the Role of foRwaRd caPacity MaRkets in incReasing deMand-side and otheR low-caRbon ResouRces
An example of an approach that attempts to ldquomarryrdquo integrated least-cost resource planning with forward capacity markets is the resource planning and procurement process recently established by the Connecticut Legislature76 The law requires the utilities Energy Advisory Board and Department of Public Utility Control to plan for current and future energy and capacity needs and provide a mechanism for procuring resources that meet specified economic reliability and environmental objectives77 to satisfy the identified need Further the law requires that resource needs first be met through energy efficiency and demand reduction resources that are cost effective reliable and feasible Based on the resulting resource plans LSEs enter into
contracts to acquire the required capacity (level and mix) through a competitive bidding process The law also requires that any resources winning contracts for capacity agree to let the LSE bid that capacity into the forward capacity auction as a ldquoself-suppliedrdquo resource This approach permits LSEs to determine both the quantity and mix of resources through integrated resource planning that will meet their resource adequacy requirements and state policy goals (eg carbon reduction) The LSE pays the contracted capacity price (under its bilateral contracts) instead of paying the auction clearing price to everyone that offers capacity into the forward capacity market (eg existing fossil fuel or nuclear plants)78
Connecticutrsquos Marriage of Resource Planning and Markets
76 Conn Gen Stat sectsect 16a-3a 16a-3b and 16a-3c
77 Costs and benefits cost-effectiveness cost impacts on customers the extent to which load growth can be eliminated and peak demand reduced reliability including energy security and economic risks impacts on meeting state environmental standards including emissions goals optimization of existing generation and generation sites the extent to which renewable resources can be used to meet needs and fuel types diversity and supply See Department of Public Utility Control Final Order in Docket No 08-07-01 Feb 18 2009
78 This approach is not without some controversy A contracted new resource in Connecticut has the potential to displace an alternative ldquocompetitiverdquo new resource in the region that would have bid at a higher price mdash had Connecticut not been allowed to designate the contract as self-supply ISO-NErsquos Internal Market Monitoring Unit has commented on this issue in a report to FERC See Internal Market Monitoring Unit ISO-NE June 5 2009
RegulatoRy assistance PRoject
28
Conclusions and Recommendations
Auction-based capacity markets in the US have been successful to date in attracting the capacity needed to maintain system reliability in an economically efficient manner In particular these markets have been successful in facilitating new demand-side resources
with ratepayers and society reaping the economic and environmental benefits However policymakers also should consider capacity markets in the context of carbon reduction policies and targets for the power sector Even markets that successfully integrate demand-side and renewable resources into the auction process are still encouraging the construction or continued operation of high-emitting supply-side resources to meet reliability targets
Existing capacity markets should be evaluated to assess whether the market is responding in this way And if it is policymakers need to critically assess whether a continuation of that market response over the coming years will make it possible to achieve the cumulative level of carbon reductions required from the power sector to avoid the worst effects of climate change Depending on the results of this inquiry policymakers may need to refine the auction rules and adopt additional policies for the power sector mdash such as those described in this paper mdash to ensure the alignment of capacity markets with both short- and long-term carbon reduction goals
More generally forward capacity markets create a revenue stream for resources that can commit to being available at times of system peak several years in the future mdash but this financial incentive is clearly not the only factor driving the mix of resources in the power sector and their resulting carbon footprint Market rules policies and regulations that affect investment and operating decisions for meeting the systemrsquos energy requirements mdash as well as those that affect access location and cost recovery for transmission and distribution facilities mdash have an enormous impact on both the short- and long-term resource mix in the electric system Policymakers will need to consider how this entire market and regulatory landscape mdash including forward capacity markets mdash can be strengthened and harmonized to reliably meet customer demand for electricity in a carbon-constrained world
29
the Role of foRwaRd caPacity MaRkets in incReasing deMand-side and otheR low-caRbon ResouRces
Cleared capacity values in the following tables represent all capacity committed by existing resources remaining in the market and all new resources that bid into the auction at or below
the market clearing price Cleared capacity includes ldquoself-suppliedrdquo or ldquoself-scheduledrdquo resources entered into the auction by LSEs However as described in this paper when the monthly billingsettlement process is completed the capacity charges allocated to the LSE will be offset (credited) for the cleared capacity delivered by these resources
Incremental capacity in the tables below reflects 1) new generation resources 2) capacity upgrades to existing generation resources 3) partial offsets to
incremental generation capacity due to capacity de-ratings to existing generation resources 4) new demand response resources 5) upgrades to existing demand response resources and 6) new energy efficiency resources
PJM Results79
PJM has conducted five Base Residual Auctions since its inception in 2007 for delivery years beginning in 20082009 (that each run from June 1 to May 31) Capacity cleared in the PJM auction is defined in terms of ldquounforcedrdquo capacity that is the capacity of a resource adjusted for availability and deliverability based on historical performance (eg forced outages)
Appendix 1
Detailed Results for PJM and ISO-NE Capacity Markets
Table 1 Generation Demand Resources and Energy Efficiency Resources
Offered and Cleared in PJM Base Residual Auctions (Unforced Capacity in MW)
Delivery Year 20082009 20092010 20102011 20112012 20122013
Generation Offered 1311648 1326142 1321248 1360679 1348730
DR Offered 7158 9368 9679 16524 98476
EE Offered - - - - 6527
Total Offered 1318806 1335510 1330927 1377203 1453733
Generation Cleared 1290614 1313389 1312515 1308566 1285274
DR Cleared 5362 8929 9390 13649 70473
EE Cleared 00 00 00 00 5689
Total Cleared 1295976 1322318 1321905 1322215 1361436
Energy efficiency resources were first eligible in the 20122013 auction
79 All information for PJM compiled from ldquo20122013 RPM Base Residual Auction Resultsrdquo at httpwwwpjmcom~mediamarkets-opsrpmrpm-auction-info2012-13-base-residual-auction-report-document-pdfashx
RegulatoRy assistance PRoject
30
Table 2 Incremental Capacity Additions and Reductions in PJM Base Residual Auctions(Installed Capacity in MW)
Delivery Year 20072008 20082009 20092010 20102011 20112012 20122013 Total
Increase inGenerationCapacity 6020 7242 12723 17762 35763 18935 98445
Decrease inGenerationCapacity -6746 -3754 -5502 -3018 -2647 -32539 -54206
Net Increase inDemand ResourceCapacity 5550 5747 2150 287 6617 79381 99732
Net Increasein EnergyEfficiency Capacity 0 0 0 0 0 6323 6323
Net Increasein InstalledCapacity 4824 9235 9371 15031 39733 72100 150294
Note Change in generation capacity is cumulative net increase in demand-side resources is relative to previous yearrsquos Base Residual Auction
Table 3 Breakdown of Incremental Capacity Resource Additionsin PJM Base Residual Auctions (Installed Capacity in MW)
Delivery Year CTGT Combined Diesel Hydro Steam Nuclear Solar Wind Total Cycle (Coal)
New 20072008 187 03 190Capacity 20082009 270 661 931Units 20092010 3995 238 530 4763 20102011 2833 5800 230 1414 10277 20112012 4164 11350 7048 11 752 23325 20122013 4038 5850 78 363 751 11080
Capacity 20072008 470 470From 20082009 1310 1310Reactivated 20092010 0Units 20102011 1600 107 1707 20112012 800 1010 1810 20122013 0
Uprates to 20072008 1145 139 800 2356 920 5360Existing 20082009 1082 340 180 1055 1960 384 5001Capacity 20092010 1522 2060 1625 614 1974 165 7960Resources 20102011 1173 1630 480 892 1603 5778 20112012 3692 1486 574 1868 2921 87 10628 20122013 2312 1643 142 1930 1260 568 7855
Total 28356 30159 2145 3963 20351 9062 11 4398 98445
Note Values represent capacity commitments Nameplate ratings of variable resources (solar and wind) are far larger than shown here
31
the Role of foRwaRd caPacity MaRkets in incReasing deMand-side and otheR low-caRbon ResouRces
Table 4 Changes to Generation Retirement Decisions
Since Reliability Pricing Model Approval (Unforced Capacity in MW)
Generation Resource Decision Changes Capacity Cleared
Withdrawn Deactivation Requests 17987
Postponed or Cancelled Retirement 13029
Reactivation 1752
ToTal 3276 8
Note Unforced capacity cleared in Base Residual Auctions from resources that withdrew their request to deactivate postponed retirement or were reactivated (ie came out of retirement or mothball state)
Table 5 PJM Base Residual Auction Clearing Price
Delivery Year Clearing Prices ($MW-day)
20072008 $4080
20082009 $11192
20092010 $10204
20102011 $17429
20112012 $11000
20122013 $1646
Note Values do not include any locational price adders Simple conversion of $MW-day to $kW-month multiply by 3 and divide by 100
Table 6 Effect of Demand-Side Resources on PJM Market Clearing Price
20122013 Base Residual Auction80
Actual Auction Results Calculated Results Without Demand-Side Resources
Clearing Prices Cleared Unforced Clearing Prices Cleared Unforced Savings
($MW-day) Capacity (MW) ($MW-day) Capacity (MW) ($MW-day)
$1646 1361435 $17878 1335682 $16232
80 Bowring Monitoring Analytics Table 20
RegulatoRy assistance PRoject
32
ISO-NE ResultsISO-NE has held three forward capacity auctions to
date The first auction (FCA 1) in February 2008 was for capacity delivery beginning in June 2010 (20102011 delivery year) The second auction (FCA 2) was held in December 2008 for delivery in 20112012 and the third
Table 7 Summary Results for ISO-NE Capacity Auctions81
Net Installed Total Resources Excess Clearing Net Price Capacity Cleared Capacity Price ($kW-month)82
Requirement (MW) (MW) ($kW-month)
FCA 1 32305 34077 1772 $450 $425
FCA 2 32528 37283 4755 $360 $312
FCA 3 31965 36996 4649 $295 $254
Table 8 Demand-Side Resources Cleared in ISO-NE Capacity Auctions (MW)81
Distributed Distributed Energy Real-Time Demand Real-Time Total Generation- Generation- Efficiency ResponseLoad Emergency Demand-Side Fossil Fuels Renewable Resources Management Generation Resources
FCA 1 46 lt02 655 978 875 2554
FCA 2 93 lt02 890 1195 759 2937
FCA 3 86 07 975 1206 630 2898
auction (FCA 3) was held in October 2009 for delivery in 20122013 ldquoClearedrdquo amounts in these tables include resources from earlier auctions that remain listed as well as new resources less resources that drop out
Note Net Installed Capacity Requirement values exclude the interconnection benefits associated with the Hydro-Queacutebec Phase III interface Excess capacity is not adjusted for Real-Time Emergency Generation in excess of the 600 MW limit Net prices reflect prorating of clearing prices due to excess capacity clearing the auction Simple conversion of $kW-month to $MW-day divide by 3 and multiply by 100
Note Demand-side values are grossed-up for avoided transmission and distribution losses and reserve margin (no reserve margin forFCA 3) Total resources cleared include excess capacity above the Net Installed Capacity Requirement Real-time emergency generation refers to distributed generation whose state air quality permit limits operation to ldquoemergencyrdquo conditions See Appendix 3
81 ISO-NE Forward Capacity Market Results at httpwwwiso-necommarketsothrmkts_datafcmcal_resultsindexhtml
82 Communication with Henry Yoshimura director Demand Resource Strategy ISO-NE March 2009
83 Eric Winkler ISO-New England ldquoThird Regional Energy Efficiency Initiative Meetingrdquo July 7 2009 and ldquoFCA Updaterdquo Demand Response Working Group Meeting Dec 2 2009 Total resources cleared (Capacity Supply Obligation) from Forward Capacity Market Auction Results for the 20102011 20112012 and 20122013 auctions at httpwwwiso-necommarketsothrmkts_datafcmcal_resultsindexhtml
33
the Role of foRwaRd caPacity MaRkets in incReasing deMand-side and otheR low-caRbon ResouRces
Step 1
System Operator (SO) Plans ldquoForwardrdquo for the Region
2012 Projection of Peak Demand = 10000 MW (incl reserves) Each ldquoLoad Serving Entityrdquo (LSE) is obligated for its 50 share
Appendix 2
Illustration of ldquoHow Forward Capacity Markets Workrdquo
SO purchases capacity in 2012 at the 2009 auction clearing price
LSE can be regulated utility or competitive retail supplier
LSE1 5000 MW
LSE2 5000 MW
R1
R1 =3500 MW capacity ldquoSelf Supplyrdquo Resources (LSE1 ownedunder contract)
RegulatoRy assistance PRoject
34
Step 2
The Regional Capacity Auction (3 Years ldquoForwardrdquo)
Step 3
System Operator Pays Cleared Resources at P and Bills LSEs(Note Self-Supply capacity is a ldquowashrdquo)
R1 R2 R3 R4 R5 R6 R7
P
R1
R3
R3
R5
R5
R2
R2
R4
R4
R6
R7
Bid Price = $ per MW-day
Quantity = MW
6500 MW P
Cleared Capacity = 10000
Supply = Capacity Committed ldquoForwardrdquo
P= Clearing price paid to all capacity clearing auction
Demand = SO Forecast of Capacity Requirements
R1-R7 = Capacity offered by Supply-Side (New built Existing Uprates) and Demand-Side (Energy Efficiency Demand Response Distrib Gen) Self-supply (R1) bids in a ldquozerordquo price New Resources set clearing price
LSE1 5000 MW
LSE2 5000 MW
R1
SOSO pays R1 3500 MW P
LSE2 pays its share of regional demand
5000 MW P
LSE1 pays its share of regional demand (5000 MW) adjusted for self-supply R1 for a net payment of 1500MW P
R1 = 3500 MW of ldquoSelf-Supplyrdquo Resources (LSE1 ownedunder contract)
In 2010Total regional peak demand of 10000 MW supplied by R1 + R2 + R3 + R4 + R5 LSE1 and LSE2 are each responsible for 50 of regional peak demand
35
the Role of foRwaRd caPacity MaRkets in incReasing deMand-side and otheR low-caRbon ResouRces
PJM Eligibility Requirements
Eligibility of demand-side resources has changed significantly over the years in PJMrsquos capacity markets In particular it was not until the most recent capacity auction (May 2009) for the
20122013 delivery year that energy efficiency became eligible to bid in PJMrsquos Base Residual Auction PJM is currently considering a tariff change to also allow energy efficiency to bid into incremental auctions
Under PJMrsquos eligibility rules an energy efficiency resource must achieve a ldquopermanentrdquo continuous reduction in electric energy consumption Examples of such a resource include lighting retrofit programs for residential commercial and industrial customers and programs to retrofit buildings with heating and cooling systems that exceed current efficiency standards To be eligible an energy efficiency resource must meet the following criteria
bull It is fully implemented throughout the delivery year without any requirement of notice dispatch or additional customer action
bull It is not reflected as a reduction in the peak load forecast used for the Base Residual Auction for the proposed delivery year
bull It exceeds relevant standards (such as building codes or appliance standards) at the time of commitment
bull It achieves the specified load reduction (expected average demand in MW) during defined summer on-peak hours84
Demand response on the other hand must be dispatchable mdash that is customer demand must be reduced when instructed For example a large supermarket with
coolers and freezers could install load management equipment that would cycle them on or off mdash and bid that demand response capability into the market85 More specifically a demand response resource must meet the following criteria
bull It is able to reduce demand for electricity up to 10 times each year for up to six consecutive hours per interruption during defined periods86
bull It is fully implemented within one hour (short lead time) or two hours (long lead time) of notice from PJM
bull In a year without calls for demand reductions it must demonstrate reliability through a test of reduction capability
bull It is registered in the Emergency Load Response Program and thus available for dispatch during PJM-declared emergency events
bull Compliance and status reports are filed as required
Multiple end-use customers can be aggregated in order to submit a single demand response offer in the capacity auction if those customers share the same curtailment service provider electric distribution company and transmission zone
In addition customer-sited distributed generation may be offered into auctions as a demand resource A hospital for example could offer to run its back-up generator on certain peak demand (eg hot summer) days to reduce its load on the system Or an industrial plant could cut back on production on such days and continue to run its on-site combustion or steam-cycle turbine
Currently energy efficiency resources may participate
Appendix 3
Eligibility Requirements for Demand-Side Resourcesin US Capacity Markets
84 Weekdays excluding holidays June through August between the hours ending 1500 and 1800 Eastern Prevailing Time (EPT)
85 If instead the supermarket replaced the existing coolers and freezers with more energy efficient ones it would bid that proposal in as an energy efficiency resource Or it could do both (replace and cycle) and bid in the capacity from the permanent savings (replacements) as energy efficiency and the dispatchable capacity (the cycling) as demand response
86 Weekdays excluding holidays from 1200 to 2000 EPT May through September and 1400 to 2200 EPT October through April
RegulatoRy assistance PRoject
36
in Base Residual Auctions for up to four consecutive delivery years In effect this means that PJM limits capacity payments for efficiency measures to four years of their measure life (rather than for the full measure life)87 In contrast a demand response resource (including distributed generation) can participate in the PJM capacity market for as long as its ability to reduce demand continues
ISO-NE Eligibility RequirementsSince the inception of ISO-NErsquos forward capacity market
in 2006 energy efficiency has qualified as an eligible demand-side resource ISO-NE defines demand resources as installed measures (products equipment systems services practices and strategies) that result in verifiable reductions in end-use consumption of electricity in the New England power system These are further categorized into ldquopassiverdquo (energy efficiency and non-dispatchable distributed generation) and ldquoactiverdquo (demand response emergency generation and dispatchable distributed generation) resources Passive demand resources are non-dispatchable but permanently reduce energy demand during peak hours Active demand resources are designed to reduce peak loads and to reduce load based on real-time system conditions or ISO-NE instructions Following are descriptions of eligible demand-side resources and performance requirements88
Passive Demand Resourcesbull On-Peak Demand Resources are measures that are
not weather-sensitive and reduce demand across a fixed set of on-peak hours such as energy-efficient commercial lighting and motors89
bull Seasonal Peak Demand Resources are weather-sensitive measures that reduce load during high-demand conditions such as energy-efficient heating and air conditioning systems Seasonal Peak Demand Resources must reduce load when actual system load is equal to 90 percent of the most recent peak load forecast for the applicable summer or winter season
Active Demand Resourcesbull Real-Time Demand Response Resources are
measures including load management and distributed generation that can be dispatched by ISO-NE as needed They must curtail electrical usage within 30 minutes of receiving a dispatch instruction and until receiving a releaserecall dispatch instruction
bull Real-Time Emergency Generation is distributed generation whose state air quality permit limits operation to ldquoemergencyrdquo conditions Generators must curtail the customerrsquos electrical usage within 30 minutes of receiving a dispatch instruction and until receiving a releaserecall dispatch instruction The amount of emergency generation that can be used to meet ISO-NErsquos capacity requirement is limited to 600 MW If the amount of real-time emergency generation that clears the auction exceeds this level payments to generators are reduced on a pro-rated basis All real-time emergency generation is treated as existing capacity
In contrast to PJM all demand-side resources in ISO-NE are eligible to bid capacity for their full measure life an approach that recognizes the full contribution of these resources to regional resource adequacy requirements and adds value to long-lived energy efficiency assets
87 FERC has directed PJM to evaluate the impact of its capacity payment period for energy efficiency resources
88 Eric Winkler and Abimael Santana ISO-NE ldquoNew Demand Resource Qualificationrdquo May 5 2009 at httpwwwiso-necomsupporttrainingcoursesfcmfcm_forum_may_5pdf
89 Summer on-peak hours are 1300 to 1700 non-holiday weekdays in June July and August Winter on-peak hours are 1700 to 1900 non-holiday weekdays in December and January
The Regulatory Assistance Project (RAP) is a global non-profit team of experts that focuses on the long-term economic and environmental sustainability of the power and natural gas sectors providing technical and policy assistance to government officials on a broad range of energy and environmental issues RAP has deep expertise in regulatory and market policies that promote economic efficiency protect the environment ensure system reliability and fairly allocate system benefits among all consumers We have worked extensively in the US since 1992 and in China since 1999 and have assisted governments in nearly every US state and many nations throughout the world RAP is now expanding operations with new programs and offices in Europe and plans to offer similar services in India in 2011 RAP functions as the hub of a network that includes many international experts and is primarily funded by foundations and federal grants
Home office
50 State Street Suite 3Montpelier Vermont 05602
802-223-8199wwwraponlineorg

RegulatoRy assistance PRoject
2
Introduction and Summary
For most of the US power sectorrsquos history the quantity and mix of resources built to meet customer demand for electricity was determined or ldquoplannedrdquo by utilities and regulators using a
range of analytical tools and methods The revolution in computing technologies during the 1970s and lsquo80s made possible the development of sophisticated planning models that were used to identify the least-cost mix of resources to meet demand for electricity given a specified level of reliability In the mid-1990s ndash with the emergence of electric industry restructuring in some parts of the US ndash came the expectation that competitive markets would now determine both the optimal amount and the optimal mix of resources The result was a move away from involvement of regulators in the planning and procurement of electricity toward almost exclusive reliance upon markets for deciding how much and what kind of generating capacity would be available to meet customer demand
Real world experience quickly demonstrated that early market designs were not going to deliver the amount of generating capacity required for reliability needs Stated another way these markets were not eliciting sufficient investment in plant capacity to meet resource adequacy requirements The response in parts of the US was to introduce a regional planning and procurement process into organized power markets2 to address this shortcoming Regional system operators using traditional planning studies were now tasked with determining the level of capacity needed for resource adequacy several years into the future They also became responsible for procuring the required amount of capacity by augmenting existing energy markets with a forward looking capacity auction
More specifically in these auctions the system operators solicit bids to meet the level of resource commitment they estimate will be needed to meet future peak demand on the system and then provide market-based revenues to resources that can fulfill that commitment The revenues take the form of a stream of capacity payments3 mdash at a
price determined through a regional competitive auction Only those resources bidding at or under the market clearing price of the auction receive capacity commitments and payments for being available and for measured and verified performance when called upon during the expected system peak hours This particular approach to planning and procurement in the power sector became generally referred to as a ldquoforward capacity marketrdquo
Forward capacity markets are a development to watch because they combine traditional planning with organized markets into a unique formula that based on experience to date in the US appears to overcome the limitations of earlier energy-only or capacity market designs in meeting resource adequacy needs4 More important they represent the first time that energy efficiency resources have been expressly designed into organized power markets and permitted to compete directly with supply-side power generators
2 ldquoOrganized power marketsrdquo refers to power markets with an Independent System Operator (ISO) or Regional Transmission Organization (RTO) that operates a regional energy market capacity market or both This paper does not distinguish between RTOs and ISOs mdash which provide equivalent reliability services mdash and we refer to these entities generically as regional ldquosystem operatorsrdquo in the following sections
3 Capacity payments are in US$megawatt (MW)-day or US$kilowatt (kW)-month Conversion $100MW-day asymp $3kW-month
4 An overview of that experience is presented above
Demand-Side ResourcesDemand-side resources (also referred to as demand
resources) are customer-based resources that reduce energy needs at various times of the day and year mdash across some or many hours They are generally defined as follows
1) Energy efficiency mdash installing more efficient equipment or using more efficient processessystems to achieve a continuous and permanent reduction in energy use without reducing the quality of service
2) Demand response mdash changing a customerrsquos electricity demand in response to dispatch instructions or price signals
3) Distributed generation mdash generating electricity at the customer site in some cases using the waste heat produced in the electric generation process to also deliver useful heat or steam (combined heat and power)
3
the Role of foRwaRd caPacity MaRkets in incReasing deMand-side and otheR low-caRbon ResouRces
Two organized markets in the US mdash PJM5 and ISO New England (ISO-NE)6 mdash now conduct forward capacity auctions that permit a wide range of demand-side resources to compete with supply-side resources in meeting the resource adequacy requirements of the region (See Figure 1 below) The response of demand-side resources in the PJM and ISO-NE auctions is impressive and their participation is clearly demonstrating that reducing consumer demand
for electricity is functionally equivalent to mdash and cheaper than mdash producing power from generating resources for keeping supply and demand in balance One study suggests that participation of these resources in the first New England auction potentially saved customers as much as $280 million by lowering the price paid to all capacity resources in the market7 And in the most recent PJM auction demand-side resources are credited with reducing the unit clearing price from $17878 to $1646 in unconstrained zones mdash a savings of $16232MW- day8 Detailed results for the PJM and ISO-NE forward capacity auctions are presented in Appendix 1
There are two additional capacity markets in the US ndash one run by the New York ISO and the other (as of June 2009) by the Midwest ISO9 However only PJM and ISO-NE run auctions several years in advance of need and permit energy efficiency along with other demand-side resources to compete with generation to meet future reliability requirements They also offer the longest track record for forward capacity markets covering multiple states Brazil is the only other country with a forward capacity market but it does not permit demand-side resources of any kind to compete10 Therefore our discussion focuses on the forward capacity markets run by PJM and ISO-NE
This paper examines how auction-based forward capacity markets address resource adequacy with particular focus on their potential to increase the availability of
5 PJM Interconnection is an RTO that operates a competitive wholesale electricity market and manages the high-voltage electricity grid for all or parts of Delaware Illinois Indiana Kentucky Maryland Michigan New Jersey North Carolina Ohio Pennsylvania Tennessee Virginia West Virginia and the District of Columbia
6 ISO-NE oversees New Englandrsquos bulk electric power system serving the states of Connecticut Maine Massachusetts New Hampshire Rhode Island and Vermont
7 Cheryl Jenkins Chris Neme and Shawn Enterline Vermont Energy Investment Corporation (VEIC) ldquoEnergy Efficiency as a Resource in the ISO New England Forward Capacity Marketrdquo ECEEE 2009 Summer Study Proceedings
8 Joseph Bowring Monitoring Analytics ldquoAnalysis of the 20122013 RPM Base Residual Auctionrdquo Sept 10 2009 Table 20 ldquoUnconstrainedrdquo zones do not experience any distribution or transmission bottlenecks for the delivery of electricity to the end-user whereas ldquoconstrainedrdquo zones experience such limitations and pay clearing prices that reflect those constraints to capacity available during peak hours in those zones Accordingly the reduction in prices due to demand resources for any individual constrained zone will be higher or lower than $16232 per MW per day for this auction depending in part on the quantity of demand-side resources located in that zone
9 For more information on these capacity markets see Paul Peterson and Vladlena Sabodash Synapse Energy Economics Inc ldquoEnergy Efficiency in Wholesale Markets ISO-NE PJM MISOrdquo ACEEE 5th National Conference mdash Energy Efficiency as a Resource Sept 29 2009 and New York ISO ldquoInstalled Capacity Manual 4rdquo October 2009
10 Sam Newell Kathleen Spees and Attila Hajos The Brattle Group Midwest ISOrsquos Resource Adequacy Construct An Evaluation of Market Design Elements prepared for the Midwest Independent System Operator January 2009 httpwwwbrattlecom_documentsuploadlibraryupload832pdf
Arizona
California Colorado
Idaho
Kansas
Montana
NebraskaNevada
New Mexico
NorthDakota
Oklahoma
Oregon
SouthDakota
Texas
Utah
Washington
Wyoming
ME
MA
RICTNY
NJPA
WV VA
NC
SCGA
FL
ALMS
TN
KY
OHDEMD
INIL
WI
MI
MO
IA
MN
AR
LA
ME
VTNH
Figure 1
ISO New England and PJM Territories
ISO New England territory
PJM territorymdashcovers all or most of the state
PJM territorymdashcovers part of the state
RegulatoRy assistance PRoject
4
demand resources to meet future capacity requirements However experience to date also makes a strong case that more is needed in a carbon-constrained world where the total mix of resources is as important as the total quantity both in the short- and long-term In particular construction and continued operation of high carbon-emitting supply-side resources dominate the mix of capacity clearing these auctions and therefore these resources are receiving the bulk of market incentives (capacity payments) The results of recent studies mdash as well as market experience mdash also suggest that carbon pricing alone is unlikely to reduce this dominance in forward capacity markets (or in energy-only markets) at the pace or scale required to meet aggressive carbon reduction targets
In light of these observations we pose the following question to policymakers How can the planning and procurement process through forward capacity markets be strengthened to work in concert with carbon reduction goals and policies rather than at cross purposes This paper suggests a menu of options that could reduce carbon emissions from the power system by
bull Providing premium capacity payments to low-carbon resources
bull Selecting auction winners based on level of carbon emissions as well as bid price
bull Making capacity payments only to those resources with low- or zero-carbon emissions
bull Phasing out capacity payments to existing high-emitting resources
bull Allowing a longer price commitment or establishing fixed-capacity floor prices for low-carbon resources
bull Properly considering energy efficiency in load forecasts that set auction capacity needs
bull Refining existing market rules as needed to ensure that energy efficiency can fully compete on an equal basis with power generators including distributed generation11
More generally forward capacity markets create market incentives in the form of capacity payments for resources that can commit to being available at times of system peak beginning several years into the future But these capacity
payments are clearly not the only factor driving the mix of resources to meet customersrsquo current and future electricity needs Existing market rules and procurement policies that affect the mix of resources meeting the systemrsquos energy requirements mdash as well as policies and regulations that affect access location and cost recovery for transmission and distribution facilities mdash have enormous impact on both the short- and long-term resource mix in the power sector
It is beyond the scope of this paper to fully explore how market rules regulations and policies can be harmonized and strengthened to meet customersrsquo energy needs reliably in a carbon-constrained world Nonetheless we observe that many states in the US including those where forward capacity markets and carbon pricing currently exist have made large and long lasting commitments to demand-side and renewable resource procurement through additional policies and regulations These include
bull Strong energy efficiency codes and equipment standards
bull Stable and sustained funding to provide audits financial incentives and financing for home and business efficiency improvements including through carbon auction revenues
bull Energy efficiency resource standards that require achievement of specified energy-saving targets
bull Renewable energy standards that require meeting a percentage of energy consumption with renewable resources along with long-term contracting requirements in some cases
bull Decoupling of utility profits from revenues financial incentives for shareholders or both where the utility is the efficiency portfolio manager mdash or performance contracting with third-party administrators to deliver comprehensive large-scale efficiency programs
bull Complementary resource planning and procurement practices designed to increase the mix of demand-side and renewable resources that can meet resource adequacy requirements
Finally we recognize that not all regions will create capacity markets for the purpose of addressing resource
11 For example energy efficiency resources that clear the PJM auction cannot receive capacity payments for more than four delivery years whereas under the ISO-NE market rules these resources are eligible to receive payments over the full life of the installed measures All other resources are eligible to participate in these capacity markets for as long as their ability to reduce demand or generate power continues
5
the Role of foRwaRd caPacity MaRkets in incReasing deMand-side and otheR low-caRbon ResouRces
adequacy needs and we do not attempt to evaluate in this paper whether they should The evolution of capacity markets in certain regions of the US has its own and unique history (See text box) Establishing forward capacity markets and their associated auctions involves complex market rules and a myriad of market design choices along the way all with major implications for the relative costs and benefits to consumers and resource providers Options for addressing resource adequacy needs that do not involve the development of a capacity market should also be explored by policymakers particularly in the context of a carbon-constrained power sector The starting point of this paper however is that such markets already exist (or are in the planning stages) It is within this context that we offer our observations and recommendations
Resource Adequacy in the US
In the US resource adequacy refers to the ldquoability of the electric system to supply the aggregate electrical demand and energy requirements of the end-use customers at all timesrdquo mdash in effect to provide reliable supply 9997 percent of the time12 This high standard of reliability reflects the unique ldquoserve all or serve nonerdquo nature of the electric system If it falls short in meeting even one customerrsquos power needs all customers relying on that electric circuit are literally left ldquositting in the darkrdquo Contrast this with other goods and services sold to consumers mdash for example milk sold at a grocery store If there are only 15 cartons of milk on the shelf and 16 customers come in at the same time to purchase milk only one customer walks away empty handed (and that person could at least find a substitute product at the store to quench hisher thirst) In contrast if that product were kilowatt-hours and peak demand (or peak load) exceeds the ability of the system to generate electricity at that time then the store ldquoshuts downrdquo and all customers walk away empty-handed
To ensure against such an outcome utilities and other companies that sell electricity in the US and in many other power markets in the world are obligated to own or purchase enough capacity to reliably meet their customersrsquo peak demands (ldquoloadsrdquo) We call them ldquoload-serving entitiesrdquo or ldquoLSEsrdquo and unless otherwise noted do not distinguish between regulated LSEs (eg distribution utilities) and non-regulated LSEs (retail electricity suppliers) In either case the LSErsquos resource obligation in a forward capacity market is expressed in terms of its share of projected capacity needs for the region several years in the future
An electric system must perform three functions well to ensure resource adequacy mdash that is to ensure that there is sufficient capacity committed to meeting customersrsquo peak loads at all times These are
1) Estimate when the peak loads are likely to occur and the level of capacity commitment needed to reliably meet them13
2) Obligate LSEs to have sufficient capacity available to them during those projected periods of peak loads
3) Put policies and rules in place to ensure that sufficient resources will commit capacity to operate (or to reduce loads) during these periods both in the short- and long-run
In other words ensuring resource adequacy involves a planning process (what level of capacity commitment is needed and when) and a procurement process (how to acquire it) that focus on the quantity and timing of resources but not the mix of resources required to meet system reliability The attribute a resource is required to demonstrate for resource adequacy purposes is that its obligated capacity will be available when called upon during the projected hours of peak system loads Resource adequacy rules are indifferent to other attributes including environmental attributes of resources
12 North American Electric Reliability Corporation Glossary of Terms Used in Reliability Standards April 20 2009 at httpwwwnerccomdocsstandardsrsGlossary_2009April20pdf Put another way resource adequacy means having sufficient electric supply resources in place to maintain the ldquoone day in 10 yearsrdquo standard of reliability (which translates to reliable supply 9997 percent of the time) See also N Jonathan Peress and Kenneth A Colburn ldquoConnecting Market Design From Carbon to Electric Capacityrdquo October 2005 Vol 3 No 1 Energy Committee Newsletter American Bar Association
13 The level and timing of peak loads are estimated before the fact and the projections are less reliable the farther out in time they are made
RegulatoRy assistance PRoject
6
Forward capacity markets in the US evolved as a way of ensuring resource adequacy at reasonable costs to electricity consumers through a combination of system planning and organized markets Prior to the development of organized markets in parts of the US15 power ldquopoolsrdquo established a reserve margin requirement and each participating LSE was responsible for acquiring installed capacity to meet its individual loads plus that margin or face financial penalties The setting of capacity requirements for the pool as a whole meant however that each LSErsquos reserve requirements were significantly lower than they would otherwise be if it were a stand-alone entity that is participants in the pool benefited from the greater diversity of loads and supply resources that characterized the combined system The pools also facilitated the trading of capacity through bilateral agreements which had particular value in those pools where individual system peaks were temporally differentiated (as in New England whose northern states peaked in the winter and southern states in the summer) After market restructuring LSEs also could trade capacity in auctions run by the system operator responsible for the reliability of the regionrsquos electric grid In those early days of competitive wholesale markets auctions generally were held just a few days before the one-month delivery period
These nascent capacity markets provided insufficient incentives for plants to be available when called on The result was ldquobipolar pricingrdquo If there was a supply surplus capacity prices were effectively zero If there was any shortfall capacity prices rose to the price cap (if any) Moreover short time horizons for the auctions
limited offers for new capacity In addition market power16 concerns surfaced after utilities sold their power plants under electric industry restructuring particularly in areas with significant transmission constraints The Federal Energy Regulatory Commission (FERC) responded with price caps for the energy market that as a side effect limited scarcity price signals Thus ldquoenergy-onlyrdquo power markets mdash that is markets that pay clearing prices for energy on a day-ahead or shorter basis mdash were not paying high enough prices for investors to build sufficient peaking resources to meet future reliability needs
Meanwhile merchant generators were buckling under high fuel prices for new natural gas-fired plants and owners of older less efficient plants filed requests for retirement To maintain system reliability federal regulators approved expensive ldquoreliability must-runrdquo contracts to keep needed plants going and then mandated the development of a more systematic approach for paying for capacity The resulting process produced a mechanism to make capacity payments to all generators not just those applying for retirement and to develop more efficient capacity where it was most needed But the high price tag of such contracts for the New England states led to legal action that ended with a novel settlement in 2006 a capacity market run by ISO-NE that allows energy efficiency and other demand-side resources to compete with generation to meet reliability requirements several years in advance of need In 2007 much of the Mid-Atlantic and Midwest region adopted a similar capacity market run by PJM
How Forward Capacity Markets Evolved in the US14
14 This description draws upon Robert Stoddard and Seabron Adamson CRA International ldquoComparing Capacity Market and Payment Designs for Ensuring Supply Adequacyrdquo Proceedings of the 42nd Hawaii International Conference on System Sciences 2009 and Sandra Levine Doug Hurley and Seth Kaplan ldquoPrime Time for Efficiencyrdquo Public Utilities Fortnightly June 2008
15 See footnote 2 for a definition of ldquoorganized marketsrdquo Southern and western states except for California have not developed organized power markets
16 Such as withholding power to extract higher prices
7
the Role of foRwaRd caPacity MaRkets in incReasing deMand-side and otheR low-caRbon ResouRces
How Forward Capacity Markets Work
A forward capacity market is an administrative market run by a regional system operator who collects supply bids to meet planning targets for regional peak capacity needs runs a competitive auction to establish capacity prices and then procures capacity at the market clearing price to meet the resource adequacy requirements of the region The regional system operator is the sole buyer in this market LSEs are individually responsible for meeting their customersrsquo peak loads and are allocated a pro-rata share of the capacity costs incurred by the system operator to meet those loads
In forward capacity markets LSEs must demonstrate on a ldquoforwardrdquo basis that they will have sufficient capacity to meet their own customersrsquo peak loads (plus required reserves) several years into the future As discussed further below LSEs have the option to meet this requirement through bilateral contracting or LSE-owned generation referred to as ldquoself-suppliedrdquo or ldquoself-scheduledrdquo resources depending on the market However the ISO-NE and PJM capacity markets are mandatory for LSEs in the sense that the system operator will procure any residual needed capacity17 through the auction and assign cost responsibility to LSEs In addition all existing capacity must be offered into the auction along with new demand- or supply-side capacity offerings with certain exceptions
The forward auctions in both PJM and ISO-NE are held three years before the delivery year And the LSEsrsquo ldquoforwardrdquo capacity obligations and amount of capacity put out to bid are
established in advance of each auction Three years was selected to roughly match the minimum lead time required for the construction or development of new capacity once demand- and supply-side resources receive a price commitment from the auction In particular it was chosen to reflect a reasonable construction period for new peaking (eg gas-fired) power plants as well as a reasonable ldquoramp uprdquo period for energy efficiency projects18
For each auction the system operator establishes the level of capacity needed for the delivery year by forecasting (with input from the LSEs and other stakeholders) regional resource adequacy requirements mdash peak loads plus required reserves PJM performs this planning function by developing a downward-sloping demand curve with built-in price elasticity for each auction whereas ISO-NE establishes a single price-inelastic quantity of demand that it auctions in successive rounds of bidding
The capacity bid into the market (the ldquosupply curverdquo) is comprised of capacity commitments (MW) offered by existing and new resources These markets and associated auction rules are designed to allow new resources when needed to set the clearing price Existing resources are generally ldquoprice-takersrdquo in the sense that they are unlikely
to set price unless there is over-supply of existing capacity in the region
The market clearing price becomes the uniform price for all capacity that clears the auction That is the market clearing price is paid to all capacity committed by existing resources and all new resources that have bid into the auction at or below that clearing price There are separate auctions for constrained zones ndash locations
17 The system operator determines the level of residual capacity that it needs to procure to ensure system reliability and purchases that quantity it also must approve the LSErsquos showing of the level of capacity commitment it can meet through owned resources and bilateral contracts
18 See Jenkins et al p 178 and Johannes Pfeifenberger Samuel Newell Robert Earle Attila Hajos and Mariko Geronimo The Brattle Group Review of PJMrsquos Reliability Pricing Model June 30 2008 at httpwwwbrattlecomExpertsExpertDetailaspExpertID=67
19 See PJM Reliability Pricing Model Demand Response and Energy Efficiency at httpwwwpjmcommarkets-and-operationsdemand response~mediamarkets-opsrpm20090406-dr-ee-in-rpm-collateralashx
Sample Calculation of Revenue for a Successful Bidder19
Assume a service provider cleared 20 MW of demand-side resources in a capacity auction that had a clearing price of $100MW-day and that the provider delivered the 20 MW as contracted during the year The annual revenue stream for the year would be 20 MW $100MW-day 365 days = $730000
RegulatoRy assistance PRoject
8
that are experiencing distribution or transmission bottlenecks for the delivery of electricity to end-use customers The clearing prices in these auctions reflect congestion costs and in effect pay a locational adder to capacity available during peak hours in those zones
Only resources that clear the market receive capacity
payments However in order to maintain reliability under very limited circumstances out-of-market payments may be made to resources that do not clear The system operator may determine that a resource critical to maintaining reliability for a given locational zone must continue to run even if its cost of operation is higher than the auction
Using simple assumptions the general ldquoworkingsrdquo of a forward capacity market from the perspective of an individual LSE can be described as follows The system operator forecasts the regional capacity requirements for the future delivery year (2012) and plans to hold the capacity auction for that delivery year three years in advance Each LSE knows its forecasted capacity obligation for 2012 some months before the auction Letrsquos assume there are only two LSEs in the region and they each account for 50 percent of the total regional capacity requirement of 10000 MW projected for the delivery year
At the time of the auction the system operator approves LSE 1rsquos showing that it has bilateral contracts in place to meet 3500 MW of its capacity obligation for the delivery year LSE 2 on the other hand has no bilateral contracts (or generation that it owns) to meet any of its capacity obligation for 2012
Herersquos how it works LSE 1 will offer the 3500 MW under its bilateral contracts as ldquoself-suppliedrdquo or ldquoself-scheduledrdquo resources into the auction at a price of zero mdash and they will automatically clear the auction20 However as described below the auction clearing price will have no impact on what LSE 1 actually pays for this resource It will only pay the capacity price negotiated under its bilateral contracts
Now letrsquos flash forward to 2012 and assume that the actual 2012 peak capacity needs of the customers served
by LSE 1 and LSE 2 turn out exactly as the system operator forecasted for that year 21 and that LSE 1rsquos resources under bilateral contracts were available to meet peak capacity needs as expected At the end of 2012 the system operator calculates what it spent to meet the regionrsquos peak capacity needs LSE 2 will get a bill from the ISO for purchasing on its behalf 50 percent of the regional capacity needs (5000 MW) at the auction price for the 2012 delivery year LSE 1 will get a similar bill from the ISO mdash but with an offsetting credit for the 3500 MW of capacity under its bilateral contracts So in effect LSE 1 only pays the auction price for the ldquoresidualrdquo capacity of 1500 MW mdash the capacity that the system operator purchased to meet the remaining capacity obligation of LSE 1
The scenario is similar if actual 2012 peak loads are greater than forecasted levels LSE 2 will still pay the auction price for all of the capacity that was purchased on its behalf to meet its actual peak capacity needs and LSE 1 will pay that auction price for the (now higher) residual amount above its contracted capacity In this way LSEs can elect to use bilateral contracts to hedge against high capacity prices in the capacity auctions just as they can hedge against high prices in energy markets
Appendix 2 presents a series of slides illustrating this numerical example of how forward capacity markets work
Illustration of Forward Capacity Markets From the LSErsquos Perspective
20 Unless the contracts are structured as a contract-for-differences (see discussion of that option further below) The net effect in either case is the same in terms of the LSE only paying the contracted price for that capacity
21 In actual practice the percentage allocation of capacity costs to LSEs for the delivery year is based on the previous yearrsquos actual peak loads (plus reserves) of each LSE relative to the regional totals mdash but as noted this is a simplified example
9
the Role of foRwaRd caPacity MaRkets in incReasing deMand-side and otheR low-caRbon ResouRces
clearing price Under these circumstances the system operator can still require LSEs to pay for reliability must-run contracts at a cost determined outside the auction process To date the amount of MW under reliability must-run contracts in the PJM and ISO-NE regions is very small In the first few auctions almost all reliability must-run contracts were voided Most of the resources previously under reliability must-run contracts however have been retained through the forward capacity auctions and receive the annual market clearing price
Market Rules to Ensure Performance and Competition
To ensure that any successful bidder will have a very high likelihood of performance during the commitment period resources cannot bid capacity into the market unless they are prequalified by the system operator In particular bidders must demonstrate that they can meet their commitment to provide capacity for the delivery year and their bids must satisfy market rules designed to mitigate market power22 They must pay a qualification deposit must provide financial assurance to ensure commercial operation and can be penalized for performance failures
Further to ensure against a condition in which capacity occupies a place in the power system but is withheld from energy markets and drives up prices all generation and demand-response resources committed in the capacity market must offer into the regionrsquos day-ahead energy market whenever available To mitigate excessive profits to resources also receiving capacity payments from the forward capacity market the system operator reduces these payments to reflect the impact of high energy
market prices The ISO-NE makes this reduction on an annual basis to reflect especially high energy prices in the preceding year23 In the case of PJM this reduction is implemented through a built-in adjustment to the auction demand curve described below
The following section describes some of the unique features of the PJM and ISO-NE capacity markets highlighting in particular their differences
PJMrsquos Capacity Market
PJMrsquos current forward capacity market mdash called the ldquoReliability Pricing Modelrdquo mdash was implemented on June 1 2007 replacing an earlier capacity market design in place since 1999 Eligible capacity resources include new and existing demand and supply-side resources (including generators outside the PJM footprint) PJM recently added energy efficiency as an eligible demand-side resource joining demand response and distributed generation
Each year PJM holds a Base Residual Auction three years in advance of a future delivery year (that runs from June 1st to May 31st) PJM establishes the target capacity level and the auction establishes the price and the actual amount of capacity procured A mechanism called the ldquoVariable Resource Requirementrdquo administratively adds demand elasticity into the auction by imposing a downward-sloping demand curve that adjusts resource amounts procured based on auction prices (See Figure 2) If capacity prices are low PJM intentionally purchases capacity in excess of its target but the total payment by load is also lower If capacity prices are high PJM procures less than the target leaving some capacity to be acquired (at potentially lower prices) in incremental auctions for the delivery year24
In PJM resources are eligible only for a one-year capacity
22 For example in the PJM auction suppliers of existing resources are limited to bidding their demonstrated going-forward costs for nearly all capacity and new resources offered below cost because of support from an LSE contract have a limited ability to set the clearing price
23 This adjustment is not currently applied to energy efficiency resources because they are not eligible to participate in the wholesale energy markets
24 The purpose of administratively developing a downward-sloping demand curve rather than relying on a descending clock auction (as described below for the New England auction) is to help stabilize prices over time when supply is price-inelastic Figure 2 and further details on the mechanics of the Reliability Pricing Model are available from PJMrsquos ldquoReliability Pricing Model Trainingrdquo November 2009 at httpwwwpjmcomtraining~mediatrainingcore-curriculumip-rpmrpm-training-section-d-auctionsashx
RegulatoRy assistance PRoject
10
commitment resulting from each annual auction mdash that is the resource is only guaranteed the auction clearing price for a one-year contract period26 However as long as that resource remains listed in the market it is eligible to receive the auction clearing price for each succeeding year27 Capacity that was offered but not cleared in the Base Residual Auction is eligible to bid into incremental auctions for the same delivery year
In general each LSE is obligated to pay its pro rata share of capacity costs acquired by the PJM system operator through a ldquolocational reliability chargerdquo28 However as described above LSEs can enter into bilateral contracts
(or own generation) to hedge these charges and submit the capacity into the auction as a ldquoself-scheduledrdquo resource at a price of zero29 When the monthly billingsettlement is completed the locational reliability charge to the LSE will be offset (credited) for capacity delivered through self-scheduled resources The net effect of these financial transactions within the market is that the LSE pays the contract price for self-scheduled contracts and does not get paid (or charged) for generation it owns and self-schedules into the auction However self-scheduled resources are counted by the system operator in establishing available capacity to meet regional peak demand (plus reserves) and
25 ldquoUCAPrdquo in this figure refers to ldquounforced capacityrdquo Unforced capacity as defined for the PJM auction represents the MW level of a generating unitrsquos capability after removing the effect of forced outage events It excludes outage events outside of management control
26 There is an exception for a new resource that relieves a congestion constraint It can receive a fixed capacity price for more than one year subject to a review of the congestion relief that it is providing
27 As discussed below energy efficiency is not eligible to remain listed in the PJM capacity market after four years
28 This charge is based on the LSErsquos peak loads adjusted for demand response resources and the applicable zonal capacity price
29 See PJM Manual 18 PJM Capacity Market Revision 9 March 1 2010 pp 4 and 38 at httpwwwpjmcom~mediadocumentsmanualsm18ashx
450
400
350
300
250
200
150
100
50
0125000 130000 135000 140000 145000 150000
Pri
ce (
$M
W-d
ay)
MW (UCAP)
Figure 2 Establishing the Market Clearing Price in PJM - 20122013 Base Residual Auction25
20122013 RTO Supply and Demand
RTO Supply
Clearing Price = $1646
RTO Demand
Note To establish the clearing price when the supply and demand curves do not intersect PJM does one of the following depending on the circumstance 1) Short of supply - Extend the supply curve up vertically until it intersects the demand curve 2) Short of demand - Extend the demand curve down vertically until it intersects the supply curve or 3) Supply curve above demand curve - No capacity will be cleared
Reliabilty requirement = 1337324 MW
Cleared capacity = 1361435 MWReserve margin = 212
11
the Role of foRwaRd caPacity MaRkets in incReasing deMand-side and otheR low-caRbon ResouRces
are subject to applicable performance requirementsIn addition to self-scheduling by LSEs PJM provides
a complete ldquoopt outrdquo ndash the ldquoFixed Resource Requirement Alternativerdquo ndash for LSEs that take full resource planning responsibility for all loads in their service area for a five-year period The projected peak capacity needs for LSEs selecting this alternative are not included in the PJM planning process to establish the regionrsquos capacity needs for the auction and the LSErsquos capacity resources (including capacity acquired through bilateral contracts) are not offered into the auction Moreover under this opt-out alternative the LSE cannot bid any excess capacity into the auction or acquire any capacity through it
Capacity suppliers can cover any auction commitment shortages through the bilateral market facilitated by an electronic system at PJM If capacity shortfalls reach triggering conditions PJM can delay deactivation of a generating resource or hold a backstop reliability auction for capacity resources for a term of up to 15 years30
To improve the availability of capacity resources when needed the capacity product in the PJM market is defined to include forced outage rates based on historical performance and penalties are imposed if the plant is not up and running during a shortage
ISO New Englandrsquos Capacity Market
As in PJM eligible capacity resources in New England include both new and existing demand-side and supply-side resources (including generators outside the ISO-NE footprint) From the start ISO-NErsquos forward capacity market allowed energy efficiency demand response and distributed generation to compete with generation on an equivalent basis which meant among other things that new demand resources could set the market clearing price
Like PJM each year ISO-NE holds a capacity auction three years in advance of the delivery period and sets the amount of capacity to be purchased in each auction In addition to the annual forward capacity auction ISO-NE holds voluntary monthly and annual reconfiguration auctions that allow deficient suppliers to procure replacement capacity These auctions also provide the
system operator the opportunity to buy additional capacity if the load forecast increases or to sell capacity if the forecast decreases
However ISO-NE does not establish a downward sloping demand curve (Variable Resource Requirement) for its auctions Rather ISO-NE puts out a single quantity of capacity for bid referred to as the ldquoInstalled Capacity Requirementrdquo Then ISO-NE uses a descending-clock auction in which market prices are reduced until the quantity of available supply bids matches this capacity requirement Bid quantities and prices decline through successive bidding rounds (with bidders withdrawing resources from the auction as prices decrease) as long as excess capacity is still offered or until the floor price is reached To address start-up issues ISO-NE established a temporary price cap (or ldquostarting pricerdquo mdash see figure below)
30 See PJM Open Access Transmission Tariff Section 16 at httpwwwpjmcom~mediadocumentsagreementstariffashx
Contracts for Differences
Instead of a bilateral contract for physical delivery of capacity an LSE and resource owner can sign a ldquocontract-for-differencesrdquo which means that the level of payments (and who makes them) depends on the auction clearing price For example if the contract price is $50 per MW-day and the clearing price is $46 per MW-day the LSE will pay the resource owner the difference of $4 per MW-day But if the auction clearing price is higher than the contract price the resource owner pays the difference (to the LSE) As in the case of self-scheduled bilateral contracts the LSE will end up paying only the contract price for that capacity However in the case of contracts-for-differences the resource underlying the contract will bid into the market and (if cleared) will receive the auction clearing price And the LSE will be allocated the full locational reliability charge receiving no credits for the contracted capacity The reconciliation happens outside the auction between the LSE and resource owner rather than as part of the monthly billingsettlement process
RegulatoRy assistance PRoject
12
and price floor for the auction The most recent auction for ISO-NE ran seven rounds over two days concluding when the auction reached the floor price of $2951kW-month31
However by rule the load only pays Installed Capacity Requirement times the clearing price so the floor price is further reduced (pro rata) to achieve that effect32 Figure 3 below illustrates the descending clock auction process for ISO-NErsquos first forward capacity market auction
Therersquos another key difference To encourage investment ISO-NE allows new resources to lock in a capacity price for up to five years (with a one-year minimum term)
regardless of clearing prices in subsequent auctions The capacity price is indexed for inflation after the first year and the bidder must select the proposed contract term in advance of the auction Existing resources including existing demand-side resources are eligible only for a one-year price commitment mdash as is the case for PJM
While ISO-NE also permits LSEs to meet their capacity requirements with self-supplied resources (owned resources and resources under bilateral contracts) ISO-NE does not provide an ldquoopt outrdquo alternative as described above for PJM Similar to PJMrsquos ldquoself-scheduledrdquo option the
31 The caps and floors were originally scheduled to be eliminated following the third forward capacity auction However a recent filing by ISO-NE to implement the results of a stakeholder process proposes to continue these mechanisms for the next three auctions For more information on how the descending clock auction functions and how these capsfloors are established see ISO-NE Internal Market Monitoring Unit Review of the Forward Capacity Market Auction Results and Design Elements June 5 2009 at httpwwwiso-necomcommitteescomm_wkgrpsothrfcmwgmtrls2009aug720096-05-09_market_monitor_report_for_fcmpdf
32 With some exceptions resources have the option to pro-rate their cleared MW (rather than take a lower price)
33 Jenkins et al p 178
40000
39000
38000
37000
36000
35000
34000
33000
32000
31000
30000 Start 1 2 3 4 5 6 7 Close
Final Results of ISO-NE FCM Auction 1
$900
Start at $1500
$800 $700$600
$5625
$525 $4875 $450
End-of-round price
Round
Su
pp
ly a
vail
able
(M
W)
at e
nd
of
rou
nd
Final Capacity Needed (ICR)
Figure 3Example of Descending Clock Auction for ISO-NErsquos Forward Capacity Market33
Note Prices are in $USkW-month By rule the load only pays Installed Capacity Requirement times the clearing price so the floor price is further reduced (pro rata) to achieve that effect
13
the Role of foRwaRd caPacity MaRkets in incReasing deMand-side and otheR low-caRbon ResouRces
LSErsquos full capacity obligation (including that portion met through self-supply) is included in the Installed Capacity Requirement put out to bid and the self-supplied resources are also counted towards the resources available to meet that requirement (at a price of zero) in the auction process The net effect for the LSE is also the same The capacity committed as self-supply does not receive any capacity revenue and the LSErsquos capacity obligations satisfied through self-supply are not subject to capacity charges Further the LSErsquos self-supplied resources are subject to applicable penalties and the LSE is subject to capacity charges for any needed residual capacity that the ISO purchases through the auction on its behalf
The penalty provisions in the two regions also differ While both PJM and ISO-NE impose stiff penalty charges if a unit fails to perform when obligated to run ISO-NE also reduces payments to units that are not producing energy at their full capacity level during shortage events mdash similar to the mechanism it uses to reduce capacity payments when prices in the energy market reach very high levels
Role and Eligibility of Demand-Side Resources in FCMs
As discussed above electric systems face a reliability challenge not faced by other commodity markets Because customers are physically interconnected because electricity cannot be meaningfully stored and because electric service is central to economic and social well-being the balance between demand and supply is critical at all times and this balance must be assured over a sustained period of time The FCM design described in this paper recognizes that actions taken on the demand side of the market can effectively moderate price spikes and enhance reliability in a comparable manner as capacity commitments from supply-side generation mdash through short-term customer demand responsiveness during system peak or through permanent and continuous reductions in peak demand (energy efficiency) This market design recognizes that demand-side resources broadly defined to encompass demand response energy efficiency and distributed generation can meet system needs lower costs and add
value to power markets in a variety of circumstances The most important opportunities include34
bull Lowering the cost of power delivery reducing congestion and improving the reliability of the delivery system
bull Enhancing regional power system reliability by using a broad range of demand-side resources to meet planning and operational reserves
bull Economically balancing supply and demand in wholesale power markets through demand-side bidding and market transactions for energy supply released through demand reduction
bull Cost-effectively reducing long-term demand and lowering throughput through energy efficiency resources both on the power grid as a whole and within the resource portfolio of power suppliers
To capture these benefits energy efficiency and demand response (including distributed generation) can now compete on a level playing field with generation in the ISO-NE and PJM forward capacity markets Like generating resources demand-side resources must meet market rules for eligibility and availability including demonstrating they will be available at the start of the proposed delivery year Each type of demand-side resource has a specific set of performance hours across which load reductions are required To be eligible for the auction service providers must demonstrate in advance their ability to perform during those hours Like other resources demand-side resources are subject to penalties if there is a mismatch between their capacity commitment and their performance
Demand-side resources must meet comprehensive standards for measurement and verification (MampV) Failure to comply with MampV protocols makes the resource ineligible for the auction failure to submit post-installation MampV reports results in a final capacity offering of zero for the delivery year plus penalties Generally penalties cannot exceed the revenue that would have been collected if the resource performed as specified in the contract Energy efficiency resources also are audited for compliance Although the capacity obligations and associated penalties for non-performance among supply-side and demand-
34 Richard Cowart Regulatory Assistance Project and Jonathan Raab Raab Associates Ltd Dimensions of Demand Response Capturing Customer-Based Resources in New Englandrsquos Power Systems and Markets Report and Recommendations of the New England Demand Response Initiative July 23 2003 at httpwwwraponlineorgdocsRAP_Cowart_DemandResponseAndNEDRI_2003_07_23pdf
RegulatoRy assistance PRoject
14
side resources are not identical in these capacity markets they are designed and intended to provide comparable incentives to perform during specified hours35
Currently the key difference in eligibility requirements for demand-side resources in the ISO-NE and PJM capacity auctions is the circumstances under which energy efficiency resources may participate Under PJMrsquos rules energy efficiency resources may participate in Base Residual Auctions only up to four years This means that efficiency measures are limited to receiving compensation for their capacity contribution to four years of their measure life rather than their full measure life Demand response resources (including distributed generation) can participate in the PJM capacity market for as long as their ability to reduce demand continues In contrast all demand-side resources in ISO-NE are eligible to bid capacity for their full measure life an approach that recognizes the
full contribution of these resources to regional resource adequacy requirements and that encourages long-lived energy efficiency assets Further description of eligible demand-side resources and performance requirements in these markets is presented in Appendix 3
Forward Capacity Auction Results
In the following sections we summarize the overall level of capacity cleared from existing and new resources in the PJM and ISO-NE auctions the level of incremental capacity successfully bidding into these markets and how different types of resources have fared to date mdash with particular focus on demand resources More detailed results for the PJM and ISO-NE forward capacity markets are provided in Appendix 1
Some stakeholders claim that demand resources are not as available as generation yet they get paid the same price for capacity (implying that they should receive a lower price) A closer examination of the ISO-NE rules reveals several problems with this generalization In particular generation availability can actually vary quite widely because these resources are excused from performing if they are on scheduled maintenance (eg nuclear plants are paid their full monthly capacity payment even when they are shut down for weeks of re-fueling) And other generation resources are ldquoallocatedrdquo a specific number of hours for annual maintenance and are paid as if they are providing capacity services when they are off-line Demand resources have pre-established hours they must be available and are penalized for performance failures differently than traditional generationmdashsome argue more severely For example a demand resource that fails to perform is assessed a penalty for that month and its capacity value is reduced going forward (for all future months) While it is possible to re-establish the capacity value
through future performance (demand response) or with updated MampV (energy efficiency) the process is a slow one that can take many months or more A generation unit that fails to perform is assessed a penalty for that month but its capacity value is either unchanged or can be reestablished with a test run at anytime and the monthly capacity payments continue with no reduction Generation plants with long notice requirements (eg 24 to 48 hoursrsquo notice for coal-fired plants if the system operator wants them on-line and actually providing energy) are paid the same as a demand response resource that is required to be dispatchable by the system operator within 30 minutes throughout the year to address shortage events (See Appendix 3) Clearly there are individual rules that stakeholders can argue work to the advantage of supply-side over demand-side resources and vice versa Overall the intent of such variations should be to make obligations penalties and payments for demand and supply resources roughly comparable while recognizing the unique operational issues associated with all resources
Performance Incentives Demand- vs Supply-Side Resources
35 Nonetheless there continues to be debate among stakeholders over whether the appropriate balance has been reached See text box
15
the Role of foRwaRd caPacity MaRkets in incReasing deMand-side and otheR low-caRbon ResouRces
Auction Results for PJM36
PJM has held five Base Residual Auctions including the most recent May 2009 auction for the 20122013 delivery year PJM serves a large market The 20122013 Base Residual Auction cleared a total of 1361436 MW of capacity While generating resources account for nearly all of this committed capacity (1285274 MW) demand response resources (including distributed generation) represent 5 percent of the total (70472 MW) New for the 20122013 delivery year 5689 MW of energy efficiency also cleared the market Table 1 in Appendix 1 lists capacity resources offered and cleared to date As indicated in that table the vast majority of demand-side resources offered into the market cleared each PJM base residual auction
Figure 4 below illustrates the increasing role of demand-side resources in PJM
Renewable generating resources also are gaining some traction in the capacity market although not anywhere near the magnitude of demand-side resources in terms of their overall contribution to resource adequacy requirements This is due to the predominance of wind resources and their variable nature PJM applies a 13 percent on-peak capacity factor to these resources mdash for every 100 MW of wind resources only 13 MW are eligible to meet capacity requirements Some 3234 MW of wind capacity resources cleared in the most recent Base Residual Auction mdash 95 percent of the amount offered While this capacity level is miniscule compared to the total capacity clearing the auction it translates to a large nameplate rating mdash 2488
12000
10000
8000
6000
4000
2000
0
Active Load Management
Prior to RPMImplementation RPM Implemented
Interruptible Load for Reliability
Energy Efficiency RPM Offered Demand Response
Figure 4 Demand-side Participation in PJMrsquos Reliability Pricing Model (RPM) Auctions
Note Demand-side resources included Active Load Management prior to the 20072008 delivery year Interruptible Load for Reliability and Demand Response were first eligible for the 20072008 delivery year Energy Efficiency resources were first eligible for the 20122013 delivery year (May 2009 auction) The large increase in demand response participation in the 20122013 delivery year is in large part due to the elimination of PJMrsquos ILR program
200506 200607 200708 200809 200910 201011 201112 201213
36 Except where noted information and figures in this section and referenced tables in Appendix 1 are from PJM ldquo20122013 RPM Base Residual Auction Resultsrdquo at httpwwwpjmcom~mediamarkets-opsrpmrpm-auction-info2012-13-base-residual-auction-report-document-pdfashx
RegulatoRy assistance PRoject
16
MW of wind resourcesPJM reports that the Base Residual Auctions have
attracted 150294 MW of incremental capacity in the region to date Incremental capacity refers to new generation resources capacity upgrades to existing generation resources new demand response resources upgrades to existing demand response resources and new energy efficiency resources37 Natural gas- and coal-fired plants account for most of the incremental capacity with nuclear plants (from uprates) also making a sizable contribution Tables 2 and 3 in Appendix 1 provide details on the incremental capacity procured It is important to note that the figures in these tables represent resources new to the capacity market including uprates mdash not all are newly built However they include a new merchant coal plant built for the PJM market38
True to one of the original goals the PJM capacity market also has been successful in retaining existing capacity from power plants that were originally under high-cost reliability must-run agreements39 Since FERC approved the Reliability Pricing Model existing capacity that would otherwise have been deactivated or retired has accounted for 32768 MW of procured capacity Table 4 in Appendix 1 shows these changes in resource deactivation and retirement
Market clearing prices for resources in PJMrsquos Base Residual Auctions to date have ranged from $1646 to $17429 per MW-day not including any locational price adders for constrained areas (See Table 5 in Appendix 1) Importantly the $1646MW-day clearing price for the 20122013 delivery year represents a decrease of $9354MW-day from the previous Base Residual Auction due in part to significant increases in capacity from demand response and the introduction of energy efficiency resources into the bidding process Moreover the participation of demand-side resources is estimated to have reduced the market clearing price for the 20122013 delivery year by an astonishing $16232MW-day in unconstrained zones (ie from a clearing price of $17878MW-day without these resources in the bid stack to the actual clearing price
of $1646MW-day) Table 6 in Appendix 1 shows the calculation by PJMrsquos independent market monitor
Auction Results for ISO-NE
ISO-NErsquos forward capacity market is about a quarter of the size of the PJM capacity market mdash the Installed Capacity Requirement set by ISO-NE for the 20122013 delivery year was 31965 MW ISO-NE has held three forward capacity auctions to date and all of them cleared at the administratively set floor price ($450kW-month $360kW-month and $295kW-month respectively) with surplus capacity above the Installed Capacity Requirement set by ISO-NE to meet reliability needs The first auction secured 1772 MW above the requirement the second auction cleared 4755 MW of excess capacity and the third auction cleared 4649 MW of excess capacity (See Table 7 in Appendix 1)
Demand resources have consistently represented about 8 percent of the resources cleared in the three auctions (2554 MW 2937 MW and 2898 MW respectively) an amount that exceeded expectations Energy efficiency accounted for about a quarter of the demand resources in the first auction and about a third in more recent auctions Real-time demand response comprises the largest share of demand resources Emergency generation (ie distributed generation whose state air quality permit limits operation to ldquoemergencyrdquo conditions) also makes a sizeable contribution Non-emergency distributed generation however comprises a negligible amount of the total Table 8 in Appendix 1 shows detailed results for demand resources
Figure 5 shows the growth in demand resources offered and cleared in the first two ISO-NE auctions by type There has been a steady growth in demand-side resources in New England since the first demand-response programs operated by ISO-NE The forward capacity auctions have contributed to and solidified these gains
Participation of demand-side resources in the ISO-NE forward capacity auction has been credited with making the clearing price lower than it would have been otherwise
37 The increase is partially offset by capacity de-ratings to existing generation resources
38 See Pfeifenberger et al at 27
39 As discussed above these contracts have not been dispensed with altogether however
17
the Role of foRwaRd caPacity MaRkets in incReasing deMand-side and otheR low-caRbon ResouRces
as it has in the PJM region Analysis of the first auction bids for example suggests that the participation of these resources saved ratepayers as much as $280 million by lowering the price paid to all capacity resources in the market40
Moreover by contributing to the excess capacity that kept capacity payments at relatively low floor prices in New England the participation of demand-side resources has
also contributed to lower overall market revenues inducing some inefficient oil-fired generating units to shut down at least temporarily Nonetheless existing and new fossil-fuel resources continue to dominate the capacity commitments in this region as is the case for PJM
Overall renewable generating resources (primarily wind resources) are making some headway in the regionrsquos forward capacity market but as in PJM they are not
40 See Cheryl Jenkins et al This calculation reflects what the market clearing price would have been in the auction given the Installed Capacity Requirement put out to bid by the system operator which assumes no impact of energy efficiency programs on loads (because energy efficiency is bidding) Therefore the calculated reduction in clearing price represents a theoretical maximum mdash excluding demand resources from the market would likely have been at least partially offset by a lower amount of capacity put out to bid As a result the difference in the market clearing price (and savings to consumers) would likely have been smaller than the number calculated here although it is difficult to say by how much However even if demand-side resources were not permitted to bid they would contribute to lower prices for consumers by lowering the total quantity of capacity required
41 Internal Market Monitoring Unit ISO-NE June 5 2009
4500
4000
3500
3000
2500
2000
1500
1000
500
0
New UnclearedTotal Uncleared1375 MW
Total Uncleared1159 MW
Total Cleared2279 MW
Total Cleared2778 MW
New Cleared
Existing Delisted Uncleared
Existing Cleared
FCA 1 FCA 1
Figure 5 Demand-Side Participation in ISO-NE Capacity Auctions by Type41
copy ISO New England Inc
Note Activerdquo resources include demand response and emergency generation energy efficiency is considered a ldquopassiverdquo resource Clearing amounts reflect ISO-NErsquos maximum limit of 600 MW of Real-Time Emergency Generation In contrast Table 8 in Appendix 1 shows the actual amount of such resources that cleared the auction Capacity payments to these resources are pro-rated if cleared levels exceed 600 MW
Cap
acit
y (M
W)
Active
Active
Active
Active
Active
Active
Active
Active
Passive
Passive
Passive
Passive
Passive
RegulatoRy assistance PRoject
18
a major contributor to the regionrsquos resource adequacy requirements at this time In the most recent (third) auction 166 MW of wind capacity cleared the auction mdash with a nameplate rating an order of magnitude larger42
Unlike PJM ISO-NE does not apply a deemed on-peak capacity factor to wind and other variable generation resources Instead all such resources must provide data that demonstrate the claimed summer and winter qualified capacity The capacity factor is adjusted over time based on actual performance during specified hours
Forward Capacity Markets in the Context of Carbon Constraints
Power market rules are not constructed in a vacuum rather they are designed to address specific public policy goals As described above forward capacity markets in the US were developed to ensure resource adequacy in the power system at a reasonably competitive price In the face of growing carbon constraints however power market rules need to be redesigned to work in concert with carbon reduction goals and policies rather than at cross purposes The challenge of substantially de-carbonizing the power sector in the coming years is too great to ignore this interaction In particular policymakers should carefully consider what elements of the current planning and procurement process to achieve resource adequacy contribute to the following effects ndash and then work to revise the market rules accordingly
bull Do the market rules encourage new investments in high-emitting resources (including repowering) at the expense of low-carbon alternatives
bull Do they encourage the continued (or increased) operation of existing high-emitting power plants
bull Will they result in a build-out of capacity and cumulative emissions that conflict with the level of de-carbonization required in the power sector mdash or make attainment of that level more costly to the economy
This paper is not intended to evaluate the PJM and ISO-NE capacity markets and auction rules in any depth with respect to these issues However we offer below general observations based on the auction design and results to date in these regions and other studies Following that we provide policy recommendations related design options and additional actions for consideration
General Observations on Forward Capacity Markets and Results
Based on our review of FCM auctions to date and related studies we offer the following observations
bull The ISO-NE and PJM forward capacity markets are meeting their resource adequacy objectives Sufficient levels of capacity have cleared the market to meet each regionrsquos anticipated peak demand and adequate resources are now committed on a forward basis to ensure reliable coverage in future years (up to the 20122013 delivery year) But in a carbon-constrained world the mix of resources is as important as the quantity in both the short-term and the long-term Most resources that are available during peak demand hours also produce electricity or reduce consumption during many more (or all) hours of the year and the carbon intensity of that mix of resources will drive the level of cumulative emissions in the power sector43 As discussed in this paper capacity markets as currently designed provide compensation based on the level of available capacity not the mix of resources providing that capacity It is worth repeating here that the only (non-price) attribute a resource needs to demonstrate for resource adequacy purposes is that it will be available when called upon during the projected hours of peak system loads In a carbon-constrained world policy makers should ask whether the planning and procurement process for acquiring a sufficient level of capacity at a reasonable price is also moving the resource mix in the right direction mdash towards zero or low carbon-emitting demand- and supply-side resources
42 Compiled from auction results at httpwwwiso-necommarketsothrmkts_datafcmcal_resultsccp13fca13indexhtml
43 With the exception of gas-fired peaking units or demand response resources that are dispatched to meet (or reduce) loads only during peak system hours
19
the Role of foRwaRd caPacity MaRkets in incReasing deMand-side and otheR low-caRbon ResouRces
bull Expressly designing demand-side resources into forward capacity markets appears key to achieving all three objectives ndash resource adequacy low-carbon resource mix and reasonable price Energy efficiency and demand response resources are faring well in auction-based capacity markets mdash and this is a positive outcome for several reasons First energy efficiency and other demand-side resources can substitute for existing and planned generation that have a higher carbon footprint thereby reinforcing carbon reduction policies and targets for the region Second demand-side resources can dramatically reduce the costs of meeting the regionrsquos resource adequacy requirements mdash as evidenced by the results of the PJM and ISO-NE auctions In addition the increase in demand-side resources facilitated by capacity auctions can reduce market power because more suppliers and more resources means individual generators have less ability to affect bid offers and clearing prices And because demand-side resources lighten the load at the end of the supplydelivery chain they enhance the reliability of each link in the chain from fuel supply and generation to the local distribution network
bull Differences in the impact of demand-side resources on carbon emissions should be recognized in capacity markets and associated auction rules Energy efficiency decreases carbon emissions because (by definition) it reduces energy use for an equivalent level of service and at the margin almost all power systems are running higher carbon resources In contrast the net impact of demand response on carbon emissions will depend upon specific circumstances including the mix of
plants serving loads at the margin For example when coal is primarily serving baseload and intermediate needs emissions may increase when customers shift loads from on-peak (when natural gas is on the margin) to off-peak periods44 Elsewhere however demand response mdash including any conservation side-effect mdash may reduce emissions from less efficient peaking plants In addition demand response includes real-time emergency generation which is often fossil-fuel powered (eg by diesel or natural gas) Any analysis of the costs and benefits of demand response resources in capacity markets should account for such effects Policies and market rules for demand response should be aligned with its environmental costs and benefits45
bull Renewable generating resources are beginning to make some headway in forward capacity markets mdash in particular wind resources This is in large part because the markets described here recognize some capacity value for variable renewable resources (wind solar and run-of-river hydro) either through a deemed on-peak capacity factor or a demonstration of claimed capacity for specified on-peak periods Policymakers need to pay attention to how these values are established so they can be confident the committed capacity will be available when called on while at the same time encouraging participation of all low-carbon resources in the market More generally as renewable resources become a more significant part of the resource mix a forward capacity market creates the opportunity to recognize their aggregate capacity value to the system46
44 For example PJM recently released figures on carbon emissions of generating units that operate on the margin during on-peak vs off-peak hours See httpwwwpjmcom~mediaabout-pjmnewsroom2010-releases20100325-pjm-reports-new-carbon-dioxide-emissions-dataashx and httpwwwpjmcomdocuments~mediadocumentsreportsco2-emissions-reportashx
45 See section 316 and Mechanism E in Attachment 1 of Pacific Northwest National Laboratory The Smart Grid An Estimate of the Energy and CO2 Benefits January 2010 (PNNL 19112) at httpenergyenvironmentpnlgovnewspdfPNNL-19112_Revision_1_Finalpdf
46 Variable renewable resources will qualify for higher capacity value if they are bundled with other resources for reliability (eg demand response hydroelectric dams or energy storage) In addition confidence in the capacity value of variable resources increases as their geographic diversity on the system increases See for example the report on the Eastern Wind Integration and Transmission Study at httpwwwnrelgovwindsystemsintegrationpdfs2010ewits_final_reportpdf
RegulatoRy assistance PRoject
20
bull Nonetheless renewable resources are hard-pressed to successfully compete with the thousands of megawatts of existing and new fossil-fuel resources participating in these auctions that are able to bid below the true societal cost of their operations under current market rules In fact capacity auctions as currently designed can breathe new economic life into high carbon-emitting plants that were previously planned for significantly reduced operations or retirement Along with new capacity from fossil-fuel generation allowing such a large amount of existing capacity from high carbon emitters to clear the auction is likely to crowd out renewable resources that are able to address resource adequacy requirements equally well Such results may not represent an ldquoefficientrdquo (or desirable) outcome for a carbon-constrained power sector This is especially true where the carbon costs of a fossil-fuel plant are not fully recognized in the energy market that plant also will be bidding into
The Electric Power Research Institute modeled the effect of various levels of carbon taxes or allowance prices in the upper Midwest (coal-dependent) and in Texas (heavily reliant on natural gas) The study found that close to a doubling of the wholesale prices of electricity in the Midwest region (through carbon-related charges) would produce only a 4 percent reduction in regional emissions given the current generation mix Similar results were observed for Texas where natural gas plants are on the margin49 And in the Northeastern US due to initially low carbon prices and a host of factors that dampen the price signal the Regional Greenhouse Gas Initiative (RGGI) has not yet resulted in generator operational changes50 One of those dampening factors is the single clearing price that is typically set through wholesale energy markets mdash which dilutes the market signal sent by a price on carbon emissions by allowing fossil-fueled plants to recover
most or all of their allowance costs through higher clearing prices reflecting the cost of allowances51
Studies also have shown that the price of carbon must rise (and be maintained) at very high levels to obtain sufficient market pull for the level of new investments in clean generation required For example a recent analysis in California concluded that it would take a carbon price of $100 per tonne52 to make economic investments in renewable resources compared to fossil fuel-fired generation in order to reach carbon reduction targets in the power sector beyond what current state requirements will achieve53 Further price signals may be diluted if a portion of the carbon allowances are allocated in a manner that shields high-emitting power plants from carbon costs or if high-emitters located outside the capped region can sell into the market on a long-term basis
Carbon Pricing Alone Is Insufficient to De-carbonize the Generation Mix
bull A market price for capacity or energy that favors the construction and operation of high carbon-emitting resources over clean resources will lead to increases mdash rather than reductions mdash in the cumulative level of carbon emissions in the power sector A carbon tax or carbon cap-and-trade regime internalizes some or all of the otherwise un-priced carbon costs of electricity production and would improve the relative economics of clean resources in both forward capacity and energy markets However carbon pricing alone may be insufficient to change the dispatch of existing high-emitting power plants or their ability to clear these capacity markets (and be paid additional revenues as a result) in such overwhelming numbers47 In fact the very modest impact of carbon pricing on the performance of fossil-fuel plants has been documented in several reports48 (See text box below)
47 With or without carbon prices policymakers also might want to consider the implications of paying existing power plants the market clearing price for capacity mdash and the potential windfall profits for plant owners mdash for making no changes in plant operations See for example Ezra Hausman Paul Peterson David White and Bruce Biewald Synapse Energy Economics Inc RPM 2006 Windfall Profits for Existing Base Load Units in PJM An Update of Two Case Studies Feb 2 2006 at wwwsynapse-energycom
21
the Role of foRwaRd caPacity MaRkets in incReasing deMand-side and otheR low-caRbon ResouRces
bull Carbon pricing alone will have limited impact on consumer decisions to invest in permanently reducing their peak demand by making cost-effective investments in energy efficiency Well-designed time-varying pricing options can successfully shift demand from high-price hours to lower price hours54 Such shifting also reduces peak demand on transmission and distribution systems Overall energy use will decline somewhat in response to price But long-term reduction in energy use due to price increases is relatively small The numerous market barriers to capturing the full cost-effective potential of energy efficiency ndash through improvements in building construction practices and industrial processes retrofits of existing buildings and installations of high-efficiency appliances and equipment in homes and businesses ndash are well-documented They include lack of information high first-costs consumersrsquo high discount rates and the landlord-tenant split incentive problem among others55 Recent empirical analysis of demand elasticities suggests that the long-term price elasticity of demand for electricity is even lower than earlier studies have indicated for both liberalized and regulated markets (See text box on page 21)
In sum while forward capacity markets are meeting their resource adequacy objectives and clearing an impressive amount of clean low cost demand-side resources on balance these markets (as currently designed) are not working sufficiently in concert with carbon reduction goals and policies in the face of growing carbon constraints For the reasons discussed above carbon pricing alone
48 See Testimony of Richard Cowart Regulatory Assistance Project Before the Committee on Energy and Commerce Subcommittee on Energy and Environment US House of Representatives April 23 2009 ldquoThe Consumer Allocation for Efficiency How Allowance Allocations Can Protect Consumers Mobilize Efficiency and Contain the Costs of GHG Reductionrdquo at httpenergycommercehousegovPress_11120090423testimony_cowartpdf
49 See Victor Niemeyer ldquoThe Change in Profit Climate How Will Carbon-Emissions Policies Affect the Generation Fleetrdquo Public Utilities Fortnightly May 2007 at 20 24
50 See ldquoRGGI marks its first year with success and lesson on effect of market pressurerdquo Electric Utility Week Dec 14 2009 Ten Northeast and Mid-Atlantic states participate in RGGI the first mandatory cap-and-trade program in the US Connecticut Delaware Maine Maryland Massachusetts New Hampshire New Jersey New York Rhode Island and Vermont Nine of them participate in either the ISO-NE or PJM forward capacity markets described in this paper
51 PJM Interconnection ldquoPotential Effects of Proposed Climate Change Policies on PJMrsquos Energy Marketrdquo Jan 23 2009 p 5 See also ldquoBecause Thatrsquos Where the Money Is The FERCrsquos Ability to Reduce the Cost of Slowing Global Warmingrdquo Samuel A Wolfe Chief Counsel New Jersey Board of Public Utilities December 2009 at httpwwwnarucorgpublicationsWOLFE-20Panel203pdf
Demand for Power Is Relatively Price-Insensitive mdash Even Over the Long Term
Modeling by the US Department of Energy suggests that a 10 percent increase in power prices will reduce demand for electricity by just 25 percent to 3 percent over 20 years assuming that the price effects persist over that entire period56 This would only offset the normally expected US load growth in two out of those 20 years57
More recently a 2009 empirical analysis of the demand for electricity in the US concludes that price elasticity of residential demand has actually decreased since retail price deregulation was first introduced in the US The results suggest that a 10 percent increase in power prices will reduce residential electricity demand more on the order of 12 percent to 17 percent based on 2001-2008 data for both deregulated and regulated states58 Price responsiveness is further dampened by the income-elasticity of demand which is positively correlated with consumption As incomes increase consumption of electricity goes up and the conservation impact of any price increase is diminished59 The equivalent historical figure for a 10 percent increase in power prices in the UK residential sector is -23 percent but the income-elasticity is such that a 10 percent increase in income results in an increase of demand of 34 percent ndash ie household income is just as important as energy price in determining energy demand60
RegulatoRy assistance PRoject
22
is unlikely to shift the power sector resource mix at the pace or scale required to meet aggressive carbon reduction targets ndash or correspondingly to substantially change the dominance of high-carbon resources clearing forward capacity auctions under current market rules An increasing number of studies makes a compelling case that our economy and our society cannot afford this dominance to persist much longer if we are to contain climate change to a livable level In fact close to full de-carbonization of the
power sector is being discussed in international forums as the only way to meet essential carbon reduction targets by 205061 While capacity markets alone are unlikely to support the full value of clean energy resources in a carbon-constrained power sector by themselves with appropriate design elements they can serve to reinforce actions taken at federal regional and state levels that provide larger and longer lasting commitments to clean demand-side and renewable resources62
52 A tonne or metric ton is a unit of mass equal to 1000 kilograms (roughly 2205 pounds) or approximately the mass of one cubic meter of water at four degrees Celsius A tonne is not the same as either a ldquoshortrdquo ton (2000 pounds) or a ldquolongrdquo ton (2240 pounds)
53 Energy and Environmental Economics Inc Greenhouse Gas Modeling of Californiarsquos Electricity Sector to 2020 Updated Results of the GHG Calculator Version 3 prepared for the California Public Utilities Commission October 2009 pp 66-67 at httpwwwethreecomdocumentsGHG_102209CPUC_GHG_Final_Report_28Oct09pdf
54 Ahmad Faruqui and Sanem Sergici The Brattle Group ldquoHousehold Response to Dynamic Pricing of Electricity A Survey of the Experimental Evidencerdquo Jan 10 2009 at httpwwwhksharvardeduhepgPapers2009The20Power20of20Experimentation20_01-11-09_pdf
55 See for example American Council for an Energy Efficient Economy ldquoQuantifying the Effects of Market Failures in the End-Use of Energyrdquo pp iii-vi 2007 at httpoldaceeeorgenergyIEAmarketbarrierspdf This study details the various types of market barriers to end-use energy efficiency and reports that up to 50 percent of residential energy use in the US is affected by such barriers
56 The US Department of Energyrsquos National Energy Modeling System (NEMS) has price elasticity built into it The long-run elasticity (assuming price effects remain for 20 years) are ndash031 for residential electric use and ndash025 for commercial electric use See Steven H Wade ldquoPrice Responsiveness in the NEMS Buildings Sector Modelrdquo in Energy Information Administrationrsquos Issues in Midterm Analysis and Forecasting 1999 pp 55 58 table 1 at httpwwweiadoegovoiafissuespdf060799pdf
57 This would require a much larger rate increase just to offset expected load growth over 20 years let alone to reduce demand sufficiently to permit absolute reductions in emissions from the nationrsquos huge generation fleet See Testimony of Richard Cowart
58 T Nakajima and S Hamori ldquoChange in Consumer Sensitivity to Electricity Prices in Response to Retail Deregulation A Panel Empirical Analysis of the Residential Demand for Electricity in the United Statesrdquo Energy Policy (2010) available at wwwsciencedirectcom
59 Ibid
60 John Dimitropoulas Lester C Hunt and Gary Judge ldquoEstimating Underlying Energy Demand Trends Using UK Annual Datardquo at httpuserwebportacuk~judgegAEL_04pdf
61 See for example Meeting Carbon Budgets ndash The Need for a Step Change Progress Report to Parliament Committee on Climate Change October 2009 at httpwwwthecccorgukreportsprogressreports Christopher Jones and Jean-Michel Glachant Why and How the European Union Can Get a (Near to) Carbon-Free Energy System in 2050 MIT Center for Energy and Environmental Policy March 2010 at httpdownloadsthecccorgukdocs2166720CCC20Executive20Summary20AW20v4pdf Roadmap 2050 A practical guide to a prosperous low-carbon Europe The European Climate Foundation April 2010 at wwwroadmap2050eu
62 Without such policies it is unlikely that even RGGIrsquos modest carbon reduction goals will be achieved See Paul Peterson Doug Hurley and David White Synapse Energy Economics Inc ISO New England Scenario Analysis Companion Report Constructing a Future That Meets Regional Goals Aug 8 2007 at wwwsynapse-energycom
23
the Role of foRwaRd caPacity MaRkets in incReasing deMand-side and otheR low-caRbon ResouRces
ISO-NE Rules for Emergency Generators Advance Environmental Goals
Emergency (ldquobackuprdquo) generators typically are diesel-fired and states in New England and elsewhere in the US have restricted the number of hours and days they may be operated through the state permitting process At the time the first regional demand response tariffs were being designed in New England a collaborative of energy regulators environmental regulators the ISO utilities and other stakeholders realized that active demand response programs could lead to substantial incentives for diesel-fired backup generators to operate more often when air quality was at its worst Regulators and the ISO proposed a rule limiting those generators to run for reliability purposes during system emergencies This is a concrete example of reliability rules being written to advance environmental goals as well as power system needs63 In addition a regional working group developed model emissions standards for small generators for statesrsquo consideration64
To reinforce regional air quality policies and goals ISO-NE limits the total amount of emergency generators in the regional capacity market to 600 MW To the extent any excess amount clears the auction capacity payments to these resources are pro-rated
63 See Cowart and Raab p 26
64 See Model Regulations for the Output of Specified Air Emissions From Smaller Scale Electric Generation Resources Oct 31 2002 at httpwwwraponlineorgshowpdfaspPDF_URL=22docsrap_issuesletter-outputbasedemissioninsert_2003_07pdf22
65 Edward S Rubin Carnegie Mellon University ldquoA Performance Standards Approach to Reducing CO2 Emissions for Electric Power Plantsrdquo June 2009 at httpwwwpewclimateorgpublicationsreportcoal-initiative-series-performance-standards-approach-reducing-co2-emissions-ele Also see Chris Simpson and Brenda Hausauer ldquoEmissions Performance Standards in Selected Statesrdquo Regulatory Assistance Project Research Brief November 2009 at httpwwwraponlineorgdocsRAP_Simpson_EPSResearchBrief_2009_11_13pdf
Policy Recommendations and Auction Design Options
We present below recommendations and a menu of auction design options for forward capacity markets that support and enhance carbon policies and carbon reduction targets
bull Power market rules should be constructed to recognize and limit the adverse environmental consequences of power generation The power system and the environment are inextricably linked Explicit consideration of environmental costs and benefits of various electricity resources is not only reasonable but necessary to meet the enormous challenge of climate change
bull Forward capacity markets should reinforce carbon reduction policies which could be accomplished by incorporating one or more of the following into the auction rules
Auction rules could apply an Emissions Performance Standard (EPS) to promote capacity commitments from low-carbon resources and discourage bids from high-emitting power plants An EPS can be expressed as a maximum level of greenhouse gas emissions per unit of electrical output or as a percentage reduction in (annual) plant emissions It can vary with fuel type and incorporate other design variations65 It may be appropriate to adopt an EPS mdash within the auction qualification rules or by regulation mdash particularly if current market signals are not sufficiently
discouraging new construction or repowering of high-emitting generating resources with long lifetimes while forward capacity markets are providing a new revenue stream to keep them running
RegulatoRy assistance PRoject
24
Auction rules could disqualify inefficient generators from participating (and from receiving capacity revenue) or more generally require their retirement through financial incentives regulations or both66 Since 2007 China has been phasing out such plants and intends to retire approximately 50 gigawatts (GW) of small inefficient coal-fired power plants nationwide and 7 GW to 10 GW of small natural gas-fired units as well as halt construction of small inefficient power plants The policy is being put in place three ways the direct rescission of operating permits the transfer of generation rights and price reductions
Capacity payments could vary by the emissions rate of the resource Instead of one price paid to all generation that clears the auction adders could be applied to payments for low-emitting units and deductions could be applied to high-emitting units67 For example a sliding-scale percentage reduction to the per-unit ($kW-month or $MW-day) clearing price could be established based on the average annualized carbon footprint of fossil-fuel resources whereas a price adder above the clearing price could be established for zero-emitting resources
Imputed ldquocarbon addersrdquo could help curtail high-emitting resources Carbon adders are imputed costs that reflect at least a portion of the societal cost of emissions They are generally
used in the context of resource planning and acquisition by a regulated LSE mdash as a way of ensuring that high-carbon risks and low-carbon alternatives are properly valued in the resource selection process But these imputed costs do not get passed on to ratepayers or consumers for every unit of power consumed in contrast to carbon pricing68 Similarly the rules in a forward capacity market could be modified so that carbon adders are applied in determining what resources clear the auction (and will receive the market clearing price for their capacity commitment)
A ldquozero-carbon resource portfolio standardrdquo could establish auctions for separate tranches of resources by emissions level For example one tranche could include energy efficiency and renewable resources The size of each tranche would be based on carbon reduction goals for the region The higher the goals the larger the tranche for energy efficiency and renewable resources These resources decrease carbon emissions because at the margin most power systems are running higher carbon resources
bull Policymakers should consider a longer price commitment in forward capacity markets mdash at least for low-carbon resources The contract period for new capacity in these markets is short (one year in PJM up to five years in ISO-NE) in part so there is greater certainty over forecasts of resource needs for system reliability (to mitigate the risk of over-supply)
66 Small and old coal plants are the most inefficient and polluting both in terms of greenhouse gases and particulate matter By some estimates 50 MW plants may use as much as 200 grams more per unit of electricity output than a plant larger than 300 MW See Frederick Weston Rebecca A Schultz David Moskovitz and Max Dupuy Regulatory Assistance Project ldquoChinarsquos Climate Change Initiatives Do new policies adopted in China offer any guidance for the transformation of the US power sector in a carbon-constrained worldrdquo November 2009 at httpwwwraponlineorgdocsRAP_China20Climate20Initiatives_NARUC_2009_11_01docx
67 See N Jonathan Peress and Kenneth A Colburn ldquoElectrical Connections Aligning Capacity Market Changes With RGGI in the Northeastrdquo Discussion Draft March 2005 at httpwwwpucnhgovEPABSymbiotic202005-03-1820Peress-Colburn20Letter20to20FERC-Woodpdf
68 Both high carbon resources and low carbon resources clearing in power markets (characterized by single-price auctions) are paid the same price So whenever fossil resources are on the margin (most of the time in most places) consumers are seeing the same price for both fossil and clean resources and the cost of carbon allowances (or carbon taxes) for that marginal resource is reflected in the clearing price for all power bought in the market Carbon adders on the other hand are not actually paid to any resource or reflected in prices for all units sold in the market
25
the Role of foRwaRd caPacity MaRkets in incReasing deMand-side and otheR low-caRbon ResouRces
Auction winners can generally participate in future auctions and receive the market clearing price but have no assurance of future prices Moreover under current rules in PJM energy efficiency resources cannot receive capacity payments over the full life of the measures mdash only for four consecutive delivery years This constraint puts energy efficiency on a different footing than other demand resources mdash as well as all supply-side resources mdash which are paid for their capacity as long as they provide the benefit
The short commitment period and lack of price certainty may not provide market signals that are strong and consistent enough to ensure sufficient new generation or encourage plant operators and investors to make efficient choices for the long-term mdash even where carbon prices are expected to increase substantially in the future due to a dramatically declining carbon cap or a high carbon tax Allowing clean resources to opt for a longer period of time over which the price is known would in particular facilitate renewable resources whose typically high upfront capital costs and low operating costs mdash compared to natural gas-fired plants in particular mdash may require such a long-term commitment to procure financing69 Another option might be to establish fixed floor prices for clean energy resources for a long-term period to provide assurance of a minimum revenue stream
bull Regional load forecasting should be reviewed for treatment of demand-side resources acquired outside the capacity market In particular the system operator determines the capacity that will be auctioned for each delivery year (three years hence) based on a 10-year load forecast which is updated on
an annual basis Under the current planning process in forward capacity markets this forecast only reflects the demand-side resources that have cleared in prior auctions The system operatorrsquos load projections do not take into consideration any load reductions from demand-side resources procured outside of the auction such as energy efficiency programs that LSEs have committed (or are obligated) to fund and implement in the coming one to three years or beyond70 If the magnitude of these load reductions is substantial the ISO may be systematically overstating the level of capacity put out to bid for each delivery year Depending upon the existing mix of resources and market conditions in the region this overstatement may have a sizeable impact not only on the level of cleared capacity and the market price but on the resulting resource mix and level of carbon emissions as well
Additional Actions
Careful design of the planning process and auctions undertaken through forward capacity markets can help to ensure that they reinforce and do not work at cross purposes with climate reduction goals and targets However forward capacity market signals (capacity prices) are only one component of a market and regulatory landscape that affects investment and operating decisions in the power sector Market rules and procurement policies that affect system energy requirements ndash as well as policies and regulations that affect access location and cost recovery for transmission and distribution facilities ndash have an enormous impact on both the short- and long-term resource mix
It is beyond the scope of this paper to fully explore how
69 LSEs in PJM and ISO-NE can contract for generating resources through the bilateral market to hedge energy and capacity costs and to meet renewable energy standards Renewable resource projects that successfully negotiate such contracts if they are long term may not need a long-term commitment in the forward capacity market Still a short-term capacity payment stream with uncertain prices thereafter weakens the ability of renewable resources to secure long-term financing
70 Some of the econometric models that the system operators use for their load forecasts may capture the impacts of federal appliance standards and building codes However to our knowledge there has been no explicit accounting to date for the impacts of state and utility energy efficiency programs where the capacity is not bid into the auctions
RegulatoRy assistance PRoject
26
market rules and other policies and regulations can be harmonized and strengthened to meet customersrsquo energy needs reliably in a carbon-constrained world Larger and longer lasting commitments to demand-side and renewable resources are certainly needed to ensure a mix of resources that will significantly reduce greenhouse gas emissions in the power sector This has been the conclusion of US policymakers who have put in place additional policies to facilitate long-term acquisition of low-carbon resources in regions that operate both forward capacity markets and a cap-and-trade program (under RGGI)71
bull States have adopted a variety of mechanisms for sustained and aggressive energy efficiency programs
bull Strong building codes and equipment standards
bull Stable funding through a system benefit charge
bull Third-party administration of programs or where the utility is the efficiency portfolio manager decoupling of utility profits from revenues financial incentives for shareholders or both
bull Recycling of carbon auction proceeds into energy efficiency investments
bull Some states require long-term resource plans or resource procurement plans that must include energy efficiency Therersquos renewed interest in long-term planning and procurement particularly for demand-side and renewable resources following a period
where these efforts were largely abandoned with electric industry restructuring and development of organized markets72
bull Several states have adopted energy efficiency resource standards that require achievement of specified energy-saving targets73
bull Most of the states have renewable energy standards74 and several states require long-term contracting of renewable resources to meet the standards75
bull Connecticut Maryland Pennsylvania and Rhode Island require contract terms of 10 years or longer
bull New York requires central procurement of renewable energy credits by a state agency under long-term contract Illinois is likely to acquire long-term contracts for renewable resources under its central procurement mandate
bull Massachusettsrsquo Green Power Partnership purchases renewable energy credits for up to 10 years using its renewable energy fund
These are just examples and certainly not an exhaustive list of the ways in which careful design of forward capacity markets coupled with additional policies at the federal regional and state level can serve to reinforce both resource adequacy requirements and carbon reduction goals
71 Regulatory Assistance Project policy grids summarize state-by-state requirements for resource planning and energy efficiency at httpwwwraponlineorgFeatureaspselect=116 For a summary of renewable energy standards in the US see Ryan Wiser and Galen Barbose Lawrence Berkeley National Laboratory ldquoState of the States Update on RPS Policies and Progressrdquo State-Federal RPS Collaborative Nov 18 2009 at httpwwwcleanenergystatesorgMeetingsRPS_Summit_09WISER_RPS_Summit2009pdf
72 More broadly 30 states nationwide require integrated resource plans or resource procurement plans that include energy efficiency
73 Includes states with strict energy efficiency standards states with Commission-ordered efficiency targets states that allow efficiency to count toward renewable energy standards and states with a rate cap that triggers a relaxation of requirements See Laura A Furrey Steven Nadel and John A ldquoSkiprdquo Laitner ACEEE Laying the Foundation for Implementing a Federal Energy Efficiency Resource Standard March 2009 at httpaceeeorgpubse091htm
74 Some 29 US states and the District of Columbia have renewable energy standards five other states have non-binding goals See Wiser and Barbose
75 For a US database of state incentives for renewable energy and energy efficiency see httpwwwdsireusaorg
27
the Role of foRwaRd caPacity MaRkets in incReasing deMand-side and otheR low-caRbon ResouRces
An example of an approach that attempts to ldquomarryrdquo integrated least-cost resource planning with forward capacity markets is the resource planning and procurement process recently established by the Connecticut Legislature76 The law requires the utilities Energy Advisory Board and Department of Public Utility Control to plan for current and future energy and capacity needs and provide a mechanism for procuring resources that meet specified economic reliability and environmental objectives77 to satisfy the identified need Further the law requires that resource needs first be met through energy efficiency and demand reduction resources that are cost effective reliable and feasible Based on the resulting resource plans LSEs enter into
contracts to acquire the required capacity (level and mix) through a competitive bidding process The law also requires that any resources winning contracts for capacity agree to let the LSE bid that capacity into the forward capacity auction as a ldquoself-suppliedrdquo resource This approach permits LSEs to determine both the quantity and mix of resources through integrated resource planning that will meet their resource adequacy requirements and state policy goals (eg carbon reduction) The LSE pays the contracted capacity price (under its bilateral contracts) instead of paying the auction clearing price to everyone that offers capacity into the forward capacity market (eg existing fossil fuel or nuclear plants)78
Connecticutrsquos Marriage of Resource Planning and Markets
76 Conn Gen Stat sectsect 16a-3a 16a-3b and 16a-3c
77 Costs and benefits cost-effectiveness cost impacts on customers the extent to which load growth can be eliminated and peak demand reduced reliability including energy security and economic risks impacts on meeting state environmental standards including emissions goals optimization of existing generation and generation sites the extent to which renewable resources can be used to meet needs and fuel types diversity and supply See Department of Public Utility Control Final Order in Docket No 08-07-01 Feb 18 2009
78 This approach is not without some controversy A contracted new resource in Connecticut has the potential to displace an alternative ldquocompetitiverdquo new resource in the region that would have bid at a higher price mdash had Connecticut not been allowed to designate the contract as self-supply ISO-NErsquos Internal Market Monitoring Unit has commented on this issue in a report to FERC See Internal Market Monitoring Unit ISO-NE June 5 2009
RegulatoRy assistance PRoject
28
Conclusions and Recommendations
Auction-based capacity markets in the US have been successful to date in attracting the capacity needed to maintain system reliability in an economically efficient manner In particular these markets have been successful in facilitating new demand-side resources
with ratepayers and society reaping the economic and environmental benefits However policymakers also should consider capacity markets in the context of carbon reduction policies and targets for the power sector Even markets that successfully integrate demand-side and renewable resources into the auction process are still encouraging the construction or continued operation of high-emitting supply-side resources to meet reliability targets
Existing capacity markets should be evaluated to assess whether the market is responding in this way And if it is policymakers need to critically assess whether a continuation of that market response over the coming years will make it possible to achieve the cumulative level of carbon reductions required from the power sector to avoid the worst effects of climate change Depending on the results of this inquiry policymakers may need to refine the auction rules and adopt additional policies for the power sector mdash such as those described in this paper mdash to ensure the alignment of capacity markets with both short- and long-term carbon reduction goals
More generally forward capacity markets create a revenue stream for resources that can commit to being available at times of system peak several years in the future mdash but this financial incentive is clearly not the only factor driving the mix of resources in the power sector and their resulting carbon footprint Market rules policies and regulations that affect investment and operating decisions for meeting the systemrsquos energy requirements mdash as well as those that affect access location and cost recovery for transmission and distribution facilities mdash have an enormous impact on both the short- and long-term resource mix in the electric system Policymakers will need to consider how this entire market and regulatory landscape mdash including forward capacity markets mdash can be strengthened and harmonized to reliably meet customer demand for electricity in a carbon-constrained world
29
the Role of foRwaRd caPacity MaRkets in incReasing deMand-side and otheR low-caRbon ResouRces
Cleared capacity values in the following tables represent all capacity committed by existing resources remaining in the market and all new resources that bid into the auction at or below
the market clearing price Cleared capacity includes ldquoself-suppliedrdquo or ldquoself-scheduledrdquo resources entered into the auction by LSEs However as described in this paper when the monthly billingsettlement process is completed the capacity charges allocated to the LSE will be offset (credited) for the cleared capacity delivered by these resources
Incremental capacity in the tables below reflects 1) new generation resources 2) capacity upgrades to existing generation resources 3) partial offsets to
incremental generation capacity due to capacity de-ratings to existing generation resources 4) new demand response resources 5) upgrades to existing demand response resources and 6) new energy efficiency resources
PJM Results79
PJM has conducted five Base Residual Auctions since its inception in 2007 for delivery years beginning in 20082009 (that each run from June 1 to May 31) Capacity cleared in the PJM auction is defined in terms of ldquounforcedrdquo capacity that is the capacity of a resource adjusted for availability and deliverability based on historical performance (eg forced outages)
Appendix 1
Detailed Results for PJM and ISO-NE Capacity Markets
Table 1 Generation Demand Resources and Energy Efficiency Resources
Offered and Cleared in PJM Base Residual Auctions (Unforced Capacity in MW)
Delivery Year 20082009 20092010 20102011 20112012 20122013
Generation Offered 1311648 1326142 1321248 1360679 1348730
DR Offered 7158 9368 9679 16524 98476
EE Offered - - - - 6527
Total Offered 1318806 1335510 1330927 1377203 1453733
Generation Cleared 1290614 1313389 1312515 1308566 1285274
DR Cleared 5362 8929 9390 13649 70473
EE Cleared 00 00 00 00 5689
Total Cleared 1295976 1322318 1321905 1322215 1361436
Energy efficiency resources were first eligible in the 20122013 auction
79 All information for PJM compiled from ldquo20122013 RPM Base Residual Auction Resultsrdquo at httpwwwpjmcom~mediamarkets-opsrpmrpm-auction-info2012-13-base-residual-auction-report-document-pdfashx
RegulatoRy assistance PRoject
30
Table 2 Incremental Capacity Additions and Reductions in PJM Base Residual Auctions(Installed Capacity in MW)
Delivery Year 20072008 20082009 20092010 20102011 20112012 20122013 Total
Increase inGenerationCapacity 6020 7242 12723 17762 35763 18935 98445
Decrease inGenerationCapacity -6746 -3754 -5502 -3018 -2647 -32539 -54206
Net Increase inDemand ResourceCapacity 5550 5747 2150 287 6617 79381 99732
Net Increasein EnergyEfficiency Capacity 0 0 0 0 0 6323 6323
Net Increasein InstalledCapacity 4824 9235 9371 15031 39733 72100 150294
Note Change in generation capacity is cumulative net increase in demand-side resources is relative to previous yearrsquos Base Residual Auction
Table 3 Breakdown of Incremental Capacity Resource Additionsin PJM Base Residual Auctions (Installed Capacity in MW)
Delivery Year CTGT Combined Diesel Hydro Steam Nuclear Solar Wind Total Cycle (Coal)
New 20072008 187 03 190Capacity 20082009 270 661 931Units 20092010 3995 238 530 4763 20102011 2833 5800 230 1414 10277 20112012 4164 11350 7048 11 752 23325 20122013 4038 5850 78 363 751 11080
Capacity 20072008 470 470From 20082009 1310 1310Reactivated 20092010 0Units 20102011 1600 107 1707 20112012 800 1010 1810 20122013 0
Uprates to 20072008 1145 139 800 2356 920 5360Existing 20082009 1082 340 180 1055 1960 384 5001Capacity 20092010 1522 2060 1625 614 1974 165 7960Resources 20102011 1173 1630 480 892 1603 5778 20112012 3692 1486 574 1868 2921 87 10628 20122013 2312 1643 142 1930 1260 568 7855
Total 28356 30159 2145 3963 20351 9062 11 4398 98445
Note Values represent capacity commitments Nameplate ratings of variable resources (solar and wind) are far larger than shown here
31
the Role of foRwaRd caPacity MaRkets in incReasing deMand-side and otheR low-caRbon ResouRces
Table 4 Changes to Generation Retirement Decisions
Since Reliability Pricing Model Approval (Unforced Capacity in MW)
Generation Resource Decision Changes Capacity Cleared
Withdrawn Deactivation Requests 17987
Postponed or Cancelled Retirement 13029
Reactivation 1752
ToTal 3276 8
Note Unforced capacity cleared in Base Residual Auctions from resources that withdrew their request to deactivate postponed retirement or were reactivated (ie came out of retirement or mothball state)
Table 5 PJM Base Residual Auction Clearing Price
Delivery Year Clearing Prices ($MW-day)
20072008 $4080
20082009 $11192
20092010 $10204
20102011 $17429
20112012 $11000
20122013 $1646
Note Values do not include any locational price adders Simple conversion of $MW-day to $kW-month multiply by 3 and divide by 100
Table 6 Effect of Demand-Side Resources on PJM Market Clearing Price
20122013 Base Residual Auction80
Actual Auction Results Calculated Results Without Demand-Side Resources
Clearing Prices Cleared Unforced Clearing Prices Cleared Unforced Savings
($MW-day) Capacity (MW) ($MW-day) Capacity (MW) ($MW-day)
$1646 1361435 $17878 1335682 $16232
80 Bowring Monitoring Analytics Table 20
RegulatoRy assistance PRoject
32
ISO-NE ResultsISO-NE has held three forward capacity auctions to
date The first auction (FCA 1) in February 2008 was for capacity delivery beginning in June 2010 (20102011 delivery year) The second auction (FCA 2) was held in December 2008 for delivery in 20112012 and the third
Table 7 Summary Results for ISO-NE Capacity Auctions81
Net Installed Total Resources Excess Clearing Net Price Capacity Cleared Capacity Price ($kW-month)82
Requirement (MW) (MW) ($kW-month)
FCA 1 32305 34077 1772 $450 $425
FCA 2 32528 37283 4755 $360 $312
FCA 3 31965 36996 4649 $295 $254
Table 8 Demand-Side Resources Cleared in ISO-NE Capacity Auctions (MW)81
Distributed Distributed Energy Real-Time Demand Real-Time Total Generation- Generation- Efficiency ResponseLoad Emergency Demand-Side Fossil Fuels Renewable Resources Management Generation Resources
FCA 1 46 lt02 655 978 875 2554
FCA 2 93 lt02 890 1195 759 2937
FCA 3 86 07 975 1206 630 2898
auction (FCA 3) was held in October 2009 for delivery in 20122013 ldquoClearedrdquo amounts in these tables include resources from earlier auctions that remain listed as well as new resources less resources that drop out
Note Net Installed Capacity Requirement values exclude the interconnection benefits associated with the Hydro-Queacutebec Phase III interface Excess capacity is not adjusted for Real-Time Emergency Generation in excess of the 600 MW limit Net prices reflect prorating of clearing prices due to excess capacity clearing the auction Simple conversion of $kW-month to $MW-day divide by 3 and multiply by 100
Note Demand-side values are grossed-up for avoided transmission and distribution losses and reserve margin (no reserve margin forFCA 3) Total resources cleared include excess capacity above the Net Installed Capacity Requirement Real-time emergency generation refers to distributed generation whose state air quality permit limits operation to ldquoemergencyrdquo conditions See Appendix 3
81 ISO-NE Forward Capacity Market Results at httpwwwiso-necommarketsothrmkts_datafcmcal_resultsindexhtml
82 Communication with Henry Yoshimura director Demand Resource Strategy ISO-NE March 2009
83 Eric Winkler ISO-New England ldquoThird Regional Energy Efficiency Initiative Meetingrdquo July 7 2009 and ldquoFCA Updaterdquo Demand Response Working Group Meeting Dec 2 2009 Total resources cleared (Capacity Supply Obligation) from Forward Capacity Market Auction Results for the 20102011 20112012 and 20122013 auctions at httpwwwiso-necommarketsothrmkts_datafcmcal_resultsindexhtml
33
the Role of foRwaRd caPacity MaRkets in incReasing deMand-side and otheR low-caRbon ResouRces
Step 1
System Operator (SO) Plans ldquoForwardrdquo for the Region
2012 Projection of Peak Demand = 10000 MW (incl reserves) Each ldquoLoad Serving Entityrdquo (LSE) is obligated for its 50 share
Appendix 2
Illustration of ldquoHow Forward Capacity Markets Workrdquo
SO purchases capacity in 2012 at the 2009 auction clearing price
LSE can be regulated utility or competitive retail supplier
LSE1 5000 MW
LSE2 5000 MW
R1
R1 =3500 MW capacity ldquoSelf Supplyrdquo Resources (LSE1 ownedunder contract)
RegulatoRy assistance PRoject
34
Step 2
The Regional Capacity Auction (3 Years ldquoForwardrdquo)
Step 3
System Operator Pays Cleared Resources at P and Bills LSEs(Note Self-Supply capacity is a ldquowashrdquo)
R1 R2 R3 R4 R5 R6 R7
P
R1
R3
R3
R5
R5
R2
R2
R4
R4
R6
R7
Bid Price = $ per MW-day
Quantity = MW
6500 MW P
Cleared Capacity = 10000
Supply = Capacity Committed ldquoForwardrdquo
P= Clearing price paid to all capacity clearing auction
Demand = SO Forecast of Capacity Requirements
R1-R7 = Capacity offered by Supply-Side (New built Existing Uprates) and Demand-Side (Energy Efficiency Demand Response Distrib Gen) Self-supply (R1) bids in a ldquozerordquo price New Resources set clearing price
LSE1 5000 MW
LSE2 5000 MW
R1
SOSO pays R1 3500 MW P
LSE2 pays its share of regional demand
5000 MW P
LSE1 pays its share of regional demand (5000 MW) adjusted for self-supply R1 for a net payment of 1500MW P
R1 = 3500 MW of ldquoSelf-Supplyrdquo Resources (LSE1 ownedunder contract)
In 2010Total regional peak demand of 10000 MW supplied by R1 + R2 + R3 + R4 + R5 LSE1 and LSE2 are each responsible for 50 of regional peak demand
35
the Role of foRwaRd caPacity MaRkets in incReasing deMand-side and otheR low-caRbon ResouRces
PJM Eligibility Requirements
Eligibility of demand-side resources has changed significantly over the years in PJMrsquos capacity markets In particular it was not until the most recent capacity auction (May 2009) for the
20122013 delivery year that energy efficiency became eligible to bid in PJMrsquos Base Residual Auction PJM is currently considering a tariff change to also allow energy efficiency to bid into incremental auctions
Under PJMrsquos eligibility rules an energy efficiency resource must achieve a ldquopermanentrdquo continuous reduction in electric energy consumption Examples of such a resource include lighting retrofit programs for residential commercial and industrial customers and programs to retrofit buildings with heating and cooling systems that exceed current efficiency standards To be eligible an energy efficiency resource must meet the following criteria
bull It is fully implemented throughout the delivery year without any requirement of notice dispatch or additional customer action
bull It is not reflected as a reduction in the peak load forecast used for the Base Residual Auction for the proposed delivery year
bull It exceeds relevant standards (such as building codes or appliance standards) at the time of commitment
bull It achieves the specified load reduction (expected average demand in MW) during defined summer on-peak hours84
Demand response on the other hand must be dispatchable mdash that is customer demand must be reduced when instructed For example a large supermarket with
coolers and freezers could install load management equipment that would cycle them on or off mdash and bid that demand response capability into the market85 More specifically a demand response resource must meet the following criteria
bull It is able to reduce demand for electricity up to 10 times each year for up to six consecutive hours per interruption during defined periods86
bull It is fully implemented within one hour (short lead time) or two hours (long lead time) of notice from PJM
bull In a year without calls for demand reductions it must demonstrate reliability through a test of reduction capability
bull It is registered in the Emergency Load Response Program and thus available for dispatch during PJM-declared emergency events
bull Compliance and status reports are filed as required
Multiple end-use customers can be aggregated in order to submit a single demand response offer in the capacity auction if those customers share the same curtailment service provider electric distribution company and transmission zone
In addition customer-sited distributed generation may be offered into auctions as a demand resource A hospital for example could offer to run its back-up generator on certain peak demand (eg hot summer) days to reduce its load on the system Or an industrial plant could cut back on production on such days and continue to run its on-site combustion or steam-cycle turbine
Currently energy efficiency resources may participate
Appendix 3
Eligibility Requirements for Demand-Side Resourcesin US Capacity Markets
84 Weekdays excluding holidays June through August between the hours ending 1500 and 1800 Eastern Prevailing Time (EPT)
85 If instead the supermarket replaced the existing coolers and freezers with more energy efficient ones it would bid that proposal in as an energy efficiency resource Or it could do both (replace and cycle) and bid in the capacity from the permanent savings (replacements) as energy efficiency and the dispatchable capacity (the cycling) as demand response
86 Weekdays excluding holidays from 1200 to 2000 EPT May through September and 1400 to 2200 EPT October through April
RegulatoRy assistance PRoject
36
in Base Residual Auctions for up to four consecutive delivery years In effect this means that PJM limits capacity payments for efficiency measures to four years of their measure life (rather than for the full measure life)87 In contrast a demand response resource (including distributed generation) can participate in the PJM capacity market for as long as its ability to reduce demand continues
ISO-NE Eligibility RequirementsSince the inception of ISO-NErsquos forward capacity market
in 2006 energy efficiency has qualified as an eligible demand-side resource ISO-NE defines demand resources as installed measures (products equipment systems services practices and strategies) that result in verifiable reductions in end-use consumption of electricity in the New England power system These are further categorized into ldquopassiverdquo (energy efficiency and non-dispatchable distributed generation) and ldquoactiverdquo (demand response emergency generation and dispatchable distributed generation) resources Passive demand resources are non-dispatchable but permanently reduce energy demand during peak hours Active demand resources are designed to reduce peak loads and to reduce load based on real-time system conditions or ISO-NE instructions Following are descriptions of eligible demand-side resources and performance requirements88
Passive Demand Resourcesbull On-Peak Demand Resources are measures that are
not weather-sensitive and reduce demand across a fixed set of on-peak hours such as energy-efficient commercial lighting and motors89
bull Seasonal Peak Demand Resources are weather-sensitive measures that reduce load during high-demand conditions such as energy-efficient heating and air conditioning systems Seasonal Peak Demand Resources must reduce load when actual system load is equal to 90 percent of the most recent peak load forecast for the applicable summer or winter season
Active Demand Resourcesbull Real-Time Demand Response Resources are
measures including load management and distributed generation that can be dispatched by ISO-NE as needed They must curtail electrical usage within 30 minutes of receiving a dispatch instruction and until receiving a releaserecall dispatch instruction
bull Real-Time Emergency Generation is distributed generation whose state air quality permit limits operation to ldquoemergencyrdquo conditions Generators must curtail the customerrsquos electrical usage within 30 minutes of receiving a dispatch instruction and until receiving a releaserecall dispatch instruction The amount of emergency generation that can be used to meet ISO-NErsquos capacity requirement is limited to 600 MW If the amount of real-time emergency generation that clears the auction exceeds this level payments to generators are reduced on a pro-rated basis All real-time emergency generation is treated as existing capacity
In contrast to PJM all demand-side resources in ISO-NE are eligible to bid capacity for their full measure life an approach that recognizes the full contribution of these resources to regional resource adequacy requirements and adds value to long-lived energy efficiency assets
87 FERC has directed PJM to evaluate the impact of its capacity payment period for energy efficiency resources
88 Eric Winkler and Abimael Santana ISO-NE ldquoNew Demand Resource Qualificationrdquo May 5 2009 at httpwwwiso-necomsupporttrainingcoursesfcmfcm_forum_may_5pdf
89 Summer on-peak hours are 1300 to 1700 non-holiday weekdays in June July and August Winter on-peak hours are 1700 to 1900 non-holiday weekdays in December and January
The Regulatory Assistance Project (RAP) is a global non-profit team of experts that focuses on the long-term economic and environmental sustainability of the power and natural gas sectors providing technical and policy assistance to government officials on a broad range of energy and environmental issues RAP has deep expertise in regulatory and market policies that promote economic efficiency protect the environment ensure system reliability and fairly allocate system benefits among all consumers We have worked extensively in the US since 1992 and in China since 1999 and have assisted governments in nearly every US state and many nations throughout the world RAP is now expanding operations with new programs and offices in Europe and plans to offer similar services in India in 2011 RAP functions as the hub of a network that includes many international experts and is primarily funded by foundations and federal grants
Home office
50 State Street Suite 3Montpelier Vermont 05602
802-223-8199wwwraponlineorg

RegulatoRy assistance PRoject
4
demand resources to meet future capacity requirements However experience to date also makes a strong case that more is needed in a carbon-constrained world where the total mix of resources is as important as the total quantity both in the short- and long-term In particular construction and continued operation of high carbon-emitting supply-side resources dominate the mix of capacity clearing these auctions and therefore these resources are receiving the bulk of market incentives (capacity payments) The results of recent studies mdash as well as market experience mdash also suggest that carbon pricing alone is unlikely to reduce this dominance in forward capacity markets (or in energy-only markets) at the pace or scale required to meet aggressive carbon reduction targets
In light of these observations we pose the following question to policymakers How can the planning and procurement process through forward capacity markets be strengthened to work in concert with carbon reduction goals and policies rather than at cross purposes This paper suggests a menu of options that could reduce carbon emissions from the power system by
bull Providing premium capacity payments to low-carbon resources
bull Selecting auction winners based on level of carbon emissions as well as bid price
bull Making capacity payments only to those resources with low- or zero-carbon emissions
bull Phasing out capacity payments to existing high-emitting resources
bull Allowing a longer price commitment or establishing fixed-capacity floor prices for low-carbon resources
bull Properly considering energy efficiency in load forecasts that set auction capacity needs
bull Refining existing market rules as needed to ensure that energy efficiency can fully compete on an equal basis with power generators including distributed generation11
More generally forward capacity markets create market incentives in the form of capacity payments for resources that can commit to being available at times of system peak beginning several years into the future But these capacity
payments are clearly not the only factor driving the mix of resources to meet customersrsquo current and future electricity needs Existing market rules and procurement policies that affect the mix of resources meeting the systemrsquos energy requirements mdash as well as policies and regulations that affect access location and cost recovery for transmission and distribution facilities mdash have enormous impact on both the short- and long-term resource mix in the power sector
It is beyond the scope of this paper to fully explore how market rules regulations and policies can be harmonized and strengthened to meet customersrsquo energy needs reliably in a carbon-constrained world Nonetheless we observe that many states in the US including those where forward capacity markets and carbon pricing currently exist have made large and long lasting commitments to demand-side and renewable resource procurement through additional policies and regulations These include
bull Strong energy efficiency codes and equipment standards
bull Stable and sustained funding to provide audits financial incentives and financing for home and business efficiency improvements including through carbon auction revenues
bull Energy efficiency resource standards that require achievement of specified energy-saving targets
bull Renewable energy standards that require meeting a percentage of energy consumption with renewable resources along with long-term contracting requirements in some cases
bull Decoupling of utility profits from revenues financial incentives for shareholders or both where the utility is the efficiency portfolio manager mdash or performance contracting with third-party administrators to deliver comprehensive large-scale efficiency programs
bull Complementary resource planning and procurement practices designed to increase the mix of demand-side and renewable resources that can meet resource adequacy requirements
Finally we recognize that not all regions will create capacity markets for the purpose of addressing resource
11 For example energy efficiency resources that clear the PJM auction cannot receive capacity payments for more than four delivery years whereas under the ISO-NE market rules these resources are eligible to receive payments over the full life of the installed measures All other resources are eligible to participate in these capacity markets for as long as their ability to reduce demand or generate power continues
5
the Role of foRwaRd caPacity MaRkets in incReasing deMand-side and otheR low-caRbon ResouRces
adequacy needs and we do not attempt to evaluate in this paper whether they should The evolution of capacity markets in certain regions of the US has its own and unique history (See text box) Establishing forward capacity markets and their associated auctions involves complex market rules and a myriad of market design choices along the way all with major implications for the relative costs and benefits to consumers and resource providers Options for addressing resource adequacy needs that do not involve the development of a capacity market should also be explored by policymakers particularly in the context of a carbon-constrained power sector The starting point of this paper however is that such markets already exist (or are in the planning stages) It is within this context that we offer our observations and recommendations
Resource Adequacy in the US
In the US resource adequacy refers to the ldquoability of the electric system to supply the aggregate electrical demand and energy requirements of the end-use customers at all timesrdquo mdash in effect to provide reliable supply 9997 percent of the time12 This high standard of reliability reflects the unique ldquoserve all or serve nonerdquo nature of the electric system If it falls short in meeting even one customerrsquos power needs all customers relying on that electric circuit are literally left ldquositting in the darkrdquo Contrast this with other goods and services sold to consumers mdash for example milk sold at a grocery store If there are only 15 cartons of milk on the shelf and 16 customers come in at the same time to purchase milk only one customer walks away empty handed (and that person could at least find a substitute product at the store to quench hisher thirst) In contrast if that product were kilowatt-hours and peak demand (or peak load) exceeds the ability of the system to generate electricity at that time then the store ldquoshuts downrdquo and all customers walk away empty-handed
To ensure against such an outcome utilities and other companies that sell electricity in the US and in many other power markets in the world are obligated to own or purchase enough capacity to reliably meet their customersrsquo peak demands (ldquoloadsrdquo) We call them ldquoload-serving entitiesrdquo or ldquoLSEsrdquo and unless otherwise noted do not distinguish between regulated LSEs (eg distribution utilities) and non-regulated LSEs (retail electricity suppliers) In either case the LSErsquos resource obligation in a forward capacity market is expressed in terms of its share of projected capacity needs for the region several years in the future
An electric system must perform three functions well to ensure resource adequacy mdash that is to ensure that there is sufficient capacity committed to meeting customersrsquo peak loads at all times These are
1) Estimate when the peak loads are likely to occur and the level of capacity commitment needed to reliably meet them13
2) Obligate LSEs to have sufficient capacity available to them during those projected periods of peak loads
3) Put policies and rules in place to ensure that sufficient resources will commit capacity to operate (or to reduce loads) during these periods both in the short- and long-run
In other words ensuring resource adequacy involves a planning process (what level of capacity commitment is needed and when) and a procurement process (how to acquire it) that focus on the quantity and timing of resources but not the mix of resources required to meet system reliability The attribute a resource is required to demonstrate for resource adequacy purposes is that its obligated capacity will be available when called upon during the projected hours of peak system loads Resource adequacy rules are indifferent to other attributes including environmental attributes of resources
12 North American Electric Reliability Corporation Glossary of Terms Used in Reliability Standards April 20 2009 at httpwwwnerccomdocsstandardsrsGlossary_2009April20pdf Put another way resource adequacy means having sufficient electric supply resources in place to maintain the ldquoone day in 10 yearsrdquo standard of reliability (which translates to reliable supply 9997 percent of the time) See also N Jonathan Peress and Kenneth A Colburn ldquoConnecting Market Design From Carbon to Electric Capacityrdquo October 2005 Vol 3 No 1 Energy Committee Newsletter American Bar Association
13 The level and timing of peak loads are estimated before the fact and the projections are less reliable the farther out in time they are made
RegulatoRy assistance PRoject
6
Forward capacity markets in the US evolved as a way of ensuring resource adequacy at reasonable costs to electricity consumers through a combination of system planning and organized markets Prior to the development of organized markets in parts of the US15 power ldquopoolsrdquo established a reserve margin requirement and each participating LSE was responsible for acquiring installed capacity to meet its individual loads plus that margin or face financial penalties The setting of capacity requirements for the pool as a whole meant however that each LSErsquos reserve requirements were significantly lower than they would otherwise be if it were a stand-alone entity that is participants in the pool benefited from the greater diversity of loads and supply resources that characterized the combined system The pools also facilitated the trading of capacity through bilateral agreements which had particular value in those pools where individual system peaks were temporally differentiated (as in New England whose northern states peaked in the winter and southern states in the summer) After market restructuring LSEs also could trade capacity in auctions run by the system operator responsible for the reliability of the regionrsquos electric grid In those early days of competitive wholesale markets auctions generally were held just a few days before the one-month delivery period
These nascent capacity markets provided insufficient incentives for plants to be available when called on The result was ldquobipolar pricingrdquo If there was a supply surplus capacity prices were effectively zero If there was any shortfall capacity prices rose to the price cap (if any) Moreover short time horizons for the auctions
limited offers for new capacity In addition market power16 concerns surfaced after utilities sold their power plants under electric industry restructuring particularly in areas with significant transmission constraints The Federal Energy Regulatory Commission (FERC) responded with price caps for the energy market that as a side effect limited scarcity price signals Thus ldquoenergy-onlyrdquo power markets mdash that is markets that pay clearing prices for energy on a day-ahead or shorter basis mdash were not paying high enough prices for investors to build sufficient peaking resources to meet future reliability needs
Meanwhile merchant generators were buckling under high fuel prices for new natural gas-fired plants and owners of older less efficient plants filed requests for retirement To maintain system reliability federal regulators approved expensive ldquoreliability must-runrdquo contracts to keep needed plants going and then mandated the development of a more systematic approach for paying for capacity The resulting process produced a mechanism to make capacity payments to all generators not just those applying for retirement and to develop more efficient capacity where it was most needed But the high price tag of such contracts for the New England states led to legal action that ended with a novel settlement in 2006 a capacity market run by ISO-NE that allows energy efficiency and other demand-side resources to compete with generation to meet reliability requirements several years in advance of need In 2007 much of the Mid-Atlantic and Midwest region adopted a similar capacity market run by PJM
How Forward Capacity Markets Evolved in the US14
14 This description draws upon Robert Stoddard and Seabron Adamson CRA International ldquoComparing Capacity Market and Payment Designs for Ensuring Supply Adequacyrdquo Proceedings of the 42nd Hawaii International Conference on System Sciences 2009 and Sandra Levine Doug Hurley and Seth Kaplan ldquoPrime Time for Efficiencyrdquo Public Utilities Fortnightly June 2008
15 See footnote 2 for a definition of ldquoorganized marketsrdquo Southern and western states except for California have not developed organized power markets
16 Such as withholding power to extract higher prices
7
the Role of foRwaRd caPacity MaRkets in incReasing deMand-side and otheR low-caRbon ResouRces
How Forward Capacity Markets Work
A forward capacity market is an administrative market run by a regional system operator who collects supply bids to meet planning targets for regional peak capacity needs runs a competitive auction to establish capacity prices and then procures capacity at the market clearing price to meet the resource adequacy requirements of the region The regional system operator is the sole buyer in this market LSEs are individually responsible for meeting their customersrsquo peak loads and are allocated a pro-rata share of the capacity costs incurred by the system operator to meet those loads
In forward capacity markets LSEs must demonstrate on a ldquoforwardrdquo basis that they will have sufficient capacity to meet their own customersrsquo peak loads (plus required reserves) several years into the future As discussed further below LSEs have the option to meet this requirement through bilateral contracting or LSE-owned generation referred to as ldquoself-suppliedrdquo or ldquoself-scheduledrdquo resources depending on the market However the ISO-NE and PJM capacity markets are mandatory for LSEs in the sense that the system operator will procure any residual needed capacity17 through the auction and assign cost responsibility to LSEs In addition all existing capacity must be offered into the auction along with new demand- or supply-side capacity offerings with certain exceptions
The forward auctions in both PJM and ISO-NE are held three years before the delivery year And the LSEsrsquo ldquoforwardrdquo capacity obligations and amount of capacity put out to bid are
established in advance of each auction Three years was selected to roughly match the minimum lead time required for the construction or development of new capacity once demand- and supply-side resources receive a price commitment from the auction In particular it was chosen to reflect a reasonable construction period for new peaking (eg gas-fired) power plants as well as a reasonable ldquoramp uprdquo period for energy efficiency projects18
For each auction the system operator establishes the level of capacity needed for the delivery year by forecasting (with input from the LSEs and other stakeholders) regional resource adequacy requirements mdash peak loads plus required reserves PJM performs this planning function by developing a downward-sloping demand curve with built-in price elasticity for each auction whereas ISO-NE establishes a single price-inelastic quantity of demand that it auctions in successive rounds of bidding
The capacity bid into the market (the ldquosupply curverdquo) is comprised of capacity commitments (MW) offered by existing and new resources These markets and associated auction rules are designed to allow new resources when needed to set the clearing price Existing resources are generally ldquoprice-takersrdquo in the sense that they are unlikely
to set price unless there is over-supply of existing capacity in the region
The market clearing price becomes the uniform price for all capacity that clears the auction That is the market clearing price is paid to all capacity committed by existing resources and all new resources that have bid into the auction at or below that clearing price There are separate auctions for constrained zones ndash locations
17 The system operator determines the level of residual capacity that it needs to procure to ensure system reliability and purchases that quantity it also must approve the LSErsquos showing of the level of capacity commitment it can meet through owned resources and bilateral contracts
18 See Jenkins et al p 178 and Johannes Pfeifenberger Samuel Newell Robert Earle Attila Hajos and Mariko Geronimo The Brattle Group Review of PJMrsquos Reliability Pricing Model June 30 2008 at httpwwwbrattlecomExpertsExpertDetailaspExpertID=67
19 See PJM Reliability Pricing Model Demand Response and Energy Efficiency at httpwwwpjmcommarkets-and-operationsdemand response~mediamarkets-opsrpm20090406-dr-ee-in-rpm-collateralashx
Sample Calculation of Revenue for a Successful Bidder19
Assume a service provider cleared 20 MW of demand-side resources in a capacity auction that had a clearing price of $100MW-day and that the provider delivered the 20 MW as contracted during the year The annual revenue stream for the year would be 20 MW $100MW-day 365 days = $730000
RegulatoRy assistance PRoject
8
that are experiencing distribution or transmission bottlenecks for the delivery of electricity to end-use customers The clearing prices in these auctions reflect congestion costs and in effect pay a locational adder to capacity available during peak hours in those zones
Only resources that clear the market receive capacity
payments However in order to maintain reliability under very limited circumstances out-of-market payments may be made to resources that do not clear The system operator may determine that a resource critical to maintaining reliability for a given locational zone must continue to run even if its cost of operation is higher than the auction
Using simple assumptions the general ldquoworkingsrdquo of a forward capacity market from the perspective of an individual LSE can be described as follows The system operator forecasts the regional capacity requirements for the future delivery year (2012) and plans to hold the capacity auction for that delivery year three years in advance Each LSE knows its forecasted capacity obligation for 2012 some months before the auction Letrsquos assume there are only two LSEs in the region and they each account for 50 percent of the total regional capacity requirement of 10000 MW projected for the delivery year
At the time of the auction the system operator approves LSE 1rsquos showing that it has bilateral contracts in place to meet 3500 MW of its capacity obligation for the delivery year LSE 2 on the other hand has no bilateral contracts (or generation that it owns) to meet any of its capacity obligation for 2012
Herersquos how it works LSE 1 will offer the 3500 MW under its bilateral contracts as ldquoself-suppliedrdquo or ldquoself-scheduledrdquo resources into the auction at a price of zero mdash and they will automatically clear the auction20 However as described below the auction clearing price will have no impact on what LSE 1 actually pays for this resource It will only pay the capacity price negotiated under its bilateral contracts
Now letrsquos flash forward to 2012 and assume that the actual 2012 peak capacity needs of the customers served
by LSE 1 and LSE 2 turn out exactly as the system operator forecasted for that year 21 and that LSE 1rsquos resources under bilateral contracts were available to meet peak capacity needs as expected At the end of 2012 the system operator calculates what it spent to meet the regionrsquos peak capacity needs LSE 2 will get a bill from the ISO for purchasing on its behalf 50 percent of the regional capacity needs (5000 MW) at the auction price for the 2012 delivery year LSE 1 will get a similar bill from the ISO mdash but with an offsetting credit for the 3500 MW of capacity under its bilateral contracts So in effect LSE 1 only pays the auction price for the ldquoresidualrdquo capacity of 1500 MW mdash the capacity that the system operator purchased to meet the remaining capacity obligation of LSE 1
The scenario is similar if actual 2012 peak loads are greater than forecasted levels LSE 2 will still pay the auction price for all of the capacity that was purchased on its behalf to meet its actual peak capacity needs and LSE 1 will pay that auction price for the (now higher) residual amount above its contracted capacity In this way LSEs can elect to use bilateral contracts to hedge against high capacity prices in the capacity auctions just as they can hedge against high prices in energy markets
Appendix 2 presents a series of slides illustrating this numerical example of how forward capacity markets work
Illustration of Forward Capacity Markets From the LSErsquos Perspective
20 Unless the contracts are structured as a contract-for-differences (see discussion of that option further below) The net effect in either case is the same in terms of the LSE only paying the contracted price for that capacity
21 In actual practice the percentage allocation of capacity costs to LSEs for the delivery year is based on the previous yearrsquos actual peak loads (plus reserves) of each LSE relative to the regional totals mdash but as noted this is a simplified example
9
the Role of foRwaRd caPacity MaRkets in incReasing deMand-side and otheR low-caRbon ResouRces
clearing price Under these circumstances the system operator can still require LSEs to pay for reliability must-run contracts at a cost determined outside the auction process To date the amount of MW under reliability must-run contracts in the PJM and ISO-NE regions is very small In the first few auctions almost all reliability must-run contracts were voided Most of the resources previously under reliability must-run contracts however have been retained through the forward capacity auctions and receive the annual market clearing price
Market Rules to Ensure Performance and Competition
To ensure that any successful bidder will have a very high likelihood of performance during the commitment period resources cannot bid capacity into the market unless they are prequalified by the system operator In particular bidders must demonstrate that they can meet their commitment to provide capacity for the delivery year and their bids must satisfy market rules designed to mitigate market power22 They must pay a qualification deposit must provide financial assurance to ensure commercial operation and can be penalized for performance failures
Further to ensure against a condition in which capacity occupies a place in the power system but is withheld from energy markets and drives up prices all generation and demand-response resources committed in the capacity market must offer into the regionrsquos day-ahead energy market whenever available To mitigate excessive profits to resources also receiving capacity payments from the forward capacity market the system operator reduces these payments to reflect the impact of high energy
market prices The ISO-NE makes this reduction on an annual basis to reflect especially high energy prices in the preceding year23 In the case of PJM this reduction is implemented through a built-in adjustment to the auction demand curve described below
The following section describes some of the unique features of the PJM and ISO-NE capacity markets highlighting in particular their differences
PJMrsquos Capacity Market
PJMrsquos current forward capacity market mdash called the ldquoReliability Pricing Modelrdquo mdash was implemented on June 1 2007 replacing an earlier capacity market design in place since 1999 Eligible capacity resources include new and existing demand and supply-side resources (including generators outside the PJM footprint) PJM recently added energy efficiency as an eligible demand-side resource joining demand response and distributed generation
Each year PJM holds a Base Residual Auction three years in advance of a future delivery year (that runs from June 1st to May 31st) PJM establishes the target capacity level and the auction establishes the price and the actual amount of capacity procured A mechanism called the ldquoVariable Resource Requirementrdquo administratively adds demand elasticity into the auction by imposing a downward-sloping demand curve that adjusts resource amounts procured based on auction prices (See Figure 2) If capacity prices are low PJM intentionally purchases capacity in excess of its target but the total payment by load is also lower If capacity prices are high PJM procures less than the target leaving some capacity to be acquired (at potentially lower prices) in incremental auctions for the delivery year24
In PJM resources are eligible only for a one-year capacity
22 For example in the PJM auction suppliers of existing resources are limited to bidding their demonstrated going-forward costs for nearly all capacity and new resources offered below cost because of support from an LSE contract have a limited ability to set the clearing price
23 This adjustment is not currently applied to energy efficiency resources because they are not eligible to participate in the wholesale energy markets
24 The purpose of administratively developing a downward-sloping demand curve rather than relying on a descending clock auction (as described below for the New England auction) is to help stabilize prices over time when supply is price-inelastic Figure 2 and further details on the mechanics of the Reliability Pricing Model are available from PJMrsquos ldquoReliability Pricing Model Trainingrdquo November 2009 at httpwwwpjmcomtraining~mediatrainingcore-curriculumip-rpmrpm-training-section-d-auctionsashx
RegulatoRy assistance PRoject
10
commitment resulting from each annual auction mdash that is the resource is only guaranteed the auction clearing price for a one-year contract period26 However as long as that resource remains listed in the market it is eligible to receive the auction clearing price for each succeeding year27 Capacity that was offered but not cleared in the Base Residual Auction is eligible to bid into incremental auctions for the same delivery year
In general each LSE is obligated to pay its pro rata share of capacity costs acquired by the PJM system operator through a ldquolocational reliability chargerdquo28 However as described above LSEs can enter into bilateral contracts
(or own generation) to hedge these charges and submit the capacity into the auction as a ldquoself-scheduledrdquo resource at a price of zero29 When the monthly billingsettlement is completed the locational reliability charge to the LSE will be offset (credited) for capacity delivered through self-scheduled resources The net effect of these financial transactions within the market is that the LSE pays the contract price for self-scheduled contracts and does not get paid (or charged) for generation it owns and self-schedules into the auction However self-scheduled resources are counted by the system operator in establishing available capacity to meet regional peak demand (plus reserves) and
25 ldquoUCAPrdquo in this figure refers to ldquounforced capacityrdquo Unforced capacity as defined for the PJM auction represents the MW level of a generating unitrsquos capability after removing the effect of forced outage events It excludes outage events outside of management control
26 There is an exception for a new resource that relieves a congestion constraint It can receive a fixed capacity price for more than one year subject to a review of the congestion relief that it is providing
27 As discussed below energy efficiency is not eligible to remain listed in the PJM capacity market after four years
28 This charge is based on the LSErsquos peak loads adjusted for demand response resources and the applicable zonal capacity price
29 See PJM Manual 18 PJM Capacity Market Revision 9 March 1 2010 pp 4 and 38 at httpwwwpjmcom~mediadocumentsmanualsm18ashx
450
400
350
300
250
200
150
100
50
0125000 130000 135000 140000 145000 150000
Pri
ce (
$M
W-d
ay)
MW (UCAP)
Figure 2 Establishing the Market Clearing Price in PJM - 20122013 Base Residual Auction25
20122013 RTO Supply and Demand
RTO Supply
Clearing Price = $1646
RTO Demand
Note To establish the clearing price when the supply and demand curves do not intersect PJM does one of the following depending on the circumstance 1) Short of supply - Extend the supply curve up vertically until it intersects the demand curve 2) Short of demand - Extend the demand curve down vertically until it intersects the supply curve or 3) Supply curve above demand curve - No capacity will be cleared
Reliabilty requirement = 1337324 MW
Cleared capacity = 1361435 MWReserve margin = 212
11
the Role of foRwaRd caPacity MaRkets in incReasing deMand-side and otheR low-caRbon ResouRces
are subject to applicable performance requirementsIn addition to self-scheduling by LSEs PJM provides
a complete ldquoopt outrdquo ndash the ldquoFixed Resource Requirement Alternativerdquo ndash for LSEs that take full resource planning responsibility for all loads in their service area for a five-year period The projected peak capacity needs for LSEs selecting this alternative are not included in the PJM planning process to establish the regionrsquos capacity needs for the auction and the LSErsquos capacity resources (including capacity acquired through bilateral contracts) are not offered into the auction Moreover under this opt-out alternative the LSE cannot bid any excess capacity into the auction or acquire any capacity through it
Capacity suppliers can cover any auction commitment shortages through the bilateral market facilitated by an electronic system at PJM If capacity shortfalls reach triggering conditions PJM can delay deactivation of a generating resource or hold a backstop reliability auction for capacity resources for a term of up to 15 years30
To improve the availability of capacity resources when needed the capacity product in the PJM market is defined to include forced outage rates based on historical performance and penalties are imposed if the plant is not up and running during a shortage
ISO New Englandrsquos Capacity Market
As in PJM eligible capacity resources in New England include both new and existing demand-side and supply-side resources (including generators outside the ISO-NE footprint) From the start ISO-NErsquos forward capacity market allowed energy efficiency demand response and distributed generation to compete with generation on an equivalent basis which meant among other things that new demand resources could set the market clearing price
Like PJM each year ISO-NE holds a capacity auction three years in advance of the delivery period and sets the amount of capacity to be purchased in each auction In addition to the annual forward capacity auction ISO-NE holds voluntary monthly and annual reconfiguration auctions that allow deficient suppliers to procure replacement capacity These auctions also provide the
system operator the opportunity to buy additional capacity if the load forecast increases or to sell capacity if the forecast decreases
However ISO-NE does not establish a downward sloping demand curve (Variable Resource Requirement) for its auctions Rather ISO-NE puts out a single quantity of capacity for bid referred to as the ldquoInstalled Capacity Requirementrdquo Then ISO-NE uses a descending-clock auction in which market prices are reduced until the quantity of available supply bids matches this capacity requirement Bid quantities and prices decline through successive bidding rounds (with bidders withdrawing resources from the auction as prices decrease) as long as excess capacity is still offered or until the floor price is reached To address start-up issues ISO-NE established a temporary price cap (or ldquostarting pricerdquo mdash see figure below)
30 See PJM Open Access Transmission Tariff Section 16 at httpwwwpjmcom~mediadocumentsagreementstariffashx
Contracts for Differences
Instead of a bilateral contract for physical delivery of capacity an LSE and resource owner can sign a ldquocontract-for-differencesrdquo which means that the level of payments (and who makes them) depends on the auction clearing price For example if the contract price is $50 per MW-day and the clearing price is $46 per MW-day the LSE will pay the resource owner the difference of $4 per MW-day But if the auction clearing price is higher than the contract price the resource owner pays the difference (to the LSE) As in the case of self-scheduled bilateral contracts the LSE will end up paying only the contract price for that capacity However in the case of contracts-for-differences the resource underlying the contract will bid into the market and (if cleared) will receive the auction clearing price And the LSE will be allocated the full locational reliability charge receiving no credits for the contracted capacity The reconciliation happens outside the auction between the LSE and resource owner rather than as part of the monthly billingsettlement process
RegulatoRy assistance PRoject
12
and price floor for the auction The most recent auction for ISO-NE ran seven rounds over two days concluding when the auction reached the floor price of $2951kW-month31
However by rule the load only pays Installed Capacity Requirement times the clearing price so the floor price is further reduced (pro rata) to achieve that effect32 Figure 3 below illustrates the descending clock auction process for ISO-NErsquos first forward capacity market auction
Therersquos another key difference To encourage investment ISO-NE allows new resources to lock in a capacity price for up to five years (with a one-year minimum term)
regardless of clearing prices in subsequent auctions The capacity price is indexed for inflation after the first year and the bidder must select the proposed contract term in advance of the auction Existing resources including existing demand-side resources are eligible only for a one-year price commitment mdash as is the case for PJM
While ISO-NE also permits LSEs to meet their capacity requirements with self-supplied resources (owned resources and resources under bilateral contracts) ISO-NE does not provide an ldquoopt outrdquo alternative as described above for PJM Similar to PJMrsquos ldquoself-scheduledrdquo option the
31 The caps and floors were originally scheduled to be eliminated following the third forward capacity auction However a recent filing by ISO-NE to implement the results of a stakeholder process proposes to continue these mechanisms for the next three auctions For more information on how the descending clock auction functions and how these capsfloors are established see ISO-NE Internal Market Monitoring Unit Review of the Forward Capacity Market Auction Results and Design Elements June 5 2009 at httpwwwiso-necomcommitteescomm_wkgrpsothrfcmwgmtrls2009aug720096-05-09_market_monitor_report_for_fcmpdf
32 With some exceptions resources have the option to pro-rate their cleared MW (rather than take a lower price)
33 Jenkins et al p 178
40000
39000
38000
37000
36000
35000
34000
33000
32000
31000
30000 Start 1 2 3 4 5 6 7 Close
Final Results of ISO-NE FCM Auction 1
$900
Start at $1500
$800 $700$600
$5625
$525 $4875 $450
End-of-round price
Round
Su
pp
ly a
vail
able
(M
W)
at e
nd
of
rou
nd
Final Capacity Needed (ICR)
Figure 3Example of Descending Clock Auction for ISO-NErsquos Forward Capacity Market33
Note Prices are in $USkW-month By rule the load only pays Installed Capacity Requirement times the clearing price so the floor price is further reduced (pro rata) to achieve that effect
13
the Role of foRwaRd caPacity MaRkets in incReasing deMand-side and otheR low-caRbon ResouRces
LSErsquos full capacity obligation (including that portion met through self-supply) is included in the Installed Capacity Requirement put out to bid and the self-supplied resources are also counted towards the resources available to meet that requirement (at a price of zero) in the auction process The net effect for the LSE is also the same The capacity committed as self-supply does not receive any capacity revenue and the LSErsquos capacity obligations satisfied through self-supply are not subject to capacity charges Further the LSErsquos self-supplied resources are subject to applicable penalties and the LSE is subject to capacity charges for any needed residual capacity that the ISO purchases through the auction on its behalf
The penalty provisions in the two regions also differ While both PJM and ISO-NE impose stiff penalty charges if a unit fails to perform when obligated to run ISO-NE also reduces payments to units that are not producing energy at their full capacity level during shortage events mdash similar to the mechanism it uses to reduce capacity payments when prices in the energy market reach very high levels
Role and Eligibility of Demand-Side Resources in FCMs
As discussed above electric systems face a reliability challenge not faced by other commodity markets Because customers are physically interconnected because electricity cannot be meaningfully stored and because electric service is central to economic and social well-being the balance between demand and supply is critical at all times and this balance must be assured over a sustained period of time The FCM design described in this paper recognizes that actions taken on the demand side of the market can effectively moderate price spikes and enhance reliability in a comparable manner as capacity commitments from supply-side generation mdash through short-term customer demand responsiveness during system peak or through permanent and continuous reductions in peak demand (energy efficiency) This market design recognizes that demand-side resources broadly defined to encompass demand response energy efficiency and distributed generation can meet system needs lower costs and add
value to power markets in a variety of circumstances The most important opportunities include34
bull Lowering the cost of power delivery reducing congestion and improving the reliability of the delivery system
bull Enhancing regional power system reliability by using a broad range of demand-side resources to meet planning and operational reserves
bull Economically balancing supply and demand in wholesale power markets through demand-side bidding and market transactions for energy supply released through demand reduction
bull Cost-effectively reducing long-term demand and lowering throughput through energy efficiency resources both on the power grid as a whole and within the resource portfolio of power suppliers
To capture these benefits energy efficiency and demand response (including distributed generation) can now compete on a level playing field with generation in the ISO-NE and PJM forward capacity markets Like generating resources demand-side resources must meet market rules for eligibility and availability including demonstrating they will be available at the start of the proposed delivery year Each type of demand-side resource has a specific set of performance hours across which load reductions are required To be eligible for the auction service providers must demonstrate in advance their ability to perform during those hours Like other resources demand-side resources are subject to penalties if there is a mismatch between their capacity commitment and their performance
Demand-side resources must meet comprehensive standards for measurement and verification (MampV) Failure to comply with MampV protocols makes the resource ineligible for the auction failure to submit post-installation MampV reports results in a final capacity offering of zero for the delivery year plus penalties Generally penalties cannot exceed the revenue that would have been collected if the resource performed as specified in the contract Energy efficiency resources also are audited for compliance Although the capacity obligations and associated penalties for non-performance among supply-side and demand-
34 Richard Cowart Regulatory Assistance Project and Jonathan Raab Raab Associates Ltd Dimensions of Demand Response Capturing Customer-Based Resources in New Englandrsquos Power Systems and Markets Report and Recommendations of the New England Demand Response Initiative July 23 2003 at httpwwwraponlineorgdocsRAP_Cowart_DemandResponseAndNEDRI_2003_07_23pdf
RegulatoRy assistance PRoject
14
side resources are not identical in these capacity markets they are designed and intended to provide comparable incentives to perform during specified hours35
Currently the key difference in eligibility requirements for demand-side resources in the ISO-NE and PJM capacity auctions is the circumstances under which energy efficiency resources may participate Under PJMrsquos rules energy efficiency resources may participate in Base Residual Auctions only up to four years This means that efficiency measures are limited to receiving compensation for their capacity contribution to four years of their measure life rather than their full measure life Demand response resources (including distributed generation) can participate in the PJM capacity market for as long as their ability to reduce demand continues In contrast all demand-side resources in ISO-NE are eligible to bid capacity for their full measure life an approach that recognizes the
full contribution of these resources to regional resource adequacy requirements and that encourages long-lived energy efficiency assets Further description of eligible demand-side resources and performance requirements in these markets is presented in Appendix 3
Forward Capacity Auction Results
In the following sections we summarize the overall level of capacity cleared from existing and new resources in the PJM and ISO-NE auctions the level of incremental capacity successfully bidding into these markets and how different types of resources have fared to date mdash with particular focus on demand resources More detailed results for the PJM and ISO-NE forward capacity markets are provided in Appendix 1
Some stakeholders claim that demand resources are not as available as generation yet they get paid the same price for capacity (implying that they should receive a lower price) A closer examination of the ISO-NE rules reveals several problems with this generalization In particular generation availability can actually vary quite widely because these resources are excused from performing if they are on scheduled maintenance (eg nuclear plants are paid their full monthly capacity payment even when they are shut down for weeks of re-fueling) And other generation resources are ldquoallocatedrdquo a specific number of hours for annual maintenance and are paid as if they are providing capacity services when they are off-line Demand resources have pre-established hours they must be available and are penalized for performance failures differently than traditional generationmdashsome argue more severely For example a demand resource that fails to perform is assessed a penalty for that month and its capacity value is reduced going forward (for all future months) While it is possible to re-establish the capacity value
through future performance (demand response) or with updated MampV (energy efficiency) the process is a slow one that can take many months or more A generation unit that fails to perform is assessed a penalty for that month but its capacity value is either unchanged or can be reestablished with a test run at anytime and the monthly capacity payments continue with no reduction Generation plants with long notice requirements (eg 24 to 48 hoursrsquo notice for coal-fired plants if the system operator wants them on-line and actually providing energy) are paid the same as a demand response resource that is required to be dispatchable by the system operator within 30 minutes throughout the year to address shortage events (See Appendix 3) Clearly there are individual rules that stakeholders can argue work to the advantage of supply-side over demand-side resources and vice versa Overall the intent of such variations should be to make obligations penalties and payments for demand and supply resources roughly comparable while recognizing the unique operational issues associated with all resources
Performance Incentives Demand- vs Supply-Side Resources
35 Nonetheless there continues to be debate among stakeholders over whether the appropriate balance has been reached See text box
15
the Role of foRwaRd caPacity MaRkets in incReasing deMand-side and otheR low-caRbon ResouRces
Auction Results for PJM36
PJM has held five Base Residual Auctions including the most recent May 2009 auction for the 20122013 delivery year PJM serves a large market The 20122013 Base Residual Auction cleared a total of 1361436 MW of capacity While generating resources account for nearly all of this committed capacity (1285274 MW) demand response resources (including distributed generation) represent 5 percent of the total (70472 MW) New for the 20122013 delivery year 5689 MW of energy efficiency also cleared the market Table 1 in Appendix 1 lists capacity resources offered and cleared to date As indicated in that table the vast majority of demand-side resources offered into the market cleared each PJM base residual auction
Figure 4 below illustrates the increasing role of demand-side resources in PJM
Renewable generating resources also are gaining some traction in the capacity market although not anywhere near the magnitude of demand-side resources in terms of their overall contribution to resource adequacy requirements This is due to the predominance of wind resources and their variable nature PJM applies a 13 percent on-peak capacity factor to these resources mdash for every 100 MW of wind resources only 13 MW are eligible to meet capacity requirements Some 3234 MW of wind capacity resources cleared in the most recent Base Residual Auction mdash 95 percent of the amount offered While this capacity level is miniscule compared to the total capacity clearing the auction it translates to a large nameplate rating mdash 2488
12000
10000
8000
6000
4000
2000
0
Active Load Management
Prior to RPMImplementation RPM Implemented
Interruptible Load for Reliability
Energy Efficiency RPM Offered Demand Response
Figure 4 Demand-side Participation in PJMrsquos Reliability Pricing Model (RPM) Auctions
Note Demand-side resources included Active Load Management prior to the 20072008 delivery year Interruptible Load for Reliability and Demand Response were first eligible for the 20072008 delivery year Energy Efficiency resources were first eligible for the 20122013 delivery year (May 2009 auction) The large increase in demand response participation in the 20122013 delivery year is in large part due to the elimination of PJMrsquos ILR program
200506 200607 200708 200809 200910 201011 201112 201213
36 Except where noted information and figures in this section and referenced tables in Appendix 1 are from PJM ldquo20122013 RPM Base Residual Auction Resultsrdquo at httpwwwpjmcom~mediamarkets-opsrpmrpm-auction-info2012-13-base-residual-auction-report-document-pdfashx
RegulatoRy assistance PRoject
16
MW of wind resourcesPJM reports that the Base Residual Auctions have
attracted 150294 MW of incremental capacity in the region to date Incremental capacity refers to new generation resources capacity upgrades to existing generation resources new demand response resources upgrades to existing demand response resources and new energy efficiency resources37 Natural gas- and coal-fired plants account for most of the incremental capacity with nuclear plants (from uprates) also making a sizable contribution Tables 2 and 3 in Appendix 1 provide details on the incremental capacity procured It is important to note that the figures in these tables represent resources new to the capacity market including uprates mdash not all are newly built However they include a new merchant coal plant built for the PJM market38
True to one of the original goals the PJM capacity market also has been successful in retaining existing capacity from power plants that were originally under high-cost reliability must-run agreements39 Since FERC approved the Reliability Pricing Model existing capacity that would otherwise have been deactivated or retired has accounted for 32768 MW of procured capacity Table 4 in Appendix 1 shows these changes in resource deactivation and retirement
Market clearing prices for resources in PJMrsquos Base Residual Auctions to date have ranged from $1646 to $17429 per MW-day not including any locational price adders for constrained areas (See Table 5 in Appendix 1) Importantly the $1646MW-day clearing price for the 20122013 delivery year represents a decrease of $9354MW-day from the previous Base Residual Auction due in part to significant increases in capacity from demand response and the introduction of energy efficiency resources into the bidding process Moreover the participation of demand-side resources is estimated to have reduced the market clearing price for the 20122013 delivery year by an astonishing $16232MW-day in unconstrained zones (ie from a clearing price of $17878MW-day without these resources in the bid stack to the actual clearing price
of $1646MW-day) Table 6 in Appendix 1 shows the calculation by PJMrsquos independent market monitor
Auction Results for ISO-NE
ISO-NErsquos forward capacity market is about a quarter of the size of the PJM capacity market mdash the Installed Capacity Requirement set by ISO-NE for the 20122013 delivery year was 31965 MW ISO-NE has held three forward capacity auctions to date and all of them cleared at the administratively set floor price ($450kW-month $360kW-month and $295kW-month respectively) with surplus capacity above the Installed Capacity Requirement set by ISO-NE to meet reliability needs The first auction secured 1772 MW above the requirement the second auction cleared 4755 MW of excess capacity and the third auction cleared 4649 MW of excess capacity (See Table 7 in Appendix 1)
Demand resources have consistently represented about 8 percent of the resources cleared in the three auctions (2554 MW 2937 MW and 2898 MW respectively) an amount that exceeded expectations Energy efficiency accounted for about a quarter of the demand resources in the first auction and about a third in more recent auctions Real-time demand response comprises the largest share of demand resources Emergency generation (ie distributed generation whose state air quality permit limits operation to ldquoemergencyrdquo conditions) also makes a sizeable contribution Non-emergency distributed generation however comprises a negligible amount of the total Table 8 in Appendix 1 shows detailed results for demand resources
Figure 5 shows the growth in demand resources offered and cleared in the first two ISO-NE auctions by type There has been a steady growth in demand-side resources in New England since the first demand-response programs operated by ISO-NE The forward capacity auctions have contributed to and solidified these gains
Participation of demand-side resources in the ISO-NE forward capacity auction has been credited with making the clearing price lower than it would have been otherwise
37 The increase is partially offset by capacity de-ratings to existing generation resources
38 See Pfeifenberger et al at 27
39 As discussed above these contracts have not been dispensed with altogether however
17
the Role of foRwaRd caPacity MaRkets in incReasing deMand-side and otheR low-caRbon ResouRces
as it has in the PJM region Analysis of the first auction bids for example suggests that the participation of these resources saved ratepayers as much as $280 million by lowering the price paid to all capacity resources in the market40
Moreover by contributing to the excess capacity that kept capacity payments at relatively low floor prices in New England the participation of demand-side resources has
also contributed to lower overall market revenues inducing some inefficient oil-fired generating units to shut down at least temporarily Nonetheless existing and new fossil-fuel resources continue to dominate the capacity commitments in this region as is the case for PJM
Overall renewable generating resources (primarily wind resources) are making some headway in the regionrsquos forward capacity market but as in PJM they are not
40 See Cheryl Jenkins et al This calculation reflects what the market clearing price would have been in the auction given the Installed Capacity Requirement put out to bid by the system operator which assumes no impact of energy efficiency programs on loads (because energy efficiency is bidding) Therefore the calculated reduction in clearing price represents a theoretical maximum mdash excluding demand resources from the market would likely have been at least partially offset by a lower amount of capacity put out to bid As a result the difference in the market clearing price (and savings to consumers) would likely have been smaller than the number calculated here although it is difficult to say by how much However even if demand-side resources were not permitted to bid they would contribute to lower prices for consumers by lowering the total quantity of capacity required
41 Internal Market Monitoring Unit ISO-NE June 5 2009
4500
4000
3500
3000
2500
2000
1500
1000
500
0
New UnclearedTotal Uncleared1375 MW
Total Uncleared1159 MW
Total Cleared2279 MW
Total Cleared2778 MW
New Cleared
Existing Delisted Uncleared
Existing Cleared
FCA 1 FCA 1
Figure 5 Demand-Side Participation in ISO-NE Capacity Auctions by Type41
copy ISO New England Inc
Note Activerdquo resources include demand response and emergency generation energy efficiency is considered a ldquopassiverdquo resource Clearing amounts reflect ISO-NErsquos maximum limit of 600 MW of Real-Time Emergency Generation In contrast Table 8 in Appendix 1 shows the actual amount of such resources that cleared the auction Capacity payments to these resources are pro-rated if cleared levels exceed 600 MW
Cap
acit
y (M
W)
Active
Active
Active
Active
Active
Active
Active
Active
Passive
Passive
Passive
Passive
Passive
RegulatoRy assistance PRoject
18
a major contributor to the regionrsquos resource adequacy requirements at this time In the most recent (third) auction 166 MW of wind capacity cleared the auction mdash with a nameplate rating an order of magnitude larger42
Unlike PJM ISO-NE does not apply a deemed on-peak capacity factor to wind and other variable generation resources Instead all such resources must provide data that demonstrate the claimed summer and winter qualified capacity The capacity factor is adjusted over time based on actual performance during specified hours
Forward Capacity Markets in the Context of Carbon Constraints
Power market rules are not constructed in a vacuum rather they are designed to address specific public policy goals As described above forward capacity markets in the US were developed to ensure resource adequacy in the power system at a reasonably competitive price In the face of growing carbon constraints however power market rules need to be redesigned to work in concert with carbon reduction goals and policies rather than at cross purposes The challenge of substantially de-carbonizing the power sector in the coming years is too great to ignore this interaction In particular policymakers should carefully consider what elements of the current planning and procurement process to achieve resource adequacy contribute to the following effects ndash and then work to revise the market rules accordingly
bull Do the market rules encourage new investments in high-emitting resources (including repowering) at the expense of low-carbon alternatives
bull Do they encourage the continued (or increased) operation of existing high-emitting power plants
bull Will they result in a build-out of capacity and cumulative emissions that conflict with the level of de-carbonization required in the power sector mdash or make attainment of that level more costly to the economy
This paper is not intended to evaluate the PJM and ISO-NE capacity markets and auction rules in any depth with respect to these issues However we offer below general observations based on the auction design and results to date in these regions and other studies Following that we provide policy recommendations related design options and additional actions for consideration
General Observations on Forward Capacity Markets and Results
Based on our review of FCM auctions to date and related studies we offer the following observations
bull The ISO-NE and PJM forward capacity markets are meeting their resource adequacy objectives Sufficient levels of capacity have cleared the market to meet each regionrsquos anticipated peak demand and adequate resources are now committed on a forward basis to ensure reliable coverage in future years (up to the 20122013 delivery year) But in a carbon-constrained world the mix of resources is as important as the quantity in both the short-term and the long-term Most resources that are available during peak demand hours also produce electricity or reduce consumption during many more (or all) hours of the year and the carbon intensity of that mix of resources will drive the level of cumulative emissions in the power sector43 As discussed in this paper capacity markets as currently designed provide compensation based on the level of available capacity not the mix of resources providing that capacity It is worth repeating here that the only (non-price) attribute a resource needs to demonstrate for resource adequacy purposes is that it will be available when called upon during the projected hours of peak system loads In a carbon-constrained world policy makers should ask whether the planning and procurement process for acquiring a sufficient level of capacity at a reasonable price is also moving the resource mix in the right direction mdash towards zero or low carbon-emitting demand- and supply-side resources
42 Compiled from auction results at httpwwwiso-necommarketsothrmkts_datafcmcal_resultsccp13fca13indexhtml
43 With the exception of gas-fired peaking units or demand response resources that are dispatched to meet (or reduce) loads only during peak system hours
19
the Role of foRwaRd caPacity MaRkets in incReasing deMand-side and otheR low-caRbon ResouRces
bull Expressly designing demand-side resources into forward capacity markets appears key to achieving all three objectives ndash resource adequacy low-carbon resource mix and reasonable price Energy efficiency and demand response resources are faring well in auction-based capacity markets mdash and this is a positive outcome for several reasons First energy efficiency and other demand-side resources can substitute for existing and planned generation that have a higher carbon footprint thereby reinforcing carbon reduction policies and targets for the region Second demand-side resources can dramatically reduce the costs of meeting the regionrsquos resource adequacy requirements mdash as evidenced by the results of the PJM and ISO-NE auctions In addition the increase in demand-side resources facilitated by capacity auctions can reduce market power because more suppliers and more resources means individual generators have less ability to affect bid offers and clearing prices And because demand-side resources lighten the load at the end of the supplydelivery chain they enhance the reliability of each link in the chain from fuel supply and generation to the local distribution network
bull Differences in the impact of demand-side resources on carbon emissions should be recognized in capacity markets and associated auction rules Energy efficiency decreases carbon emissions because (by definition) it reduces energy use for an equivalent level of service and at the margin almost all power systems are running higher carbon resources In contrast the net impact of demand response on carbon emissions will depend upon specific circumstances including the mix of
plants serving loads at the margin For example when coal is primarily serving baseload and intermediate needs emissions may increase when customers shift loads from on-peak (when natural gas is on the margin) to off-peak periods44 Elsewhere however demand response mdash including any conservation side-effect mdash may reduce emissions from less efficient peaking plants In addition demand response includes real-time emergency generation which is often fossil-fuel powered (eg by diesel or natural gas) Any analysis of the costs and benefits of demand response resources in capacity markets should account for such effects Policies and market rules for demand response should be aligned with its environmental costs and benefits45
bull Renewable generating resources are beginning to make some headway in forward capacity markets mdash in particular wind resources This is in large part because the markets described here recognize some capacity value for variable renewable resources (wind solar and run-of-river hydro) either through a deemed on-peak capacity factor or a demonstration of claimed capacity for specified on-peak periods Policymakers need to pay attention to how these values are established so they can be confident the committed capacity will be available when called on while at the same time encouraging participation of all low-carbon resources in the market More generally as renewable resources become a more significant part of the resource mix a forward capacity market creates the opportunity to recognize their aggregate capacity value to the system46
44 For example PJM recently released figures on carbon emissions of generating units that operate on the margin during on-peak vs off-peak hours See httpwwwpjmcom~mediaabout-pjmnewsroom2010-releases20100325-pjm-reports-new-carbon-dioxide-emissions-dataashx and httpwwwpjmcomdocuments~mediadocumentsreportsco2-emissions-reportashx
45 See section 316 and Mechanism E in Attachment 1 of Pacific Northwest National Laboratory The Smart Grid An Estimate of the Energy and CO2 Benefits January 2010 (PNNL 19112) at httpenergyenvironmentpnlgovnewspdfPNNL-19112_Revision_1_Finalpdf
46 Variable renewable resources will qualify for higher capacity value if they are bundled with other resources for reliability (eg demand response hydroelectric dams or energy storage) In addition confidence in the capacity value of variable resources increases as their geographic diversity on the system increases See for example the report on the Eastern Wind Integration and Transmission Study at httpwwwnrelgovwindsystemsintegrationpdfs2010ewits_final_reportpdf
RegulatoRy assistance PRoject
20
bull Nonetheless renewable resources are hard-pressed to successfully compete with the thousands of megawatts of existing and new fossil-fuel resources participating in these auctions that are able to bid below the true societal cost of their operations under current market rules In fact capacity auctions as currently designed can breathe new economic life into high carbon-emitting plants that were previously planned for significantly reduced operations or retirement Along with new capacity from fossil-fuel generation allowing such a large amount of existing capacity from high carbon emitters to clear the auction is likely to crowd out renewable resources that are able to address resource adequacy requirements equally well Such results may not represent an ldquoefficientrdquo (or desirable) outcome for a carbon-constrained power sector This is especially true where the carbon costs of a fossil-fuel plant are not fully recognized in the energy market that plant also will be bidding into
The Electric Power Research Institute modeled the effect of various levels of carbon taxes or allowance prices in the upper Midwest (coal-dependent) and in Texas (heavily reliant on natural gas) The study found that close to a doubling of the wholesale prices of electricity in the Midwest region (through carbon-related charges) would produce only a 4 percent reduction in regional emissions given the current generation mix Similar results were observed for Texas where natural gas plants are on the margin49 And in the Northeastern US due to initially low carbon prices and a host of factors that dampen the price signal the Regional Greenhouse Gas Initiative (RGGI) has not yet resulted in generator operational changes50 One of those dampening factors is the single clearing price that is typically set through wholesale energy markets mdash which dilutes the market signal sent by a price on carbon emissions by allowing fossil-fueled plants to recover
most or all of their allowance costs through higher clearing prices reflecting the cost of allowances51
Studies also have shown that the price of carbon must rise (and be maintained) at very high levels to obtain sufficient market pull for the level of new investments in clean generation required For example a recent analysis in California concluded that it would take a carbon price of $100 per tonne52 to make economic investments in renewable resources compared to fossil fuel-fired generation in order to reach carbon reduction targets in the power sector beyond what current state requirements will achieve53 Further price signals may be diluted if a portion of the carbon allowances are allocated in a manner that shields high-emitting power plants from carbon costs or if high-emitters located outside the capped region can sell into the market on a long-term basis
Carbon Pricing Alone Is Insufficient to De-carbonize the Generation Mix
bull A market price for capacity or energy that favors the construction and operation of high carbon-emitting resources over clean resources will lead to increases mdash rather than reductions mdash in the cumulative level of carbon emissions in the power sector A carbon tax or carbon cap-and-trade regime internalizes some or all of the otherwise un-priced carbon costs of electricity production and would improve the relative economics of clean resources in both forward capacity and energy markets However carbon pricing alone may be insufficient to change the dispatch of existing high-emitting power plants or their ability to clear these capacity markets (and be paid additional revenues as a result) in such overwhelming numbers47 In fact the very modest impact of carbon pricing on the performance of fossil-fuel plants has been documented in several reports48 (See text box below)
47 With or without carbon prices policymakers also might want to consider the implications of paying existing power plants the market clearing price for capacity mdash and the potential windfall profits for plant owners mdash for making no changes in plant operations See for example Ezra Hausman Paul Peterson David White and Bruce Biewald Synapse Energy Economics Inc RPM 2006 Windfall Profits for Existing Base Load Units in PJM An Update of Two Case Studies Feb 2 2006 at wwwsynapse-energycom
21
the Role of foRwaRd caPacity MaRkets in incReasing deMand-side and otheR low-caRbon ResouRces
bull Carbon pricing alone will have limited impact on consumer decisions to invest in permanently reducing their peak demand by making cost-effective investments in energy efficiency Well-designed time-varying pricing options can successfully shift demand from high-price hours to lower price hours54 Such shifting also reduces peak demand on transmission and distribution systems Overall energy use will decline somewhat in response to price But long-term reduction in energy use due to price increases is relatively small The numerous market barriers to capturing the full cost-effective potential of energy efficiency ndash through improvements in building construction practices and industrial processes retrofits of existing buildings and installations of high-efficiency appliances and equipment in homes and businesses ndash are well-documented They include lack of information high first-costs consumersrsquo high discount rates and the landlord-tenant split incentive problem among others55 Recent empirical analysis of demand elasticities suggests that the long-term price elasticity of demand for electricity is even lower than earlier studies have indicated for both liberalized and regulated markets (See text box on page 21)
In sum while forward capacity markets are meeting their resource adequacy objectives and clearing an impressive amount of clean low cost demand-side resources on balance these markets (as currently designed) are not working sufficiently in concert with carbon reduction goals and policies in the face of growing carbon constraints For the reasons discussed above carbon pricing alone
48 See Testimony of Richard Cowart Regulatory Assistance Project Before the Committee on Energy and Commerce Subcommittee on Energy and Environment US House of Representatives April 23 2009 ldquoThe Consumer Allocation for Efficiency How Allowance Allocations Can Protect Consumers Mobilize Efficiency and Contain the Costs of GHG Reductionrdquo at httpenergycommercehousegovPress_11120090423testimony_cowartpdf
49 See Victor Niemeyer ldquoThe Change in Profit Climate How Will Carbon-Emissions Policies Affect the Generation Fleetrdquo Public Utilities Fortnightly May 2007 at 20 24
50 See ldquoRGGI marks its first year with success and lesson on effect of market pressurerdquo Electric Utility Week Dec 14 2009 Ten Northeast and Mid-Atlantic states participate in RGGI the first mandatory cap-and-trade program in the US Connecticut Delaware Maine Maryland Massachusetts New Hampshire New Jersey New York Rhode Island and Vermont Nine of them participate in either the ISO-NE or PJM forward capacity markets described in this paper
51 PJM Interconnection ldquoPotential Effects of Proposed Climate Change Policies on PJMrsquos Energy Marketrdquo Jan 23 2009 p 5 See also ldquoBecause Thatrsquos Where the Money Is The FERCrsquos Ability to Reduce the Cost of Slowing Global Warmingrdquo Samuel A Wolfe Chief Counsel New Jersey Board of Public Utilities December 2009 at httpwwwnarucorgpublicationsWOLFE-20Panel203pdf
Demand for Power Is Relatively Price-Insensitive mdash Even Over the Long Term
Modeling by the US Department of Energy suggests that a 10 percent increase in power prices will reduce demand for electricity by just 25 percent to 3 percent over 20 years assuming that the price effects persist over that entire period56 This would only offset the normally expected US load growth in two out of those 20 years57
More recently a 2009 empirical analysis of the demand for electricity in the US concludes that price elasticity of residential demand has actually decreased since retail price deregulation was first introduced in the US The results suggest that a 10 percent increase in power prices will reduce residential electricity demand more on the order of 12 percent to 17 percent based on 2001-2008 data for both deregulated and regulated states58 Price responsiveness is further dampened by the income-elasticity of demand which is positively correlated with consumption As incomes increase consumption of electricity goes up and the conservation impact of any price increase is diminished59 The equivalent historical figure for a 10 percent increase in power prices in the UK residential sector is -23 percent but the income-elasticity is such that a 10 percent increase in income results in an increase of demand of 34 percent ndash ie household income is just as important as energy price in determining energy demand60
RegulatoRy assistance PRoject
22
is unlikely to shift the power sector resource mix at the pace or scale required to meet aggressive carbon reduction targets ndash or correspondingly to substantially change the dominance of high-carbon resources clearing forward capacity auctions under current market rules An increasing number of studies makes a compelling case that our economy and our society cannot afford this dominance to persist much longer if we are to contain climate change to a livable level In fact close to full de-carbonization of the
power sector is being discussed in international forums as the only way to meet essential carbon reduction targets by 205061 While capacity markets alone are unlikely to support the full value of clean energy resources in a carbon-constrained power sector by themselves with appropriate design elements they can serve to reinforce actions taken at federal regional and state levels that provide larger and longer lasting commitments to clean demand-side and renewable resources62
52 A tonne or metric ton is a unit of mass equal to 1000 kilograms (roughly 2205 pounds) or approximately the mass of one cubic meter of water at four degrees Celsius A tonne is not the same as either a ldquoshortrdquo ton (2000 pounds) or a ldquolongrdquo ton (2240 pounds)
53 Energy and Environmental Economics Inc Greenhouse Gas Modeling of Californiarsquos Electricity Sector to 2020 Updated Results of the GHG Calculator Version 3 prepared for the California Public Utilities Commission October 2009 pp 66-67 at httpwwwethreecomdocumentsGHG_102209CPUC_GHG_Final_Report_28Oct09pdf
54 Ahmad Faruqui and Sanem Sergici The Brattle Group ldquoHousehold Response to Dynamic Pricing of Electricity A Survey of the Experimental Evidencerdquo Jan 10 2009 at httpwwwhksharvardeduhepgPapers2009The20Power20of20Experimentation20_01-11-09_pdf
55 See for example American Council for an Energy Efficient Economy ldquoQuantifying the Effects of Market Failures in the End-Use of Energyrdquo pp iii-vi 2007 at httpoldaceeeorgenergyIEAmarketbarrierspdf This study details the various types of market barriers to end-use energy efficiency and reports that up to 50 percent of residential energy use in the US is affected by such barriers
56 The US Department of Energyrsquos National Energy Modeling System (NEMS) has price elasticity built into it The long-run elasticity (assuming price effects remain for 20 years) are ndash031 for residential electric use and ndash025 for commercial electric use See Steven H Wade ldquoPrice Responsiveness in the NEMS Buildings Sector Modelrdquo in Energy Information Administrationrsquos Issues in Midterm Analysis and Forecasting 1999 pp 55 58 table 1 at httpwwweiadoegovoiafissuespdf060799pdf
57 This would require a much larger rate increase just to offset expected load growth over 20 years let alone to reduce demand sufficiently to permit absolute reductions in emissions from the nationrsquos huge generation fleet See Testimony of Richard Cowart
58 T Nakajima and S Hamori ldquoChange in Consumer Sensitivity to Electricity Prices in Response to Retail Deregulation A Panel Empirical Analysis of the Residential Demand for Electricity in the United Statesrdquo Energy Policy (2010) available at wwwsciencedirectcom
59 Ibid
60 John Dimitropoulas Lester C Hunt and Gary Judge ldquoEstimating Underlying Energy Demand Trends Using UK Annual Datardquo at httpuserwebportacuk~judgegAEL_04pdf
61 See for example Meeting Carbon Budgets ndash The Need for a Step Change Progress Report to Parliament Committee on Climate Change October 2009 at httpwwwthecccorgukreportsprogressreports Christopher Jones and Jean-Michel Glachant Why and How the European Union Can Get a (Near to) Carbon-Free Energy System in 2050 MIT Center for Energy and Environmental Policy March 2010 at httpdownloadsthecccorgukdocs2166720CCC20Executive20Summary20AW20v4pdf Roadmap 2050 A practical guide to a prosperous low-carbon Europe The European Climate Foundation April 2010 at wwwroadmap2050eu
62 Without such policies it is unlikely that even RGGIrsquos modest carbon reduction goals will be achieved See Paul Peterson Doug Hurley and David White Synapse Energy Economics Inc ISO New England Scenario Analysis Companion Report Constructing a Future That Meets Regional Goals Aug 8 2007 at wwwsynapse-energycom
23
the Role of foRwaRd caPacity MaRkets in incReasing deMand-side and otheR low-caRbon ResouRces
ISO-NE Rules for Emergency Generators Advance Environmental Goals
Emergency (ldquobackuprdquo) generators typically are diesel-fired and states in New England and elsewhere in the US have restricted the number of hours and days they may be operated through the state permitting process At the time the first regional demand response tariffs were being designed in New England a collaborative of energy regulators environmental regulators the ISO utilities and other stakeholders realized that active demand response programs could lead to substantial incentives for diesel-fired backup generators to operate more often when air quality was at its worst Regulators and the ISO proposed a rule limiting those generators to run for reliability purposes during system emergencies This is a concrete example of reliability rules being written to advance environmental goals as well as power system needs63 In addition a regional working group developed model emissions standards for small generators for statesrsquo consideration64
To reinforce regional air quality policies and goals ISO-NE limits the total amount of emergency generators in the regional capacity market to 600 MW To the extent any excess amount clears the auction capacity payments to these resources are pro-rated
63 See Cowart and Raab p 26
64 See Model Regulations for the Output of Specified Air Emissions From Smaller Scale Electric Generation Resources Oct 31 2002 at httpwwwraponlineorgshowpdfaspPDF_URL=22docsrap_issuesletter-outputbasedemissioninsert_2003_07pdf22
65 Edward S Rubin Carnegie Mellon University ldquoA Performance Standards Approach to Reducing CO2 Emissions for Electric Power Plantsrdquo June 2009 at httpwwwpewclimateorgpublicationsreportcoal-initiative-series-performance-standards-approach-reducing-co2-emissions-ele Also see Chris Simpson and Brenda Hausauer ldquoEmissions Performance Standards in Selected Statesrdquo Regulatory Assistance Project Research Brief November 2009 at httpwwwraponlineorgdocsRAP_Simpson_EPSResearchBrief_2009_11_13pdf
Policy Recommendations and Auction Design Options
We present below recommendations and a menu of auction design options for forward capacity markets that support and enhance carbon policies and carbon reduction targets
bull Power market rules should be constructed to recognize and limit the adverse environmental consequences of power generation The power system and the environment are inextricably linked Explicit consideration of environmental costs and benefits of various electricity resources is not only reasonable but necessary to meet the enormous challenge of climate change
bull Forward capacity markets should reinforce carbon reduction policies which could be accomplished by incorporating one or more of the following into the auction rules
Auction rules could apply an Emissions Performance Standard (EPS) to promote capacity commitments from low-carbon resources and discourage bids from high-emitting power plants An EPS can be expressed as a maximum level of greenhouse gas emissions per unit of electrical output or as a percentage reduction in (annual) plant emissions It can vary with fuel type and incorporate other design variations65 It may be appropriate to adopt an EPS mdash within the auction qualification rules or by regulation mdash particularly if current market signals are not sufficiently
discouraging new construction or repowering of high-emitting generating resources with long lifetimes while forward capacity markets are providing a new revenue stream to keep them running
RegulatoRy assistance PRoject
24
Auction rules could disqualify inefficient generators from participating (and from receiving capacity revenue) or more generally require their retirement through financial incentives regulations or both66 Since 2007 China has been phasing out such plants and intends to retire approximately 50 gigawatts (GW) of small inefficient coal-fired power plants nationwide and 7 GW to 10 GW of small natural gas-fired units as well as halt construction of small inefficient power plants The policy is being put in place three ways the direct rescission of operating permits the transfer of generation rights and price reductions
Capacity payments could vary by the emissions rate of the resource Instead of one price paid to all generation that clears the auction adders could be applied to payments for low-emitting units and deductions could be applied to high-emitting units67 For example a sliding-scale percentage reduction to the per-unit ($kW-month or $MW-day) clearing price could be established based on the average annualized carbon footprint of fossil-fuel resources whereas a price adder above the clearing price could be established for zero-emitting resources
Imputed ldquocarbon addersrdquo could help curtail high-emitting resources Carbon adders are imputed costs that reflect at least a portion of the societal cost of emissions They are generally
used in the context of resource planning and acquisition by a regulated LSE mdash as a way of ensuring that high-carbon risks and low-carbon alternatives are properly valued in the resource selection process But these imputed costs do not get passed on to ratepayers or consumers for every unit of power consumed in contrast to carbon pricing68 Similarly the rules in a forward capacity market could be modified so that carbon adders are applied in determining what resources clear the auction (and will receive the market clearing price for their capacity commitment)
A ldquozero-carbon resource portfolio standardrdquo could establish auctions for separate tranches of resources by emissions level For example one tranche could include energy efficiency and renewable resources The size of each tranche would be based on carbon reduction goals for the region The higher the goals the larger the tranche for energy efficiency and renewable resources These resources decrease carbon emissions because at the margin most power systems are running higher carbon resources
bull Policymakers should consider a longer price commitment in forward capacity markets mdash at least for low-carbon resources The contract period for new capacity in these markets is short (one year in PJM up to five years in ISO-NE) in part so there is greater certainty over forecasts of resource needs for system reliability (to mitigate the risk of over-supply)
66 Small and old coal plants are the most inefficient and polluting both in terms of greenhouse gases and particulate matter By some estimates 50 MW plants may use as much as 200 grams more per unit of electricity output than a plant larger than 300 MW See Frederick Weston Rebecca A Schultz David Moskovitz and Max Dupuy Regulatory Assistance Project ldquoChinarsquos Climate Change Initiatives Do new policies adopted in China offer any guidance for the transformation of the US power sector in a carbon-constrained worldrdquo November 2009 at httpwwwraponlineorgdocsRAP_China20Climate20Initiatives_NARUC_2009_11_01docx
67 See N Jonathan Peress and Kenneth A Colburn ldquoElectrical Connections Aligning Capacity Market Changes With RGGI in the Northeastrdquo Discussion Draft March 2005 at httpwwwpucnhgovEPABSymbiotic202005-03-1820Peress-Colburn20Letter20to20FERC-Woodpdf
68 Both high carbon resources and low carbon resources clearing in power markets (characterized by single-price auctions) are paid the same price So whenever fossil resources are on the margin (most of the time in most places) consumers are seeing the same price for both fossil and clean resources and the cost of carbon allowances (or carbon taxes) for that marginal resource is reflected in the clearing price for all power bought in the market Carbon adders on the other hand are not actually paid to any resource or reflected in prices for all units sold in the market
25
the Role of foRwaRd caPacity MaRkets in incReasing deMand-side and otheR low-caRbon ResouRces
Auction winners can generally participate in future auctions and receive the market clearing price but have no assurance of future prices Moreover under current rules in PJM energy efficiency resources cannot receive capacity payments over the full life of the measures mdash only for four consecutive delivery years This constraint puts energy efficiency on a different footing than other demand resources mdash as well as all supply-side resources mdash which are paid for their capacity as long as they provide the benefit
The short commitment period and lack of price certainty may not provide market signals that are strong and consistent enough to ensure sufficient new generation or encourage plant operators and investors to make efficient choices for the long-term mdash even where carbon prices are expected to increase substantially in the future due to a dramatically declining carbon cap or a high carbon tax Allowing clean resources to opt for a longer period of time over which the price is known would in particular facilitate renewable resources whose typically high upfront capital costs and low operating costs mdash compared to natural gas-fired plants in particular mdash may require such a long-term commitment to procure financing69 Another option might be to establish fixed floor prices for clean energy resources for a long-term period to provide assurance of a minimum revenue stream
bull Regional load forecasting should be reviewed for treatment of demand-side resources acquired outside the capacity market In particular the system operator determines the capacity that will be auctioned for each delivery year (three years hence) based on a 10-year load forecast which is updated on
an annual basis Under the current planning process in forward capacity markets this forecast only reflects the demand-side resources that have cleared in prior auctions The system operatorrsquos load projections do not take into consideration any load reductions from demand-side resources procured outside of the auction such as energy efficiency programs that LSEs have committed (or are obligated) to fund and implement in the coming one to three years or beyond70 If the magnitude of these load reductions is substantial the ISO may be systematically overstating the level of capacity put out to bid for each delivery year Depending upon the existing mix of resources and market conditions in the region this overstatement may have a sizeable impact not only on the level of cleared capacity and the market price but on the resulting resource mix and level of carbon emissions as well
Additional Actions
Careful design of the planning process and auctions undertaken through forward capacity markets can help to ensure that they reinforce and do not work at cross purposes with climate reduction goals and targets However forward capacity market signals (capacity prices) are only one component of a market and regulatory landscape that affects investment and operating decisions in the power sector Market rules and procurement policies that affect system energy requirements ndash as well as policies and regulations that affect access location and cost recovery for transmission and distribution facilities ndash have an enormous impact on both the short- and long-term resource mix
It is beyond the scope of this paper to fully explore how
69 LSEs in PJM and ISO-NE can contract for generating resources through the bilateral market to hedge energy and capacity costs and to meet renewable energy standards Renewable resource projects that successfully negotiate such contracts if they are long term may not need a long-term commitment in the forward capacity market Still a short-term capacity payment stream with uncertain prices thereafter weakens the ability of renewable resources to secure long-term financing
70 Some of the econometric models that the system operators use for their load forecasts may capture the impacts of federal appliance standards and building codes However to our knowledge there has been no explicit accounting to date for the impacts of state and utility energy efficiency programs where the capacity is not bid into the auctions
RegulatoRy assistance PRoject
26
market rules and other policies and regulations can be harmonized and strengthened to meet customersrsquo energy needs reliably in a carbon-constrained world Larger and longer lasting commitments to demand-side and renewable resources are certainly needed to ensure a mix of resources that will significantly reduce greenhouse gas emissions in the power sector This has been the conclusion of US policymakers who have put in place additional policies to facilitate long-term acquisition of low-carbon resources in regions that operate both forward capacity markets and a cap-and-trade program (under RGGI)71
bull States have adopted a variety of mechanisms for sustained and aggressive energy efficiency programs
bull Strong building codes and equipment standards
bull Stable funding through a system benefit charge
bull Third-party administration of programs or where the utility is the efficiency portfolio manager decoupling of utility profits from revenues financial incentives for shareholders or both
bull Recycling of carbon auction proceeds into energy efficiency investments
bull Some states require long-term resource plans or resource procurement plans that must include energy efficiency Therersquos renewed interest in long-term planning and procurement particularly for demand-side and renewable resources following a period
where these efforts were largely abandoned with electric industry restructuring and development of organized markets72
bull Several states have adopted energy efficiency resource standards that require achievement of specified energy-saving targets73
bull Most of the states have renewable energy standards74 and several states require long-term contracting of renewable resources to meet the standards75
bull Connecticut Maryland Pennsylvania and Rhode Island require contract terms of 10 years or longer
bull New York requires central procurement of renewable energy credits by a state agency under long-term contract Illinois is likely to acquire long-term contracts for renewable resources under its central procurement mandate
bull Massachusettsrsquo Green Power Partnership purchases renewable energy credits for up to 10 years using its renewable energy fund
These are just examples and certainly not an exhaustive list of the ways in which careful design of forward capacity markets coupled with additional policies at the federal regional and state level can serve to reinforce both resource adequacy requirements and carbon reduction goals
71 Regulatory Assistance Project policy grids summarize state-by-state requirements for resource planning and energy efficiency at httpwwwraponlineorgFeatureaspselect=116 For a summary of renewable energy standards in the US see Ryan Wiser and Galen Barbose Lawrence Berkeley National Laboratory ldquoState of the States Update on RPS Policies and Progressrdquo State-Federal RPS Collaborative Nov 18 2009 at httpwwwcleanenergystatesorgMeetingsRPS_Summit_09WISER_RPS_Summit2009pdf
72 More broadly 30 states nationwide require integrated resource plans or resource procurement plans that include energy efficiency
73 Includes states with strict energy efficiency standards states with Commission-ordered efficiency targets states that allow efficiency to count toward renewable energy standards and states with a rate cap that triggers a relaxation of requirements See Laura A Furrey Steven Nadel and John A ldquoSkiprdquo Laitner ACEEE Laying the Foundation for Implementing a Federal Energy Efficiency Resource Standard March 2009 at httpaceeeorgpubse091htm
74 Some 29 US states and the District of Columbia have renewable energy standards five other states have non-binding goals See Wiser and Barbose
75 For a US database of state incentives for renewable energy and energy efficiency see httpwwwdsireusaorg
27
the Role of foRwaRd caPacity MaRkets in incReasing deMand-side and otheR low-caRbon ResouRces
An example of an approach that attempts to ldquomarryrdquo integrated least-cost resource planning with forward capacity markets is the resource planning and procurement process recently established by the Connecticut Legislature76 The law requires the utilities Energy Advisory Board and Department of Public Utility Control to plan for current and future energy and capacity needs and provide a mechanism for procuring resources that meet specified economic reliability and environmental objectives77 to satisfy the identified need Further the law requires that resource needs first be met through energy efficiency and demand reduction resources that are cost effective reliable and feasible Based on the resulting resource plans LSEs enter into
contracts to acquire the required capacity (level and mix) through a competitive bidding process The law also requires that any resources winning contracts for capacity agree to let the LSE bid that capacity into the forward capacity auction as a ldquoself-suppliedrdquo resource This approach permits LSEs to determine both the quantity and mix of resources through integrated resource planning that will meet their resource adequacy requirements and state policy goals (eg carbon reduction) The LSE pays the contracted capacity price (under its bilateral contracts) instead of paying the auction clearing price to everyone that offers capacity into the forward capacity market (eg existing fossil fuel or nuclear plants)78
Connecticutrsquos Marriage of Resource Planning and Markets
76 Conn Gen Stat sectsect 16a-3a 16a-3b and 16a-3c
77 Costs and benefits cost-effectiveness cost impacts on customers the extent to which load growth can be eliminated and peak demand reduced reliability including energy security and economic risks impacts on meeting state environmental standards including emissions goals optimization of existing generation and generation sites the extent to which renewable resources can be used to meet needs and fuel types diversity and supply See Department of Public Utility Control Final Order in Docket No 08-07-01 Feb 18 2009
78 This approach is not without some controversy A contracted new resource in Connecticut has the potential to displace an alternative ldquocompetitiverdquo new resource in the region that would have bid at a higher price mdash had Connecticut not been allowed to designate the contract as self-supply ISO-NErsquos Internal Market Monitoring Unit has commented on this issue in a report to FERC See Internal Market Monitoring Unit ISO-NE June 5 2009
RegulatoRy assistance PRoject
28
Conclusions and Recommendations
Auction-based capacity markets in the US have been successful to date in attracting the capacity needed to maintain system reliability in an economically efficient manner In particular these markets have been successful in facilitating new demand-side resources
with ratepayers and society reaping the economic and environmental benefits However policymakers also should consider capacity markets in the context of carbon reduction policies and targets for the power sector Even markets that successfully integrate demand-side and renewable resources into the auction process are still encouraging the construction or continued operation of high-emitting supply-side resources to meet reliability targets
Existing capacity markets should be evaluated to assess whether the market is responding in this way And if it is policymakers need to critically assess whether a continuation of that market response over the coming years will make it possible to achieve the cumulative level of carbon reductions required from the power sector to avoid the worst effects of climate change Depending on the results of this inquiry policymakers may need to refine the auction rules and adopt additional policies for the power sector mdash such as those described in this paper mdash to ensure the alignment of capacity markets with both short- and long-term carbon reduction goals
More generally forward capacity markets create a revenue stream for resources that can commit to being available at times of system peak several years in the future mdash but this financial incentive is clearly not the only factor driving the mix of resources in the power sector and their resulting carbon footprint Market rules policies and regulations that affect investment and operating decisions for meeting the systemrsquos energy requirements mdash as well as those that affect access location and cost recovery for transmission and distribution facilities mdash have an enormous impact on both the short- and long-term resource mix in the electric system Policymakers will need to consider how this entire market and regulatory landscape mdash including forward capacity markets mdash can be strengthened and harmonized to reliably meet customer demand for electricity in a carbon-constrained world
29
the Role of foRwaRd caPacity MaRkets in incReasing deMand-side and otheR low-caRbon ResouRces
Cleared capacity values in the following tables represent all capacity committed by existing resources remaining in the market and all new resources that bid into the auction at or below
the market clearing price Cleared capacity includes ldquoself-suppliedrdquo or ldquoself-scheduledrdquo resources entered into the auction by LSEs However as described in this paper when the monthly billingsettlement process is completed the capacity charges allocated to the LSE will be offset (credited) for the cleared capacity delivered by these resources
Incremental capacity in the tables below reflects 1) new generation resources 2) capacity upgrades to existing generation resources 3) partial offsets to
incremental generation capacity due to capacity de-ratings to existing generation resources 4) new demand response resources 5) upgrades to existing demand response resources and 6) new energy efficiency resources
PJM Results79
PJM has conducted five Base Residual Auctions since its inception in 2007 for delivery years beginning in 20082009 (that each run from June 1 to May 31) Capacity cleared in the PJM auction is defined in terms of ldquounforcedrdquo capacity that is the capacity of a resource adjusted for availability and deliverability based on historical performance (eg forced outages)
Appendix 1
Detailed Results for PJM and ISO-NE Capacity Markets
Table 1 Generation Demand Resources and Energy Efficiency Resources
Offered and Cleared in PJM Base Residual Auctions (Unforced Capacity in MW)
Delivery Year 20082009 20092010 20102011 20112012 20122013
Generation Offered 1311648 1326142 1321248 1360679 1348730
DR Offered 7158 9368 9679 16524 98476
EE Offered - - - - 6527
Total Offered 1318806 1335510 1330927 1377203 1453733
Generation Cleared 1290614 1313389 1312515 1308566 1285274
DR Cleared 5362 8929 9390 13649 70473
EE Cleared 00 00 00 00 5689
Total Cleared 1295976 1322318 1321905 1322215 1361436
Energy efficiency resources were first eligible in the 20122013 auction
79 All information for PJM compiled from ldquo20122013 RPM Base Residual Auction Resultsrdquo at httpwwwpjmcom~mediamarkets-opsrpmrpm-auction-info2012-13-base-residual-auction-report-document-pdfashx
RegulatoRy assistance PRoject
30
Table 2 Incremental Capacity Additions and Reductions in PJM Base Residual Auctions(Installed Capacity in MW)
Delivery Year 20072008 20082009 20092010 20102011 20112012 20122013 Total
Increase inGenerationCapacity 6020 7242 12723 17762 35763 18935 98445
Decrease inGenerationCapacity -6746 -3754 -5502 -3018 -2647 -32539 -54206
Net Increase inDemand ResourceCapacity 5550 5747 2150 287 6617 79381 99732
Net Increasein EnergyEfficiency Capacity 0 0 0 0 0 6323 6323
Net Increasein InstalledCapacity 4824 9235 9371 15031 39733 72100 150294
Note Change in generation capacity is cumulative net increase in demand-side resources is relative to previous yearrsquos Base Residual Auction
Table 3 Breakdown of Incremental Capacity Resource Additionsin PJM Base Residual Auctions (Installed Capacity in MW)
Delivery Year CTGT Combined Diesel Hydro Steam Nuclear Solar Wind Total Cycle (Coal)
New 20072008 187 03 190Capacity 20082009 270 661 931Units 20092010 3995 238 530 4763 20102011 2833 5800 230 1414 10277 20112012 4164 11350 7048 11 752 23325 20122013 4038 5850 78 363 751 11080
Capacity 20072008 470 470From 20082009 1310 1310Reactivated 20092010 0Units 20102011 1600 107 1707 20112012 800 1010 1810 20122013 0
Uprates to 20072008 1145 139 800 2356 920 5360Existing 20082009 1082 340 180 1055 1960 384 5001Capacity 20092010 1522 2060 1625 614 1974 165 7960Resources 20102011 1173 1630 480 892 1603 5778 20112012 3692 1486 574 1868 2921 87 10628 20122013 2312 1643 142 1930 1260 568 7855
Total 28356 30159 2145 3963 20351 9062 11 4398 98445
Note Values represent capacity commitments Nameplate ratings of variable resources (solar and wind) are far larger than shown here
31
the Role of foRwaRd caPacity MaRkets in incReasing deMand-side and otheR low-caRbon ResouRces
Table 4 Changes to Generation Retirement Decisions
Since Reliability Pricing Model Approval (Unforced Capacity in MW)
Generation Resource Decision Changes Capacity Cleared
Withdrawn Deactivation Requests 17987
Postponed or Cancelled Retirement 13029
Reactivation 1752
ToTal 3276 8
Note Unforced capacity cleared in Base Residual Auctions from resources that withdrew their request to deactivate postponed retirement or were reactivated (ie came out of retirement or mothball state)
Table 5 PJM Base Residual Auction Clearing Price
Delivery Year Clearing Prices ($MW-day)
20072008 $4080
20082009 $11192
20092010 $10204
20102011 $17429
20112012 $11000
20122013 $1646
Note Values do not include any locational price adders Simple conversion of $MW-day to $kW-month multiply by 3 and divide by 100
Table 6 Effect of Demand-Side Resources on PJM Market Clearing Price
20122013 Base Residual Auction80
Actual Auction Results Calculated Results Without Demand-Side Resources
Clearing Prices Cleared Unforced Clearing Prices Cleared Unforced Savings
($MW-day) Capacity (MW) ($MW-day) Capacity (MW) ($MW-day)
$1646 1361435 $17878 1335682 $16232
80 Bowring Monitoring Analytics Table 20
RegulatoRy assistance PRoject
32
ISO-NE ResultsISO-NE has held three forward capacity auctions to
date The first auction (FCA 1) in February 2008 was for capacity delivery beginning in June 2010 (20102011 delivery year) The second auction (FCA 2) was held in December 2008 for delivery in 20112012 and the third
Table 7 Summary Results for ISO-NE Capacity Auctions81
Net Installed Total Resources Excess Clearing Net Price Capacity Cleared Capacity Price ($kW-month)82
Requirement (MW) (MW) ($kW-month)
FCA 1 32305 34077 1772 $450 $425
FCA 2 32528 37283 4755 $360 $312
FCA 3 31965 36996 4649 $295 $254
Table 8 Demand-Side Resources Cleared in ISO-NE Capacity Auctions (MW)81
Distributed Distributed Energy Real-Time Demand Real-Time Total Generation- Generation- Efficiency ResponseLoad Emergency Demand-Side Fossil Fuels Renewable Resources Management Generation Resources
FCA 1 46 lt02 655 978 875 2554
FCA 2 93 lt02 890 1195 759 2937
FCA 3 86 07 975 1206 630 2898
auction (FCA 3) was held in October 2009 for delivery in 20122013 ldquoClearedrdquo amounts in these tables include resources from earlier auctions that remain listed as well as new resources less resources that drop out
Note Net Installed Capacity Requirement values exclude the interconnection benefits associated with the Hydro-Queacutebec Phase III interface Excess capacity is not adjusted for Real-Time Emergency Generation in excess of the 600 MW limit Net prices reflect prorating of clearing prices due to excess capacity clearing the auction Simple conversion of $kW-month to $MW-day divide by 3 and multiply by 100
Note Demand-side values are grossed-up for avoided transmission and distribution losses and reserve margin (no reserve margin forFCA 3) Total resources cleared include excess capacity above the Net Installed Capacity Requirement Real-time emergency generation refers to distributed generation whose state air quality permit limits operation to ldquoemergencyrdquo conditions See Appendix 3
81 ISO-NE Forward Capacity Market Results at httpwwwiso-necommarketsothrmkts_datafcmcal_resultsindexhtml
82 Communication with Henry Yoshimura director Demand Resource Strategy ISO-NE March 2009
83 Eric Winkler ISO-New England ldquoThird Regional Energy Efficiency Initiative Meetingrdquo July 7 2009 and ldquoFCA Updaterdquo Demand Response Working Group Meeting Dec 2 2009 Total resources cleared (Capacity Supply Obligation) from Forward Capacity Market Auction Results for the 20102011 20112012 and 20122013 auctions at httpwwwiso-necommarketsothrmkts_datafcmcal_resultsindexhtml
33
the Role of foRwaRd caPacity MaRkets in incReasing deMand-side and otheR low-caRbon ResouRces
Step 1
System Operator (SO) Plans ldquoForwardrdquo for the Region
2012 Projection of Peak Demand = 10000 MW (incl reserves) Each ldquoLoad Serving Entityrdquo (LSE) is obligated for its 50 share
Appendix 2
Illustration of ldquoHow Forward Capacity Markets Workrdquo
SO purchases capacity in 2012 at the 2009 auction clearing price
LSE can be regulated utility or competitive retail supplier
LSE1 5000 MW
LSE2 5000 MW
R1
R1 =3500 MW capacity ldquoSelf Supplyrdquo Resources (LSE1 ownedunder contract)
RegulatoRy assistance PRoject
34
Step 2
The Regional Capacity Auction (3 Years ldquoForwardrdquo)
Step 3
System Operator Pays Cleared Resources at P and Bills LSEs(Note Self-Supply capacity is a ldquowashrdquo)
R1 R2 R3 R4 R5 R6 R7
P
R1
R3
R3
R5
R5
R2
R2
R4
R4
R6
R7
Bid Price = $ per MW-day
Quantity = MW
6500 MW P
Cleared Capacity = 10000
Supply = Capacity Committed ldquoForwardrdquo
P= Clearing price paid to all capacity clearing auction
Demand = SO Forecast of Capacity Requirements
R1-R7 = Capacity offered by Supply-Side (New built Existing Uprates) and Demand-Side (Energy Efficiency Demand Response Distrib Gen) Self-supply (R1) bids in a ldquozerordquo price New Resources set clearing price
LSE1 5000 MW
LSE2 5000 MW
R1
SOSO pays R1 3500 MW P
LSE2 pays its share of regional demand
5000 MW P
LSE1 pays its share of regional demand (5000 MW) adjusted for self-supply R1 for a net payment of 1500MW P
R1 = 3500 MW of ldquoSelf-Supplyrdquo Resources (LSE1 ownedunder contract)
In 2010Total regional peak demand of 10000 MW supplied by R1 + R2 + R3 + R4 + R5 LSE1 and LSE2 are each responsible for 50 of regional peak demand
35
the Role of foRwaRd caPacity MaRkets in incReasing deMand-side and otheR low-caRbon ResouRces
PJM Eligibility Requirements
Eligibility of demand-side resources has changed significantly over the years in PJMrsquos capacity markets In particular it was not until the most recent capacity auction (May 2009) for the
20122013 delivery year that energy efficiency became eligible to bid in PJMrsquos Base Residual Auction PJM is currently considering a tariff change to also allow energy efficiency to bid into incremental auctions
Under PJMrsquos eligibility rules an energy efficiency resource must achieve a ldquopermanentrdquo continuous reduction in electric energy consumption Examples of such a resource include lighting retrofit programs for residential commercial and industrial customers and programs to retrofit buildings with heating and cooling systems that exceed current efficiency standards To be eligible an energy efficiency resource must meet the following criteria
bull It is fully implemented throughout the delivery year without any requirement of notice dispatch or additional customer action
bull It is not reflected as a reduction in the peak load forecast used for the Base Residual Auction for the proposed delivery year
bull It exceeds relevant standards (such as building codes or appliance standards) at the time of commitment
bull It achieves the specified load reduction (expected average demand in MW) during defined summer on-peak hours84
Demand response on the other hand must be dispatchable mdash that is customer demand must be reduced when instructed For example a large supermarket with
coolers and freezers could install load management equipment that would cycle them on or off mdash and bid that demand response capability into the market85 More specifically a demand response resource must meet the following criteria
bull It is able to reduce demand for electricity up to 10 times each year for up to six consecutive hours per interruption during defined periods86
bull It is fully implemented within one hour (short lead time) or two hours (long lead time) of notice from PJM
bull In a year without calls for demand reductions it must demonstrate reliability through a test of reduction capability
bull It is registered in the Emergency Load Response Program and thus available for dispatch during PJM-declared emergency events
bull Compliance and status reports are filed as required
Multiple end-use customers can be aggregated in order to submit a single demand response offer in the capacity auction if those customers share the same curtailment service provider electric distribution company and transmission zone
In addition customer-sited distributed generation may be offered into auctions as a demand resource A hospital for example could offer to run its back-up generator on certain peak demand (eg hot summer) days to reduce its load on the system Or an industrial plant could cut back on production on such days and continue to run its on-site combustion or steam-cycle turbine
Currently energy efficiency resources may participate
Appendix 3
Eligibility Requirements for Demand-Side Resourcesin US Capacity Markets
84 Weekdays excluding holidays June through August between the hours ending 1500 and 1800 Eastern Prevailing Time (EPT)
85 If instead the supermarket replaced the existing coolers and freezers with more energy efficient ones it would bid that proposal in as an energy efficiency resource Or it could do both (replace and cycle) and bid in the capacity from the permanent savings (replacements) as energy efficiency and the dispatchable capacity (the cycling) as demand response
86 Weekdays excluding holidays from 1200 to 2000 EPT May through September and 1400 to 2200 EPT October through April
RegulatoRy assistance PRoject
36
in Base Residual Auctions for up to four consecutive delivery years In effect this means that PJM limits capacity payments for efficiency measures to four years of their measure life (rather than for the full measure life)87 In contrast a demand response resource (including distributed generation) can participate in the PJM capacity market for as long as its ability to reduce demand continues
ISO-NE Eligibility RequirementsSince the inception of ISO-NErsquos forward capacity market
in 2006 energy efficiency has qualified as an eligible demand-side resource ISO-NE defines demand resources as installed measures (products equipment systems services practices and strategies) that result in verifiable reductions in end-use consumption of electricity in the New England power system These are further categorized into ldquopassiverdquo (energy efficiency and non-dispatchable distributed generation) and ldquoactiverdquo (demand response emergency generation and dispatchable distributed generation) resources Passive demand resources are non-dispatchable but permanently reduce energy demand during peak hours Active demand resources are designed to reduce peak loads and to reduce load based on real-time system conditions or ISO-NE instructions Following are descriptions of eligible demand-side resources and performance requirements88
Passive Demand Resourcesbull On-Peak Demand Resources are measures that are
not weather-sensitive and reduce demand across a fixed set of on-peak hours such as energy-efficient commercial lighting and motors89
bull Seasonal Peak Demand Resources are weather-sensitive measures that reduce load during high-demand conditions such as energy-efficient heating and air conditioning systems Seasonal Peak Demand Resources must reduce load when actual system load is equal to 90 percent of the most recent peak load forecast for the applicable summer or winter season
Active Demand Resourcesbull Real-Time Demand Response Resources are
measures including load management and distributed generation that can be dispatched by ISO-NE as needed They must curtail electrical usage within 30 minutes of receiving a dispatch instruction and until receiving a releaserecall dispatch instruction
bull Real-Time Emergency Generation is distributed generation whose state air quality permit limits operation to ldquoemergencyrdquo conditions Generators must curtail the customerrsquos electrical usage within 30 minutes of receiving a dispatch instruction and until receiving a releaserecall dispatch instruction The amount of emergency generation that can be used to meet ISO-NErsquos capacity requirement is limited to 600 MW If the amount of real-time emergency generation that clears the auction exceeds this level payments to generators are reduced on a pro-rated basis All real-time emergency generation is treated as existing capacity
In contrast to PJM all demand-side resources in ISO-NE are eligible to bid capacity for their full measure life an approach that recognizes the full contribution of these resources to regional resource adequacy requirements and adds value to long-lived energy efficiency assets
87 FERC has directed PJM to evaluate the impact of its capacity payment period for energy efficiency resources
88 Eric Winkler and Abimael Santana ISO-NE ldquoNew Demand Resource Qualificationrdquo May 5 2009 at httpwwwiso-necomsupporttrainingcoursesfcmfcm_forum_may_5pdf
89 Summer on-peak hours are 1300 to 1700 non-holiday weekdays in June July and August Winter on-peak hours are 1700 to 1900 non-holiday weekdays in December and January
The Regulatory Assistance Project (RAP) is a global non-profit team of experts that focuses on the long-term economic and environmental sustainability of the power and natural gas sectors providing technical and policy assistance to government officials on a broad range of energy and environmental issues RAP has deep expertise in regulatory and market policies that promote economic efficiency protect the environment ensure system reliability and fairly allocate system benefits among all consumers We have worked extensively in the US since 1992 and in China since 1999 and have assisted governments in nearly every US state and many nations throughout the world RAP is now expanding operations with new programs and offices in Europe and plans to offer similar services in India in 2011 RAP functions as the hub of a network that includes many international experts and is primarily funded by foundations and federal grants
Home office
50 State Street Suite 3Montpelier Vermont 05602
802-223-8199wwwraponlineorg

RegulatoRy assistance PRoject
6
Forward capacity markets in the US evolved as a way of ensuring resource adequacy at reasonable costs to electricity consumers through a combination of system planning and organized markets Prior to the development of organized markets in parts of the US15 power ldquopoolsrdquo established a reserve margin requirement and each participating LSE was responsible for acquiring installed capacity to meet its individual loads plus that margin or face financial penalties The setting of capacity requirements for the pool as a whole meant however that each LSErsquos reserve requirements were significantly lower than they would otherwise be if it were a stand-alone entity that is participants in the pool benefited from the greater diversity of loads and supply resources that characterized the combined system The pools also facilitated the trading of capacity through bilateral agreements which had particular value in those pools where individual system peaks were temporally differentiated (as in New England whose northern states peaked in the winter and southern states in the summer) After market restructuring LSEs also could trade capacity in auctions run by the system operator responsible for the reliability of the regionrsquos electric grid In those early days of competitive wholesale markets auctions generally were held just a few days before the one-month delivery period
These nascent capacity markets provided insufficient incentives for plants to be available when called on The result was ldquobipolar pricingrdquo If there was a supply surplus capacity prices were effectively zero If there was any shortfall capacity prices rose to the price cap (if any) Moreover short time horizons for the auctions
limited offers for new capacity In addition market power16 concerns surfaced after utilities sold their power plants under electric industry restructuring particularly in areas with significant transmission constraints The Federal Energy Regulatory Commission (FERC) responded with price caps for the energy market that as a side effect limited scarcity price signals Thus ldquoenergy-onlyrdquo power markets mdash that is markets that pay clearing prices for energy on a day-ahead or shorter basis mdash were not paying high enough prices for investors to build sufficient peaking resources to meet future reliability needs
Meanwhile merchant generators were buckling under high fuel prices for new natural gas-fired plants and owners of older less efficient plants filed requests for retirement To maintain system reliability federal regulators approved expensive ldquoreliability must-runrdquo contracts to keep needed plants going and then mandated the development of a more systematic approach for paying for capacity The resulting process produced a mechanism to make capacity payments to all generators not just those applying for retirement and to develop more efficient capacity where it was most needed But the high price tag of such contracts for the New England states led to legal action that ended with a novel settlement in 2006 a capacity market run by ISO-NE that allows energy efficiency and other demand-side resources to compete with generation to meet reliability requirements several years in advance of need In 2007 much of the Mid-Atlantic and Midwest region adopted a similar capacity market run by PJM
How Forward Capacity Markets Evolved in the US14
14 This description draws upon Robert Stoddard and Seabron Adamson CRA International ldquoComparing Capacity Market and Payment Designs for Ensuring Supply Adequacyrdquo Proceedings of the 42nd Hawaii International Conference on System Sciences 2009 and Sandra Levine Doug Hurley and Seth Kaplan ldquoPrime Time for Efficiencyrdquo Public Utilities Fortnightly June 2008
15 See footnote 2 for a definition of ldquoorganized marketsrdquo Southern and western states except for California have not developed organized power markets
16 Such as withholding power to extract higher prices
7
the Role of foRwaRd caPacity MaRkets in incReasing deMand-side and otheR low-caRbon ResouRces
How Forward Capacity Markets Work
A forward capacity market is an administrative market run by a regional system operator who collects supply bids to meet planning targets for regional peak capacity needs runs a competitive auction to establish capacity prices and then procures capacity at the market clearing price to meet the resource adequacy requirements of the region The regional system operator is the sole buyer in this market LSEs are individually responsible for meeting their customersrsquo peak loads and are allocated a pro-rata share of the capacity costs incurred by the system operator to meet those loads
In forward capacity markets LSEs must demonstrate on a ldquoforwardrdquo basis that they will have sufficient capacity to meet their own customersrsquo peak loads (plus required reserves) several years into the future As discussed further below LSEs have the option to meet this requirement through bilateral contracting or LSE-owned generation referred to as ldquoself-suppliedrdquo or ldquoself-scheduledrdquo resources depending on the market However the ISO-NE and PJM capacity markets are mandatory for LSEs in the sense that the system operator will procure any residual needed capacity17 through the auction and assign cost responsibility to LSEs In addition all existing capacity must be offered into the auction along with new demand- or supply-side capacity offerings with certain exceptions
The forward auctions in both PJM and ISO-NE are held three years before the delivery year And the LSEsrsquo ldquoforwardrdquo capacity obligations and amount of capacity put out to bid are
established in advance of each auction Three years was selected to roughly match the minimum lead time required for the construction or development of new capacity once demand- and supply-side resources receive a price commitment from the auction In particular it was chosen to reflect a reasonable construction period for new peaking (eg gas-fired) power plants as well as a reasonable ldquoramp uprdquo period for energy efficiency projects18
For each auction the system operator establishes the level of capacity needed for the delivery year by forecasting (with input from the LSEs and other stakeholders) regional resource adequacy requirements mdash peak loads plus required reserves PJM performs this planning function by developing a downward-sloping demand curve with built-in price elasticity for each auction whereas ISO-NE establishes a single price-inelastic quantity of demand that it auctions in successive rounds of bidding
The capacity bid into the market (the ldquosupply curverdquo) is comprised of capacity commitments (MW) offered by existing and new resources These markets and associated auction rules are designed to allow new resources when needed to set the clearing price Existing resources are generally ldquoprice-takersrdquo in the sense that they are unlikely
to set price unless there is over-supply of existing capacity in the region
The market clearing price becomes the uniform price for all capacity that clears the auction That is the market clearing price is paid to all capacity committed by existing resources and all new resources that have bid into the auction at or below that clearing price There are separate auctions for constrained zones ndash locations
17 The system operator determines the level of residual capacity that it needs to procure to ensure system reliability and purchases that quantity it also must approve the LSErsquos showing of the level of capacity commitment it can meet through owned resources and bilateral contracts
18 See Jenkins et al p 178 and Johannes Pfeifenberger Samuel Newell Robert Earle Attila Hajos and Mariko Geronimo The Brattle Group Review of PJMrsquos Reliability Pricing Model June 30 2008 at httpwwwbrattlecomExpertsExpertDetailaspExpertID=67
19 See PJM Reliability Pricing Model Demand Response and Energy Efficiency at httpwwwpjmcommarkets-and-operationsdemand response~mediamarkets-opsrpm20090406-dr-ee-in-rpm-collateralashx
Sample Calculation of Revenue for a Successful Bidder19
Assume a service provider cleared 20 MW of demand-side resources in a capacity auction that had a clearing price of $100MW-day and that the provider delivered the 20 MW as contracted during the year The annual revenue stream for the year would be 20 MW $100MW-day 365 days = $730000
RegulatoRy assistance PRoject
8
that are experiencing distribution or transmission bottlenecks for the delivery of electricity to end-use customers The clearing prices in these auctions reflect congestion costs and in effect pay a locational adder to capacity available during peak hours in those zones
Only resources that clear the market receive capacity
payments However in order to maintain reliability under very limited circumstances out-of-market payments may be made to resources that do not clear The system operator may determine that a resource critical to maintaining reliability for a given locational zone must continue to run even if its cost of operation is higher than the auction
Using simple assumptions the general ldquoworkingsrdquo of a forward capacity market from the perspective of an individual LSE can be described as follows The system operator forecasts the regional capacity requirements for the future delivery year (2012) and plans to hold the capacity auction for that delivery year three years in advance Each LSE knows its forecasted capacity obligation for 2012 some months before the auction Letrsquos assume there are only two LSEs in the region and they each account for 50 percent of the total regional capacity requirement of 10000 MW projected for the delivery year
At the time of the auction the system operator approves LSE 1rsquos showing that it has bilateral contracts in place to meet 3500 MW of its capacity obligation for the delivery year LSE 2 on the other hand has no bilateral contracts (or generation that it owns) to meet any of its capacity obligation for 2012
Herersquos how it works LSE 1 will offer the 3500 MW under its bilateral contracts as ldquoself-suppliedrdquo or ldquoself-scheduledrdquo resources into the auction at a price of zero mdash and they will automatically clear the auction20 However as described below the auction clearing price will have no impact on what LSE 1 actually pays for this resource It will only pay the capacity price negotiated under its bilateral contracts
Now letrsquos flash forward to 2012 and assume that the actual 2012 peak capacity needs of the customers served
by LSE 1 and LSE 2 turn out exactly as the system operator forecasted for that year 21 and that LSE 1rsquos resources under bilateral contracts were available to meet peak capacity needs as expected At the end of 2012 the system operator calculates what it spent to meet the regionrsquos peak capacity needs LSE 2 will get a bill from the ISO for purchasing on its behalf 50 percent of the regional capacity needs (5000 MW) at the auction price for the 2012 delivery year LSE 1 will get a similar bill from the ISO mdash but with an offsetting credit for the 3500 MW of capacity under its bilateral contracts So in effect LSE 1 only pays the auction price for the ldquoresidualrdquo capacity of 1500 MW mdash the capacity that the system operator purchased to meet the remaining capacity obligation of LSE 1
The scenario is similar if actual 2012 peak loads are greater than forecasted levels LSE 2 will still pay the auction price for all of the capacity that was purchased on its behalf to meet its actual peak capacity needs and LSE 1 will pay that auction price for the (now higher) residual amount above its contracted capacity In this way LSEs can elect to use bilateral contracts to hedge against high capacity prices in the capacity auctions just as they can hedge against high prices in energy markets
Appendix 2 presents a series of slides illustrating this numerical example of how forward capacity markets work
Illustration of Forward Capacity Markets From the LSErsquos Perspective
20 Unless the contracts are structured as a contract-for-differences (see discussion of that option further below) The net effect in either case is the same in terms of the LSE only paying the contracted price for that capacity
21 In actual practice the percentage allocation of capacity costs to LSEs for the delivery year is based on the previous yearrsquos actual peak loads (plus reserves) of each LSE relative to the regional totals mdash but as noted this is a simplified example
9
the Role of foRwaRd caPacity MaRkets in incReasing deMand-side and otheR low-caRbon ResouRces
clearing price Under these circumstances the system operator can still require LSEs to pay for reliability must-run contracts at a cost determined outside the auction process To date the amount of MW under reliability must-run contracts in the PJM and ISO-NE regions is very small In the first few auctions almost all reliability must-run contracts were voided Most of the resources previously under reliability must-run contracts however have been retained through the forward capacity auctions and receive the annual market clearing price
Market Rules to Ensure Performance and Competition
To ensure that any successful bidder will have a very high likelihood of performance during the commitment period resources cannot bid capacity into the market unless they are prequalified by the system operator In particular bidders must demonstrate that they can meet their commitment to provide capacity for the delivery year and their bids must satisfy market rules designed to mitigate market power22 They must pay a qualification deposit must provide financial assurance to ensure commercial operation and can be penalized for performance failures
Further to ensure against a condition in which capacity occupies a place in the power system but is withheld from energy markets and drives up prices all generation and demand-response resources committed in the capacity market must offer into the regionrsquos day-ahead energy market whenever available To mitigate excessive profits to resources also receiving capacity payments from the forward capacity market the system operator reduces these payments to reflect the impact of high energy
market prices The ISO-NE makes this reduction on an annual basis to reflect especially high energy prices in the preceding year23 In the case of PJM this reduction is implemented through a built-in adjustment to the auction demand curve described below
The following section describes some of the unique features of the PJM and ISO-NE capacity markets highlighting in particular their differences
PJMrsquos Capacity Market
PJMrsquos current forward capacity market mdash called the ldquoReliability Pricing Modelrdquo mdash was implemented on June 1 2007 replacing an earlier capacity market design in place since 1999 Eligible capacity resources include new and existing demand and supply-side resources (including generators outside the PJM footprint) PJM recently added energy efficiency as an eligible demand-side resource joining demand response and distributed generation
Each year PJM holds a Base Residual Auction three years in advance of a future delivery year (that runs from June 1st to May 31st) PJM establishes the target capacity level and the auction establishes the price and the actual amount of capacity procured A mechanism called the ldquoVariable Resource Requirementrdquo administratively adds demand elasticity into the auction by imposing a downward-sloping demand curve that adjusts resource amounts procured based on auction prices (See Figure 2) If capacity prices are low PJM intentionally purchases capacity in excess of its target but the total payment by load is also lower If capacity prices are high PJM procures less than the target leaving some capacity to be acquired (at potentially lower prices) in incremental auctions for the delivery year24
In PJM resources are eligible only for a one-year capacity
22 For example in the PJM auction suppliers of existing resources are limited to bidding their demonstrated going-forward costs for nearly all capacity and new resources offered below cost because of support from an LSE contract have a limited ability to set the clearing price
23 This adjustment is not currently applied to energy efficiency resources because they are not eligible to participate in the wholesale energy markets
24 The purpose of administratively developing a downward-sloping demand curve rather than relying on a descending clock auction (as described below for the New England auction) is to help stabilize prices over time when supply is price-inelastic Figure 2 and further details on the mechanics of the Reliability Pricing Model are available from PJMrsquos ldquoReliability Pricing Model Trainingrdquo November 2009 at httpwwwpjmcomtraining~mediatrainingcore-curriculumip-rpmrpm-training-section-d-auctionsashx
RegulatoRy assistance PRoject
10
commitment resulting from each annual auction mdash that is the resource is only guaranteed the auction clearing price for a one-year contract period26 However as long as that resource remains listed in the market it is eligible to receive the auction clearing price for each succeeding year27 Capacity that was offered but not cleared in the Base Residual Auction is eligible to bid into incremental auctions for the same delivery year
In general each LSE is obligated to pay its pro rata share of capacity costs acquired by the PJM system operator through a ldquolocational reliability chargerdquo28 However as described above LSEs can enter into bilateral contracts
(or own generation) to hedge these charges and submit the capacity into the auction as a ldquoself-scheduledrdquo resource at a price of zero29 When the monthly billingsettlement is completed the locational reliability charge to the LSE will be offset (credited) for capacity delivered through self-scheduled resources The net effect of these financial transactions within the market is that the LSE pays the contract price for self-scheduled contracts and does not get paid (or charged) for generation it owns and self-schedules into the auction However self-scheduled resources are counted by the system operator in establishing available capacity to meet regional peak demand (plus reserves) and
25 ldquoUCAPrdquo in this figure refers to ldquounforced capacityrdquo Unforced capacity as defined for the PJM auction represents the MW level of a generating unitrsquos capability after removing the effect of forced outage events It excludes outage events outside of management control
26 There is an exception for a new resource that relieves a congestion constraint It can receive a fixed capacity price for more than one year subject to a review of the congestion relief that it is providing
27 As discussed below energy efficiency is not eligible to remain listed in the PJM capacity market after four years
28 This charge is based on the LSErsquos peak loads adjusted for demand response resources and the applicable zonal capacity price
29 See PJM Manual 18 PJM Capacity Market Revision 9 March 1 2010 pp 4 and 38 at httpwwwpjmcom~mediadocumentsmanualsm18ashx
450
400
350
300
250
200
150
100
50
0125000 130000 135000 140000 145000 150000
Pri
ce (
$M
W-d
ay)
MW (UCAP)
Figure 2 Establishing the Market Clearing Price in PJM - 20122013 Base Residual Auction25
20122013 RTO Supply and Demand
RTO Supply
Clearing Price = $1646
RTO Demand
Note To establish the clearing price when the supply and demand curves do not intersect PJM does one of the following depending on the circumstance 1) Short of supply - Extend the supply curve up vertically until it intersects the demand curve 2) Short of demand - Extend the demand curve down vertically until it intersects the supply curve or 3) Supply curve above demand curve - No capacity will be cleared
Reliabilty requirement = 1337324 MW
Cleared capacity = 1361435 MWReserve margin = 212
11
the Role of foRwaRd caPacity MaRkets in incReasing deMand-side and otheR low-caRbon ResouRces
are subject to applicable performance requirementsIn addition to self-scheduling by LSEs PJM provides
a complete ldquoopt outrdquo ndash the ldquoFixed Resource Requirement Alternativerdquo ndash for LSEs that take full resource planning responsibility for all loads in their service area for a five-year period The projected peak capacity needs for LSEs selecting this alternative are not included in the PJM planning process to establish the regionrsquos capacity needs for the auction and the LSErsquos capacity resources (including capacity acquired through bilateral contracts) are not offered into the auction Moreover under this opt-out alternative the LSE cannot bid any excess capacity into the auction or acquire any capacity through it
Capacity suppliers can cover any auction commitment shortages through the bilateral market facilitated by an electronic system at PJM If capacity shortfalls reach triggering conditions PJM can delay deactivation of a generating resource or hold a backstop reliability auction for capacity resources for a term of up to 15 years30
To improve the availability of capacity resources when needed the capacity product in the PJM market is defined to include forced outage rates based on historical performance and penalties are imposed if the plant is not up and running during a shortage
ISO New Englandrsquos Capacity Market
As in PJM eligible capacity resources in New England include both new and existing demand-side and supply-side resources (including generators outside the ISO-NE footprint) From the start ISO-NErsquos forward capacity market allowed energy efficiency demand response and distributed generation to compete with generation on an equivalent basis which meant among other things that new demand resources could set the market clearing price
Like PJM each year ISO-NE holds a capacity auction three years in advance of the delivery period and sets the amount of capacity to be purchased in each auction In addition to the annual forward capacity auction ISO-NE holds voluntary monthly and annual reconfiguration auctions that allow deficient suppliers to procure replacement capacity These auctions also provide the
system operator the opportunity to buy additional capacity if the load forecast increases or to sell capacity if the forecast decreases
However ISO-NE does not establish a downward sloping demand curve (Variable Resource Requirement) for its auctions Rather ISO-NE puts out a single quantity of capacity for bid referred to as the ldquoInstalled Capacity Requirementrdquo Then ISO-NE uses a descending-clock auction in which market prices are reduced until the quantity of available supply bids matches this capacity requirement Bid quantities and prices decline through successive bidding rounds (with bidders withdrawing resources from the auction as prices decrease) as long as excess capacity is still offered or until the floor price is reached To address start-up issues ISO-NE established a temporary price cap (or ldquostarting pricerdquo mdash see figure below)
30 See PJM Open Access Transmission Tariff Section 16 at httpwwwpjmcom~mediadocumentsagreementstariffashx
Contracts for Differences
Instead of a bilateral contract for physical delivery of capacity an LSE and resource owner can sign a ldquocontract-for-differencesrdquo which means that the level of payments (and who makes them) depends on the auction clearing price For example if the contract price is $50 per MW-day and the clearing price is $46 per MW-day the LSE will pay the resource owner the difference of $4 per MW-day But if the auction clearing price is higher than the contract price the resource owner pays the difference (to the LSE) As in the case of self-scheduled bilateral contracts the LSE will end up paying only the contract price for that capacity However in the case of contracts-for-differences the resource underlying the contract will bid into the market and (if cleared) will receive the auction clearing price And the LSE will be allocated the full locational reliability charge receiving no credits for the contracted capacity The reconciliation happens outside the auction between the LSE and resource owner rather than as part of the monthly billingsettlement process
RegulatoRy assistance PRoject
12
and price floor for the auction The most recent auction for ISO-NE ran seven rounds over two days concluding when the auction reached the floor price of $2951kW-month31
However by rule the load only pays Installed Capacity Requirement times the clearing price so the floor price is further reduced (pro rata) to achieve that effect32 Figure 3 below illustrates the descending clock auction process for ISO-NErsquos first forward capacity market auction
Therersquos another key difference To encourage investment ISO-NE allows new resources to lock in a capacity price for up to five years (with a one-year minimum term)
regardless of clearing prices in subsequent auctions The capacity price is indexed for inflation after the first year and the bidder must select the proposed contract term in advance of the auction Existing resources including existing demand-side resources are eligible only for a one-year price commitment mdash as is the case for PJM
While ISO-NE also permits LSEs to meet their capacity requirements with self-supplied resources (owned resources and resources under bilateral contracts) ISO-NE does not provide an ldquoopt outrdquo alternative as described above for PJM Similar to PJMrsquos ldquoself-scheduledrdquo option the
31 The caps and floors were originally scheduled to be eliminated following the third forward capacity auction However a recent filing by ISO-NE to implement the results of a stakeholder process proposes to continue these mechanisms for the next three auctions For more information on how the descending clock auction functions and how these capsfloors are established see ISO-NE Internal Market Monitoring Unit Review of the Forward Capacity Market Auction Results and Design Elements June 5 2009 at httpwwwiso-necomcommitteescomm_wkgrpsothrfcmwgmtrls2009aug720096-05-09_market_monitor_report_for_fcmpdf
32 With some exceptions resources have the option to pro-rate their cleared MW (rather than take a lower price)
33 Jenkins et al p 178
40000
39000
38000
37000
36000
35000
34000
33000
32000
31000
30000 Start 1 2 3 4 5 6 7 Close
Final Results of ISO-NE FCM Auction 1
$900
Start at $1500
$800 $700$600
$5625
$525 $4875 $450
End-of-round price
Round
Su
pp
ly a
vail
able
(M
W)
at e
nd
of
rou
nd
Final Capacity Needed (ICR)
Figure 3Example of Descending Clock Auction for ISO-NErsquos Forward Capacity Market33
Note Prices are in $USkW-month By rule the load only pays Installed Capacity Requirement times the clearing price so the floor price is further reduced (pro rata) to achieve that effect
13
the Role of foRwaRd caPacity MaRkets in incReasing deMand-side and otheR low-caRbon ResouRces
LSErsquos full capacity obligation (including that portion met through self-supply) is included in the Installed Capacity Requirement put out to bid and the self-supplied resources are also counted towards the resources available to meet that requirement (at a price of zero) in the auction process The net effect for the LSE is also the same The capacity committed as self-supply does not receive any capacity revenue and the LSErsquos capacity obligations satisfied through self-supply are not subject to capacity charges Further the LSErsquos self-supplied resources are subject to applicable penalties and the LSE is subject to capacity charges for any needed residual capacity that the ISO purchases through the auction on its behalf
The penalty provisions in the two regions also differ While both PJM and ISO-NE impose stiff penalty charges if a unit fails to perform when obligated to run ISO-NE also reduces payments to units that are not producing energy at their full capacity level during shortage events mdash similar to the mechanism it uses to reduce capacity payments when prices in the energy market reach very high levels
Role and Eligibility of Demand-Side Resources in FCMs
As discussed above electric systems face a reliability challenge not faced by other commodity markets Because customers are physically interconnected because electricity cannot be meaningfully stored and because electric service is central to economic and social well-being the balance between demand and supply is critical at all times and this balance must be assured over a sustained period of time The FCM design described in this paper recognizes that actions taken on the demand side of the market can effectively moderate price spikes and enhance reliability in a comparable manner as capacity commitments from supply-side generation mdash through short-term customer demand responsiveness during system peak or through permanent and continuous reductions in peak demand (energy efficiency) This market design recognizes that demand-side resources broadly defined to encompass demand response energy efficiency and distributed generation can meet system needs lower costs and add
value to power markets in a variety of circumstances The most important opportunities include34
bull Lowering the cost of power delivery reducing congestion and improving the reliability of the delivery system
bull Enhancing regional power system reliability by using a broad range of demand-side resources to meet planning and operational reserves
bull Economically balancing supply and demand in wholesale power markets through demand-side bidding and market transactions for energy supply released through demand reduction
bull Cost-effectively reducing long-term demand and lowering throughput through energy efficiency resources both on the power grid as a whole and within the resource portfolio of power suppliers
To capture these benefits energy efficiency and demand response (including distributed generation) can now compete on a level playing field with generation in the ISO-NE and PJM forward capacity markets Like generating resources demand-side resources must meet market rules for eligibility and availability including demonstrating they will be available at the start of the proposed delivery year Each type of demand-side resource has a specific set of performance hours across which load reductions are required To be eligible for the auction service providers must demonstrate in advance their ability to perform during those hours Like other resources demand-side resources are subject to penalties if there is a mismatch between their capacity commitment and their performance
Demand-side resources must meet comprehensive standards for measurement and verification (MampV) Failure to comply with MampV protocols makes the resource ineligible for the auction failure to submit post-installation MampV reports results in a final capacity offering of zero for the delivery year plus penalties Generally penalties cannot exceed the revenue that would have been collected if the resource performed as specified in the contract Energy efficiency resources also are audited for compliance Although the capacity obligations and associated penalties for non-performance among supply-side and demand-
34 Richard Cowart Regulatory Assistance Project and Jonathan Raab Raab Associates Ltd Dimensions of Demand Response Capturing Customer-Based Resources in New Englandrsquos Power Systems and Markets Report and Recommendations of the New England Demand Response Initiative July 23 2003 at httpwwwraponlineorgdocsRAP_Cowart_DemandResponseAndNEDRI_2003_07_23pdf
RegulatoRy assistance PRoject
14
side resources are not identical in these capacity markets they are designed and intended to provide comparable incentives to perform during specified hours35
Currently the key difference in eligibility requirements for demand-side resources in the ISO-NE and PJM capacity auctions is the circumstances under which energy efficiency resources may participate Under PJMrsquos rules energy efficiency resources may participate in Base Residual Auctions only up to four years This means that efficiency measures are limited to receiving compensation for their capacity contribution to four years of their measure life rather than their full measure life Demand response resources (including distributed generation) can participate in the PJM capacity market for as long as their ability to reduce demand continues In contrast all demand-side resources in ISO-NE are eligible to bid capacity for their full measure life an approach that recognizes the
full contribution of these resources to regional resource adequacy requirements and that encourages long-lived energy efficiency assets Further description of eligible demand-side resources and performance requirements in these markets is presented in Appendix 3
Forward Capacity Auction Results
In the following sections we summarize the overall level of capacity cleared from existing and new resources in the PJM and ISO-NE auctions the level of incremental capacity successfully bidding into these markets and how different types of resources have fared to date mdash with particular focus on demand resources More detailed results for the PJM and ISO-NE forward capacity markets are provided in Appendix 1
Some stakeholders claim that demand resources are not as available as generation yet they get paid the same price for capacity (implying that they should receive a lower price) A closer examination of the ISO-NE rules reveals several problems with this generalization In particular generation availability can actually vary quite widely because these resources are excused from performing if they are on scheduled maintenance (eg nuclear plants are paid their full monthly capacity payment even when they are shut down for weeks of re-fueling) And other generation resources are ldquoallocatedrdquo a specific number of hours for annual maintenance and are paid as if they are providing capacity services when they are off-line Demand resources have pre-established hours they must be available and are penalized for performance failures differently than traditional generationmdashsome argue more severely For example a demand resource that fails to perform is assessed a penalty for that month and its capacity value is reduced going forward (for all future months) While it is possible to re-establish the capacity value
through future performance (demand response) or with updated MampV (energy efficiency) the process is a slow one that can take many months or more A generation unit that fails to perform is assessed a penalty for that month but its capacity value is either unchanged or can be reestablished with a test run at anytime and the monthly capacity payments continue with no reduction Generation plants with long notice requirements (eg 24 to 48 hoursrsquo notice for coal-fired plants if the system operator wants them on-line and actually providing energy) are paid the same as a demand response resource that is required to be dispatchable by the system operator within 30 minutes throughout the year to address shortage events (See Appendix 3) Clearly there are individual rules that stakeholders can argue work to the advantage of supply-side over demand-side resources and vice versa Overall the intent of such variations should be to make obligations penalties and payments for demand and supply resources roughly comparable while recognizing the unique operational issues associated with all resources
Performance Incentives Demand- vs Supply-Side Resources
35 Nonetheless there continues to be debate among stakeholders over whether the appropriate balance has been reached See text box
15
the Role of foRwaRd caPacity MaRkets in incReasing deMand-side and otheR low-caRbon ResouRces
Auction Results for PJM36
PJM has held five Base Residual Auctions including the most recent May 2009 auction for the 20122013 delivery year PJM serves a large market The 20122013 Base Residual Auction cleared a total of 1361436 MW of capacity While generating resources account for nearly all of this committed capacity (1285274 MW) demand response resources (including distributed generation) represent 5 percent of the total (70472 MW) New for the 20122013 delivery year 5689 MW of energy efficiency also cleared the market Table 1 in Appendix 1 lists capacity resources offered and cleared to date As indicated in that table the vast majority of demand-side resources offered into the market cleared each PJM base residual auction
Figure 4 below illustrates the increasing role of demand-side resources in PJM
Renewable generating resources also are gaining some traction in the capacity market although not anywhere near the magnitude of demand-side resources in terms of their overall contribution to resource adequacy requirements This is due to the predominance of wind resources and their variable nature PJM applies a 13 percent on-peak capacity factor to these resources mdash for every 100 MW of wind resources only 13 MW are eligible to meet capacity requirements Some 3234 MW of wind capacity resources cleared in the most recent Base Residual Auction mdash 95 percent of the amount offered While this capacity level is miniscule compared to the total capacity clearing the auction it translates to a large nameplate rating mdash 2488
12000
10000
8000
6000
4000
2000
0
Active Load Management
Prior to RPMImplementation RPM Implemented
Interruptible Load for Reliability
Energy Efficiency RPM Offered Demand Response
Figure 4 Demand-side Participation in PJMrsquos Reliability Pricing Model (RPM) Auctions
Note Demand-side resources included Active Load Management prior to the 20072008 delivery year Interruptible Load for Reliability and Demand Response were first eligible for the 20072008 delivery year Energy Efficiency resources were first eligible for the 20122013 delivery year (May 2009 auction) The large increase in demand response participation in the 20122013 delivery year is in large part due to the elimination of PJMrsquos ILR program
200506 200607 200708 200809 200910 201011 201112 201213
36 Except where noted information and figures in this section and referenced tables in Appendix 1 are from PJM ldquo20122013 RPM Base Residual Auction Resultsrdquo at httpwwwpjmcom~mediamarkets-opsrpmrpm-auction-info2012-13-base-residual-auction-report-document-pdfashx
RegulatoRy assistance PRoject
16
MW of wind resourcesPJM reports that the Base Residual Auctions have
attracted 150294 MW of incremental capacity in the region to date Incremental capacity refers to new generation resources capacity upgrades to existing generation resources new demand response resources upgrades to existing demand response resources and new energy efficiency resources37 Natural gas- and coal-fired plants account for most of the incremental capacity with nuclear plants (from uprates) also making a sizable contribution Tables 2 and 3 in Appendix 1 provide details on the incremental capacity procured It is important to note that the figures in these tables represent resources new to the capacity market including uprates mdash not all are newly built However they include a new merchant coal plant built for the PJM market38
True to one of the original goals the PJM capacity market also has been successful in retaining existing capacity from power plants that were originally under high-cost reliability must-run agreements39 Since FERC approved the Reliability Pricing Model existing capacity that would otherwise have been deactivated or retired has accounted for 32768 MW of procured capacity Table 4 in Appendix 1 shows these changes in resource deactivation and retirement
Market clearing prices for resources in PJMrsquos Base Residual Auctions to date have ranged from $1646 to $17429 per MW-day not including any locational price adders for constrained areas (See Table 5 in Appendix 1) Importantly the $1646MW-day clearing price for the 20122013 delivery year represents a decrease of $9354MW-day from the previous Base Residual Auction due in part to significant increases in capacity from demand response and the introduction of energy efficiency resources into the bidding process Moreover the participation of demand-side resources is estimated to have reduced the market clearing price for the 20122013 delivery year by an astonishing $16232MW-day in unconstrained zones (ie from a clearing price of $17878MW-day without these resources in the bid stack to the actual clearing price
of $1646MW-day) Table 6 in Appendix 1 shows the calculation by PJMrsquos independent market monitor
Auction Results for ISO-NE
ISO-NErsquos forward capacity market is about a quarter of the size of the PJM capacity market mdash the Installed Capacity Requirement set by ISO-NE for the 20122013 delivery year was 31965 MW ISO-NE has held three forward capacity auctions to date and all of them cleared at the administratively set floor price ($450kW-month $360kW-month and $295kW-month respectively) with surplus capacity above the Installed Capacity Requirement set by ISO-NE to meet reliability needs The first auction secured 1772 MW above the requirement the second auction cleared 4755 MW of excess capacity and the third auction cleared 4649 MW of excess capacity (See Table 7 in Appendix 1)
Demand resources have consistently represented about 8 percent of the resources cleared in the three auctions (2554 MW 2937 MW and 2898 MW respectively) an amount that exceeded expectations Energy efficiency accounted for about a quarter of the demand resources in the first auction and about a third in more recent auctions Real-time demand response comprises the largest share of demand resources Emergency generation (ie distributed generation whose state air quality permit limits operation to ldquoemergencyrdquo conditions) also makes a sizeable contribution Non-emergency distributed generation however comprises a negligible amount of the total Table 8 in Appendix 1 shows detailed results for demand resources
Figure 5 shows the growth in demand resources offered and cleared in the first two ISO-NE auctions by type There has been a steady growth in demand-side resources in New England since the first demand-response programs operated by ISO-NE The forward capacity auctions have contributed to and solidified these gains
Participation of demand-side resources in the ISO-NE forward capacity auction has been credited with making the clearing price lower than it would have been otherwise
37 The increase is partially offset by capacity de-ratings to existing generation resources
38 See Pfeifenberger et al at 27
39 As discussed above these contracts have not been dispensed with altogether however
17
the Role of foRwaRd caPacity MaRkets in incReasing deMand-side and otheR low-caRbon ResouRces
as it has in the PJM region Analysis of the first auction bids for example suggests that the participation of these resources saved ratepayers as much as $280 million by lowering the price paid to all capacity resources in the market40
Moreover by contributing to the excess capacity that kept capacity payments at relatively low floor prices in New England the participation of demand-side resources has
also contributed to lower overall market revenues inducing some inefficient oil-fired generating units to shut down at least temporarily Nonetheless existing and new fossil-fuel resources continue to dominate the capacity commitments in this region as is the case for PJM
Overall renewable generating resources (primarily wind resources) are making some headway in the regionrsquos forward capacity market but as in PJM they are not
40 See Cheryl Jenkins et al This calculation reflects what the market clearing price would have been in the auction given the Installed Capacity Requirement put out to bid by the system operator which assumes no impact of energy efficiency programs on loads (because energy efficiency is bidding) Therefore the calculated reduction in clearing price represents a theoretical maximum mdash excluding demand resources from the market would likely have been at least partially offset by a lower amount of capacity put out to bid As a result the difference in the market clearing price (and savings to consumers) would likely have been smaller than the number calculated here although it is difficult to say by how much However even if demand-side resources were not permitted to bid they would contribute to lower prices for consumers by lowering the total quantity of capacity required
41 Internal Market Monitoring Unit ISO-NE June 5 2009
4500
4000
3500
3000
2500
2000
1500
1000
500
0
New UnclearedTotal Uncleared1375 MW
Total Uncleared1159 MW
Total Cleared2279 MW
Total Cleared2778 MW
New Cleared
Existing Delisted Uncleared
Existing Cleared
FCA 1 FCA 1
Figure 5 Demand-Side Participation in ISO-NE Capacity Auctions by Type41
copy ISO New England Inc
Note Activerdquo resources include demand response and emergency generation energy efficiency is considered a ldquopassiverdquo resource Clearing amounts reflect ISO-NErsquos maximum limit of 600 MW of Real-Time Emergency Generation In contrast Table 8 in Appendix 1 shows the actual amount of such resources that cleared the auction Capacity payments to these resources are pro-rated if cleared levels exceed 600 MW
Cap
acit
y (M
W)
Active
Active
Active
Active
Active
Active
Active
Active
Passive
Passive
Passive
Passive
Passive
RegulatoRy assistance PRoject
18
a major contributor to the regionrsquos resource adequacy requirements at this time In the most recent (third) auction 166 MW of wind capacity cleared the auction mdash with a nameplate rating an order of magnitude larger42
Unlike PJM ISO-NE does not apply a deemed on-peak capacity factor to wind and other variable generation resources Instead all such resources must provide data that demonstrate the claimed summer and winter qualified capacity The capacity factor is adjusted over time based on actual performance during specified hours
Forward Capacity Markets in the Context of Carbon Constraints
Power market rules are not constructed in a vacuum rather they are designed to address specific public policy goals As described above forward capacity markets in the US were developed to ensure resource adequacy in the power system at a reasonably competitive price In the face of growing carbon constraints however power market rules need to be redesigned to work in concert with carbon reduction goals and policies rather than at cross purposes The challenge of substantially de-carbonizing the power sector in the coming years is too great to ignore this interaction In particular policymakers should carefully consider what elements of the current planning and procurement process to achieve resource adequacy contribute to the following effects ndash and then work to revise the market rules accordingly
bull Do the market rules encourage new investments in high-emitting resources (including repowering) at the expense of low-carbon alternatives
bull Do they encourage the continued (or increased) operation of existing high-emitting power plants
bull Will they result in a build-out of capacity and cumulative emissions that conflict with the level of de-carbonization required in the power sector mdash or make attainment of that level more costly to the economy
This paper is not intended to evaluate the PJM and ISO-NE capacity markets and auction rules in any depth with respect to these issues However we offer below general observations based on the auction design and results to date in these regions and other studies Following that we provide policy recommendations related design options and additional actions for consideration
General Observations on Forward Capacity Markets and Results
Based on our review of FCM auctions to date and related studies we offer the following observations
bull The ISO-NE and PJM forward capacity markets are meeting their resource adequacy objectives Sufficient levels of capacity have cleared the market to meet each regionrsquos anticipated peak demand and adequate resources are now committed on a forward basis to ensure reliable coverage in future years (up to the 20122013 delivery year) But in a carbon-constrained world the mix of resources is as important as the quantity in both the short-term and the long-term Most resources that are available during peak demand hours also produce electricity or reduce consumption during many more (or all) hours of the year and the carbon intensity of that mix of resources will drive the level of cumulative emissions in the power sector43 As discussed in this paper capacity markets as currently designed provide compensation based on the level of available capacity not the mix of resources providing that capacity It is worth repeating here that the only (non-price) attribute a resource needs to demonstrate for resource adequacy purposes is that it will be available when called upon during the projected hours of peak system loads In a carbon-constrained world policy makers should ask whether the planning and procurement process for acquiring a sufficient level of capacity at a reasonable price is also moving the resource mix in the right direction mdash towards zero or low carbon-emitting demand- and supply-side resources
42 Compiled from auction results at httpwwwiso-necommarketsothrmkts_datafcmcal_resultsccp13fca13indexhtml
43 With the exception of gas-fired peaking units or demand response resources that are dispatched to meet (or reduce) loads only during peak system hours
19
the Role of foRwaRd caPacity MaRkets in incReasing deMand-side and otheR low-caRbon ResouRces
bull Expressly designing demand-side resources into forward capacity markets appears key to achieving all three objectives ndash resource adequacy low-carbon resource mix and reasonable price Energy efficiency and demand response resources are faring well in auction-based capacity markets mdash and this is a positive outcome for several reasons First energy efficiency and other demand-side resources can substitute for existing and planned generation that have a higher carbon footprint thereby reinforcing carbon reduction policies and targets for the region Second demand-side resources can dramatically reduce the costs of meeting the regionrsquos resource adequacy requirements mdash as evidenced by the results of the PJM and ISO-NE auctions In addition the increase in demand-side resources facilitated by capacity auctions can reduce market power because more suppliers and more resources means individual generators have less ability to affect bid offers and clearing prices And because demand-side resources lighten the load at the end of the supplydelivery chain they enhance the reliability of each link in the chain from fuel supply and generation to the local distribution network
bull Differences in the impact of demand-side resources on carbon emissions should be recognized in capacity markets and associated auction rules Energy efficiency decreases carbon emissions because (by definition) it reduces energy use for an equivalent level of service and at the margin almost all power systems are running higher carbon resources In contrast the net impact of demand response on carbon emissions will depend upon specific circumstances including the mix of
plants serving loads at the margin For example when coal is primarily serving baseload and intermediate needs emissions may increase when customers shift loads from on-peak (when natural gas is on the margin) to off-peak periods44 Elsewhere however demand response mdash including any conservation side-effect mdash may reduce emissions from less efficient peaking plants In addition demand response includes real-time emergency generation which is often fossil-fuel powered (eg by diesel or natural gas) Any analysis of the costs and benefits of demand response resources in capacity markets should account for such effects Policies and market rules for demand response should be aligned with its environmental costs and benefits45
bull Renewable generating resources are beginning to make some headway in forward capacity markets mdash in particular wind resources This is in large part because the markets described here recognize some capacity value for variable renewable resources (wind solar and run-of-river hydro) either through a deemed on-peak capacity factor or a demonstration of claimed capacity for specified on-peak periods Policymakers need to pay attention to how these values are established so they can be confident the committed capacity will be available when called on while at the same time encouraging participation of all low-carbon resources in the market More generally as renewable resources become a more significant part of the resource mix a forward capacity market creates the opportunity to recognize their aggregate capacity value to the system46
44 For example PJM recently released figures on carbon emissions of generating units that operate on the margin during on-peak vs off-peak hours See httpwwwpjmcom~mediaabout-pjmnewsroom2010-releases20100325-pjm-reports-new-carbon-dioxide-emissions-dataashx and httpwwwpjmcomdocuments~mediadocumentsreportsco2-emissions-reportashx
45 See section 316 and Mechanism E in Attachment 1 of Pacific Northwest National Laboratory The Smart Grid An Estimate of the Energy and CO2 Benefits January 2010 (PNNL 19112) at httpenergyenvironmentpnlgovnewspdfPNNL-19112_Revision_1_Finalpdf
46 Variable renewable resources will qualify for higher capacity value if they are bundled with other resources for reliability (eg demand response hydroelectric dams or energy storage) In addition confidence in the capacity value of variable resources increases as their geographic diversity on the system increases See for example the report on the Eastern Wind Integration and Transmission Study at httpwwwnrelgovwindsystemsintegrationpdfs2010ewits_final_reportpdf
RegulatoRy assistance PRoject
20
bull Nonetheless renewable resources are hard-pressed to successfully compete with the thousands of megawatts of existing and new fossil-fuel resources participating in these auctions that are able to bid below the true societal cost of their operations under current market rules In fact capacity auctions as currently designed can breathe new economic life into high carbon-emitting plants that were previously planned for significantly reduced operations or retirement Along with new capacity from fossil-fuel generation allowing such a large amount of existing capacity from high carbon emitters to clear the auction is likely to crowd out renewable resources that are able to address resource adequacy requirements equally well Such results may not represent an ldquoefficientrdquo (or desirable) outcome for a carbon-constrained power sector This is especially true where the carbon costs of a fossil-fuel plant are not fully recognized in the energy market that plant also will be bidding into
The Electric Power Research Institute modeled the effect of various levels of carbon taxes or allowance prices in the upper Midwest (coal-dependent) and in Texas (heavily reliant on natural gas) The study found that close to a doubling of the wholesale prices of electricity in the Midwest region (through carbon-related charges) would produce only a 4 percent reduction in regional emissions given the current generation mix Similar results were observed for Texas where natural gas plants are on the margin49 And in the Northeastern US due to initially low carbon prices and a host of factors that dampen the price signal the Regional Greenhouse Gas Initiative (RGGI) has not yet resulted in generator operational changes50 One of those dampening factors is the single clearing price that is typically set through wholesale energy markets mdash which dilutes the market signal sent by a price on carbon emissions by allowing fossil-fueled plants to recover
most or all of their allowance costs through higher clearing prices reflecting the cost of allowances51
Studies also have shown that the price of carbon must rise (and be maintained) at very high levels to obtain sufficient market pull for the level of new investments in clean generation required For example a recent analysis in California concluded that it would take a carbon price of $100 per tonne52 to make economic investments in renewable resources compared to fossil fuel-fired generation in order to reach carbon reduction targets in the power sector beyond what current state requirements will achieve53 Further price signals may be diluted if a portion of the carbon allowances are allocated in a manner that shields high-emitting power plants from carbon costs or if high-emitters located outside the capped region can sell into the market on a long-term basis
Carbon Pricing Alone Is Insufficient to De-carbonize the Generation Mix
bull A market price for capacity or energy that favors the construction and operation of high carbon-emitting resources over clean resources will lead to increases mdash rather than reductions mdash in the cumulative level of carbon emissions in the power sector A carbon tax or carbon cap-and-trade regime internalizes some or all of the otherwise un-priced carbon costs of electricity production and would improve the relative economics of clean resources in both forward capacity and energy markets However carbon pricing alone may be insufficient to change the dispatch of existing high-emitting power plants or their ability to clear these capacity markets (and be paid additional revenues as a result) in such overwhelming numbers47 In fact the very modest impact of carbon pricing on the performance of fossil-fuel plants has been documented in several reports48 (See text box below)
47 With or without carbon prices policymakers also might want to consider the implications of paying existing power plants the market clearing price for capacity mdash and the potential windfall profits for plant owners mdash for making no changes in plant operations See for example Ezra Hausman Paul Peterson David White and Bruce Biewald Synapse Energy Economics Inc RPM 2006 Windfall Profits for Existing Base Load Units in PJM An Update of Two Case Studies Feb 2 2006 at wwwsynapse-energycom
21
the Role of foRwaRd caPacity MaRkets in incReasing deMand-side and otheR low-caRbon ResouRces
bull Carbon pricing alone will have limited impact on consumer decisions to invest in permanently reducing their peak demand by making cost-effective investments in energy efficiency Well-designed time-varying pricing options can successfully shift demand from high-price hours to lower price hours54 Such shifting also reduces peak demand on transmission and distribution systems Overall energy use will decline somewhat in response to price But long-term reduction in energy use due to price increases is relatively small The numerous market barriers to capturing the full cost-effective potential of energy efficiency ndash through improvements in building construction practices and industrial processes retrofits of existing buildings and installations of high-efficiency appliances and equipment in homes and businesses ndash are well-documented They include lack of information high first-costs consumersrsquo high discount rates and the landlord-tenant split incentive problem among others55 Recent empirical analysis of demand elasticities suggests that the long-term price elasticity of demand for electricity is even lower than earlier studies have indicated for both liberalized and regulated markets (See text box on page 21)
In sum while forward capacity markets are meeting their resource adequacy objectives and clearing an impressive amount of clean low cost demand-side resources on balance these markets (as currently designed) are not working sufficiently in concert with carbon reduction goals and policies in the face of growing carbon constraints For the reasons discussed above carbon pricing alone
48 See Testimony of Richard Cowart Regulatory Assistance Project Before the Committee on Energy and Commerce Subcommittee on Energy and Environment US House of Representatives April 23 2009 ldquoThe Consumer Allocation for Efficiency How Allowance Allocations Can Protect Consumers Mobilize Efficiency and Contain the Costs of GHG Reductionrdquo at httpenergycommercehousegovPress_11120090423testimony_cowartpdf
49 See Victor Niemeyer ldquoThe Change in Profit Climate How Will Carbon-Emissions Policies Affect the Generation Fleetrdquo Public Utilities Fortnightly May 2007 at 20 24
50 See ldquoRGGI marks its first year with success and lesson on effect of market pressurerdquo Electric Utility Week Dec 14 2009 Ten Northeast and Mid-Atlantic states participate in RGGI the first mandatory cap-and-trade program in the US Connecticut Delaware Maine Maryland Massachusetts New Hampshire New Jersey New York Rhode Island and Vermont Nine of them participate in either the ISO-NE or PJM forward capacity markets described in this paper
51 PJM Interconnection ldquoPotential Effects of Proposed Climate Change Policies on PJMrsquos Energy Marketrdquo Jan 23 2009 p 5 See also ldquoBecause Thatrsquos Where the Money Is The FERCrsquos Ability to Reduce the Cost of Slowing Global Warmingrdquo Samuel A Wolfe Chief Counsel New Jersey Board of Public Utilities December 2009 at httpwwwnarucorgpublicationsWOLFE-20Panel203pdf
Demand for Power Is Relatively Price-Insensitive mdash Even Over the Long Term
Modeling by the US Department of Energy suggests that a 10 percent increase in power prices will reduce demand for electricity by just 25 percent to 3 percent over 20 years assuming that the price effects persist over that entire period56 This would only offset the normally expected US load growth in two out of those 20 years57
More recently a 2009 empirical analysis of the demand for electricity in the US concludes that price elasticity of residential demand has actually decreased since retail price deregulation was first introduced in the US The results suggest that a 10 percent increase in power prices will reduce residential electricity demand more on the order of 12 percent to 17 percent based on 2001-2008 data for both deregulated and regulated states58 Price responsiveness is further dampened by the income-elasticity of demand which is positively correlated with consumption As incomes increase consumption of electricity goes up and the conservation impact of any price increase is diminished59 The equivalent historical figure for a 10 percent increase in power prices in the UK residential sector is -23 percent but the income-elasticity is such that a 10 percent increase in income results in an increase of demand of 34 percent ndash ie household income is just as important as energy price in determining energy demand60
RegulatoRy assistance PRoject
22
is unlikely to shift the power sector resource mix at the pace or scale required to meet aggressive carbon reduction targets ndash or correspondingly to substantially change the dominance of high-carbon resources clearing forward capacity auctions under current market rules An increasing number of studies makes a compelling case that our economy and our society cannot afford this dominance to persist much longer if we are to contain climate change to a livable level In fact close to full de-carbonization of the
power sector is being discussed in international forums as the only way to meet essential carbon reduction targets by 205061 While capacity markets alone are unlikely to support the full value of clean energy resources in a carbon-constrained power sector by themselves with appropriate design elements they can serve to reinforce actions taken at federal regional and state levels that provide larger and longer lasting commitments to clean demand-side and renewable resources62
52 A tonne or metric ton is a unit of mass equal to 1000 kilograms (roughly 2205 pounds) or approximately the mass of one cubic meter of water at four degrees Celsius A tonne is not the same as either a ldquoshortrdquo ton (2000 pounds) or a ldquolongrdquo ton (2240 pounds)
53 Energy and Environmental Economics Inc Greenhouse Gas Modeling of Californiarsquos Electricity Sector to 2020 Updated Results of the GHG Calculator Version 3 prepared for the California Public Utilities Commission October 2009 pp 66-67 at httpwwwethreecomdocumentsGHG_102209CPUC_GHG_Final_Report_28Oct09pdf
54 Ahmad Faruqui and Sanem Sergici The Brattle Group ldquoHousehold Response to Dynamic Pricing of Electricity A Survey of the Experimental Evidencerdquo Jan 10 2009 at httpwwwhksharvardeduhepgPapers2009The20Power20of20Experimentation20_01-11-09_pdf
55 See for example American Council for an Energy Efficient Economy ldquoQuantifying the Effects of Market Failures in the End-Use of Energyrdquo pp iii-vi 2007 at httpoldaceeeorgenergyIEAmarketbarrierspdf This study details the various types of market barriers to end-use energy efficiency and reports that up to 50 percent of residential energy use in the US is affected by such barriers
56 The US Department of Energyrsquos National Energy Modeling System (NEMS) has price elasticity built into it The long-run elasticity (assuming price effects remain for 20 years) are ndash031 for residential electric use and ndash025 for commercial electric use See Steven H Wade ldquoPrice Responsiveness in the NEMS Buildings Sector Modelrdquo in Energy Information Administrationrsquos Issues in Midterm Analysis and Forecasting 1999 pp 55 58 table 1 at httpwwweiadoegovoiafissuespdf060799pdf
57 This would require a much larger rate increase just to offset expected load growth over 20 years let alone to reduce demand sufficiently to permit absolute reductions in emissions from the nationrsquos huge generation fleet See Testimony of Richard Cowart
58 T Nakajima and S Hamori ldquoChange in Consumer Sensitivity to Electricity Prices in Response to Retail Deregulation A Panel Empirical Analysis of the Residential Demand for Electricity in the United Statesrdquo Energy Policy (2010) available at wwwsciencedirectcom
59 Ibid
60 John Dimitropoulas Lester C Hunt and Gary Judge ldquoEstimating Underlying Energy Demand Trends Using UK Annual Datardquo at httpuserwebportacuk~judgegAEL_04pdf
61 See for example Meeting Carbon Budgets ndash The Need for a Step Change Progress Report to Parliament Committee on Climate Change October 2009 at httpwwwthecccorgukreportsprogressreports Christopher Jones and Jean-Michel Glachant Why and How the European Union Can Get a (Near to) Carbon-Free Energy System in 2050 MIT Center for Energy and Environmental Policy March 2010 at httpdownloadsthecccorgukdocs2166720CCC20Executive20Summary20AW20v4pdf Roadmap 2050 A practical guide to a prosperous low-carbon Europe The European Climate Foundation April 2010 at wwwroadmap2050eu
62 Without such policies it is unlikely that even RGGIrsquos modest carbon reduction goals will be achieved See Paul Peterson Doug Hurley and David White Synapse Energy Economics Inc ISO New England Scenario Analysis Companion Report Constructing a Future That Meets Regional Goals Aug 8 2007 at wwwsynapse-energycom
23
the Role of foRwaRd caPacity MaRkets in incReasing deMand-side and otheR low-caRbon ResouRces
ISO-NE Rules for Emergency Generators Advance Environmental Goals
Emergency (ldquobackuprdquo) generators typically are diesel-fired and states in New England and elsewhere in the US have restricted the number of hours and days they may be operated through the state permitting process At the time the first regional demand response tariffs were being designed in New England a collaborative of energy regulators environmental regulators the ISO utilities and other stakeholders realized that active demand response programs could lead to substantial incentives for diesel-fired backup generators to operate more often when air quality was at its worst Regulators and the ISO proposed a rule limiting those generators to run for reliability purposes during system emergencies This is a concrete example of reliability rules being written to advance environmental goals as well as power system needs63 In addition a regional working group developed model emissions standards for small generators for statesrsquo consideration64
To reinforce regional air quality policies and goals ISO-NE limits the total amount of emergency generators in the regional capacity market to 600 MW To the extent any excess amount clears the auction capacity payments to these resources are pro-rated
63 See Cowart and Raab p 26
64 See Model Regulations for the Output of Specified Air Emissions From Smaller Scale Electric Generation Resources Oct 31 2002 at httpwwwraponlineorgshowpdfaspPDF_URL=22docsrap_issuesletter-outputbasedemissioninsert_2003_07pdf22
65 Edward S Rubin Carnegie Mellon University ldquoA Performance Standards Approach to Reducing CO2 Emissions for Electric Power Plantsrdquo June 2009 at httpwwwpewclimateorgpublicationsreportcoal-initiative-series-performance-standards-approach-reducing-co2-emissions-ele Also see Chris Simpson and Brenda Hausauer ldquoEmissions Performance Standards in Selected Statesrdquo Regulatory Assistance Project Research Brief November 2009 at httpwwwraponlineorgdocsRAP_Simpson_EPSResearchBrief_2009_11_13pdf
Policy Recommendations and Auction Design Options
We present below recommendations and a menu of auction design options for forward capacity markets that support and enhance carbon policies and carbon reduction targets
bull Power market rules should be constructed to recognize and limit the adverse environmental consequences of power generation The power system and the environment are inextricably linked Explicit consideration of environmental costs and benefits of various electricity resources is not only reasonable but necessary to meet the enormous challenge of climate change
bull Forward capacity markets should reinforce carbon reduction policies which could be accomplished by incorporating one or more of the following into the auction rules
Auction rules could apply an Emissions Performance Standard (EPS) to promote capacity commitments from low-carbon resources and discourage bids from high-emitting power plants An EPS can be expressed as a maximum level of greenhouse gas emissions per unit of electrical output or as a percentage reduction in (annual) plant emissions It can vary with fuel type and incorporate other design variations65 It may be appropriate to adopt an EPS mdash within the auction qualification rules or by regulation mdash particularly if current market signals are not sufficiently
discouraging new construction or repowering of high-emitting generating resources with long lifetimes while forward capacity markets are providing a new revenue stream to keep them running
RegulatoRy assistance PRoject
24
Auction rules could disqualify inefficient generators from participating (and from receiving capacity revenue) or more generally require their retirement through financial incentives regulations or both66 Since 2007 China has been phasing out such plants and intends to retire approximately 50 gigawatts (GW) of small inefficient coal-fired power plants nationwide and 7 GW to 10 GW of small natural gas-fired units as well as halt construction of small inefficient power plants The policy is being put in place three ways the direct rescission of operating permits the transfer of generation rights and price reductions
Capacity payments could vary by the emissions rate of the resource Instead of one price paid to all generation that clears the auction adders could be applied to payments for low-emitting units and deductions could be applied to high-emitting units67 For example a sliding-scale percentage reduction to the per-unit ($kW-month or $MW-day) clearing price could be established based on the average annualized carbon footprint of fossil-fuel resources whereas a price adder above the clearing price could be established for zero-emitting resources
Imputed ldquocarbon addersrdquo could help curtail high-emitting resources Carbon adders are imputed costs that reflect at least a portion of the societal cost of emissions They are generally
used in the context of resource planning and acquisition by a regulated LSE mdash as a way of ensuring that high-carbon risks and low-carbon alternatives are properly valued in the resource selection process But these imputed costs do not get passed on to ratepayers or consumers for every unit of power consumed in contrast to carbon pricing68 Similarly the rules in a forward capacity market could be modified so that carbon adders are applied in determining what resources clear the auction (and will receive the market clearing price for their capacity commitment)
A ldquozero-carbon resource portfolio standardrdquo could establish auctions for separate tranches of resources by emissions level For example one tranche could include energy efficiency and renewable resources The size of each tranche would be based on carbon reduction goals for the region The higher the goals the larger the tranche for energy efficiency and renewable resources These resources decrease carbon emissions because at the margin most power systems are running higher carbon resources
bull Policymakers should consider a longer price commitment in forward capacity markets mdash at least for low-carbon resources The contract period for new capacity in these markets is short (one year in PJM up to five years in ISO-NE) in part so there is greater certainty over forecasts of resource needs for system reliability (to mitigate the risk of over-supply)
66 Small and old coal plants are the most inefficient and polluting both in terms of greenhouse gases and particulate matter By some estimates 50 MW plants may use as much as 200 grams more per unit of electricity output than a plant larger than 300 MW See Frederick Weston Rebecca A Schultz David Moskovitz and Max Dupuy Regulatory Assistance Project ldquoChinarsquos Climate Change Initiatives Do new policies adopted in China offer any guidance for the transformation of the US power sector in a carbon-constrained worldrdquo November 2009 at httpwwwraponlineorgdocsRAP_China20Climate20Initiatives_NARUC_2009_11_01docx
67 See N Jonathan Peress and Kenneth A Colburn ldquoElectrical Connections Aligning Capacity Market Changes With RGGI in the Northeastrdquo Discussion Draft March 2005 at httpwwwpucnhgovEPABSymbiotic202005-03-1820Peress-Colburn20Letter20to20FERC-Woodpdf
68 Both high carbon resources and low carbon resources clearing in power markets (characterized by single-price auctions) are paid the same price So whenever fossil resources are on the margin (most of the time in most places) consumers are seeing the same price for both fossil and clean resources and the cost of carbon allowances (or carbon taxes) for that marginal resource is reflected in the clearing price for all power bought in the market Carbon adders on the other hand are not actually paid to any resource or reflected in prices for all units sold in the market
25
the Role of foRwaRd caPacity MaRkets in incReasing deMand-side and otheR low-caRbon ResouRces
Auction winners can generally participate in future auctions and receive the market clearing price but have no assurance of future prices Moreover under current rules in PJM energy efficiency resources cannot receive capacity payments over the full life of the measures mdash only for four consecutive delivery years This constraint puts energy efficiency on a different footing than other demand resources mdash as well as all supply-side resources mdash which are paid for their capacity as long as they provide the benefit
The short commitment period and lack of price certainty may not provide market signals that are strong and consistent enough to ensure sufficient new generation or encourage plant operators and investors to make efficient choices for the long-term mdash even where carbon prices are expected to increase substantially in the future due to a dramatically declining carbon cap or a high carbon tax Allowing clean resources to opt for a longer period of time over which the price is known would in particular facilitate renewable resources whose typically high upfront capital costs and low operating costs mdash compared to natural gas-fired plants in particular mdash may require such a long-term commitment to procure financing69 Another option might be to establish fixed floor prices for clean energy resources for a long-term period to provide assurance of a minimum revenue stream
bull Regional load forecasting should be reviewed for treatment of demand-side resources acquired outside the capacity market In particular the system operator determines the capacity that will be auctioned for each delivery year (three years hence) based on a 10-year load forecast which is updated on
an annual basis Under the current planning process in forward capacity markets this forecast only reflects the demand-side resources that have cleared in prior auctions The system operatorrsquos load projections do not take into consideration any load reductions from demand-side resources procured outside of the auction such as energy efficiency programs that LSEs have committed (or are obligated) to fund and implement in the coming one to three years or beyond70 If the magnitude of these load reductions is substantial the ISO may be systematically overstating the level of capacity put out to bid for each delivery year Depending upon the existing mix of resources and market conditions in the region this overstatement may have a sizeable impact not only on the level of cleared capacity and the market price but on the resulting resource mix and level of carbon emissions as well
Additional Actions
Careful design of the planning process and auctions undertaken through forward capacity markets can help to ensure that they reinforce and do not work at cross purposes with climate reduction goals and targets However forward capacity market signals (capacity prices) are only one component of a market and regulatory landscape that affects investment and operating decisions in the power sector Market rules and procurement policies that affect system energy requirements ndash as well as policies and regulations that affect access location and cost recovery for transmission and distribution facilities ndash have an enormous impact on both the short- and long-term resource mix
It is beyond the scope of this paper to fully explore how
69 LSEs in PJM and ISO-NE can contract for generating resources through the bilateral market to hedge energy and capacity costs and to meet renewable energy standards Renewable resource projects that successfully negotiate such contracts if they are long term may not need a long-term commitment in the forward capacity market Still a short-term capacity payment stream with uncertain prices thereafter weakens the ability of renewable resources to secure long-term financing
70 Some of the econometric models that the system operators use for their load forecasts may capture the impacts of federal appliance standards and building codes However to our knowledge there has been no explicit accounting to date for the impacts of state and utility energy efficiency programs where the capacity is not bid into the auctions
RegulatoRy assistance PRoject
26
market rules and other policies and regulations can be harmonized and strengthened to meet customersrsquo energy needs reliably in a carbon-constrained world Larger and longer lasting commitments to demand-side and renewable resources are certainly needed to ensure a mix of resources that will significantly reduce greenhouse gas emissions in the power sector This has been the conclusion of US policymakers who have put in place additional policies to facilitate long-term acquisition of low-carbon resources in regions that operate both forward capacity markets and a cap-and-trade program (under RGGI)71
bull States have adopted a variety of mechanisms for sustained and aggressive energy efficiency programs
bull Strong building codes and equipment standards
bull Stable funding through a system benefit charge
bull Third-party administration of programs or where the utility is the efficiency portfolio manager decoupling of utility profits from revenues financial incentives for shareholders or both
bull Recycling of carbon auction proceeds into energy efficiency investments
bull Some states require long-term resource plans or resource procurement plans that must include energy efficiency Therersquos renewed interest in long-term planning and procurement particularly for demand-side and renewable resources following a period
where these efforts were largely abandoned with electric industry restructuring and development of organized markets72
bull Several states have adopted energy efficiency resource standards that require achievement of specified energy-saving targets73
bull Most of the states have renewable energy standards74 and several states require long-term contracting of renewable resources to meet the standards75
bull Connecticut Maryland Pennsylvania and Rhode Island require contract terms of 10 years or longer
bull New York requires central procurement of renewable energy credits by a state agency under long-term contract Illinois is likely to acquire long-term contracts for renewable resources under its central procurement mandate
bull Massachusettsrsquo Green Power Partnership purchases renewable energy credits for up to 10 years using its renewable energy fund
These are just examples and certainly not an exhaustive list of the ways in which careful design of forward capacity markets coupled with additional policies at the federal regional and state level can serve to reinforce both resource adequacy requirements and carbon reduction goals
71 Regulatory Assistance Project policy grids summarize state-by-state requirements for resource planning and energy efficiency at httpwwwraponlineorgFeatureaspselect=116 For a summary of renewable energy standards in the US see Ryan Wiser and Galen Barbose Lawrence Berkeley National Laboratory ldquoState of the States Update on RPS Policies and Progressrdquo State-Federal RPS Collaborative Nov 18 2009 at httpwwwcleanenergystatesorgMeetingsRPS_Summit_09WISER_RPS_Summit2009pdf
72 More broadly 30 states nationwide require integrated resource plans or resource procurement plans that include energy efficiency
73 Includes states with strict energy efficiency standards states with Commission-ordered efficiency targets states that allow efficiency to count toward renewable energy standards and states with a rate cap that triggers a relaxation of requirements See Laura A Furrey Steven Nadel and John A ldquoSkiprdquo Laitner ACEEE Laying the Foundation for Implementing a Federal Energy Efficiency Resource Standard March 2009 at httpaceeeorgpubse091htm
74 Some 29 US states and the District of Columbia have renewable energy standards five other states have non-binding goals See Wiser and Barbose
75 For a US database of state incentives for renewable energy and energy efficiency see httpwwwdsireusaorg
27
the Role of foRwaRd caPacity MaRkets in incReasing deMand-side and otheR low-caRbon ResouRces
An example of an approach that attempts to ldquomarryrdquo integrated least-cost resource planning with forward capacity markets is the resource planning and procurement process recently established by the Connecticut Legislature76 The law requires the utilities Energy Advisory Board and Department of Public Utility Control to plan for current and future energy and capacity needs and provide a mechanism for procuring resources that meet specified economic reliability and environmental objectives77 to satisfy the identified need Further the law requires that resource needs first be met through energy efficiency and demand reduction resources that are cost effective reliable and feasible Based on the resulting resource plans LSEs enter into
contracts to acquire the required capacity (level and mix) through a competitive bidding process The law also requires that any resources winning contracts for capacity agree to let the LSE bid that capacity into the forward capacity auction as a ldquoself-suppliedrdquo resource This approach permits LSEs to determine both the quantity and mix of resources through integrated resource planning that will meet their resource adequacy requirements and state policy goals (eg carbon reduction) The LSE pays the contracted capacity price (under its bilateral contracts) instead of paying the auction clearing price to everyone that offers capacity into the forward capacity market (eg existing fossil fuel or nuclear plants)78
Connecticutrsquos Marriage of Resource Planning and Markets
76 Conn Gen Stat sectsect 16a-3a 16a-3b and 16a-3c
77 Costs and benefits cost-effectiveness cost impacts on customers the extent to which load growth can be eliminated and peak demand reduced reliability including energy security and economic risks impacts on meeting state environmental standards including emissions goals optimization of existing generation and generation sites the extent to which renewable resources can be used to meet needs and fuel types diversity and supply See Department of Public Utility Control Final Order in Docket No 08-07-01 Feb 18 2009
78 This approach is not without some controversy A contracted new resource in Connecticut has the potential to displace an alternative ldquocompetitiverdquo new resource in the region that would have bid at a higher price mdash had Connecticut not been allowed to designate the contract as self-supply ISO-NErsquos Internal Market Monitoring Unit has commented on this issue in a report to FERC See Internal Market Monitoring Unit ISO-NE June 5 2009
RegulatoRy assistance PRoject
28
Conclusions and Recommendations
Auction-based capacity markets in the US have been successful to date in attracting the capacity needed to maintain system reliability in an economically efficient manner In particular these markets have been successful in facilitating new demand-side resources
with ratepayers and society reaping the economic and environmental benefits However policymakers also should consider capacity markets in the context of carbon reduction policies and targets for the power sector Even markets that successfully integrate demand-side and renewable resources into the auction process are still encouraging the construction or continued operation of high-emitting supply-side resources to meet reliability targets
Existing capacity markets should be evaluated to assess whether the market is responding in this way And if it is policymakers need to critically assess whether a continuation of that market response over the coming years will make it possible to achieve the cumulative level of carbon reductions required from the power sector to avoid the worst effects of climate change Depending on the results of this inquiry policymakers may need to refine the auction rules and adopt additional policies for the power sector mdash such as those described in this paper mdash to ensure the alignment of capacity markets with both short- and long-term carbon reduction goals
More generally forward capacity markets create a revenue stream for resources that can commit to being available at times of system peak several years in the future mdash but this financial incentive is clearly not the only factor driving the mix of resources in the power sector and their resulting carbon footprint Market rules policies and regulations that affect investment and operating decisions for meeting the systemrsquos energy requirements mdash as well as those that affect access location and cost recovery for transmission and distribution facilities mdash have an enormous impact on both the short- and long-term resource mix in the electric system Policymakers will need to consider how this entire market and regulatory landscape mdash including forward capacity markets mdash can be strengthened and harmonized to reliably meet customer demand for electricity in a carbon-constrained world
29
the Role of foRwaRd caPacity MaRkets in incReasing deMand-side and otheR low-caRbon ResouRces
Cleared capacity values in the following tables represent all capacity committed by existing resources remaining in the market and all new resources that bid into the auction at or below
the market clearing price Cleared capacity includes ldquoself-suppliedrdquo or ldquoself-scheduledrdquo resources entered into the auction by LSEs However as described in this paper when the monthly billingsettlement process is completed the capacity charges allocated to the LSE will be offset (credited) for the cleared capacity delivered by these resources
Incremental capacity in the tables below reflects 1) new generation resources 2) capacity upgrades to existing generation resources 3) partial offsets to
incremental generation capacity due to capacity de-ratings to existing generation resources 4) new demand response resources 5) upgrades to existing demand response resources and 6) new energy efficiency resources
PJM Results79
PJM has conducted five Base Residual Auctions since its inception in 2007 for delivery years beginning in 20082009 (that each run from June 1 to May 31) Capacity cleared in the PJM auction is defined in terms of ldquounforcedrdquo capacity that is the capacity of a resource adjusted for availability and deliverability based on historical performance (eg forced outages)
Appendix 1
Detailed Results for PJM and ISO-NE Capacity Markets
Table 1 Generation Demand Resources and Energy Efficiency Resources
Offered and Cleared in PJM Base Residual Auctions (Unforced Capacity in MW)
Delivery Year 20082009 20092010 20102011 20112012 20122013
Generation Offered 1311648 1326142 1321248 1360679 1348730
DR Offered 7158 9368 9679 16524 98476
EE Offered - - - - 6527
Total Offered 1318806 1335510 1330927 1377203 1453733
Generation Cleared 1290614 1313389 1312515 1308566 1285274
DR Cleared 5362 8929 9390 13649 70473
EE Cleared 00 00 00 00 5689
Total Cleared 1295976 1322318 1321905 1322215 1361436
Energy efficiency resources were first eligible in the 20122013 auction
79 All information for PJM compiled from ldquo20122013 RPM Base Residual Auction Resultsrdquo at httpwwwpjmcom~mediamarkets-opsrpmrpm-auction-info2012-13-base-residual-auction-report-document-pdfashx
RegulatoRy assistance PRoject
30
Table 2 Incremental Capacity Additions and Reductions in PJM Base Residual Auctions(Installed Capacity in MW)
Delivery Year 20072008 20082009 20092010 20102011 20112012 20122013 Total
Increase inGenerationCapacity 6020 7242 12723 17762 35763 18935 98445
Decrease inGenerationCapacity -6746 -3754 -5502 -3018 -2647 -32539 -54206
Net Increase inDemand ResourceCapacity 5550 5747 2150 287 6617 79381 99732
Net Increasein EnergyEfficiency Capacity 0 0 0 0 0 6323 6323
Net Increasein InstalledCapacity 4824 9235 9371 15031 39733 72100 150294
Note Change in generation capacity is cumulative net increase in demand-side resources is relative to previous yearrsquos Base Residual Auction
Table 3 Breakdown of Incremental Capacity Resource Additionsin PJM Base Residual Auctions (Installed Capacity in MW)
Delivery Year CTGT Combined Diesel Hydro Steam Nuclear Solar Wind Total Cycle (Coal)
New 20072008 187 03 190Capacity 20082009 270 661 931Units 20092010 3995 238 530 4763 20102011 2833 5800 230 1414 10277 20112012 4164 11350 7048 11 752 23325 20122013 4038 5850 78 363 751 11080
Capacity 20072008 470 470From 20082009 1310 1310Reactivated 20092010 0Units 20102011 1600 107 1707 20112012 800 1010 1810 20122013 0
Uprates to 20072008 1145 139 800 2356 920 5360Existing 20082009 1082 340 180 1055 1960 384 5001Capacity 20092010 1522 2060 1625 614 1974 165 7960Resources 20102011 1173 1630 480 892 1603 5778 20112012 3692 1486 574 1868 2921 87 10628 20122013 2312 1643 142 1930 1260 568 7855
Total 28356 30159 2145 3963 20351 9062 11 4398 98445
Note Values represent capacity commitments Nameplate ratings of variable resources (solar and wind) are far larger than shown here
31
the Role of foRwaRd caPacity MaRkets in incReasing deMand-side and otheR low-caRbon ResouRces
Table 4 Changes to Generation Retirement Decisions
Since Reliability Pricing Model Approval (Unforced Capacity in MW)
Generation Resource Decision Changes Capacity Cleared
Withdrawn Deactivation Requests 17987
Postponed or Cancelled Retirement 13029
Reactivation 1752
ToTal 3276 8
Note Unforced capacity cleared in Base Residual Auctions from resources that withdrew their request to deactivate postponed retirement or were reactivated (ie came out of retirement or mothball state)
Table 5 PJM Base Residual Auction Clearing Price
Delivery Year Clearing Prices ($MW-day)
20072008 $4080
20082009 $11192
20092010 $10204
20102011 $17429
20112012 $11000
20122013 $1646
Note Values do not include any locational price adders Simple conversion of $MW-day to $kW-month multiply by 3 and divide by 100
Table 6 Effect of Demand-Side Resources on PJM Market Clearing Price
20122013 Base Residual Auction80
Actual Auction Results Calculated Results Without Demand-Side Resources
Clearing Prices Cleared Unforced Clearing Prices Cleared Unforced Savings
($MW-day) Capacity (MW) ($MW-day) Capacity (MW) ($MW-day)
$1646 1361435 $17878 1335682 $16232
80 Bowring Monitoring Analytics Table 20
RegulatoRy assistance PRoject
32
ISO-NE ResultsISO-NE has held three forward capacity auctions to
date The first auction (FCA 1) in February 2008 was for capacity delivery beginning in June 2010 (20102011 delivery year) The second auction (FCA 2) was held in December 2008 for delivery in 20112012 and the third
Table 7 Summary Results for ISO-NE Capacity Auctions81
Net Installed Total Resources Excess Clearing Net Price Capacity Cleared Capacity Price ($kW-month)82
Requirement (MW) (MW) ($kW-month)
FCA 1 32305 34077 1772 $450 $425
FCA 2 32528 37283 4755 $360 $312
FCA 3 31965 36996 4649 $295 $254
Table 8 Demand-Side Resources Cleared in ISO-NE Capacity Auctions (MW)81
Distributed Distributed Energy Real-Time Demand Real-Time Total Generation- Generation- Efficiency ResponseLoad Emergency Demand-Side Fossil Fuels Renewable Resources Management Generation Resources
FCA 1 46 lt02 655 978 875 2554
FCA 2 93 lt02 890 1195 759 2937
FCA 3 86 07 975 1206 630 2898
auction (FCA 3) was held in October 2009 for delivery in 20122013 ldquoClearedrdquo amounts in these tables include resources from earlier auctions that remain listed as well as new resources less resources that drop out
Note Net Installed Capacity Requirement values exclude the interconnection benefits associated with the Hydro-Queacutebec Phase III interface Excess capacity is not adjusted for Real-Time Emergency Generation in excess of the 600 MW limit Net prices reflect prorating of clearing prices due to excess capacity clearing the auction Simple conversion of $kW-month to $MW-day divide by 3 and multiply by 100
Note Demand-side values are grossed-up for avoided transmission and distribution losses and reserve margin (no reserve margin forFCA 3) Total resources cleared include excess capacity above the Net Installed Capacity Requirement Real-time emergency generation refers to distributed generation whose state air quality permit limits operation to ldquoemergencyrdquo conditions See Appendix 3
81 ISO-NE Forward Capacity Market Results at httpwwwiso-necommarketsothrmkts_datafcmcal_resultsindexhtml
82 Communication with Henry Yoshimura director Demand Resource Strategy ISO-NE March 2009
83 Eric Winkler ISO-New England ldquoThird Regional Energy Efficiency Initiative Meetingrdquo July 7 2009 and ldquoFCA Updaterdquo Demand Response Working Group Meeting Dec 2 2009 Total resources cleared (Capacity Supply Obligation) from Forward Capacity Market Auction Results for the 20102011 20112012 and 20122013 auctions at httpwwwiso-necommarketsothrmkts_datafcmcal_resultsindexhtml
33
the Role of foRwaRd caPacity MaRkets in incReasing deMand-side and otheR low-caRbon ResouRces
Step 1
System Operator (SO) Plans ldquoForwardrdquo for the Region
2012 Projection of Peak Demand = 10000 MW (incl reserves) Each ldquoLoad Serving Entityrdquo (LSE) is obligated for its 50 share
Appendix 2
Illustration of ldquoHow Forward Capacity Markets Workrdquo
SO purchases capacity in 2012 at the 2009 auction clearing price
LSE can be regulated utility or competitive retail supplier
LSE1 5000 MW
LSE2 5000 MW
R1
R1 =3500 MW capacity ldquoSelf Supplyrdquo Resources (LSE1 ownedunder contract)
RegulatoRy assistance PRoject
34
Step 2
The Regional Capacity Auction (3 Years ldquoForwardrdquo)
Step 3
System Operator Pays Cleared Resources at P and Bills LSEs(Note Self-Supply capacity is a ldquowashrdquo)
R1 R2 R3 R4 R5 R6 R7
P
R1
R3
R3
R5
R5
R2
R2
R4
R4
R6
R7
Bid Price = $ per MW-day
Quantity = MW
6500 MW P
Cleared Capacity = 10000
Supply = Capacity Committed ldquoForwardrdquo
P= Clearing price paid to all capacity clearing auction
Demand = SO Forecast of Capacity Requirements
R1-R7 = Capacity offered by Supply-Side (New built Existing Uprates) and Demand-Side (Energy Efficiency Demand Response Distrib Gen) Self-supply (R1) bids in a ldquozerordquo price New Resources set clearing price
LSE1 5000 MW
LSE2 5000 MW
R1
SOSO pays R1 3500 MW P
LSE2 pays its share of regional demand
5000 MW P
LSE1 pays its share of regional demand (5000 MW) adjusted for self-supply R1 for a net payment of 1500MW P
R1 = 3500 MW of ldquoSelf-Supplyrdquo Resources (LSE1 ownedunder contract)
In 2010Total regional peak demand of 10000 MW supplied by R1 + R2 + R3 + R4 + R5 LSE1 and LSE2 are each responsible for 50 of regional peak demand
35
the Role of foRwaRd caPacity MaRkets in incReasing deMand-side and otheR low-caRbon ResouRces
PJM Eligibility Requirements
Eligibility of demand-side resources has changed significantly over the years in PJMrsquos capacity markets In particular it was not until the most recent capacity auction (May 2009) for the
20122013 delivery year that energy efficiency became eligible to bid in PJMrsquos Base Residual Auction PJM is currently considering a tariff change to also allow energy efficiency to bid into incremental auctions
Under PJMrsquos eligibility rules an energy efficiency resource must achieve a ldquopermanentrdquo continuous reduction in electric energy consumption Examples of such a resource include lighting retrofit programs for residential commercial and industrial customers and programs to retrofit buildings with heating and cooling systems that exceed current efficiency standards To be eligible an energy efficiency resource must meet the following criteria
bull It is fully implemented throughout the delivery year without any requirement of notice dispatch or additional customer action
bull It is not reflected as a reduction in the peak load forecast used for the Base Residual Auction for the proposed delivery year
bull It exceeds relevant standards (such as building codes or appliance standards) at the time of commitment
bull It achieves the specified load reduction (expected average demand in MW) during defined summer on-peak hours84
Demand response on the other hand must be dispatchable mdash that is customer demand must be reduced when instructed For example a large supermarket with
coolers and freezers could install load management equipment that would cycle them on or off mdash and bid that demand response capability into the market85 More specifically a demand response resource must meet the following criteria
bull It is able to reduce demand for electricity up to 10 times each year for up to six consecutive hours per interruption during defined periods86
bull It is fully implemented within one hour (short lead time) or two hours (long lead time) of notice from PJM
bull In a year without calls for demand reductions it must demonstrate reliability through a test of reduction capability
bull It is registered in the Emergency Load Response Program and thus available for dispatch during PJM-declared emergency events
bull Compliance and status reports are filed as required
Multiple end-use customers can be aggregated in order to submit a single demand response offer in the capacity auction if those customers share the same curtailment service provider electric distribution company and transmission zone
In addition customer-sited distributed generation may be offered into auctions as a demand resource A hospital for example could offer to run its back-up generator on certain peak demand (eg hot summer) days to reduce its load on the system Or an industrial plant could cut back on production on such days and continue to run its on-site combustion or steam-cycle turbine
Currently energy efficiency resources may participate
Appendix 3
Eligibility Requirements for Demand-Side Resourcesin US Capacity Markets
84 Weekdays excluding holidays June through August between the hours ending 1500 and 1800 Eastern Prevailing Time (EPT)
85 If instead the supermarket replaced the existing coolers and freezers with more energy efficient ones it would bid that proposal in as an energy efficiency resource Or it could do both (replace and cycle) and bid in the capacity from the permanent savings (replacements) as energy efficiency and the dispatchable capacity (the cycling) as demand response
86 Weekdays excluding holidays from 1200 to 2000 EPT May through September and 1400 to 2200 EPT October through April
RegulatoRy assistance PRoject
36
in Base Residual Auctions for up to four consecutive delivery years In effect this means that PJM limits capacity payments for efficiency measures to four years of their measure life (rather than for the full measure life)87 In contrast a demand response resource (including distributed generation) can participate in the PJM capacity market for as long as its ability to reduce demand continues
ISO-NE Eligibility RequirementsSince the inception of ISO-NErsquos forward capacity market
in 2006 energy efficiency has qualified as an eligible demand-side resource ISO-NE defines demand resources as installed measures (products equipment systems services practices and strategies) that result in verifiable reductions in end-use consumption of electricity in the New England power system These are further categorized into ldquopassiverdquo (energy efficiency and non-dispatchable distributed generation) and ldquoactiverdquo (demand response emergency generation and dispatchable distributed generation) resources Passive demand resources are non-dispatchable but permanently reduce energy demand during peak hours Active demand resources are designed to reduce peak loads and to reduce load based on real-time system conditions or ISO-NE instructions Following are descriptions of eligible demand-side resources and performance requirements88
Passive Demand Resourcesbull On-Peak Demand Resources are measures that are
not weather-sensitive and reduce demand across a fixed set of on-peak hours such as energy-efficient commercial lighting and motors89
bull Seasonal Peak Demand Resources are weather-sensitive measures that reduce load during high-demand conditions such as energy-efficient heating and air conditioning systems Seasonal Peak Demand Resources must reduce load when actual system load is equal to 90 percent of the most recent peak load forecast for the applicable summer or winter season
Active Demand Resourcesbull Real-Time Demand Response Resources are
measures including load management and distributed generation that can be dispatched by ISO-NE as needed They must curtail electrical usage within 30 minutes of receiving a dispatch instruction and until receiving a releaserecall dispatch instruction
bull Real-Time Emergency Generation is distributed generation whose state air quality permit limits operation to ldquoemergencyrdquo conditions Generators must curtail the customerrsquos electrical usage within 30 minutes of receiving a dispatch instruction and until receiving a releaserecall dispatch instruction The amount of emergency generation that can be used to meet ISO-NErsquos capacity requirement is limited to 600 MW If the amount of real-time emergency generation that clears the auction exceeds this level payments to generators are reduced on a pro-rated basis All real-time emergency generation is treated as existing capacity
In contrast to PJM all demand-side resources in ISO-NE are eligible to bid capacity for their full measure life an approach that recognizes the full contribution of these resources to regional resource adequacy requirements and adds value to long-lived energy efficiency assets
87 FERC has directed PJM to evaluate the impact of its capacity payment period for energy efficiency resources
88 Eric Winkler and Abimael Santana ISO-NE ldquoNew Demand Resource Qualificationrdquo May 5 2009 at httpwwwiso-necomsupporttrainingcoursesfcmfcm_forum_may_5pdf
89 Summer on-peak hours are 1300 to 1700 non-holiday weekdays in June July and August Winter on-peak hours are 1700 to 1900 non-holiday weekdays in December and January
The Regulatory Assistance Project (RAP) is a global non-profit team of experts that focuses on the long-term economic and environmental sustainability of the power and natural gas sectors providing technical and policy assistance to government officials on a broad range of energy and environmental issues RAP has deep expertise in regulatory and market policies that promote economic efficiency protect the environment ensure system reliability and fairly allocate system benefits among all consumers We have worked extensively in the US since 1992 and in China since 1999 and have assisted governments in nearly every US state and many nations throughout the world RAP is now expanding operations with new programs and offices in Europe and plans to offer similar services in India in 2011 RAP functions as the hub of a network that includes many international experts and is primarily funded by foundations and federal grants
Home office
50 State Street Suite 3Montpelier Vermont 05602
802-223-8199wwwraponlineorg

RegulatoRy assistance PRoject
8
that are experiencing distribution or transmission bottlenecks for the delivery of electricity to end-use customers The clearing prices in these auctions reflect congestion costs and in effect pay a locational adder to capacity available during peak hours in those zones
Only resources that clear the market receive capacity
payments However in order to maintain reliability under very limited circumstances out-of-market payments may be made to resources that do not clear The system operator may determine that a resource critical to maintaining reliability for a given locational zone must continue to run even if its cost of operation is higher than the auction
Using simple assumptions the general ldquoworkingsrdquo of a forward capacity market from the perspective of an individual LSE can be described as follows The system operator forecasts the regional capacity requirements for the future delivery year (2012) and plans to hold the capacity auction for that delivery year three years in advance Each LSE knows its forecasted capacity obligation for 2012 some months before the auction Letrsquos assume there are only two LSEs in the region and they each account for 50 percent of the total regional capacity requirement of 10000 MW projected for the delivery year
At the time of the auction the system operator approves LSE 1rsquos showing that it has bilateral contracts in place to meet 3500 MW of its capacity obligation for the delivery year LSE 2 on the other hand has no bilateral contracts (or generation that it owns) to meet any of its capacity obligation for 2012
Herersquos how it works LSE 1 will offer the 3500 MW under its bilateral contracts as ldquoself-suppliedrdquo or ldquoself-scheduledrdquo resources into the auction at a price of zero mdash and they will automatically clear the auction20 However as described below the auction clearing price will have no impact on what LSE 1 actually pays for this resource It will only pay the capacity price negotiated under its bilateral contracts
Now letrsquos flash forward to 2012 and assume that the actual 2012 peak capacity needs of the customers served
by LSE 1 and LSE 2 turn out exactly as the system operator forecasted for that year 21 and that LSE 1rsquos resources under bilateral contracts were available to meet peak capacity needs as expected At the end of 2012 the system operator calculates what it spent to meet the regionrsquos peak capacity needs LSE 2 will get a bill from the ISO for purchasing on its behalf 50 percent of the regional capacity needs (5000 MW) at the auction price for the 2012 delivery year LSE 1 will get a similar bill from the ISO mdash but with an offsetting credit for the 3500 MW of capacity under its bilateral contracts So in effect LSE 1 only pays the auction price for the ldquoresidualrdquo capacity of 1500 MW mdash the capacity that the system operator purchased to meet the remaining capacity obligation of LSE 1
The scenario is similar if actual 2012 peak loads are greater than forecasted levels LSE 2 will still pay the auction price for all of the capacity that was purchased on its behalf to meet its actual peak capacity needs and LSE 1 will pay that auction price for the (now higher) residual amount above its contracted capacity In this way LSEs can elect to use bilateral contracts to hedge against high capacity prices in the capacity auctions just as they can hedge against high prices in energy markets
Appendix 2 presents a series of slides illustrating this numerical example of how forward capacity markets work
Illustration of Forward Capacity Markets From the LSErsquos Perspective
20 Unless the contracts are structured as a contract-for-differences (see discussion of that option further below) The net effect in either case is the same in terms of the LSE only paying the contracted price for that capacity
21 In actual practice the percentage allocation of capacity costs to LSEs for the delivery year is based on the previous yearrsquos actual peak loads (plus reserves) of each LSE relative to the regional totals mdash but as noted this is a simplified example
9
the Role of foRwaRd caPacity MaRkets in incReasing deMand-side and otheR low-caRbon ResouRces
clearing price Under these circumstances the system operator can still require LSEs to pay for reliability must-run contracts at a cost determined outside the auction process To date the amount of MW under reliability must-run contracts in the PJM and ISO-NE regions is very small In the first few auctions almost all reliability must-run contracts were voided Most of the resources previously under reliability must-run contracts however have been retained through the forward capacity auctions and receive the annual market clearing price
Market Rules to Ensure Performance and Competition
To ensure that any successful bidder will have a very high likelihood of performance during the commitment period resources cannot bid capacity into the market unless they are prequalified by the system operator In particular bidders must demonstrate that they can meet their commitment to provide capacity for the delivery year and their bids must satisfy market rules designed to mitigate market power22 They must pay a qualification deposit must provide financial assurance to ensure commercial operation and can be penalized for performance failures
Further to ensure against a condition in which capacity occupies a place in the power system but is withheld from energy markets and drives up prices all generation and demand-response resources committed in the capacity market must offer into the regionrsquos day-ahead energy market whenever available To mitigate excessive profits to resources also receiving capacity payments from the forward capacity market the system operator reduces these payments to reflect the impact of high energy
market prices The ISO-NE makes this reduction on an annual basis to reflect especially high energy prices in the preceding year23 In the case of PJM this reduction is implemented through a built-in adjustment to the auction demand curve described below
The following section describes some of the unique features of the PJM and ISO-NE capacity markets highlighting in particular their differences
PJMrsquos Capacity Market
PJMrsquos current forward capacity market mdash called the ldquoReliability Pricing Modelrdquo mdash was implemented on June 1 2007 replacing an earlier capacity market design in place since 1999 Eligible capacity resources include new and existing demand and supply-side resources (including generators outside the PJM footprint) PJM recently added energy efficiency as an eligible demand-side resource joining demand response and distributed generation
Each year PJM holds a Base Residual Auction three years in advance of a future delivery year (that runs from June 1st to May 31st) PJM establishes the target capacity level and the auction establishes the price and the actual amount of capacity procured A mechanism called the ldquoVariable Resource Requirementrdquo administratively adds demand elasticity into the auction by imposing a downward-sloping demand curve that adjusts resource amounts procured based on auction prices (See Figure 2) If capacity prices are low PJM intentionally purchases capacity in excess of its target but the total payment by load is also lower If capacity prices are high PJM procures less than the target leaving some capacity to be acquired (at potentially lower prices) in incremental auctions for the delivery year24
In PJM resources are eligible only for a one-year capacity
22 For example in the PJM auction suppliers of existing resources are limited to bidding their demonstrated going-forward costs for nearly all capacity and new resources offered below cost because of support from an LSE contract have a limited ability to set the clearing price
23 This adjustment is not currently applied to energy efficiency resources because they are not eligible to participate in the wholesale energy markets
24 The purpose of administratively developing a downward-sloping demand curve rather than relying on a descending clock auction (as described below for the New England auction) is to help stabilize prices over time when supply is price-inelastic Figure 2 and further details on the mechanics of the Reliability Pricing Model are available from PJMrsquos ldquoReliability Pricing Model Trainingrdquo November 2009 at httpwwwpjmcomtraining~mediatrainingcore-curriculumip-rpmrpm-training-section-d-auctionsashx
RegulatoRy assistance PRoject
10
commitment resulting from each annual auction mdash that is the resource is only guaranteed the auction clearing price for a one-year contract period26 However as long as that resource remains listed in the market it is eligible to receive the auction clearing price for each succeeding year27 Capacity that was offered but not cleared in the Base Residual Auction is eligible to bid into incremental auctions for the same delivery year
In general each LSE is obligated to pay its pro rata share of capacity costs acquired by the PJM system operator through a ldquolocational reliability chargerdquo28 However as described above LSEs can enter into bilateral contracts
(or own generation) to hedge these charges and submit the capacity into the auction as a ldquoself-scheduledrdquo resource at a price of zero29 When the monthly billingsettlement is completed the locational reliability charge to the LSE will be offset (credited) for capacity delivered through self-scheduled resources The net effect of these financial transactions within the market is that the LSE pays the contract price for self-scheduled contracts and does not get paid (or charged) for generation it owns and self-schedules into the auction However self-scheduled resources are counted by the system operator in establishing available capacity to meet regional peak demand (plus reserves) and
25 ldquoUCAPrdquo in this figure refers to ldquounforced capacityrdquo Unforced capacity as defined for the PJM auction represents the MW level of a generating unitrsquos capability after removing the effect of forced outage events It excludes outage events outside of management control
26 There is an exception for a new resource that relieves a congestion constraint It can receive a fixed capacity price for more than one year subject to a review of the congestion relief that it is providing
27 As discussed below energy efficiency is not eligible to remain listed in the PJM capacity market after four years
28 This charge is based on the LSErsquos peak loads adjusted for demand response resources and the applicable zonal capacity price
29 See PJM Manual 18 PJM Capacity Market Revision 9 March 1 2010 pp 4 and 38 at httpwwwpjmcom~mediadocumentsmanualsm18ashx
450
400
350
300
250
200
150
100
50
0125000 130000 135000 140000 145000 150000
Pri
ce (
$M
W-d
ay)
MW (UCAP)
Figure 2 Establishing the Market Clearing Price in PJM - 20122013 Base Residual Auction25
20122013 RTO Supply and Demand
RTO Supply
Clearing Price = $1646
RTO Demand
Note To establish the clearing price when the supply and demand curves do not intersect PJM does one of the following depending on the circumstance 1) Short of supply - Extend the supply curve up vertically until it intersects the demand curve 2) Short of demand - Extend the demand curve down vertically until it intersects the supply curve or 3) Supply curve above demand curve - No capacity will be cleared
Reliabilty requirement = 1337324 MW
Cleared capacity = 1361435 MWReserve margin = 212
11
the Role of foRwaRd caPacity MaRkets in incReasing deMand-side and otheR low-caRbon ResouRces
are subject to applicable performance requirementsIn addition to self-scheduling by LSEs PJM provides
a complete ldquoopt outrdquo ndash the ldquoFixed Resource Requirement Alternativerdquo ndash for LSEs that take full resource planning responsibility for all loads in their service area for a five-year period The projected peak capacity needs for LSEs selecting this alternative are not included in the PJM planning process to establish the regionrsquos capacity needs for the auction and the LSErsquos capacity resources (including capacity acquired through bilateral contracts) are not offered into the auction Moreover under this opt-out alternative the LSE cannot bid any excess capacity into the auction or acquire any capacity through it
Capacity suppliers can cover any auction commitment shortages through the bilateral market facilitated by an electronic system at PJM If capacity shortfalls reach triggering conditions PJM can delay deactivation of a generating resource or hold a backstop reliability auction for capacity resources for a term of up to 15 years30
To improve the availability of capacity resources when needed the capacity product in the PJM market is defined to include forced outage rates based on historical performance and penalties are imposed if the plant is not up and running during a shortage
ISO New Englandrsquos Capacity Market
As in PJM eligible capacity resources in New England include both new and existing demand-side and supply-side resources (including generators outside the ISO-NE footprint) From the start ISO-NErsquos forward capacity market allowed energy efficiency demand response and distributed generation to compete with generation on an equivalent basis which meant among other things that new demand resources could set the market clearing price
Like PJM each year ISO-NE holds a capacity auction three years in advance of the delivery period and sets the amount of capacity to be purchased in each auction In addition to the annual forward capacity auction ISO-NE holds voluntary monthly and annual reconfiguration auctions that allow deficient suppliers to procure replacement capacity These auctions also provide the
system operator the opportunity to buy additional capacity if the load forecast increases or to sell capacity if the forecast decreases
However ISO-NE does not establish a downward sloping demand curve (Variable Resource Requirement) for its auctions Rather ISO-NE puts out a single quantity of capacity for bid referred to as the ldquoInstalled Capacity Requirementrdquo Then ISO-NE uses a descending-clock auction in which market prices are reduced until the quantity of available supply bids matches this capacity requirement Bid quantities and prices decline through successive bidding rounds (with bidders withdrawing resources from the auction as prices decrease) as long as excess capacity is still offered or until the floor price is reached To address start-up issues ISO-NE established a temporary price cap (or ldquostarting pricerdquo mdash see figure below)
30 See PJM Open Access Transmission Tariff Section 16 at httpwwwpjmcom~mediadocumentsagreementstariffashx
Contracts for Differences
Instead of a bilateral contract for physical delivery of capacity an LSE and resource owner can sign a ldquocontract-for-differencesrdquo which means that the level of payments (and who makes them) depends on the auction clearing price For example if the contract price is $50 per MW-day and the clearing price is $46 per MW-day the LSE will pay the resource owner the difference of $4 per MW-day But if the auction clearing price is higher than the contract price the resource owner pays the difference (to the LSE) As in the case of self-scheduled bilateral contracts the LSE will end up paying only the contract price for that capacity However in the case of contracts-for-differences the resource underlying the contract will bid into the market and (if cleared) will receive the auction clearing price And the LSE will be allocated the full locational reliability charge receiving no credits for the contracted capacity The reconciliation happens outside the auction between the LSE and resource owner rather than as part of the monthly billingsettlement process
RegulatoRy assistance PRoject
12
and price floor for the auction The most recent auction for ISO-NE ran seven rounds over two days concluding when the auction reached the floor price of $2951kW-month31
However by rule the load only pays Installed Capacity Requirement times the clearing price so the floor price is further reduced (pro rata) to achieve that effect32 Figure 3 below illustrates the descending clock auction process for ISO-NErsquos first forward capacity market auction
Therersquos another key difference To encourage investment ISO-NE allows new resources to lock in a capacity price for up to five years (with a one-year minimum term)
regardless of clearing prices in subsequent auctions The capacity price is indexed for inflation after the first year and the bidder must select the proposed contract term in advance of the auction Existing resources including existing demand-side resources are eligible only for a one-year price commitment mdash as is the case for PJM
While ISO-NE also permits LSEs to meet their capacity requirements with self-supplied resources (owned resources and resources under bilateral contracts) ISO-NE does not provide an ldquoopt outrdquo alternative as described above for PJM Similar to PJMrsquos ldquoself-scheduledrdquo option the
31 The caps and floors were originally scheduled to be eliminated following the third forward capacity auction However a recent filing by ISO-NE to implement the results of a stakeholder process proposes to continue these mechanisms for the next three auctions For more information on how the descending clock auction functions and how these capsfloors are established see ISO-NE Internal Market Monitoring Unit Review of the Forward Capacity Market Auction Results and Design Elements June 5 2009 at httpwwwiso-necomcommitteescomm_wkgrpsothrfcmwgmtrls2009aug720096-05-09_market_monitor_report_for_fcmpdf
32 With some exceptions resources have the option to pro-rate their cleared MW (rather than take a lower price)
33 Jenkins et al p 178
40000
39000
38000
37000
36000
35000
34000
33000
32000
31000
30000 Start 1 2 3 4 5 6 7 Close
Final Results of ISO-NE FCM Auction 1
$900
Start at $1500
$800 $700$600
$5625
$525 $4875 $450
End-of-round price
Round
Su
pp
ly a
vail
able
(M
W)
at e
nd
of
rou
nd
Final Capacity Needed (ICR)
Figure 3Example of Descending Clock Auction for ISO-NErsquos Forward Capacity Market33
Note Prices are in $USkW-month By rule the load only pays Installed Capacity Requirement times the clearing price so the floor price is further reduced (pro rata) to achieve that effect
13
the Role of foRwaRd caPacity MaRkets in incReasing deMand-side and otheR low-caRbon ResouRces
LSErsquos full capacity obligation (including that portion met through self-supply) is included in the Installed Capacity Requirement put out to bid and the self-supplied resources are also counted towards the resources available to meet that requirement (at a price of zero) in the auction process The net effect for the LSE is also the same The capacity committed as self-supply does not receive any capacity revenue and the LSErsquos capacity obligations satisfied through self-supply are not subject to capacity charges Further the LSErsquos self-supplied resources are subject to applicable penalties and the LSE is subject to capacity charges for any needed residual capacity that the ISO purchases through the auction on its behalf
The penalty provisions in the two regions also differ While both PJM and ISO-NE impose stiff penalty charges if a unit fails to perform when obligated to run ISO-NE also reduces payments to units that are not producing energy at their full capacity level during shortage events mdash similar to the mechanism it uses to reduce capacity payments when prices in the energy market reach very high levels
Role and Eligibility of Demand-Side Resources in FCMs
As discussed above electric systems face a reliability challenge not faced by other commodity markets Because customers are physically interconnected because electricity cannot be meaningfully stored and because electric service is central to economic and social well-being the balance between demand and supply is critical at all times and this balance must be assured over a sustained period of time The FCM design described in this paper recognizes that actions taken on the demand side of the market can effectively moderate price spikes and enhance reliability in a comparable manner as capacity commitments from supply-side generation mdash through short-term customer demand responsiveness during system peak or through permanent and continuous reductions in peak demand (energy efficiency) This market design recognizes that demand-side resources broadly defined to encompass demand response energy efficiency and distributed generation can meet system needs lower costs and add
value to power markets in a variety of circumstances The most important opportunities include34
bull Lowering the cost of power delivery reducing congestion and improving the reliability of the delivery system
bull Enhancing regional power system reliability by using a broad range of demand-side resources to meet planning and operational reserves
bull Economically balancing supply and demand in wholesale power markets through demand-side bidding and market transactions for energy supply released through demand reduction
bull Cost-effectively reducing long-term demand and lowering throughput through energy efficiency resources both on the power grid as a whole and within the resource portfolio of power suppliers
To capture these benefits energy efficiency and demand response (including distributed generation) can now compete on a level playing field with generation in the ISO-NE and PJM forward capacity markets Like generating resources demand-side resources must meet market rules for eligibility and availability including demonstrating they will be available at the start of the proposed delivery year Each type of demand-side resource has a specific set of performance hours across which load reductions are required To be eligible for the auction service providers must demonstrate in advance their ability to perform during those hours Like other resources demand-side resources are subject to penalties if there is a mismatch between their capacity commitment and their performance
Demand-side resources must meet comprehensive standards for measurement and verification (MampV) Failure to comply with MampV protocols makes the resource ineligible for the auction failure to submit post-installation MampV reports results in a final capacity offering of zero for the delivery year plus penalties Generally penalties cannot exceed the revenue that would have been collected if the resource performed as specified in the contract Energy efficiency resources also are audited for compliance Although the capacity obligations and associated penalties for non-performance among supply-side and demand-
34 Richard Cowart Regulatory Assistance Project and Jonathan Raab Raab Associates Ltd Dimensions of Demand Response Capturing Customer-Based Resources in New Englandrsquos Power Systems and Markets Report and Recommendations of the New England Demand Response Initiative July 23 2003 at httpwwwraponlineorgdocsRAP_Cowart_DemandResponseAndNEDRI_2003_07_23pdf
RegulatoRy assistance PRoject
14
side resources are not identical in these capacity markets they are designed and intended to provide comparable incentives to perform during specified hours35
Currently the key difference in eligibility requirements for demand-side resources in the ISO-NE and PJM capacity auctions is the circumstances under which energy efficiency resources may participate Under PJMrsquos rules energy efficiency resources may participate in Base Residual Auctions only up to four years This means that efficiency measures are limited to receiving compensation for their capacity contribution to four years of their measure life rather than their full measure life Demand response resources (including distributed generation) can participate in the PJM capacity market for as long as their ability to reduce demand continues In contrast all demand-side resources in ISO-NE are eligible to bid capacity for their full measure life an approach that recognizes the
full contribution of these resources to regional resource adequacy requirements and that encourages long-lived energy efficiency assets Further description of eligible demand-side resources and performance requirements in these markets is presented in Appendix 3
Forward Capacity Auction Results
In the following sections we summarize the overall level of capacity cleared from existing and new resources in the PJM and ISO-NE auctions the level of incremental capacity successfully bidding into these markets and how different types of resources have fared to date mdash with particular focus on demand resources More detailed results for the PJM and ISO-NE forward capacity markets are provided in Appendix 1
Some stakeholders claim that demand resources are not as available as generation yet they get paid the same price for capacity (implying that they should receive a lower price) A closer examination of the ISO-NE rules reveals several problems with this generalization In particular generation availability can actually vary quite widely because these resources are excused from performing if they are on scheduled maintenance (eg nuclear plants are paid their full monthly capacity payment even when they are shut down for weeks of re-fueling) And other generation resources are ldquoallocatedrdquo a specific number of hours for annual maintenance and are paid as if they are providing capacity services when they are off-line Demand resources have pre-established hours they must be available and are penalized for performance failures differently than traditional generationmdashsome argue more severely For example a demand resource that fails to perform is assessed a penalty for that month and its capacity value is reduced going forward (for all future months) While it is possible to re-establish the capacity value
through future performance (demand response) or with updated MampV (energy efficiency) the process is a slow one that can take many months or more A generation unit that fails to perform is assessed a penalty for that month but its capacity value is either unchanged or can be reestablished with a test run at anytime and the monthly capacity payments continue with no reduction Generation plants with long notice requirements (eg 24 to 48 hoursrsquo notice for coal-fired plants if the system operator wants them on-line and actually providing energy) are paid the same as a demand response resource that is required to be dispatchable by the system operator within 30 minutes throughout the year to address shortage events (See Appendix 3) Clearly there are individual rules that stakeholders can argue work to the advantage of supply-side over demand-side resources and vice versa Overall the intent of such variations should be to make obligations penalties and payments for demand and supply resources roughly comparable while recognizing the unique operational issues associated with all resources
Performance Incentives Demand- vs Supply-Side Resources
35 Nonetheless there continues to be debate among stakeholders over whether the appropriate balance has been reached See text box
15
the Role of foRwaRd caPacity MaRkets in incReasing deMand-side and otheR low-caRbon ResouRces
Auction Results for PJM36
PJM has held five Base Residual Auctions including the most recent May 2009 auction for the 20122013 delivery year PJM serves a large market The 20122013 Base Residual Auction cleared a total of 1361436 MW of capacity While generating resources account for nearly all of this committed capacity (1285274 MW) demand response resources (including distributed generation) represent 5 percent of the total (70472 MW) New for the 20122013 delivery year 5689 MW of energy efficiency also cleared the market Table 1 in Appendix 1 lists capacity resources offered and cleared to date As indicated in that table the vast majority of demand-side resources offered into the market cleared each PJM base residual auction
Figure 4 below illustrates the increasing role of demand-side resources in PJM
Renewable generating resources also are gaining some traction in the capacity market although not anywhere near the magnitude of demand-side resources in terms of their overall contribution to resource adequacy requirements This is due to the predominance of wind resources and their variable nature PJM applies a 13 percent on-peak capacity factor to these resources mdash for every 100 MW of wind resources only 13 MW are eligible to meet capacity requirements Some 3234 MW of wind capacity resources cleared in the most recent Base Residual Auction mdash 95 percent of the amount offered While this capacity level is miniscule compared to the total capacity clearing the auction it translates to a large nameplate rating mdash 2488
12000
10000
8000
6000
4000
2000
0
Active Load Management
Prior to RPMImplementation RPM Implemented
Interruptible Load for Reliability
Energy Efficiency RPM Offered Demand Response
Figure 4 Demand-side Participation in PJMrsquos Reliability Pricing Model (RPM) Auctions
Note Demand-side resources included Active Load Management prior to the 20072008 delivery year Interruptible Load for Reliability and Demand Response were first eligible for the 20072008 delivery year Energy Efficiency resources were first eligible for the 20122013 delivery year (May 2009 auction) The large increase in demand response participation in the 20122013 delivery year is in large part due to the elimination of PJMrsquos ILR program
200506 200607 200708 200809 200910 201011 201112 201213
36 Except where noted information and figures in this section and referenced tables in Appendix 1 are from PJM ldquo20122013 RPM Base Residual Auction Resultsrdquo at httpwwwpjmcom~mediamarkets-opsrpmrpm-auction-info2012-13-base-residual-auction-report-document-pdfashx
RegulatoRy assistance PRoject
16
MW of wind resourcesPJM reports that the Base Residual Auctions have
attracted 150294 MW of incremental capacity in the region to date Incremental capacity refers to new generation resources capacity upgrades to existing generation resources new demand response resources upgrades to existing demand response resources and new energy efficiency resources37 Natural gas- and coal-fired plants account for most of the incremental capacity with nuclear plants (from uprates) also making a sizable contribution Tables 2 and 3 in Appendix 1 provide details on the incremental capacity procured It is important to note that the figures in these tables represent resources new to the capacity market including uprates mdash not all are newly built However they include a new merchant coal plant built for the PJM market38
True to one of the original goals the PJM capacity market also has been successful in retaining existing capacity from power plants that were originally under high-cost reliability must-run agreements39 Since FERC approved the Reliability Pricing Model existing capacity that would otherwise have been deactivated or retired has accounted for 32768 MW of procured capacity Table 4 in Appendix 1 shows these changes in resource deactivation and retirement
Market clearing prices for resources in PJMrsquos Base Residual Auctions to date have ranged from $1646 to $17429 per MW-day not including any locational price adders for constrained areas (See Table 5 in Appendix 1) Importantly the $1646MW-day clearing price for the 20122013 delivery year represents a decrease of $9354MW-day from the previous Base Residual Auction due in part to significant increases in capacity from demand response and the introduction of energy efficiency resources into the bidding process Moreover the participation of demand-side resources is estimated to have reduced the market clearing price for the 20122013 delivery year by an astonishing $16232MW-day in unconstrained zones (ie from a clearing price of $17878MW-day without these resources in the bid stack to the actual clearing price
of $1646MW-day) Table 6 in Appendix 1 shows the calculation by PJMrsquos independent market monitor
Auction Results for ISO-NE
ISO-NErsquos forward capacity market is about a quarter of the size of the PJM capacity market mdash the Installed Capacity Requirement set by ISO-NE for the 20122013 delivery year was 31965 MW ISO-NE has held three forward capacity auctions to date and all of them cleared at the administratively set floor price ($450kW-month $360kW-month and $295kW-month respectively) with surplus capacity above the Installed Capacity Requirement set by ISO-NE to meet reliability needs The first auction secured 1772 MW above the requirement the second auction cleared 4755 MW of excess capacity and the third auction cleared 4649 MW of excess capacity (See Table 7 in Appendix 1)
Demand resources have consistently represented about 8 percent of the resources cleared in the three auctions (2554 MW 2937 MW and 2898 MW respectively) an amount that exceeded expectations Energy efficiency accounted for about a quarter of the demand resources in the first auction and about a third in more recent auctions Real-time demand response comprises the largest share of demand resources Emergency generation (ie distributed generation whose state air quality permit limits operation to ldquoemergencyrdquo conditions) also makes a sizeable contribution Non-emergency distributed generation however comprises a negligible amount of the total Table 8 in Appendix 1 shows detailed results for demand resources
Figure 5 shows the growth in demand resources offered and cleared in the first two ISO-NE auctions by type There has been a steady growth in demand-side resources in New England since the first demand-response programs operated by ISO-NE The forward capacity auctions have contributed to and solidified these gains
Participation of demand-side resources in the ISO-NE forward capacity auction has been credited with making the clearing price lower than it would have been otherwise
37 The increase is partially offset by capacity de-ratings to existing generation resources
38 See Pfeifenberger et al at 27
39 As discussed above these contracts have not been dispensed with altogether however
17
the Role of foRwaRd caPacity MaRkets in incReasing deMand-side and otheR low-caRbon ResouRces
as it has in the PJM region Analysis of the first auction bids for example suggests that the participation of these resources saved ratepayers as much as $280 million by lowering the price paid to all capacity resources in the market40
Moreover by contributing to the excess capacity that kept capacity payments at relatively low floor prices in New England the participation of demand-side resources has
also contributed to lower overall market revenues inducing some inefficient oil-fired generating units to shut down at least temporarily Nonetheless existing and new fossil-fuel resources continue to dominate the capacity commitments in this region as is the case for PJM
Overall renewable generating resources (primarily wind resources) are making some headway in the regionrsquos forward capacity market but as in PJM they are not
40 See Cheryl Jenkins et al This calculation reflects what the market clearing price would have been in the auction given the Installed Capacity Requirement put out to bid by the system operator which assumes no impact of energy efficiency programs on loads (because energy efficiency is bidding) Therefore the calculated reduction in clearing price represents a theoretical maximum mdash excluding demand resources from the market would likely have been at least partially offset by a lower amount of capacity put out to bid As a result the difference in the market clearing price (and savings to consumers) would likely have been smaller than the number calculated here although it is difficult to say by how much However even if demand-side resources were not permitted to bid they would contribute to lower prices for consumers by lowering the total quantity of capacity required
41 Internal Market Monitoring Unit ISO-NE June 5 2009
4500
4000
3500
3000
2500
2000
1500
1000
500
0
New UnclearedTotal Uncleared1375 MW
Total Uncleared1159 MW
Total Cleared2279 MW
Total Cleared2778 MW
New Cleared
Existing Delisted Uncleared
Existing Cleared
FCA 1 FCA 1
Figure 5 Demand-Side Participation in ISO-NE Capacity Auctions by Type41
copy ISO New England Inc
Note Activerdquo resources include demand response and emergency generation energy efficiency is considered a ldquopassiverdquo resource Clearing amounts reflect ISO-NErsquos maximum limit of 600 MW of Real-Time Emergency Generation In contrast Table 8 in Appendix 1 shows the actual amount of such resources that cleared the auction Capacity payments to these resources are pro-rated if cleared levels exceed 600 MW
Cap
acit
y (M
W)
Active
Active
Active
Active
Active
Active
Active
Active
Passive
Passive
Passive
Passive
Passive
RegulatoRy assistance PRoject
18
a major contributor to the regionrsquos resource adequacy requirements at this time In the most recent (third) auction 166 MW of wind capacity cleared the auction mdash with a nameplate rating an order of magnitude larger42
Unlike PJM ISO-NE does not apply a deemed on-peak capacity factor to wind and other variable generation resources Instead all such resources must provide data that demonstrate the claimed summer and winter qualified capacity The capacity factor is adjusted over time based on actual performance during specified hours
Forward Capacity Markets in the Context of Carbon Constraints
Power market rules are not constructed in a vacuum rather they are designed to address specific public policy goals As described above forward capacity markets in the US were developed to ensure resource adequacy in the power system at a reasonably competitive price In the face of growing carbon constraints however power market rules need to be redesigned to work in concert with carbon reduction goals and policies rather than at cross purposes The challenge of substantially de-carbonizing the power sector in the coming years is too great to ignore this interaction In particular policymakers should carefully consider what elements of the current planning and procurement process to achieve resource adequacy contribute to the following effects ndash and then work to revise the market rules accordingly
bull Do the market rules encourage new investments in high-emitting resources (including repowering) at the expense of low-carbon alternatives
bull Do they encourage the continued (or increased) operation of existing high-emitting power plants
bull Will they result in a build-out of capacity and cumulative emissions that conflict with the level of de-carbonization required in the power sector mdash or make attainment of that level more costly to the economy
This paper is not intended to evaluate the PJM and ISO-NE capacity markets and auction rules in any depth with respect to these issues However we offer below general observations based on the auction design and results to date in these regions and other studies Following that we provide policy recommendations related design options and additional actions for consideration
General Observations on Forward Capacity Markets and Results
Based on our review of FCM auctions to date and related studies we offer the following observations
bull The ISO-NE and PJM forward capacity markets are meeting their resource adequacy objectives Sufficient levels of capacity have cleared the market to meet each regionrsquos anticipated peak demand and adequate resources are now committed on a forward basis to ensure reliable coverage in future years (up to the 20122013 delivery year) But in a carbon-constrained world the mix of resources is as important as the quantity in both the short-term and the long-term Most resources that are available during peak demand hours also produce electricity or reduce consumption during many more (or all) hours of the year and the carbon intensity of that mix of resources will drive the level of cumulative emissions in the power sector43 As discussed in this paper capacity markets as currently designed provide compensation based on the level of available capacity not the mix of resources providing that capacity It is worth repeating here that the only (non-price) attribute a resource needs to demonstrate for resource adequacy purposes is that it will be available when called upon during the projected hours of peak system loads In a carbon-constrained world policy makers should ask whether the planning and procurement process for acquiring a sufficient level of capacity at a reasonable price is also moving the resource mix in the right direction mdash towards zero or low carbon-emitting demand- and supply-side resources
42 Compiled from auction results at httpwwwiso-necommarketsothrmkts_datafcmcal_resultsccp13fca13indexhtml
43 With the exception of gas-fired peaking units or demand response resources that are dispatched to meet (or reduce) loads only during peak system hours
19
the Role of foRwaRd caPacity MaRkets in incReasing deMand-side and otheR low-caRbon ResouRces
bull Expressly designing demand-side resources into forward capacity markets appears key to achieving all three objectives ndash resource adequacy low-carbon resource mix and reasonable price Energy efficiency and demand response resources are faring well in auction-based capacity markets mdash and this is a positive outcome for several reasons First energy efficiency and other demand-side resources can substitute for existing and planned generation that have a higher carbon footprint thereby reinforcing carbon reduction policies and targets for the region Second demand-side resources can dramatically reduce the costs of meeting the regionrsquos resource adequacy requirements mdash as evidenced by the results of the PJM and ISO-NE auctions In addition the increase in demand-side resources facilitated by capacity auctions can reduce market power because more suppliers and more resources means individual generators have less ability to affect bid offers and clearing prices And because demand-side resources lighten the load at the end of the supplydelivery chain they enhance the reliability of each link in the chain from fuel supply and generation to the local distribution network
bull Differences in the impact of demand-side resources on carbon emissions should be recognized in capacity markets and associated auction rules Energy efficiency decreases carbon emissions because (by definition) it reduces energy use for an equivalent level of service and at the margin almost all power systems are running higher carbon resources In contrast the net impact of demand response on carbon emissions will depend upon specific circumstances including the mix of
plants serving loads at the margin For example when coal is primarily serving baseload and intermediate needs emissions may increase when customers shift loads from on-peak (when natural gas is on the margin) to off-peak periods44 Elsewhere however demand response mdash including any conservation side-effect mdash may reduce emissions from less efficient peaking plants In addition demand response includes real-time emergency generation which is often fossil-fuel powered (eg by diesel or natural gas) Any analysis of the costs and benefits of demand response resources in capacity markets should account for such effects Policies and market rules for demand response should be aligned with its environmental costs and benefits45
bull Renewable generating resources are beginning to make some headway in forward capacity markets mdash in particular wind resources This is in large part because the markets described here recognize some capacity value for variable renewable resources (wind solar and run-of-river hydro) either through a deemed on-peak capacity factor or a demonstration of claimed capacity for specified on-peak periods Policymakers need to pay attention to how these values are established so they can be confident the committed capacity will be available when called on while at the same time encouraging participation of all low-carbon resources in the market More generally as renewable resources become a more significant part of the resource mix a forward capacity market creates the opportunity to recognize their aggregate capacity value to the system46
44 For example PJM recently released figures on carbon emissions of generating units that operate on the margin during on-peak vs off-peak hours See httpwwwpjmcom~mediaabout-pjmnewsroom2010-releases20100325-pjm-reports-new-carbon-dioxide-emissions-dataashx and httpwwwpjmcomdocuments~mediadocumentsreportsco2-emissions-reportashx
45 See section 316 and Mechanism E in Attachment 1 of Pacific Northwest National Laboratory The Smart Grid An Estimate of the Energy and CO2 Benefits January 2010 (PNNL 19112) at httpenergyenvironmentpnlgovnewspdfPNNL-19112_Revision_1_Finalpdf
46 Variable renewable resources will qualify for higher capacity value if they are bundled with other resources for reliability (eg demand response hydroelectric dams or energy storage) In addition confidence in the capacity value of variable resources increases as their geographic diversity on the system increases See for example the report on the Eastern Wind Integration and Transmission Study at httpwwwnrelgovwindsystemsintegrationpdfs2010ewits_final_reportpdf
RegulatoRy assistance PRoject
20
bull Nonetheless renewable resources are hard-pressed to successfully compete with the thousands of megawatts of existing and new fossil-fuel resources participating in these auctions that are able to bid below the true societal cost of their operations under current market rules In fact capacity auctions as currently designed can breathe new economic life into high carbon-emitting plants that were previously planned for significantly reduced operations or retirement Along with new capacity from fossil-fuel generation allowing such a large amount of existing capacity from high carbon emitters to clear the auction is likely to crowd out renewable resources that are able to address resource adequacy requirements equally well Such results may not represent an ldquoefficientrdquo (or desirable) outcome for a carbon-constrained power sector This is especially true where the carbon costs of a fossil-fuel plant are not fully recognized in the energy market that plant also will be bidding into
The Electric Power Research Institute modeled the effect of various levels of carbon taxes or allowance prices in the upper Midwest (coal-dependent) and in Texas (heavily reliant on natural gas) The study found that close to a doubling of the wholesale prices of electricity in the Midwest region (through carbon-related charges) would produce only a 4 percent reduction in regional emissions given the current generation mix Similar results were observed for Texas where natural gas plants are on the margin49 And in the Northeastern US due to initially low carbon prices and a host of factors that dampen the price signal the Regional Greenhouse Gas Initiative (RGGI) has not yet resulted in generator operational changes50 One of those dampening factors is the single clearing price that is typically set through wholesale energy markets mdash which dilutes the market signal sent by a price on carbon emissions by allowing fossil-fueled plants to recover
most or all of their allowance costs through higher clearing prices reflecting the cost of allowances51
Studies also have shown that the price of carbon must rise (and be maintained) at very high levels to obtain sufficient market pull for the level of new investments in clean generation required For example a recent analysis in California concluded that it would take a carbon price of $100 per tonne52 to make economic investments in renewable resources compared to fossil fuel-fired generation in order to reach carbon reduction targets in the power sector beyond what current state requirements will achieve53 Further price signals may be diluted if a portion of the carbon allowances are allocated in a manner that shields high-emitting power plants from carbon costs or if high-emitters located outside the capped region can sell into the market on a long-term basis
Carbon Pricing Alone Is Insufficient to De-carbonize the Generation Mix
bull A market price for capacity or energy that favors the construction and operation of high carbon-emitting resources over clean resources will lead to increases mdash rather than reductions mdash in the cumulative level of carbon emissions in the power sector A carbon tax or carbon cap-and-trade regime internalizes some or all of the otherwise un-priced carbon costs of electricity production and would improve the relative economics of clean resources in both forward capacity and energy markets However carbon pricing alone may be insufficient to change the dispatch of existing high-emitting power plants or their ability to clear these capacity markets (and be paid additional revenues as a result) in such overwhelming numbers47 In fact the very modest impact of carbon pricing on the performance of fossil-fuel plants has been documented in several reports48 (See text box below)
47 With or without carbon prices policymakers also might want to consider the implications of paying existing power plants the market clearing price for capacity mdash and the potential windfall profits for plant owners mdash for making no changes in plant operations See for example Ezra Hausman Paul Peterson David White and Bruce Biewald Synapse Energy Economics Inc RPM 2006 Windfall Profits for Existing Base Load Units in PJM An Update of Two Case Studies Feb 2 2006 at wwwsynapse-energycom
21
the Role of foRwaRd caPacity MaRkets in incReasing deMand-side and otheR low-caRbon ResouRces
bull Carbon pricing alone will have limited impact on consumer decisions to invest in permanently reducing their peak demand by making cost-effective investments in energy efficiency Well-designed time-varying pricing options can successfully shift demand from high-price hours to lower price hours54 Such shifting also reduces peak demand on transmission and distribution systems Overall energy use will decline somewhat in response to price But long-term reduction in energy use due to price increases is relatively small The numerous market barriers to capturing the full cost-effective potential of energy efficiency ndash through improvements in building construction practices and industrial processes retrofits of existing buildings and installations of high-efficiency appliances and equipment in homes and businesses ndash are well-documented They include lack of information high first-costs consumersrsquo high discount rates and the landlord-tenant split incentive problem among others55 Recent empirical analysis of demand elasticities suggests that the long-term price elasticity of demand for electricity is even lower than earlier studies have indicated for both liberalized and regulated markets (See text box on page 21)
In sum while forward capacity markets are meeting their resource adequacy objectives and clearing an impressive amount of clean low cost demand-side resources on balance these markets (as currently designed) are not working sufficiently in concert with carbon reduction goals and policies in the face of growing carbon constraints For the reasons discussed above carbon pricing alone
48 See Testimony of Richard Cowart Regulatory Assistance Project Before the Committee on Energy and Commerce Subcommittee on Energy and Environment US House of Representatives April 23 2009 ldquoThe Consumer Allocation for Efficiency How Allowance Allocations Can Protect Consumers Mobilize Efficiency and Contain the Costs of GHG Reductionrdquo at httpenergycommercehousegovPress_11120090423testimony_cowartpdf
49 See Victor Niemeyer ldquoThe Change in Profit Climate How Will Carbon-Emissions Policies Affect the Generation Fleetrdquo Public Utilities Fortnightly May 2007 at 20 24
50 See ldquoRGGI marks its first year with success and lesson on effect of market pressurerdquo Electric Utility Week Dec 14 2009 Ten Northeast and Mid-Atlantic states participate in RGGI the first mandatory cap-and-trade program in the US Connecticut Delaware Maine Maryland Massachusetts New Hampshire New Jersey New York Rhode Island and Vermont Nine of them participate in either the ISO-NE or PJM forward capacity markets described in this paper
51 PJM Interconnection ldquoPotential Effects of Proposed Climate Change Policies on PJMrsquos Energy Marketrdquo Jan 23 2009 p 5 See also ldquoBecause Thatrsquos Where the Money Is The FERCrsquos Ability to Reduce the Cost of Slowing Global Warmingrdquo Samuel A Wolfe Chief Counsel New Jersey Board of Public Utilities December 2009 at httpwwwnarucorgpublicationsWOLFE-20Panel203pdf
Demand for Power Is Relatively Price-Insensitive mdash Even Over the Long Term
Modeling by the US Department of Energy suggests that a 10 percent increase in power prices will reduce demand for electricity by just 25 percent to 3 percent over 20 years assuming that the price effects persist over that entire period56 This would only offset the normally expected US load growth in two out of those 20 years57
More recently a 2009 empirical analysis of the demand for electricity in the US concludes that price elasticity of residential demand has actually decreased since retail price deregulation was first introduced in the US The results suggest that a 10 percent increase in power prices will reduce residential electricity demand more on the order of 12 percent to 17 percent based on 2001-2008 data for both deregulated and regulated states58 Price responsiveness is further dampened by the income-elasticity of demand which is positively correlated with consumption As incomes increase consumption of electricity goes up and the conservation impact of any price increase is diminished59 The equivalent historical figure for a 10 percent increase in power prices in the UK residential sector is -23 percent but the income-elasticity is such that a 10 percent increase in income results in an increase of demand of 34 percent ndash ie household income is just as important as energy price in determining energy demand60
RegulatoRy assistance PRoject
22
is unlikely to shift the power sector resource mix at the pace or scale required to meet aggressive carbon reduction targets ndash or correspondingly to substantially change the dominance of high-carbon resources clearing forward capacity auctions under current market rules An increasing number of studies makes a compelling case that our economy and our society cannot afford this dominance to persist much longer if we are to contain climate change to a livable level In fact close to full de-carbonization of the
power sector is being discussed in international forums as the only way to meet essential carbon reduction targets by 205061 While capacity markets alone are unlikely to support the full value of clean energy resources in a carbon-constrained power sector by themselves with appropriate design elements they can serve to reinforce actions taken at federal regional and state levels that provide larger and longer lasting commitments to clean demand-side and renewable resources62
52 A tonne or metric ton is a unit of mass equal to 1000 kilograms (roughly 2205 pounds) or approximately the mass of one cubic meter of water at four degrees Celsius A tonne is not the same as either a ldquoshortrdquo ton (2000 pounds) or a ldquolongrdquo ton (2240 pounds)
53 Energy and Environmental Economics Inc Greenhouse Gas Modeling of Californiarsquos Electricity Sector to 2020 Updated Results of the GHG Calculator Version 3 prepared for the California Public Utilities Commission October 2009 pp 66-67 at httpwwwethreecomdocumentsGHG_102209CPUC_GHG_Final_Report_28Oct09pdf
54 Ahmad Faruqui and Sanem Sergici The Brattle Group ldquoHousehold Response to Dynamic Pricing of Electricity A Survey of the Experimental Evidencerdquo Jan 10 2009 at httpwwwhksharvardeduhepgPapers2009The20Power20of20Experimentation20_01-11-09_pdf
55 See for example American Council for an Energy Efficient Economy ldquoQuantifying the Effects of Market Failures in the End-Use of Energyrdquo pp iii-vi 2007 at httpoldaceeeorgenergyIEAmarketbarrierspdf This study details the various types of market barriers to end-use energy efficiency and reports that up to 50 percent of residential energy use in the US is affected by such barriers
56 The US Department of Energyrsquos National Energy Modeling System (NEMS) has price elasticity built into it The long-run elasticity (assuming price effects remain for 20 years) are ndash031 for residential electric use and ndash025 for commercial electric use See Steven H Wade ldquoPrice Responsiveness in the NEMS Buildings Sector Modelrdquo in Energy Information Administrationrsquos Issues in Midterm Analysis and Forecasting 1999 pp 55 58 table 1 at httpwwweiadoegovoiafissuespdf060799pdf
57 This would require a much larger rate increase just to offset expected load growth over 20 years let alone to reduce demand sufficiently to permit absolute reductions in emissions from the nationrsquos huge generation fleet See Testimony of Richard Cowart
58 T Nakajima and S Hamori ldquoChange in Consumer Sensitivity to Electricity Prices in Response to Retail Deregulation A Panel Empirical Analysis of the Residential Demand for Electricity in the United Statesrdquo Energy Policy (2010) available at wwwsciencedirectcom
59 Ibid
60 John Dimitropoulas Lester C Hunt and Gary Judge ldquoEstimating Underlying Energy Demand Trends Using UK Annual Datardquo at httpuserwebportacuk~judgegAEL_04pdf
61 See for example Meeting Carbon Budgets ndash The Need for a Step Change Progress Report to Parliament Committee on Climate Change October 2009 at httpwwwthecccorgukreportsprogressreports Christopher Jones and Jean-Michel Glachant Why and How the European Union Can Get a (Near to) Carbon-Free Energy System in 2050 MIT Center for Energy and Environmental Policy March 2010 at httpdownloadsthecccorgukdocs2166720CCC20Executive20Summary20AW20v4pdf Roadmap 2050 A practical guide to a prosperous low-carbon Europe The European Climate Foundation April 2010 at wwwroadmap2050eu
62 Without such policies it is unlikely that even RGGIrsquos modest carbon reduction goals will be achieved See Paul Peterson Doug Hurley and David White Synapse Energy Economics Inc ISO New England Scenario Analysis Companion Report Constructing a Future That Meets Regional Goals Aug 8 2007 at wwwsynapse-energycom
23
the Role of foRwaRd caPacity MaRkets in incReasing deMand-side and otheR low-caRbon ResouRces
ISO-NE Rules for Emergency Generators Advance Environmental Goals
Emergency (ldquobackuprdquo) generators typically are diesel-fired and states in New England and elsewhere in the US have restricted the number of hours and days they may be operated through the state permitting process At the time the first regional demand response tariffs were being designed in New England a collaborative of energy regulators environmental regulators the ISO utilities and other stakeholders realized that active demand response programs could lead to substantial incentives for diesel-fired backup generators to operate more often when air quality was at its worst Regulators and the ISO proposed a rule limiting those generators to run for reliability purposes during system emergencies This is a concrete example of reliability rules being written to advance environmental goals as well as power system needs63 In addition a regional working group developed model emissions standards for small generators for statesrsquo consideration64
To reinforce regional air quality policies and goals ISO-NE limits the total amount of emergency generators in the regional capacity market to 600 MW To the extent any excess amount clears the auction capacity payments to these resources are pro-rated
63 See Cowart and Raab p 26
64 See Model Regulations for the Output of Specified Air Emissions From Smaller Scale Electric Generation Resources Oct 31 2002 at httpwwwraponlineorgshowpdfaspPDF_URL=22docsrap_issuesletter-outputbasedemissioninsert_2003_07pdf22
65 Edward S Rubin Carnegie Mellon University ldquoA Performance Standards Approach to Reducing CO2 Emissions for Electric Power Plantsrdquo June 2009 at httpwwwpewclimateorgpublicationsreportcoal-initiative-series-performance-standards-approach-reducing-co2-emissions-ele Also see Chris Simpson and Brenda Hausauer ldquoEmissions Performance Standards in Selected Statesrdquo Regulatory Assistance Project Research Brief November 2009 at httpwwwraponlineorgdocsRAP_Simpson_EPSResearchBrief_2009_11_13pdf
Policy Recommendations and Auction Design Options
We present below recommendations and a menu of auction design options for forward capacity markets that support and enhance carbon policies and carbon reduction targets
bull Power market rules should be constructed to recognize and limit the adverse environmental consequences of power generation The power system and the environment are inextricably linked Explicit consideration of environmental costs and benefits of various electricity resources is not only reasonable but necessary to meet the enormous challenge of climate change
bull Forward capacity markets should reinforce carbon reduction policies which could be accomplished by incorporating one or more of the following into the auction rules
Auction rules could apply an Emissions Performance Standard (EPS) to promote capacity commitments from low-carbon resources and discourage bids from high-emitting power plants An EPS can be expressed as a maximum level of greenhouse gas emissions per unit of electrical output or as a percentage reduction in (annual) plant emissions It can vary with fuel type and incorporate other design variations65 It may be appropriate to adopt an EPS mdash within the auction qualification rules or by regulation mdash particularly if current market signals are not sufficiently
discouraging new construction or repowering of high-emitting generating resources with long lifetimes while forward capacity markets are providing a new revenue stream to keep them running
RegulatoRy assistance PRoject
24
Auction rules could disqualify inefficient generators from participating (and from receiving capacity revenue) or more generally require their retirement through financial incentives regulations or both66 Since 2007 China has been phasing out such plants and intends to retire approximately 50 gigawatts (GW) of small inefficient coal-fired power plants nationwide and 7 GW to 10 GW of small natural gas-fired units as well as halt construction of small inefficient power plants The policy is being put in place three ways the direct rescission of operating permits the transfer of generation rights and price reductions
Capacity payments could vary by the emissions rate of the resource Instead of one price paid to all generation that clears the auction adders could be applied to payments for low-emitting units and deductions could be applied to high-emitting units67 For example a sliding-scale percentage reduction to the per-unit ($kW-month or $MW-day) clearing price could be established based on the average annualized carbon footprint of fossil-fuel resources whereas a price adder above the clearing price could be established for zero-emitting resources
Imputed ldquocarbon addersrdquo could help curtail high-emitting resources Carbon adders are imputed costs that reflect at least a portion of the societal cost of emissions They are generally
used in the context of resource planning and acquisition by a regulated LSE mdash as a way of ensuring that high-carbon risks and low-carbon alternatives are properly valued in the resource selection process But these imputed costs do not get passed on to ratepayers or consumers for every unit of power consumed in contrast to carbon pricing68 Similarly the rules in a forward capacity market could be modified so that carbon adders are applied in determining what resources clear the auction (and will receive the market clearing price for their capacity commitment)
A ldquozero-carbon resource portfolio standardrdquo could establish auctions for separate tranches of resources by emissions level For example one tranche could include energy efficiency and renewable resources The size of each tranche would be based on carbon reduction goals for the region The higher the goals the larger the tranche for energy efficiency and renewable resources These resources decrease carbon emissions because at the margin most power systems are running higher carbon resources
bull Policymakers should consider a longer price commitment in forward capacity markets mdash at least for low-carbon resources The contract period for new capacity in these markets is short (one year in PJM up to five years in ISO-NE) in part so there is greater certainty over forecasts of resource needs for system reliability (to mitigate the risk of over-supply)
66 Small and old coal plants are the most inefficient and polluting both in terms of greenhouse gases and particulate matter By some estimates 50 MW plants may use as much as 200 grams more per unit of electricity output than a plant larger than 300 MW See Frederick Weston Rebecca A Schultz David Moskovitz and Max Dupuy Regulatory Assistance Project ldquoChinarsquos Climate Change Initiatives Do new policies adopted in China offer any guidance for the transformation of the US power sector in a carbon-constrained worldrdquo November 2009 at httpwwwraponlineorgdocsRAP_China20Climate20Initiatives_NARUC_2009_11_01docx
67 See N Jonathan Peress and Kenneth A Colburn ldquoElectrical Connections Aligning Capacity Market Changes With RGGI in the Northeastrdquo Discussion Draft March 2005 at httpwwwpucnhgovEPABSymbiotic202005-03-1820Peress-Colburn20Letter20to20FERC-Woodpdf
68 Both high carbon resources and low carbon resources clearing in power markets (characterized by single-price auctions) are paid the same price So whenever fossil resources are on the margin (most of the time in most places) consumers are seeing the same price for both fossil and clean resources and the cost of carbon allowances (or carbon taxes) for that marginal resource is reflected in the clearing price for all power bought in the market Carbon adders on the other hand are not actually paid to any resource or reflected in prices for all units sold in the market
25
the Role of foRwaRd caPacity MaRkets in incReasing deMand-side and otheR low-caRbon ResouRces
Auction winners can generally participate in future auctions and receive the market clearing price but have no assurance of future prices Moreover under current rules in PJM energy efficiency resources cannot receive capacity payments over the full life of the measures mdash only for four consecutive delivery years This constraint puts energy efficiency on a different footing than other demand resources mdash as well as all supply-side resources mdash which are paid for their capacity as long as they provide the benefit
The short commitment period and lack of price certainty may not provide market signals that are strong and consistent enough to ensure sufficient new generation or encourage plant operators and investors to make efficient choices for the long-term mdash even where carbon prices are expected to increase substantially in the future due to a dramatically declining carbon cap or a high carbon tax Allowing clean resources to opt for a longer period of time over which the price is known would in particular facilitate renewable resources whose typically high upfront capital costs and low operating costs mdash compared to natural gas-fired plants in particular mdash may require such a long-term commitment to procure financing69 Another option might be to establish fixed floor prices for clean energy resources for a long-term period to provide assurance of a minimum revenue stream
bull Regional load forecasting should be reviewed for treatment of demand-side resources acquired outside the capacity market In particular the system operator determines the capacity that will be auctioned for each delivery year (three years hence) based on a 10-year load forecast which is updated on
an annual basis Under the current planning process in forward capacity markets this forecast only reflects the demand-side resources that have cleared in prior auctions The system operatorrsquos load projections do not take into consideration any load reductions from demand-side resources procured outside of the auction such as energy efficiency programs that LSEs have committed (or are obligated) to fund and implement in the coming one to three years or beyond70 If the magnitude of these load reductions is substantial the ISO may be systematically overstating the level of capacity put out to bid for each delivery year Depending upon the existing mix of resources and market conditions in the region this overstatement may have a sizeable impact not only on the level of cleared capacity and the market price but on the resulting resource mix and level of carbon emissions as well
Additional Actions
Careful design of the planning process and auctions undertaken through forward capacity markets can help to ensure that they reinforce and do not work at cross purposes with climate reduction goals and targets However forward capacity market signals (capacity prices) are only one component of a market and regulatory landscape that affects investment and operating decisions in the power sector Market rules and procurement policies that affect system energy requirements ndash as well as policies and regulations that affect access location and cost recovery for transmission and distribution facilities ndash have an enormous impact on both the short- and long-term resource mix
It is beyond the scope of this paper to fully explore how
69 LSEs in PJM and ISO-NE can contract for generating resources through the bilateral market to hedge energy and capacity costs and to meet renewable energy standards Renewable resource projects that successfully negotiate such contracts if they are long term may not need a long-term commitment in the forward capacity market Still a short-term capacity payment stream with uncertain prices thereafter weakens the ability of renewable resources to secure long-term financing
70 Some of the econometric models that the system operators use for their load forecasts may capture the impacts of federal appliance standards and building codes However to our knowledge there has been no explicit accounting to date for the impacts of state and utility energy efficiency programs where the capacity is not bid into the auctions
RegulatoRy assistance PRoject
26
market rules and other policies and regulations can be harmonized and strengthened to meet customersrsquo energy needs reliably in a carbon-constrained world Larger and longer lasting commitments to demand-side and renewable resources are certainly needed to ensure a mix of resources that will significantly reduce greenhouse gas emissions in the power sector This has been the conclusion of US policymakers who have put in place additional policies to facilitate long-term acquisition of low-carbon resources in regions that operate both forward capacity markets and a cap-and-trade program (under RGGI)71
bull States have adopted a variety of mechanisms for sustained and aggressive energy efficiency programs
bull Strong building codes and equipment standards
bull Stable funding through a system benefit charge
bull Third-party administration of programs or where the utility is the efficiency portfolio manager decoupling of utility profits from revenues financial incentives for shareholders or both
bull Recycling of carbon auction proceeds into energy efficiency investments
bull Some states require long-term resource plans or resource procurement plans that must include energy efficiency Therersquos renewed interest in long-term planning and procurement particularly for demand-side and renewable resources following a period
where these efforts were largely abandoned with electric industry restructuring and development of organized markets72
bull Several states have adopted energy efficiency resource standards that require achievement of specified energy-saving targets73
bull Most of the states have renewable energy standards74 and several states require long-term contracting of renewable resources to meet the standards75
bull Connecticut Maryland Pennsylvania and Rhode Island require contract terms of 10 years or longer
bull New York requires central procurement of renewable energy credits by a state agency under long-term contract Illinois is likely to acquire long-term contracts for renewable resources under its central procurement mandate
bull Massachusettsrsquo Green Power Partnership purchases renewable energy credits for up to 10 years using its renewable energy fund
These are just examples and certainly not an exhaustive list of the ways in which careful design of forward capacity markets coupled with additional policies at the federal regional and state level can serve to reinforce both resource adequacy requirements and carbon reduction goals
71 Regulatory Assistance Project policy grids summarize state-by-state requirements for resource planning and energy efficiency at httpwwwraponlineorgFeatureaspselect=116 For a summary of renewable energy standards in the US see Ryan Wiser and Galen Barbose Lawrence Berkeley National Laboratory ldquoState of the States Update on RPS Policies and Progressrdquo State-Federal RPS Collaborative Nov 18 2009 at httpwwwcleanenergystatesorgMeetingsRPS_Summit_09WISER_RPS_Summit2009pdf
72 More broadly 30 states nationwide require integrated resource plans or resource procurement plans that include energy efficiency
73 Includes states with strict energy efficiency standards states with Commission-ordered efficiency targets states that allow efficiency to count toward renewable energy standards and states with a rate cap that triggers a relaxation of requirements See Laura A Furrey Steven Nadel and John A ldquoSkiprdquo Laitner ACEEE Laying the Foundation for Implementing a Federal Energy Efficiency Resource Standard March 2009 at httpaceeeorgpubse091htm
74 Some 29 US states and the District of Columbia have renewable energy standards five other states have non-binding goals See Wiser and Barbose
75 For a US database of state incentives for renewable energy and energy efficiency see httpwwwdsireusaorg
27
the Role of foRwaRd caPacity MaRkets in incReasing deMand-side and otheR low-caRbon ResouRces
An example of an approach that attempts to ldquomarryrdquo integrated least-cost resource planning with forward capacity markets is the resource planning and procurement process recently established by the Connecticut Legislature76 The law requires the utilities Energy Advisory Board and Department of Public Utility Control to plan for current and future energy and capacity needs and provide a mechanism for procuring resources that meet specified economic reliability and environmental objectives77 to satisfy the identified need Further the law requires that resource needs first be met through energy efficiency and demand reduction resources that are cost effective reliable and feasible Based on the resulting resource plans LSEs enter into
contracts to acquire the required capacity (level and mix) through a competitive bidding process The law also requires that any resources winning contracts for capacity agree to let the LSE bid that capacity into the forward capacity auction as a ldquoself-suppliedrdquo resource This approach permits LSEs to determine both the quantity and mix of resources through integrated resource planning that will meet their resource adequacy requirements and state policy goals (eg carbon reduction) The LSE pays the contracted capacity price (under its bilateral contracts) instead of paying the auction clearing price to everyone that offers capacity into the forward capacity market (eg existing fossil fuel or nuclear plants)78
Connecticutrsquos Marriage of Resource Planning and Markets
76 Conn Gen Stat sectsect 16a-3a 16a-3b and 16a-3c
77 Costs and benefits cost-effectiveness cost impacts on customers the extent to which load growth can be eliminated and peak demand reduced reliability including energy security and economic risks impacts on meeting state environmental standards including emissions goals optimization of existing generation and generation sites the extent to which renewable resources can be used to meet needs and fuel types diversity and supply See Department of Public Utility Control Final Order in Docket No 08-07-01 Feb 18 2009
78 This approach is not without some controversy A contracted new resource in Connecticut has the potential to displace an alternative ldquocompetitiverdquo new resource in the region that would have bid at a higher price mdash had Connecticut not been allowed to designate the contract as self-supply ISO-NErsquos Internal Market Monitoring Unit has commented on this issue in a report to FERC See Internal Market Monitoring Unit ISO-NE June 5 2009
RegulatoRy assistance PRoject
28
Conclusions and Recommendations
Auction-based capacity markets in the US have been successful to date in attracting the capacity needed to maintain system reliability in an economically efficient manner In particular these markets have been successful in facilitating new demand-side resources
with ratepayers and society reaping the economic and environmental benefits However policymakers also should consider capacity markets in the context of carbon reduction policies and targets for the power sector Even markets that successfully integrate demand-side and renewable resources into the auction process are still encouraging the construction or continued operation of high-emitting supply-side resources to meet reliability targets
Existing capacity markets should be evaluated to assess whether the market is responding in this way And if it is policymakers need to critically assess whether a continuation of that market response over the coming years will make it possible to achieve the cumulative level of carbon reductions required from the power sector to avoid the worst effects of climate change Depending on the results of this inquiry policymakers may need to refine the auction rules and adopt additional policies for the power sector mdash such as those described in this paper mdash to ensure the alignment of capacity markets with both short- and long-term carbon reduction goals
More generally forward capacity markets create a revenue stream for resources that can commit to being available at times of system peak several years in the future mdash but this financial incentive is clearly not the only factor driving the mix of resources in the power sector and their resulting carbon footprint Market rules policies and regulations that affect investment and operating decisions for meeting the systemrsquos energy requirements mdash as well as those that affect access location and cost recovery for transmission and distribution facilities mdash have an enormous impact on both the short- and long-term resource mix in the electric system Policymakers will need to consider how this entire market and regulatory landscape mdash including forward capacity markets mdash can be strengthened and harmonized to reliably meet customer demand for electricity in a carbon-constrained world
29
the Role of foRwaRd caPacity MaRkets in incReasing deMand-side and otheR low-caRbon ResouRces
Cleared capacity values in the following tables represent all capacity committed by existing resources remaining in the market and all new resources that bid into the auction at or below
the market clearing price Cleared capacity includes ldquoself-suppliedrdquo or ldquoself-scheduledrdquo resources entered into the auction by LSEs However as described in this paper when the monthly billingsettlement process is completed the capacity charges allocated to the LSE will be offset (credited) for the cleared capacity delivered by these resources
Incremental capacity in the tables below reflects 1) new generation resources 2) capacity upgrades to existing generation resources 3) partial offsets to
incremental generation capacity due to capacity de-ratings to existing generation resources 4) new demand response resources 5) upgrades to existing demand response resources and 6) new energy efficiency resources
PJM Results79
PJM has conducted five Base Residual Auctions since its inception in 2007 for delivery years beginning in 20082009 (that each run from June 1 to May 31) Capacity cleared in the PJM auction is defined in terms of ldquounforcedrdquo capacity that is the capacity of a resource adjusted for availability and deliverability based on historical performance (eg forced outages)
Appendix 1
Detailed Results for PJM and ISO-NE Capacity Markets
Table 1 Generation Demand Resources and Energy Efficiency Resources
Offered and Cleared in PJM Base Residual Auctions (Unforced Capacity in MW)
Delivery Year 20082009 20092010 20102011 20112012 20122013
Generation Offered 1311648 1326142 1321248 1360679 1348730
DR Offered 7158 9368 9679 16524 98476
EE Offered - - - - 6527
Total Offered 1318806 1335510 1330927 1377203 1453733
Generation Cleared 1290614 1313389 1312515 1308566 1285274
DR Cleared 5362 8929 9390 13649 70473
EE Cleared 00 00 00 00 5689
Total Cleared 1295976 1322318 1321905 1322215 1361436
Energy efficiency resources were first eligible in the 20122013 auction
79 All information for PJM compiled from ldquo20122013 RPM Base Residual Auction Resultsrdquo at httpwwwpjmcom~mediamarkets-opsrpmrpm-auction-info2012-13-base-residual-auction-report-document-pdfashx
RegulatoRy assistance PRoject
30
Table 2 Incremental Capacity Additions and Reductions in PJM Base Residual Auctions(Installed Capacity in MW)
Delivery Year 20072008 20082009 20092010 20102011 20112012 20122013 Total
Increase inGenerationCapacity 6020 7242 12723 17762 35763 18935 98445
Decrease inGenerationCapacity -6746 -3754 -5502 -3018 -2647 -32539 -54206
Net Increase inDemand ResourceCapacity 5550 5747 2150 287 6617 79381 99732
Net Increasein EnergyEfficiency Capacity 0 0 0 0 0 6323 6323
Net Increasein InstalledCapacity 4824 9235 9371 15031 39733 72100 150294
Note Change in generation capacity is cumulative net increase in demand-side resources is relative to previous yearrsquos Base Residual Auction
Table 3 Breakdown of Incremental Capacity Resource Additionsin PJM Base Residual Auctions (Installed Capacity in MW)
Delivery Year CTGT Combined Diesel Hydro Steam Nuclear Solar Wind Total Cycle (Coal)
New 20072008 187 03 190Capacity 20082009 270 661 931Units 20092010 3995 238 530 4763 20102011 2833 5800 230 1414 10277 20112012 4164 11350 7048 11 752 23325 20122013 4038 5850 78 363 751 11080
Capacity 20072008 470 470From 20082009 1310 1310Reactivated 20092010 0Units 20102011 1600 107 1707 20112012 800 1010 1810 20122013 0
Uprates to 20072008 1145 139 800 2356 920 5360Existing 20082009 1082 340 180 1055 1960 384 5001Capacity 20092010 1522 2060 1625 614 1974 165 7960Resources 20102011 1173 1630 480 892 1603 5778 20112012 3692 1486 574 1868 2921 87 10628 20122013 2312 1643 142 1930 1260 568 7855
Total 28356 30159 2145 3963 20351 9062 11 4398 98445
Note Values represent capacity commitments Nameplate ratings of variable resources (solar and wind) are far larger than shown here
31
the Role of foRwaRd caPacity MaRkets in incReasing deMand-side and otheR low-caRbon ResouRces
Table 4 Changes to Generation Retirement Decisions
Since Reliability Pricing Model Approval (Unforced Capacity in MW)
Generation Resource Decision Changes Capacity Cleared
Withdrawn Deactivation Requests 17987
Postponed or Cancelled Retirement 13029
Reactivation 1752
ToTal 3276 8
Note Unforced capacity cleared in Base Residual Auctions from resources that withdrew their request to deactivate postponed retirement or were reactivated (ie came out of retirement or mothball state)
Table 5 PJM Base Residual Auction Clearing Price
Delivery Year Clearing Prices ($MW-day)
20072008 $4080
20082009 $11192
20092010 $10204
20102011 $17429
20112012 $11000
20122013 $1646
Note Values do not include any locational price adders Simple conversion of $MW-day to $kW-month multiply by 3 and divide by 100
Table 6 Effect of Demand-Side Resources on PJM Market Clearing Price
20122013 Base Residual Auction80
Actual Auction Results Calculated Results Without Demand-Side Resources
Clearing Prices Cleared Unforced Clearing Prices Cleared Unforced Savings
($MW-day) Capacity (MW) ($MW-day) Capacity (MW) ($MW-day)
$1646 1361435 $17878 1335682 $16232
80 Bowring Monitoring Analytics Table 20
RegulatoRy assistance PRoject
32
ISO-NE ResultsISO-NE has held three forward capacity auctions to
date The first auction (FCA 1) in February 2008 was for capacity delivery beginning in June 2010 (20102011 delivery year) The second auction (FCA 2) was held in December 2008 for delivery in 20112012 and the third
Table 7 Summary Results for ISO-NE Capacity Auctions81
Net Installed Total Resources Excess Clearing Net Price Capacity Cleared Capacity Price ($kW-month)82
Requirement (MW) (MW) ($kW-month)
FCA 1 32305 34077 1772 $450 $425
FCA 2 32528 37283 4755 $360 $312
FCA 3 31965 36996 4649 $295 $254
Table 8 Demand-Side Resources Cleared in ISO-NE Capacity Auctions (MW)81
Distributed Distributed Energy Real-Time Demand Real-Time Total Generation- Generation- Efficiency ResponseLoad Emergency Demand-Side Fossil Fuels Renewable Resources Management Generation Resources
FCA 1 46 lt02 655 978 875 2554
FCA 2 93 lt02 890 1195 759 2937
FCA 3 86 07 975 1206 630 2898
auction (FCA 3) was held in October 2009 for delivery in 20122013 ldquoClearedrdquo amounts in these tables include resources from earlier auctions that remain listed as well as new resources less resources that drop out
Note Net Installed Capacity Requirement values exclude the interconnection benefits associated with the Hydro-Queacutebec Phase III interface Excess capacity is not adjusted for Real-Time Emergency Generation in excess of the 600 MW limit Net prices reflect prorating of clearing prices due to excess capacity clearing the auction Simple conversion of $kW-month to $MW-day divide by 3 and multiply by 100
Note Demand-side values are grossed-up for avoided transmission and distribution losses and reserve margin (no reserve margin forFCA 3) Total resources cleared include excess capacity above the Net Installed Capacity Requirement Real-time emergency generation refers to distributed generation whose state air quality permit limits operation to ldquoemergencyrdquo conditions See Appendix 3
81 ISO-NE Forward Capacity Market Results at httpwwwiso-necommarketsothrmkts_datafcmcal_resultsindexhtml
82 Communication with Henry Yoshimura director Demand Resource Strategy ISO-NE March 2009
83 Eric Winkler ISO-New England ldquoThird Regional Energy Efficiency Initiative Meetingrdquo July 7 2009 and ldquoFCA Updaterdquo Demand Response Working Group Meeting Dec 2 2009 Total resources cleared (Capacity Supply Obligation) from Forward Capacity Market Auction Results for the 20102011 20112012 and 20122013 auctions at httpwwwiso-necommarketsothrmkts_datafcmcal_resultsindexhtml
33
the Role of foRwaRd caPacity MaRkets in incReasing deMand-side and otheR low-caRbon ResouRces
Step 1
System Operator (SO) Plans ldquoForwardrdquo for the Region
2012 Projection of Peak Demand = 10000 MW (incl reserves) Each ldquoLoad Serving Entityrdquo (LSE) is obligated for its 50 share
Appendix 2
Illustration of ldquoHow Forward Capacity Markets Workrdquo
SO purchases capacity in 2012 at the 2009 auction clearing price
LSE can be regulated utility or competitive retail supplier
LSE1 5000 MW
LSE2 5000 MW
R1
R1 =3500 MW capacity ldquoSelf Supplyrdquo Resources (LSE1 ownedunder contract)
RegulatoRy assistance PRoject
34
Step 2
The Regional Capacity Auction (3 Years ldquoForwardrdquo)
Step 3
System Operator Pays Cleared Resources at P and Bills LSEs(Note Self-Supply capacity is a ldquowashrdquo)
R1 R2 R3 R4 R5 R6 R7
P
R1
R3
R3
R5
R5
R2
R2
R4
R4
R6
R7
Bid Price = $ per MW-day
Quantity = MW
6500 MW P
Cleared Capacity = 10000
Supply = Capacity Committed ldquoForwardrdquo
P= Clearing price paid to all capacity clearing auction
Demand = SO Forecast of Capacity Requirements
R1-R7 = Capacity offered by Supply-Side (New built Existing Uprates) and Demand-Side (Energy Efficiency Demand Response Distrib Gen) Self-supply (R1) bids in a ldquozerordquo price New Resources set clearing price
LSE1 5000 MW
LSE2 5000 MW
R1
SOSO pays R1 3500 MW P
LSE2 pays its share of regional demand
5000 MW P
LSE1 pays its share of regional demand (5000 MW) adjusted for self-supply R1 for a net payment of 1500MW P
R1 = 3500 MW of ldquoSelf-Supplyrdquo Resources (LSE1 ownedunder contract)
In 2010Total regional peak demand of 10000 MW supplied by R1 + R2 + R3 + R4 + R5 LSE1 and LSE2 are each responsible for 50 of regional peak demand
35
the Role of foRwaRd caPacity MaRkets in incReasing deMand-side and otheR low-caRbon ResouRces
PJM Eligibility Requirements
Eligibility of demand-side resources has changed significantly over the years in PJMrsquos capacity markets In particular it was not until the most recent capacity auction (May 2009) for the
20122013 delivery year that energy efficiency became eligible to bid in PJMrsquos Base Residual Auction PJM is currently considering a tariff change to also allow energy efficiency to bid into incremental auctions
Under PJMrsquos eligibility rules an energy efficiency resource must achieve a ldquopermanentrdquo continuous reduction in electric energy consumption Examples of such a resource include lighting retrofit programs for residential commercial and industrial customers and programs to retrofit buildings with heating and cooling systems that exceed current efficiency standards To be eligible an energy efficiency resource must meet the following criteria
bull It is fully implemented throughout the delivery year without any requirement of notice dispatch or additional customer action
bull It is not reflected as a reduction in the peak load forecast used for the Base Residual Auction for the proposed delivery year
bull It exceeds relevant standards (such as building codes or appliance standards) at the time of commitment
bull It achieves the specified load reduction (expected average demand in MW) during defined summer on-peak hours84
Demand response on the other hand must be dispatchable mdash that is customer demand must be reduced when instructed For example a large supermarket with
coolers and freezers could install load management equipment that would cycle them on or off mdash and bid that demand response capability into the market85 More specifically a demand response resource must meet the following criteria
bull It is able to reduce demand for electricity up to 10 times each year for up to six consecutive hours per interruption during defined periods86
bull It is fully implemented within one hour (short lead time) or two hours (long lead time) of notice from PJM
bull In a year without calls for demand reductions it must demonstrate reliability through a test of reduction capability
bull It is registered in the Emergency Load Response Program and thus available for dispatch during PJM-declared emergency events
bull Compliance and status reports are filed as required
Multiple end-use customers can be aggregated in order to submit a single demand response offer in the capacity auction if those customers share the same curtailment service provider electric distribution company and transmission zone
In addition customer-sited distributed generation may be offered into auctions as a demand resource A hospital for example could offer to run its back-up generator on certain peak demand (eg hot summer) days to reduce its load on the system Or an industrial plant could cut back on production on such days and continue to run its on-site combustion or steam-cycle turbine
Currently energy efficiency resources may participate
Appendix 3
Eligibility Requirements for Demand-Side Resourcesin US Capacity Markets
84 Weekdays excluding holidays June through August between the hours ending 1500 and 1800 Eastern Prevailing Time (EPT)
85 If instead the supermarket replaced the existing coolers and freezers with more energy efficient ones it would bid that proposal in as an energy efficiency resource Or it could do both (replace and cycle) and bid in the capacity from the permanent savings (replacements) as energy efficiency and the dispatchable capacity (the cycling) as demand response
86 Weekdays excluding holidays from 1200 to 2000 EPT May through September and 1400 to 2200 EPT October through April
RegulatoRy assistance PRoject
36
in Base Residual Auctions for up to four consecutive delivery years In effect this means that PJM limits capacity payments for efficiency measures to four years of their measure life (rather than for the full measure life)87 In contrast a demand response resource (including distributed generation) can participate in the PJM capacity market for as long as its ability to reduce demand continues
ISO-NE Eligibility RequirementsSince the inception of ISO-NErsquos forward capacity market
in 2006 energy efficiency has qualified as an eligible demand-side resource ISO-NE defines demand resources as installed measures (products equipment systems services practices and strategies) that result in verifiable reductions in end-use consumption of electricity in the New England power system These are further categorized into ldquopassiverdquo (energy efficiency and non-dispatchable distributed generation) and ldquoactiverdquo (demand response emergency generation and dispatchable distributed generation) resources Passive demand resources are non-dispatchable but permanently reduce energy demand during peak hours Active demand resources are designed to reduce peak loads and to reduce load based on real-time system conditions or ISO-NE instructions Following are descriptions of eligible demand-side resources and performance requirements88
Passive Demand Resourcesbull On-Peak Demand Resources are measures that are
not weather-sensitive and reduce demand across a fixed set of on-peak hours such as energy-efficient commercial lighting and motors89
bull Seasonal Peak Demand Resources are weather-sensitive measures that reduce load during high-demand conditions such as energy-efficient heating and air conditioning systems Seasonal Peak Demand Resources must reduce load when actual system load is equal to 90 percent of the most recent peak load forecast for the applicable summer or winter season
Active Demand Resourcesbull Real-Time Demand Response Resources are
measures including load management and distributed generation that can be dispatched by ISO-NE as needed They must curtail electrical usage within 30 minutes of receiving a dispatch instruction and until receiving a releaserecall dispatch instruction
bull Real-Time Emergency Generation is distributed generation whose state air quality permit limits operation to ldquoemergencyrdquo conditions Generators must curtail the customerrsquos electrical usage within 30 minutes of receiving a dispatch instruction and until receiving a releaserecall dispatch instruction The amount of emergency generation that can be used to meet ISO-NErsquos capacity requirement is limited to 600 MW If the amount of real-time emergency generation that clears the auction exceeds this level payments to generators are reduced on a pro-rated basis All real-time emergency generation is treated as existing capacity
In contrast to PJM all demand-side resources in ISO-NE are eligible to bid capacity for their full measure life an approach that recognizes the full contribution of these resources to regional resource adequacy requirements and adds value to long-lived energy efficiency assets
87 FERC has directed PJM to evaluate the impact of its capacity payment period for energy efficiency resources
88 Eric Winkler and Abimael Santana ISO-NE ldquoNew Demand Resource Qualificationrdquo May 5 2009 at httpwwwiso-necomsupporttrainingcoursesfcmfcm_forum_may_5pdf
89 Summer on-peak hours are 1300 to 1700 non-holiday weekdays in June July and August Winter on-peak hours are 1700 to 1900 non-holiday weekdays in December and January
The Regulatory Assistance Project (RAP) is a global non-profit team of experts that focuses on the long-term economic and environmental sustainability of the power and natural gas sectors providing technical and policy assistance to government officials on a broad range of energy and environmental issues RAP has deep expertise in regulatory and market policies that promote economic efficiency protect the environment ensure system reliability and fairly allocate system benefits among all consumers We have worked extensively in the US since 1992 and in China since 1999 and have assisted governments in nearly every US state and many nations throughout the world RAP is now expanding operations with new programs and offices in Europe and plans to offer similar services in India in 2011 RAP functions as the hub of a network that includes many international experts and is primarily funded by foundations and federal grants
Home office
50 State Street Suite 3Montpelier Vermont 05602
802-223-8199wwwraponlineorg
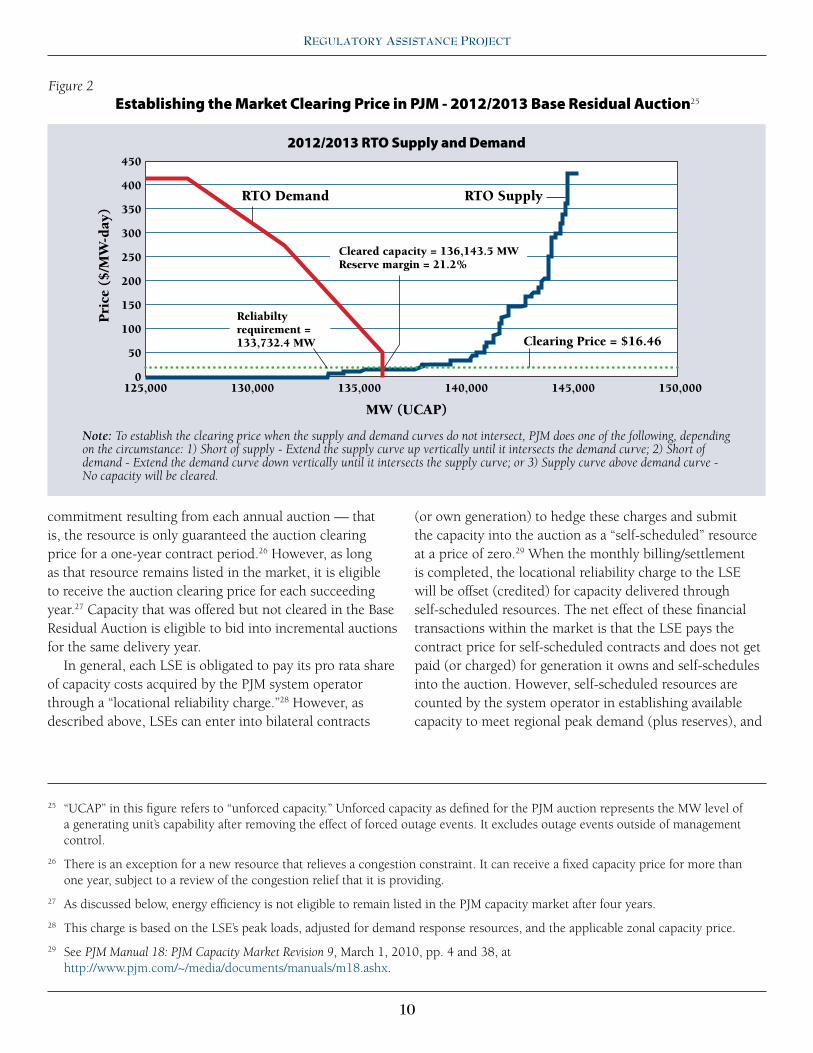
RegulatoRy assistance PRoject
10
commitment resulting from each annual auction mdash that is the resource is only guaranteed the auction clearing price for a one-year contract period26 However as long as that resource remains listed in the market it is eligible to receive the auction clearing price for each succeeding year27 Capacity that was offered but not cleared in the Base Residual Auction is eligible to bid into incremental auctions for the same delivery year
In general each LSE is obligated to pay its pro rata share of capacity costs acquired by the PJM system operator through a ldquolocational reliability chargerdquo28 However as described above LSEs can enter into bilateral contracts
(or own generation) to hedge these charges and submit the capacity into the auction as a ldquoself-scheduledrdquo resource at a price of zero29 When the monthly billingsettlement is completed the locational reliability charge to the LSE will be offset (credited) for capacity delivered through self-scheduled resources The net effect of these financial transactions within the market is that the LSE pays the contract price for self-scheduled contracts and does not get paid (or charged) for generation it owns and self-schedules into the auction However self-scheduled resources are counted by the system operator in establishing available capacity to meet regional peak demand (plus reserves) and
25 ldquoUCAPrdquo in this figure refers to ldquounforced capacityrdquo Unforced capacity as defined for the PJM auction represents the MW level of a generating unitrsquos capability after removing the effect of forced outage events It excludes outage events outside of management control
26 There is an exception for a new resource that relieves a congestion constraint It can receive a fixed capacity price for more than one year subject to a review of the congestion relief that it is providing
27 As discussed below energy efficiency is not eligible to remain listed in the PJM capacity market after four years
28 This charge is based on the LSErsquos peak loads adjusted for demand response resources and the applicable zonal capacity price
29 See PJM Manual 18 PJM Capacity Market Revision 9 March 1 2010 pp 4 and 38 at httpwwwpjmcom~mediadocumentsmanualsm18ashx
450
400
350
300
250
200
150
100
50
0125000 130000 135000 140000 145000 150000
Pri
ce (
$M
W-d
ay)
MW (UCAP)
Figure 2 Establishing the Market Clearing Price in PJM - 20122013 Base Residual Auction25
20122013 RTO Supply and Demand
RTO Supply
Clearing Price = $1646
RTO Demand
Note To establish the clearing price when the supply and demand curves do not intersect PJM does one of the following depending on the circumstance 1) Short of supply - Extend the supply curve up vertically until it intersects the demand curve 2) Short of demand - Extend the demand curve down vertically until it intersects the supply curve or 3) Supply curve above demand curve - No capacity will be cleared
Reliabilty requirement = 1337324 MW
Cleared capacity = 1361435 MWReserve margin = 212
11
the Role of foRwaRd caPacity MaRkets in incReasing deMand-side and otheR low-caRbon ResouRces
are subject to applicable performance requirementsIn addition to self-scheduling by LSEs PJM provides
a complete ldquoopt outrdquo ndash the ldquoFixed Resource Requirement Alternativerdquo ndash for LSEs that take full resource planning responsibility for all loads in their service area for a five-year period The projected peak capacity needs for LSEs selecting this alternative are not included in the PJM planning process to establish the regionrsquos capacity needs for the auction and the LSErsquos capacity resources (including capacity acquired through bilateral contracts) are not offered into the auction Moreover under this opt-out alternative the LSE cannot bid any excess capacity into the auction or acquire any capacity through it
Capacity suppliers can cover any auction commitment shortages through the bilateral market facilitated by an electronic system at PJM If capacity shortfalls reach triggering conditions PJM can delay deactivation of a generating resource or hold a backstop reliability auction for capacity resources for a term of up to 15 years30
To improve the availability of capacity resources when needed the capacity product in the PJM market is defined to include forced outage rates based on historical performance and penalties are imposed if the plant is not up and running during a shortage
ISO New Englandrsquos Capacity Market
As in PJM eligible capacity resources in New England include both new and existing demand-side and supply-side resources (including generators outside the ISO-NE footprint) From the start ISO-NErsquos forward capacity market allowed energy efficiency demand response and distributed generation to compete with generation on an equivalent basis which meant among other things that new demand resources could set the market clearing price
Like PJM each year ISO-NE holds a capacity auction three years in advance of the delivery period and sets the amount of capacity to be purchased in each auction In addition to the annual forward capacity auction ISO-NE holds voluntary monthly and annual reconfiguration auctions that allow deficient suppliers to procure replacement capacity These auctions also provide the
system operator the opportunity to buy additional capacity if the load forecast increases or to sell capacity if the forecast decreases
However ISO-NE does not establish a downward sloping demand curve (Variable Resource Requirement) for its auctions Rather ISO-NE puts out a single quantity of capacity for bid referred to as the ldquoInstalled Capacity Requirementrdquo Then ISO-NE uses a descending-clock auction in which market prices are reduced until the quantity of available supply bids matches this capacity requirement Bid quantities and prices decline through successive bidding rounds (with bidders withdrawing resources from the auction as prices decrease) as long as excess capacity is still offered or until the floor price is reached To address start-up issues ISO-NE established a temporary price cap (or ldquostarting pricerdquo mdash see figure below)
30 See PJM Open Access Transmission Tariff Section 16 at httpwwwpjmcom~mediadocumentsagreementstariffashx
Contracts for Differences
Instead of a bilateral contract for physical delivery of capacity an LSE and resource owner can sign a ldquocontract-for-differencesrdquo which means that the level of payments (and who makes them) depends on the auction clearing price For example if the contract price is $50 per MW-day and the clearing price is $46 per MW-day the LSE will pay the resource owner the difference of $4 per MW-day But if the auction clearing price is higher than the contract price the resource owner pays the difference (to the LSE) As in the case of self-scheduled bilateral contracts the LSE will end up paying only the contract price for that capacity However in the case of contracts-for-differences the resource underlying the contract will bid into the market and (if cleared) will receive the auction clearing price And the LSE will be allocated the full locational reliability charge receiving no credits for the contracted capacity The reconciliation happens outside the auction between the LSE and resource owner rather than as part of the monthly billingsettlement process
RegulatoRy assistance PRoject
12
and price floor for the auction The most recent auction for ISO-NE ran seven rounds over two days concluding when the auction reached the floor price of $2951kW-month31
However by rule the load only pays Installed Capacity Requirement times the clearing price so the floor price is further reduced (pro rata) to achieve that effect32 Figure 3 below illustrates the descending clock auction process for ISO-NErsquos first forward capacity market auction
Therersquos another key difference To encourage investment ISO-NE allows new resources to lock in a capacity price for up to five years (with a one-year minimum term)
regardless of clearing prices in subsequent auctions The capacity price is indexed for inflation after the first year and the bidder must select the proposed contract term in advance of the auction Existing resources including existing demand-side resources are eligible only for a one-year price commitment mdash as is the case for PJM
While ISO-NE also permits LSEs to meet their capacity requirements with self-supplied resources (owned resources and resources under bilateral contracts) ISO-NE does not provide an ldquoopt outrdquo alternative as described above for PJM Similar to PJMrsquos ldquoself-scheduledrdquo option the
31 The caps and floors were originally scheduled to be eliminated following the third forward capacity auction However a recent filing by ISO-NE to implement the results of a stakeholder process proposes to continue these mechanisms for the next three auctions For more information on how the descending clock auction functions and how these capsfloors are established see ISO-NE Internal Market Monitoring Unit Review of the Forward Capacity Market Auction Results and Design Elements June 5 2009 at httpwwwiso-necomcommitteescomm_wkgrpsothrfcmwgmtrls2009aug720096-05-09_market_monitor_report_for_fcmpdf
32 With some exceptions resources have the option to pro-rate their cleared MW (rather than take a lower price)
33 Jenkins et al p 178
40000
39000
38000
37000
36000
35000
34000
33000
32000
31000
30000 Start 1 2 3 4 5 6 7 Close
Final Results of ISO-NE FCM Auction 1
$900
Start at $1500
$800 $700$600
$5625
$525 $4875 $450
End-of-round price
Round
Su
pp
ly a
vail
able
(M
W)
at e
nd
of
rou
nd
Final Capacity Needed (ICR)
Figure 3Example of Descending Clock Auction for ISO-NErsquos Forward Capacity Market33
Note Prices are in $USkW-month By rule the load only pays Installed Capacity Requirement times the clearing price so the floor price is further reduced (pro rata) to achieve that effect
13
the Role of foRwaRd caPacity MaRkets in incReasing deMand-side and otheR low-caRbon ResouRces
LSErsquos full capacity obligation (including that portion met through self-supply) is included in the Installed Capacity Requirement put out to bid and the self-supplied resources are also counted towards the resources available to meet that requirement (at a price of zero) in the auction process The net effect for the LSE is also the same The capacity committed as self-supply does not receive any capacity revenue and the LSErsquos capacity obligations satisfied through self-supply are not subject to capacity charges Further the LSErsquos self-supplied resources are subject to applicable penalties and the LSE is subject to capacity charges for any needed residual capacity that the ISO purchases through the auction on its behalf
The penalty provisions in the two regions also differ While both PJM and ISO-NE impose stiff penalty charges if a unit fails to perform when obligated to run ISO-NE also reduces payments to units that are not producing energy at their full capacity level during shortage events mdash similar to the mechanism it uses to reduce capacity payments when prices in the energy market reach very high levels
Role and Eligibility of Demand-Side Resources in FCMs
As discussed above electric systems face a reliability challenge not faced by other commodity markets Because customers are physically interconnected because electricity cannot be meaningfully stored and because electric service is central to economic and social well-being the balance between demand and supply is critical at all times and this balance must be assured over a sustained period of time The FCM design described in this paper recognizes that actions taken on the demand side of the market can effectively moderate price spikes and enhance reliability in a comparable manner as capacity commitments from supply-side generation mdash through short-term customer demand responsiveness during system peak or through permanent and continuous reductions in peak demand (energy efficiency) This market design recognizes that demand-side resources broadly defined to encompass demand response energy efficiency and distributed generation can meet system needs lower costs and add
value to power markets in a variety of circumstances The most important opportunities include34
bull Lowering the cost of power delivery reducing congestion and improving the reliability of the delivery system
bull Enhancing regional power system reliability by using a broad range of demand-side resources to meet planning and operational reserves
bull Economically balancing supply and demand in wholesale power markets through demand-side bidding and market transactions for energy supply released through demand reduction
bull Cost-effectively reducing long-term demand and lowering throughput through energy efficiency resources both on the power grid as a whole and within the resource portfolio of power suppliers
To capture these benefits energy efficiency and demand response (including distributed generation) can now compete on a level playing field with generation in the ISO-NE and PJM forward capacity markets Like generating resources demand-side resources must meet market rules for eligibility and availability including demonstrating they will be available at the start of the proposed delivery year Each type of demand-side resource has a specific set of performance hours across which load reductions are required To be eligible for the auction service providers must demonstrate in advance their ability to perform during those hours Like other resources demand-side resources are subject to penalties if there is a mismatch between their capacity commitment and their performance
Demand-side resources must meet comprehensive standards for measurement and verification (MampV) Failure to comply with MampV protocols makes the resource ineligible for the auction failure to submit post-installation MampV reports results in a final capacity offering of zero for the delivery year plus penalties Generally penalties cannot exceed the revenue that would have been collected if the resource performed as specified in the contract Energy efficiency resources also are audited for compliance Although the capacity obligations and associated penalties for non-performance among supply-side and demand-
34 Richard Cowart Regulatory Assistance Project and Jonathan Raab Raab Associates Ltd Dimensions of Demand Response Capturing Customer-Based Resources in New Englandrsquos Power Systems and Markets Report and Recommendations of the New England Demand Response Initiative July 23 2003 at httpwwwraponlineorgdocsRAP_Cowart_DemandResponseAndNEDRI_2003_07_23pdf
RegulatoRy assistance PRoject
14
side resources are not identical in these capacity markets they are designed and intended to provide comparable incentives to perform during specified hours35
Currently the key difference in eligibility requirements for demand-side resources in the ISO-NE and PJM capacity auctions is the circumstances under which energy efficiency resources may participate Under PJMrsquos rules energy efficiency resources may participate in Base Residual Auctions only up to four years This means that efficiency measures are limited to receiving compensation for their capacity contribution to four years of their measure life rather than their full measure life Demand response resources (including distributed generation) can participate in the PJM capacity market for as long as their ability to reduce demand continues In contrast all demand-side resources in ISO-NE are eligible to bid capacity for their full measure life an approach that recognizes the
full contribution of these resources to regional resource adequacy requirements and that encourages long-lived energy efficiency assets Further description of eligible demand-side resources and performance requirements in these markets is presented in Appendix 3
Forward Capacity Auction Results
In the following sections we summarize the overall level of capacity cleared from existing and new resources in the PJM and ISO-NE auctions the level of incremental capacity successfully bidding into these markets and how different types of resources have fared to date mdash with particular focus on demand resources More detailed results for the PJM and ISO-NE forward capacity markets are provided in Appendix 1
Some stakeholders claim that demand resources are not as available as generation yet they get paid the same price for capacity (implying that they should receive a lower price) A closer examination of the ISO-NE rules reveals several problems with this generalization In particular generation availability can actually vary quite widely because these resources are excused from performing if they are on scheduled maintenance (eg nuclear plants are paid their full monthly capacity payment even when they are shut down for weeks of re-fueling) And other generation resources are ldquoallocatedrdquo a specific number of hours for annual maintenance and are paid as if they are providing capacity services when they are off-line Demand resources have pre-established hours they must be available and are penalized for performance failures differently than traditional generationmdashsome argue more severely For example a demand resource that fails to perform is assessed a penalty for that month and its capacity value is reduced going forward (for all future months) While it is possible to re-establish the capacity value
through future performance (demand response) or with updated MampV (energy efficiency) the process is a slow one that can take many months or more A generation unit that fails to perform is assessed a penalty for that month but its capacity value is either unchanged or can be reestablished with a test run at anytime and the monthly capacity payments continue with no reduction Generation plants with long notice requirements (eg 24 to 48 hoursrsquo notice for coal-fired plants if the system operator wants them on-line and actually providing energy) are paid the same as a demand response resource that is required to be dispatchable by the system operator within 30 minutes throughout the year to address shortage events (See Appendix 3) Clearly there are individual rules that stakeholders can argue work to the advantage of supply-side over demand-side resources and vice versa Overall the intent of such variations should be to make obligations penalties and payments for demand and supply resources roughly comparable while recognizing the unique operational issues associated with all resources
Performance Incentives Demand- vs Supply-Side Resources
35 Nonetheless there continues to be debate among stakeholders over whether the appropriate balance has been reached See text box
15
the Role of foRwaRd caPacity MaRkets in incReasing deMand-side and otheR low-caRbon ResouRces
Auction Results for PJM36
PJM has held five Base Residual Auctions including the most recent May 2009 auction for the 20122013 delivery year PJM serves a large market The 20122013 Base Residual Auction cleared a total of 1361436 MW of capacity While generating resources account for nearly all of this committed capacity (1285274 MW) demand response resources (including distributed generation) represent 5 percent of the total (70472 MW) New for the 20122013 delivery year 5689 MW of energy efficiency also cleared the market Table 1 in Appendix 1 lists capacity resources offered and cleared to date As indicated in that table the vast majority of demand-side resources offered into the market cleared each PJM base residual auction
Figure 4 below illustrates the increasing role of demand-side resources in PJM
Renewable generating resources also are gaining some traction in the capacity market although not anywhere near the magnitude of demand-side resources in terms of their overall contribution to resource adequacy requirements This is due to the predominance of wind resources and their variable nature PJM applies a 13 percent on-peak capacity factor to these resources mdash for every 100 MW of wind resources only 13 MW are eligible to meet capacity requirements Some 3234 MW of wind capacity resources cleared in the most recent Base Residual Auction mdash 95 percent of the amount offered While this capacity level is miniscule compared to the total capacity clearing the auction it translates to a large nameplate rating mdash 2488
12000
10000
8000
6000
4000
2000
0
Active Load Management
Prior to RPMImplementation RPM Implemented
Interruptible Load for Reliability
Energy Efficiency RPM Offered Demand Response
Figure 4 Demand-side Participation in PJMrsquos Reliability Pricing Model (RPM) Auctions
Note Demand-side resources included Active Load Management prior to the 20072008 delivery year Interruptible Load for Reliability and Demand Response were first eligible for the 20072008 delivery year Energy Efficiency resources were first eligible for the 20122013 delivery year (May 2009 auction) The large increase in demand response participation in the 20122013 delivery year is in large part due to the elimination of PJMrsquos ILR program
200506 200607 200708 200809 200910 201011 201112 201213
36 Except where noted information and figures in this section and referenced tables in Appendix 1 are from PJM ldquo20122013 RPM Base Residual Auction Resultsrdquo at httpwwwpjmcom~mediamarkets-opsrpmrpm-auction-info2012-13-base-residual-auction-report-document-pdfashx
RegulatoRy assistance PRoject
16
MW of wind resourcesPJM reports that the Base Residual Auctions have
attracted 150294 MW of incremental capacity in the region to date Incremental capacity refers to new generation resources capacity upgrades to existing generation resources new demand response resources upgrades to existing demand response resources and new energy efficiency resources37 Natural gas- and coal-fired plants account for most of the incremental capacity with nuclear plants (from uprates) also making a sizable contribution Tables 2 and 3 in Appendix 1 provide details on the incremental capacity procured It is important to note that the figures in these tables represent resources new to the capacity market including uprates mdash not all are newly built However they include a new merchant coal plant built for the PJM market38
True to one of the original goals the PJM capacity market also has been successful in retaining existing capacity from power plants that were originally under high-cost reliability must-run agreements39 Since FERC approved the Reliability Pricing Model existing capacity that would otherwise have been deactivated or retired has accounted for 32768 MW of procured capacity Table 4 in Appendix 1 shows these changes in resource deactivation and retirement
Market clearing prices for resources in PJMrsquos Base Residual Auctions to date have ranged from $1646 to $17429 per MW-day not including any locational price adders for constrained areas (See Table 5 in Appendix 1) Importantly the $1646MW-day clearing price for the 20122013 delivery year represents a decrease of $9354MW-day from the previous Base Residual Auction due in part to significant increases in capacity from demand response and the introduction of energy efficiency resources into the bidding process Moreover the participation of demand-side resources is estimated to have reduced the market clearing price for the 20122013 delivery year by an astonishing $16232MW-day in unconstrained zones (ie from a clearing price of $17878MW-day without these resources in the bid stack to the actual clearing price
of $1646MW-day) Table 6 in Appendix 1 shows the calculation by PJMrsquos independent market monitor
Auction Results for ISO-NE
ISO-NErsquos forward capacity market is about a quarter of the size of the PJM capacity market mdash the Installed Capacity Requirement set by ISO-NE for the 20122013 delivery year was 31965 MW ISO-NE has held three forward capacity auctions to date and all of them cleared at the administratively set floor price ($450kW-month $360kW-month and $295kW-month respectively) with surplus capacity above the Installed Capacity Requirement set by ISO-NE to meet reliability needs The first auction secured 1772 MW above the requirement the second auction cleared 4755 MW of excess capacity and the third auction cleared 4649 MW of excess capacity (See Table 7 in Appendix 1)
Demand resources have consistently represented about 8 percent of the resources cleared in the three auctions (2554 MW 2937 MW and 2898 MW respectively) an amount that exceeded expectations Energy efficiency accounted for about a quarter of the demand resources in the first auction and about a third in more recent auctions Real-time demand response comprises the largest share of demand resources Emergency generation (ie distributed generation whose state air quality permit limits operation to ldquoemergencyrdquo conditions) also makes a sizeable contribution Non-emergency distributed generation however comprises a negligible amount of the total Table 8 in Appendix 1 shows detailed results for demand resources
Figure 5 shows the growth in demand resources offered and cleared in the first two ISO-NE auctions by type There has been a steady growth in demand-side resources in New England since the first demand-response programs operated by ISO-NE The forward capacity auctions have contributed to and solidified these gains
Participation of demand-side resources in the ISO-NE forward capacity auction has been credited with making the clearing price lower than it would have been otherwise
37 The increase is partially offset by capacity de-ratings to existing generation resources
38 See Pfeifenberger et al at 27
39 As discussed above these contracts have not been dispensed with altogether however
17
the Role of foRwaRd caPacity MaRkets in incReasing deMand-side and otheR low-caRbon ResouRces
as it has in the PJM region Analysis of the first auction bids for example suggests that the participation of these resources saved ratepayers as much as $280 million by lowering the price paid to all capacity resources in the market40
Moreover by contributing to the excess capacity that kept capacity payments at relatively low floor prices in New England the participation of demand-side resources has
also contributed to lower overall market revenues inducing some inefficient oil-fired generating units to shut down at least temporarily Nonetheless existing and new fossil-fuel resources continue to dominate the capacity commitments in this region as is the case for PJM
Overall renewable generating resources (primarily wind resources) are making some headway in the regionrsquos forward capacity market but as in PJM they are not
40 See Cheryl Jenkins et al This calculation reflects what the market clearing price would have been in the auction given the Installed Capacity Requirement put out to bid by the system operator which assumes no impact of energy efficiency programs on loads (because energy efficiency is bidding) Therefore the calculated reduction in clearing price represents a theoretical maximum mdash excluding demand resources from the market would likely have been at least partially offset by a lower amount of capacity put out to bid As a result the difference in the market clearing price (and savings to consumers) would likely have been smaller than the number calculated here although it is difficult to say by how much However even if demand-side resources were not permitted to bid they would contribute to lower prices for consumers by lowering the total quantity of capacity required
41 Internal Market Monitoring Unit ISO-NE June 5 2009
4500
4000
3500
3000
2500
2000
1500
1000
500
0
New UnclearedTotal Uncleared1375 MW
Total Uncleared1159 MW
Total Cleared2279 MW
Total Cleared2778 MW
New Cleared
Existing Delisted Uncleared
Existing Cleared
FCA 1 FCA 1
Figure 5 Demand-Side Participation in ISO-NE Capacity Auctions by Type41
copy ISO New England Inc
Note Activerdquo resources include demand response and emergency generation energy efficiency is considered a ldquopassiverdquo resource Clearing amounts reflect ISO-NErsquos maximum limit of 600 MW of Real-Time Emergency Generation In contrast Table 8 in Appendix 1 shows the actual amount of such resources that cleared the auction Capacity payments to these resources are pro-rated if cleared levels exceed 600 MW
Cap
acit
y (M
W)
Active
Active
Active
Active
Active
Active
Active
Active
Passive
Passive
Passive
Passive
Passive
RegulatoRy assistance PRoject
18
a major contributor to the regionrsquos resource adequacy requirements at this time In the most recent (third) auction 166 MW of wind capacity cleared the auction mdash with a nameplate rating an order of magnitude larger42
Unlike PJM ISO-NE does not apply a deemed on-peak capacity factor to wind and other variable generation resources Instead all such resources must provide data that demonstrate the claimed summer and winter qualified capacity The capacity factor is adjusted over time based on actual performance during specified hours
Forward Capacity Markets in the Context of Carbon Constraints
Power market rules are not constructed in a vacuum rather they are designed to address specific public policy goals As described above forward capacity markets in the US were developed to ensure resource adequacy in the power system at a reasonably competitive price In the face of growing carbon constraints however power market rules need to be redesigned to work in concert with carbon reduction goals and policies rather than at cross purposes The challenge of substantially de-carbonizing the power sector in the coming years is too great to ignore this interaction In particular policymakers should carefully consider what elements of the current planning and procurement process to achieve resource adequacy contribute to the following effects ndash and then work to revise the market rules accordingly
bull Do the market rules encourage new investments in high-emitting resources (including repowering) at the expense of low-carbon alternatives
bull Do they encourage the continued (or increased) operation of existing high-emitting power plants
bull Will they result in a build-out of capacity and cumulative emissions that conflict with the level of de-carbonization required in the power sector mdash or make attainment of that level more costly to the economy
This paper is not intended to evaluate the PJM and ISO-NE capacity markets and auction rules in any depth with respect to these issues However we offer below general observations based on the auction design and results to date in these regions and other studies Following that we provide policy recommendations related design options and additional actions for consideration
General Observations on Forward Capacity Markets and Results
Based on our review of FCM auctions to date and related studies we offer the following observations
bull The ISO-NE and PJM forward capacity markets are meeting their resource adequacy objectives Sufficient levels of capacity have cleared the market to meet each regionrsquos anticipated peak demand and adequate resources are now committed on a forward basis to ensure reliable coverage in future years (up to the 20122013 delivery year) But in a carbon-constrained world the mix of resources is as important as the quantity in both the short-term and the long-term Most resources that are available during peak demand hours also produce electricity or reduce consumption during many more (or all) hours of the year and the carbon intensity of that mix of resources will drive the level of cumulative emissions in the power sector43 As discussed in this paper capacity markets as currently designed provide compensation based on the level of available capacity not the mix of resources providing that capacity It is worth repeating here that the only (non-price) attribute a resource needs to demonstrate for resource adequacy purposes is that it will be available when called upon during the projected hours of peak system loads In a carbon-constrained world policy makers should ask whether the planning and procurement process for acquiring a sufficient level of capacity at a reasonable price is also moving the resource mix in the right direction mdash towards zero or low carbon-emitting demand- and supply-side resources
42 Compiled from auction results at httpwwwiso-necommarketsothrmkts_datafcmcal_resultsccp13fca13indexhtml
43 With the exception of gas-fired peaking units or demand response resources that are dispatched to meet (or reduce) loads only during peak system hours
19
the Role of foRwaRd caPacity MaRkets in incReasing deMand-side and otheR low-caRbon ResouRces
bull Expressly designing demand-side resources into forward capacity markets appears key to achieving all three objectives ndash resource adequacy low-carbon resource mix and reasonable price Energy efficiency and demand response resources are faring well in auction-based capacity markets mdash and this is a positive outcome for several reasons First energy efficiency and other demand-side resources can substitute for existing and planned generation that have a higher carbon footprint thereby reinforcing carbon reduction policies and targets for the region Second demand-side resources can dramatically reduce the costs of meeting the regionrsquos resource adequacy requirements mdash as evidenced by the results of the PJM and ISO-NE auctions In addition the increase in demand-side resources facilitated by capacity auctions can reduce market power because more suppliers and more resources means individual generators have less ability to affect bid offers and clearing prices And because demand-side resources lighten the load at the end of the supplydelivery chain they enhance the reliability of each link in the chain from fuel supply and generation to the local distribution network
bull Differences in the impact of demand-side resources on carbon emissions should be recognized in capacity markets and associated auction rules Energy efficiency decreases carbon emissions because (by definition) it reduces energy use for an equivalent level of service and at the margin almost all power systems are running higher carbon resources In contrast the net impact of demand response on carbon emissions will depend upon specific circumstances including the mix of
plants serving loads at the margin For example when coal is primarily serving baseload and intermediate needs emissions may increase when customers shift loads from on-peak (when natural gas is on the margin) to off-peak periods44 Elsewhere however demand response mdash including any conservation side-effect mdash may reduce emissions from less efficient peaking plants In addition demand response includes real-time emergency generation which is often fossil-fuel powered (eg by diesel or natural gas) Any analysis of the costs and benefits of demand response resources in capacity markets should account for such effects Policies and market rules for demand response should be aligned with its environmental costs and benefits45
bull Renewable generating resources are beginning to make some headway in forward capacity markets mdash in particular wind resources This is in large part because the markets described here recognize some capacity value for variable renewable resources (wind solar and run-of-river hydro) either through a deemed on-peak capacity factor or a demonstration of claimed capacity for specified on-peak periods Policymakers need to pay attention to how these values are established so they can be confident the committed capacity will be available when called on while at the same time encouraging participation of all low-carbon resources in the market More generally as renewable resources become a more significant part of the resource mix a forward capacity market creates the opportunity to recognize their aggregate capacity value to the system46
44 For example PJM recently released figures on carbon emissions of generating units that operate on the margin during on-peak vs off-peak hours See httpwwwpjmcom~mediaabout-pjmnewsroom2010-releases20100325-pjm-reports-new-carbon-dioxide-emissions-dataashx and httpwwwpjmcomdocuments~mediadocumentsreportsco2-emissions-reportashx
45 See section 316 and Mechanism E in Attachment 1 of Pacific Northwest National Laboratory The Smart Grid An Estimate of the Energy and CO2 Benefits January 2010 (PNNL 19112) at httpenergyenvironmentpnlgovnewspdfPNNL-19112_Revision_1_Finalpdf
46 Variable renewable resources will qualify for higher capacity value if they are bundled with other resources for reliability (eg demand response hydroelectric dams or energy storage) In addition confidence in the capacity value of variable resources increases as their geographic diversity on the system increases See for example the report on the Eastern Wind Integration and Transmission Study at httpwwwnrelgovwindsystemsintegrationpdfs2010ewits_final_reportpdf
RegulatoRy assistance PRoject
20
bull Nonetheless renewable resources are hard-pressed to successfully compete with the thousands of megawatts of existing and new fossil-fuel resources participating in these auctions that are able to bid below the true societal cost of their operations under current market rules In fact capacity auctions as currently designed can breathe new economic life into high carbon-emitting plants that were previously planned for significantly reduced operations or retirement Along with new capacity from fossil-fuel generation allowing such a large amount of existing capacity from high carbon emitters to clear the auction is likely to crowd out renewable resources that are able to address resource adequacy requirements equally well Such results may not represent an ldquoefficientrdquo (or desirable) outcome for a carbon-constrained power sector This is especially true where the carbon costs of a fossil-fuel plant are not fully recognized in the energy market that plant also will be bidding into
The Electric Power Research Institute modeled the effect of various levels of carbon taxes or allowance prices in the upper Midwest (coal-dependent) and in Texas (heavily reliant on natural gas) The study found that close to a doubling of the wholesale prices of electricity in the Midwest region (through carbon-related charges) would produce only a 4 percent reduction in regional emissions given the current generation mix Similar results were observed for Texas where natural gas plants are on the margin49 And in the Northeastern US due to initially low carbon prices and a host of factors that dampen the price signal the Regional Greenhouse Gas Initiative (RGGI) has not yet resulted in generator operational changes50 One of those dampening factors is the single clearing price that is typically set through wholesale energy markets mdash which dilutes the market signal sent by a price on carbon emissions by allowing fossil-fueled plants to recover
most or all of their allowance costs through higher clearing prices reflecting the cost of allowances51
Studies also have shown that the price of carbon must rise (and be maintained) at very high levels to obtain sufficient market pull for the level of new investments in clean generation required For example a recent analysis in California concluded that it would take a carbon price of $100 per tonne52 to make economic investments in renewable resources compared to fossil fuel-fired generation in order to reach carbon reduction targets in the power sector beyond what current state requirements will achieve53 Further price signals may be diluted if a portion of the carbon allowances are allocated in a manner that shields high-emitting power plants from carbon costs or if high-emitters located outside the capped region can sell into the market on a long-term basis
Carbon Pricing Alone Is Insufficient to De-carbonize the Generation Mix
bull A market price for capacity or energy that favors the construction and operation of high carbon-emitting resources over clean resources will lead to increases mdash rather than reductions mdash in the cumulative level of carbon emissions in the power sector A carbon tax or carbon cap-and-trade regime internalizes some or all of the otherwise un-priced carbon costs of electricity production and would improve the relative economics of clean resources in both forward capacity and energy markets However carbon pricing alone may be insufficient to change the dispatch of existing high-emitting power plants or their ability to clear these capacity markets (and be paid additional revenues as a result) in such overwhelming numbers47 In fact the very modest impact of carbon pricing on the performance of fossil-fuel plants has been documented in several reports48 (See text box below)
47 With or without carbon prices policymakers also might want to consider the implications of paying existing power plants the market clearing price for capacity mdash and the potential windfall profits for plant owners mdash for making no changes in plant operations See for example Ezra Hausman Paul Peterson David White and Bruce Biewald Synapse Energy Economics Inc RPM 2006 Windfall Profits for Existing Base Load Units in PJM An Update of Two Case Studies Feb 2 2006 at wwwsynapse-energycom
21
the Role of foRwaRd caPacity MaRkets in incReasing deMand-side and otheR low-caRbon ResouRces
bull Carbon pricing alone will have limited impact on consumer decisions to invest in permanently reducing their peak demand by making cost-effective investments in energy efficiency Well-designed time-varying pricing options can successfully shift demand from high-price hours to lower price hours54 Such shifting also reduces peak demand on transmission and distribution systems Overall energy use will decline somewhat in response to price But long-term reduction in energy use due to price increases is relatively small The numerous market barriers to capturing the full cost-effective potential of energy efficiency ndash through improvements in building construction practices and industrial processes retrofits of existing buildings and installations of high-efficiency appliances and equipment in homes and businesses ndash are well-documented They include lack of information high first-costs consumersrsquo high discount rates and the landlord-tenant split incentive problem among others55 Recent empirical analysis of demand elasticities suggests that the long-term price elasticity of demand for electricity is even lower than earlier studies have indicated for both liberalized and regulated markets (See text box on page 21)
In sum while forward capacity markets are meeting their resource adequacy objectives and clearing an impressive amount of clean low cost demand-side resources on balance these markets (as currently designed) are not working sufficiently in concert with carbon reduction goals and policies in the face of growing carbon constraints For the reasons discussed above carbon pricing alone
48 See Testimony of Richard Cowart Regulatory Assistance Project Before the Committee on Energy and Commerce Subcommittee on Energy and Environment US House of Representatives April 23 2009 ldquoThe Consumer Allocation for Efficiency How Allowance Allocations Can Protect Consumers Mobilize Efficiency and Contain the Costs of GHG Reductionrdquo at httpenergycommercehousegovPress_11120090423testimony_cowartpdf
49 See Victor Niemeyer ldquoThe Change in Profit Climate How Will Carbon-Emissions Policies Affect the Generation Fleetrdquo Public Utilities Fortnightly May 2007 at 20 24
50 See ldquoRGGI marks its first year with success and lesson on effect of market pressurerdquo Electric Utility Week Dec 14 2009 Ten Northeast and Mid-Atlantic states participate in RGGI the first mandatory cap-and-trade program in the US Connecticut Delaware Maine Maryland Massachusetts New Hampshire New Jersey New York Rhode Island and Vermont Nine of them participate in either the ISO-NE or PJM forward capacity markets described in this paper
51 PJM Interconnection ldquoPotential Effects of Proposed Climate Change Policies on PJMrsquos Energy Marketrdquo Jan 23 2009 p 5 See also ldquoBecause Thatrsquos Where the Money Is The FERCrsquos Ability to Reduce the Cost of Slowing Global Warmingrdquo Samuel A Wolfe Chief Counsel New Jersey Board of Public Utilities December 2009 at httpwwwnarucorgpublicationsWOLFE-20Panel203pdf
Demand for Power Is Relatively Price-Insensitive mdash Even Over the Long Term
Modeling by the US Department of Energy suggests that a 10 percent increase in power prices will reduce demand for electricity by just 25 percent to 3 percent over 20 years assuming that the price effects persist over that entire period56 This would only offset the normally expected US load growth in two out of those 20 years57
More recently a 2009 empirical analysis of the demand for electricity in the US concludes that price elasticity of residential demand has actually decreased since retail price deregulation was first introduced in the US The results suggest that a 10 percent increase in power prices will reduce residential electricity demand more on the order of 12 percent to 17 percent based on 2001-2008 data for both deregulated and regulated states58 Price responsiveness is further dampened by the income-elasticity of demand which is positively correlated with consumption As incomes increase consumption of electricity goes up and the conservation impact of any price increase is diminished59 The equivalent historical figure for a 10 percent increase in power prices in the UK residential sector is -23 percent but the income-elasticity is such that a 10 percent increase in income results in an increase of demand of 34 percent ndash ie household income is just as important as energy price in determining energy demand60
RegulatoRy assistance PRoject
22
is unlikely to shift the power sector resource mix at the pace or scale required to meet aggressive carbon reduction targets ndash or correspondingly to substantially change the dominance of high-carbon resources clearing forward capacity auctions under current market rules An increasing number of studies makes a compelling case that our economy and our society cannot afford this dominance to persist much longer if we are to contain climate change to a livable level In fact close to full de-carbonization of the
power sector is being discussed in international forums as the only way to meet essential carbon reduction targets by 205061 While capacity markets alone are unlikely to support the full value of clean energy resources in a carbon-constrained power sector by themselves with appropriate design elements they can serve to reinforce actions taken at federal regional and state levels that provide larger and longer lasting commitments to clean demand-side and renewable resources62
52 A tonne or metric ton is a unit of mass equal to 1000 kilograms (roughly 2205 pounds) or approximately the mass of one cubic meter of water at four degrees Celsius A tonne is not the same as either a ldquoshortrdquo ton (2000 pounds) or a ldquolongrdquo ton (2240 pounds)
53 Energy and Environmental Economics Inc Greenhouse Gas Modeling of Californiarsquos Electricity Sector to 2020 Updated Results of the GHG Calculator Version 3 prepared for the California Public Utilities Commission October 2009 pp 66-67 at httpwwwethreecomdocumentsGHG_102209CPUC_GHG_Final_Report_28Oct09pdf
54 Ahmad Faruqui and Sanem Sergici The Brattle Group ldquoHousehold Response to Dynamic Pricing of Electricity A Survey of the Experimental Evidencerdquo Jan 10 2009 at httpwwwhksharvardeduhepgPapers2009The20Power20of20Experimentation20_01-11-09_pdf
55 See for example American Council for an Energy Efficient Economy ldquoQuantifying the Effects of Market Failures in the End-Use of Energyrdquo pp iii-vi 2007 at httpoldaceeeorgenergyIEAmarketbarrierspdf This study details the various types of market barriers to end-use energy efficiency and reports that up to 50 percent of residential energy use in the US is affected by such barriers
56 The US Department of Energyrsquos National Energy Modeling System (NEMS) has price elasticity built into it The long-run elasticity (assuming price effects remain for 20 years) are ndash031 for residential electric use and ndash025 for commercial electric use See Steven H Wade ldquoPrice Responsiveness in the NEMS Buildings Sector Modelrdquo in Energy Information Administrationrsquos Issues in Midterm Analysis and Forecasting 1999 pp 55 58 table 1 at httpwwweiadoegovoiafissuespdf060799pdf
57 This would require a much larger rate increase just to offset expected load growth over 20 years let alone to reduce demand sufficiently to permit absolute reductions in emissions from the nationrsquos huge generation fleet See Testimony of Richard Cowart
58 T Nakajima and S Hamori ldquoChange in Consumer Sensitivity to Electricity Prices in Response to Retail Deregulation A Panel Empirical Analysis of the Residential Demand for Electricity in the United Statesrdquo Energy Policy (2010) available at wwwsciencedirectcom
59 Ibid
60 John Dimitropoulas Lester C Hunt and Gary Judge ldquoEstimating Underlying Energy Demand Trends Using UK Annual Datardquo at httpuserwebportacuk~judgegAEL_04pdf
61 See for example Meeting Carbon Budgets ndash The Need for a Step Change Progress Report to Parliament Committee on Climate Change October 2009 at httpwwwthecccorgukreportsprogressreports Christopher Jones and Jean-Michel Glachant Why and How the European Union Can Get a (Near to) Carbon-Free Energy System in 2050 MIT Center for Energy and Environmental Policy March 2010 at httpdownloadsthecccorgukdocs2166720CCC20Executive20Summary20AW20v4pdf Roadmap 2050 A practical guide to a prosperous low-carbon Europe The European Climate Foundation April 2010 at wwwroadmap2050eu
62 Without such policies it is unlikely that even RGGIrsquos modest carbon reduction goals will be achieved See Paul Peterson Doug Hurley and David White Synapse Energy Economics Inc ISO New England Scenario Analysis Companion Report Constructing a Future That Meets Regional Goals Aug 8 2007 at wwwsynapse-energycom
23
the Role of foRwaRd caPacity MaRkets in incReasing deMand-side and otheR low-caRbon ResouRces
ISO-NE Rules for Emergency Generators Advance Environmental Goals
Emergency (ldquobackuprdquo) generators typically are diesel-fired and states in New England and elsewhere in the US have restricted the number of hours and days they may be operated through the state permitting process At the time the first regional demand response tariffs were being designed in New England a collaborative of energy regulators environmental regulators the ISO utilities and other stakeholders realized that active demand response programs could lead to substantial incentives for diesel-fired backup generators to operate more often when air quality was at its worst Regulators and the ISO proposed a rule limiting those generators to run for reliability purposes during system emergencies This is a concrete example of reliability rules being written to advance environmental goals as well as power system needs63 In addition a regional working group developed model emissions standards for small generators for statesrsquo consideration64
To reinforce regional air quality policies and goals ISO-NE limits the total amount of emergency generators in the regional capacity market to 600 MW To the extent any excess amount clears the auction capacity payments to these resources are pro-rated
63 See Cowart and Raab p 26
64 See Model Regulations for the Output of Specified Air Emissions From Smaller Scale Electric Generation Resources Oct 31 2002 at httpwwwraponlineorgshowpdfaspPDF_URL=22docsrap_issuesletter-outputbasedemissioninsert_2003_07pdf22
65 Edward S Rubin Carnegie Mellon University ldquoA Performance Standards Approach to Reducing CO2 Emissions for Electric Power Plantsrdquo June 2009 at httpwwwpewclimateorgpublicationsreportcoal-initiative-series-performance-standards-approach-reducing-co2-emissions-ele Also see Chris Simpson and Brenda Hausauer ldquoEmissions Performance Standards in Selected Statesrdquo Regulatory Assistance Project Research Brief November 2009 at httpwwwraponlineorgdocsRAP_Simpson_EPSResearchBrief_2009_11_13pdf
Policy Recommendations and Auction Design Options
We present below recommendations and a menu of auction design options for forward capacity markets that support and enhance carbon policies and carbon reduction targets
bull Power market rules should be constructed to recognize and limit the adverse environmental consequences of power generation The power system and the environment are inextricably linked Explicit consideration of environmental costs and benefits of various electricity resources is not only reasonable but necessary to meet the enormous challenge of climate change
bull Forward capacity markets should reinforce carbon reduction policies which could be accomplished by incorporating one or more of the following into the auction rules
Auction rules could apply an Emissions Performance Standard (EPS) to promote capacity commitments from low-carbon resources and discourage bids from high-emitting power plants An EPS can be expressed as a maximum level of greenhouse gas emissions per unit of electrical output or as a percentage reduction in (annual) plant emissions It can vary with fuel type and incorporate other design variations65 It may be appropriate to adopt an EPS mdash within the auction qualification rules or by regulation mdash particularly if current market signals are not sufficiently
discouraging new construction or repowering of high-emitting generating resources with long lifetimes while forward capacity markets are providing a new revenue stream to keep them running
RegulatoRy assistance PRoject
24
Auction rules could disqualify inefficient generators from participating (and from receiving capacity revenue) or more generally require their retirement through financial incentives regulations or both66 Since 2007 China has been phasing out such plants and intends to retire approximately 50 gigawatts (GW) of small inefficient coal-fired power plants nationwide and 7 GW to 10 GW of small natural gas-fired units as well as halt construction of small inefficient power plants The policy is being put in place three ways the direct rescission of operating permits the transfer of generation rights and price reductions
Capacity payments could vary by the emissions rate of the resource Instead of one price paid to all generation that clears the auction adders could be applied to payments for low-emitting units and deductions could be applied to high-emitting units67 For example a sliding-scale percentage reduction to the per-unit ($kW-month or $MW-day) clearing price could be established based on the average annualized carbon footprint of fossil-fuel resources whereas a price adder above the clearing price could be established for zero-emitting resources
Imputed ldquocarbon addersrdquo could help curtail high-emitting resources Carbon adders are imputed costs that reflect at least a portion of the societal cost of emissions They are generally
used in the context of resource planning and acquisition by a regulated LSE mdash as a way of ensuring that high-carbon risks and low-carbon alternatives are properly valued in the resource selection process But these imputed costs do not get passed on to ratepayers or consumers for every unit of power consumed in contrast to carbon pricing68 Similarly the rules in a forward capacity market could be modified so that carbon adders are applied in determining what resources clear the auction (and will receive the market clearing price for their capacity commitment)
A ldquozero-carbon resource portfolio standardrdquo could establish auctions for separate tranches of resources by emissions level For example one tranche could include energy efficiency and renewable resources The size of each tranche would be based on carbon reduction goals for the region The higher the goals the larger the tranche for energy efficiency and renewable resources These resources decrease carbon emissions because at the margin most power systems are running higher carbon resources
bull Policymakers should consider a longer price commitment in forward capacity markets mdash at least for low-carbon resources The contract period for new capacity in these markets is short (one year in PJM up to five years in ISO-NE) in part so there is greater certainty over forecasts of resource needs for system reliability (to mitigate the risk of over-supply)
66 Small and old coal plants are the most inefficient and polluting both in terms of greenhouse gases and particulate matter By some estimates 50 MW plants may use as much as 200 grams more per unit of electricity output than a plant larger than 300 MW See Frederick Weston Rebecca A Schultz David Moskovitz and Max Dupuy Regulatory Assistance Project ldquoChinarsquos Climate Change Initiatives Do new policies adopted in China offer any guidance for the transformation of the US power sector in a carbon-constrained worldrdquo November 2009 at httpwwwraponlineorgdocsRAP_China20Climate20Initiatives_NARUC_2009_11_01docx
67 See N Jonathan Peress and Kenneth A Colburn ldquoElectrical Connections Aligning Capacity Market Changes With RGGI in the Northeastrdquo Discussion Draft March 2005 at httpwwwpucnhgovEPABSymbiotic202005-03-1820Peress-Colburn20Letter20to20FERC-Woodpdf
68 Both high carbon resources and low carbon resources clearing in power markets (characterized by single-price auctions) are paid the same price So whenever fossil resources are on the margin (most of the time in most places) consumers are seeing the same price for both fossil and clean resources and the cost of carbon allowances (or carbon taxes) for that marginal resource is reflected in the clearing price for all power bought in the market Carbon adders on the other hand are not actually paid to any resource or reflected in prices for all units sold in the market
25
the Role of foRwaRd caPacity MaRkets in incReasing deMand-side and otheR low-caRbon ResouRces
Auction winners can generally participate in future auctions and receive the market clearing price but have no assurance of future prices Moreover under current rules in PJM energy efficiency resources cannot receive capacity payments over the full life of the measures mdash only for four consecutive delivery years This constraint puts energy efficiency on a different footing than other demand resources mdash as well as all supply-side resources mdash which are paid for their capacity as long as they provide the benefit
The short commitment period and lack of price certainty may not provide market signals that are strong and consistent enough to ensure sufficient new generation or encourage plant operators and investors to make efficient choices for the long-term mdash even where carbon prices are expected to increase substantially in the future due to a dramatically declining carbon cap or a high carbon tax Allowing clean resources to opt for a longer period of time over which the price is known would in particular facilitate renewable resources whose typically high upfront capital costs and low operating costs mdash compared to natural gas-fired plants in particular mdash may require such a long-term commitment to procure financing69 Another option might be to establish fixed floor prices for clean energy resources for a long-term period to provide assurance of a minimum revenue stream
bull Regional load forecasting should be reviewed for treatment of demand-side resources acquired outside the capacity market In particular the system operator determines the capacity that will be auctioned for each delivery year (three years hence) based on a 10-year load forecast which is updated on
an annual basis Under the current planning process in forward capacity markets this forecast only reflects the demand-side resources that have cleared in prior auctions The system operatorrsquos load projections do not take into consideration any load reductions from demand-side resources procured outside of the auction such as energy efficiency programs that LSEs have committed (or are obligated) to fund and implement in the coming one to three years or beyond70 If the magnitude of these load reductions is substantial the ISO may be systematically overstating the level of capacity put out to bid for each delivery year Depending upon the existing mix of resources and market conditions in the region this overstatement may have a sizeable impact not only on the level of cleared capacity and the market price but on the resulting resource mix and level of carbon emissions as well
Additional Actions
Careful design of the planning process and auctions undertaken through forward capacity markets can help to ensure that they reinforce and do not work at cross purposes with climate reduction goals and targets However forward capacity market signals (capacity prices) are only one component of a market and regulatory landscape that affects investment and operating decisions in the power sector Market rules and procurement policies that affect system energy requirements ndash as well as policies and regulations that affect access location and cost recovery for transmission and distribution facilities ndash have an enormous impact on both the short- and long-term resource mix
It is beyond the scope of this paper to fully explore how
69 LSEs in PJM and ISO-NE can contract for generating resources through the bilateral market to hedge energy and capacity costs and to meet renewable energy standards Renewable resource projects that successfully negotiate such contracts if they are long term may not need a long-term commitment in the forward capacity market Still a short-term capacity payment stream with uncertain prices thereafter weakens the ability of renewable resources to secure long-term financing
70 Some of the econometric models that the system operators use for their load forecasts may capture the impacts of federal appliance standards and building codes However to our knowledge there has been no explicit accounting to date for the impacts of state and utility energy efficiency programs where the capacity is not bid into the auctions
RegulatoRy assistance PRoject
26
market rules and other policies and regulations can be harmonized and strengthened to meet customersrsquo energy needs reliably in a carbon-constrained world Larger and longer lasting commitments to demand-side and renewable resources are certainly needed to ensure a mix of resources that will significantly reduce greenhouse gas emissions in the power sector This has been the conclusion of US policymakers who have put in place additional policies to facilitate long-term acquisition of low-carbon resources in regions that operate both forward capacity markets and a cap-and-trade program (under RGGI)71
bull States have adopted a variety of mechanisms for sustained and aggressive energy efficiency programs
bull Strong building codes and equipment standards
bull Stable funding through a system benefit charge
bull Third-party administration of programs or where the utility is the efficiency portfolio manager decoupling of utility profits from revenues financial incentives for shareholders or both
bull Recycling of carbon auction proceeds into energy efficiency investments
bull Some states require long-term resource plans or resource procurement plans that must include energy efficiency Therersquos renewed interest in long-term planning and procurement particularly for demand-side and renewable resources following a period
where these efforts were largely abandoned with electric industry restructuring and development of organized markets72
bull Several states have adopted energy efficiency resource standards that require achievement of specified energy-saving targets73
bull Most of the states have renewable energy standards74 and several states require long-term contracting of renewable resources to meet the standards75
bull Connecticut Maryland Pennsylvania and Rhode Island require contract terms of 10 years or longer
bull New York requires central procurement of renewable energy credits by a state agency under long-term contract Illinois is likely to acquire long-term contracts for renewable resources under its central procurement mandate
bull Massachusettsrsquo Green Power Partnership purchases renewable energy credits for up to 10 years using its renewable energy fund
These are just examples and certainly not an exhaustive list of the ways in which careful design of forward capacity markets coupled with additional policies at the federal regional and state level can serve to reinforce both resource adequacy requirements and carbon reduction goals
71 Regulatory Assistance Project policy grids summarize state-by-state requirements for resource planning and energy efficiency at httpwwwraponlineorgFeatureaspselect=116 For a summary of renewable energy standards in the US see Ryan Wiser and Galen Barbose Lawrence Berkeley National Laboratory ldquoState of the States Update on RPS Policies and Progressrdquo State-Federal RPS Collaborative Nov 18 2009 at httpwwwcleanenergystatesorgMeetingsRPS_Summit_09WISER_RPS_Summit2009pdf
72 More broadly 30 states nationwide require integrated resource plans or resource procurement plans that include energy efficiency
73 Includes states with strict energy efficiency standards states with Commission-ordered efficiency targets states that allow efficiency to count toward renewable energy standards and states with a rate cap that triggers a relaxation of requirements See Laura A Furrey Steven Nadel and John A ldquoSkiprdquo Laitner ACEEE Laying the Foundation for Implementing a Federal Energy Efficiency Resource Standard March 2009 at httpaceeeorgpubse091htm
74 Some 29 US states and the District of Columbia have renewable energy standards five other states have non-binding goals See Wiser and Barbose
75 For a US database of state incentives for renewable energy and energy efficiency see httpwwwdsireusaorg
27
the Role of foRwaRd caPacity MaRkets in incReasing deMand-side and otheR low-caRbon ResouRces
An example of an approach that attempts to ldquomarryrdquo integrated least-cost resource planning with forward capacity markets is the resource planning and procurement process recently established by the Connecticut Legislature76 The law requires the utilities Energy Advisory Board and Department of Public Utility Control to plan for current and future energy and capacity needs and provide a mechanism for procuring resources that meet specified economic reliability and environmental objectives77 to satisfy the identified need Further the law requires that resource needs first be met through energy efficiency and demand reduction resources that are cost effective reliable and feasible Based on the resulting resource plans LSEs enter into
contracts to acquire the required capacity (level and mix) through a competitive bidding process The law also requires that any resources winning contracts for capacity agree to let the LSE bid that capacity into the forward capacity auction as a ldquoself-suppliedrdquo resource This approach permits LSEs to determine both the quantity and mix of resources through integrated resource planning that will meet their resource adequacy requirements and state policy goals (eg carbon reduction) The LSE pays the contracted capacity price (under its bilateral contracts) instead of paying the auction clearing price to everyone that offers capacity into the forward capacity market (eg existing fossil fuel or nuclear plants)78
Connecticutrsquos Marriage of Resource Planning and Markets
76 Conn Gen Stat sectsect 16a-3a 16a-3b and 16a-3c
77 Costs and benefits cost-effectiveness cost impacts on customers the extent to which load growth can be eliminated and peak demand reduced reliability including energy security and economic risks impacts on meeting state environmental standards including emissions goals optimization of existing generation and generation sites the extent to which renewable resources can be used to meet needs and fuel types diversity and supply See Department of Public Utility Control Final Order in Docket No 08-07-01 Feb 18 2009
78 This approach is not without some controversy A contracted new resource in Connecticut has the potential to displace an alternative ldquocompetitiverdquo new resource in the region that would have bid at a higher price mdash had Connecticut not been allowed to designate the contract as self-supply ISO-NErsquos Internal Market Monitoring Unit has commented on this issue in a report to FERC See Internal Market Monitoring Unit ISO-NE June 5 2009
RegulatoRy assistance PRoject
28
Conclusions and Recommendations
Auction-based capacity markets in the US have been successful to date in attracting the capacity needed to maintain system reliability in an economically efficient manner In particular these markets have been successful in facilitating new demand-side resources
with ratepayers and society reaping the economic and environmental benefits However policymakers also should consider capacity markets in the context of carbon reduction policies and targets for the power sector Even markets that successfully integrate demand-side and renewable resources into the auction process are still encouraging the construction or continued operation of high-emitting supply-side resources to meet reliability targets
Existing capacity markets should be evaluated to assess whether the market is responding in this way And if it is policymakers need to critically assess whether a continuation of that market response over the coming years will make it possible to achieve the cumulative level of carbon reductions required from the power sector to avoid the worst effects of climate change Depending on the results of this inquiry policymakers may need to refine the auction rules and adopt additional policies for the power sector mdash such as those described in this paper mdash to ensure the alignment of capacity markets with both short- and long-term carbon reduction goals
More generally forward capacity markets create a revenue stream for resources that can commit to being available at times of system peak several years in the future mdash but this financial incentive is clearly not the only factor driving the mix of resources in the power sector and their resulting carbon footprint Market rules policies and regulations that affect investment and operating decisions for meeting the systemrsquos energy requirements mdash as well as those that affect access location and cost recovery for transmission and distribution facilities mdash have an enormous impact on both the short- and long-term resource mix in the electric system Policymakers will need to consider how this entire market and regulatory landscape mdash including forward capacity markets mdash can be strengthened and harmonized to reliably meet customer demand for electricity in a carbon-constrained world
29
the Role of foRwaRd caPacity MaRkets in incReasing deMand-side and otheR low-caRbon ResouRces
Cleared capacity values in the following tables represent all capacity committed by existing resources remaining in the market and all new resources that bid into the auction at or below
the market clearing price Cleared capacity includes ldquoself-suppliedrdquo or ldquoself-scheduledrdquo resources entered into the auction by LSEs However as described in this paper when the monthly billingsettlement process is completed the capacity charges allocated to the LSE will be offset (credited) for the cleared capacity delivered by these resources
Incremental capacity in the tables below reflects 1) new generation resources 2) capacity upgrades to existing generation resources 3) partial offsets to
incremental generation capacity due to capacity de-ratings to existing generation resources 4) new demand response resources 5) upgrades to existing demand response resources and 6) new energy efficiency resources
PJM Results79
PJM has conducted five Base Residual Auctions since its inception in 2007 for delivery years beginning in 20082009 (that each run from June 1 to May 31) Capacity cleared in the PJM auction is defined in terms of ldquounforcedrdquo capacity that is the capacity of a resource adjusted for availability and deliverability based on historical performance (eg forced outages)
Appendix 1
Detailed Results for PJM and ISO-NE Capacity Markets
Table 1 Generation Demand Resources and Energy Efficiency Resources
Offered and Cleared in PJM Base Residual Auctions (Unforced Capacity in MW)
Delivery Year 20082009 20092010 20102011 20112012 20122013
Generation Offered 1311648 1326142 1321248 1360679 1348730
DR Offered 7158 9368 9679 16524 98476
EE Offered - - - - 6527
Total Offered 1318806 1335510 1330927 1377203 1453733
Generation Cleared 1290614 1313389 1312515 1308566 1285274
DR Cleared 5362 8929 9390 13649 70473
EE Cleared 00 00 00 00 5689
Total Cleared 1295976 1322318 1321905 1322215 1361436
Energy efficiency resources were first eligible in the 20122013 auction
79 All information for PJM compiled from ldquo20122013 RPM Base Residual Auction Resultsrdquo at httpwwwpjmcom~mediamarkets-opsrpmrpm-auction-info2012-13-base-residual-auction-report-document-pdfashx
RegulatoRy assistance PRoject
30
Table 2 Incremental Capacity Additions and Reductions in PJM Base Residual Auctions(Installed Capacity in MW)
Delivery Year 20072008 20082009 20092010 20102011 20112012 20122013 Total
Increase inGenerationCapacity 6020 7242 12723 17762 35763 18935 98445
Decrease inGenerationCapacity -6746 -3754 -5502 -3018 -2647 -32539 -54206
Net Increase inDemand ResourceCapacity 5550 5747 2150 287 6617 79381 99732
Net Increasein EnergyEfficiency Capacity 0 0 0 0 0 6323 6323
Net Increasein InstalledCapacity 4824 9235 9371 15031 39733 72100 150294
Note Change in generation capacity is cumulative net increase in demand-side resources is relative to previous yearrsquos Base Residual Auction
Table 3 Breakdown of Incremental Capacity Resource Additionsin PJM Base Residual Auctions (Installed Capacity in MW)
Delivery Year CTGT Combined Diesel Hydro Steam Nuclear Solar Wind Total Cycle (Coal)
New 20072008 187 03 190Capacity 20082009 270 661 931Units 20092010 3995 238 530 4763 20102011 2833 5800 230 1414 10277 20112012 4164 11350 7048 11 752 23325 20122013 4038 5850 78 363 751 11080
Capacity 20072008 470 470From 20082009 1310 1310Reactivated 20092010 0Units 20102011 1600 107 1707 20112012 800 1010 1810 20122013 0
Uprates to 20072008 1145 139 800 2356 920 5360Existing 20082009 1082 340 180 1055 1960 384 5001Capacity 20092010 1522 2060 1625 614 1974 165 7960Resources 20102011 1173 1630 480 892 1603 5778 20112012 3692 1486 574 1868 2921 87 10628 20122013 2312 1643 142 1930 1260 568 7855
Total 28356 30159 2145 3963 20351 9062 11 4398 98445
Note Values represent capacity commitments Nameplate ratings of variable resources (solar and wind) are far larger than shown here
31
the Role of foRwaRd caPacity MaRkets in incReasing deMand-side and otheR low-caRbon ResouRces
Table 4 Changes to Generation Retirement Decisions
Since Reliability Pricing Model Approval (Unforced Capacity in MW)
Generation Resource Decision Changes Capacity Cleared
Withdrawn Deactivation Requests 17987
Postponed or Cancelled Retirement 13029
Reactivation 1752
ToTal 3276 8
Note Unforced capacity cleared in Base Residual Auctions from resources that withdrew their request to deactivate postponed retirement or were reactivated (ie came out of retirement or mothball state)
Table 5 PJM Base Residual Auction Clearing Price
Delivery Year Clearing Prices ($MW-day)
20072008 $4080
20082009 $11192
20092010 $10204
20102011 $17429
20112012 $11000
20122013 $1646
Note Values do not include any locational price adders Simple conversion of $MW-day to $kW-month multiply by 3 and divide by 100
Table 6 Effect of Demand-Side Resources on PJM Market Clearing Price
20122013 Base Residual Auction80
Actual Auction Results Calculated Results Without Demand-Side Resources
Clearing Prices Cleared Unforced Clearing Prices Cleared Unforced Savings
($MW-day) Capacity (MW) ($MW-day) Capacity (MW) ($MW-day)
$1646 1361435 $17878 1335682 $16232
80 Bowring Monitoring Analytics Table 20
RegulatoRy assistance PRoject
32
ISO-NE ResultsISO-NE has held three forward capacity auctions to
date The first auction (FCA 1) in February 2008 was for capacity delivery beginning in June 2010 (20102011 delivery year) The second auction (FCA 2) was held in December 2008 for delivery in 20112012 and the third
Table 7 Summary Results for ISO-NE Capacity Auctions81
Net Installed Total Resources Excess Clearing Net Price Capacity Cleared Capacity Price ($kW-month)82
Requirement (MW) (MW) ($kW-month)
FCA 1 32305 34077 1772 $450 $425
FCA 2 32528 37283 4755 $360 $312
FCA 3 31965 36996 4649 $295 $254
Table 8 Demand-Side Resources Cleared in ISO-NE Capacity Auctions (MW)81
Distributed Distributed Energy Real-Time Demand Real-Time Total Generation- Generation- Efficiency ResponseLoad Emergency Demand-Side Fossil Fuels Renewable Resources Management Generation Resources
FCA 1 46 lt02 655 978 875 2554
FCA 2 93 lt02 890 1195 759 2937
FCA 3 86 07 975 1206 630 2898
auction (FCA 3) was held in October 2009 for delivery in 20122013 ldquoClearedrdquo amounts in these tables include resources from earlier auctions that remain listed as well as new resources less resources that drop out
Note Net Installed Capacity Requirement values exclude the interconnection benefits associated with the Hydro-Queacutebec Phase III interface Excess capacity is not adjusted for Real-Time Emergency Generation in excess of the 600 MW limit Net prices reflect prorating of clearing prices due to excess capacity clearing the auction Simple conversion of $kW-month to $MW-day divide by 3 and multiply by 100
Note Demand-side values are grossed-up for avoided transmission and distribution losses and reserve margin (no reserve margin forFCA 3) Total resources cleared include excess capacity above the Net Installed Capacity Requirement Real-time emergency generation refers to distributed generation whose state air quality permit limits operation to ldquoemergencyrdquo conditions See Appendix 3
81 ISO-NE Forward Capacity Market Results at httpwwwiso-necommarketsothrmkts_datafcmcal_resultsindexhtml
82 Communication with Henry Yoshimura director Demand Resource Strategy ISO-NE March 2009
83 Eric Winkler ISO-New England ldquoThird Regional Energy Efficiency Initiative Meetingrdquo July 7 2009 and ldquoFCA Updaterdquo Demand Response Working Group Meeting Dec 2 2009 Total resources cleared (Capacity Supply Obligation) from Forward Capacity Market Auction Results for the 20102011 20112012 and 20122013 auctions at httpwwwiso-necommarketsothrmkts_datafcmcal_resultsindexhtml
33
the Role of foRwaRd caPacity MaRkets in incReasing deMand-side and otheR low-caRbon ResouRces
Step 1
System Operator (SO) Plans ldquoForwardrdquo for the Region
2012 Projection of Peak Demand = 10000 MW (incl reserves) Each ldquoLoad Serving Entityrdquo (LSE) is obligated for its 50 share
Appendix 2
Illustration of ldquoHow Forward Capacity Markets Workrdquo
SO purchases capacity in 2012 at the 2009 auction clearing price
LSE can be regulated utility or competitive retail supplier
LSE1 5000 MW
LSE2 5000 MW
R1
R1 =3500 MW capacity ldquoSelf Supplyrdquo Resources (LSE1 ownedunder contract)
RegulatoRy assistance PRoject
34
Step 2
The Regional Capacity Auction (3 Years ldquoForwardrdquo)
Step 3
System Operator Pays Cleared Resources at P and Bills LSEs(Note Self-Supply capacity is a ldquowashrdquo)
R1 R2 R3 R4 R5 R6 R7
P
R1
R3
R3
R5
R5
R2
R2
R4
R4
R6
R7
Bid Price = $ per MW-day
Quantity = MW
6500 MW P
Cleared Capacity = 10000
Supply = Capacity Committed ldquoForwardrdquo
P= Clearing price paid to all capacity clearing auction
Demand = SO Forecast of Capacity Requirements
R1-R7 = Capacity offered by Supply-Side (New built Existing Uprates) and Demand-Side (Energy Efficiency Demand Response Distrib Gen) Self-supply (R1) bids in a ldquozerordquo price New Resources set clearing price
LSE1 5000 MW
LSE2 5000 MW
R1
SOSO pays R1 3500 MW P
LSE2 pays its share of regional demand
5000 MW P
LSE1 pays its share of regional demand (5000 MW) adjusted for self-supply R1 for a net payment of 1500MW P
R1 = 3500 MW of ldquoSelf-Supplyrdquo Resources (LSE1 ownedunder contract)
In 2010Total regional peak demand of 10000 MW supplied by R1 + R2 + R3 + R4 + R5 LSE1 and LSE2 are each responsible for 50 of regional peak demand
35
the Role of foRwaRd caPacity MaRkets in incReasing deMand-side and otheR low-caRbon ResouRces
PJM Eligibility Requirements
Eligibility of demand-side resources has changed significantly over the years in PJMrsquos capacity markets In particular it was not until the most recent capacity auction (May 2009) for the
20122013 delivery year that energy efficiency became eligible to bid in PJMrsquos Base Residual Auction PJM is currently considering a tariff change to also allow energy efficiency to bid into incremental auctions
Under PJMrsquos eligibility rules an energy efficiency resource must achieve a ldquopermanentrdquo continuous reduction in electric energy consumption Examples of such a resource include lighting retrofit programs for residential commercial and industrial customers and programs to retrofit buildings with heating and cooling systems that exceed current efficiency standards To be eligible an energy efficiency resource must meet the following criteria
bull It is fully implemented throughout the delivery year without any requirement of notice dispatch or additional customer action
bull It is not reflected as a reduction in the peak load forecast used for the Base Residual Auction for the proposed delivery year
bull It exceeds relevant standards (such as building codes or appliance standards) at the time of commitment
bull It achieves the specified load reduction (expected average demand in MW) during defined summer on-peak hours84
Demand response on the other hand must be dispatchable mdash that is customer demand must be reduced when instructed For example a large supermarket with
coolers and freezers could install load management equipment that would cycle them on or off mdash and bid that demand response capability into the market85 More specifically a demand response resource must meet the following criteria
bull It is able to reduce demand for electricity up to 10 times each year for up to six consecutive hours per interruption during defined periods86
bull It is fully implemented within one hour (short lead time) or two hours (long lead time) of notice from PJM
bull In a year without calls for demand reductions it must demonstrate reliability through a test of reduction capability
bull It is registered in the Emergency Load Response Program and thus available for dispatch during PJM-declared emergency events
bull Compliance and status reports are filed as required
Multiple end-use customers can be aggregated in order to submit a single demand response offer in the capacity auction if those customers share the same curtailment service provider electric distribution company and transmission zone
In addition customer-sited distributed generation may be offered into auctions as a demand resource A hospital for example could offer to run its back-up generator on certain peak demand (eg hot summer) days to reduce its load on the system Or an industrial plant could cut back on production on such days and continue to run its on-site combustion or steam-cycle turbine
Currently energy efficiency resources may participate
Appendix 3
Eligibility Requirements for Demand-Side Resourcesin US Capacity Markets
84 Weekdays excluding holidays June through August between the hours ending 1500 and 1800 Eastern Prevailing Time (EPT)
85 If instead the supermarket replaced the existing coolers and freezers with more energy efficient ones it would bid that proposal in as an energy efficiency resource Or it could do both (replace and cycle) and bid in the capacity from the permanent savings (replacements) as energy efficiency and the dispatchable capacity (the cycling) as demand response
86 Weekdays excluding holidays from 1200 to 2000 EPT May through September and 1400 to 2200 EPT October through April
RegulatoRy assistance PRoject
36
in Base Residual Auctions for up to four consecutive delivery years In effect this means that PJM limits capacity payments for efficiency measures to four years of their measure life (rather than for the full measure life)87 In contrast a demand response resource (including distributed generation) can participate in the PJM capacity market for as long as its ability to reduce demand continues
ISO-NE Eligibility RequirementsSince the inception of ISO-NErsquos forward capacity market
in 2006 energy efficiency has qualified as an eligible demand-side resource ISO-NE defines demand resources as installed measures (products equipment systems services practices and strategies) that result in verifiable reductions in end-use consumption of electricity in the New England power system These are further categorized into ldquopassiverdquo (energy efficiency and non-dispatchable distributed generation) and ldquoactiverdquo (demand response emergency generation and dispatchable distributed generation) resources Passive demand resources are non-dispatchable but permanently reduce energy demand during peak hours Active demand resources are designed to reduce peak loads and to reduce load based on real-time system conditions or ISO-NE instructions Following are descriptions of eligible demand-side resources and performance requirements88
Passive Demand Resourcesbull On-Peak Demand Resources are measures that are
not weather-sensitive and reduce demand across a fixed set of on-peak hours such as energy-efficient commercial lighting and motors89
bull Seasonal Peak Demand Resources are weather-sensitive measures that reduce load during high-demand conditions such as energy-efficient heating and air conditioning systems Seasonal Peak Demand Resources must reduce load when actual system load is equal to 90 percent of the most recent peak load forecast for the applicable summer or winter season
Active Demand Resourcesbull Real-Time Demand Response Resources are
measures including load management and distributed generation that can be dispatched by ISO-NE as needed They must curtail electrical usage within 30 minutes of receiving a dispatch instruction and until receiving a releaserecall dispatch instruction
bull Real-Time Emergency Generation is distributed generation whose state air quality permit limits operation to ldquoemergencyrdquo conditions Generators must curtail the customerrsquos electrical usage within 30 minutes of receiving a dispatch instruction and until receiving a releaserecall dispatch instruction The amount of emergency generation that can be used to meet ISO-NErsquos capacity requirement is limited to 600 MW If the amount of real-time emergency generation that clears the auction exceeds this level payments to generators are reduced on a pro-rated basis All real-time emergency generation is treated as existing capacity
In contrast to PJM all demand-side resources in ISO-NE are eligible to bid capacity for their full measure life an approach that recognizes the full contribution of these resources to regional resource adequacy requirements and adds value to long-lived energy efficiency assets
87 FERC has directed PJM to evaluate the impact of its capacity payment period for energy efficiency resources
88 Eric Winkler and Abimael Santana ISO-NE ldquoNew Demand Resource Qualificationrdquo May 5 2009 at httpwwwiso-necomsupporttrainingcoursesfcmfcm_forum_may_5pdf
89 Summer on-peak hours are 1300 to 1700 non-holiday weekdays in June July and August Winter on-peak hours are 1700 to 1900 non-holiday weekdays in December and January
The Regulatory Assistance Project (RAP) is a global non-profit team of experts that focuses on the long-term economic and environmental sustainability of the power and natural gas sectors providing technical and policy assistance to government officials on a broad range of energy and environmental issues RAP has deep expertise in regulatory and market policies that promote economic efficiency protect the environment ensure system reliability and fairly allocate system benefits among all consumers We have worked extensively in the US since 1992 and in China since 1999 and have assisted governments in nearly every US state and many nations throughout the world RAP is now expanding operations with new programs and offices in Europe and plans to offer similar services in India in 2011 RAP functions as the hub of a network that includes many international experts and is primarily funded by foundations and federal grants
Home office
50 State Street Suite 3Montpelier Vermont 05602
802-223-8199wwwraponlineorg

RegulatoRy assistance PRoject
12
and price floor for the auction The most recent auction for ISO-NE ran seven rounds over two days concluding when the auction reached the floor price of $2951kW-month31
However by rule the load only pays Installed Capacity Requirement times the clearing price so the floor price is further reduced (pro rata) to achieve that effect32 Figure 3 below illustrates the descending clock auction process for ISO-NErsquos first forward capacity market auction
Therersquos another key difference To encourage investment ISO-NE allows new resources to lock in a capacity price for up to five years (with a one-year minimum term)
regardless of clearing prices in subsequent auctions The capacity price is indexed for inflation after the first year and the bidder must select the proposed contract term in advance of the auction Existing resources including existing demand-side resources are eligible only for a one-year price commitment mdash as is the case for PJM
While ISO-NE also permits LSEs to meet their capacity requirements with self-supplied resources (owned resources and resources under bilateral contracts) ISO-NE does not provide an ldquoopt outrdquo alternative as described above for PJM Similar to PJMrsquos ldquoself-scheduledrdquo option the
31 The caps and floors were originally scheduled to be eliminated following the third forward capacity auction However a recent filing by ISO-NE to implement the results of a stakeholder process proposes to continue these mechanisms for the next three auctions For more information on how the descending clock auction functions and how these capsfloors are established see ISO-NE Internal Market Monitoring Unit Review of the Forward Capacity Market Auction Results and Design Elements June 5 2009 at httpwwwiso-necomcommitteescomm_wkgrpsothrfcmwgmtrls2009aug720096-05-09_market_monitor_report_for_fcmpdf
32 With some exceptions resources have the option to pro-rate their cleared MW (rather than take a lower price)
33 Jenkins et al p 178
40000
39000
38000
37000
36000
35000
34000
33000
32000
31000
30000 Start 1 2 3 4 5 6 7 Close
Final Results of ISO-NE FCM Auction 1
$900
Start at $1500
$800 $700$600
$5625
$525 $4875 $450
End-of-round price
Round
Su
pp
ly a
vail
able
(M
W)
at e
nd
of
rou
nd
Final Capacity Needed (ICR)
Figure 3Example of Descending Clock Auction for ISO-NErsquos Forward Capacity Market33
Note Prices are in $USkW-month By rule the load only pays Installed Capacity Requirement times the clearing price so the floor price is further reduced (pro rata) to achieve that effect
13
the Role of foRwaRd caPacity MaRkets in incReasing deMand-side and otheR low-caRbon ResouRces
LSErsquos full capacity obligation (including that portion met through self-supply) is included in the Installed Capacity Requirement put out to bid and the self-supplied resources are also counted towards the resources available to meet that requirement (at a price of zero) in the auction process The net effect for the LSE is also the same The capacity committed as self-supply does not receive any capacity revenue and the LSErsquos capacity obligations satisfied through self-supply are not subject to capacity charges Further the LSErsquos self-supplied resources are subject to applicable penalties and the LSE is subject to capacity charges for any needed residual capacity that the ISO purchases through the auction on its behalf
The penalty provisions in the two regions also differ While both PJM and ISO-NE impose stiff penalty charges if a unit fails to perform when obligated to run ISO-NE also reduces payments to units that are not producing energy at their full capacity level during shortage events mdash similar to the mechanism it uses to reduce capacity payments when prices in the energy market reach very high levels
Role and Eligibility of Demand-Side Resources in FCMs
As discussed above electric systems face a reliability challenge not faced by other commodity markets Because customers are physically interconnected because electricity cannot be meaningfully stored and because electric service is central to economic and social well-being the balance between demand and supply is critical at all times and this balance must be assured over a sustained period of time The FCM design described in this paper recognizes that actions taken on the demand side of the market can effectively moderate price spikes and enhance reliability in a comparable manner as capacity commitments from supply-side generation mdash through short-term customer demand responsiveness during system peak or through permanent and continuous reductions in peak demand (energy efficiency) This market design recognizes that demand-side resources broadly defined to encompass demand response energy efficiency and distributed generation can meet system needs lower costs and add
value to power markets in a variety of circumstances The most important opportunities include34
bull Lowering the cost of power delivery reducing congestion and improving the reliability of the delivery system
bull Enhancing regional power system reliability by using a broad range of demand-side resources to meet planning and operational reserves
bull Economically balancing supply and demand in wholesale power markets through demand-side bidding and market transactions for energy supply released through demand reduction
bull Cost-effectively reducing long-term demand and lowering throughput through energy efficiency resources both on the power grid as a whole and within the resource portfolio of power suppliers
To capture these benefits energy efficiency and demand response (including distributed generation) can now compete on a level playing field with generation in the ISO-NE and PJM forward capacity markets Like generating resources demand-side resources must meet market rules for eligibility and availability including demonstrating they will be available at the start of the proposed delivery year Each type of demand-side resource has a specific set of performance hours across which load reductions are required To be eligible for the auction service providers must demonstrate in advance their ability to perform during those hours Like other resources demand-side resources are subject to penalties if there is a mismatch between their capacity commitment and their performance
Demand-side resources must meet comprehensive standards for measurement and verification (MampV) Failure to comply with MampV protocols makes the resource ineligible for the auction failure to submit post-installation MampV reports results in a final capacity offering of zero for the delivery year plus penalties Generally penalties cannot exceed the revenue that would have been collected if the resource performed as specified in the contract Energy efficiency resources also are audited for compliance Although the capacity obligations and associated penalties for non-performance among supply-side and demand-
34 Richard Cowart Regulatory Assistance Project and Jonathan Raab Raab Associates Ltd Dimensions of Demand Response Capturing Customer-Based Resources in New Englandrsquos Power Systems and Markets Report and Recommendations of the New England Demand Response Initiative July 23 2003 at httpwwwraponlineorgdocsRAP_Cowart_DemandResponseAndNEDRI_2003_07_23pdf
RegulatoRy assistance PRoject
14
side resources are not identical in these capacity markets they are designed and intended to provide comparable incentives to perform during specified hours35
Currently the key difference in eligibility requirements for demand-side resources in the ISO-NE and PJM capacity auctions is the circumstances under which energy efficiency resources may participate Under PJMrsquos rules energy efficiency resources may participate in Base Residual Auctions only up to four years This means that efficiency measures are limited to receiving compensation for their capacity contribution to four years of their measure life rather than their full measure life Demand response resources (including distributed generation) can participate in the PJM capacity market for as long as their ability to reduce demand continues In contrast all demand-side resources in ISO-NE are eligible to bid capacity for their full measure life an approach that recognizes the
full contribution of these resources to regional resource adequacy requirements and that encourages long-lived energy efficiency assets Further description of eligible demand-side resources and performance requirements in these markets is presented in Appendix 3
Forward Capacity Auction Results
In the following sections we summarize the overall level of capacity cleared from existing and new resources in the PJM and ISO-NE auctions the level of incremental capacity successfully bidding into these markets and how different types of resources have fared to date mdash with particular focus on demand resources More detailed results for the PJM and ISO-NE forward capacity markets are provided in Appendix 1
Some stakeholders claim that demand resources are not as available as generation yet they get paid the same price for capacity (implying that they should receive a lower price) A closer examination of the ISO-NE rules reveals several problems with this generalization In particular generation availability can actually vary quite widely because these resources are excused from performing if they are on scheduled maintenance (eg nuclear plants are paid their full monthly capacity payment even when they are shut down for weeks of re-fueling) And other generation resources are ldquoallocatedrdquo a specific number of hours for annual maintenance and are paid as if they are providing capacity services when they are off-line Demand resources have pre-established hours they must be available and are penalized for performance failures differently than traditional generationmdashsome argue more severely For example a demand resource that fails to perform is assessed a penalty for that month and its capacity value is reduced going forward (for all future months) While it is possible to re-establish the capacity value
through future performance (demand response) or with updated MampV (energy efficiency) the process is a slow one that can take many months or more A generation unit that fails to perform is assessed a penalty for that month but its capacity value is either unchanged or can be reestablished with a test run at anytime and the monthly capacity payments continue with no reduction Generation plants with long notice requirements (eg 24 to 48 hoursrsquo notice for coal-fired plants if the system operator wants them on-line and actually providing energy) are paid the same as a demand response resource that is required to be dispatchable by the system operator within 30 minutes throughout the year to address shortage events (See Appendix 3) Clearly there are individual rules that stakeholders can argue work to the advantage of supply-side over demand-side resources and vice versa Overall the intent of such variations should be to make obligations penalties and payments for demand and supply resources roughly comparable while recognizing the unique operational issues associated with all resources
Performance Incentives Demand- vs Supply-Side Resources
35 Nonetheless there continues to be debate among stakeholders over whether the appropriate balance has been reached See text box
15
the Role of foRwaRd caPacity MaRkets in incReasing deMand-side and otheR low-caRbon ResouRces
Auction Results for PJM36
PJM has held five Base Residual Auctions including the most recent May 2009 auction for the 20122013 delivery year PJM serves a large market The 20122013 Base Residual Auction cleared a total of 1361436 MW of capacity While generating resources account for nearly all of this committed capacity (1285274 MW) demand response resources (including distributed generation) represent 5 percent of the total (70472 MW) New for the 20122013 delivery year 5689 MW of energy efficiency also cleared the market Table 1 in Appendix 1 lists capacity resources offered and cleared to date As indicated in that table the vast majority of demand-side resources offered into the market cleared each PJM base residual auction
Figure 4 below illustrates the increasing role of demand-side resources in PJM
Renewable generating resources also are gaining some traction in the capacity market although not anywhere near the magnitude of demand-side resources in terms of their overall contribution to resource adequacy requirements This is due to the predominance of wind resources and their variable nature PJM applies a 13 percent on-peak capacity factor to these resources mdash for every 100 MW of wind resources only 13 MW are eligible to meet capacity requirements Some 3234 MW of wind capacity resources cleared in the most recent Base Residual Auction mdash 95 percent of the amount offered While this capacity level is miniscule compared to the total capacity clearing the auction it translates to a large nameplate rating mdash 2488
12000
10000
8000
6000
4000
2000
0
Active Load Management
Prior to RPMImplementation RPM Implemented
Interruptible Load for Reliability
Energy Efficiency RPM Offered Demand Response
Figure 4 Demand-side Participation in PJMrsquos Reliability Pricing Model (RPM) Auctions
Note Demand-side resources included Active Load Management prior to the 20072008 delivery year Interruptible Load for Reliability and Demand Response were first eligible for the 20072008 delivery year Energy Efficiency resources were first eligible for the 20122013 delivery year (May 2009 auction) The large increase in demand response participation in the 20122013 delivery year is in large part due to the elimination of PJMrsquos ILR program
200506 200607 200708 200809 200910 201011 201112 201213
36 Except where noted information and figures in this section and referenced tables in Appendix 1 are from PJM ldquo20122013 RPM Base Residual Auction Resultsrdquo at httpwwwpjmcom~mediamarkets-opsrpmrpm-auction-info2012-13-base-residual-auction-report-document-pdfashx
RegulatoRy assistance PRoject
16
MW of wind resourcesPJM reports that the Base Residual Auctions have
attracted 150294 MW of incremental capacity in the region to date Incremental capacity refers to new generation resources capacity upgrades to existing generation resources new demand response resources upgrades to existing demand response resources and new energy efficiency resources37 Natural gas- and coal-fired plants account for most of the incremental capacity with nuclear plants (from uprates) also making a sizable contribution Tables 2 and 3 in Appendix 1 provide details on the incremental capacity procured It is important to note that the figures in these tables represent resources new to the capacity market including uprates mdash not all are newly built However they include a new merchant coal plant built for the PJM market38
True to one of the original goals the PJM capacity market also has been successful in retaining existing capacity from power plants that were originally under high-cost reliability must-run agreements39 Since FERC approved the Reliability Pricing Model existing capacity that would otherwise have been deactivated or retired has accounted for 32768 MW of procured capacity Table 4 in Appendix 1 shows these changes in resource deactivation and retirement
Market clearing prices for resources in PJMrsquos Base Residual Auctions to date have ranged from $1646 to $17429 per MW-day not including any locational price adders for constrained areas (See Table 5 in Appendix 1) Importantly the $1646MW-day clearing price for the 20122013 delivery year represents a decrease of $9354MW-day from the previous Base Residual Auction due in part to significant increases in capacity from demand response and the introduction of energy efficiency resources into the bidding process Moreover the participation of demand-side resources is estimated to have reduced the market clearing price for the 20122013 delivery year by an astonishing $16232MW-day in unconstrained zones (ie from a clearing price of $17878MW-day without these resources in the bid stack to the actual clearing price
of $1646MW-day) Table 6 in Appendix 1 shows the calculation by PJMrsquos independent market monitor
Auction Results for ISO-NE
ISO-NErsquos forward capacity market is about a quarter of the size of the PJM capacity market mdash the Installed Capacity Requirement set by ISO-NE for the 20122013 delivery year was 31965 MW ISO-NE has held three forward capacity auctions to date and all of them cleared at the administratively set floor price ($450kW-month $360kW-month and $295kW-month respectively) with surplus capacity above the Installed Capacity Requirement set by ISO-NE to meet reliability needs The first auction secured 1772 MW above the requirement the second auction cleared 4755 MW of excess capacity and the third auction cleared 4649 MW of excess capacity (See Table 7 in Appendix 1)
Demand resources have consistently represented about 8 percent of the resources cleared in the three auctions (2554 MW 2937 MW and 2898 MW respectively) an amount that exceeded expectations Energy efficiency accounted for about a quarter of the demand resources in the first auction and about a third in more recent auctions Real-time demand response comprises the largest share of demand resources Emergency generation (ie distributed generation whose state air quality permit limits operation to ldquoemergencyrdquo conditions) also makes a sizeable contribution Non-emergency distributed generation however comprises a negligible amount of the total Table 8 in Appendix 1 shows detailed results for demand resources
Figure 5 shows the growth in demand resources offered and cleared in the first two ISO-NE auctions by type There has been a steady growth in demand-side resources in New England since the first demand-response programs operated by ISO-NE The forward capacity auctions have contributed to and solidified these gains
Participation of demand-side resources in the ISO-NE forward capacity auction has been credited with making the clearing price lower than it would have been otherwise
37 The increase is partially offset by capacity de-ratings to existing generation resources
38 See Pfeifenberger et al at 27
39 As discussed above these contracts have not been dispensed with altogether however
17
the Role of foRwaRd caPacity MaRkets in incReasing deMand-side and otheR low-caRbon ResouRces
as it has in the PJM region Analysis of the first auction bids for example suggests that the participation of these resources saved ratepayers as much as $280 million by lowering the price paid to all capacity resources in the market40
Moreover by contributing to the excess capacity that kept capacity payments at relatively low floor prices in New England the participation of demand-side resources has
also contributed to lower overall market revenues inducing some inefficient oil-fired generating units to shut down at least temporarily Nonetheless existing and new fossil-fuel resources continue to dominate the capacity commitments in this region as is the case for PJM
Overall renewable generating resources (primarily wind resources) are making some headway in the regionrsquos forward capacity market but as in PJM they are not
40 See Cheryl Jenkins et al This calculation reflects what the market clearing price would have been in the auction given the Installed Capacity Requirement put out to bid by the system operator which assumes no impact of energy efficiency programs on loads (because energy efficiency is bidding) Therefore the calculated reduction in clearing price represents a theoretical maximum mdash excluding demand resources from the market would likely have been at least partially offset by a lower amount of capacity put out to bid As a result the difference in the market clearing price (and savings to consumers) would likely have been smaller than the number calculated here although it is difficult to say by how much However even if demand-side resources were not permitted to bid they would contribute to lower prices for consumers by lowering the total quantity of capacity required
41 Internal Market Monitoring Unit ISO-NE June 5 2009
4500
4000
3500
3000
2500
2000
1500
1000
500
0
New UnclearedTotal Uncleared1375 MW
Total Uncleared1159 MW
Total Cleared2279 MW
Total Cleared2778 MW
New Cleared
Existing Delisted Uncleared
Existing Cleared
FCA 1 FCA 1
Figure 5 Demand-Side Participation in ISO-NE Capacity Auctions by Type41
copy ISO New England Inc
Note Activerdquo resources include demand response and emergency generation energy efficiency is considered a ldquopassiverdquo resource Clearing amounts reflect ISO-NErsquos maximum limit of 600 MW of Real-Time Emergency Generation In contrast Table 8 in Appendix 1 shows the actual amount of such resources that cleared the auction Capacity payments to these resources are pro-rated if cleared levels exceed 600 MW
Cap
acit
y (M
W)
Active
Active
Active
Active
Active
Active
Active
Active
Passive
Passive
Passive
Passive
Passive
RegulatoRy assistance PRoject
18
a major contributor to the regionrsquos resource adequacy requirements at this time In the most recent (third) auction 166 MW of wind capacity cleared the auction mdash with a nameplate rating an order of magnitude larger42
Unlike PJM ISO-NE does not apply a deemed on-peak capacity factor to wind and other variable generation resources Instead all such resources must provide data that demonstrate the claimed summer and winter qualified capacity The capacity factor is adjusted over time based on actual performance during specified hours
Forward Capacity Markets in the Context of Carbon Constraints
Power market rules are not constructed in a vacuum rather they are designed to address specific public policy goals As described above forward capacity markets in the US were developed to ensure resource adequacy in the power system at a reasonably competitive price In the face of growing carbon constraints however power market rules need to be redesigned to work in concert with carbon reduction goals and policies rather than at cross purposes The challenge of substantially de-carbonizing the power sector in the coming years is too great to ignore this interaction In particular policymakers should carefully consider what elements of the current planning and procurement process to achieve resource adequacy contribute to the following effects ndash and then work to revise the market rules accordingly
bull Do the market rules encourage new investments in high-emitting resources (including repowering) at the expense of low-carbon alternatives
bull Do they encourage the continued (or increased) operation of existing high-emitting power plants
bull Will they result in a build-out of capacity and cumulative emissions that conflict with the level of de-carbonization required in the power sector mdash or make attainment of that level more costly to the economy
This paper is not intended to evaluate the PJM and ISO-NE capacity markets and auction rules in any depth with respect to these issues However we offer below general observations based on the auction design and results to date in these regions and other studies Following that we provide policy recommendations related design options and additional actions for consideration
General Observations on Forward Capacity Markets and Results
Based on our review of FCM auctions to date and related studies we offer the following observations
bull The ISO-NE and PJM forward capacity markets are meeting their resource adequacy objectives Sufficient levels of capacity have cleared the market to meet each regionrsquos anticipated peak demand and adequate resources are now committed on a forward basis to ensure reliable coverage in future years (up to the 20122013 delivery year) But in a carbon-constrained world the mix of resources is as important as the quantity in both the short-term and the long-term Most resources that are available during peak demand hours also produce electricity or reduce consumption during many more (or all) hours of the year and the carbon intensity of that mix of resources will drive the level of cumulative emissions in the power sector43 As discussed in this paper capacity markets as currently designed provide compensation based on the level of available capacity not the mix of resources providing that capacity It is worth repeating here that the only (non-price) attribute a resource needs to demonstrate for resource adequacy purposes is that it will be available when called upon during the projected hours of peak system loads In a carbon-constrained world policy makers should ask whether the planning and procurement process for acquiring a sufficient level of capacity at a reasonable price is also moving the resource mix in the right direction mdash towards zero or low carbon-emitting demand- and supply-side resources
42 Compiled from auction results at httpwwwiso-necommarketsothrmkts_datafcmcal_resultsccp13fca13indexhtml
43 With the exception of gas-fired peaking units or demand response resources that are dispatched to meet (or reduce) loads only during peak system hours
19
the Role of foRwaRd caPacity MaRkets in incReasing deMand-side and otheR low-caRbon ResouRces
bull Expressly designing demand-side resources into forward capacity markets appears key to achieving all three objectives ndash resource adequacy low-carbon resource mix and reasonable price Energy efficiency and demand response resources are faring well in auction-based capacity markets mdash and this is a positive outcome for several reasons First energy efficiency and other demand-side resources can substitute for existing and planned generation that have a higher carbon footprint thereby reinforcing carbon reduction policies and targets for the region Second demand-side resources can dramatically reduce the costs of meeting the regionrsquos resource adequacy requirements mdash as evidenced by the results of the PJM and ISO-NE auctions In addition the increase in demand-side resources facilitated by capacity auctions can reduce market power because more suppliers and more resources means individual generators have less ability to affect bid offers and clearing prices And because demand-side resources lighten the load at the end of the supplydelivery chain they enhance the reliability of each link in the chain from fuel supply and generation to the local distribution network
bull Differences in the impact of demand-side resources on carbon emissions should be recognized in capacity markets and associated auction rules Energy efficiency decreases carbon emissions because (by definition) it reduces energy use for an equivalent level of service and at the margin almost all power systems are running higher carbon resources In contrast the net impact of demand response on carbon emissions will depend upon specific circumstances including the mix of
plants serving loads at the margin For example when coal is primarily serving baseload and intermediate needs emissions may increase when customers shift loads from on-peak (when natural gas is on the margin) to off-peak periods44 Elsewhere however demand response mdash including any conservation side-effect mdash may reduce emissions from less efficient peaking plants In addition demand response includes real-time emergency generation which is often fossil-fuel powered (eg by diesel or natural gas) Any analysis of the costs and benefits of demand response resources in capacity markets should account for such effects Policies and market rules for demand response should be aligned with its environmental costs and benefits45
bull Renewable generating resources are beginning to make some headway in forward capacity markets mdash in particular wind resources This is in large part because the markets described here recognize some capacity value for variable renewable resources (wind solar and run-of-river hydro) either through a deemed on-peak capacity factor or a demonstration of claimed capacity for specified on-peak periods Policymakers need to pay attention to how these values are established so they can be confident the committed capacity will be available when called on while at the same time encouraging participation of all low-carbon resources in the market More generally as renewable resources become a more significant part of the resource mix a forward capacity market creates the opportunity to recognize their aggregate capacity value to the system46
44 For example PJM recently released figures on carbon emissions of generating units that operate on the margin during on-peak vs off-peak hours See httpwwwpjmcom~mediaabout-pjmnewsroom2010-releases20100325-pjm-reports-new-carbon-dioxide-emissions-dataashx and httpwwwpjmcomdocuments~mediadocumentsreportsco2-emissions-reportashx
45 See section 316 and Mechanism E in Attachment 1 of Pacific Northwest National Laboratory The Smart Grid An Estimate of the Energy and CO2 Benefits January 2010 (PNNL 19112) at httpenergyenvironmentpnlgovnewspdfPNNL-19112_Revision_1_Finalpdf
46 Variable renewable resources will qualify for higher capacity value if they are bundled with other resources for reliability (eg demand response hydroelectric dams or energy storage) In addition confidence in the capacity value of variable resources increases as their geographic diversity on the system increases See for example the report on the Eastern Wind Integration and Transmission Study at httpwwwnrelgovwindsystemsintegrationpdfs2010ewits_final_reportpdf
RegulatoRy assistance PRoject
20
bull Nonetheless renewable resources are hard-pressed to successfully compete with the thousands of megawatts of existing and new fossil-fuel resources participating in these auctions that are able to bid below the true societal cost of their operations under current market rules In fact capacity auctions as currently designed can breathe new economic life into high carbon-emitting plants that were previously planned for significantly reduced operations or retirement Along with new capacity from fossil-fuel generation allowing such a large amount of existing capacity from high carbon emitters to clear the auction is likely to crowd out renewable resources that are able to address resource adequacy requirements equally well Such results may not represent an ldquoefficientrdquo (or desirable) outcome for a carbon-constrained power sector This is especially true where the carbon costs of a fossil-fuel plant are not fully recognized in the energy market that plant also will be bidding into
The Electric Power Research Institute modeled the effect of various levels of carbon taxes or allowance prices in the upper Midwest (coal-dependent) and in Texas (heavily reliant on natural gas) The study found that close to a doubling of the wholesale prices of electricity in the Midwest region (through carbon-related charges) would produce only a 4 percent reduction in regional emissions given the current generation mix Similar results were observed for Texas where natural gas plants are on the margin49 And in the Northeastern US due to initially low carbon prices and a host of factors that dampen the price signal the Regional Greenhouse Gas Initiative (RGGI) has not yet resulted in generator operational changes50 One of those dampening factors is the single clearing price that is typically set through wholesale energy markets mdash which dilutes the market signal sent by a price on carbon emissions by allowing fossil-fueled plants to recover
most or all of their allowance costs through higher clearing prices reflecting the cost of allowances51
Studies also have shown that the price of carbon must rise (and be maintained) at very high levels to obtain sufficient market pull for the level of new investments in clean generation required For example a recent analysis in California concluded that it would take a carbon price of $100 per tonne52 to make economic investments in renewable resources compared to fossil fuel-fired generation in order to reach carbon reduction targets in the power sector beyond what current state requirements will achieve53 Further price signals may be diluted if a portion of the carbon allowances are allocated in a manner that shields high-emitting power plants from carbon costs or if high-emitters located outside the capped region can sell into the market on a long-term basis
Carbon Pricing Alone Is Insufficient to De-carbonize the Generation Mix
bull A market price for capacity or energy that favors the construction and operation of high carbon-emitting resources over clean resources will lead to increases mdash rather than reductions mdash in the cumulative level of carbon emissions in the power sector A carbon tax or carbon cap-and-trade regime internalizes some or all of the otherwise un-priced carbon costs of electricity production and would improve the relative economics of clean resources in both forward capacity and energy markets However carbon pricing alone may be insufficient to change the dispatch of existing high-emitting power plants or their ability to clear these capacity markets (and be paid additional revenues as a result) in such overwhelming numbers47 In fact the very modest impact of carbon pricing on the performance of fossil-fuel plants has been documented in several reports48 (See text box below)
47 With or without carbon prices policymakers also might want to consider the implications of paying existing power plants the market clearing price for capacity mdash and the potential windfall profits for plant owners mdash for making no changes in plant operations See for example Ezra Hausman Paul Peterson David White and Bruce Biewald Synapse Energy Economics Inc RPM 2006 Windfall Profits for Existing Base Load Units in PJM An Update of Two Case Studies Feb 2 2006 at wwwsynapse-energycom
21
the Role of foRwaRd caPacity MaRkets in incReasing deMand-side and otheR low-caRbon ResouRces
bull Carbon pricing alone will have limited impact on consumer decisions to invest in permanently reducing their peak demand by making cost-effective investments in energy efficiency Well-designed time-varying pricing options can successfully shift demand from high-price hours to lower price hours54 Such shifting also reduces peak demand on transmission and distribution systems Overall energy use will decline somewhat in response to price But long-term reduction in energy use due to price increases is relatively small The numerous market barriers to capturing the full cost-effective potential of energy efficiency ndash through improvements in building construction practices and industrial processes retrofits of existing buildings and installations of high-efficiency appliances and equipment in homes and businesses ndash are well-documented They include lack of information high first-costs consumersrsquo high discount rates and the landlord-tenant split incentive problem among others55 Recent empirical analysis of demand elasticities suggests that the long-term price elasticity of demand for electricity is even lower than earlier studies have indicated for both liberalized and regulated markets (See text box on page 21)
In sum while forward capacity markets are meeting their resource adequacy objectives and clearing an impressive amount of clean low cost demand-side resources on balance these markets (as currently designed) are not working sufficiently in concert with carbon reduction goals and policies in the face of growing carbon constraints For the reasons discussed above carbon pricing alone
48 See Testimony of Richard Cowart Regulatory Assistance Project Before the Committee on Energy and Commerce Subcommittee on Energy and Environment US House of Representatives April 23 2009 ldquoThe Consumer Allocation for Efficiency How Allowance Allocations Can Protect Consumers Mobilize Efficiency and Contain the Costs of GHG Reductionrdquo at httpenergycommercehousegovPress_11120090423testimony_cowartpdf
49 See Victor Niemeyer ldquoThe Change in Profit Climate How Will Carbon-Emissions Policies Affect the Generation Fleetrdquo Public Utilities Fortnightly May 2007 at 20 24
50 See ldquoRGGI marks its first year with success and lesson on effect of market pressurerdquo Electric Utility Week Dec 14 2009 Ten Northeast and Mid-Atlantic states participate in RGGI the first mandatory cap-and-trade program in the US Connecticut Delaware Maine Maryland Massachusetts New Hampshire New Jersey New York Rhode Island and Vermont Nine of them participate in either the ISO-NE or PJM forward capacity markets described in this paper
51 PJM Interconnection ldquoPotential Effects of Proposed Climate Change Policies on PJMrsquos Energy Marketrdquo Jan 23 2009 p 5 See also ldquoBecause Thatrsquos Where the Money Is The FERCrsquos Ability to Reduce the Cost of Slowing Global Warmingrdquo Samuel A Wolfe Chief Counsel New Jersey Board of Public Utilities December 2009 at httpwwwnarucorgpublicationsWOLFE-20Panel203pdf
Demand for Power Is Relatively Price-Insensitive mdash Even Over the Long Term
Modeling by the US Department of Energy suggests that a 10 percent increase in power prices will reduce demand for electricity by just 25 percent to 3 percent over 20 years assuming that the price effects persist over that entire period56 This would only offset the normally expected US load growth in two out of those 20 years57
More recently a 2009 empirical analysis of the demand for electricity in the US concludes that price elasticity of residential demand has actually decreased since retail price deregulation was first introduced in the US The results suggest that a 10 percent increase in power prices will reduce residential electricity demand more on the order of 12 percent to 17 percent based on 2001-2008 data for both deregulated and regulated states58 Price responsiveness is further dampened by the income-elasticity of demand which is positively correlated with consumption As incomes increase consumption of electricity goes up and the conservation impact of any price increase is diminished59 The equivalent historical figure for a 10 percent increase in power prices in the UK residential sector is -23 percent but the income-elasticity is such that a 10 percent increase in income results in an increase of demand of 34 percent ndash ie household income is just as important as energy price in determining energy demand60
RegulatoRy assistance PRoject
22
is unlikely to shift the power sector resource mix at the pace or scale required to meet aggressive carbon reduction targets ndash or correspondingly to substantially change the dominance of high-carbon resources clearing forward capacity auctions under current market rules An increasing number of studies makes a compelling case that our economy and our society cannot afford this dominance to persist much longer if we are to contain climate change to a livable level In fact close to full de-carbonization of the
power sector is being discussed in international forums as the only way to meet essential carbon reduction targets by 205061 While capacity markets alone are unlikely to support the full value of clean energy resources in a carbon-constrained power sector by themselves with appropriate design elements they can serve to reinforce actions taken at federal regional and state levels that provide larger and longer lasting commitments to clean demand-side and renewable resources62
52 A tonne or metric ton is a unit of mass equal to 1000 kilograms (roughly 2205 pounds) or approximately the mass of one cubic meter of water at four degrees Celsius A tonne is not the same as either a ldquoshortrdquo ton (2000 pounds) or a ldquolongrdquo ton (2240 pounds)
53 Energy and Environmental Economics Inc Greenhouse Gas Modeling of Californiarsquos Electricity Sector to 2020 Updated Results of the GHG Calculator Version 3 prepared for the California Public Utilities Commission October 2009 pp 66-67 at httpwwwethreecomdocumentsGHG_102209CPUC_GHG_Final_Report_28Oct09pdf
54 Ahmad Faruqui and Sanem Sergici The Brattle Group ldquoHousehold Response to Dynamic Pricing of Electricity A Survey of the Experimental Evidencerdquo Jan 10 2009 at httpwwwhksharvardeduhepgPapers2009The20Power20of20Experimentation20_01-11-09_pdf
55 See for example American Council for an Energy Efficient Economy ldquoQuantifying the Effects of Market Failures in the End-Use of Energyrdquo pp iii-vi 2007 at httpoldaceeeorgenergyIEAmarketbarrierspdf This study details the various types of market barriers to end-use energy efficiency and reports that up to 50 percent of residential energy use in the US is affected by such barriers
56 The US Department of Energyrsquos National Energy Modeling System (NEMS) has price elasticity built into it The long-run elasticity (assuming price effects remain for 20 years) are ndash031 for residential electric use and ndash025 for commercial electric use See Steven H Wade ldquoPrice Responsiveness in the NEMS Buildings Sector Modelrdquo in Energy Information Administrationrsquos Issues in Midterm Analysis and Forecasting 1999 pp 55 58 table 1 at httpwwweiadoegovoiafissuespdf060799pdf
57 This would require a much larger rate increase just to offset expected load growth over 20 years let alone to reduce demand sufficiently to permit absolute reductions in emissions from the nationrsquos huge generation fleet See Testimony of Richard Cowart
58 T Nakajima and S Hamori ldquoChange in Consumer Sensitivity to Electricity Prices in Response to Retail Deregulation A Panel Empirical Analysis of the Residential Demand for Electricity in the United Statesrdquo Energy Policy (2010) available at wwwsciencedirectcom
59 Ibid
60 John Dimitropoulas Lester C Hunt and Gary Judge ldquoEstimating Underlying Energy Demand Trends Using UK Annual Datardquo at httpuserwebportacuk~judgegAEL_04pdf
61 See for example Meeting Carbon Budgets ndash The Need for a Step Change Progress Report to Parliament Committee on Climate Change October 2009 at httpwwwthecccorgukreportsprogressreports Christopher Jones and Jean-Michel Glachant Why and How the European Union Can Get a (Near to) Carbon-Free Energy System in 2050 MIT Center for Energy and Environmental Policy March 2010 at httpdownloadsthecccorgukdocs2166720CCC20Executive20Summary20AW20v4pdf Roadmap 2050 A practical guide to a prosperous low-carbon Europe The European Climate Foundation April 2010 at wwwroadmap2050eu
62 Without such policies it is unlikely that even RGGIrsquos modest carbon reduction goals will be achieved See Paul Peterson Doug Hurley and David White Synapse Energy Economics Inc ISO New England Scenario Analysis Companion Report Constructing a Future That Meets Regional Goals Aug 8 2007 at wwwsynapse-energycom
23
the Role of foRwaRd caPacity MaRkets in incReasing deMand-side and otheR low-caRbon ResouRces
ISO-NE Rules for Emergency Generators Advance Environmental Goals
Emergency (ldquobackuprdquo) generators typically are diesel-fired and states in New England and elsewhere in the US have restricted the number of hours and days they may be operated through the state permitting process At the time the first regional demand response tariffs were being designed in New England a collaborative of energy regulators environmental regulators the ISO utilities and other stakeholders realized that active demand response programs could lead to substantial incentives for diesel-fired backup generators to operate more often when air quality was at its worst Regulators and the ISO proposed a rule limiting those generators to run for reliability purposes during system emergencies This is a concrete example of reliability rules being written to advance environmental goals as well as power system needs63 In addition a regional working group developed model emissions standards for small generators for statesrsquo consideration64
To reinforce regional air quality policies and goals ISO-NE limits the total amount of emergency generators in the regional capacity market to 600 MW To the extent any excess amount clears the auction capacity payments to these resources are pro-rated
63 See Cowart and Raab p 26
64 See Model Regulations for the Output of Specified Air Emissions From Smaller Scale Electric Generation Resources Oct 31 2002 at httpwwwraponlineorgshowpdfaspPDF_URL=22docsrap_issuesletter-outputbasedemissioninsert_2003_07pdf22
65 Edward S Rubin Carnegie Mellon University ldquoA Performance Standards Approach to Reducing CO2 Emissions for Electric Power Plantsrdquo June 2009 at httpwwwpewclimateorgpublicationsreportcoal-initiative-series-performance-standards-approach-reducing-co2-emissions-ele Also see Chris Simpson and Brenda Hausauer ldquoEmissions Performance Standards in Selected Statesrdquo Regulatory Assistance Project Research Brief November 2009 at httpwwwraponlineorgdocsRAP_Simpson_EPSResearchBrief_2009_11_13pdf
Policy Recommendations and Auction Design Options
We present below recommendations and a menu of auction design options for forward capacity markets that support and enhance carbon policies and carbon reduction targets
bull Power market rules should be constructed to recognize and limit the adverse environmental consequences of power generation The power system and the environment are inextricably linked Explicit consideration of environmental costs and benefits of various electricity resources is not only reasonable but necessary to meet the enormous challenge of climate change
bull Forward capacity markets should reinforce carbon reduction policies which could be accomplished by incorporating one or more of the following into the auction rules
Auction rules could apply an Emissions Performance Standard (EPS) to promote capacity commitments from low-carbon resources and discourage bids from high-emitting power plants An EPS can be expressed as a maximum level of greenhouse gas emissions per unit of electrical output or as a percentage reduction in (annual) plant emissions It can vary with fuel type and incorporate other design variations65 It may be appropriate to adopt an EPS mdash within the auction qualification rules or by regulation mdash particularly if current market signals are not sufficiently
discouraging new construction or repowering of high-emitting generating resources with long lifetimes while forward capacity markets are providing a new revenue stream to keep them running
RegulatoRy assistance PRoject
24
Auction rules could disqualify inefficient generators from participating (and from receiving capacity revenue) or more generally require their retirement through financial incentives regulations or both66 Since 2007 China has been phasing out such plants and intends to retire approximately 50 gigawatts (GW) of small inefficient coal-fired power plants nationwide and 7 GW to 10 GW of small natural gas-fired units as well as halt construction of small inefficient power plants The policy is being put in place three ways the direct rescission of operating permits the transfer of generation rights and price reductions
Capacity payments could vary by the emissions rate of the resource Instead of one price paid to all generation that clears the auction adders could be applied to payments for low-emitting units and deductions could be applied to high-emitting units67 For example a sliding-scale percentage reduction to the per-unit ($kW-month or $MW-day) clearing price could be established based on the average annualized carbon footprint of fossil-fuel resources whereas a price adder above the clearing price could be established for zero-emitting resources
Imputed ldquocarbon addersrdquo could help curtail high-emitting resources Carbon adders are imputed costs that reflect at least a portion of the societal cost of emissions They are generally
used in the context of resource planning and acquisition by a regulated LSE mdash as a way of ensuring that high-carbon risks and low-carbon alternatives are properly valued in the resource selection process But these imputed costs do not get passed on to ratepayers or consumers for every unit of power consumed in contrast to carbon pricing68 Similarly the rules in a forward capacity market could be modified so that carbon adders are applied in determining what resources clear the auction (and will receive the market clearing price for their capacity commitment)
A ldquozero-carbon resource portfolio standardrdquo could establish auctions for separate tranches of resources by emissions level For example one tranche could include energy efficiency and renewable resources The size of each tranche would be based on carbon reduction goals for the region The higher the goals the larger the tranche for energy efficiency and renewable resources These resources decrease carbon emissions because at the margin most power systems are running higher carbon resources
bull Policymakers should consider a longer price commitment in forward capacity markets mdash at least for low-carbon resources The contract period for new capacity in these markets is short (one year in PJM up to five years in ISO-NE) in part so there is greater certainty over forecasts of resource needs for system reliability (to mitigate the risk of over-supply)
66 Small and old coal plants are the most inefficient and polluting both in terms of greenhouse gases and particulate matter By some estimates 50 MW plants may use as much as 200 grams more per unit of electricity output than a plant larger than 300 MW See Frederick Weston Rebecca A Schultz David Moskovitz and Max Dupuy Regulatory Assistance Project ldquoChinarsquos Climate Change Initiatives Do new policies adopted in China offer any guidance for the transformation of the US power sector in a carbon-constrained worldrdquo November 2009 at httpwwwraponlineorgdocsRAP_China20Climate20Initiatives_NARUC_2009_11_01docx
67 See N Jonathan Peress and Kenneth A Colburn ldquoElectrical Connections Aligning Capacity Market Changes With RGGI in the Northeastrdquo Discussion Draft March 2005 at httpwwwpucnhgovEPABSymbiotic202005-03-1820Peress-Colburn20Letter20to20FERC-Woodpdf
68 Both high carbon resources and low carbon resources clearing in power markets (characterized by single-price auctions) are paid the same price So whenever fossil resources are on the margin (most of the time in most places) consumers are seeing the same price for both fossil and clean resources and the cost of carbon allowances (or carbon taxes) for that marginal resource is reflected in the clearing price for all power bought in the market Carbon adders on the other hand are not actually paid to any resource or reflected in prices for all units sold in the market
25
the Role of foRwaRd caPacity MaRkets in incReasing deMand-side and otheR low-caRbon ResouRces
Auction winners can generally participate in future auctions and receive the market clearing price but have no assurance of future prices Moreover under current rules in PJM energy efficiency resources cannot receive capacity payments over the full life of the measures mdash only for four consecutive delivery years This constraint puts energy efficiency on a different footing than other demand resources mdash as well as all supply-side resources mdash which are paid for their capacity as long as they provide the benefit
The short commitment period and lack of price certainty may not provide market signals that are strong and consistent enough to ensure sufficient new generation or encourage plant operators and investors to make efficient choices for the long-term mdash even where carbon prices are expected to increase substantially in the future due to a dramatically declining carbon cap or a high carbon tax Allowing clean resources to opt for a longer period of time over which the price is known would in particular facilitate renewable resources whose typically high upfront capital costs and low operating costs mdash compared to natural gas-fired plants in particular mdash may require such a long-term commitment to procure financing69 Another option might be to establish fixed floor prices for clean energy resources for a long-term period to provide assurance of a minimum revenue stream
bull Regional load forecasting should be reviewed for treatment of demand-side resources acquired outside the capacity market In particular the system operator determines the capacity that will be auctioned for each delivery year (three years hence) based on a 10-year load forecast which is updated on
an annual basis Under the current planning process in forward capacity markets this forecast only reflects the demand-side resources that have cleared in prior auctions The system operatorrsquos load projections do not take into consideration any load reductions from demand-side resources procured outside of the auction such as energy efficiency programs that LSEs have committed (or are obligated) to fund and implement in the coming one to three years or beyond70 If the magnitude of these load reductions is substantial the ISO may be systematically overstating the level of capacity put out to bid for each delivery year Depending upon the existing mix of resources and market conditions in the region this overstatement may have a sizeable impact not only on the level of cleared capacity and the market price but on the resulting resource mix and level of carbon emissions as well
Additional Actions
Careful design of the planning process and auctions undertaken through forward capacity markets can help to ensure that they reinforce and do not work at cross purposes with climate reduction goals and targets However forward capacity market signals (capacity prices) are only one component of a market and regulatory landscape that affects investment and operating decisions in the power sector Market rules and procurement policies that affect system energy requirements ndash as well as policies and regulations that affect access location and cost recovery for transmission and distribution facilities ndash have an enormous impact on both the short- and long-term resource mix
It is beyond the scope of this paper to fully explore how
69 LSEs in PJM and ISO-NE can contract for generating resources through the bilateral market to hedge energy and capacity costs and to meet renewable energy standards Renewable resource projects that successfully negotiate such contracts if they are long term may not need a long-term commitment in the forward capacity market Still a short-term capacity payment stream with uncertain prices thereafter weakens the ability of renewable resources to secure long-term financing
70 Some of the econometric models that the system operators use for their load forecasts may capture the impacts of federal appliance standards and building codes However to our knowledge there has been no explicit accounting to date for the impacts of state and utility energy efficiency programs where the capacity is not bid into the auctions
RegulatoRy assistance PRoject
26
market rules and other policies and regulations can be harmonized and strengthened to meet customersrsquo energy needs reliably in a carbon-constrained world Larger and longer lasting commitments to demand-side and renewable resources are certainly needed to ensure a mix of resources that will significantly reduce greenhouse gas emissions in the power sector This has been the conclusion of US policymakers who have put in place additional policies to facilitate long-term acquisition of low-carbon resources in regions that operate both forward capacity markets and a cap-and-trade program (under RGGI)71
bull States have adopted a variety of mechanisms for sustained and aggressive energy efficiency programs
bull Strong building codes and equipment standards
bull Stable funding through a system benefit charge
bull Third-party administration of programs or where the utility is the efficiency portfolio manager decoupling of utility profits from revenues financial incentives for shareholders or both
bull Recycling of carbon auction proceeds into energy efficiency investments
bull Some states require long-term resource plans or resource procurement plans that must include energy efficiency Therersquos renewed interest in long-term planning and procurement particularly for demand-side and renewable resources following a period
where these efforts were largely abandoned with electric industry restructuring and development of organized markets72
bull Several states have adopted energy efficiency resource standards that require achievement of specified energy-saving targets73
bull Most of the states have renewable energy standards74 and several states require long-term contracting of renewable resources to meet the standards75
bull Connecticut Maryland Pennsylvania and Rhode Island require contract terms of 10 years or longer
bull New York requires central procurement of renewable energy credits by a state agency under long-term contract Illinois is likely to acquire long-term contracts for renewable resources under its central procurement mandate
bull Massachusettsrsquo Green Power Partnership purchases renewable energy credits for up to 10 years using its renewable energy fund
These are just examples and certainly not an exhaustive list of the ways in which careful design of forward capacity markets coupled with additional policies at the federal regional and state level can serve to reinforce both resource adequacy requirements and carbon reduction goals
71 Regulatory Assistance Project policy grids summarize state-by-state requirements for resource planning and energy efficiency at httpwwwraponlineorgFeatureaspselect=116 For a summary of renewable energy standards in the US see Ryan Wiser and Galen Barbose Lawrence Berkeley National Laboratory ldquoState of the States Update on RPS Policies and Progressrdquo State-Federal RPS Collaborative Nov 18 2009 at httpwwwcleanenergystatesorgMeetingsRPS_Summit_09WISER_RPS_Summit2009pdf
72 More broadly 30 states nationwide require integrated resource plans or resource procurement plans that include energy efficiency
73 Includes states with strict energy efficiency standards states with Commission-ordered efficiency targets states that allow efficiency to count toward renewable energy standards and states with a rate cap that triggers a relaxation of requirements See Laura A Furrey Steven Nadel and John A ldquoSkiprdquo Laitner ACEEE Laying the Foundation for Implementing a Federal Energy Efficiency Resource Standard March 2009 at httpaceeeorgpubse091htm
74 Some 29 US states and the District of Columbia have renewable energy standards five other states have non-binding goals See Wiser and Barbose
75 For a US database of state incentives for renewable energy and energy efficiency see httpwwwdsireusaorg
27
the Role of foRwaRd caPacity MaRkets in incReasing deMand-side and otheR low-caRbon ResouRces
An example of an approach that attempts to ldquomarryrdquo integrated least-cost resource planning with forward capacity markets is the resource planning and procurement process recently established by the Connecticut Legislature76 The law requires the utilities Energy Advisory Board and Department of Public Utility Control to plan for current and future energy and capacity needs and provide a mechanism for procuring resources that meet specified economic reliability and environmental objectives77 to satisfy the identified need Further the law requires that resource needs first be met through energy efficiency and demand reduction resources that are cost effective reliable and feasible Based on the resulting resource plans LSEs enter into
contracts to acquire the required capacity (level and mix) through a competitive bidding process The law also requires that any resources winning contracts for capacity agree to let the LSE bid that capacity into the forward capacity auction as a ldquoself-suppliedrdquo resource This approach permits LSEs to determine both the quantity and mix of resources through integrated resource planning that will meet their resource adequacy requirements and state policy goals (eg carbon reduction) The LSE pays the contracted capacity price (under its bilateral contracts) instead of paying the auction clearing price to everyone that offers capacity into the forward capacity market (eg existing fossil fuel or nuclear plants)78
Connecticutrsquos Marriage of Resource Planning and Markets
76 Conn Gen Stat sectsect 16a-3a 16a-3b and 16a-3c
77 Costs and benefits cost-effectiveness cost impacts on customers the extent to which load growth can be eliminated and peak demand reduced reliability including energy security and economic risks impacts on meeting state environmental standards including emissions goals optimization of existing generation and generation sites the extent to which renewable resources can be used to meet needs and fuel types diversity and supply See Department of Public Utility Control Final Order in Docket No 08-07-01 Feb 18 2009
78 This approach is not without some controversy A contracted new resource in Connecticut has the potential to displace an alternative ldquocompetitiverdquo new resource in the region that would have bid at a higher price mdash had Connecticut not been allowed to designate the contract as self-supply ISO-NErsquos Internal Market Monitoring Unit has commented on this issue in a report to FERC See Internal Market Monitoring Unit ISO-NE June 5 2009
RegulatoRy assistance PRoject
28
Conclusions and Recommendations
Auction-based capacity markets in the US have been successful to date in attracting the capacity needed to maintain system reliability in an economically efficient manner In particular these markets have been successful in facilitating new demand-side resources
with ratepayers and society reaping the economic and environmental benefits However policymakers also should consider capacity markets in the context of carbon reduction policies and targets for the power sector Even markets that successfully integrate demand-side and renewable resources into the auction process are still encouraging the construction or continued operation of high-emitting supply-side resources to meet reliability targets
Existing capacity markets should be evaluated to assess whether the market is responding in this way And if it is policymakers need to critically assess whether a continuation of that market response over the coming years will make it possible to achieve the cumulative level of carbon reductions required from the power sector to avoid the worst effects of climate change Depending on the results of this inquiry policymakers may need to refine the auction rules and adopt additional policies for the power sector mdash such as those described in this paper mdash to ensure the alignment of capacity markets with both short- and long-term carbon reduction goals
More generally forward capacity markets create a revenue stream for resources that can commit to being available at times of system peak several years in the future mdash but this financial incentive is clearly not the only factor driving the mix of resources in the power sector and their resulting carbon footprint Market rules policies and regulations that affect investment and operating decisions for meeting the systemrsquos energy requirements mdash as well as those that affect access location and cost recovery for transmission and distribution facilities mdash have an enormous impact on both the short- and long-term resource mix in the electric system Policymakers will need to consider how this entire market and regulatory landscape mdash including forward capacity markets mdash can be strengthened and harmonized to reliably meet customer demand for electricity in a carbon-constrained world
29
the Role of foRwaRd caPacity MaRkets in incReasing deMand-side and otheR low-caRbon ResouRces
Cleared capacity values in the following tables represent all capacity committed by existing resources remaining in the market and all new resources that bid into the auction at or below
the market clearing price Cleared capacity includes ldquoself-suppliedrdquo or ldquoself-scheduledrdquo resources entered into the auction by LSEs However as described in this paper when the monthly billingsettlement process is completed the capacity charges allocated to the LSE will be offset (credited) for the cleared capacity delivered by these resources
Incremental capacity in the tables below reflects 1) new generation resources 2) capacity upgrades to existing generation resources 3) partial offsets to
incremental generation capacity due to capacity de-ratings to existing generation resources 4) new demand response resources 5) upgrades to existing demand response resources and 6) new energy efficiency resources
PJM Results79
PJM has conducted five Base Residual Auctions since its inception in 2007 for delivery years beginning in 20082009 (that each run from June 1 to May 31) Capacity cleared in the PJM auction is defined in terms of ldquounforcedrdquo capacity that is the capacity of a resource adjusted for availability and deliverability based on historical performance (eg forced outages)
Appendix 1
Detailed Results for PJM and ISO-NE Capacity Markets
Table 1 Generation Demand Resources and Energy Efficiency Resources
Offered and Cleared in PJM Base Residual Auctions (Unforced Capacity in MW)
Delivery Year 20082009 20092010 20102011 20112012 20122013
Generation Offered 1311648 1326142 1321248 1360679 1348730
DR Offered 7158 9368 9679 16524 98476
EE Offered - - - - 6527
Total Offered 1318806 1335510 1330927 1377203 1453733
Generation Cleared 1290614 1313389 1312515 1308566 1285274
DR Cleared 5362 8929 9390 13649 70473
EE Cleared 00 00 00 00 5689
Total Cleared 1295976 1322318 1321905 1322215 1361436
Energy efficiency resources were first eligible in the 20122013 auction
79 All information for PJM compiled from ldquo20122013 RPM Base Residual Auction Resultsrdquo at httpwwwpjmcom~mediamarkets-opsrpmrpm-auction-info2012-13-base-residual-auction-report-document-pdfashx
RegulatoRy assistance PRoject
30
Table 2 Incremental Capacity Additions and Reductions in PJM Base Residual Auctions(Installed Capacity in MW)
Delivery Year 20072008 20082009 20092010 20102011 20112012 20122013 Total
Increase inGenerationCapacity 6020 7242 12723 17762 35763 18935 98445
Decrease inGenerationCapacity -6746 -3754 -5502 -3018 -2647 -32539 -54206
Net Increase inDemand ResourceCapacity 5550 5747 2150 287 6617 79381 99732
Net Increasein EnergyEfficiency Capacity 0 0 0 0 0 6323 6323
Net Increasein InstalledCapacity 4824 9235 9371 15031 39733 72100 150294
Note Change in generation capacity is cumulative net increase in demand-side resources is relative to previous yearrsquos Base Residual Auction
Table 3 Breakdown of Incremental Capacity Resource Additionsin PJM Base Residual Auctions (Installed Capacity in MW)
Delivery Year CTGT Combined Diesel Hydro Steam Nuclear Solar Wind Total Cycle (Coal)
New 20072008 187 03 190Capacity 20082009 270 661 931Units 20092010 3995 238 530 4763 20102011 2833 5800 230 1414 10277 20112012 4164 11350 7048 11 752 23325 20122013 4038 5850 78 363 751 11080
Capacity 20072008 470 470From 20082009 1310 1310Reactivated 20092010 0Units 20102011 1600 107 1707 20112012 800 1010 1810 20122013 0
Uprates to 20072008 1145 139 800 2356 920 5360Existing 20082009 1082 340 180 1055 1960 384 5001Capacity 20092010 1522 2060 1625 614 1974 165 7960Resources 20102011 1173 1630 480 892 1603 5778 20112012 3692 1486 574 1868 2921 87 10628 20122013 2312 1643 142 1930 1260 568 7855
Total 28356 30159 2145 3963 20351 9062 11 4398 98445
Note Values represent capacity commitments Nameplate ratings of variable resources (solar and wind) are far larger than shown here
31
the Role of foRwaRd caPacity MaRkets in incReasing deMand-side and otheR low-caRbon ResouRces
Table 4 Changes to Generation Retirement Decisions
Since Reliability Pricing Model Approval (Unforced Capacity in MW)
Generation Resource Decision Changes Capacity Cleared
Withdrawn Deactivation Requests 17987
Postponed or Cancelled Retirement 13029
Reactivation 1752
ToTal 3276 8
Note Unforced capacity cleared in Base Residual Auctions from resources that withdrew their request to deactivate postponed retirement or were reactivated (ie came out of retirement or mothball state)
Table 5 PJM Base Residual Auction Clearing Price
Delivery Year Clearing Prices ($MW-day)
20072008 $4080
20082009 $11192
20092010 $10204
20102011 $17429
20112012 $11000
20122013 $1646
Note Values do not include any locational price adders Simple conversion of $MW-day to $kW-month multiply by 3 and divide by 100
Table 6 Effect of Demand-Side Resources on PJM Market Clearing Price
20122013 Base Residual Auction80
Actual Auction Results Calculated Results Without Demand-Side Resources
Clearing Prices Cleared Unforced Clearing Prices Cleared Unforced Savings
($MW-day) Capacity (MW) ($MW-day) Capacity (MW) ($MW-day)
$1646 1361435 $17878 1335682 $16232
80 Bowring Monitoring Analytics Table 20
RegulatoRy assistance PRoject
32
ISO-NE ResultsISO-NE has held three forward capacity auctions to
date The first auction (FCA 1) in February 2008 was for capacity delivery beginning in June 2010 (20102011 delivery year) The second auction (FCA 2) was held in December 2008 for delivery in 20112012 and the third
Table 7 Summary Results for ISO-NE Capacity Auctions81
Net Installed Total Resources Excess Clearing Net Price Capacity Cleared Capacity Price ($kW-month)82
Requirement (MW) (MW) ($kW-month)
FCA 1 32305 34077 1772 $450 $425
FCA 2 32528 37283 4755 $360 $312
FCA 3 31965 36996 4649 $295 $254
Table 8 Demand-Side Resources Cleared in ISO-NE Capacity Auctions (MW)81
Distributed Distributed Energy Real-Time Demand Real-Time Total Generation- Generation- Efficiency ResponseLoad Emergency Demand-Side Fossil Fuels Renewable Resources Management Generation Resources
FCA 1 46 lt02 655 978 875 2554
FCA 2 93 lt02 890 1195 759 2937
FCA 3 86 07 975 1206 630 2898
auction (FCA 3) was held in October 2009 for delivery in 20122013 ldquoClearedrdquo amounts in these tables include resources from earlier auctions that remain listed as well as new resources less resources that drop out
Note Net Installed Capacity Requirement values exclude the interconnection benefits associated with the Hydro-Queacutebec Phase III interface Excess capacity is not adjusted for Real-Time Emergency Generation in excess of the 600 MW limit Net prices reflect prorating of clearing prices due to excess capacity clearing the auction Simple conversion of $kW-month to $MW-day divide by 3 and multiply by 100
Note Demand-side values are grossed-up for avoided transmission and distribution losses and reserve margin (no reserve margin forFCA 3) Total resources cleared include excess capacity above the Net Installed Capacity Requirement Real-time emergency generation refers to distributed generation whose state air quality permit limits operation to ldquoemergencyrdquo conditions See Appendix 3
81 ISO-NE Forward Capacity Market Results at httpwwwiso-necommarketsothrmkts_datafcmcal_resultsindexhtml
82 Communication with Henry Yoshimura director Demand Resource Strategy ISO-NE March 2009
83 Eric Winkler ISO-New England ldquoThird Regional Energy Efficiency Initiative Meetingrdquo July 7 2009 and ldquoFCA Updaterdquo Demand Response Working Group Meeting Dec 2 2009 Total resources cleared (Capacity Supply Obligation) from Forward Capacity Market Auction Results for the 20102011 20112012 and 20122013 auctions at httpwwwiso-necommarketsothrmkts_datafcmcal_resultsindexhtml
33
the Role of foRwaRd caPacity MaRkets in incReasing deMand-side and otheR low-caRbon ResouRces
Step 1
System Operator (SO) Plans ldquoForwardrdquo for the Region
2012 Projection of Peak Demand = 10000 MW (incl reserves) Each ldquoLoad Serving Entityrdquo (LSE) is obligated for its 50 share
Appendix 2
Illustration of ldquoHow Forward Capacity Markets Workrdquo
SO purchases capacity in 2012 at the 2009 auction clearing price
LSE can be regulated utility or competitive retail supplier
LSE1 5000 MW
LSE2 5000 MW
R1
R1 =3500 MW capacity ldquoSelf Supplyrdquo Resources (LSE1 ownedunder contract)
RegulatoRy assistance PRoject
34
Step 2
The Regional Capacity Auction (3 Years ldquoForwardrdquo)
Step 3
System Operator Pays Cleared Resources at P and Bills LSEs(Note Self-Supply capacity is a ldquowashrdquo)
R1 R2 R3 R4 R5 R6 R7
P
R1
R3
R3
R5
R5
R2
R2
R4
R4
R6
R7
Bid Price = $ per MW-day
Quantity = MW
6500 MW P
Cleared Capacity = 10000
Supply = Capacity Committed ldquoForwardrdquo
P= Clearing price paid to all capacity clearing auction
Demand = SO Forecast of Capacity Requirements
R1-R7 = Capacity offered by Supply-Side (New built Existing Uprates) and Demand-Side (Energy Efficiency Demand Response Distrib Gen) Self-supply (R1) bids in a ldquozerordquo price New Resources set clearing price
LSE1 5000 MW
LSE2 5000 MW
R1
SOSO pays R1 3500 MW P
LSE2 pays its share of regional demand
5000 MW P
LSE1 pays its share of regional demand (5000 MW) adjusted for self-supply R1 for a net payment of 1500MW P
R1 = 3500 MW of ldquoSelf-Supplyrdquo Resources (LSE1 ownedunder contract)
In 2010Total regional peak demand of 10000 MW supplied by R1 + R2 + R3 + R4 + R5 LSE1 and LSE2 are each responsible for 50 of regional peak demand
35
the Role of foRwaRd caPacity MaRkets in incReasing deMand-side and otheR low-caRbon ResouRces
PJM Eligibility Requirements
Eligibility of demand-side resources has changed significantly over the years in PJMrsquos capacity markets In particular it was not until the most recent capacity auction (May 2009) for the
20122013 delivery year that energy efficiency became eligible to bid in PJMrsquos Base Residual Auction PJM is currently considering a tariff change to also allow energy efficiency to bid into incremental auctions
Under PJMrsquos eligibility rules an energy efficiency resource must achieve a ldquopermanentrdquo continuous reduction in electric energy consumption Examples of such a resource include lighting retrofit programs for residential commercial and industrial customers and programs to retrofit buildings with heating and cooling systems that exceed current efficiency standards To be eligible an energy efficiency resource must meet the following criteria
bull It is fully implemented throughout the delivery year without any requirement of notice dispatch or additional customer action
bull It is not reflected as a reduction in the peak load forecast used for the Base Residual Auction for the proposed delivery year
bull It exceeds relevant standards (such as building codes or appliance standards) at the time of commitment
bull It achieves the specified load reduction (expected average demand in MW) during defined summer on-peak hours84
Demand response on the other hand must be dispatchable mdash that is customer demand must be reduced when instructed For example a large supermarket with
coolers and freezers could install load management equipment that would cycle them on or off mdash and bid that demand response capability into the market85 More specifically a demand response resource must meet the following criteria
bull It is able to reduce demand for electricity up to 10 times each year for up to six consecutive hours per interruption during defined periods86
bull It is fully implemented within one hour (short lead time) or two hours (long lead time) of notice from PJM
bull In a year without calls for demand reductions it must demonstrate reliability through a test of reduction capability
bull It is registered in the Emergency Load Response Program and thus available for dispatch during PJM-declared emergency events
bull Compliance and status reports are filed as required
Multiple end-use customers can be aggregated in order to submit a single demand response offer in the capacity auction if those customers share the same curtailment service provider electric distribution company and transmission zone
In addition customer-sited distributed generation may be offered into auctions as a demand resource A hospital for example could offer to run its back-up generator on certain peak demand (eg hot summer) days to reduce its load on the system Or an industrial plant could cut back on production on such days and continue to run its on-site combustion or steam-cycle turbine
Currently energy efficiency resources may participate
Appendix 3
Eligibility Requirements for Demand-Side Resourcesin US Capacity Markets
84 Weekdays excluding holidays June through August between the hours ending 1500 and 1800 Eastern Prevailing Time (EPT)
85 If instead the supermarket replaced the existing coolers and freezers with more energy efficient ones it would bid that proposal in as an energy efficiency resource Or it could do both (replace and cycle) and bid in the capacity from the permanent savings (replacements) as energy efficiency and the dispatchable capacity (the cycling) as demand response
86 Weekdays excluding holidays from 1200 to 2000 EPT May through September and 1400 to 2200 EPT October through April
RegulatoRy assistance PRoject
36
in Base Residual Auctions for up to four consecutive delivery years In effect this means that PJM limits capacity payments for efficiency measures to four years of their measure life (rather than for the full measure life)87 In contrast a demand response resource (including distributed generation) can participate in the PJM capacity market for as long as its ability to reduce demand continues
ISO-NE Eligibility RequirementsSince the inception of ISO-NErsquos forward capacity market
in 2006 energy efficiency has qualified as an eligible demand-side resource ISO-NE defines demand resources as installed measures (products equipment systems services practices and strategies) that result in verifiable reductions in end-use consumption of electricity in the New England power system These are further categorized into ldquopassiverdquo (energy efficiency and non-dispatchable distributed generation) and ldquoactiverdquo (demand response emergency generation and dispatchable distributed generation) resources Passive demand resources are non-dispatchable but permanently reduce energy demand during peak hours Active demand resources are designed to reduce peak loads and to reduce load based on real-time system conditions or ISO-NE instructions Following are descriptions of eligible demand-side resources and performance requirements88
Passive Demand Resourcesbull On-Peak Demand Resources are measures that are
not weather-sensitive and reduce demand across a fixed set of on-peak hours such as energy-efficient commercial lighting and motors89
bull Seasonal Peak Demand Resources are weather-sensitive measures that reduce load during high-demand conditions such as energy-efficient heating and air conditioning systems Seasonal Peak Demand Resources must reduce load when actual system load is equal to 90 percent of the most recent peak load forecast for the applicable summer or winter season
Active Demand Resourcesbull Real-Time Demand Response Resources are
measures including load management and distributed generation that can be dispatched by ISO-NE as needed They must curtail electrical usage within 30 minutes of receiving a dispatch instruction and until receiving a releaserecall dispatch instruction
bull Real-Time Emergency Generation is distributed generation whose state air quality permit limits operation to ldquoemergencyrdquo conditions Generators must curtail the customerrsquos electrical usage within 30 minutes of receiving a dispatch instruction and until receiving a releaserecall dispatch instruction The amount of emergency generation that can be used to meet ISO-NErsquos capacity requirement is limited to 600 MW If the amount of real-time emergency generation that clears the auction exceeds this level payments to generators are reduced on a pro-rated basis All real-time emergency generation is treated as existing capacity
In contrast to PJM all demand-side resources in ISO-NE are eligible to bid capacity for their full measure life an approach that recognizes the full contribution of these resources to regional resource adequacy requirements and adds value to long-lived energy efficiency assets
87 FERC has directed PJM to evaluate the impact of its capacity payment period for energy efficiency resources
88 Eric Winkler and Abimael Santana ISO-NE ldquoNew Demand Resource Qualificationrdquo May 5 2009 at httpwwwiso-necomsupporttrainingcoursesfcmfcm_forum_may_5pdf
89 Summer on-peak hours are 1300 to 1700 non-holiday weekdays in June July and August Winter on-peak hours are 1700 to 1900 non-holiday weekdays in December and January
The Regulatory Assistance Project (RAP) is a global non-profit team of experts that focuses on the long-term economic and environmental sustainability of the power and natural gas sectors providing technical and policy assistance to government officials on a broad range of energy and environmental issues RAP has deep expertise in regulatory and market policies that promote economic efficiency protect the environment ensure system reliability and fairly allocate system benefits among all consumers We have worked extensively in the US since 1992 and in China since 1999 and have assisted governments in nearly every US state and many nations throughout the world RAP is now expanding operations with new programs and offices in Europe and plans to offer similar services in India in 2011 RAP functions as the hub of a network that includes many international experts and is primarily funded by foundations and federal grants
Home office
50 State Street Suite 3Montpelier Vermont 05602
802-223-8199wwwraponlineorg

RegulatoRy assistance PRoject
14
side resources are not identical in these capacity markets they are designed and intended to provide comparable incentives to perform during specified hours35
Currently the key difference in eligibility requirements for demand-side resources in the ISO-NE and PJM capacity auctions is the circumstances under which energy efficiency resources may participate Under PJMrsquos rules energy efficiency resources may participate in Base Residual Auctions only up to four years This means that efficiency measures are limited to receiving compensation for their capacity contribution to four years of their measure life rather than their full measure life Demand response resources (including distributed generation) can participate in the PJM capacity market for as long as their ability to reduce demand continues In contrast all demand-side resources in ISO-NE are eligible to bid capacity for their full measure life an approach that recognizes the
full contribution of these resources to regional resource adequacy requirements and that encourages long-lived energy efficiency assets Further description of eligible demand-side resources and performance requirements in these markets is presented in Appendix 3
Forward Capacity Auction Results
In the following sections we summarize the overall level of capacity cleared from existing and new resources in the PJM and ISO-NE auctions the level of incremental capacity successfully bidding into these markets and how different types of resources have fared to date mdash with particular focus on demand resources More detailed results for the PJM and ISO-NE forward capacity markets are provided in Appendix 1
Some stakeholders claim that demand resources are not as available as generation yet they get paid the same price for capacity (implying that they should receive a lower price) A closer examination of the ISO-NE rules reveals several problems with this generalization In particular generation availability can actually vary quite widely because these resources are excused from performing if they are on scheduled maintenance (eg nuclear plants are paid their full monthly capacity payment even when they are shut down for weeks of re-fueling) And other generation resources are ldquoallocatedrdquo a specific number of hours for annual maintenance and are paid as if they are providing capacity services when they are off-line Demand resources have pre-established hours they must be available and are penalized for performance failures differently than traditional generationmdashsome argue more severely For example a demand resource that fails to perform is assessed a penalty for that month and its capacity value is reduced going forward (for all future months) While it is possible to re-establish the capacity value
through future performance (demand response) or with updated MampV (energy efficiency) the process is a slow one that can take many months or more A generation unit that fails to perform is assessed a penalty for that month but its capacity value is either unchanged or can be reestablished with a test run at anytime and the monthly capacity payments continue with no reduction Generation plants with long notice requirements (eg 24 to 48 hoursrsquo notice for coal-fired plants if the system operator wants them on-line and actually providing energy) are paid the same as a demand response resource that is required to be dispatchable by the system operator within 30 minutes throughout the year to address shortage events (See Appendix 3) Clearly there are individual rules that stakeholders can argue work to the advantage of supply-side over demand-side resources and vice versa Overall the intent of such variations should be to make obligations penalties and payments for demand and supply resources roughly comparable while recognizing the unique operational issues associated with all resources
Performance Incentives Demand- vs Supply-Side Resources
35 Nonetheless there continues to be debate among stakeholders over whether the appropriate balance has been reached See text box
15
the Role of foRwaRd caPacity MaRkets in incReasing deMand-side and otheR low-caRbon ResouRces
Auction Results for PJM36
PJM has held five Base Residual Auctions including the most recent May 2009 auction for the 20122013 delivery year PJM serves a large market The 20122013 Base Residual Auction cleared a total of 1361436 MW of capacity While generating resources account for nearly all of this committed capacity (1285274 MW) demand response resources (including distributed generation) represent 5 percent of the total (70472 MW) New for the 20122013 delivery year 5689 MW of energy efficiency also cleared the market Table 1 in Appendix 1 lists capacity resources offered and cleared to date As indicated in that table the vast majority of demand-side resources offered into the market cleared each PJM base residual auction
Figure 4 below illustrates the increasing role of demand-side resources in PJM
Renewable generating resources also are gaining some traction in the capacity market although not anywhere near the magnitude of demand-side resources in terms of their overall contribution to resource adequacy requirements This is due to the predominance of wind resources and their variable nature PJM applies a 13 percent on-peak capacity factor to these resources mdash for every 100 MW of wind resources only 13 MW are eligible to meet capacity requirements Some 3234 MW of wind capacity resources cleared in the most recent Base Residual Auction mdash 95 percent of the amount offered While this capacity level is miniscule compared to the total capacity clearing the auction it translates to a large nameplate rating mdash 2488
12000
10000
8000
6000
4000
2000
0
Active Load Management
Prior to RPMImplementation RPM Implemented
Interruptible Load for Reliability
Energy Efficiency RPM Offered Demand Response
Figure 4 Demand-side Participation in PJMrsquos Reliability Pricing Model (RPM) Auctions
Note Demand-side resources included Active Load Management prior to the 20072008 delivery year Interruptible Load for Reliability and Demand Response were first eligible for the 20072008 delivery year Energy Efficiency resources were first eligible for the 20122013 delivery year (May 2009 auction) The large increase in demand response participation in the 20122013 delivery year is in large part due to the elimination of PJMrsquos ILR program
200506 200607 200708 200809 200910 201011 201112 201213
36 Except where noted information and figures in this section and referenced tables in Appendix 1 are from PJM ldquo20122013 RPM Base Residual Auction Resultsrdquo at httpwwwpjmcom~mediamarkets-opsrpmrpm-auction-info2012-13-base-residual-auction-report-document-pdfashx
RegulatoRy assistance PRoject
16
MW of wind resourcesPJM reports that the Base Residual Auctions have
attracted 150294 MW of incremental capacity in the region to date Incremental capacity refers to new generation resources capacity upgrades to existing generation resources new demand response resources upgrades to existing demand response resources and new energy efficiency resources37 Natural gas- and coal-fired plants account for most of the incremental capacity with nuclear plants (from uprates) also making a sizable contribution Tables 2 and 3 in Appendix 1 provide details on the incremental capacity procured It is important to note that the figures in these tables represent resources new to the capacity market including uprates mdash not all are newly built However they include a new merchant coal plant built for the PJM market38
True to one of the original goals the PJM capacity market also has been successful in retaining existing capacity from power plants that were originally under high-cost reliability must-run agreements39 Since FERC approved the Reliability Pricing Model existing capacity that would otherwise have been deactivated or retired has accounted for 32768 MW of procured capacity Table 4 in Appendix 1 shows these changes in resource deactivation and retirement
Market clearing prices for resources in PJMrsquos Base Residual Auctions to date have ranged from $1646 to $17429 per MW-day not including any locational price adders for constrained areas (See Table 5 in Appendix 1) Importantly the $1646MW-day clearing price for the 20122013 delivery year represents a decrease of $9354MW-day from the previous Base Residual Auction due in part to significant increases in capacity from demand response and the introduction of energy efficiency resources into the bidding process Moreover the participation of demand-side resources is estimated to have reduced the market clearing price for the 20122013 delivery year by an astonishing $16232MW-day in unconstrained zones (ie from a clearing price of $17878MW-day without these resources in the bid stack to the actual clearing price
of $1646MW-day) Table 6 in Appendix 1 shows the calculation by PJMrsquos independent market monitor
Auction Results for ISO-NE
ISO-NErsquos forward capacity market is about a quarter of the size of the PJM capacity market mdash the Installed Capacity Requirement set by ISO-NE for the 20122013 delivery year was 31965 MW ISO-NE has held three forward capacity auctions to date and all of them cleared at the administratively set floor price ($450kW-month $360kW-month and $295kW-month respectively) with surplus capacity above the Installed Capacity Requirement set by ISO-NE to meet reliability needs The first auction secured 1772 MW above the requirement the second auction cleared 4755 MW of excess capacity and the third auction cleared 4649 MW of excess capacity (See Table 7 in Appendix 1)
Demand resources have consistently represented about 8 percent of the resources cleared in the three auctions (2554 MW 2937 MW and 2898 MW respectively) an amount that exceeded expectations Energy efficiency accounted for about a quarter of the demand resources in the first auction and about a third in more recent auctions Real-time demand response comprises the largest share of demand resources Emergency generation (ie distributed generation whose state air quality permit limits operation to ldquoemergencyrdquo conditions) also makes a sizeable contribution Non-emergency distributed generation however comprises a negligible amount of the total Table 8 in Appendix 1 shows detailed results for demand resources
Figure 5 shows the growth in demand resources offered and cleared in the first two ISO-NE auctions by type There has been a steady growth in demand-side resources in New England since the first demand-response programs operated by ISO-NE The forward capacity auctions have contributed to and solidified these gains
Participation of demand-side resources in the ISO-NE forward capacity auction has been credited with making the clearing price lower than it would have been otherwise
37 The increase is partially offset by capacity de-ratings to existing generation resources
38 See Pfeifenberger et al at 27
39 As discussed above these contracts have not been dispensed with altogether however
17
the Role of foRwaRd caPacity MaRkets in incReasing deMand-side and otheR low-caRbon ResouRces
as it has in the PJM region Analysis of the first auction bids for example suggests that the participation of these resources saved ratepayers as much as $280 million by lowering the price paid to all capacity resources in the market40
Moreover by contributing to the excess capacity that kept capacity payments at relatively low floor prices in New England the participation of demand-side resources has
also contributed to lower overall market revenues inducing some inefficient oil-fired generating units to shut down at least temporarily Nonetheless existing and new fossil-fuel resources continue to dominate the capacity commitments in this region as is the case for PJM
Overall renewable generating resources (primarily wind resources) are making some headway in the regionrsquos forward capacity market but as in PJM they are not
40 See Cheryl Jenkins et al This calculation reflects what the market clearing price would have been in the auction given the Installed Capacity Requirement put out to bid by the system operator which assumes no impact of energy efficiency programs on loads (because energy efficiency is bidding) Therefore the calculated reduction in clearing price represents a theoretical maximum mdash excluding demand resources from the market would likely have been at least partially offset by a lower amount of capacity put out to bid As a result the difference in the market clearing price (and savings to consumers) would likely have been smaller than the number calculated here although it is difficult to say by how much However even if demand-side resources were not permitted to bid they would contribute to lower prices for consumers by lowering the total quantity of capacity required
41 Internal Market Monitoring Unit ISO-NE June 5 2009
4500
4000
3500
3000
2500
2000
1500
1000
500
0
New UnclearedTotal Uncleared1375 MW
Total Uncleared1159 MW
Total Cleared2279 MW
Total Cleared2778 MW
New Cleared
Existing Delisted Uncleared
Existing Cleared
FCA 1 FCA 1
Figure 5 Demand-Side Participation in ISO-NE Capacity Auctions by Type41
copy ISO New England Inc
Note Activerdquo resources include demand response and emergency generation energy efficiency is considered a ldquopassiverdquo resource Clearing amounts reflect ISO-NErsquos maximum limit of 600 MW of Real-Time Emergency Generation In contrast Table 8 in Appendix 1 shows the actual amount of such resources that cleared the auction Capacity payments to these resources are pro-rated if cleared levels exceed 600 MW
Cap
acit
y (M
W)
Active
Active
Active
Active
Active
Active
Active
Active
Passive
Passive
Passive
Passive
Passive
RegulatoRy assistance PRoject
18
a major contributor to the regionrsquos resource adequacy requirements at this time In the most recent (third) auction 166 MW of wind capacity cleared the auction mdash with a nameplate rating an order of magnitude larger42
Unlike PJM ISO-NE does not apply a deemed on-peak capacity factor to wind and other variable generation resources Instead all such resources must provide data that demonstrate the claimed summer and winter qualified capacity The capacity factor is adjusted over time based on actual performance during specified hours
Forward Capacity Markets in the Context of Carbon Constraints
Power market rules are not constructed in a vacuum rather they are designed to address specific public policy goals As described above forward capacity markets in the US were developed to ensure resource adequacy in the power system at a reasonably competitive price In the face of growing carbon constraints however power market rules need to be redesigned to work in concert with carbon reduction goals and policies rather than at cross purposes The challenge of substantially de-carbonizing the power sector in the coming years is too great to ignore this interaction In particular policymakers should carefully consider what elements of the current planning and procurement process to achieve resource adequacy contribute to the following effects ndash and then work to revise the market rules accordingly
bull Do the market rules encourage new investments in high-emitting resources (including repowering) at the expense of low-carbon alternatives
bull Do they encourage the continued (or increased) operation of existing high-emitting power plants
bull Will they result in a build-out of capacity and cumulative emissions that conflict with the level of de-carbonization required in the power sector mdash or make attainment of that level more costly to the economy
This paper is not intended to evaluate the PJM and ISO-NE capacity markets and auction rules in any depth with respect to these issues However we offer below general observations based on the auction design and results to date in these regions and other studies Following that we provide policy recommendations related design options and additional actions for consideration
General Observations on Forward Capacity Markets and Results
Based on our review of FCM auctions to date and related studies we offer the following observations
bull The ISO-NE and PJM forward capacity markets are meeting their resource adequacy objectives Sufficient levels of capacity have cleared the market to meet each regionrsquos anticipated peak demand and adequate resources are now committed on a forward basis to ensure reliable coverage in future years (up to the 20122013 delivery year) But in a carbon-constrained world the mix of resources is as important as the quantity in both the short-term and the long-term Most resources that are available during peak demand hours also produce electricity or reduce consumption during many more (or all) hours of the year and the carbon intensity of that mix of resources will drive the level of cumulative emissions in the power sector43 As discussed in this paper capacity markets as currently designed provide compensation based on the level of available capacity not the mix of resources providing that capacity It is worth repeating here that the only (non-price) attribute a resource needs to demonstrate for resource adequacy purposes is that it will be available when called upon during the projected hours of peak system loads In a carbon-constrained world policy makers should ask whether the planning and procurement process for acquiring a sufficient level of capacity at a reasonable price is also moving the resource mix in the right direction mdash towards zero or low carbon-emitting demand- and supply-side resources
42 Compiled from auction results at httpwwwiso-necommarketsothrmkts_datafcmcal_resultsccp13fca13indexhtml
43 With the exception of gas-fired peaking units or demand response resources that are dispatched to meet (or reduce) loads only during peak system hours
19
the Role of foRwaRd caPacity MaRkets in incReasing deMand-side and otheR low-caRbon ResouRces
bull Expressly designing demand-side resources into forward capacity markets appears key to achieving all three objectives ndash resource adequacy low-carbon resource mix and reasonable price Energy efficiency and demand response resources are faring well in auction-based capacity markets mdash and this is a positive outcome for several reasons First energy efficiency and other demand-side resources can substitute for existing and planned generation that have a higher carbon footprint thereby reinforcing carbon reduction policies and targets for the region Second demand-side resources can dramatically reduce the costs of meeting the regionrsquos resource adequacy requirements mdash as evidenced by the results of the PJM and ISO-NE auctions In addition the increase in demand-side resources facilitated by capacity auctions can reduce market power because more suppliers and more resources means individual generators have less ability to affect bid offers and clearing prices And because demand-side resources lighten the load at the end of the supplydelivery chain they enhance the reliability of each link in the chain from fuel supply and generation to the local distribution network
bull Differences in the impact of demand-side resources on carbon emissions should be recognized in capacity markets and associated auction rules Energy efficiency decreases carbon emissions because (by definition) it reduces energy use for an equivalent level of service and at the margin almost all power systems are running higher carbon resources In contrast the net impact of demand response on carbon emissions will depend upon specific circumstances including the mix of
plants serving loads at the margin For example when coal is primarily serving baseload and intermediate needs emissions may increase when customers shift loads from on-peak (when natural gas is on the margin) to off-peak periods44 Elsewhere however demand response mdash including any conservation side-effect mdash may reduce emissions from less efficient peaking plants In addition demand response includes real-time emergency generation which is often fossil-fuel powered (eg by diesel or natural gas) Any analysis of the costs and benefits of demand response resources in capacity markets should account for such effects Policies and market rules for demand response should be aligned with its environmental costs and benefits45
bull Renewable generating resources are beginning to make some headway in forward capacity markets mdash in particular wind resources This is in large part because the markets described here recognize some capacity value for variable renewable resources (wind solar and run-of-river hydro) either through a deemed on-peak capacity factor or a demonstration of claimed capacity for specified on-peak periods Policymakers need to pay attention to how these values are established so they can be confident the committed capacity will be available when called on while at the same time encouraging participation of all low-carbon resources in the market More generally as renewable resources become a more significant part of the resource mix a forward capacity market creates the opportunity to recognize their aggregate capacity value to the system46
44 For example PJM recently released figures on carbon emissions of generating units that operate on the margin during on-peak vs off-peak hours See httpwwwpjmcom~mediaabout-pjmnewsroom2010-releases20100325-pjm-reports-new-carbon-dioxide-emissions-dataashx and httpwwwpjmcomdocuments~mediadocumentsreportsco2-emissions-reportashx
45 See section 316 and Mechanism E in Attachment 1 of Pacific Northwest National Laboratory The Smart Grid An Estimate of the Energy and CO2 Benefits January 2010 (PNNL 19112) at httpenergyenvironmentpnlgovnewspdfPNNL-19112_Revision_1_Finalpdf
46 Variable renewable resources will qualify for higher capacity value if they are bundled with other resources for reliability (eg demand response hydroelectric dams or energy storage) In addition confidence in the capacity value of variable resources increases as their geographic diversity on the system increases See for example the report on the Eastern Wind Integration and Transmission Study at httpwwwnrelgovwindsystemsintegrationpdfs2010ewits_final_reportpdf
RegulatoRy assistance PRoject
20
bull Nonetheless renewable resources are hard-pressed to successfully compete with the thousands of megawatts of existing and new fossil-fuel resources participating in these auctions that are able to bid below the true societal cost of their operations under current market rules In fact capacity auctions as currently designed can breathe new economic life into high carbon-emitting plants that were previously planned for significantly reduced operations or retirement Along with new capacity from fossil-fuel generation allowing such a large amount of existing capacity from high carbon emitters to clear the auction is likely to crowd out renewable resources that are able to address resource adequacy requirements equally well Such results may not represent an ldquoefficientrdquo (or desirable) outcome for a carbon-constrained power sector This is especially true where the carbon costs of a fossil-fuel plant are not fully recognized in the energy market that plant also will be bidding into
The Electric Power Research Institute modeled the effect of various levels of carbon taxes or allowance prices in the upper Midwest (coal-dependent) and in Texas (heavily reliant on natural gas) The study found that close to a doubling of the wholesale prices of electricity in the Midwest region (through carbon-related charges) would produce only a 4 percent reduction in regional emissions given the current generation mix Similar results were observed for Texas where natural gas plants are on the margin49 And in the Northeastern US due to initially low carbon prices and a host of factors that dampen the price signal the Regional Greenhouse Gas Initiative (RGGI) has not yet resulted in generator operational changes50 One of those dampening factors is the single clearing price that is typically set through wholesale energy markets mdash which dilutes the market signal sent by a price on carbon emissions by allowing fossil-fueled plants to recover
most or all of their allowance costs through higher clearing prices reflecting the cost of allowances51
Studies also have shown that the price of carbon must rise (and be maintained) at very high levels to obtain sufficient market pull for the level of new investments in clean generation required For example a recent analysis in California concluded that it would take a carbon price of $100 per tonne52 to make economic investments in renewable resources compared to fossil fuel-fired generation in order to reach carbon reduction targets in the power sector beyond what current state requirements will achieve53 Further price signals may be diluted if a portion of the carbon allowances are allocated in a manner that shields high-emitting power plants from carbon costs or if high-emitters located outside the capped region can sell into the market on a long-term basis
Carbon Pricing Alone Is Insufficient to De-carbonize the Generation Mix
bull A market price for capacity or energy that favors the construction and operation of high carbon-emitting resources over clean resources will lead to increases mdash rather than reductions mdash in the cumulative level of carbon emissions in the power sector A carbon tax or carbon cap-and-trade regime internalizes some or all of the otherwise un-priced carbon costs of electricity production and would improve the relative economics of clean resources in both forward capacity and energy markets However carbon pricing alone may be insufficient to change the dispatch of existing high-emitting power plants or their ability to clear these capacity markets (and be paid additional revenues as a result) in such overwhelming numbers47 In fact the very modest impact of carbon pricing on the performance of fossil-fuel plants has been documented in several reports48 (See text box below)
47 With or without carbon prices policymakers also might want to consider the implications of paying existing power plants the market clearing price for capacity mdash and the potential windfall profits for plant owners mdash for making no changes in plant operations See for example Ezra Hausman Paul Peterson David White and Bruce Biewald Synapse Energy Economics Inc RPM 2006 Windfall Profits for Existing Base Load Units in PJM An Update of Two Case Studies Feb 2 2006 at wwwsynapse-energycom
21
the Role of foRwaRd caPacity MaRkets in incReasing deMand-side and otheR low-caRbon ResouRces
bull Carbon pricing alone will have limited impact on consumer decisions to invest in permanently reducing their peak demand by making cost-effective investments in energy efficiency Well-designed time-varying pricing options can successfully shift demand from high-price hours to lower price hours54 Such shifting also reduces peak demand on transmission and distribution systems Overall energy use will decline somewhat in response to price But long-term reduction in energy use due to price increases is relatively small The numerous market barriers to capturing the full cost-effective potential of energy efficiency ndash through improvements in building construction practices and industrial processes retrofits of existing buildings and installations of high-efficiency appliances and equipment in homes and businesses ndash are well-documented They include lack of information high first-costs consumersrsquo high discount rates and the landlord-tenant split incentive problem among others55 Recent empirical analysis of demand elasticities suggests that the long-term price elasticity of demand for electricity is even lower than earlier studies have indicated for both liberalized and regulated markets (See text box on page 21)
In sum while forward capacity markets are meeting their resource adequacy objectives and clearing an impressive amount of clean low cost demand-side resources on balance these markets (as currently designed) are not working sufficiently in concert with carbon reduction goals and policies in the face of growing carbon constraints For the reasons discussed above carbon pricing alone
48 See Testimony of Richard Cowart Regulatory Assistance Project Before the Committee on Energy and Commerce Subcommittee on Energy and Environment US House of Representatives April 23 2009 ldquoThe Consumer Allocation for Efficiency How Allowance Allocations Can Protect Consumers Mobilize Efficiency and Contain the Costs of GHG Reductionrdquo at httpenergycommercehousegovPress_11120090423testimony_cowartpdf
49 See Victor Niemeyer ldquoThe Change in Profit Climate How Will Carbon-Emissions Policies Affect the Generation Fleetrdquo Public Utilities Fortnightly May 2007 at 20 24
50 See ldquoRGGI marks its first year with success and lesson on effect of market pressurerdquo Electric Utility Week Dec 14 2009 Ten Northeast and Mid-Atlantic states participate in RGGI the first mandatory cap-and-trade program in the US Connecticut Delaware Maine Maryland Massachusetts New Hampshire New Jersey New York Rhode Island and Vermont Nine of them participate in either the ISO-NE or PJM forward capacity markets described in this paper
51 PJM Interconnection ldquoPotential Effects of Proposed Climate Change Policies on PJMrsquos Energy Marketrdquo Jan 23 2009 p 5 See also ldquoBecause Thatrsquos Where the Money Is The FERCrsquos Ability to Reduce the Cost of Slowing Global Warmingrdquo Samuel A Wolfe Chief Counsel New Jersey Board of Public Utilities December 2009 at httpwwwnarucorgpublicationsWOLFE-20Panel203pdf
Demand for Power Is Relatively Price-Insensitive mdash Even Over the Long Term
Modeling by the US Department of Energy suggests that a 10 percent increase in power prices will reduce demand for electricity by just 25 percent to 3 percent over 20 years assuming that the price effects persist over that entire period56 This would only offset the normally expected US load growth in two out of those 20 years57
More recently a 2009 empirical analysis of the demand for electricity in the US concludes that price elasticity of residential demand has actually decreased since retail price deregulation was first introduced in the US The results suggest that a 10 percent increase in power prices will reduce residential electricity demand more on the order of 12 percent to 17 percent based on 2001-2008 data for both deregulated and regulated states58 Price responsiveness is further dampened by the income-elasticity of demand which is positively correlated with consumption As incomes increase consumption of electricity goes up and the conservation impact of any price increase is diminished59 The equivalent historical figure for a 10 percent increase in power prices in the UK residential sector is -23 percent but the income-elasticity is such that a 10 percent increase in income results in an increase of demand of 34 percent ndash ie household income is just as important as energy price in determining energy demand60
RegulatoRy assistance PRoject
22
is unlikely to shift the power sector resource mix at the pace or scale required to meet aggressive carbon reduction targets ndash or correspondingly to substantially change the dominance of high-carbon resources clearing forward capacity auctions under current market rules An increasing number of studies makes a compelling case that our economy and our society cannot afford this dominance to persist much longer if we are to contain climate change to a livable level In fact close to full de-carbonization of the
power sector is being discussed in international forums as the only way to meet essential carbon reduction targets by 205061 While capacity markets alone are unlikely to support the full value of clean energy resources in a carbon-constrained power sector by themselves with appropriate design elements they can serve to reinforce actions taken at federal regional and state levels that provide larger and longer lasting commitments to clean demand-side and renewable resources62
52 A tonne or metric ton is a unit of mass equal to 1000 kilograms (roughly 2205 pounds) or approximately the mass of one cubic meter of water at four degrees Celsius A tonne is not the same as either a ldquoshortrdquo ton (2000 pounds) or a ldquolongrdquo ton (2240 pounds)
53 Energy and Environmental Economics Inc Greenhouse Gas Modeling of Californiarsquos Electricity Sector to 2020 Updated Results of the GHG Calculator Version 3 prepared for the California Public Utilities Commission October 2009 pp 66-67 at httpwwwethreecomdocumentsGHG_102209CPUC_GHG_Final_Report_28Oct09pdf
54 Ahmad Faruqui and Sanem Sergici The Brattle Group ldquoHousehold Response to Dynamic Pricing of Electricity A Survey of the Experimental Evidencerdquo Jan 10 2009 at httpwwwhksharvardeduhepgPapers2009The20Power20of20Experimentation20_01-11-09_pdf
55 See for example American Council for an Energy Efficient Economy ldquoQuantifying the Effects of Market Failures in the End-Use of Energyrdquo pp iii-vi 2007 at httpoldaceeeorgenergyIEAmarketbarrierspdf This study details the various types of market barriers to end-use energy efficiency and reports that up to 50 percent of residential energy use in the US is affected by such barriers
56 The US Department of Energyrsquos National Energy Modeling System (NEMS) has price elasticity built into it The long-run elasticity (assuming price effects remain for 20 years) are ndash031 for residential electric use and ndash025 for commercial electric use See Steven H Wade ldquoPrice Responsiveness in the NEMS Buildings Sector Modelrdquo in Energy Information Administrationrsquos Issues in Midterm Analysis and Forecasting 1999 pp 55 58 table 1 at httpwwweiadoegovoiafissuespdf060799pdf
57 This would require a much larger rate increase just to offset expected load growth over 20 years let alone to reduce demand sufficiently to permit absolute reductions in emissions from the nationrsquos huge generation fleet See Testimony of Richard Cowart
58 T Nakajima and S Hamori ldquoChange in Consumer Sensitivity to Electricity Prices in Response to Retail Deregulation A Panel Empirical Analysis of the Residential Demand for Electricity in the United Statesrdquo Energy Policy (2010) available at wwwsciencedirectcom
59 Ibid
60 John Dimitropoulas Lester C Hunt and Gary Judge ldquoEstimating Underlying Energy Demand Trends Using UK Annual Datardquo at httpuserwebportacuk~judgegAEL_04pdf
61 See for example Meeting Carbon Budgets ndash The Need for a Step Change Progress Report to Parliament Committee on Climate Change October 2009 at httpwwwthecccorgukreportsprogressreports Christopher Jones and Jean-Michel Glachant Why and How the European Union Can Get a (Near to) Carbon-Free Energy System in 2050 MIT Center for Energy and Environmental Policy March 2010 at httpdownloadsthecccorgukdocs2166720CCC20Executive20Summary20AW20v4pdf Roadmap 2050 A practical guide to a prosperous low-carbon Europe The European Climate Foundation April 2010 at wwwroadmap2050eu
62 Without such policies it is unlikely that even RGGIrsquos modest carbon reduction goals will be achieved See Paul Peterson Doug Hurley and David White Synapse Energy Economics Inc ISO New England Scenario Analysis Companion Report Constructing a Future That Meets Regional Goals Aug 8 2007 at wwwsynapse-energycom
23
the Role of foRwaRd caPacity MaRkets in incReasing deMand-side and otheR low-caRbon ResouRces
ISO-NE Rules for Emergency Generators Advance Environmental Goals
Emergency (ldquobackuprdquo) generators typically are diesel-fired and states in New England and elsewhere in the US have restricted the number of hours and days they may be operated through the state permitting process At the time the first regional demand response tariffs were being designed in New England a collaborative of energy regulators environmental regulators the ISO utilities and other stakeholders realized that active demand response programs could lead to substantial incentives for diesel-fired backup generators to operate more often when air quality was at its worst Regulators and the ISO proposed a rule limiting those generators to run for reliability purposes during system emergencies This is a concrete example of reliability rules being written to advance environmental goals as well as power system needs63 In addition a regional working group developed model emissions standards for small generators for statesrsquo consideration64
To reinforce regional air quality policies and goals ISO-NE limits the total amount of emergency generators in the regional capacity market to 600 MW To the extent any excess amount clears the auction capacity payments to these resources are pro-rated
63 See Cowart and Raab p 26
64 See Model Regulations for the Output of Specified Air Emissions From Smaller Scale Electric Generation Resources Oct 31 2002 at httpwwwraponlineorgshowpdfaspPDF_URL=22docsrap_issuesletter-outputbasedemissioninsert_2003_07pdf22
65 Edward S Rubin Carnegie Mellon University ldquoA Performance Standards Approach to Reducing CO2 Emissions for Electric Power Plantsrdquo June 2009 at httpwwwpewclimateorgpublicationsreportcoal-initiative-series-performance-standards-approach-reducing-co2-emissions-ele Also see Chris Simpson and Brenda Hausauer ldquoEmissions Performance Standards in Selected Statesrdquo Regulatory Assistance Project Research Brief November 2009 at httpwwwraponlineorgdocsRAP_Simpson_EPSResearchBrief_2009_11_13pdf
Policy Recommendations and Auction Design Options
We present below recommendations and a menu of auction design options for forward capacity markets that support and enhance carbon policies and carbon reduction targets
bull Power market rules should be constructed to recognize and limit the adverse environmental consequences of power generation The power system and the environment are inextricably linked Explicit consideration of environmental costs and benefits of various electricity resources is not only reasonable but necessary to meet the enormous challenge of climate change
bull Forward capacity markets should reinforce carbon reduction policies which could be accomplished by incorporating one or more of the following into the auction rules
Auction rules could apply an Emissions Performance Standard (EPS) to promote capacity commitments from low-carbon resources and discourage bids from high-emitting power plants An EPS can be expressed as a maximum level of greenhouse gas emissions per unit of electrical output or as a percentage reduction in (annual) plant emissions It can vary with fuel type and incorporate other design variations65 It may be appropriate to adopt an EPS mdash within the auction qualification rules or by regulation mdash particularly if current market signals are not sufficiently
discouraging new construction or repowering of high-emitting generating resources with long lifetimes while forward capacity markets are providing a new revenue stream to keep them running
RegulatoRy assistance PRoject
24
Auction rules could disqualify inefficient generators from participating (and from receiving capacity revenue) or more generally require their retirement through financial incentives regulations or both66 Since 2007 China has been phasing out such plants and intends to retire approximately 50 gigawatts (GW) of small inefficient coal-fired power plants nationwide and 7 GW to 10 GW of small natural gas-fired units as well as halt construction of small inefficient power plants The policy is being put in place three ways the direct rescission of operating permits the transfer of generation rights and price reductions
Capacity payments could vary by the emissions rate of the resource Instead of one price paid to all generation that clears the auction adders could be applied to payments for low-emitting units and deductions could be applied to high-emitting units67 For example a sliding-scale percentage reduction to the per-unit ($kW-month or $MW-day) clearing price could be established based on the average annualized carbon footprint of fossil-fuel resources whereas a price adder above the clearing price could be established for zero-emitting resources
Imputed ldquocarbon addersrdquo could help curtail high-emitting resources Carbon adders are imputed costs that reflect at least a portion of the societal cost of emissions They are generally
used in the context of resource planning and acquisition by a regulated LSE mdash as a way of ensuring that high-carbon risks and low-carbon alternatives are properly valued in the resource selection process But these imputed costs do not get passed on to ratepayers or consumers for every unit of power consumed in contrast to carbon pricing68 Similarly the rules in a forward capacity market could be modified so that carbon adders are applied in determining what resources clear the auction (and will receive the market clearing price for their capacity commitment)
A ldquozero-carbon resource portfolio standardrdquo could establish auctions for separate tranches of resources by emissions level For example one tranche could include energy efficiency and renewable resources The size of each tranche would be based on carbon reduction goals for the region The higher the goals the larger the tranche for energy efficiency and renewable resources These resources decrease carbon emissions because at the margin most power systems are running higher carbon resources
bull Policymakers should consider a longer price commitment in forward capacity markets mdash at least for low-carbon resources The contract period for new capacity in these markets is short (one year in PJM up to five years in ISO-NE) in part so there is greater certainty over forecasts of resource needs for system reliability (to mitigate the risk of over-supply)
66 Small and old coal plants are the most inefficient and polluting both in terms of greenhouse gases and particulate matter By some estimates 50 MW plants may use as much as 200 grams more per unit of electricity output than a plant larger than 300 MW See Frederick Weston Rebecca A Schultz David Moskovitz and Max Dupuy Regulatory Assistance Project ldquoChinarsquos Climate Change Initiatives Do new policies adopted in China offer any guidance for the transformation of the US power sector in a carbon-constrained worldrdquo November 2009 at httpwwwraponlineorgdocsRAP_China20Climate20Initiatives_NARUC_2009_11_01docx
67 See N Jonathan Peress and Kenneth A Colburn ldquoElectrical Connections Aligning Capacity Market Changes With RGGI in the Northeastrdquo Discussion Draft March 2005 at httpwwwpucnhgovEPABSymbiotic202005-03-1820Peress-Colburn20Letter20to20FERC-Woodpdf
68 Both high carbon resources and low carbon resources clearing in power markets (characterized by single-price auctions) are paid the same price So whenever fossil resources are on the margin (most of the time in most places) consumers are seeing the same price for both fossil and clean resources and the cost of carbon allowances (or carbon taxes) for that marginal resource is reflected in the clearing price for all power bought in the market Carbon adders on the other hand are not actually paid to any resource or reflected in prices for all units sold in the market
25
the Role of foRwaRd caPacity MaRkets in incReasing deMand-side and otheR low-caRbon ResouRces
Auction winners can generally participate in future auctions and receive the market clearing price but have no assurance of future prices Moreover under current rules in PJM energy efficiency resources cannot receive capacity payments over the full life of the measures mdash only for four consecutive delivery years This constraint puts energy efficiency on a different footing than other demand resources mdash as well as all supply-side resources mdash which are paid for their capacity as long as they provide the benefit
The short commitment period and lack of price certainty may not provide market signals that are strong and consistent enough to ensure sufficient new generation or encourage plant operators and investors to make efficient choices for the long-term mdash even where carbon prices are expected to increase substantially in the future due to a dramatically declining carbon cap or a high carbon tax Allowing clean resources to opt for a longer period of time over which the price is known would in particular facilitate renewable resources whose typically high upfront capital costs and low operating costs mdash compared to natural gas-fired plants in particular mdash may require such a long-term commitment to procure financing69 Another option might be to establish fixed floor prices for clean energy resources for a long-term period to provide assurance of a minimum revenue stream
bull Regional load forecasting should be reviewed for treatment of demand-side resources acquired outside the capacity market In particular the system operator determines the capacity that will be auctioned for each delivery year (three years hence) based on a 10-year load forecast which is updated on
an annual basis Under the current planning process in forward capacity markets this forecast only reflects the demand-side resources that have cleared in prior auctions The system operatorrsquos load projections do not take into consideration any load reductions from demand-side resources procured outside of the auction such as energy efficiency programs that LSEs have committed (or are obligated) to fund and implement in the coming one to three years or beyond70 If the magnitude of these load reductions is substantial the ISO may be systematically overstating the level of capacity put out to bid for each delivery year Depending upon the existing mix of resources and market conditions in the region this overstatement may have a sizeable impact not only on the level of cleared capacity and the market price but on the resulting resource mix and level of carbon emissions as well
Additional Actions
Careful design of the planning process and auctions undertaken through forward capacity markets can help to ensure that they reinforce and do not work at cross purposes with climate reduction goals and targets However forward capacity market signals (capacity prices) are only one component of a market and regulatory landscape that affects investment and operating decisions in the power sector Market rules and procurement policies that affect system energy requirements ndash as well as policies and regulations that affect access location and cost recovery for transmission and distribution facilities ndash have an enormous impact on both the short- and long-term resource mix
It is beyond the scope of this paper to fully explore how
69 LSEs in PJM and ISO-NE can contract for generating resources through the bilateral market to hedge energy and capacity costs and to meet renewable energy standards Renewable resource projects that successfully negotiate such contracts if they are long term may not need a long-term commitment in the forward capacity market Still a short-term capacity payment stream with uncertain prices thereafter weakens the ability of renewable resources to secure long-term financing
70 Some of the econometric models that the system operators use for their load forecasts may capture the impacts of federal appliance standards and building codes However to our knowledge there has been no explicit accounting to date for the impacts of state and utility energy efficiency programs where the capacity is not bid into the auctions
RegulatoRy assistance PRoject
26
market rules and other policies and regulations can be harmonized and strengthened to meet customersrsquo energy needs reliably in a carbon-constrained world Larger and longer lasting commitments to demand-side and renewable resources are certainly needed to ensure a mix of resources that will significantly reduce greenhouse gas emissions in the power sector This has been the conclusion of US policymakers who have put in place additional policies to facilitate long-term acquisition of low-carbon resources in regions that operate both forward capacity markets and a cap-and-trade program (under RGGI)71
bull States have adopted a variety of mechanisms for sustained and aggressive energy efficiency programs
bull Strong building codes and equipment standards
bull Stable funding through a system benefit charge
bull Third-party administration of programs or where the utility is the efficiency portfolio manager decoupling of utility profits from revenues financial incentives for shareholders or both
bull Recycling of carbon auction proceeds into energy efficiency investments
bull Some states require long-term resource plans or resource procurement plans that must include energy efficiency Therersquos renewed interest in long-term planning and procurement particularly for demand-side and renewable resources following a period
where these efforts were largely abandoned with electric industry restructuring and development of organized markets72
bull Several states have adopted energy efficiency resource standards that require achievement of specified energy-saving targets73
bull Most of the states have renewable energy standards74 and several states require long-term contracting of renewable resources to meet the standards75
bull Connecticut Maryland Pennsylvania and Rhode Island require contract terms of 10 years or longer
bull New York requires central procurement of renewable energy credits by a state agency under long-term contract Illinois is likely to acquire long-term contracts for renewable resources under its central procurement mandate
bull Massachusettsrsquo Green Power Partnership purchases renewable energy credits for up to 10 years using its renewable energy fund
These are just examples and certainly not an exhaustive list of the ways in which careful design of forward capacity markets coupled with additional policies at the federal regional and state level can serve to reinforce both resource adequacy requirements and carbon reduction goals
71 Regulatory Assistance Project policy grids summarize state-by-state requirements for resource planning and energy efficiency at httpwwwraponlineorgFeatureaspselect=116 For a summary of renewable energy standards in the US see Ryan Wiser and Galen Barbose Lawrence Berkeley National Laboratory ldquoState of the States Update on RPS Policies and Progressrdquo State-Federal RPS Collaborative Nov 18 2009 at httpwwwcleanenergystatesorgMeetingsRPS_Summit_09WISER_RPS_Summit2009pdf
72 More broadly 30 states nationwide require integrated resource plans or resource procurement plans that include energy efficiency
73 Includes states with strict energy efficiency standards states with Commission-ordered efficiency targets states that allow efficiency to count toward renewable energy standards and states with a rate cap that triggers a relaxation of requirements See Laura A Furrey Steven Nadel and John A ldquoSkiprdquo Laitner ACEEE Laying the Foundation for Implementing a Federal Energy Efficiency Resource Standard March 2009 at httpaceeeorgpubse091htm
74 Some 29 US states and the District of Columbia have renewable energy standards five other states have non-binding goals See Wiser and Barbose
75 For a US database of state incentives for renewable energy and energy efficiency see httpwwwdsireusaorg
27
the Role of foRwaRd caPacity MaRkets in incReasing deMand-side and otheR low-caRbon ResouRces
An example of an approach that attempts to ldquomarryrdquo integrated least-cost resource planning with forward capacity markets is the resource planning and procurement process recently established by the Connecticut Legislature76 The law requires the utilities Energy Advisory Board and Department of Public Utility Control to plan for current and future energy and capacity needs and provide a mechanism for procuring resources that meet specified economic reliability and environmental objectives77 to satisfy the identified need Further the law requires that resource needs first be met through energy efficiency and demand reduction resources that are cost effective reliable and feasible Based on the resulting resource plans LSEs enter into
contracts to acquire the required capacity (level and mix) through a competitive bidding process The law also requires that any resources winning contracts for capacity agree to let the LSE bid that capacity into the forward capacity auction as a ldquoself-suppliedrdquo resource This approach permits LSEs to determine both the quantity and mix of resources through integrated resource planning that will meet their resource adequacy requirements and state policy goals (eg carbon reduction) The LSE pays the contracted capacity price (under its bilateral contracts) instead of paying the auction clearing price to everyone that offers capacity into the forward capacity market (eg existing fossil fuel or nuclear plants)78
Connecticutrsquos Marriage of Resource Planning and Markets
76 Conn Gen Stat sectsect 16a-3a 16a-3b and 16a-3c
77 Costs and benefits cost-effectiveness cost impacts on customers the extent to which load growth can be eliminated and peak demand reduced reliability including energy security and economic risks impacts on meeting state environmental standards including emissions goals optimization of existing generation and generation sites the extent to which renewable resources can be used to meet needs and fuel types diversity and supply See Department of Public Utility Control Final Order in Docket No 08-07-01 Feb 18 2009
78 This approach is not without some controversy A contracted new resource in Connecticut has the potential to displace an alternative ldquocompetitiverdquo new resource in the region that would have bid at a higher price mdash had Connecticut not been allowed to designate the contract as self-supply ISO-NErsquos Internal Market Monitoring Unit has commented on this issue in a report to FERC See Internal Market Monitoring Unit ISO-NE June 5 2009
RegulatoRy assistance PRoject
28
Conclusions and Recommendations
Auction-based capacity markets in the US have been successful to date in attracting the capacity needed to maintain system reliability in an economically efficient manner In particular these markets have been successful in facilitating new demand-side resources
with ratepayers and society reaping the economic and environmental benefits However policymakers also should consider capacity markets in the context of carbon reduction policies and targets for the power sector Even markets that successfully integrate demand-side and renewable resources into the auction process are still encouraging the construction or continued operation of high-emitting supply-side resources to meet reliability targets
Existing capacity markets should be evaluated to assess whether the market is responding in this way And if it is policymakers need to critically assess whether a continuation of that market response over the coming years will make it possible to achieve the cumulative level of carbon reductions required from the power sector to avoid the worst effects of climate change Depending on the results of this inquiry policymakers may need to refine the auction rules and adopt additional policies for the power sector mdash such as those described in this paper mdash to ensure the alignment of capacity markets with both short- and long-term carbon reduction goals
More generally forward capacity markets create a revenue stream for resources that can commit to being available at times of system peak several years in the future mdash but this financial incentive is clearly not the only factor driving the mix of resources in the power sector and their resulting carbon footprint Market rules policies and regulations that affect investment and operating decisions for meeting the systemrsquos energy requirements mdash as well as those that affect access location and cost recovery for transmission and distribution facilities mdash have an enormous impact on both the short- and long-term resource mix in the electric system Policymakers will need to consider how this entire market and regulatory landscape mdash including forward capacity markets mdash can be strengthened and harmonized to reliably meet customer demand for electricity in a carbon-constrained world
29
the Role of foRwaRd caPacity MaRkets in incReasing deMand-side and otheR low-caRbon ResouRces
Cleared capacity values in the following tables represent all capacity committed by existing resources remaining in the market and all new resources that bid into the auction at or below
the market clearing price Cleared capacity includes ldquoself-suppliedrdquo or ldquoself-scheduledrdquo resources entered into the auction by LSEs However as described in this paper when the monthly billingsettlement process is completed the capacity charges allocated to the LSE will be offset (credited) for the cleared capacity delivered by these resources
Incremental capacity in the tables below reflects 1) new generation resources 2) capacity upgrades to existing generation resources 3) partial offsets to
incremental generation capacity due to capacity de-ratings to existing generation resources 4) new demand response resources 5) upgrades to existing demand response resources and 6) new energy efficiency resources
PJM Results79
PJM has conducted five Base Residual Auctions since its inception in 2007 for delivery years beginning in 20082009 (that each run from June 1 to May 31) Capacity cleared in the PJM auction is defined in terms of ldquounforcedrdquo capacity that is the capacity of a resource adjusted for availability and deliverability based on historical performance (eg forced outages)
Appendix 1
Detailed Results for PJM and ISO-NE Capacity Markets
Table 1 Generation Demand Resources and Energy Efficiency Resources
Offered and Cleared in PJM Base Residual Auctions (Unforced Capacity in MW)
Delivery Year 20082009 20092010 20102011 20112012 20122013
Generation Offered 1311648 1326142 1321248 1360679 1348730
DR Offered 7158 9368 9679 16524 98476
EE Offered - - - - 6527
Total Offered 1318806 1335510 1330927 1377203 1453733
Generation Cleared 1290614 1313389 1312515 1308566 1285274
DR Cleared 5362 8929 9390 13649 70473
EE Cleared 00 00 00 00 5689
Total Cleared 1295976 1322318 1321905 1322215 1361436
Energy efficiency resources were first eligible in the 20122013 auction
79 All information for PJM compiled from ldquo20122013 RPM Base Residual Auction Resultsrdquo at httpwwwpjmcom~mediamarkets-opsrpmrpm-auction-info2012-13-base-residual-auction-report-document-pdfashx
RegulatoRy assistance PRoject
30
Table 2 Incremental Capacity Additions and Reductions in PJM Base Residual Auctions(Installed Capacity in MW)
Delivery Year 20072008 20082009 20092010 20102011 20112012 20122013 Total
Increase inGenerationCapacity 6020 7242 12723 17762 35763 18935 98445
Decrease inGenerationCapacity -6746 -3754 -5502 -3018 -2647 -32539 -54206
Net Increase inDemand ResourceCapacity 5550 5747 2150 287 6617 79381 99732
Net Increasein EnergyEfficiency Capacity 0 0 0 0 0 6323 6323
Net Increasein InstalledCapacity 4824 9235 9371 15031 39733 72100 150294
Note Change in generation capacity is cumulative net increase in demand-side resources is relative to previous yearrsquos Base Residual Auction
Table 3 Breakdown of Incremental Capacity Resource Additionsin PJM Base Residual Auctions (Installed Capacity in MW)
Delivery Year CTGT Combined Diesel Hydro Steam Nuclear Solar Wind Total Cycle (Coal)
New 20072008 187 03 190Capacity 20082009 270 661 931Units 20092010 3995 238 530 4763 20102011 2833 5800 230 1414 10277 20112012 4164 11350 7048 11 752 23325 20122013 4038 5850 78 363 751 11080
Capacity 20072008 470 470From 20082009 1310 1310Reactivated 20092010 0Units 20102011 1600 107 1707 20112012 800 1010 1810 20122013 0
Uprates to 20072008 1145 139 800 2356 920 5360Existing 20082009 1082 340 180 1055 1960 384 5001Capacity 20092010 1522 2060 1625 614 1974 165 7960Resources 20102011 1173 1630 480 892 1603 5778 20112012 3692 1486 574 1868 2921 87 10628 20122013 2312 1643 142 1930 1260 568 7855
Total 28356 30159 2145 3963 20351 9062 11 4398 98445
Note Values represent capacity commitments Nameplate ratings of variable resources (solar and wind) are far larger than shown here
31
the Role of foRwaRd caPacity MaRkets in incReasing deMand-side and otheR low-caRbon ResouRces
Table 4 Changes to Generation Retirement Decisions
Since Reliability Pricing Model Approval (Unforced Capacity in MW)
Generation Resource Decision Changes Capacity Cleared
Withdrawn Deactivation Requests 17987
Postponed or Cancelled Retirement 13029
Reactivation 1752
ToTal 3276 8
Note Unforced capacity cleared in Base Residual Auctions from resources that withdrew their request to deactivate postponed retirement or were reactivated (ie came out of retirement or mothball state)
Table 5 PJM Base Residual Auction Clearing Price
Delivery Year Clearing Prices ($MW-day)
20072008 $4080
20082009 $11192
20092010 $10204
20102011 $17429
20112012 $11000
20122013 $1646
Note Values do not include any locational price adders Simple conversion of $MW-day to $kW-month multiply by 3 and divide by 100
Table 6 Effect of Demand-Side Resources on PJM Market Clearing Price
20122013 Base Residual Auction80
Actual Auction Results Calculated Results Without Demand-Side Resources
Clearing Prices Cleared Unforced Clearing Prices Cleared Unforced Savings
($MW-day) Capacity (MW) ($MW-day) Capacity (MW) ($MW-day)
$1646 1361435 $17878 1335682 $16232
80 Bowring Monitoring Analytics Table 20
RegulatoRy assistance PRoject
32
ISO-NE ResultsISO-NE has held three forward capacity auctions to
date The first auction (FCA 1) in February 2008 was for capacity delivery beginning in June 2010 (20102011 delivery year) The second auction (FCA 2) was held in December 2008 for delivery in 20112012 and the third
Table 7 Summary Results for ISO-NE Capacity Auctions81
Net Installed Total Resources Excess Clearing Net Price Capacity Cleared Capacity Price ($kW-month)82
Requirement (MW) (MW) ($kW-month)
FCA 1 32305 34077 1772 $450 $425
FCA 2 32528 37283 4755 $360 $312
FCA 3 31965 36996 4649 $295 $254
Table 8 Demand-Side Resources Cleared in ISO-NE Capacity Auctions (MW)81
Distributed Distributed Energy Real-Time Demand Real-Time Total Generation- Generation- Efficiency ResponseLoad Emergency Demand-Side Fossil Fuels Renewable Resources Management Generation Resources
FCA 1 46 lt02 655 978 875 2554
FCA 2 93 lt02 890 1195 759 2937
FCA 3 86 07 975 1206 630 2898
auction (FCA 3) was held in October 2009 for delivery in 20122013 ldquoClearedrdquo amounts in these tables include resources from earlier auctions that remain listed as well as new resources less resources that drop out
Note Net Installed Capacity Requirement values exclude the interconnection benefits associated with the Hydro-Queacutebec Phase III interface Excess capacity is not adjusted for Real-Time Emergency Generation in excess of the 600 MW limit Net prices reflect prorating of clearing prices due to excess capacity clearing the auction Simple conversion of $kW-month to $MW-day divide by 3 and multiply by 100
Note Demand-side values are grossed-up for avoided transmission and distribution losses and reserve margin (no reserve margin forFCA 3) Total resources cleared include excess capacity above the Net Installed Capacity Requirement Real-time emergency generation refers to distributed generation whose state air quality permit limits operation to ldquoemergencyrdquo conditions See Appendix 3
81 ISO-NE Forward Capacity Market Results at httpwwwiso-necommarketsothrmkts_datafcmcal_resultsindexhtml
82 Communication with Henry Yoshimura director Demand Resource Strategy ISO-NE March 2009
83 Eric Winkler ISO-New England ldquoThird Regional Energy Efficiency Initiative Meetingrdquo July 7 2009 and ldquoFCA Updaterdquo Demand Response Working Group Meeting Dec 2 2009 Total resources cleared (Capacity Supply Obligation) from Forward Capacity Market Auction Results for the 20102011 20112012 and 20122013 auctions at httpwwwiso-necommarketsothrmkts_datafcmcal_resultsindexhtml
33
the Role of foRwaRd caPacity MaRkets in incReasing deMand-side and otheR low-caRbon ResouRces
Step 1
System Operator (SO) Plans ldquoForwardrdquo for the Region
2012 Projection of Peak Demand = 10000 MW (incl reserves) Each ldquoLoad Serving Entityrdquo (LSE) is obligated for its 50 share
Appendix 2
Illustration of ldquoHow Forward Capacity Markets Workrdquo
SO purchases capacity in 2012 at the 2009 auction clearing price
LSE can be regulated utility or competitive retail supplier
LSE1 5000 MW
LSE2 5000 MW
R1
R1 =3500 MW capacity ldquoSelf Supplyrdquo Resources (LSE1 ownedunder contract)
RegulatoRy assistance PRoject
34
Step 2
The Regional Capacity Auction (3 Years ldquoForwardrdquo)
Step 3
System Operator Pays Cleared Resources at P and Bills LSEs(Note Self-Supply capacity is a ldquowashrdquo)
R1 R2 R3 R4 R5 R6 R7
P
R1
R3
R3
R5
R5
R2
R2
R4
R4
R6
R7
Bid Price = $ per MW-day
Quantity = MW
6500 MW P
Cleared Capacity = 10000
Supply = Capacity Committed ldquoForwardrdquo
P= Clearing price paid to all capacity clearing auction
Demand = SO Forecast of Capacity Requirements
R1-R7 = Capacity offered by Supply-Side (New built Existing Uprates) and Demand-Side (Energy Efficiency Demand Response Distrib Gen) Self-supply (R1) bids in a ldquozerordquo price New Resources set clearing price
LSE1 5000 MW
LSE2 5000 MW
R1
SOSO pays R1 3500 MW P
LSE2 pays its share of regional demand
5000 MW P
LSE1 pays its share of regional demand (5000 MW) adjusted for self-supply R1 for a net payment of 1500MW P
R1 = 3500 MW of ldquoSelf-Supplyrdquo Resources (LSE1 ownedunder contract)
In 2010Total regional peak demand of 10000 MW supplied by R1 + R2 + R3 + R4 + R5 LSE1 and LSE2 are each responsible for 50 of regional peak demand
35
the Role of foRwaRd caPacity MaRkets in incReasing deMand-side and otheR low-caRbon ResouRces
PJM Eligibility Requirements
Eligibility of demand-side resources has changed significantly over the years in PJMrsquos capacity markets In particular it was not until the most recent capacity auction (May 2009) for the
20122013 delivery year that energy efficiency became eligible to bid in PJMrsquos Base Residual Auction PJM is currently considering a tariff change to also allow energy efficiency to bid into incremental auctions
Under PJMrsquos eligibility rules an energy efficiency resource must achieve a ldquopermanentrdquo continuous reduction in electric energy consumption Examples of such a resource include lighting retrofit programs for residential commercial and industrial customers and programs to retrofit buildings with heating and cooling systems that exceed current efficiency standards To be eligible an energy efficiency resource must meet the following criteria
bull It is fully implemented throughout the delivery year without any requirement of notice dispatch or additional customer action
bull It is not reflected as a reduction in the peak load forecast used for the Base Residual Auction for the proposed delivery year
bull It exceeds relevant standards (such as building codes or appliance standards) at the time of commitment
bull It achieves the specified load reduction (expected average demand in MW) during defined summer on-peak hours84
Demand response on the other hand must be dispatchable mdash that is customer demand must be reduced when instructed For example a large supermarket with
coolers and freezers could install load management equipment that would cycle them on or off mdash and bid that demand response capability into the market85 More specifically a demand response resource must meet the following criteria
bull It is able to reduce demand for electricity up to 10 times each year for up to six consecutive hours per interruption during defined periods86
bull It is fully implemented within one hour (short lead time) or two hours (long lead time) of notice from PJM
bull In a year without calls for demand reductions it must demonstrate reliability through a test of reduction capability
bull It is registered in the Emergency Load Response Program and thus available for dispatch during PJM-declared emergency events
bull Compliance and status reports are filed as required
Multiple end-use customers can be aggregated in order to submit a single demand response offer in the capacity auction if those customers share the same curtailment service provider electric distribution company and transmission zone
In addition customer-sited distributed generation may be offered into auctions as a demand resource A hospital for example could offer to run its back-up generator on certain peak demand (eg hot summer) days to reduce its load on the system Or an industrial plant could cut back on production on such days and continue to run its on-site combustion or steam-cycle turbine
Currently energy efficiency resources may participate
Appendix 3
Eligibility Requirements for Demand-Side Resourcesin US Capacity Markets
84 Weekdays excluding holidays June through August between the hours ending 1500 and 1800 Eastern Prevailing Time (EPT)
85 If instead the supermarket replaced the existing coolers and freezers with more energy efficient ones it would bid that proposal in as an energy efficiency resource Or it could do both (replace and cycle) and bid in the capacity from the permanent savings (replacements) as energy efficiency and the dispatchable capacity (the cycling) as demand response
86 Weekdays excluding holidays from 1200 to 2000 EPT May through September and 1400 to 2200 EPT October through April
RegulatoRy assistance PRoject
36
in Base Residual Auctions for up to four consecutive delivery years In effect this means that PJM limits capacity payments for efficiency measures to four years of their measure life (rather than for the full measure life)87 In contrast a demand response resource (including distributed generation) can participate in the PJM capacity market for as long as its ability to reduce demand continues
ISO-NE Eligibility RequirementsSince the inception of ISO-NErsquos forward capacity market
in 2006 energy efficiency has qualified as an eligible demand-side resource ISO-NE defines demand resources as installed measures (products equipment systems services practices and strategies) that result in verifiable reductions in end-use consumption of electricity in the New England power system These are further categorized into ldquopassiverdquo (energy efficiency and non-dispatchable distributed generation) and ldquoactiverdquo (demand response emergency generation and dispatchable distributed generation) resources Passive demand resources are non-dispatchable but permanently reduce energy demand during peak hours Active demand resources are designed to reduce peak loads and to reduce load based on real-time system conditions or ISO-NE instructions Following are descriptions of eligible demand-side resources and performance requirements88
Passive Demand Resourcesbull On-Peak Demand Resources are measures that are
not weather-sensitive and reduce demand across a fixed set of on-peak hours such as energy-efficient commercial lighting and motors89
bull Seasonal Peak Demand Resources are weather-sensitive measures that reduce load during high-demand conditions such as energy-efficient heating and air conditioning systems Seasonal Peak Demand Resources must reduce load when actual system load is equal to 90 percent of the most recent peak load forecast for the applicable summer or winter season
Active Demand Resourcesbull Real-Time Demand Response Resources are
measures including load management and distributed generation that can be dispatched by ISO-NE as needed They must curtail electrical usage within 30 minutes of receiving a dispatch instruction and until receiving a releaserecall dispatch instruction
bull Real-Time Emergency Generation is distributed generation whose state air quality permit limits operation to ldquoemergencyrdquo conditions Generators must curtail the customerrsquos electrical usage within 30 minutes of receiving a dispatch instruction and until receiving a releaserecall dispatch instruction The amount of emergency generation that can be used to meet ISO-NErsquos capacity requirement is limited to 600 MW If the amount of real-time emergency generation that clears the auction exceeds this level payments to generators are reduced on a pro-rated basis All real-time emergency generation is treated as existing capacity
In contrast to PJM all demand-side resources in ISO-NE are eligible to bid capacity for their full measure life an approach that recognizes the full contribution of these resources to regional resource adequacy requirements and adds value to long-lived energy efficiency assets
87 FERC has directed PJM to evaluate the impact of its capacity payment period for energy efficiency resources
88 Eric Winkler and Abimael Santana ISO-NE ldquoNew Demand Resource Qualificationrdquo May 5 2009 at httpwwwiso-necomsupporttrainingcoursesfcmfcm_forum_may_5pdf
89 Summer on-peak hours are 1300 to 1700 non-holiday weekdays in June July and August Winter on-peak hours are 1700 to 1900 non-holiday weekdays in December and January
The Regulatory Assistance Project (RAP) is a global non-profit team of experts that focuses on the long-term economic and environmental sustainability of the power and natural gas sectors providing technical and policy assistance to government officials on a broad range of energy and environmental issues RAP has deep expertise in regulatory and market policies that promote economic efficiency protect the environment ensure system reliability and fairly allocate system benefits among all consumers We have worked extensively in the US since 1992 and in China since 1999 and have assisted governments in nearly every US state and many nations throughout the world RAP is now expanding operations with new programs and offices in Europe and plans to offer similar services in India in 2011 RAP functions as the hub of a network that includes many international experts and is primarily funded by foundations and federal grants
Home office
50 State Street Suite 3Montpelier Vermont 05602
802-223-8199wwwraponlineorg

RegulatoRy assistance PRoject
16
MW of wind resourcesPJM reports that the Base Residual Auctions have
attracted 150294 MW of incremental capacity in the region to date Incremental capacity refers to new generation resources capacity upgrades to existing generation resources new demand response resources upgrades to existing demand response resources and new energy efficiency resources37 Natural gas- and coal-fired plants account for most of the incremental capacity with nuclear plants (from uprates) also making a sizable contribution Tables 2 and 3 in Appendix 1 provide details on the incremental capacity procured It is important to note that the figures in these tables represent resources new to the capacity market including uprates mdash not all are newly built However they include a new merchant coal plant built for the PJM market38
True to one of the original goals the PJM capacity market also has been successful in retaining existing capacity from power plants that were originally under high-cost reliability must-run agreements39 Since FERC approved the Reliability Pricing Model existing capacity that would otherwise have been deactivated or retired has accounted for 32768 MW of procured capacity Table 4 in Appendix 1 shows these changes in resource deactivation and retirement
Market clearing prices for resources in PJMrsquos Base Residual Auctions to date have ranged from $1646 to $17429 per MW-day not including any locational price adders for constrained areas (See Table 5 in Appendix 1) Importantly the $1646MW-day clearing price for the 20122013 delivery year represents a decrease of $9354MW-day from the previous Base Residual Auction due in part to significant increases in capacity from demand response and the introduction of energy efficiency resources into the bidding process Moreover the participation of demand-side resources is estimated to have reduced the market clearing price for the 20122013 delivery year by an astonishing $16232MW-day in unconstrained zones (ie from a clearing price of $17878MW-day without these resources in the bid stack to the actual clearing price
of $1646MW-day) Table 6 in Appendix 1 shows the calculation by PJMrsquos independent market monitor
Auction Results for ISO-NE
ISO-NErsquos forward capacity market is about a quarter of the size of the PJM capacity market mdash the Installed Capacity Requirement set by ISO-NE for the 20122013 delivery year was 31965 MW ISO-NE has held three forward capacity auctions to date and all of them cleared at the administratively set floor price ($450kW-month $360kW-month and $295kW-month respectively) with surplus capacity above the Installed Capacity Requirement set by ISO-NE to meet reliability needs The first auction secured 1772 MW above the requirement the second auction cleared 4755 MW of excess capacity and the third auction cleared 4649 MW of excess capacity (See Table 7 in Appendix 1)
Demand resources have consistently represented about 8 percent of the resources cleared in the three auctions (2554 MW 2937 MW and 2898 MW respectively) an amount that exceeded expectations Energy efficiency accounted for about a quarter of the demand resources in the first auction and about a third in more recent auctions Real-time demand response comprises the largest share of demand resources Emergency generation (ie distributed generation whose state air quality permit limits operation to ldquoemergencyrdquo conditions) also makes a sizeable contribution Non-emergency distributed generation however comprises a negligible amount of the total Table 8 in Appendix 1 shows detailed results for demand resources
Figure 5 shows the growth in demand resources offered and cleared in the first two ISO-NE auctions by type There has been a steady growth in demand-side resources in New England since the first demand-response programs operated by ISO-NE The forward capacity auctions have contributed to and solidified these gains
Participation of demand-side resources in the ISO-NE forward capacity auction has been credited with making the clearing price lower than it would have been otherwise
37 The increase is partially offset by capacity de-ratings to existing generation resources
38 See Pfeifenberger et al at 27
39 As discussed above these contracts have not been dispensed with altogether however
17
the Role of foRwaRd caPacity MaRkets in incReasing deMand-side and otheR low-caRbon ResouRces
as it has in the PJM region Analysis of the first auction bids for example suggests that the participation of these resources saved ratepayers as much as $280 million by lowering the price paid to all capacity resources in the market40
Moreover by contributing to the excess capacity that kept capacity payments at relatively low floor prices in New England the participation of demand-side resources has
also contributed to lower overall market revenues inducing some inefficient oil-fired generating units to shut down at least temporarily Nonetheless existing and new fossil-fuel resources continue to dominate the capacity commitments in this region as is the case for PJM
Overall renewable generating resources (primarily wind resources) are making some headway in the regionrsquos forward capacity market but as in PJM they are not
40 See Cheryl Jenkins et al This calculation reflects what the market clearing price would have been in the auction given the Installed Capacity Requirement put out to bid by the system operator which assumes no impact of energy efficiency programs on loads (because energy efficiency is bidding) Therefore the calculated reduction in clearing price represents a theoretical maximum mdash excluding demand resources from the market would likely have been at least partially offset by a lower amount of capacity put out to bid As a result the difference in the market clearing price (and savings to consumers) would likely have been smaller than the number calculated here although it is difficult to say by how much However even if demand-side resources were not permitted to bid they would contribute to lower prices for consumers by lowering the total quantity of capacity required
41 Internal Market Monitoring Unit ISO-NE June 5 2009
4500
4000
3500
3000
2500
2000
1500
1000
500
0
New UnclearedTotal Uncleared1375 MW
Total Uncleared1159 MW
Total Cleared2279 MW
Total Cleared2778 MW
New Cleared
Existing Delisted Uncleared
Existing Cleared
FCA 1 FCA 1
Figure 5 Demand-Side Participation in ISO-NE Capacity Auctions by Type41
copy ISO New England Inc
Note Activerdquo resources include demand response and emergency generation energy efficiency is considered a ldquopassiverdquo resource Clearing amounts reflect ISO-NErsquos maximum limit of 600 MW of Real-Time Emergency Generation In contrast Table 8 in Appendix 1 shows the actual amount of such resources that cleared the auction Capacity payments to these resources are pro-rated if cleared levels exceed 600 MW
Cap
acit
y (M
W)
Active
Active
Active
Active
Active
Active
Active
Active
Passive
Passive
Passive
Passive
Passive
RegulatoRy assistance PRoject
18
a major contributor to the regionrsquos resource adequacy requirements at this time In the most recent (third) auction 166 MW of wind capacity cleared the auction mdash with a nameplate rating an order of magnitude larger42
Unlike PJM ISO-NE does not apply a deemed on-peak capacity factor to wind and other variable generation resources Instead all such resources must provide data that demonstrate the claimed summer and winter qualified capacity The capacity factor is adjusted over time based on actual performance during specified hours
Forward Capacity Markets in the Context of Carbon Constraints
Power market rules are not constructed in a vacuum rather they are designed to address specific public policy goals As described above forward capacity markets in the US were developed to ensure resource adequacy in the power system at a reasonably competitive price In the face of growing carbon constraints however power market rules need to be redesigned to work in concert with carbon reduction goals and policies rather than at cross purposes The challenge of substantially de-carbonizing the power sector in the coming years is too great to ignore this interaction In particular policymakers should carefully consider what elements of the current planning and procurement process to achieve resource adequacy contribute to the following effects ndash and then work to revise the market rules accordingly
bull Do the market rules encourage new investments in high-emitting resources (including repowering) at the expense of low-carbon alternatives
bull Do they encourage the continued (or increased) operation of existing high-emitting power plants
bull Will they result in a build-out of capacity and cumulative emissions that conflict with the level of de-carbonization required in the power sector mdash or make attainment of that level more costly to the economy
This paper is not intended to evaluate the PJM and ISO-NE capacity markets and auction rules in any depth with respect to these issues However we offer below general observations based on the auction design and results to date in these regions and other studies Following that we provide policy recommendations related design options and additional actions for consideration
General Observations on Forward Capacity Markets and Results
Based on our review of FCM auctions to date and related studies we offer the following observations
bull The ISO-NE and PJM forward capacity markets are meeting their resource adequacy objectives Sufficient levels of capacity have cleared the market to meet each regionrsquos anticipated peak demand and adequate resources are now committed on a forward basis to ensure reliable coverage in future years (up to the 20122013 delivery year) But in a carbon-constrained world the mix of resources is as important as the quantity in both the short-term and the long-term Most resources that are available during peak demand hours also produce electricity or reduce consumption during many more (or all) hours of the year and the carbon intensity of that mix of resources will drive the level of cumulative emissions in the power sector43 As discussed in this paper capacity markets as currently designed provide compensation based on the level of available capacity not the mix of resources providing that capacity It is worth repeating here that the only (non-price) attribute a resource needs to demonstrate for resource adequacy purposes is that it will be available when called upon during the projected hours of peak system loads In a carbon-constrained world policy makers should ask whether the planning and procurement process for acquiring a sufficient level of capacity at a reasonable price is also moving the resource mix in the right direction mdash towards zero or low carbon-emitting demand- and supply-side resources
42 Compiled from auction results at httpwwwiso-necommarketsothrmkts_datafcmcal_resultsccp13fca13indexhtml
43 With the exception of gas-fired peaking units or demand response resources that are dispatched to meet (or reduce) loads only during peak system hours
19
the Role of foRwaRd caPacity MaRkets in incReasing deMand-side and otheR low-caRbon ResouRces
bull Expressly designing demand-side resources into forward capacity markets appears key to achieving all three objectives ndash resource adequacy low-carbon resource mix and reasonable price Energy efficiency and demand response resources are faring well in auction-based capacity markets mdash and this is a positive outcome for several reasons First energy efficiency and other demand-side resources can substitute for existing and planned generation that have a higher carbon footprint thereby reinforcing carbon reduction policies and targets for the region Second demand-side resources can dramatically reduce the costs of meeting the regionrsquos resource adequacy requirements mdash as evidenced by the results of the PJM and ISO-NE auctions In addition the increase in demand-side resources facilitated by capacity auctions can reduce market power because more suppliers and more resources means individual generators have less ability to affect bid offers and clearing prices And because demand-side resources lighten the load at the end of the supplydelivery chain they enhance the reliability of each link in the chain from fuel supply and generation to the local distribution network
bull Differences in the impact of demand-side resources on carbon emissions should be recognized in capacity markets and associated auction rules Energy efficiency decreases carbon emissions because (by definition) it reduces energy use for an equivalent level of service and at the margin almost all power systems are running higher carbon resources In contrast the net impact of demand response on carbon emissions will depend upon specific circumstances including the mix of
plants serving loads at the margin For example when coal is primarily serving baseload and intermediate needs emissions may increase when customers shift loads from on-peak (when natural gas is on the margin) to off-peak periods44 Elsewhere however demand response mdash including any conservation side-effect mdash may reduce emissions from less efficient peaking plants In addition demand response includes real-time emergency generation which is often fossil-fuel powered (eg by diesel or natural gas) Any analysis of the costs and benefits of demand response resources in capacity markets should account for such effects Policies and market rules for demand response should be aligned with its environmental costs and benefits45
bull Renewable generating resources are beginning to make some headway in forward capacity markets mdash in particular wind resources This is in large part because the markets described here recognize some capacity value for variable renewable resources (wind solar and run-of-river hydro) either through a deemed on-peak capacity factor or a demonstration of claimed capacity for specified on-peak periods Policymakers need to pay attention to how these values are established so they can be confident the committed capacity will be available when called on while at the same time encouraging participation of all low-carbon resources in the market More generally as renewable resources become a more significant part of the resource mix a forward capacity market creates the opportunity to recognize their aggregate capacity value to the system46
44 For example PJM recently released figures on carbon emissions of generating units that operate on the margin during on-peak vs off-peak hours See httpwwwpjmcom~mediaabout-pjmnewsroom2010-releases20100325-pjm-reports-new-carbon-dioxide-emissions-dataashx and httpwwwpjmcomdocuments~mediadocumentsreportsco2-emissions-reportashx
45 See section 316 and Mechanism E in Attachment 1 of Pacific Northwest National Laboratory The Smart Grid An Estimate of the Energy and CO2 Benefits January 2010 (PNNL 19112) at httpenergyenvironmentpnlgovnewspdfPNNL-19112_Revision_1_Finalpdf
46 Variable renewable resources will qualify for higher capacity value if they are bundled with other resources for reliability (eg demand response hydroelectric dams or energy storage) In addition confidence in the capacity value of variable resources increases as their geographic diversity on the system increases See for example the report on the Eastern Wind Integration and Transmission Study at httpwwwnrelgovwindsystemsintegrationpdfs2010ewits_final_reportpdf
RegulatoRy assistance PRoject
20
bull Nonetheless renewable resources are hard-pressed to successfully compete with the thousands of megawatts of existing and new fossil-fuel resources participating in these auctions that are able to bid below the true societal cost of their operations under current market rules In fact capacity auctions as currently designed can breathe new economic life into high carbon-emitting plants that were previously planned for significantly reduced operations or retirement Along with new capacity from fossil-fuel generation allowing such a large amount of existing capacity from high carbon emitters to clear the auction is likely to crowd out renewable resources that are able to address resource adequacy requirements equally well Such results may not represent an ldquoefficientrdquo (or desirable) outcome for a carbon-constrained power sector This is especially true where the carbon costs of a fossil-fuel plant are not fully recognized in the energy market that plant also will be bidding into
The Electric Power Research Institute modeled the effect of various levels of carbon taxes or allowance prices in the upper Midwest (coal-dependent) and in Texas (heavily reliant on natural gas) The study found that close to a doubling of the wholesale prices of electricity in the Midwest region (through carbon-related charges) would produce only a 4 percent reduction in regional emissions given the current generation mix Similar results were observed for Texas where natural gas plants are on the margin49 And in the Northeastern US due to initially low carbon prices and a host of factors that dampen the price signal the Regional Greenhouse Gas Initiative (RGGI) has not yet resulted in generator operational changes50 One of those dampening factors is the single clearing price that is typically set through wholesale energy markets mdash which dilutes the market signal sent by a price on carbon emissions by allowing fossil-fueled plants to recover
most or all of their allowance costs through higher clearing prices reflecting the cost of allowances51
Studies also have shown that the price of carbon must rise (and be maintained) at very high levels to obtain sufficient market pull for the level of new investments in clean generation required For example a recent analysis in California concluded that it would take a carbon price of $100 per tonne52 to make economic investments in renewable resources compared to fossil fuel-fired generation in order to reach carbon reduction targets in the power sector beyond what current state requirements will achieve53 Further price signals may be diluted if a portion of the carbon allowances are allocated in a manner that shields high-emitting power plants from carbon costs or if high-emitters located outside the capped region can sell into the market on a long-term basis
Carbon Pricing Alone Is Insufficient to De-carbonize the Generation Mix
bull A market price for capacity or energy that favors the construction and operation of high carbon-emitting resources over clean resources will lead to increases mdash rather than reductions mdash in the cumulative level of carbon emissions in the power sector A carbon tax or carbon cap-and-trade regime internalizes some or all of the otherwise un-priced carbon costs of electricity production and would improve the relative economics of clean resources in both forward capacity and energy markets However carbon pricing alone may be insufficient to change the dispatch of existing high-emitting power plants or their ability to clear these capacity markets (and be paid additional revenues as a result) in such overwhelming numbers47 In fact the very modest impact of carbon pricing on the performance of fossil-fuel plants has been documented in several reports48 (See text box below)
47 With or without carbon prices policymakers also might want to consider the implications of paying existing power plants the market clearing price for capacity mdash and the potential windfall profits for plant owners mdash for making no changes in plant operations See for example Ezra Hausman Paul Peterson David White and Bruce Biewald Synapse Energy Economics Inc RPM 2006 Windfall Profits for Existing Base Load Units in PJM An Update of Two Case Studies Feb 2 2006 at wwwsynapse-energycom
21
the Role of foRwaRd caPacity MaRkets in incReasing deMand-side and otheR low-caRbon ResouRces
bull Carbon pricing alone will have limited impact on consumer decisions to invest in permanently reducing their peak demand by making cost-effective investments in energy efficiency Well-designed time-varying pricing options can successfully shift demand from high-price hours to lower price hours54 Such shifting also reduces peak demand on transmission and distribution systems Overall energy use will decline somewhat in response to price But long-term reduction in energy use due to price increases is relatively small The numerous market barriers to capturing the full cost-effective potential of energy efficiency ndash through improvements in building construction practices and industrial processes retrofits of existing buildings and installations of high-efficiency appliances and equipment in homes and businesses ndash are well-documented They include lack of information high first-costs consumersrsquo high discount rates and the landlord-tenant split incentive problem among others55 Recent empirical analysis of demand elasticities suggests that the long-term price elasticity of demand for electricity is even lower than earlier studies have indicated for both liberalized and regulated markets (See text box on page 21)
In sum while forward capacity markets are meeting their resource adequacy objectives and clearing an impressive amount of clean low cost demand-side resources on balance these markets (as currently designed) are not working sufficiently in concert with carbon reduction goals and policies in the face of growing carbon constraints For the reasons discussed above carbon pricing alone
48 See Testimony of Richard Cowart Regulatory Assistance Project Before the Committee on Energy and Commerce Subcommittee on Energy and Environment US House of Representatives April 23 2009 ldquoThe Consumer Allocation for Efficiency How Allowance Allocations Can Protect Consumers Mobilize Efficiency and Contain the Costs of GHG Reductionrdquo at httpenergycommercehousegovPress_11120090423testimony_cowartpdf
49 See Victor Niemeyer ldquoThe Change in Profit Climate How Will Carbon-Emissions Policies Affect the Generation Fleetrdquo Public Utilities Fortnightly May 2007 at 20 24
50 See ldquoRGGI marks its first year with success and lesson on effect of market pressurerdquo Electric Utility Week Dec 14 2009 Ten Northeast and Mid-Atlantic states participate in RGGI the first mandatory cap-and-trade program in the US Connecticut Delaware Maine Maryland Massachusetts New Hampshire New Jersey New York Rhode Island and Vermont Nine of them participate in either the ISO-NE or PJM forward capacity markets described in this paper
51 PJM Interconnection ldquoPotential Effects of Proposed Climate Change Policies on PJMrsquos Energy Marketrdquo Jan 23 2009 p 5 See also ldquoBecause Thatrsquos Where the Money Is The FERCrsquos Ability to Reduce the Cost of Slowing Global Warmingrdquo Samuel A Wolfe Chief Counsel New Jersey Board of Public Utilities December 2009 at httpwwwnarucorgpublicationsWOLFE-20Panel203pdf
Demand for Power Is Relatively Price-Insensitive mdash Even Over the Long Term
Modeling by the US Department of Energy suggests that a 10 percent increase in power prices will reduce demand for electricity by just 25 percent to 3 percent over 20 years assuming that the price effects persist over that entire period56 This would only offset the normally expected US load growth in two out of those 20 years57
More recently a 2009 empirical analysis of the demand for electricity in the US concludes that price elasticity of residential demand has actually decreased since retail price deregulation was first introduced in the US The results suggest that a 10 percent increase in power prices will reduce residential electricity demand more on the order of 12 percent to 17 percent based on 2001-2008 data for both deregulated and regulated states58 Price responsiveness is further dampened by the income-elasticity of demand which is positively correlated with consumption As incomes increase consumption of electricity goes up and the conservation impact of any price increase is diminished59 The equivalent historical figure for a 10 percent increase in power prices in the UK residential sector is -23 percent but the income-elasticity is such that a 10 percent increase in income results in an increase of demand of 34 percent ndash ie household income is just as important as energy price in determining energy demand60
RegulatoRy assistance PRoject
22
is unlikely to shift the power sector resource mix at the pace or scale required to meet aggressive carbon reduction targets ndash or correspondingly to substantially change the dominance of high-carbon resources clearing forward capacity auctions under current market rules An increasing number of studies makes a compelling case that our economy and our society cannot afford this dominance to persist much longer if we are to contain climate change to a livable level In fact close to full de-carbonization of the
power sector is being discussed in international forums as the only way to meet essential carbon reduction targets by 205061 While capacity markets alone are unlikely to support the full value of clean energy resources in a carbon-constrained power sector by themselves with appropriate design elements they can serve to reinforce actions taken at federal regional and state levels that provide larger and longer lasting commitments to clean demand-side and renewable resources62
52 A tonne or metric ton is a unit of mass equal to 1000 kilograms (roughly 2205 pounds) or approximately the mass of one cubic meter of water at four degrees Celsius A tonne is not the same as either a ldquoshortrdquo ton (2000 pounds) or a ldquolongrdquo ton (2240 pounds)
53 Energy and Environmental Economics Inc Greenhouse Gas Modeling of Californiarsquos Electricity Sector to 2020 Updated Results of the GHG Calculator Version 3 prepared for the California Public Utilities Commission October 2009 pp 66-67 at httpwwwethreecomdocumentsGHG_102209CPUC_GHG_Final_Report_28Oct09pdf
54 Ahmad Faruqui and Sanem Sergici The Brattle Group ldquoHousehold Response to Dynamic Pricing of Electricity A Survey of the Experimental Evidencerdquo Jan 10 2009 at httpwwwhksharvardeduhepgPapers2009The20Power20of20Experimentation20_01-11-09_pdf
55 See for example American Council for an Energy Efficient Economy ldquoQuantifying the Effects of Market Failures in the End-Use of Energyrdquo pp iii-vi 2007 at httpoldaceeeorgenergyIEAmarketbarrierspdf This study details the various types of market barriers to end-use energy efficiency and reports that up to 50 percent of residential energy use in the US is affected by such barriers
56 The US Department of Energyrsquos National Energy Modeling System (NEMS) has price elasticity built into it The long-run elasticity (assuming price effects remain for 20 years) are ndash031 for residential electric use and ndash025 for commercial electric use See Steven H Wade ldquoPrice Responsiveness in the NEMS Buildings Sector Modelrdquo in Energy Information Administrationrsquos Issues in Midterm Analysis and Forecasting 1999 pp 55 58 table 1 at httpwwweiadoegovoiafissuespdf060799pdf
57 This would require a much larger rate increase just to offset expected load growth over 20 years let alone to reduce demand sufficiently to permit absolute reductions in emissions from the nationrsquos huge generation fleet See Testimony of Richard Cowart
58 T Nakajima and S Hamori ldquoChange in Consumer Sensitivity to Electricity Prices in Response to Retail Deregulation A Panel Empirical Analysis of the Residential Demand for Electricity in the United Statesrdquo Energy Policy (2010) available at wwwsciencedirectcom
59 Ibid
60 John Dimitropoulas Lester C Hunt and Gary Judge ldquoEstimating Underlying Energy Demand Trends Using UK Annual Datardquo at httpuserwebportacuk~judgegAEL_04pdf
61 See for example Meeting Carbon Budgets ndash The Need for a Step Change Progress Report to Parliament Committee on Climate Change October 2009 at httpwwwthecccorgukreportsprogressreports Christopher Jones and Jean-Michel Glachant Why and How the European Union Can Get a (Near to) Carbon-Free Energy System in 2050 MIT Center for Energy and Environmental Policy March 2010 at httpdownloadsthecccorgukdocs2166720CCC20Executive20Summary20AW20v4pdf Roadmap 2050 A practical guide to a prosperous low-carbon Europe The European Climate Foundation April 2010 at wwwroadmap2050eu
62 Without such policies it is unlikely that even RGGIrsquos modest carbon reduction goals will be achieved See Paul Peterson Doug Hurley and David White Synapse Energy Economics Inc ISO New England Scenario Analysis Companion Report Constructing a Future That Meets Regional Goals Aug 8 2007 at wwwsynapse-energycom
23
the Role of foRwaRd caPacity MaRkets in incReasing deMand-side and otheR low-caRbon ResouRces
ISO-NE Rules for Emergency Generators Advance Environmental Goals
Emergency (ldquobackuprdquo) generators typically are diesel-fired and states in New England and elsewhere in the US have restricted the number of hours and days they may be operated through the state permitting process At the time the first regional demand response tariffs were being designed in New England a collaborative of energy regulators environmental regulators the ISO utilities and other stakeholders realized that active demand response programs could lead to substantial incentives for diesel-fired backup generators to operate more often when air quality was at its worst Regulators and the ISO proposed a rule limiting those generators to run for reliability purposes during system emergencies This is a concrete example of reliability rules being written to advance environmental goals as well as power system needs63 In addition a regional working group developed model emissions standards for small generators for statesrsquo consideration64
To reinforce regional air quality policies and goals ISO-NE limits the total amount of emergency generators in the regional capacity market to 600 MW To the extent any excess amount clears the auction capacity payments to these resources are pro-rated
63 See Cowart and Raab p 26
64 See Model Regulations for the Output of Specified Air Emissions From Smaller Scale Electric Generation Resources Oct 31 2002 at httpwwwraponlineorgshowpdfaspPDF_URL=22docsrap_issuesletter-outputbasedemissioninsert_2003_07pdf22
65 Edward S Rubin Carnegie Mellon University ldquoA Performance Standards Approach to Reducing CO2 Emissions for Electric Power Plantsrdquo June 2009 at httpwwwpewclimateorgpublicationsreportcoal-initiative-series-performance-standards-approach-reducing-co2-emissions-ele Also see Chris Simpson and Brenda Hausauer ldquoEmissions Performance Standards in Selected Statesrdquo Regulatory Assistance Project Research Brief November 2009 at httpwwwraponlineorgdocsRAP_Simpson_EPSResearchBrief_2009_11_13pdf
Policy Recommendations and Auction Design Options
We present below recommendations and a menu of auction design options for forward capacity markets that support and enhance carbon policies and carbon reduction targets
bull Power market rules should be constructed to recognize and limit the adverse environmental consequences of power generation The power system and the environment are inextricably linked Explicit consideration of environmental costs and benefits of various electricity resources is not only reasonable but necessary to meet the enormous challenge of climate change
bull Forward capacity markets should reinforce carbon reduction policies which could be accomplished by incorporating one or more of the following into the auction rules
Auction rules could apply an Emissions Performance Standard (EPS) to promote capacity commitments from low-carbon resources and discourage bids from high-emitting power plants An EPS can be expressed as a maximum level of greenhouse gas emissions per unit of electrical output or as a percentage reduction in (annual) plant emissions It can vary with fuel type and incorporate other design variations65 It may be appropriate to adopt an EPS mdash within the auction qualification rules or by regulation mdash particularly if current market signals are not sufficiently
discouraging new construction or repowering of high-emitting generating resources with long lifetimes while forward capacity markets are providing a new revenue stream to keep them running
RegulatoRy assistance PRoject
24
Auction rules could disqualify inefficient generators from participating (and from receiving capacity revenue) or more generally require their retirement through financial incentives regulations or both66 Since 2007 China has been phasing out such plants and intends to retire approximately 50 gigawatts (GW) of small inefficient coal-fired power plants nationwide and 7 GW to 10 GW of small natural gas-fired units as well as halt construction of small inefficient power plants The policy is being put in place three ways the direct rescission of operating permits the transfer of generation rights and price reductions
Capacity payments could vary by the emissions rate of the resource Instead of one price paid to all generation that clears the auction adders could be applied to payments for low-emitting units and deductions could be applied to high-emitting units67 For example a sliding-scale percentage reduction to the per-unit ($kW-month or $MW-day) clearing price could be established based on the average annualized carbon footprint of fossil-fuel resources whereas a price adder above the clearing price could be established for zero-emitting resources
Imputed ldquocarbon addersrdquo could help curtail high-emitting resources Carbon adders are imputed costs that reflect at least a portion of the societal cost of emissions They are generally
used in the context of resource planning and acquisition by a regulated LSE mdash as a way of ensuring that high-carbon risks and low-carbon alternatives are properly valued in the resource selection process But these imputed costs do not get passed on to ratepayers or consumers for every unit of power consumed in contrast to carbon pricing68 Similarly the rules in a forward capacity market could be modified so that carbon adders are applied in determining what resources clear the auction (and will receive the market clearing price for their capacity commitment)
A ldquozero-carbon resource portfolio standardrdquo could establish auctions for separate tranches of resources by emissions level For example one tranche could include energy efficiency and renewable resources The size of each tranche would be based on carbon reduction goals for the region The higher the goals the larger the tranche for energy efficiency and renewable resources These resources decrease carbon emissions because at the margin most power systems are running higher carbon resources
bull Policymakers should consider a longer price commitment in forward capacity markets mdash at least for low-carbon resources The contract period for new capacity in these markets is short (one year in PJM up to five years in ISO-NE) in part so there is greater certainty over forecasts of resource needs for system reliability (to mitigate the risk of over-supply)
66 Small and old coal plants are the most inefficient and polluting both in terms of greenhouse gases and particulate matter By some estimates 50 MW plants may use as much as 200 grams more per unit of electricity output than a plant larger than 300 MW See Frederick Weston Rebecca A Schultz David Moskovitz and Max Dupuy Regulatory Assistance Project ldquoChinarsquos Climate Change Initiatives Do new policies adopted in China offer any guidance for the transformation of the US power sector in a carbon-constrained worldrdquo November 2009 at httpwwwraponlineorgdocsRAP_China20Climate20Initiatives_NARUC_2009_11_01docx
67 See N Jonathan Peress and Kenneth A Colburn ldquoElectrical Connections Aligning Capacity Market Changes With RGGI in the Northeastrdquo Discussion Draft March 2005 at httpwwwpucnhgovEPABSymbiotic202005-03-1820Peress-Colburn20Letter20to20FERC-Woodpdf
68 Both high carbon resources and low carbon resources clearing in power markets (characterized by single-price auctions) are paid the same price So whenever fossil resources are on the margin (most of the time in most places) consumers are seeing the same price for both fossil and clean resources and the cost of carbon allowances (or carbon taxes) for that marginal resource is reflected in the clearing price for all power bought in the market Carbon adders on the other hand are not actually paid to any resource or reflected in prices for all units sold in the market
25
the Role of foRwaRd caPacity MaRkets in incReasing deMand-side and otheR low-caRbon ResouRces
Auction winners can generally participate in future auctions and receive the market clearing price but have no assurance of future prices Moreover under current rules in PJM energy efficiency resources cannot receive capacity payments over the full life of the measures mdash only for four consecutive delivery years This constraint puts energy efficiency on a different footing than other demand resources mdash as well as all supply-side resources mdash which are paid for their capacity as long as they provide the benefit
The short commitment period and lack of price certainty may not provide market signals that are strong and consistent enough to ensure sufficient new generation or encourage plant operators and investors to make efficient choices for the long-term mdash even where carbon prices are expected to increase substantially in the future due to a dramatically declining carbon cap or a high carbon tax Allowing clean resources to opt for a longer period of time over which the price is known would in particular facilitate renewable resources whose typically high upfront capital costs and low operating costs mdash compared to natural gas-fired plants in particular mdash may require such a long-term commitment to procure financing69 Another option might be to establish fixed floor prices for clean energy resources for a long-term period to provide assurance of a minimum revenue stream
bull Regional load forecasting should be reviewed for treatment of demand-side resources acquired outside the capacity market In particular the system operator determines the capacity that will be auctioned for each delivery year (three years hence) based on a 10-year load forecast which is updated on
an annual basis Under the current planning process in forward capacity markets this forecast only reflects the demand-side resources that have cleared in prior auctions The system operatorrsquos load projections do not take into consideration any load reductions from demand-side resources procured outside of the auction such as energy efficiency programs that LSEs have committed (or are obligated) to fund and implement in the coming one to three years or beyond70 If the magnitude of these load reductions is substantial the ISO may be systematically overstating the level of capacity put out to bid for each delivery year Depending upon the existing mix of resources and market conditions in the region this overstatement may have a sizeable impact not only on the level of cleared capacity and the market price but on the resulting resource mix and level of carbon emissions as well
Additional Actions
Careful design of the planning process and auctions undertaken through forward capacity markets can help to ensure that they reinforce and do not work at cross purposes with climate reduction goals and targets However forward capacity market signals (capacity prices) are only one component of a market and regulatory landscape that affects investment and operating decisions in the power sector Market rules and procurement policies that affect system energy requirements ndash as well as policies and regulations that affect access location and cost recovery for transmission and distribution facilities ndash have an enormous impact on both the short- and long-term resource mix
It is beyond the scope of this paper to fully explore how
69 LSEs in PJM and ISO-NE can contract for generating resources through the bilateral market to hedge energy and capacity costs and to meet renewable energy standards Renewable resource projects that successfully negotiate such contracts if they are long term may not need a long-term commitment in the forward capacity market Still a short-term capacity payment stream with uncertain prices thereafter weakens the ability of renewable resources to secure long-term financing
70 Some of the econometric models that the system operators use for their load forecasts may capture the impacts of federal appliance standards and building codes However to our knowledge there has been no explicit accounting to date for the impacts of state and utility energy efficiency programs where the capacity is not bid into the auctions
RegulatoRy assistance PRoject
26
market rules and other policies and regulations can be harmonized and strengthened to meet customersrsquo energy needs reliably in a carbon-constrained world Larger and longer lasting commitments to demand-side and renewable resources are certainly needed to ensure a mix of resources that will significantly reduce greenhouse gas emissions in the power sector This has been the conclusion of US policymakers who have put in place additional policies to facilitate long-term acquisition of low-carbon resources in regions that operate both forward capacity markets and a cap-and-trade program (under RGGI)71
bull States have adopted a variety of mechanisms for sustained and aggressive energy efficiency programs
bull Strong building codes and equipment standards
bull Stable funding through a system benefit charge
bull Third-party administration of programs or where the utility is the efficiency portfolio manager decoupling of utility profits from revenues financial incentives for shareholders or both
bull Recycling of carbon auction proceeds into energy efficiency investments
bull Some states require long-term resource plans or resource procurement plans that must include energy efficiency Therersquos renewed interest in long-term planning and procurement particularly for demand-side and renewable resources following a period
where these efforts were largely abandoned with electric industry restructuring and development of organized markets72
bull Several states have adopted energy efficiency resource standards that require achievement of specified energy-saving targets73
bull Most of the states have renewable energy standards74 and several states require long-term contracting of renewable resources to meet the standards75
bull Connecticut Maryland Pennsylvania and Rhode Island require contract terms of 10 years or longer
bull New York requires central procurement of renewable energy credits by a state agency under long-term contract Illinois is likely to acquire long-term contracts for renewable resources under its central procurement mandate
bull Massachusettsrsquo Green Power Partnership purchases renewable energy credits for up to 10 years using its renewable energy fund
These are just examples and certainly not an exhaustive list of the ways in which careful design of forward capacity markets coupled with additional policies at the federal regional and state level can serve to reinforce both resource adequacy requirements and carbon reduction goals
71 Regulatory Assistance Project policy grids summarize state-by-state requirements for resource planning and energy efficiency at httpwwwraponlineorgFeatureaspselect=116 For a summary of renewable energy standards in the US see Ryan Wiser and Galen Barbose Lawrence Berkeley National Laboratory ldquoState of the States Update on RPS Policies and Progressrdquo State-Federal RPS Collaborative Nov 18 2009 at httpwwwcleanenergystatesorgMeetingsRPS_Summit_09WISER_RPS_Summit2009pdf
72 More broadly 30 states nationwide require integrated resource plans or resource procurement plans that include energy efficiency
73 Includes states with strict energy efficiency standards states with Commission-ordered efficiency targets states that allow efficiency to count toward renewable energy standards and states with a rate cap that triggers a relaxation of requirements See Laura A Furrey Steven Nadel and John A ldquoSkiprdquo Laitner ACEEE Laying the Foundation for Implementing a Federal Energy Efficiency Resource Standard March 2009 at httpaceeeorgpubse091htm
74 Some 29 US states and the District of Columbia have renewable energy standards five other states have non-binding goals See Wiser and Barbose
75 For a US database of state incentives for renewable energy and energy efficiency see httpwwwdsireusaorg
27
the Role of foRwaRd caPacity MaRkets in incReasing deMand-side and otheR low-caRbon ResouRces
An example of an approach that attempts to ldquomarryrdquo integrated least-cost resource planning with forward capacity markets is the resource planning and procurement process recently established by the Connecticut Legislature76 The law requires the utilities Energy Advisory Board and Department of Public Utility Control to plan for current and future energy and capacity needs and provide a mechanism for procuring resources that meet specified economic reliability and environmental objectives77 to satisfy the identified need Further the law requires that resource needs first be met through energy efficiency and demand reduction resources that are cost effective reliable and feasible Based on the resulting resource plans LSEs enter into
contracts to acquire the required capacity (level and mix) through a competitive bidding process The law also requires that any resources winning contracts for capacity agree to let the LSE bid that capacity into the forward capacity auction as a ldquoself-suppliedrdquo resource This approach permits LSEs to determine both the quantity and mix of resources through integrated resource planning that will meet their resource adequacy requirements and state policy goals (eg carbon reduction) The LSE pays the contracted capacity price (under its bilateral contracts) instead of paying the auction clearing price to everyone that offers capacity into the forward capacity market (eg existing fossil fuel or nuclear plants)78
Connecticutrsquos Marriage of Resource Planning and Markets
76 Conn Gen Stat sectsect 16a-3a 16a-3b and 16a-3c
77 Costs and benefits cost-effectiveness cost impacts on customers the extent to which load growth can be eliminated and peak demand reduced reliability including energy security and economic risks impacts on meeting state environmental standards including emissions goals optimization of existing generation and generation sites the extent to which renewable resources can be used to meet needs and fuel types diversity and supply See Department of Public Utility Control Final Order in Docket No 08-07-01 Feb 18 2009
78 This approach is not without some controversy A contracted new resource in Connecticut has the potential to displace an alternative ldquocompetitiverdquo new resource in the region that would have bid at a higher price mdash had Connecticut not been allowed to designate the contract as self-supply ISO-NErsquos Internal Market Monitoring Unit has commented on this issue in a report to FERC See Internal Market Monitoring Unit ISO-NE June 5 2009
RegulatoRy assistance PRoject
28
Conclusions and Recommendations
Auction-based capacity markets in the US have been successful to date in attracting the capacity needed to maintain system reliability in an economically efficient manner In particular these markets have been successful in facilitating new demand-side resources
with ratepayers and society reaping the economic and environmental benefits However policymakers also should consider capacity markets in the context of carbon reduction policies and targets for the power sector Even markets that successfully integrate demand-side and renewable resources into the auction process are still encouraging the construction or continued operation of high-emitting supply-side resources to meet reliability targets
Existing capacity markets should be evaluated to assess whether the market is responding in this way And if it is policymakers need to critically assess whether a continuation of that market response over the coming years will make it possible to achieve the cumulative level of carbon reductions required from the power sector to avoid the worst effects of climate change Depending on the results of this inquiry policymakers may need to refine the auction rules and adopt additional policies for the power sector mdash such as those described in this paper mdash to ensure the alignment of capacity markets with both short- and long-term carbon reduction goals
More generally forward capacity markets create a revenue stream for resources that can commit to being available at times of system peak several years in the future mdash but this financial incentive is clearly not the only factor driving the mix of resources in the power sector and their resulting carbon footprint Market rules policies and regulations that affect investment and operating decisions for meeting the systemrsquos energy requirements mdash as well as those that affect access location and cost recovery for transmission and distribution facilities mdash have an enormous impact on both the short- and long-term resource mix in the electric system Policymakers will need to consider how this entire market and regulatory landscape mdash including forward capacity markets mdash can be strengthened and harmonized to reliably meet customer demand for electricity in a carbon-constrained world
29
the Role of foRwaRd caPacity MaRkets in incReasing deMand-side and otheR low-caRbon ResouRces
Cleared capacity values in the following tables represent all capacity committed by existing resources remaining in the market and all new resources that bid into the auction at or below
the market clearing price Cleared capacity includes ldquoself-suppliedrdquo or ldquoself-scheduledrdquo resources entered into the auction by LSEs However as described in this paper when the monthly billingsettlement process is completed the capacity charges allocated to the LSE will be offset (credited) for the cleared capacity delivered by these resources
Incremental capacity in the tables below reflects 1) new generation resources 2) capacity upgrades to existing generation resources 3) partial offsets to
incremental generation capacity due to capacity de-ratings to existing generation resources 4) new demand response resources 5) upgrades to existing demand response resources and 6) new energy efficiency resources
PJM Results79
PJM has conducted five Base Residual Auctions since its inception in 2007 for delivery years beginning in 20082009 (that each run from June 1 to May 31) Capacity cleared in the PJM auction is defined in terms of ldquounforcedrdquo capacity that is the capacity of a resource adjusted for availability and deliverability based on historical performance (eg forced outages)
Appendix 1
Detailed Results for PJM and ISO-NE Capacity Markets
Table 1 Generation Demand Resources and Energy Efficiency Resources
Offered and Cleared in PJM Base Residual Auctions (Unforced Capacity in MW)
Delivery Year 20082009 20092010 20102011 20112012 20122013
Generation Offered 1311648 1326142 1321248 1360679 1348730
DR Offered 7158 9368 9679 16524 98476
EE Offered - - - - 6527
Total Offered 1318806 1335510 1330927 1377203 1453733
Generation Cleared 1290614 1313389 1312515 1308566 1285274
DR Cleared 5362 8929 9390 13649 70473
EE Cleared 00 00 00 00 5689
Total Cleared 1295976 1322318 1321905 1322215 1361436
Energy efficiency resources were first eligible in the 20122013 auction
79 All information for PJM compiled from ldquo20122013 RPM Base Residual Auction Resultsrdquo at httpwwwpjmcom~mediamarkets-opsrpmrpm-auction-info2012-13-base-residual-auction-report-document-pdfashx
RegulatoRy assistance PRoject
30
Table 2 Incremental Capacity Additions and Reductions in PJM Base Residual Auctions(Installed Capacity in MW)
Delivery Year 20072008 20082009 20092010 20102011 20112012 20122013 Total
Increase inGenerationCapacity 6020 7242 12723 17762 35763 18935 98445
Decrease inGenerationCapacity -6746 -3754 -5502 -3018 -2647 -32539 -54206
Net Increase inDemand ResourceCapacity 5550 5747 2150 287 6617 79381 99732
Net Increasein EnergyEfficiency Capacity 0 0 0 0 0 6323 6323
Net Increasein InstalledCapacity 4824 9235 9371 15031 39733 72100 150294
Note Change in generation capacity is cumulative net increase in demand-side resources is relative to previous yearrsquos Base Residual Auction
Table 3 Breakdown of Incremental Capacity Resource Additionsin PJM Base Residual Auctions (Installed Capacity in MW)
Delivery Year CTGT Combined Diesel Hydro Steam Nuclear Solar Wind Total Cycle (Coal)
New 20072008 187 03 190Capacity 20082009 270 661 931Units 20092010 3995 238 530 4763 20102011 2833 5800 230 1414 10277 20112012 4164 11350 7048 11 752 23325 20122013 4038 5850 78 363 751 11080
Capacity 20072008 470 470From 20082009 1310 1310Reactivated 20092010 0Units 20102011 1600 107 1707 20112012 800 1010 1810 20122013 0
Uprates to 20072008 1145 139 800 2356 920 5360Existing 20082009 1082 340 180 1055 1960 384 5001Capacity 20092010 1522 2060 1625 614 1974 165 7960Resources 20102011 1173 1630 480 892 1603 5778 20112012 3692 1486 574 1868 2921 87 10628 20122013 2312 1643 142 1930 1260 568 7855
Total 28356 30159 2145 3963 20351 9062 11 4398 98445
Note Values represent capacity commitments Nameplate ratings of variable resources (solar and wind) are far larger than shown here
31
the Role of foRwaRd caPacity MaRkets in incReasing deMand-side and otheR low-caRbon ResouRces
Table 4 Changes to Generation Retirement Decisions
Since Reliability Pricing Model Approval (Unforced Capacity in MW)
Generation Resource Decision Changes Capacity Cleared
Withdrawn Deactivation Requests 17987
Postponed or Cancelled Retirement 13029
Reactivation 1752
ToTal 3276 8
Note Unforced capacity cleared in Base Residual Auctions from resources that withdrew their request to deactivate postponed retirement or were reactivated (ie came out of retirement or mothball state)
Table 5 PJM Base Residual Auction Clearing Price
Delivery Year Clearing Prices ($MW-day)
20072008 $4080
20082009 $11192
20092010 $10204
20102011 $17429
20112012 $11000
20122013 $1646
Note Values do not include any locational price adders Simple conversion of $MW-day to $kW-month multiply by 3 and divide by 100
Table 6 Effect of Demand-Side Resources on PJM Market Clearing Price
20122013 Base Residual Auction80
Actual Auction Results Calculated Results Without Demand-Side Resources
Clearing Prices Cleared Unforced Clearing Prices Cleared Unforced Savings
($MW-day) Capacity (MW) ($MW-day) Capacity (MW) ($MW-day)
$1646 1361435 $17878 1335682 $16232
80 Bowring Monitoring Analytics Table 20
RegulatoRy assistance PRoject
32
ISO-NE ResultsISO-NE has held three forward capacity auctions to
date The first auction (FCA 1) in February 2008 was for capacity delivery beginning in June 2010 (20102011 delivery year) The second auction (FCA 2) was held in December 2008 for delivery in 20112012 and the third
Table 7 Summary Results for ISO-NE Capacity Auctions81
Net Installed Total Resources Excess Clearing Net Price Capacity Cleared Capacity Price ($kW-month)82
Requirement (MW) (MW) ($kW-month)
FCA 1 32305 34077 1772 $450 $425
FCA 2 32528 37283 4755 $360 $312
FCA 3 31965 36996 4649 $295 $254
Table 8 Demand-Side Resources Cleared in ISO-NE Capacity Auctions (MW)81
Distributed Distributed Energy Real-Time Demand Real-Time Total Generation- Generation- Efficiency ResponseLoad Emergency Demand-Side Fossil Fuels Renewable Resources Management Generation Resources
FCA 1 46 lt02 655 978 875 2554
FCA 2 93 lt02 890 1195 759 2937
FCA 3 86 07 975 1206 630 2898
auction (FCA 3) was held in October 2009 for delivery in 20122013 ldquoClearedrdquo amounts in these tables include resources from earlier auctions that remain listed as well as new resources less resources that drop out
Note Net Installed Capacity Requirement values exclude the interconnection benefits associated with the Hydro-Queacutebec Phase III interface Excess capacity is not adjusted for Real-Time Emergency Generation in excess of the 600 MW limit Net prices reflect prorating of clearing prices due to excess capacity clearing the auction Simple conversion of $kW-month to $MW-day divide by 3 and multiply by 100
Note Demand-side values are grossed-up for avoided transmission and distribution losses and reserve margin (no reserve margin forFCA 3) Total resources cleared include excess capacity above the Net Installed Capacity Requirement Real-time emergency generation refers to distributed generation whose state air quality permit limits operation to ldquoemergencyrdquo conditions See Appendix 3
81 ISO-NE Forward Capacity Market Results at httpwwwiso-necommarketsothrmkts_datafcmcal_resultsindexhtml
82 Communication with Henry Yoshimura director Demand Resource Strategy ISO-NE March 2009
83 Eric Winkler ISO-New England ldquoThird Regional Energy Efficiency Initiative Meetingrdquo July 7 2009 and ldquoFCA Updaterdquo Demand Response Working Group Meeting Dec 2 2009 Total resources cleared (Capacity Supply Obligation) from Forward Capacity Market Auction Results for the 20102011 20112012 and 20122013 auctions at httpwwwiso-necommarketsothrmkts_datafcmcal_resultsindexhtml
33
the Role of foRwaRd caPacity MaRkets in incReasing deMand-side and otheR low-caRbon ResouRces
Step 1
System Operator (SO) Plans ldquoForwardrdquo for the Region
2012 Projection of Peak Demand = 10000 MW (incl reserves) Each ldquoLoad Serving Entityrdquo (LSE) is obligated for its 50 share
Appendix 2
Illustration of ldquoHow Forward Capacity Markets Workrdquo
SO purchases capacity in 2012 at the 2009 auction clearing price
LSE can be regulated utility or competitive retail supplier
LSE1 5000 MW
LSE2 5000 MW
R1
R1 =3500 MW capacity ldquoSelf Supplyrdquo Resources (LSE1 ownedunder contract)
RegulatoRy assistance PRoject
34
Step 2
The Regional Capacity Auction (3 Years ldquoForwardrdquo)
Step 3
System Operator Pays Cleared Resources at P and Bills LSEs(Note Self-Supply capacity is a ldquowashrdquo)
R1 R2 R3 R4 R5 R6 R7
P
R1
R3
R3
R5
R5
R2
R2
R4
R4
R6
R7
Bid Price = $ per MW-day
Quantity = MW
6500 MW P
Cleared Capacity = 10000
Supply = Capacity Committed ldquoForwardrdquo
P= Clearing price paid to all capacity clearing auction
Demand = SO Forecast of Capacity Requirements
R1-R7 = Capacity offered by Supply-Side (New built Existing Uprates) and Demand-Side (Energy Efficiency Demand Response Distrib Gen) Self-supply (R1) bids in a ldquozerordquo price New Resources set clearing price
LSE1 5000 MW
LSE2 5000 MW
R1
SOSO pays R1 3500 MW P
LSE2 pays its share of regional demand
5000 MW P
LSE1 pays its share of regional demand (5000 MW) adjusted for self-supply R1 for a net payment of 1500MW P
R1 = 3500 MW of ldquoSelf-Supplyrdquo Resources (LSE1 ownedunder contract)
In 2010Total regional peak demand of 10000 MW supplied by R1 + R2 + R3 + R4 + R5 LSE1 and LSE2 are each responsible for 50 of regional peak demand
35
the Role of foRwaRd caPacity MaRkets in incReasing deMand-side and otheR low-caRbon ResouRces
PJM Eligibility Requirements
Eligibility of demand-side resources has changed significantly over the years in PJMrsquos capacity markets In particular it was not until the most recent capacity auction (May 2009) for the
20122013 delivery year that energy efficiency became eligible to bid in PJMrsquos Base Residual Auction PJM is currently considering a tariff change to also allow energy efficiency to bid into incremental auctions
Under PJMrsquos eligibility rules an energy efficiency resource must achieve a ldquopermanentrdquo continuous reduction in electric energy consumption Examples of such a resource include lighting retrofit programs for residential commercial and industrial customers and programs to retrofit buildings with heating and cooling systems that exceed current efficiency standards To be eligible an energy efficiency resource must meet the following criteria
bull It is fully implemented throughout the delivery year without any requirement of notice dispatch or additional customer action
bull It is not reflected as a reduction in the peak load forecast used for the Base Residual Auction for the proposed delivery year
bull It exceeds relevant standards (such as building codes or appliance standards) at the time of commitment
bull It achieves the specified load reduction (expected average demand in MW) during defined summer on-peak hours84
Demand response on the other hand must be dispatchable mdash that is customer demand must be reduced when instructed For example a large supermarket with
coolers and freezers could install load management equipment that would cycle them on or off mdash and bid that demand response capability into the market85 More specifically a demand response resource must meet the following criteria
bull It is able to reduce demand for electricity up to 10 times each year for up to six consecutive hours per interruption during defined periods86
bull It is fully implemented within one hour (short lead time) or two hours (long lead time) of notice from PJM
bull In a year without calls for demand reductions it must demonstrate reliability through a test of reduction capability
bull It is registered in the Emergency Load Response Program and thus available for dispatch during PJM-declared emergency events
bull Compliance and status reports are filed as required
Multiple end-use customers can be aggregated in order to submit a single demand response offer in the capacity auction if those customers share the same curtailment service provider electric distribution company and transmission zone
In addition customer-sited distributed generation may be offered into auctions as a demand resource A hospital for example could offer to run its back-up generator on certain peak demand (eg hot summer) days to reduce its load on the system Or an industrial plant could cut back on production on such days and continue to run its on-site combustion or steam-cycle turbine
Currently energy efficiency resources may participate
Appendix 3
Eligibility Requirements for Demand-Side Resourcesin US Capacity Markets
84 Weekdays excluding holidays June through August between the hours ending 1500 and 1800 Eastern Prevailing Time (EPT)
85 If instead the supermarket replaced the existing coolers and freezers with more energy efficient ones it would bid that proposal in as an energy efficiency resource Or it could do both (replace and cycle) and bid in the capacity from the permanent savings (replacements) as energy efficiency and the dispatchable capacity (the cycling) as demand response
86 Weekdays excluding holidays from 1200 to 2000 EPT May through September and 1400 to 2200 EPT October through April
RegulatoRy assistance PRoject
36
in Base Residual Auctions for up to four consecutive delivery years In effect this means that PJM limits capacity payments for efficiency measures to four years of their measure life (rather than for the full measure life)87 In contrast a demand response resource (including distributed generation) can participate in the PJM capacity market for as long as its ability to reduce demand continues
ISO-NE Eligibility RequirementsSince the inception of ISO-NErsquos forward capacity market
in 2006 energy efficiency has qualified as an eligible demand-side resource ISO-NE defines demand resources as installed measures (products equipment systems services practices and strategies) that result in verifiable reductions in end-use consumption of electricity in the New England power system These are further categorized into ldquopassiverdquo (energy efficiency and non-dispatchable distributed generation) and ldquoactiverdquo (demand response emergency generation and dispatchable distributed generation) resources Passive demand resources are non-dispatchable but permanently reduce energy demand during peak hours Active demand resources are designed to reduce peak loads and to reduce load based on real-time system conditions or ISO-NE instructions Following are descriptions of eligible demand-side resources and performance requirements88
Passive Demand Resourcesbull On-Peak Demand Resources are measures that are
not weather-sensitive and reduce demand across a fixed set of on-peak hours such as energy-efficient commercial lighting and motors89
bull Seasonal Peak Demand Resources are weather-sensitive measures that reduce load during high-demand conditions such as energy-efficient heating and air conditioning systems Seasonal Peak Demand Resources must reduce load when actual system load is equal to 90 percent of the most recent peak load forecast for the applicable summer or winter season
Active Demand Resourcesbull Real-Time Demand Response Resources are
measures including load management and distributed generation that can be dispatched by ISO-NE as needed They must curtail electrical usage within 30 minutes of receiving a dispatch instruction and until receiving a releaserecall dispatch instruction
bull Real-Time Emergency Generation is distributed generation whose state air quality permit limits operation to ldquoemergencyrdquo conditions Generators must curtail the customerrsquos electrical usage within 30 minutes of receiving a dispatch instruction and until receiving a releaserecall dispatch instruction The amount of emergency generation that can be used to meet ISO-NErsquos capacity requirement is limited to 600 MW If the amount of real-time emergency generation that clears the auction exceeds this level payments to generators are reduced on a pro-rated basis All real-time emergency generation is treated as existing capacity
In contrast to PJM all demand-side resources in ISO-NE are eligible to bid capacity for their full measure life an approach that recognizes the full contribution of these resources to regional resource adequacy requirements and adds value to long-lived energy efficiency assets
87 FERC has directed PJM to evaluate the impact of its capacity payment period for energy efficiency resources
88 Eric Winkler and Abimael Santana ISO-NE ldquoNew Demand Resource Qualificationrdquo May 5 2009 at httpwwwiso-necomsupporttrainingcoursesfcmfcm_forum_may_5pdf
89 Summer on-peak hours are 1300 to 1700 non-holiday weekdays in June July and August Winter on-peak hours are 1700 to 1900 non-holiday weekdays in December and January
The Regulatory Assistance Project (RAP) is a global non-profit team of experts that focuses on the long-term economic and environmental sustainability of the power and natural gas sectors providing technical and policy assistance to government officials on a broad range of energy and environmental issues RAP has deep expertise in regulatory and market policies that promote economic efficiency protect the environment ensure system reliability and fairly allocate system benefits among all consumers We have worked extensively in the US since 1992 and in China since 1999 and have assisted governments in nearly every US state and many nations throughout the world RAP is now expanding operations with new programs and offices in Europe and plans to offer similar services in India in 2011 RAP functions as the hub of a network that includes many international experts and is primarily funded by foundations and federal grants
Home office
50 State Street Suite 3Montpelier Vermont 05602
802-223-8199wwwraponlineorg

RegulatoRy assistance PRoject
18
a major contributor to the regionrsquos resource adequacy requirements at this time In the most recent (third) auction 166 MW of wind capacity cleared the auction mdash with a nameplate rating an order of magnitude larger42
Unlike PJM ISO-NE does not apply a deemed on-peak capacity factor to wind and other variable generation resources Instead all such resources must provide data that demonstrate the claimed summer and winter qualified capacity The capacity factor is adjusted over time based on actual performance during specified hours
Forward Capacity Markets in the Context of Carbon Constraints
Power market rules are not constructed in a vacuum rather they are designed to address specific public policy goals As described above forward capacity markets in the US were developed to ensure resource adequacy in the power system at a reasonably competitive price In the face of growing carbon constraints however power market rules need to be redesigned to work in concert with carbon reduction goals and policies rather than at cross purposes The challenge of substantially de-carbonizing the power sector in the coming years is too great to ignore this interaction In particular policymakers should carefully consider what elements of the current planning and procurement process to achieve resource adequacy contribute to the following effects ndash and then work to revise the market rules accordingly
bull Do the market rules encourage new investments in high-emitting resources (including repowering) at the expense of low-carbon alternatives
bull Do they encourage the continued (or increased) operation of existing high-emitting power plants
bull Will they result in a build-out of capacity and cumulative emissions that conflict with the level of de-carbonization required in the power sector mdash or make attainment of that level more costly to the economy
This paper is not intended to evaluate the PJM and ISO-NE capacity markets and auction rules in any depth with respect to these issues However we offer below general observations based on the auction design and results to date in these regions and other studies Following that we provide policy recommendations related design options and additional actions for consideration
General Observations on Forward Capacity Markets and Results
Based on our review of FCM auctions to date and related studies we offer the following observations
bull The ISO-NE and PJM forward capacity markets are meeting their resource adequacy objectives Sufficient levels of capacity have cleared the market to meet each regionrsquos anticipated peak demand and adequate resources are now committed on a forward basis to ensure reliable coverage in future years (up to the 20122013 delivery year) But in a carbon-constrained world the mix of resources is as important as the quantity in both the short-term and the long-term Most resources that are available during peak demand hours also produce electricity or reduce consumption during many more (or all) hours of the year and the carbon intensity of that mix of resources will drive the level of cumulative emissions in the power sector43 As discussed in this paper capacity markets as currently designed provide compensation based on the level of available capacity not the mix of resources providing that capacity It is worth repeating here that the only (non-price) attribute a resource needs to demonstrate for resource adequacy purposes is that it will be available when called upon during the projected hours of peak system loads In a carbon-constrained world policy makers should ask whether the planning and procurement process for acquiring a sufficient level of capacity at a reasonable price is also moving the resource mix in the right direction mdash towards zero or low carbon-emitting demand- and supply-side resources
42 Compiled from auction results at httpwwwiso-necommarketsothrmkts_datafcmcal_resultsccp13fca13indexhtml
43 With the exception of gas-fired peaking units or demand response resources that are dispatched to meet (or reduce) loads only during peak system hours
19
the Role of foRwaRd caPacity MaRkets in incReasing deMand-side and otheR low-caRbon ResouRces
bull Expressly designing demand-side resources into forward capacity markets appears key to achieving all three objectives ndash resource adequacy low-carbon resource mix and reasonable price Energy efficiency and demand response resources are faring well in auction-based capacity markets mdash and this is a positive outcome for several reasons First energy efficiency and other demand-side resources can substitute for existing and planned generation that have a higher carbon footprint thereby reinforcing carbon reduction policies and targets for the region Second demand-side resources can dramatically reduce the costs of meeting the regionrsquos resource adequacy requirements mdash as evidenced by the results of the PJM and ISO-NE auctions In addition the increase in demand-side resources facilitated by capacity auctions can reduce market power because more suppliers and more resources means individual generators have less ability to affect bid offers and clearing prices And because demand-side resources lighten the load at the end of the supplydelivery chain they enhance the reliability of each link in the chain from fuel supply and generation to the local distribution network
bull Differences in the impact of demand-side resources on carbon emissions should be recognized in capacity markets and associated auction rules Energy efficiency decreases carbon emissions because (by definition) it reduces energy use for an equivalent level of service and at the margin almost all power systems are running higher carbon resources In contrast the net impact of demand response on carbon emissions will depend upon specific circumstances including the mix of
plants serving loads at the margin For example when coal is primarily serving baseload and intermediate needs emissions may increase when customers shift loads from on-peak (when natural gas is on the margin) to off-peak periods44 Elsewhere however demand response mdash including any conservation side-effect mdash may reduce emissions from less efficient peaking plants In addition demand response includes real-time emergency generation which is often fossil-fuel powered (eg by diesel or natural gas) Any analysis of the costs and benefits of demand response resources in capacity markets should account for such effects Policies and market rules for demand response should be aligned with its environmental costs and benefits45
bull Renewable generating resources are beginning to make some headway in forward capacity markets mdash in particular wind resources This is in large part because the markets described here recognize some capacity value for variable renewable resources (wind solar and run-of-river hydro) either through a deemed on-peak capacity factor or a demonstration of claimed capacity for specified on-peak periods Policymakers need to pay attention to how these values are established so they can be confident the committed capacity will be available when called on while at the same time encouraging participation of all low-carbon resources in the market More generally as renewable resources become a more significant part of the resource mix a forward capacity market creates the opportunity to recognize their aggregate capacity value to the system46
44 For example PJM recently released figures on carbon emissions of generating units that operate on the margin during on-peak vs off-peak hours See httpwwwpjmcom~mediaabout-pjmnewsroom2010-releases20100325-pjm-reports-new-carbon-dioxide-emissions-dataashx and httpwwwpjmcomdocuments~mediadocumentsreportsco2-emissions-reportashx
45 See section 316 and Mechanism E in Attachment 1 of Pacific Northwest National Laboratory The Smart Grid An Estimate of the Energy and CO2 Benefits January 2010 (PNNL 19112) at httpenergyenvironmentpnlgovnewspdfPNNL-19112_Revision_1_Finalpdf
46 Variable renewable resources will qualify for higher capacity value if they are bundled with other resources for reliability (eg demand response hydroelectric dams or energy storage) In addition confidence in the capacity value of variable resources increases as their geographic diversity on the system increases See for example the report on the Eastern Wind Integration and Transmission Study at httpwwwnrelgovwindsystemsintegrationpdfs2010ewits_final_reportpdf
RegulatoRy assistance PRoject
20
bull Nonetheless renewable resources are hard-pressed to successfully compete with the thousands of megawatts of existing and new fossil-fuel resources participating in these auctions that are able to bid below the true societal cost of their operations under current market rules In fact capacity auctions as currently designed can breathe new economic life into high carbon-emitting plants that were previously planned for significantly reduced operations or retirement Along with new capacity from fossil-fuel generation allowing such a large amount of existing capacity from high carbon emitters to clear the auction is likely to crowd out renewable resources that are able to address resource adequacy requirements equally well Such results may not represent an ldquoefficientrdquo (or desirable) outcome for a carbon-constrained power sector This is especially true where the carbon costs of a fossil-fuel plant are not fully recognized in the energy market that plant also will be bidding into
The Electric Power Research Institute modeled the effect of various levels of carbon taxes or allowance prices in the upper Midwest (coal-dependent) and in Texas (heavily reliant on natural gas) The study found that close to a doubling of the wholesale prices of electricity in the Midwest region (through carbon-related charges) would produce only a 4 percent reduction in regional emissions given the current generation mix Similar results were observed for Texas where natural gas plants are on the margin49 And in the Northeastern US due to initially low carbon prices and a host of factors that dampen the price signal the Regional Greenhouse Gas Initiative (RGGI) has not yet resulted in generator operational changes50 One of those dampening factors is the single clearing price that is typically set through wholesale energy markets mdash which dilutes the market signal sent by a price on carbon emissions by allowing fossil-fueled plants to recover
most or all of their allowance costs through higher clearing prices reflecting the cost of allowances51
Studies also have shown that the price of carbon must rise (and be maintained) at very high levels to obtain sufficient market pull for the level of new investments in clean generation required For example a recent analysis in California concluded that it would take a carbon price of $100 per tonne52 to make economic investments in renewable resources compared to fossil fuel-fired generation in order to reach carbon reduction targets in the power sector beyond what current state requirements will achieve53 Further price signals may be diluted if a portion of the carbon allowances are allocated in a manner that shields high-emitting power plants from carbon costs or if high-emitters located outside the capped region can sell into the market on a long-term basis
Carbon Pricing Alone Is Insufficient to De-carbonize the Generation Mix
bull A market price for capacity or energy that favors the construction and operation of high carbon-emitting resources over clean resources will lead to increases mdash rather than reductions mdash in the cumulative level of carbon emissions in the power sector A carbon tax or carbon cap-and-trade regime internalizes some or all of the otherwise un-priced carbon costs of electricity production and would improve the relative economics of clean resources in both forward capacity and energy markets However carbon pricing alone may be insufficient to change the dispatch of existing high-emitting power plants or their ability to clear these capacity markets (and be paid additional revenues as a result) in such overwhelming numbers47 In fact the very modest impact of carbon pricing on the performance of fossil-fuel plants has been documented in several reports48 (See text box below)
47 With or without carbon prices policymakers also might want to consider the implications of paying existing power plants the market clearing price for capacity mdash and the potential windfall profits for plant owners mdash for making no changes in plant operations See for example Ezra Hausman Paul Peterson David White and Bruce Biewald Synapse Energy Economics Inc RPM 2006 Windfall Profits for Existing Base Load Units in PJM An Update of Two Case Studies Feb 2 2006 at wwwsynapse-energycom
21
the Role of foRwaRd caPacity MaRkets in incReasing deMand-side and otheR low-caRbon ResouRces
bull Carbon pricing alone will have limited impact on consumer decisions to invest in permanently reducing their peak demand by making cost-effective investments in energy efficiency Well-designed time-varying pricing options can successfully shift demand from high-price hours to lower price hours54 Such shifting also reduces peak demand on transmission and distribution systems Overall energy use will decline somewhat in response to price But long-term reduction in energy use due to price increases is relatively small The numerous market barriers to capturing the full cost-effective potential of energy efficiency ndash through improvements in building construction practices and industrial processes retrofits of existing buildings and installations of high-efficiency appliances and equipment in homes and businesses ndash are well-documented They include lack of information high first-costs consumersrsquo high discount rates and the landlord-tenant split incentive problem among others55 Recent empirical analysis of demand elasticities suggests that the long-term price elasticity of demand for electricity is even lower than earlier studies have indicated for both liberalized and regulated markets (See text box on page 21)
In sum while forward capacity markets are meeting their resource adequacy objectives and clearing an impressive amount of clean low cost demand-side resources on balance these markets (as currently designed) are not working sufficiently in concert with carbon reduction goals and policies in the face of growing carbon constraints For the reasons discussed above carbon pricing alone
48 See Testimony of Richard Cowart Regulatory Assistance Project Before the Committee on Energy and Commerce Subcommittee on Energy and Environment US House of Representatives April 23 2009 ldquoThe Consumer Allocation for Efficiency How Allowance Allocations Can Protect Consumers Mobilize Efficiency and Contain the Costs of GHG Reductionrdquo at httpenergycommercehousegovPress_11120090423testimony_cowartpdf
49 See Victor Niemeyer ldquoThe Change in Profit Climate How Will Carbon-Emissions Policies Affect the Generation Fleetrdquo Public Utilities Fortnightly May 2007 at 20 24
50 See ldquoRGGI marks its first year with success and lesson on effect of market pressurerdquo Electric Utility Week Dec 14 2009 Ten Northeast and Mid-Atlantic states participate in RGGI the first mandatory cap-and-trade program in the US Connecticut Delaware Maine Maryland Massachusetts New Hampshire New Jersey New York Rhode Island and Vermont Nine of them participate in either the ISO-NE or PJM forward capacity markets described in this paper
51 PJM Interconnection ldquoPotential Effects of Proposed Climate Change Policies on PJMrsquos Energy Marketrdquo Jan 23 2009 p 5 See also ldquoBecause Thatrsquos Where the Money Is The FERCrsquos Ability to Reduce the Cost of Slowing Global Warmingrdquo Samuel A Wolfe Chief Counsel New Jersey Board of Public Utilities December 2009 at httpwwwnarucorgpublicationsWOLFE-20Panel203pdf
Demand for Power Is Relatively Price-Insensitive mdash Even Over the Long Term
Modeling by the US Department of Energy suggests that a 10 percent increase in power prices will reduce demand for electricity by just 25 percent to 3 percent over 20 years assuming that the price effects persist over that entire period56 This would only offset the normally expected US load growth in two out of those 20 years57
More recently a 2009 empirical analysis of the demand for electricity in the US concludes that price elasticity of residential demand has actually decreased since retail price deregulation was first introduced in the US The results suggest that a 10 percent increase in power prices will reduce residential electricity demand more on the order of 12 percent to 17 percent based on 2001-2008 data for both deregulated and regulated states58 Price responsiveness is further dampened by the income-elasticity of demand which is positively correlated with consumption As incomes increase consumption of electricity goes up and the conservation impact of any price increase is diminished59 The equivalent historical figure for a 10 percent increase in power prices in the UK residential sector is -23 percent but the income-elasticity is such that a 10 percent increase in income results in an increase of demand of 34 percent ndash ie household income is just as important as energy price in determining energy demand60
RegulatoRy assistance PRoject
22
is unlikely to shift the power sector resource mix at the pace or scale required to meet aggressive carbon reduction targets ndash or correspondingly to substantially change the dominance of high-carbon resources clearing forward capacity auctions under current market rules An increasing number of studies makes a compelling case that our economy and our society cannot afford this dominance to persist much longer if we are to contain climate change to a livable level In fact close to full de-carbonization of the
power sector is being discussed in international forums as the only way to meet essential carbon reduction targets by 205061 While capacity markets alone are unlikely to support the full value of clean energy resources in a carbon-constrained power sector by themselves with appropriate design elements they can serve to reinforce actions taken at federal regional and state levels that provide larger and longer lasting commitments to clean demand-side and renewable resources62
52 A tonne or metric ton is a unit of mass equal to 1000 kilograms (roughly 2205 pounds) or approximately the mass of one cubic meter of water at four degrees Celsius A tonne is not the same as either a ldquoshortrdquo ton (2000 pounds) or a ldquolongrdquo ton (2240 pounds)
53 Energy and Environmental Economics Inc Greenhouse Gas Modeling of Californiarsquos Electricity Sector to 2020 Updated Results of the GHG Calculator Version 3 prepared for the California Public Utilities Commission October 2009 pp 66-67 at httpwwwethreecomdocumentsGHG_102209CPUC_GHG_Final_Report_28Oct09pdf
54 Ahmad Faruqui and Sanem Sergici The Brattle Group ldquoHousehold Response to Dynamic Pricing of Electricity A Survey of the Experimental Evidencerdquo Jan 10 2009 at httpwwwhksharvardeduhepgPapers2009The20Power20of20Experimentation20_01-11-09_pdf
55 See for example American Council for an Energy Efficient Economy ldquoQuantifying the Effects of Market Failures in the End-Use of Energyrdquo pp iii-vi 2007 at httpoldaceeeorgenergyIEAmarketbarrierspdf This study details the various types of market barriers to end-use energy efficiency and reports that up to 50 percent of residential energy use in the US is affected by such barriers
56 The US Department of Energyrsquos National Energy Modeling System (NEMS) has price elasticity built into it The long-run elasticity (assuming price effects remain for 20 years) are ndash031 for residential electric use and ndash025 for commercial electric use See Steven H Wade ldquoPrice Responsiveness in the NEMS Buildings Sector Modelrdquo in Energy Information Administrationrsquos Issues in Midterm Analysis and Forecasting 1999 pp 55 58 table 1 at httpwwweiadoegovoiafissuespdf060799pdf
57 This would require a much larger rate increase just to offset expected load growth over 20 years let alone to reduce demand sufficiently to permit absolute reductions in emissions from the nationrsquos huge generation fleet See Testimony of Richard Cowart
58 T Nakajima and S Hamori ldquoChange in Consumer Sensitivity to Electricity Prices in Response to Retail Deregulation A Panel Empirical Analysis of the Residential Demand for Electricity in the United Statesrdquo Energy Policy (2010) available at wwwsciencedirectcom
59 Ibid
60 John Dimitropoulas Lester C Hunt and Gary Judge ldquoEstimating Underlying Energy Demand Trends Using UK Annual Datardquo at httpuserwebportacuk~judgegAEL_04pdf
61 See for example Meeting Carbon Budgets ndash The Need for a Step Change Progress Report to Parliament Committee on Climate Change October 2009 at httpwwwthecccorgukreportsprogressreports Christopher Jones and Jean-Michel Glachant Why and How the European Union Can Get a (Near to) Carbon-Free Energy System in 2050 MIT Center for Energy and Environmental Policy March 2010 at httpdownloadsthecccorgukdocs2166720CCC20Executive20Summary20AW20v4pdf Roadmap 2050 A practical guide to a prosperous low-carbon Europe The European Climate Foundation April 2010 at wwwroadmap2050eu
62 Without such policies it is unlikely that even RGGIrsquos modest carbon reduction goals will be achieved See Paul Peterson Doug Hurley and David White Synapse Energy Economics Inc ISO New England Scenario Analysis Companion Report Constructing a Future That Meets Regional Goals Aug 8 2007 at wwwsynapse-energycom
23
the Role of foRwaRd caPacity MaRkets in incReasing deMand-side and otheR low-caRbon ResouRces
ISO-NE Rules for Emergency Generators Advance Environmental Goals
Emergency (ldquobackuprdquo) generators typically are diesel-fired and states in New England and elsewhere in the US have restricted the number of hours and days they may be operated through the state permitting process At the time the first regional demand response tariffs were being designed in New England a collaborative of energy regulators environmental regulators the ISO utilities and other stakeholders realized that active demand response programs could lead to substantial incentives for diesel-fired backup generators to operate more often when air quality was at its worst Regulators and the ISO proposed a rule limiting those generators to run for reliability purposes during system emergencies This is a concrete example of reliability rules being written to advance environmental goals as well as power system needs63 In addition a regional working group developed model emissions standards for small generators for statesrsquo consideration64
To reinforce regional air quality policies and goals ISO-NE limits the total amount of emergency generators in the regional capacity market to 600 MW To the extent any excess amount clears the auction capacity payments to these resources are pro-rated
63 See Cowart and Raab p 26
64 See Model Regulations for the Output of Specified Air Emissions From Smaller Scale Electric Generation Resources Oct 31 2002 at httpwwwraponlineorgshowpdfaspPDF_URL=22docsrap_issuesletter-outputbasedemissioninsert_2003_07pdf22
65 Edward S Rubin Carnegie Mellon University ldquoA Performance Standards Approach to Reducing CO2 Emissions for Electric Power Plantsrdquo June 2009 at httpwwwpewclimateorgpublicationsreportcoal-initiative-series-performance-standards-approach-reducing-co2-emissions-ele Also see Chris Simpson and Brenda Hausauer ldquoEmissions Performance Standards in Selected Statesrdquo Regulatory Assistance Project Research Brief November 2009 at httpwwwraponlineorgdocsRAP_Simpson_EPSResearchBrief_2009_11_13pdf
Policy Recommendations and Auction Design Options
We present below recommendations and a menu of auction design options for forward capacity markets that support and enhance carbon policies and carbon reduction targets
bull Power market rules should be constructed to recognize and limit the adverse environmental consequences of power generation The power system and the environment are inextricably linked Explicit consideration of environmental costs and benefits of various electricity resources is not only reasonable but necessary to meet the enormous challenge of climate change
bull Forward capacity markets should reinforce carbon reduction policies which could be accomplished by incorporating one or more of the following into the auction rules
Auction rules could apply an Emissions Performance Standard (EPS) to promote capacity commitments from low-carbon resources and discourage bids from high-emitting power plants An EPS can be expressed as a maximum level of greenhouse gas emissions per unit of electrical output or as a percentage reduction in (annual) plant emissions It can vary with fuel type and incorporate other design variations65 It may be appropriate to adopt an EPS mdash within the auction qualification rules or by regulation mdash particularly if current market signals are not sufficiently
discouraging new construction or repowering of high-emitting generating resources with long lifetimes while forward capacity markets are providing a new revenue stream to keep them running
RegulatoRy assistance PRoject
24
Auction rules could disqualify inefficient generators from participating (and from receiving capacity revenue) or more generally require their retirement through financial incentives regulations or both66 Since 2007 China has been phasing out such plants and intends to retire approximately 50 gigawatts (GW) of small inefficient coal-fired power plants nationwide and 7 GW to 10 GW of small natural gas-fired units as well as halt construction of small inefficient power plants The policy is being put in place three ways the direct rescission of operating permits the transfer of generation rights and price reductions
Capacity payments could vary by the emissions rate of the resource Instead of one price paid to all generation that clears the auction adders could be applied to payments for low-emitting units and deductions could be applied to high-emitting units67 For example a sliding-scale percentage reduction to the per-unit ($kW-month or $MW-day) clearing price could be established based on the average annualized carbon footprint of fossil-fuel resources whereas a price adder above the clearing price could be established for zero-emitting resources
Imputed ldquocarbon addersrdquo could help curtail high-emitting resources Carbon adders are imputed costs that reflect at least a portion of the societal cost of emissions They are generally
used in the context of resource planning and acquisition by a regulated LSE mdash as a way of ensuring that high-carbon risks and low-carbon alternatives are properly valued in the resource selection process But these imputed costs do not get passed on to ratepayers or consumers for every unit of power consumed in contrast to carbon pricing68 Similarly the rules in a forward capacity market could be modified so that carbon adders are applied in determining what resources clear the auction (and will receive the market clearing price for their capacity commitment)
A ldquozero-carbon resource portfolio standardrdquo could establish auctions for separate tranches of resources by emissions level For example one tranche could include energy efficiency and renewable resources The size of each tranche would be based on carbon reduction goals for the region The higher the goals the larger the tranche for energy efficiency and renewable resources These resources decrease carbon emissions because at the margin most power systems are running higher carbon resources
bull Policymakers should consider a longer price commitment in forward capacity markets mdash at least for low-carbon resources The contract period for new capacity in these markets is short (one year in PJM up to five years in ISO-NE) in part so there is greater certainty over forecasts of resource needs for system reliability (to mitigate the risk of over-supply)
66 Small and old coal plants are the most inefficient and polluting both in terms of greenhouse gases and particulate matter By some estimates 50 MW plants may use as much as 200 grams more per unit of electricity output than a plant larger than 300 MW See Frederick Weston Rebecca A Schultz David Moskovitz and Max Dupuy Regulatory Assistance Project ldquoChinarsquos Climate Change Initiatives Do new policies adopted in China offer any guidance for the transformation of the US power sector in a carbon-constrained worldrdquo November 2009 at httpwwwraponlineorgdocsRAP_China20Climate20Initiatives_NARUC_2009_11_01docx
67 See N Jonathan Peress and Kenneth A Colburn ldquoElectrical Connections Aligning Capacity Market Changes With RGGI in the Northeastrdquo Discussion Draft March 2005 at httpwwwpucnhgovEPABSymbiotic202005-03-1820Peress-Colburn20Letter20to20FERC-Woodpdf
68 Both high carbon resources and low carbon resources clearing in power markets (characterized by single-price auctions) are paid the same price So whenever fossil resources are on the margin (most of the time in most places) consumers are seeing the same price for both fossil and clean resources and the cost of carbon allowances (or carbon taxes) for that marginal resource is reflected in the clearing price for all power bought in the market Carbon adders on the other hand are not actually paid to any resource or reflected in prices for all units sold in the market
25
the Role of foRwaRd caPacity MaRkets in incReasing deMand-side and otheR low-caRbon ResouRces
Auction winners can generally participate in future auctions and receive the market clearing price but have no assurance of future prices Moreover under current rules in PJM energy efficiency resources cannot receive capacity payments over the full life of the measures mdash only for four consecutive delivery years This constraint puts energy efficiency on a different footing than other demand resources mdash as well as all supply-side resources mdash which are paid for their capacity as long as they provide the benefit
The short commitment period and lack of price certainty may not provide market signals that are strong and consistent enough to ensure sufficient new generation or encourage plant operators and investors to make efficient choices for the long-term mdash even where carbon prices are expected to increase substantially in the future due to a dramatically declining carbon cap or a high carbon tax Allowing clean resources to opt for a longer period of time over which the price is known would in particular facilitate renewable resources whose typically high upfront capital costs and low operating costs mdash compared to natural gas-fired plants in particular mdash may require such a long-term commitment to procure financing69 Another option might be to establish fixed floor prices for clean energy resources for a long-term period to provide assurance of a minimum revenue stream
bull Regional load forecasting should be reviewed for treatment of demand-side resources acquired outside the capacity market In particular the system operator determines the capacity that will be auctioned for each delivery year (three years hence) based on a 10-year load forecast which is updated on
an annual basis Under the current planning process in forward capacity markets this forecast only reflects the demand-side resources that have cleared in prior auctions The system operatorrsquos load projections do not take into consideration any load reductions from demand-side resources procured outside of the auction such as energy efficiency programs that LSEs have committed (or are obligated) to fund and implement in the coming one to three years or beyond70 If the magnitude of these load reductions is substantial the ISO may be systematically overstating the level of capacity put out to bid for each delivery year Depending upon the existing mix of resources and market conditions in the region this overstatement may have a sizeable impact not only on the level of cleared capacity and the market price but on the resulting resource mix and level of carbon emissions as well
Additional Actions
Careful design of the planning process and auctions undertaken through forward capacity markets can help to ensure that they reinforce and do not work at cross purposes with climate reduction goals and targets However forward capacity market signals (capacity prices) are only one component of a market and regulatory landscape that affects investment and operating decisions in the power sector Market rules and procurement policies that affect system energy requirements ndash as well as policies and regulations that affect access location and cost recovery for transmission and distribution facilities ndash have an enormous impact on both the short- and long-term resource mix
It is beyond the scope of this paper to fully explore how
69 LSEs in PJM and ISO-NE can contract for generating resources through the bilateral market to hedge energy and capacity costs and to meet renewable energy standards Renewable resource projects that successfully negotiate such contracts if they are long term may not need a long-term commitment in the forward capacity market Still a short-term capacity payment stream with uncertain prices thereafter weakens the ability of renewable resources to secure long-term financing
70 Some of the econometric models that the system operators use for their load forecasts may capture the impacts of federal appliance standards and building codes However to our knowledge there has been no explicit accounting to date for the impacts of state and utility energy efficiency programs where the capacity is not bid into the auctions
RegulatoRy assistance PRoject
26
market rules and other policies and regulations can be harmonized and strengthened to meet customersrsquo energy needs reliably in a carbon-constrained world Larger and longer lasting commitments to demand-side and renewable resources are certainly needed to ensure a mix of resources that will significantly reduce greenhouse gas emissions in the power sector This has been the conclusion of US policymakers who have put in place additional policies to facilitate long-term acquisition of low-carbon resources in regions that operate both forward capacity markets and a cap-and-trade program (under RGGI)71
bull States have adopted a variety of mechanisms for sustained and aggressive energy efficiency programs
bull Strong building codes and equipment standards
bull Stable funding through a system benefit charge
bull Third-party administration of programs or where the utility is the efficiency portfolio manager decoupling of utility profits from revenues financial incentives for shareholders or both
bull Recycling of carbon auction proceeds into energy efficiency investments
bull Some states require long-term resource plans or resource procurement plans that must include energy efficiency Therersquos renewed interest in long-term planning and procurement particularly for demand-side and renewable resources following a period
where these efforts were largely abandoned with electric industry restructuring and development of organized markets72
bull Several states have adopted energy efficiency resource standards that require achievement of specified energy-saving targets73
bull Most of the states have renewable energy standards74 and several states require long-term contracting of renewable resources to meet the standards75
bull Connecticut Maryland Pennsylvania and Rhode Island require contract terms of 10 years or longer
bull New York requires central procurement of renewable energy credits by a state agency under long-term contract Illinois is likely to acquire long-term contracts for renewable resources under its central procurement mandate
bull Massachusettsrsquo Green Power Partnership purchases renewable energy credits for up to 10 years using its renewable energy fund
These are just examples and certainly not an exhaustive list of the ways in which careful design of forward capacity markets coupled with additional policies at the federal regional and state level can serve to reinforce both resource adequacy requirements and carbon reduction goals
71 Regulatory Assistance Project policy grids summarize state-by-state requirements for resource planning and energy efficiency at httpwwwraponlineorgFeatureaspselect=116 For a summary of renewable energy standards in the US see Ryan Wiser and Galen Barbose Lawrence Berkeley National Laboratory ldquoState of the States Update on RPS Policies and Progressrdquo State-Federal RPS Collaborative Nov 18 2009 at httpwwwcleanenergystatesorgMeetingsRPS_Summit_09WISER_RPS_Summit2009pdf
72 More broadly 30 states nationwide require integrated resource plans or resource procurement plans that include energy efficiency
73 Includes states with strict energy efficiency standards states with Commission-ordered efficiency targets states that allow efficiency to count toward renewable energy standards and states with a rate cap that triggers a relaxation of requirements See Laura A Furrey Steven Nadel and John A ldquoSkiprdquo Laitner ACEEE Laying the Foundation for Implementing a Federal Energy Efficiency Resource Standard March 2009 at httpaceeeorgpubse091htm
74 Some 29 US states and the District of Columbia have renewable energy standards five other states have non-binding goals See Wiser and Barbose
75 For a US database of state incentives for renewable energy and energy efficiency see httpwwwdsireusaorg
27
the Role of foRwaRd caPacity MaRkets in incReasing deMand-side and otheR low-caRbon ResouRces
An example of an approach that attempts to ldquomarryrdquo integrated least-cost resource planning with forward capacity markets is the resource planning and procurement process recently established by the Connecticut Legislature76 The law requires the utilities Energy Advisory Board and Department of Public Utility Control to plan for current and future energy and capacity needs and provide a mechanism for procuring resources that meet specified economic reliability and environmental objectives77 to satisfy the identified need Further the law requires that resource needs first be met through energy efficiency and demand reduction resources that are cost effective reliable and feasible Based on the resulting resource plans LSEs enter into
contracts to acquire the required capacity (level and mix) through a competitive bidding process The law also requires that any resources winning contracts for capacity agree to let the LSE bid that capacity into the forward capacity auction as a ldquoself-suppliedrdquo resource This approach permits LSEs to determine both the quantity and mix of resources through integrated resource planning that will meet their resource adequacy requirements and state policy goals (eg carbon reduction) The LSE pays the contracted capacity price (under its bilateral contracts) instead of paying the auction clearing price to everyone that offers capacity into the forward capacity market (eg existing fossil fuel or nuclear plants)78
Connecticutrsquos Marriage of Resource Planning and Markets
76 Conn Gen Stat sectsect 16a-3a 16a-3b and 16a-3c
77 Costs and benefits cost-effectiveness cost impacts on customers the extent to which load growth can be eliminated and peak demand reduced reliability including energy security and economic risks impacts on meeting state environmental standards including emissions goals optimization of existing generation and generation sites the extent to which renewable resources can be used to meet needs and fuel types diversity and supply See Department of Public Utility Control Final Order in Docket No 08-07-01 Feb 18 2009
78 This approach is not without some controversy A contracted new resource in Connecticut has the potential to displace an alternative ldquocompetitiverdquo new resource in the region that would have bid at a higher price mdash had Connecticut not been allowed to designate the contract as self-supply ISO-NErsquos Internal Market Monitoring Unit has commented on this issue in a report to FERC See Internal Market Monitoring Unit ISO-NE June 5 2009
RegulatoRy assistance PRoject
28
Conclusions and Recommendations
Auction-based capacity markets in the US have been successful to date in attracting the capacity needed to maintain system reliability in an economically efficient manner In particular these markets have been successful in facilitating new demand-side resources
with ratepayers and society reaping the economic and environmental benefits However policymakers also should consider capacity markets in the context of carbon reduction policies and targets for the power sector Even markets that successfully integrate demand-side and renewable resources into the auction process are still encouraging the construction or continued operation of high-emitting supply-side resources to meet reliability targets
Existing capacity markets should be evaluated to assess whether the market is responding in this way And if it is policymakers need to critically assess whether a continuation of that market response over the coming years will make it possible to achieve the cumulative level of carbon reductions required from the power sector to avoid the worst effects of climate change Depending on the results of this inquiry policymakers may need to refine the auction rules and adopt additional policies for the power sector mdash such as those described in this paper mdash to ensure the alignment of capacity markets with both short- and long-term carbon reduction goals
More generally forward capacity markets create a revenue stream for resources that can commit to being available at times of system peak several years in the future mdash but this financial incentive is clearly not the only factor driving the mix of resources in the power sector and their resulting carbon footprint Market rules policies and regulations that affect investment and operating decisions for meeting the systemrsquos energy requirements mdash as well as those that affect access location and cost recovery for transmission and distribution facilities mdash have an enormous impact on both the short- and long-term resource mix in the electric system Policymakers will need to consider how this entire market and regulatory landscape mdash including forward capacity markets mdash can be strengthened and harmonized to reliably meet customer demand for electricity in a carbon-constrained world
29
the Role of foRwaRd caPacity MaRkets in incReasing deMand-side and otheR low-caRbon ResouRces
Cleared capacity values in the following tables represent all capacity committed by existing resources remaining in the market and all new resources that bid into the auction at or below
the market clearing price Cleared capacity includes ldquoself-suppliedrdquo or ldquoself-scheduledrdquo resources entered into the auction by LSEs However as described in this paper when the monthly billingsettlement process is completed the capacity charges allocated to the LSE will be offset (credited) for the cleared capacity delivered by these resources
Incremental capacity in the tables below reflects 1) new generation resources 2) capacity upgrades to existing generation resources 3) partial offsets to
incremental generation capacity due to capacity de-ratings to existing generation resources 4) new demand response resources 5) upgrades to existing demand response resources and 6) new energy efficiency resources
PJM Results79
PJM has conducted five Base Residual Auctions since its inception in 2007 for delivery years beginning in 20082009 (that each run from June 1 to May 31) Capacity cleared in the PJM auction is defined in terms of ldquounforcedrdquo capacity that is the capacity of a resource adjusted for availability and deliverability based on historical performance (eg forced outages)
Appendix 1
Detailed Results for PJM and ISO-NE Capacity Markets
Table 1 Generation Demand Resources and Energy Efficiency Resources
Offered and Cleared in PJM Base Residual Auctions (Unforced Capacity in MW)
Delivery Year 20082009 20092010 20102011 20112012 20122013
Generation Offered 1311648 1326142 1321248 1360679 1348730
DR Offered 7158 9368 9679 16524 98476
EE Offered - - - - 6527
Total Offered 1318806 1335510 1330927 1377203 1453733
Generation Cleared 1290614 1313389 1312515 1308566 1285274
DR Cleared 5362 8929 9390 13649 70473
EE Cleared 00 00 00 00 5689
Total Cleared 1295976 1322318 1321905 1322215 1361436
Energy efficiency resources were first eligible in the 20122013 auction
79 All information for PJM compiled from ldquo20122013 RPM Base Residual Auction Resultsrdquo at httpwwwpjmcom~mediamarkets-opsrpmrpm-auction-info2012-13-base-residual-auction-report-document-pdfashx
RegulatoRy assistance PRoject
30
Table 2 Incremental Capacity Additions and Reductions in PJM Base Residual Auctions(Installed Capacity in MW)
Delivery Year 20072008 20082009 20092010 20102011 20112012 20122013 Total
Increase inGenerationCapacity 6020 7242 12723 17762 35763 18935 98445
Decrease inGenerationCapacity -6746 -3754 -5502 -3018 -2647 -32539 -54206
Net Increase inDemand ResourceCapacity 5550 5747 2150 287 6617 79381 99732
Net Increasein EnergyEfficiency Capacity 0 0 0 0 0 6323 6323
Net Increasein InstalledCapacity 4824 9235 9371 15031 39733 72100 150294
Note Change in generation capacity is cumulative net increase in demand-side resources is relative to previous yearrsquos Base Residual Auction
Table 3 Breakdown of Incremental Capacity Resource Additionsin PJM Base Residual Auctions (Installed Capacity in MW)
Delivery Year CTGT Combined Diesel Hydro Steam Nuclear Solar Wind Total Cycle (Coal)
New 20072008 187 03 190Capacity 20082009 270 661 931Units 20092010 3995 238 530 4763 20102011 2833 5800 230 1414 10277 20112012 4164 11350 7048 11 752 23325 20122013 4038 5850 78 363 751 11080
Capacity 20072008 470 470From 20082009 1310 1310Reactivated 20092010 0Units 20102011 1600 107 1707 20112012 800 1010 1810 20122013 0
Uprates to 20072008 1145 139 800 2356 920 5360Existing 20082009 1082 340 180 1055 1960 384 5001Capacity 20092010 1522 2060 1625 614 1974 165 7960Resources 20102011 1173 1630 480 892 1603 5778 20112012 3692 1486 574 1868 2921 87 10628 20122013 2312 1643 142 1930 1260 568 7855
Total 28356 30159 2145 3963 20351 9062 11 4398 98445
Note Values represent capacity commitments Nameplate ratings of variable resources (solar and wind) are far larger than shown here
31
the Role of foRwaRd caPacity MaRkets in incReasing deMand-side and otheR low-caRbon ResouRces
Table 4 Changes to Generation Retirement Decisions
Since Reliability Pricing Model Approval (Unforced Capacity in MW)
Generation Resource Decision Changes Capacity Cleared
Withdrawn Deactivation Requests 17987
Postponed or Cancelled Retirement 13029
Reactivation 1752
ToTal 3276 8
Note Unforced capacity cleared in Base Residual Auctions from resources that withdrew their request to deactivate postponed retirement or were reactivated (ie came out of retirement or mothball state)
Table 5 PJM Base Residual Auction Clearing Price
Delivery Year Clearing Prices ($MW-day)
20072008 $4080
20082009 $11192
20092010 $10204
20102011 $17429
20112012 $11000
20122013 $1646
Note Values do not include any locational price adders Simple conversion of $MW-day to $kW-month multiply by 3 and divide by 100
Table 6 Effect of Demand-Side Resources on PJM Market Clearing Price
20122013 Base Residual Auction80
Actual Auction Results Calculated Results Without Demand-Side Resources
Clearing Prices Cleared Unforced Clearing Prices Cleared Unforced Savings
($MW-day) Capacity (MW) ($MW-day) Capacity (MW) ($MW-day)
$1646 1361435 $17878 1335682 $16232
80 Bowring Monitoring Analytics Table 20
RegulatoRy assistance PRoject
32
ISO-NE ResultsISO-NE has held three forward capacity auctions to
date The first auction (FCA 1) in February 2008 was for capacity delivery beginning in June 2010 (20102011 delivery year) The second auction (FCA 2) was held in December 2008 for delivery in 20112012 and the third
Table 7 Summary Results for ISO-NE Capacity Auctions81
Net Installed Total Resources Excess Clearing Net Price Capacity Cleared Capacity Price ($kW-month)82
Requirement (MW) (MW) ($kW-month)
FCA 1 32305 34077 1772 $450 $425
FCA 2 32528 37283 4755 $360 $312
FCA 3 31965 36996 4649 $295 $254
Table 8 Demand-Side Resources Cleared in ISO-NE Capacity Auctions (MW)81
Distributed Distributed Energy Real-Time Demand Real-Time Total Generation- Generation- Efficiency ResponseLoad Emergency Demand-Side Fossil Fuels Renewable Resources Management Generation Resources
FCA 1 46 lt02 655 978 875 2554
FCA 2 93 lt02 890 1195 759 2937
FCA 3 86 07 975 1206 630 2898
auction (FCA 3) was held in October 2009 for delivery in 20122013 ldquoClearedrdquo amounts in these tables include resources from earlier auctions that remain listed as well as new resources less resources that drop out
Note Net Installed Capacity Requirement values exclude the interconnection benefits associated with the Hydro-Queacutebec Phase III interface Excess capacity is not adjusted for Real-Time Emergency Generation in excess of the 600 MW limit Net prices reflect prorating of clearing prices due to excess capacity clearing the auction Simple conversion of $kW-month to $MW-day divide by 3 and multiply by 100
Note Demand-side values are grossed-up for avoided transmission and distribution losses and reserve margin (no reserve margin forFCA 3) Total resources cleared include excess capacity above the Net Installed Capacity Requirement Real-time emergency generation refers to distributed generation whose state air quality permit limits operation to ldquoemergencyrdquo conditions See Appendix 3
81 ISO-NE Forward Capacity Market Results at httpwwwiso-necommarketsothrmkts_datafcmcal_resultsindexhtml
82 Communication with Henry Yoshimura director Demand Resource Strategy ISO-NE March 2009
83 Eric Winkler ISO-New England ldquoThird Regional Energy Efficiency Initiative Meetingrdquo July 7 2009 and ldquoFCA Updaterdquo Demand Response Working Group Meeting Dec 2 2009 Total resources cleared (Capacity Supply Obligation) from Forward Capacity Market Auction Results for the 20102011 20112012 and 20122013 auctions at httpwwwiso-necommarketsothrmkts_datafcmcal_resultsindexhtml
33
the Role of foRwaRd caPacity MaRkets in incReasing deMand-side and otheR low-caRbon ResouRces
Step 1
System Operator (SO) Plans ldquoForwardrdquo for the Region
2012 Projection of Peak Demand = 10000 MW (incl reserves) Each ldquoLoad Serving Entityrdquo (LSE) is obligated for its 50 share
Appendix 2
Illustration of ldquoHow Forward Capacity Markets Workrdquo
SO purchases capacity in 2012 at the 2009 auction clearing price
LSE can be regulated utility or competitive retail supplier
LSE1 5000 MW
LSE2 5000 MW
R1
R1 =3500 MW capacity ldquoSelf Supplyrdquo Resources (LSE1 ownedunder contract)
RegulatoRy assistance PRoject
34
Step 2
The Regional Capacity Auction (3 Years ldquoForwardrdquo)
Step 3
System Operator Pays Cleared Resources at P and Bills LSEs(Note Self-Supply capacity is a ldquowashrdquo)
R1 R2 R3 R4 R5 R6 R7
P
R1
R3
R3
R5
R5
R2
R2
R4
R4
R6
R7
Bid Price = $ per MW-day
Quantity = MW
6500 MW P
Cleared Capacity = 10000
Supply = Capacity Committed ldquoForwardrdquo
P= Clearing price paid to all capacity clearing auction
Demand = SO Forecast of Capacity Requirements
R1-R7 = Capacity offered by Supply-Side (New built Existing Uprates) and Demand-Side (Energy Efficiency Demand Response Distrib Gen) Self-supply (R1) bids in a ldquozerordquo price New Resources set clearing price
LSE1 5000 MW
LSE2 5000 MW
R1
SOSO pays R1 3500 MW P
LSE2 pays its share of regional demand
5000 MW P
LSE1 pays its share of regional demand (5000 MW) adjusted for self-supply R1 for a net payment of 1500MW P
R1 = 3500 MW of ldquoSelf-Supplyrdquo Resources (LSE1 ownedunder contract)
In 2010Total regional peak demand of 10000 MW supplied by R1 + R2 + R3 + R4 + R5 LSE1 and LSE2 are each responsible for 50 of regional peak demand
35
the Role of foRwaRd caPacity MaRkets in incReasing deMand-side and otheR low-caRbon ResouRces
PJM Eligibility Requirements
Eligibility of demand-side resources has changed significantly over the years in PJMrsquos capacity markets In particular it was not until the most recent capacity auction (May 2009) for the
20122013 delivery year that energy efficiency became eligible to bid in PJMrsquos Base Residual Auction PJM is currently considering a tariff change to also allow energy efficiency to bid into incremental auctions
Under PJMrsquos eligibility rules an energy efficiency resource must achieve a ldquopermanentrdquo continuous reduction in electric energy consumption Examples of such a resource include lighting retrofit programs for residential commercial and industrial customers and programs to retrofit buildings with heating and cooling systems that exceed current efficiency standards To be eligible an energy efficiency resource must meet the following criteria
bull It is fully implemented throughout the delivery year without any requirement of notice dispatch or additional customer action
bull It is not reflected as a reduction in the peak load forecast used for the Base Residual Auction for the proposed delivery year
bull It exceeds relevant standards (such as building codes or appliance standards) at the time of commitment
bull It achieves the specified load reduction (expected average demand in MW) during defined summer on-peak hours84
Demand response on the other hand must be dispatchable mdash that is customer demand must be reduced when instructed For example a large supermarket with
coolers and freezers could install load management equipment that would cycle them on or off mdash and bid that demand response capability into the market85 More specifically a demand response resource must meet the following criteria
bull It is able to reduce demand for electricity up to 10 times each year for up to six consecutive hours per interruption during defined periods86
bull It is fully implemented within one hour (short lead time) or two hours (long lead time) of notice from PJM
bull In a year without calls for demand reductions it must demonstrate reliability through a test of reduction capability
bull It is registered in the Emergency Load Response Program and thus available for dispatch during PJM-declared emergency events
bull Compliance and status reports are filed as required
Multiple end-use customers can be aggregated in order to submit a single demand response offer in the capacity auction if those customers share the same curtailment service provider electric distribution company and transmission zone
In addition customer-sited distributed generation may be offered into auctions as a demand resource A hospital for example could offer to run its back-up generator on certain peak demand (eg hot summer) days to reduce its load on the system Or an industrial plant could cut back on production on such days and continue to run its on-site combustion or steam-cycle turbine
Currently energy efficiency resources may participate
Appendix 3
Eligibility Requirements for Demand-Side Resourcesin US Capacity Markets
84 Weekdays excluding holidays June through August between the hours ending 1500 and 1800 Eastern Prevailing Time (EPT)
85 If instead the supermarket replaced the existing coolers and freezers with more energy efficient ones it would bid that proposal in as an energy efficiency resource Or it could do both (replace and cycle) and bid in the capacity from the permanent savings (replacements) as energy efficiency and the dispatchable capacity (the cycling) as demand response
86 Weekdays excluding holidays from 1200 to 2000 EPT May through September and 1400 to 2200 EPT October through April
RegulatoRy assistance PRoject
36
in Base Residual Auctions for up to four consecutive delivery years In effect this means that PJM limits capacity payments for efficiency measures to four years of their measure life (rather than for the full measure life)87 In contrast a demand response resource (including distributed generation) can participate in the PJM capacity market for as long as its ability to reduce demand continues
ISO-NE Eligibility RequirementsSince the inception of ISO-NErsquos forward capacity market
in 2006 energy efficiency has qualified as an eligible demand-side resource ISO-NE defines demand resources as installed measures (products equipment systems services practices and strategies) that result in verifiable reductions in end-use consumption of electricity in the New England power system These are further categorized into ldquopassiverdquo (energy efficiency and non-dispatchable distributed generation) and ldquoactiverdquo (demand response emergency generation and dispatchable distributed generation) resources Passive demand resources are non-dispatchable but permanently reduce energy demand during peak hours Active demand resources are designed to reduce peak loads and to reduce load based on real-time system conditions or ISO-NE instructions Following are descriptions of eligible demand-side resources and performance requirements88
Passive Demand Resourcesbull On-Peak Demand Resources are measures that are
not weather-sensitive and reduce demand across a fixed set of on-peak hours such as energy-efficient commercial lighting and motors89
bull Seasonal Peak Demand Resources are weather-sensitive measures that reduce load during high-demand conditions such as energy-efficient heating and air conditioning systems Seasonal Peak Demand Resources must reduce load when actual system load is equal to 90 percent of the most recent peak load forecast for the applicable summer or winter season
Active Demand Resourcesbull Real-Time Demand Response Resources are
measures including load management and distributed generation that can be dispatched by ISO-NE as needed They must curtail electrical usage within 30 minutes of receiving a dispatch instruction and until receiving a releaserecall dispatch instruction
bull Real-Time Emergency Generation is distributed generation whose state air quality permit limits operation to ldquoemergencyrdquo conditions Generators must curtail the customerrsquos electrical usage within 30 minutes of receiving a dispatch instruction and until receiving a releaserecall dispatch instruction The amount of emergency generation that can be used to meet ISO-NErsquos capacity requirement is limited to 600 MW If the amount of real-time emergency generation that clears the auction exceeds this level payments to generators are reduced on a pro-rated basis All real-time emergency generation is treated as existing capacity
In contrast to PJM all demand-side resources in ISO-NE are eligible to bid capacity for their full measure life an approach that recognizes the full contribution of these resources to regional resource adequacy requirements and adds value to long-lived energy efficiency assets
87 FERC has directed PJM to evaluate the impact of its capacity payment period for energy efficiency resources
88 Eric Winkler and Abimael Santana ISO-NE ldquoNew Demand Resource Qualificationrdquo May 5 2009 at httpwwwiso-necomsupporttrainingcoursesfcmfcm_forum_may_5pdf
89 Summer on-peak hours are 1300 to 1700 non-holiday weekdays in June July and August Winter on-peak hours are 1700 to 1900 non-holiday weekdays in December and January
The Regulatory Assistance Project (RAP) is a global non-profit team of experts that focuses on the long-term economic and environmental sustainability of the power and natural gas sectors providing technical and policy assistance to government officials on a broad range of energy and environmental issues RAP has deep expertise in regulatory and market policies that promote economic efficiency protect the environment ensure system reliability and fairly allocate system benefits among all consumers We have worked extensively in the US since 1992 and in China since 1999 and have assisted governments in nearly every US state and many nations throughout the world RAP is now expanding operations with new programs and offices in Europe and plans to offer similar services in India in 2011 RAP functions as the hub of a network that includes many international experts and is primarily funded by foundations and federal grants
Home office
50 State Street Suite 3Montpelier Vermont 05602
802-223-8199wwwraponlineorg

RegulatoRy assistance PRoject
20
bull Nonetheless renewable resources are hard-pressed to successfully compete with the thousands of megawatts of existing and new fossil-fuel resources participating in these auctions that are able to bid below the true societal cost of their operations under current market rules In fact capacity auctions as currently designed can breathe new economic life into high carbon-emitting plants that were previously planned for significantly reduced operations or retirement Along with new capacity from fossil-fuel generation allowing such a large amount of existing capacity from high carbon emitters to clear the auction is likely to crowd out renewable resources that are able to address resource adequacy requirements equally well Such results may not represent an ldquoefficientrdquo (or desirable) outcome for a carbon-constrained power sector This is especially true where the carbon costs of a fossil-fuel plant are not fully recognized in the energy market that plant also will be bidding into
The Electric Power Research Institute modeled the effect of various levels of carbon taxes or allowance prices in the upper Midwest (coal-dependent) and in Texas (heavily reliant on natural gas) The study found that close to a doubling of the wholesale prices of electricity in the Midwest region (through carbon-related charges) would produce only a 4 percent reduction in regional emissions given the current generation mix Similar results were observed for Texas where natural gas plants are on the margin49 And in the Northeastern US due to initially low carbon prices and a host of factors that dampen the price signal the Regional Greenhouse Gas Initiative (RGGI) has not yet resulted in generator operational changes50 One of those dampening factors is the single clearing price that is typically set through wholesale energy markets mdash which dilutes the market signal sent by a price on carbon emissions by allowing fossil-fueled plants to recover
most or all of their allowance costs through higher clearing prices reflecting the cost of allowances51
Studies also have shown that the price of carbon must rise (and be maintained) at very high levels to obtain sufficient market pull for the level of new investments in clean generation required For example a recent analysis in California concluded that it would take a carbon price of $100 per tonne52 to make economic investments in renewable resources compared to fossil fuel-fired generation in order to reach carbon reduction targets in the power sector beyond what current state requirements will achieve53 Further price signals may be diluted if a portion of the carbon allowances are allocated in a manner that shields high-emitting power plants from carbon costs or if high-emitters located outside the capped region can sell into the market on a long-term basis
Carbon Pricing Alone Is Insufficient to De-carbonize the Generation Mix
bull A market price for capacity or energy that favors the construction and operation of high carbon-emitting resources over clean resources will lead to increases mdash rather than reductions mdash in the cumulative level of carbon emissions in the power sector A carbon tax or carbon cap-and-trade regime internalizes some or all of the otherwise un-priced carbon costs of electricity production and would improve the relative economics of clean resources in both forward capacity and energy markets However carbon pricing alone may be insufficient to change the dispatch of existing high-emitting power plants or their ability to clear these capacity markets (and be paid additional revenues as a result) in such overwhelming numbers47 In fact the very modest impact of carbon pricing on the performance of fossil-fuel plants has been documented in several reports48 (See text box below)
47 With or without carbon prices policymakers also might want to consider the implications of paying existing power plants the market clearing price for capacity mdash and the potential windfall profits for plant owners mdash for making no changes in plant operations See for example Ezra Hausman Paul Peterson David White and Bruce Biewald Synapse Energy Economics Inc RPM 2006 Windfall Profits for Existing Base Load Units in PJM An Update of Two Case Studies Feb 2 2006 at wwwsynapse-energycom
21
the Role of foRwaRd caPacity MaRkets in incReasing deMand-side and otheR low-caRbon ResouRces
bull Carbon pricing alone will have limited impact on consumer decisions to invest in permanently reducing their peak demand by making cost-effective investments in energy efficiency Well-designed time-varying pricing options can successfully shift demand from high-price hours to lower price hours54 Such shifting also reduces peak demand on transmission and distribution systems Overall energy use will decline somewhat in response to price But long-term reduction in energy use due to price increases is relatively small The numerous market barriers to capturing the full cost-effective potential of energy efficiency ndash through improvements in building construction practices and industrial processes retrofits of existing buildings and installations of high-efficiency appliances and equipment in homes and businesses ndash are well-documented They include lack of information high first-costs consumersrsquo high discount rates and the landlord-tenant split incentive problem among others55 Recent empirical analysis of demand elasticities suggests that the long-term price elasticity of demand for electricity is even lower than earlier studies have indicated for both liberalized and regulated markets (See text box on page 21)
In sum while forward capacity markets are meeting their resource adequacy objectives and clearing an impressive amount of clean low cost demand-side resources on balance these markets (as currently designed) are not working sufficiently in concert with carbon reduction goals and policies in the face of growing carbon constraints For the reasons discussed above carbon pricing alone
48 See Testimony of Richard Cowart Regulatory Assistance Project Before the Committee on Energy and Commerce Subcommittee on Energy and Environment US House of Representatives April 23 2009 ldquoThe Consumer Allocation for Efficiency How Allowance Allocations Can Protect Consumers Mobilize Efficiency and Contain the Costs of GHG Reductionrdquo at httpenergycommercehousegovPress_11120090423testimony_cowartpdf
49 See Victor Niemeyer ldquoThe Change in Profit Climate How Will Carbon-Emissions Policies Affect the Generation Fleetrdquo Public Utilities Fortnightly May 2007 at 20 24
50 See ldquoRGGI marks its first year with success and lesson on effect of market pressurerdquo Electric Utility Week Dec 14 2009 Ten Northeast and Mid-Atlantic states participate in RGGI the first mandatory cap-and-trade program in the US Connecticut Delaware Maine Maryland Massachusetts New Hampshire New Jersey New York Rhode Island and Vermont Nine of them participate in either the ISO-NE or PJM forward capacity markets described in this paper
51 PJM Interconnection ldquoPotential Effects of Proposed Climate Change Policies on PJMrsquos Energy Marketrdquo Jan 23 2009 p 5 See also ldquoBecause Thatrsquos Where the Money Is The FERCrsquos Ability to Reduce the Cost of Slowing Global Warmingrdquo Samuel A Wolfe Chief Counsel New Jersey Board of Public Utilities December 2009 at httpwwwnarucorgpublicationsWOLFE-20Panel203pdf
Demand for Power Is Relatively Price-Insensitive mdash Even Over the Long Term
Modeling by the US Department of Energy suggests that a 10 percent increase in power prices will reduce demand for electricity by just 25 percent to 3 percent over 20 years assuming that the price effects persist over that entire period56 This would only offset the normally expected US load growth in two out of those 20 years57
More recently a 2009 empirical analysis of the demand for electricity in the US concludes that price elasticity of residential demand has actually decreased since retail price deregulation was first introduced in the US The results suggest that a 10 percent increase in power prices will reduce residential electricity demand more on the order of 12 percent to 17 percent based on 2001-2008 data for both deregulated and regulated states58 Price responsiveness is further dampened by the income-elasticity of demand which is positively correlated with consumption As incomes increase consumption of electricity goes up and the conservation impact of any price increase is diminished59 The equivalent historical figure for a 10 percent increase in power prices in the UK residential sector is -23 percent but the income-elasticity is such that a 10 percent increase in income results in an increase of demand of 34 percent ndash ie household income is just as important as energy price in determining energy demand60
RegulatoRy assistance PRoject
22
is unlikely to shift the power sector resource mix at the pace or scale required to meet aggressive carbon reduction targets ndash or correspondingly to substantially change the dominance of high-carbon resources clearing forward capacity auctions under current market rules An increasing number of studies makes a compelling case that our economy and our society cannot afford this dominance to persist much longer if we are to contain climate change to a livable level In fact close to full de-carbonization of the
power sector is being discussed in international forums as the only way to meet essential carbon reduction targets by 205061 While capacity markets alone are unlikely to support the full value of clean energy resources in a carbon-constrained power sector by themselves with appropriate design elements they can serve to reinforce actions taken at federal regional and state levels that provide larger and longer lasting commitments to clean demand-side and renewable resources62
52 A tonne or metric ton is a unit of mass equal to 1000 kilograms (roughly 2205 pounds) or approximately the mass of one cubic meter of water at four degrees Celsius A tonne is not the same as either a ldquoshortrdquo ton (2000 pounds) or a ldquolongrdquo ton (2240 pounds)
53 Energy and Environmental Economics Inc Greenhouse Gas Modeling of Californiarsquos Electricity Sector to 2020 Updated Results of the GHG Calculator Version 3 prepared for the California Public Utilities Commission October 2009 pp 66-67 at httpwwwethreecomdocumentsGHG_102209CPUC_GHG_Final_Report_28Oct09pdf
54 Ahmad Faruqui and Sanem Sergici The Brattle Group ldquoHousehold Response to Dynamic Pricing of Electricity A Survey of the Experimental Evidencerdquo Jan 10 2009 at httpwwwhksharvardeduhepgPapers2009The20Power20of20Experimentation20_01-11-09_pdf
55 See for example American Council for an Energy Efficient Economy ldquoQuantifying the Effects of Market Failures in the End-Use of Energyrdquo pp iii-vi 2007 at httpoldaceeeorgenergyIEAmarketbarrierspdf This study details the various types of market barriers to end-use energy efficiency and reports that up to 50 percent of residential energy use in the US is affected by such barriers
56 The US Department of Energyrsquos National Energy Modeling System (NEMS) has price elasticity built into it The long-run elasticity (assuming price effects remain for 20 years) are ndash031 for residential electric use and ndash025 for commercial electric use See Steven H Wade ldquoPrice Responsiveness in the NEMS Buildings Sector Modelrdquo in Energy Information Administrationrsquos Issues in Midterm Analysis and Forecasting 1999 pp 55 58 table 1 at httpwwweiadoegovoiafissuespdf060799pdf
57 This would require a much larger rate increase just to offset expected load growth over 20 years let alone to reduce demand sufficiently to permit absolute reductions in emissions from the nationrsquos huge generation fleet See Testimony of Richard Cowart
58 T Nakajima and S Hamori ldquoChange in Consumer Sensitivity to Electricity Prices in Response to Retail Deregulation A Panel Empirical Analysis of the Residential Demand for Electricity in the United Statesrdquo Energy Policy (2010) available at wwwsciencedirectcom
59 Ibid
60 John Dimitropoulas Lester C Hunt and Gary Judge ldquoEstimating Underlying Energy Demand Trends Using UK Annual Datardquo at httpuserwebportacuk~judgegAEL_04pdf
61 See for example Meeting Carbon Budgets ndash The Need for a Step Change Progress Report to Parliament Committee on Climate Change October 2009 at httpwwwthecccorgukreportsprogressreports Christopher Jones and Jean-Michel Glachant Why and How the European Union Can Get a (Near to) Carbon-Free Energy System in 2050 MIT Center for Energy and Environmental Policy March 2010 at httpdownloadsthecccorgukdocs2166720CCC20Executive20Summary20AW20v4pdf Roadmap 2050 A practical guide to a prosperous low-carbon Europe The European Climate Foundation April 2010 at wwwroadmap2050eu
62 Without such policies it is unlikely that even RGGIrsquos modest carbon reduction goals will be achieved See Paul Peterson Doug Hurley and David White Synapse Energy Economics Inc ISO New England Scenario Analysis Companion Report Constructing a Future That Meets Regional Goals Aug 8 2007 at wwwsynapse-energycom
23
the Role of foRwaRd caPacity MaRkets in incReasing deMand-side and otheR low-caRbon ResouRces
ISO-NE Rules for Emergency Generators Advance Environmental Goals
Emergency (ldquobackuprdquo) generators typically are diesel-fired and states in New England and elsewhere in the US have restricted the number of hours and days they may be operated through the state permitting process At the time the first regional demand response tariffs were being designed in New England a collaborative of energy regulators environmental regulators the ISO utilities and other stakeholders realized that active demand response programs could lead to substantial incentives for diesel-fired backup generators to operate more often when air quality was at its worst Regulators and the ISO proposed a rule limiting those generators to run for reliability purposes during system emergencies This is a concrete example of reliability rules being written to advance environmental goals as well as power system needs63 In addition a regional working group developed model emissions standards for small generators for statesrsquo consideration64
To reinforce regional air quality policies and goals ISO-NE limits the total amount of emergency generators in the regional capacity market to 600 MW To the extent any excess amount clears the auction capacity payments to these resources are pro-rated
63 See Cowart and Raab p 26
64 See Model Regulations for the Output of Specified Air Emissions From Smaller Scale Electric Generation Resources Oct 31 2002 at httpwwwraponlineorgshowpdfaspPDF_URL=22docsrap_issuesletter-outputbasedemissioninsert_2003_07pdf22
65 Edward S Rubin Carnegie Mellon University ldquoA Performance Standards Approach to Reducing CO2 Emissions for Electric Power Plantsrdquo June 2009 at httpwwwpewclimateorgpublicationsreportcoal-initiative-series-performance-standards-approach-reducing-co2-emissions-ele Also see Chris Simpson and Brenda Hausauer ldquoEmissions Performance Standards in Selected Statesrdquo Regulatory Assistance Project Research Brief November 2009 at httpwwwraponlineorgdocsRAP_Simpson_EPSResearchBrief_2009_11_13pdf
Policy Recommendations and Auction Design Options
We present below recommendations and a menu of auction design options for forward capacity markets that support and enhance carbon policies and carbon reduction targets
bull Power market rules should be constructed to recognize and limit the adverse environmental consequences of power generation The power system and the environment are inextricably linked Explicit consideration of environmental costs and benefits of various electricity resources is not only reasonable but necessary to meet the enormous challenge of climate change
bull Forward capacity markets should reinforce carbon reduction policies which could be accomplished by incorporating one or more of the following into the auction rules
Auction rules could apply an Emissions Performance Standard (EPS) to promote capacity commitments from low-carbon resources and discourage bids from high-emitting power plants An EPS can be expressed as a maximum level of greenhouse gas emissions per unit of electrical output or as a percentage reduction in (annual) plant emissions It can vary with fuel type and incorporate other design variations65 It may be appropriate to adopt an EPS mdash within the auction qualification rules or by regulation mdash particularly if current market signals are not sufficiently
discouraging new construction or repowering of high-emitting generating resources with long lifetimes while forward capacity markets are providing a new revenue stream to keep them running
RegulatoRy assistance PRoject
24
Auction rules could disqualify inefficient generators from participating (and from receiving capacity revenue) or more generally require their retirement through financial incentives regulations or both66 Since 2007 China has been phasing out such plants and intends to retire approximately 50 gigawatts (GW) of small inefficient coal-fired power plants nationwide and 7 GW to 10 GW of small natural gas-fired units as well as halt construction of small inefficient power plants The policy is being put in place three ways the direct rescission of operating permits the transfer of generation rights and price reductions
Capacity payments could vary by the emissions rate of the resource Instead of one price paid to all generation that clears the auction adders could be applied to payments for low-emitting units and deductions could be applied to high-emitting units67 For example a sliding-scale percentage reduction to the per-unit ($kW-month or $MW-day) clearing price could be established based on the average annualized carbon footprint of fossil-fuel resources whereas a price adder above the clearing price could be established for zero-emitting resources
Imputed ldquocarbon addersrdquo could help curtail high-emitting resources Carbon adders are imputed costs that reflect at least a portion of the societal cost of emissions They are generally
used in the context of resource planning and acquisition by a regulated LSE mdash as a way of ensuring that high-carbon risks and low-carbon alternatives are properly valued in the resource selection process But these imputed costs do not get passed on to ratepayers or consumers for every unit of power consumed in contrast to carbon pricing68 Similarly the rules in a forward capacity market could be modified so that carbon adders are applied in determining what resources clear the auction (and will receive the market clearing price for their capacity commitment)
A ldquozero-carbon resource portfolio standardrdquo could establish auctions for separate tranches of resources by emissions level For example one tranche could include energy efficiency and renewable resources The size of each tranche would be based on carbon reduction goals for the region The higher the goals the larger the tranche for energy efficiency and renewable resources These resources decrease carbon emissions because at the margin most power systems are running higher carbon resources
bull Policymakers should consider a longer price commitment in forward capacity markets mdash at least for low-carbon resources The contract period for new capacity in these markets is short (one year in PJM up to five years in ISO-NE) in part so there is greater certainty over forecasts of resource needs for system reliability (to mitigate the risk of over-supply)
66 Small and old coal plants are the most inefficient and polluting both in terms of greenhouse gases and particulate matter By some estimates 50 MW plants may use as much as 200 grams more per unit of electricity output than a plant larger than 300 MW See Frederick Weston Rebecca A Schultz David Moskovitz and Max Dupuy Regulatory Assistance Project ldquoChinarsquos Climate Change Initiatives Do new policies adopted in China offer any guidance for the transformation of the US power sector in a carbon-constrained worldrdquo November 2009 at httpwwwraponlineorgdocsRAP_China20Climate20Initiatives_NARUC_2009_11_01docx
67 See N Jonathan Peress and Kenneth A Colburn ldquoElectrical Connections Aligning Capacity Market Changes With RGGI in the Northeastrdquo Discussion Draft March 2005 at httpwwwpucnhgovEPABSymbiotic202005-03-1820Peress-Colburn20Letter20to20FERC-Woodpdf
68 Both high carbon resources and low carbon resources clearing in power markets (characterized by single-price auctions) are paid the same price So whenever fossil resources are on the margin (most of the time in most places) consumers are seeing the same price for both fossil and clean resources and the cost of carbon allowances (or carbon taxes) for that marginal resource is reflected in the clearing price for all power bought in the market Carbon adders on the other hand are not actually paid to any resource or reflected in prices for all units sold in the market
25
the Role of foRwaRd caPacity MaRkets in incReasing deMand-side and otheR low-caRbon ResouRces
Auction winners can generally participate in future auctions and receive the market clearing price but have no assurance of future prices Moreover under current rules in PJM energy efficiency resources cannot receive capacity payments over the full life of the measures mdash only for four consecutive delivery years This constraint puts energy efficiency on a different footing than other demand resources mdash as well as all supply-side resources mdash which are paid for their capacity as long as they provide the benefit
The short commitment period and lack of price certainty may not provide market signals that are strong and consistent enough to ensure sufficient new generation or encourage plant operators and investors to make efficient choices for the long-term mdash even where carbon prices are expected to increase substantially in the future due to a dramatically declining carbon cap or a high carbon tax Allowing clean resources to opt for a longer period of time over which the price is known would in particular facilitate renewable resources whose typically high upfront capital costs and low operating costs mdash compared to natural gas-fired plants in particular mdash may require such a long-term commitment to procure financing69 Another option might be to establish fixed floor prices for clean energy resources for a long-term period to provide assurance of a minimum revenue stream
bull Regional load forecasting should be reviewed for treatment of demand-side resources acquired outside the capacity market In particular the system operator determines the capacity that will be auctioned for each delivery year (three years hence) based on a 10-year load forecast which is updated on
an annual basis Under the current planning process in forward capacity markets this forecast only reflects the demand-side resources that have cleared in prior auctions The system operatorrsquos load projections do not take into consideration any load reductions from demand-side resources procured outside of the auction such as energy efficiency programs that LSEs have committed (or are obligated) to fund and implement in the coming one to three years or beyond70 If the magnitude of these load reductions is substantial the ISO may be systematically overstating the level of capacity put out to bid for each delivery year Depending upon the existing mix of resources and market conditions in the region this overstatement may have a sizeable impact not only on the level of cleared capacity and the market price but on the resulting resource mix and level of carbon emissions as well
Additional Actions
Careful design of the planning process and auctions undertaken through forward capacity markets can help to ensure that they reinforce and do not work at cross purposes with climate reduction goals and targets However forward capacity market signals (capacity prices) are only one component of a market and regulatory landscape that affects investment and operating decisions in the power sector Market rules and procurement policies that affect system energy requirements ndash as well as policies and regulations that affect access location and cost recovery for transmission and distribution facilities ndash have an enormous impact on both the short- and long-term resource mix
It is beyond the scope of this paper to fully explore how
69 LSEs in PJM and ISO-NE can contract for generating resources through the bilateral market to hedge energy and capacity costs and to meet renewable energy standards Renewable resource projects that successfully negotiate such contracts if they are long term may not need a long-term commitment in the forward capacity market Still a short-term capacity payment stream with uncertain prices thereafter weakens the ability of renewable resources to secure long-term financing
70 Some of the econometric models that the system operators use for their load forecasts may capture the impacts of federal appliance standards and building codes However to our knowledge there has been no explicit accounting to date for the impacts of state and utility energy efficiency programs where the capacity is not bid into the auctions
RegulatoRy assistance PRoject
26
market rules and other policies and regulations can be harmonized and strengthened to meet customersrsquo energy needs reliably in a carbon-constrained world Larger and longer lasting commitments to demand-side and renewable resources are certainly needed to ensure a mix of resources that will significantly reduce greenhouse gas emissions in the power sector This has been the conclusion of US policymakers who have put in place additional policies to facilitate long-term acquisition of low-carbon resources in regions that operate both forward capacity markets and a cap-and-trade program (under RGGI)71
bull States have adopted a variety of mechanisms for sustained and aggressive energy efficiency programs
bull Strong building codes and equipment standards
bull Stable funding through a system benefit charge
bull Third-party administration of programs or where the utility is the efficiency portfolio manager decoupling of utility profits from revenues financial incentives for shareholders or both
bull Recycling of carbon auction proceeds into energy efficiency investments
bull Some states require long-term resource plans or resource procurement plans that must include energy efficiency Therersquos renewed interest in long-term planning and procurement particularly for demand-side and renewable resources following a period
where these efforts were largely abandoned with electric industry restructuring and development of organized markets72
bull Several states have adopted energy efficiency resource standards that require achievement of specified energy-saving targets73
bull Most of the states have renewable energy standards74 and several states require long-term contracting of renewable resources to meet the standards75
bull Connecticut Maryland Pennsylvania and Rhode Island require contract terms of 10 years or longer
bull New York requires central procurement of renewable energy credits by a state agency under long-term contract Illinois is likely to acquire long-term contracts for renewable resources under its central procurement mandate
bull Massachusettsrsquo Green Power Partnership purchases renewable energy credits for up to 10 years using its renewable energy fund
These are just examples and certainly not an exhaustive list of the ways in which careful design of forward capacity markets coupled with additional policies at the federal regional and state level can serve to reinforce both resource adequacy requirements and carbon reduction goals
71 Regulatory Assistance Project policy grids summarize state-by-state requirements for resource planning and energy efficiency at httpwwwraponlineorgFeatureaspselect=116 For a summary of renewable energy standards in the US see Ryan Wiser and Galen Barbose Lawrence Berkeley National Laboratory ldquoState of the States Update on RPS Policies and Progressrdquo State-Federal RPS Collaborative Nov 18 2009 at httpwwwcleanenergystatesorgMeetingsRPS_Summit_09WISER_RPS_Summit2009pdf
72 More broadly 30 states nationwide require integrated resource plans or resource procurement plans that include energy efficiency
73 Includes states with strict energy efficiency standards states with Commission-ordered efficiency targets states that allow efficiency to count toward renewable energy standards and states with a rate cap that triggers a relaxation of requirements See Laura A Furrey Steven Nadel and John A ldquoSkiprdquo Laitner ACEEE Laying the Foundation for Implementing a Federal Energy Efficiency Resource Standard March 2009 at httpaceeeorgpubse091htm
74 Some 29 US states and the District of Columbia have renewable energy standards five other states have non-binding goals See Wiser and Barbose
75 For a US database of state incentives for renewable energy and energy efficiency see httpwwwdsireusaorg
27
the Role of foRwaRd caPacity MaRkets in incReasing deMand-side and otheR low-caRbon ResouRces
An example of an approach that attempts to ldquomarryrdquo integrated least-cost resource planning with forward capacity markets is the resource planning and procurement process recently established by the Connecticut Legislature76 The law requires the utilities Energy Advisory Board and Department of Public Utility Control to plan for current and future energy and capacity needs and provide a mechanism for procuring resources that meet specified economic reliability and environmental objectives77 to satisfy the identified need Further the law requires that resource needs first be met through energy efficiency and demand reduction resources that are cost effective reliable and feasible Based on the resulting resource plans LSEs enter into
contracts to acquire the required capacity (level and mix) through a competitive bidding process The law also requires that any resources winning contracts for capacity agree to let the LSE bid that capacity into the forward capacity auction as a ldquoself-suppliedrdquo resource This approach permits LSEs to determine both the quantity and mix of resources through integrated resource planning that will meet their resource adequacy requirements and state policy goals (eg carbon reduction) The LSE pays the contracted capacity price (under its bilateral contracts) instead of paying the auction clearing price to everyone that offers capacity into the forward capacity market (eg existing fossil fuel or nuclear plants)78
Connecticutrsquos Marriage of Resource Planning and Markets
76 Conn Gen Stat sectsect 16a-3a 16a-3b and 16a-3c
77 Costs and benefits cost-effectiveness cost impacts on customers the extent to which load growth can be eliminated and peak demand reduced reliability including energy security and economic risks impacts on meeting state environmental standards including emissions goals optimization of existing generation and generation sites the extent to which renewable resources can be used to meet needs and fuel types diversity and supply See Department of Public Utility Control Final Order in Docket No 08-07-01 Feb 18 2009
78 This approach is not without some controversy A contracted new resource in Connecticut has the potential to displace an alternative ldquocompetitiverdquo new resource in the region that would have bid at a higher price mdash had Connecticut not been allowed to designate the contract as self-supply ISO-NErsquos Internal Market Monitoring Unit has commented on this issue in a report to FERC See Internal Market Monitoring Unit ISO-NE June 5 2009
RegulatoRy assistance PRoject
28
Conclusions and Recommendations
Auction-based capacity markets in the US have been successful to date in attracting the capacity needed to maintain system reliability in an economically efficient manner In particular these markets have been successful in facilitating new demand-side resources
with ratepayers and society reaping the economic and environmental benefits However policymakers also should consider capacity markets in the context of carbon reduction policies and targets for the power sector Even markets that successfully integrate demand-side and renewable resources into the auction process are still encouraging the construction or continued operation of high-emitting supply-side resources to meet reliability targets
Existing capacity markets should be evaluated to assess whether the market is responding in this way And if it is policymakers need to critically assess whether a continuation of that market response over the coming years will make it possible to achieve the cumulative level of carbon reductions required from the power sector to avoid the worst effects of climate change Depending on the results of this inquiry policymakers may need to refine the auction rules and adopt additional policies for the power sector mdash such as those described in this paper mdash to ensure the alignment of capacity markets with both short- and long-term carbon reduction goals
More generally forward capacity markets create a revenue stream for resources that can commit to being available at times of system peak several years in the future mdash but this financial incentive is clearly not the only factor driving the mix of resources in the power sector and their resulting carbon footprint Market rules policies and regulations that affect investment and operating decisions for meeting the systemrsquos energy requirements mdash as well as those that affect access location and cost recovery for transmission and distribution facilities mdash have an enormous impact on both the short- and long-term resource mix in the electric system Policymakers will need to consider how this entire market and regulatory landscape mdash including forward capacity markets mdash can be strengthened and harmonized to reliably meet customer demand for electricity in a carbon-constrained world
29
the Role of foRwaRd caPacity MaRkets in incReasing deMand-side and otheR low-caRbon ResouRces
Cleared capacity values in the following tables represent all capacity committed by existing resources remaining in the market and all new resources that bid into the auction at or below
the market clearing price Cleared capacity includes ldquoself-suppliedrdquo or ldquoself-scheduledrdquo resources entered into the auction by LSEs However as described in this paper when the monthly billingsettlement process is completed the capacity charges allocated to the LSE will be offset (credited) for the cleared capacity delivered by these resources
Incremental capacity in the tables below reflects 1) new generation resources 2) capacity upgrades to existing generation resources 3) partial offsets to
incremental generation capacity due to capacity de-ratings to existing generation resources 4) new demand response resources 5) upgrades to existing demand response resources and 6) new energy efficiency resources
PJM Results79
PJM has conducted five Base Residual Auctions since its inception in 2007 for delivery years beginning in 20082009 (that each run from June 1 to May 31) Capacity cleared in the PJM auction is defined in terms of ldquounforcedrdquo capacity that is the capacity of a resource adjusted for availability and deliverability based on historical performance (eg forced outages)
Appendix 1
Detailed Results for PJM and ISO-NE Capacity Markets
Table 1 Generation Demand Resources and Energy Efficiency Resources
Offered and Cleared in PJM Base Residual Auctions (Unforced Capacity in MW)
Delivery Year 20082009 20092010 20102011 20112012 20122013
Generation Offered 1311648 1326142 1321248 1360679 1348730
DR Offered 7158 9368 9679 16524 98476
EE Offered - - - - 6527
Total Offered 1318806 1335510 1330927 1377203 1453733
Generation Cleared 1290614 1313389 1312515 1308566 1285274
DR Cleared 5362 8929 9390 13649 70473
EE Cleared 00 00 00 00 5689
Total Cleared 1295976 1322318 1321905 1322215 1361436
Energy efficiency resources were first eligible in the 20122013 auction
79 All information for PJM compiled from ldquo20122013 RPM Base Residual Auction Resultsrdquo at httpwwwpjmcom~mediamarkets-opsrpmrpm-auction-info2012-13-base-residual-auction-report-document-pdfashx
RegulatoRy assistance PRoject
30
Table 2 Incremental Capacity Additions and Reductions in PJM Base Residual Auctions(Installed Capacity in MW)
Delivery Year 20072008 20082009 20092010 20102011 20112012 20122013 Total
Increase inGenerationCapacity 6020 7242 12723 17762 35763 18935 98445
Decrease inGenerationCapacity -6746 -3754 -5502 -3018 -2647 -32539 -54206
Net Increase inDemand ResourceCapacity 5550 5747 2150 287 6617 79381 99732
Net Increasein EnergyEfficiency Capacity 0 0 0 0 0 6323 6323
Net Increasein InstalledCapacity 4824 9235 9371 15031 39733 72100 150294
Note Change in generation capacity is cumulative net increase in demand-side resources is relative to previous yearrsquos Base Residual Auction
Table 3 Breakdown of Incremental Capacity Resource Additionsin PJM Base Residual Auctions (Installed Capacity in MW)
Delivery Year CTGT Combined Diesel Hydro Steam Nuclear Solar Wind Total Cycle (Coal)
New 20072008 187 03 190Capacity 20082009 270 661 931Units 20092010 3995 238 530 4763 20102011 2833 5800 230 1414 10277 20112012 4164 11350 7048 11 752 23325 20122013 4038 5850 78 363 751 11080
Capacity 20072008 470 470From 20082009 1310 1310Reactivated 20092010 0Units 20102011 1600 107 1707 20112012 800 1010 1810 20122013 0
Uprates to 20072008 1145 139 800 2356 920 5360Existing 20082009 1082 340 180 1055 1960 384 5001Capacity 20092010 1522 2060 1625 614 1974 165 7960Resources 20102011 1173 1630 480 892 1603 5778 20112012 3692 1486 574 1868 2921 87 10628 20122013 2312 1643 142 1930 1260 568 7855
Total 28356 30159 2145 3963 20351 9062 11 4398 98445
Note Values represent capacity commitments Nameplate ratings of variable resources (solar and wind) are far larger than shown here
31
the Role of foRwaRd caPacity MaRkets in incReasing deMand-side and otheR low-caRbon ResouRces
Table 4 Changes to Generation Retirement Decisions
Since Reliability Pricing Model Approval (Unforced Capacity in MW)
Generation Resource Decision Changes Capacity Cleared
Withdrawn Deactivation Requests 17987
Postponed or Cancelled Retirement 13029
Reactivation 1752
ToTal 3276 8
Note Unforced capacity cleared in Base Residual Auctions from resources that withdrew their request to deactivate postponed retirement or were reactivated (ie came out of retirement or mothball state)
Table 5 PJM Base Residual Auction Clearing Price
Delivery Year Clearing Prices ($MW-day)
20072008 $4080
20082009 $11192
20092010 $10204
20102011 $17429
20112012 $11000
20122013 $1646
Note Values do not include any locational price adders Simple conversion of $MW-day to $kW-month multiply by 3 and divide by 100
Table 6 Effect of Demand-Side Resources on PJM Market Clearing Price
20122013 Base Residual Auction80
Actual Auction Results Calculated Results Without Demand-Side Resources
Clearing Prices Cleared Unforced Clearing Prices Cleared Unforced Savings
($MW-day) Capacity (MW) ($MW-day) Capacity (MW) ($MW-day)
$1646 1361435 $17878 1335682 $16232
80 Bowring Monitoring Analytics Table 20
RegulatoRy assistance PRoject
32
ISO-NE ResultsISO-NE has held three forward capacity auctions to
date The first auction (FCA 1) in February 2008 was for capacity delivery beginning in June 2010 (20102011 delivery year) The second auction (FCA 2) was held in December 2008 for delivery in 20112012 and the third
Table 7 Summary Results for ISO-NE Capacity Auctions81
Net Installed Total Resources Excess Clearing Net Price Capacity Cleared Capacity Price ($kW-month)82
Requirement (MW) (MW) ($kW-month)
FCA 1 32305 34077 1772 $450 $425
FCA 2 32528 37283 4755 $360 $312
FCA 3 31965 36996 4649 $295 $254
Table 8 Demand-Side Resources Cleared in ISO-NE Capacity Auctions (MW)81
Distributed Distributed Energy Real-Time Demand Real-Time Total Generation- Generation- Efficiency ResponseLoad Emergency Demand-Side Fossil Fuels Renewable Resources Management Generation Resources
FCA 1 46 lt02 655 978 875 2554
FCA 2 93 lt02 890 1195 759 2937
FCA 3 86 07 975 1206 630 2898
auction (FCA 3) was held in October 2009 for delivery in 20122013 ldquoClearedrdquo amounts in these tables include resources from earlier auctions that remain listed as well as new resources less resources that drop out
Note Net Installed Capacity Requirement values exclude the interconnection benefits associated with the Hydro-Queacutebec Phase III interface Excess capacity is not adjusted for Real-Time Emergency Generation in excess of the 600 MW limit Net prices reflect prorating of clearing prices due to excess capacity clearing the auction Simple conversion of $kW-month to $MW-day divide by 3 and multiply by 100
Note Demand-side values are grossed-up for avoided transmission and distribution losses and reserve margin (no reserve margin forFCA 3) Total resources cleared include excess capacity above the Net Installed Capacity Requirement Real-time emergency generation refers to distributed generation whose state air quality permit limits operation to ldquoemergencyrdquo conditions See Appendix 3
81 ISO-NE Forward Capacity Market Results at httpwwwiso-necommarketsothrmkts_datafcmcal_resultsindexhtml
82 Communication with Henry Yoshimura director Demand Resource Strategy ISO-NE March 2009
83 Eric Winkler ISO-New England ldquoThird Regional Energy Efficiency Initiative Meetingrdquo July 7 2009 and ldquoFCA Updaterdquo Demand Response Working Group Meeting Dec 2 2009 Total resources cleared (Capacity Supply Obligation) from Forward Capacity Market Auction Results for the 20102011 20112012 and 20122013 auctions at httpwwwiso-necommarketsothrmkts_datafcmcal_resultsindexhtml
33
the Role of foRwaRd caPacity MaRkets in incReasing deMand-side and otheR low-caRbon ResouRces
Step 1
System Operator (SO) Plans ldquoForwardrdquo for the Region
2012 Projection of Peak Demand = 10000 MW (incl reserves) Each ldquoLoad Serving Entityrdquo (LSE) is obligated for its 50 share
Appendix 2
Illustration of ldquoHow Forward Capacity Markets Workrdquo
SO purchases capacity in 2012 at the 2009 auction clearing price
LSE can be regulated utility or competitive retail supplier
LSE1 5000 MW
LSE2 5000 MW
R1
R1 =3500 MW capacity ldquoSelf Supplyrdquo Resources (LSE1 ownedunder contract)
RegulatoRy assistance PRoject
34
Step 2
The Regional Capacity Auction (3 Years ldquoForwardrdquo)
Step 3
System Operator Pays Cleared Resources at P and Bills LSEs(Note Self-Supply capacity is a ldquowashrdquo)
R1 R2 R3 R4 R5 R6 R7
P
R1
R3
R3
R5
R5
R2
R2
R4
R4
R6
R7
Bid Price = $ per MW-day
Quantity = MW
6500 MW P
Cleared Capacity = 10000
Supply = Capacity Committed ldquoForwardrdquo
P= Clearing price paid to all capacity clearing auction
Demand = SO Forecast of Capacity Requirements
R1-R7 = Capacity offered by Supply-Side (New built Existing Uprates) and Demand-Side (Energy Efficiency Demand Response Distrib Gen) Self-supply (R1) bids in a ldquozerordquo price New Resources set clearing price
LSE1 5000 MW
LSE2 5000 MW
R1
SOSO pays R1 3500 MW P
LSE2 pays its share of regional demand
5000 MW P
LSE1 pays its share of regional demand (5000 MW) adjusted for self-supply R1 for a net payment of 1500MW P
R1 = 3500 MW of ldquoSelf-Supplyrdquo Resources (LSE1 ownedunder contract)
In 2010Total regional peak demand of 10000 MW supplied by R1 + R2 + R3 + R4 + R5 LSE1 and LSE2 are each responsible for 50 of regional peak demand
35
the Role of foRwaRd caPacity MaRkets in incReasing deMand-side and otheR low-caRbon ResouRces
PJM Eligibility Requirements
Eligibility of demand-side resources has changed significantly over the years in PJMrsquos capacity markets In particular it was not until the most recent capacity auction (May 2009) for the
20122013 delivery year that energy efficiency became eligible to bid in PJMrsquos Base Residual Auction PJM is currently considering a tariff change to also allow energy efficiency to bid into incremental auctions
Under PJMrsquos eligibility rules an energy efficiency resource must achieve a ldquopermanentrdquo continuous reduction in electric energy consumption Examples of such a resource include lighting retrofit programs for residential commercial and industrial customers and programs to retrofit buildings with heating and cooling systems that exceed current efficiency standards To be eligible an energy efficiency resource must meet the following criteria
bull It is fully implemented throughout the delivery year without any requirement of notice dispatch or additional customer action
bull It is not reflected as a reduction in the peak load forecast used for the Base Residual Auction for the proposed delivery year
bull It exceeds relevant standards (such as building codes or appliance standards) at the time of commitment
bull It achieves the specified load reduction (expected average demand in MW) during defined summer on-peak hours84
Demand response on the other hand must be dispatchable mdash that is customer demand must be reduced when instructed For example a large supermarket with
coolers and freezers could install load management equipment that would cycle them on or off mdash and bid that demand response capability into the market85 More specifically a demand response resource must meet the following criteria
bull It is able to reduce demand for electricity up to 10 times each year for up to six consecutive hours per interruption during defined periods86
bull It is fully implemented within one hour (short lead time) or two hours (long lead time) of notice from PJM
bull In a year without calls for demand reductions it must demonstrate reliability through a test of reduction capability
bull It is registered in the Emergency Load Response Program and thus available for dispatch during PJM-declared emergency events
bull Compliance and status reports are filed as required
Multiple end-use customers can be aggregated in order to submit a single demand response offer in the capacity auction if those customers share the same curtailment service provider electric distribution company and transmission zone
In addition customer-sited distributed generation may be offered into auctions as a demand resource A hospital for example could offer to run its back-up generator on certain peak demand (eg hot summer) days to reduce its load on the system Or an industrial plant could cut back on production on such days and continue to run its on-site combustion or steam-cycle turbine
Currently energy efficiency resources may participate
Appendix 3
Eligibility Requirements for Demand-Side Resourcesin US Capacity Markets
84 Weekdays excluding holidays June through August between the hours ending 1500 and 1800 Eastern Prevailing Time (EPT)
85 If instead the supermarket replaced the existing coolers and freezers with more energy efficient ones it would bid that proposal in as an energy efficiency resource Or it could do both (replace and cycle) and bid in the capacity from the permanent savings (replacements) as energy efficiency and the dispatchable capacity (the cycling) as demand response
86 Weekdays excluding holidays from 1200 to 2000 EPT May through September and 1400 to 2200 EPT October through April
RegulatoRy assistance PRoject
36
in Base Residual Auctions for up to four consecutive delivery years In effect this means that PJM limits capacity payments for efficiency measures to four years of their measure life (rather than for the full measure life)87 In contrast a demand response resource (including distributed generation) can participate in the PJM capacity market for as long as its ability to reduce demand continues
ISO-NE Eligibility RequirementsSince the inception of ISO-NErsquos forward capacity market
in 2006 energy efficiency has qualified as an eligible demand-side resource ISO-NE defines demand resources as installed measures (products equipment systems services practices and strategies) that result in verifiable reductions in end-use consumption of electricity in the New England power system These are further categorized into ldquopassiverdquo (energy efficiency and non-dispatchable distributed generation) and ldquoactiverdquo (demand response emergency generation and dispatchable distributed generation) resources Passive demand resources are non-dispatchable but permanently reduce energy demand during peak hours Active demand resources are designed to reduce peak loads and to reduce load based on real-time system conditions or ISO-NE instructions Following are descriptions of eligible demand-side resources and performance requirements88
Passive Demand Resourcesbull On-Peak Demand Resources are measures that are
not weather-sensitive and reduce demand across a fixed set of on-peak hours such as energy-efficient commercial lighting and motors89
bull Seasonal Peak Demand Resources are weather-sensitive measures that reduce load during high-demand conditions such as energy-efficient heating and air conditioning systems Seasonal Peak Demand Resources must reduce load when actual system load is equal to 90 percent of the most recent peak load forecast for the applicable summer or winter season
Active Demand Resourcesbull Real-Time Demand Response Resources are
measures including load management and distributed generation that can be dispatched by ISO-NE as needed They must curtail electrical usage within 30 minutes of receiving a dispatch instruction and until receiving a releaserecall dispatch instruction
bull Real-Time Emergency Generation is distributed generation whose state air quality permit limits operation to ldquoemergencyrdquo conditions Generators must curtail the customerrsquos electrical usage within 30 minutes of receiving a dispatch instruction and until receiving a releaserecall dispatch instruction The amount of emergency generation that can be used to meet ISO-NErsquos capacity requirement is limited to 600 MW If the amount of real-time emergency generation that clears the auction exceeds this level payments to generators are reduced on a pro-rated basis All real-time emergency generation is treated as existing capacity
In contrast to PJM all demand-side resources in ISO-NE are eligible to bid capacity for their full measure life an approach that recognizes the full contribution of these resources to regional resource adequacy requirements and adds value to long-lived energy efficiency assets
87 FERC has directed PJM to evaluate the impact of its capacity payment period for energy efficiency resources
88 Eric Winkler and Abimael Santana ISO-NE ldquoNew Demand Resource Qualificationrdquo May 5 2009 at httpwwwiso-necomsupporttrainingcoursesfcmfcm_forum_may_5pdf
89 Summer on-peak hours are 1300 to 1700 non-holiday weekdays in June July and August Winter on-peak hours are 1700 to 1900 non-holiday weekdays in December and January
The Regulatory Assistance Project (RAP) is a global non-profit team of experts that focuses on the long-term economic and environmental sustainability of the power and natural gas sectors providing technical and policy assistance to government officials on a broad range of energy and environmental issues RAP has deep expertise in regulatory and market policies that promote economic efficiency protect the environment ensure system reliability and fairly allocate system benefits among all consumers We have worked extensively in the US since 1992 and in China since 1999 and have assisted governments in nearly every US state and many nations throughout the world RAP is now expanding operations with new programs and offices in Europe and plans to offer similar services in India in 2011 RAP functions as the hub of a network that includes many international experts and is primarily funded by foundations and federal grants
Home office
50 State Street Suite 3Montpelier Vermont 05602
802-223-8199wwwraponlineorg

RegulatoRy assistance PRoject
22
is unlikely to shift the power sector resource mix at the pace or scale required to meet aggressive carbon reduction targets ndash or correspondingly to substantially change the dominance of high-carbon resources clearing forward capacity auctions under current market rules An increasing number of studies makes a compelling case that our economy and our society cannot afford this dominance to persist much longer if we are to contain climate change to a livable level In fact close to full de-carbonization of the
power sector is being discussed in international forums as the only way to meet essential carbon reduction targets by 205061 While capacity markets alone are unlikely to support the full value of clean energy resources in a carbon-constrained power sector by themselves with appropriate design elements they can serve to reinforce actions taken at federal regional and state levels that provide larger and longer lasting commitments to clean demand-side and renewable resources62
52 A tonne or metric ton is a unit of mass equal to 1000 kilograms (roughly 2205 pounds) or approximately the mass of one cubic meter of water at four degrees Celsius A tonne is not the same as either a ldquoshortrdquo ton (2000 pounds) or a ldquolongrdquo ton (2240 pounds)
53 Energy and Environmental Economics Inc Greenhouse Gas Modeling of Californiarsquos Electricity Sector to 2020 Updated Results of the GHG Calculator Version 3 prepared for the California Public Utilities Commission October 2009 pp 66-67 at httpwwwethreecomdocumentsGHG_102209CPUC_GHG_Final_Report_28Oct09pdf
54 Ahmad Faruqui and Sanem Sergici The Brattle Group ldquoHousehold Response to Dynamic Pricing of Electricity A Survey of the Experimental Evidencerdquo Jan 10 2009 at httpwwwhksharvardeduhepgPapers2009The20Power20of20Experimentation20_01-11-09_pdf
55 See for example American Council for an Energy Efficient Economy ldquoQuantifying the Effects of Market Failures in the End-Use of Energyrdquo pp iii-vi 2007 at httpoldaceeeorgenergyIEAmarketbarrierspdf This study details the various types of market barriers to end-use energy efficiency and reports that up to 50 percent of residential energy use in the US is affected by such barriers
56 The US Department of Energyrsquos National Energy Modeling System (NEMS) has price elasticity built into it The long-run elasticity (assuming price effects remain for 20 years) are ndash031 for residential electric use and ndash025 for commercial electric use See Steven H Wade ldquoPrice Responsiveness in the NEMS Buildings Sector Modelrdquo in Energy Information Administrationrsquos Issues in Midterm Analysis and Forecasting 1999 pp 55 58 table 1 at httpwwweiadoegovoiafissuespdf060799pdf
57 This would require a much larger rate increase just to offset expected load growth over 20 years let alone to reduce demand sufficiently to permit absolute reductions in emissions from the nationrsquos huge generation fleet See Testimony of Richard Cowart
58 T Nakajima and S Hamori ldquoChange in Consumer Sensitivity to Electricity Prices in Response to Retail Deregulation A Panel Empirical Analysis of the Residential Demand for Electricity in the United Statesrdquo Energy Policy (2010) available at wwwsciencedirectcom
59 Ibid
60 John Dimitropoulas Lester C Hunt and Gary Judge ldquoEstimating Underlying Energy Demand Trends Using UK Annual Datardquo at httpuserwebportacuk~judgegAEL_04pdf
61 See for example Meeting Carbon Budgets ndash The Need for a Step Change Progress Report to Parliament Committee on Climate Change October 2009 at httpwwwthecccorgukreportsprogressreports Christopher Jones and Jean-Michel Glachant Why and How the European Union Can Get a (Near to) Carbon-Free Energy System in 2050 MIT Center for Energy and Environmental Policy March 2010 at httpdownloadsthecccorgukdocs2166720CCC20Executive20Summary20AW20v4pdf Roadmap 2050 A practical guide to a prosperous low-carbon Europe The European Climate Foundation April 2010 at wwwroadmap2050eu
62 Without such policies it is unlikely that even RGGIrsquos modest carbon reduction goals will be achieved See Paul Peterson Doug Hurley and David White Synapse Energy Economics Inc ISO New England Scenario Analysis Companion Report Constructing a Future That Meets Regional Goals Aug 8 2007 at wwwsynapse-energycom
23
the Role of foRwaRd caPacity MaRkets in incReasing deMand-side and otheR low-caRbon ResouRces
ISO-NE Rules for Emergency Generators Advance Environmental Goals
Emergency (ldquobackuprdquo) generators typically are diesel-fired and states in New England and elsewhere in the US have restricted the number of hours and days they may be operated through the state permitting process At the time the first regional demand response tariffs were being designed in New England a collaborative of energy regulators environmental regulators the ISO utilities and other stakeholders realized that active demand response programs could lead to substantial incentives for diesel-fired backup generators to operate more often when air quality was at its worst Regulators and the ISO proposed a rule limiting those generators to run for reliability purposes during system emergencies This is a concrete example of reliability rules being written to advance environmental goals as well as power system needs63 In addition a regional working group developed model emissions standards for small generators for statesrsquo consideration64
To reinforce regional air quality policies and goals ISO-NE limits the total amount of emergency generators in the regional capacity market to 600 MW To the extent any excess amount clears the auction capacity payments to these resources are pro-rated
63 See Cowart and Raab p 26
64 See Model Regulations for the Output of Specified Air Emissions From Smaller Scale Electric Generation Resources Oct 31 2002 at httpwwwraponlineorgshowpdfaspPDF_URL=22docsrap_issuesletter-outputbasedemissioninsert_2003_07pdf22
65 Edward S Rubin Carnegie Mellon University ldquoA Performance Standards Approach to Reducing CO2 Emissions for Electric Power Plantsrdquo June 2009 at httpwwwpewclimateorgpublicationsreportcoal-initiative-series-performance-standards-approach-reducing-co2-emissions-ele Also see Chris Simpson and Brenda Hausauer ldquoEmissions Performance Standards in Selected Statesrdquo Regulatory Assistance Project Research Brief November 2009 at httpwwwraponlineorgdocsRAP_Simpson_EPSResearchBrief_2009_11_13pdf
Policy Recommendations and Auction Design Options
We present below recommendations and a menu of auction design options for forward capacity markets that support and enhance carbon policies and carbon reduction targets
bull Power market rules should be constructed to recognize and limit the adverse environmental consequences of power generation The power system and the environment are inextricably linked Explicit consideration of environmental costs and benefits of various electricity resources is not only reasonable but necessary to meet the enormous challenge of climate change
bull Forward capacity markets should reinforce carbon reduction policies which could be accomplished by incorporating one or more of the following into the auction rules
Auction rules could apply an Emissions Performance Standard (EPS) to promote capacity commitments from low-carbon resources and discourage bids from high-emitting power plants An EPS can be expressed as a maximum level of greenhouse gas emissions per unit of electrical output or as a percentage reduction in (annual) plant emissions It can vary with fuel type and incorporate other design variations65 It may be appropriate to adopt an EPS mdash within the auction qualification rules or by regulation mdash particularly if current market signals are not sufficiently
discouraging new construction or repowering of high-emitting generating resources with long lifetimes while forward capacity markets are providing a new revenue stream to keep them running
RegulatoRy assistance PRoject
24
Auction rules could disqualify inefficient generators from participating (and from receiving capacity revenue) or more generally require their retirement through financial incentives regulations or both66 Since 2007 China has been phasing out such plants and intends to retire approximately 50 gigawatts (GW) of small inefficient coal-fired power plants nationwide and 7 GW to 10 GW of small natural gas-fired units as well as halt construction of small inefficient power plants The policy is being put in place three ways the direct rescission of operating permits the transfer of generation rights and price reductions
Capacity payments could vary by the emissions rate of the resource Instead of one price paid to all generation that clears the auction adders could be applied to payments for low-emitting units and deductions could be applied to high-emitting units67 For example a sliding-scale percentage reduction to the per-unit ($kW-month or $MW-day) clearing price could be established based on the average annualized carbon footprint of fossil-fuel resources whereas a price adder above the clearing price could be established for zero-emitting resources
Imputed ldquocarbon addersrdquo could help curtail high-emitting resources Carbon adders are imputed costs that reflect at least a portion of the societal cost of emissions They are generally
used in the context of resource planning and acquisition by a regulated LSE mdash as a way of ensuring that high-carbon risks and low-carbon alternatives are properly valued in the resource selection process But these imputed costs do not get passed on to ratepayers or consumers for every unit of power consumed in contrast to carbon pricing68 Similarly the rules in a forward capacity market could be modified so that carbon adders are applied in determining what resources clear the auction (and will receive the market clearing price for their capacity commitment)
A ldquozero-carbon resource portfolio standardrdquo could establish auctions for separate tranches of resources by emissions level For example one tranche could include energy efficiency and renewable resources The size of each tranche would be based on carbon reduction goals for the region The higher the goals the larger the tranche for energy efficiency and renewable resources These resources decrease carbon emissions because at the margin most power systems are running higher carbon resources
bull Policymakers should consider a longer price commitment in forward capacity markets mdash at least for low-carbon resources The contract period for new capacity in these markets is short (one year in PJM up to five years in ISO-NE) in part so there is greater certainty over forecasts of resource needs for system reliability (to mitigate the risk of over-supply)
66 Small and old coal plants are the most inefficient and polluting both in terms of greenhouse gases and particulate matter By some estimates 50 MW plants may use as much as 200 grams more per unit of electricity output than a plant larger than 300 MW See Frederick Weston Rebecca A Schultz David Moskovitz and Max Dupuy Regulatory Assistance Project ldquoChinarsquos Climate Change Initiatives Do new policies adopted in China offer any guidance for the transformation of the US power sector in a carbon-constrained worldrdquo November 2009 at httpwwwraponlineorgdocsRAP_China20Climate20Initiatives_NARUC_2009_11_01docx
67 See N Jonathan Peress and Kenneth A Colburn ldquoElectrical Connections Aligning Capacity Market Changes With RGGI in the Northeastrdquo Discussion Draft March 2005 at httpwwwpucnhgovEPABSymbiotic202005-03-1820Peress-Colburn20Letter20to20FERC-Woodpdf
68 Both high carbon resources and low carbon resources clearing in power markets (characterized by single-price auctions) are paid the same price So whenever fossil resources are on the margin (most of the time in most places) consumers are seeing the same price for both fossil and clean resources and the cost of carbon allowances (or carbon taxes) for that marginal resource is reflected in the clearing price for all power bought in the market Carbon adders on the other hand are not actually paid to any resource or reflected in prices for all units sold in the market
25
the Role of foRwaRd caPacity MaRkets in incReasing deMand-side and otheR low-caRbon ResouRces
Auction winners can generally participate in future auctions and receive the market clearing price but have no assurance of future prices Moreover under current rules in PJM energy efficiency resources cannot receive capacity payments over the full life of the measures mdash only for four consecutive delivery years This constraint puts energy efficiency on a different footing than other demand resources mdash as well as all supply-side resources mdash which are paid for their capacity as long as they provide the benefit
The short commitment period and lack of price certainty may not provide market signals that are strong and consistent enough to ensure sufficient new generation or encourage plant operators and investors to make efficient choices for the long-term mdash even where carbon prices are expected to increase substantially in the future due to a dramatically declining carbon cap or a high carbon tax Allowing clean resources to opt for a longer period of time over which the price is known would in particular facilitate renewable resources whose typically high upfront capital costs and low operating costs mdash compared to natural gas-fired plants in particular mdash may require such a long-term commitment to procure financing69 Another option might be to establish fixed floor prices for clean energy resources for a long-term period to provide assurance of a minimum revenue stream
bull Regional load forecasting should be reviewed for treatment of demand-side resources acquired outside the capacity market In particular the system operator determines the capacity that will be auctioned for each delivery year (three years hence) based on a 10-year load forecast which is updated on
an annual basis Under the current planning process in forward capacity markets this forecast only reflects the demand-side resources that have cleared in prior auctions The system operatorrsquos load projections do not take into consideration any load reductions from demand-side resources procured outside of the auction such as energy efficiency programs that LSEs have committed (or are obligated) to fund and implement in the coming one to three years or beyond70 If the magnitude of these load reductions is substantial the ISO may be systematically overstating the level of capacity put out to bid for each delivery year Depending upon the existing mix of resources and market conditions in the region this overstatement may have a sizeable impact not only on the level of cleared capacity and the market price but on the resulting resource mix and level of carbon emissions as well
Additional Actions
Careful design of the planning process and auctions undertaken through forward capacity markets can help to ensure that they reinforce and do not work at cross purposes with climate reduction goals and targets However forward capacity market signals (capacity prices) are only one component of a market and regulatory landscape that affects investment and operating decisions in the power sector Market rules and procurement policies that affect system energy requirements ndash as well as policies and regulations that affect access location and cost recovery for transmission and distribution facilities ndash have an enormous impact on both the short- and long-term resource mix
It is beyond the scope of this paper to fully explore how
69 LSEs in PJM and ISO-NE can contract for generating resources through the bilateral market to hedge energy and capacity costs and to meet renewable energy standards Renewable resource projects that successfully negotiate such contracts if they are long term may not need a long-term commitment in the forward capacity market Still a short-term capacity payment stream with uncertain prices thereafter weakens the ability of renewable resources to secure long-term financing
70 Some of the econometric models that the system operators use for their load forecasts may capture the impacts of federal appliance standards and building codes However to our knowledge there has been no explicit accounting to date for the impacts of state and utility energy efficiency programs where the capacity is not bid into the auctions
RegulatoRy assistance PRoject
26
market rules and other policies and regulations can be harmonized and strengthened to meet customersrsquo energy needs reliably in a carbon-constrained world Larger and longer lasting commitments to demand-side and renewable resources are certainly needed to ensure a mix of resources that will significantly reduce greenhouse gas emissions in the power sector This has been the conclusion of US policymakers who have put in place additional policies to facilitate long-term acquisition of low-carbon resources in regions that operate both forward capacity markets and a cap-and-trade program (under RGGI)71
bull States have adopted a variety of mechanisms for sustained and aggressive energy efficiency programs
bull Strong building codes and equipment standards
bull Stable funding through a system benefit charge
bull Third-party administration of programs or where the utility is the efficiency portfolio manager decoupling of utility profits from revenues financial incentives for shareholders or both
bull Recycling of carbon auction proceeds into energy efficiency investments
bull Some states require long-term resource plans or resource procurement plans that must include energy efficiency Therersquos renewed interest in long-term planning and procurement particularly for demand-side and renewable resources following a period
where these efforts were largely abandoned with electric industry restructuring and development of organized markets72
bull Several states have adopted energy efficiency resource standards that require achievement of specified energy-saving targets73
bull Most of the states have renewable energy standards74 and several states require long-term contracting of renewable resources to meet the standards75
bull Connecticut Maryland Pennsylvania and Rhode Island require contract terms of 10 years or longer
bull New York requires central procurement of renewable energy credits by a state agency under long-term contract Illinois is likely to acquire long-term contracts for renewable resources under its central procurement mandate
bull Massachusettsrsquo Green Power Partnership purchases renewable energy credits for up to 10 years using its renewable energy fund
These are just examples and certainly not an exhaustive list of the ways in which careful design of forward capacity markets coupled with additional policies at the federal regional and state level can serve to reinforce both resource adequacy requirements and carbon reduction goals
71 Regulatory Assistance Project policy grids summarize state-by-state requirements for resource planning and energy efficiency at httpwwwraponlineorgFeatureaspselect=116 For a summary of renewable energy standards in the US see Ryan Wiser and Galen Barbose Lawrence Berkeley National Laboratory ldquoState of the States Update on RPS Policies and Progressrdquo State-Federal RPS Collaborative Nov 18 2009 at httpwwwcleanenergystatesorgMeetingsRPS_Summit_09WISER_RPS_Summit2009pdf
72 More broadly 30 states nationwide require integrated resource plans or resource procurement plans that include energy efficiency
73 Includes states with strict energy efficiency standards states with Commission-ordered efficiency targets states that allow efficiency to count toward renewable energy standards and states with a rate cap that triggers a relaxation of requirements See Laura A Furrey Steven Nadel and John A ldquoSkiprdquo Laitner ACEEE Laying the Foundation for Implementing a Federal Energy Efficiency Resource Standard March 2009 at httpaceeeorgpubse091htm
74 Some 29 US states and the District of Columbia have renewable energy standards five other states have non-binding goals See Wiser and Barbose
75 For a US database of state incentives for renewable energy and energy efficiency see httpwwwdsireusaorg
27
the Role of foRwaRd caPacity MaRkets in incReasing deMand-side and otheR low-caRbon ResouRces
An example of an approach that attempts to ldquomarryrdquo integrated least-cost resource planning with forward capacity markets is the resource planning and procurement process recently established by the Connecticut Legislature76 The law requires the utilities Energy Advisory Board and Department of Public Utility Control to plan for current and future energy and capacity needs and provide a mechanism for procuring resources that meet specified economic reliability and environmental objectives77 to satisfy the identified need Further the law requires that resource needs first be met through energy efficiency and demand reduction resources that are cost effective reliable and feasible Based on the resulting resource plans LSEs enter into
contracts to acquire the required capacity (level and mix) through a competitive bidding process The law also requires that any resources winning contracts for capacity agree to let the LSE bid that capacity into the forward capacity auction as a ldquoself-suppliedrdquo resource This approach permits LSEs to determine both the quantity and mix of resources through integrated resource planning that will meet their resource adequacy requirements and state policy goals (eg carbon reduction) The LSE pays the contracted capacity price (under its bilateral contracts) instead of paying the auction clearing price to everyone that offers capacity into the forward capacity market (eg existing fossil fuel or nuclear plants)78
Connecticutrsquos Marriage of Resource Planning and Markets
76 Conn Gen Stat sectsect 16a-3a 16a-3b and 16a-3c
77 Costs and benefits cost-effectiveness cost impacts on customers the extent to which load growth can be eliminated and peak demand reduced reliability including energy security and economic risks impacts on meeting state environmental standards including emissions goals optimization of existing generation and generation sites the extent to which renewable resources can be used to meet needs and fuel types diversity and supply See Department of Public Utility Control Final Order in Docket No 08-07-01 Feb 18 2009
78 This approach is not without some controversy A contracted new resource in Connecticut has the potential to displace an alternative ldquocompetitiverdquo new resource in the region that would have bid at a higher price mdash had Connecticut not been allowed to designate the contract as self-supply ISO-NErsquos Internal Market Monitoring Unit has commented on this issue in a report to FERC See Internal Market Monitoring Unit ISO-NE June 5 2009
RegulatoRy assistance PRoject
28
Conclusions and Recommendations
Auction-based capacity markets in the US have been successful to date in attracting the capacity needed to maintain system reliability in an economically efficient manner In particular these markets have been successful in facilitating new demand-side resources
with ratepayers and society reaping the economic and environmental benefits However policymakers also should consider capacity markets in the context of carbon reduction policies and targets for the power sector Even markets that successfully integrate demand-side and renewable resources into the auction process are still encouraging the construction or continued operation of high-emitting supply-side resources to meet reliability targets
Existing capacity markets should be evaluated to assess whether the market is responding in this way And if it is policymakers need to critically assess whether a continuation of that market response over the coming years will make it possible to achieve the cumulative level of carbon reductions required from the power sector to avoid the worst effects of climate change Depending on the results of this inquiry policymakers may need to refine the auction rules and adopt additional policies for the power sector mdash such as those described in this paper mdash to ensure the alignment of capacity markets with both short- and long-term carbon reduction goals
More generally forward capacity markets create a revenue stream for resources that can commit to being available at times of system peak several years in the future mdash but this financial incentive is clearly not the only factor driving the mix of resources in the power sector and their resulting carbon footprint Market rules policies and regulations that affect investment and operating decisions for meeting the systemrsquos energy requirements mdash as well as those that affect access location and cost recovery for transmission and distribution facilities mdash have an enormous impact on both the short- and long-term resource mix in the electric system Policymakers will need to consider how this entire market and regulatory landscape mdash including forward capacity markets mdash can be strengthened and harmonized to reliably meet customer demand for electricity in a carbon-constrained world
29
the Role of foRwaRd caPacity MaRkets in incReasing deMand-side and otheR low-caRbon ResouRces
Cleared capacity values in the following tables represent all capacity committed by existing resources remaining in the market and all new resources that bid into the auction at or below
the market clearing price Cleared capacity includes ldquoself-suppliedrdquo or ldquoself-scheduledrdquo resources entered into the auction by LSEs However as described in this paper when the monthly billingsettlement process is completed the capacity charges allocated to the LSE will be offset (credited) for the cleared capacity delivered by these resources
Incremental capacity in the tables below reflects 1) new generation resources 2) capacity upgrades to existing generation resources 3) partial offsets to
incremental generation capacity due to capacity de-ratings to existing generation resources 4) new demand response resources 5) upgrades to existing demand response resources and 6) new energy efficiency resources
PJM Results79
PJM has conducted five Base Residual Auctions since its inception in 2007 for delivery years beginning in 20082009 (that each run from June 1 to May 31) Capacity cleared in the PJM auction is defined in terms of ldquounforcedrdquo capacity that is the capacity of a resource adjusted for availability and deliverability based on historical performance (eg forced outages)
Appendix 1
Detailed Results for PJM and ISO-NE Capacity Markets
Table 1 Generation Demand Resources and Energy Efficiency Resources
Offered and Cleared in PJM Base Residual Auctions (Unforced Capacity in MW)
Delivery Year 20082009 20092010 20102011 20112012 20122013
Generation Offered 1311648 1326142 1321248 1360679 1348730
DR Offered 7158 9368 9679 16524 98476
EE Offered - - - - 6527
Total Offered 1318806 1335510 1330927 1377203 1453733
Generation Cleared 1290614 1313389 1312515 1308566 1285274
DR Cleared 5362 8929 9390 13649 70473
EE Cleared 00 00 00 00 5689
Total Cleared 1295976 1322318 1321905 1322215 1361436
Energy efficiency resources were first eligible in the 20122013 auction
79 All information for PJM compiled from ldquo20122013 RPM Base Residual Auction Resultsrdquo at httpwwwpjmcom~mediamarkets-opsrpmrpm-auction-info2012-13-base-residual-auction-report-document-pdfashx
RegulatoRy assistance PRoject
30
Table 2 Incremental Capacity Additions and Reductions in PJM Base Residual Auctions(Installed Capacity in MW)
Delivery Year 20072008 20082009 20092010 20102011 20112012 20122013 Total
Increase inGenerationCapacity 6020 7242 12723 17762 35763 18935 98445
Decrease inGenerationCapacity -6746 -3754 -5502 -3018 -2647 -32539 -54206
Net Increase inDemand ResourceCapacity 5550 5747 2150 287 6617 79381 99732
Net Increasein EnergyEfficiency Capacity 0 0 0 0 0 6323 6323
Net Increasein InstalledCapacity 4824 9235 9371 15031 39733 72100 150294
Note Change in generation capacity is cumulative net increase in demand-side resources is relative to previous yearrsquos Base Residual Auction
Table 3 Breakdown of Incremental Capacity Resource Additionsin PJM Base Residual Auctions (Installed Capacity in MW)
Delivery Year CTGT Combined Diesel Hydro Steam Nuclear Solar Wind Total Cycle (Coal)
New 20072008 187 03 190Capacity 20082009 270 661 931Units 20092010 3995 238 530 4763 20102011 2833 5800 230 1414 10277 20112012 4164 11350 7048 11 752 23325 20122013 4038 5850 78 363 751 11080
Capacity 20072008 470 470From 20082009 1310 1310Reactivated 20092010 0Units 20102011 1600 107 1707 20112012 800 1010 1810 20122013 0
Uprates to 20072008 1145 139 800 2356 920 5360Existing 20082009 1082 340 180 1055 1960 384 5001Capacity 20092010 1522 2060 1625 614 1974 165 7960Resources 20102011 1173 1630 480 892 1603 5778 20112012 3692 1486 574 1868 2921 87 10628 20122013 2312 1643 142 1930 1260 568 7855
Total 28356 30159 2145 3963 20351 9062 11 4398 98445
Note Values represent capacity commitments Nameplate ratings of variable resources (solar and wind) are far larger than shown here
31
the Role of foRwaRd caPacity MaRkets in incReasing deMand-side and otheR low-caRbon ResouRces
Table 4 Changes to Generation Retirement Decisions
Since Reliability Pricing Model Approval (Unforced Capacity in MW)
Generation Resource Decision Changes Capacity Cleared
Withdrawn Deactivation Requests 17987
Postponed or Cancelled Retirement 13029
Reactivation 1752
ToTal 3276 8
Note Unforced capacity cleared in Base Residual Auctions from resources that withdrew their request to deactivate postponed retirement or were reactivated (ie came out of retirement or mothball state)
Table 5 PJM Base Residual Auction Clearing Price
Delivery Year Clearing Prices ($MW-day)
20072008 $4080
20082009 $11192
20092010 $10204
20102011 $17429
20112012 $11000
20122013 $1646
Note Values do not include any locational price adders Simple conversion of $MW-day to $kW-month multiply by 3 and divide by 100
Table 6 Effect of Demand-Side Resources on PJM Market Clearing Price
20122013 Base Residual Auction80
Actual Auction Results Calculated Results Without Demand-Side Resources
Clearing Prices Cleared Unforced Clearing Prices Cleared Unforced Savings
($MW-day) Capacity (MW) ($MW-day) Capacity (MW) ($MW-day)
$1646 1361435 $17878 1335682 $16232
80 Bowring Monitoring Analytics Table 20
RegulatoRy assistance PRoject
32
ISO-NE ResultsISO-NE has held three forward capacity auctions to
date The first auction (FCA 1) in February 2008 was for capacity delivery beginning in June 2010 (20102011 delivery year) The second auction (FCA 2) was held in December 2008 for delivery in 20112012 and the third
Table 7 Summary Results for ISO-NE Capacity Auctions81
Net Installed Total Resources Excess Clearing Net Price Capacity Cleared Capacity Price ($kW-month)82
Requirement (MW) (MW) ($kW-month)
FCA 1 32305 34077 1772 $450 $425
FCA 2 32528 37283 4755 $360 $312
FCA 3 31965 36996 4649 $295 $254
Table 8 Demand-Side Resources Cleared in ISO-NE Capacity Auctions (MW)81
Distributed Distributed Energy Real-Time Demand Real-Time Total Generation- Generation- Efficiency ResponseLoad Emergency Demand-Side Fossil Fuels Renewable Resources Management Generation Resources
FCA 1 46 lt02 655 978 875 2554
FCA 2 93 lt02 890 1195 759 2937
FCA 3 86 07 975 1206 630 2898
auction (FCA 3) was held in October 2009 for delivery in 20122013 ldquoClearedrdquo amounts in these tables include resources from earlier auctions that remain listed as well as new resources less resources that drop out
Note Net Installed Capacity Requirement values exclude the interconnection benefits associated with the Hydro-Queacutebec Phase III interface Excess capacity is not adjusted for Real-Time Emergency Generation in excess of the 600 MW limit Net prices reflect prorating of clearing prices due to excess capacity clearing the auction Simple conversion of $kW-month to $MW-day divide by 3 and multiply by 100
Note Demand-side values are grossed-up for avoided transmission and distribution losses and reserve margin (no reserve margin forFCA 3) Total resources cleared include excess capacity above the Net Installed Capacity Requirement Real-time emergency generation refers to distributed generation whose state air quality permit limits operation to ldquoemergencyrdquo conditions See Appendix 3
81 ISO-NE Forward Capacity Market Results at httpwwwiso-necommarketsothrmkts_datafcmcal_resultsindexhtml
82 Communication with Henry Yoshimura director Demand Resource Strategy ISO-NE March 2009
83 Eric Winkler ISO-New England ldquoThird Regional Energy Efficiency Initiative Meetingrdquo July 7 2009 and ldquoFCA Updaterdquo Demand Response Working Group Meeting Dec 2 2009 Total resources cleared (Capacity Supply Obligation) from Forward Capacity Market Auction Results for the 20102011 20112012 and 20122013 auctions at httpwwwiso-necommarketsothrmkts_datafcmcal_resultsindexhtml
33
the Role of foRwaRd caPacity MaRkets in incReasing deMand-side and otheR low-caRbon ResouRces
Step 1
System Operator (SO) Plans ldquoForwardrdquo for the Region
2012 Projection of Peak Demand = 10000 MW (incl reserves) Each ldquoLoad Serving Entityrdquo (LSE) is obligated for its 50 share
Appendix 2
Illustration of ldquoHow Forward Capacity Markets Workrdquo
SO purchases capacity in 2012 at the 2009 auction clearing price
LSE can be regulated utility or competitive retail supplier
LSE1 5000 MW
LSE2 5000 MW
R1
R1 =3500 MW capacity ldquoSelf Supplyrdquo Resources (LSE1 ownedunder contract)
RegulatoRy assistance PRoject
34
Step 2
The Regional Capacity Auction (3 Years ldquoForwardrdquo)
Step 3
System Operator Pays Cleared Resources at P and Bills LSEs(Note Self-Supply capacity is a ldquowashrdquo)
R1 R2 R3 R4 R5 R6 R7
P
R1
R3
R3
R5
R5
R2
R2
R4
R4
R6
R7
Bid Price = $ per MW-day
Quantity = MW
6500 MW P
Cleared Capacity = 10000
Supply = Capacity Committed ldquoForwardrdquo
P= Clearing price paid to all capacity clearing auction
Demand = SO Forecast of Capacity Requirements
R1-R7 = Capacity offered by Supply-Side (New built Existing Uprates) and Demand-Side (Energy Efficiency Demand Response Distrib Gen) Self-supply (R1) bids in a ldquozerordquo price New Resources set clearing price
LSE1 5000 MW
LSE2 5000 MW
R1
SOSO pays R1 3500 MW P
LSE2 pays its share of regional demand
5000 MW P
LSE1 pays its share of regional demand (5000 MW) adjusted for self-supply R1 for a net payment of 1500MW P
R1 = 3500 MW of ldquoSelf-Supplyrdquo Resources (LSE1 ownedunder contract)
In 2010Total regional peak demand of 10000 MW supplied by R1 + R2 + R3 + R4 + R5 LSE1 and LSE2 are each responsible for 50 of regional peak demand
35
the Role of foRwaRd caPacity MaRkets in incReasing deMand-side and otheR low-caRbon ResouRces
PJM Eligibility Requirements
Eligibility of demand-side resources has changed significantly over the years in PJMrsquos capacity markets In particular it was not until the most recent capacity auction (May 2009) for the
20122013 delivery year that energy efficiency became eligible to bid in PJMrsquos Base Residual Auction PJM is currently considering a tariff change to also allow energy efficiency to bid into incremental auctions
Under PJMrsquos eligibility rules an energy efficiency resource must achieve a ldquopermanentrdquo continuous reduction in electric energy consumption Examples of such a resource include lighting retrofit programs for residential commercial and industrial customers and programs to retrofit buildings with heating and cooling systems that exceed current efficiency standards To be eligible an energy efficiency resource must meet the following criteria
bull It is fully implemented throughout the delivery year without any requirement of notice dispatch or additional customer action
bull It is not reflected as a reduction in the peak load forecast used for the Base Residual Auction for the proposed delivery year
bull It exceeds relevant standards (such as building codes or appliance standards) at the time of commitment
bull It achieves the specified load reduction (expected average demand in MW) during defined summer on-peak hours84
Demand response on the other hand must be dispatchable mdash that is customer demand must be reduced when instructed For example a large supermarket with
coolers and freezers could install load management equipment that would cycle them on or off mdash and bid that demand response capability into the market85 More specifically a demand response resource must meet the following criteria
bull It is able to reduce demand for electricity up to 10 times each year for up to six consecutive hours per interruption during defined periods86
bull It is fully implemented within one hour (short lead time) or two hours (long lead time) of notice from PJM
bull In a year without calls for demand reductions it must demonstrate reliability through a test of reduction capability
bull It is registered in the Emergency Load Response Program and thus available for dispatch during PJM-declared emergency events
bull Compliance and status reports are filed as required
Multiple end-use customers can be aggregated in order to submit a single demand response offer in the capacity auction if those customers share the same curtailment service provider electric distribution company and transmission zone
In addition customer-sited distributed generation may be offered into auctions as a demand resource A hospital for example could offer to run its back-up generator on certain peak demand (eg hot summer) days to reduce its load on the system Or an industrial plant could cut back on production on such days and continue to run its on-site combustion or steam-cycle turbine
Currently energy efficiency resources may participate
Appendix 3
Eligibility Requirements for Demand-Side Resourcesin US Capacity Markets
84 Weekdays excluding holidays June through August between the hours ending 1500 and 1800 Eastern Prevailing Time (EPT)
85 If instead the supermarket replaced the existing coolers and freezers with more energy efficient ones it would bid that proposal in as an energy efficiency resource Or it could do both (replace and cycle) and bid in the capacity from the permanent savings (replacements) as energy efficiency and the dispatchable capacity (the cycling) as demand response
86 Weekdays excluding holidays from 1200 to 2000 EPT May through September and 1400 to 2200 EPT October through April
RegulatoRy assistance PRoject
36
in Base Residual Auctions for up to four consecutive delivery years In effect this means that PJM limits capacity payments for efficiency measures to four years of their measure life (rather than for the full measure life)87 In contrast a demand response resource (including distributed generation) can participate in the PJM capacity market for as long as its ability to reduce demand continues
ISO-NE Eligibility RequirementsSince the inception of ISO-NErsquos forward capacity market
in 2006 energy efficiency has qualified as an eligible demand-side resource ISO-NE defines demand resources as installed measures (products equipment systems services practices and strategies) that result in verifiable reductions in end-use consumption of electricity in the New England power system These are further categorized into ldquopassiverdquo (energy efficiency and non-dispatchable distributed generation) and ldquoactiverdquo (demand response emergency generation and dispatchable distributed generation) resources Passive demand resources are non-dispatchable but permanently reduce energy demand during peak hours Active demand resources are designed to reduce peak loads and to reduce load based on real-time system conditions or ISO-NE instructions Following are descriptions of eligible demand-side resources and performance requirements88
Passive Demand Resourcesbull On-Peak Demand Resources are measures that are
not weather-sensitive and reduce demand across a fixed set of on-peak hours such as energy-efficient commercial lighting and motors89
bull Seasonal Peak Demand Resources are weather-sensitive measures that reduce load during high-demand conditions such as energy-efficient heating and air conditioning systems Seasonal Peak Demand Resources must reduce load when actual system load is equal to 90 percent of the most recent peak load forecast for the applicable summer or winter season
Active Demand Resourcesbull Real-Time Demand Response Resources are
measures including load management and distributed generation that can be dispatched by ISO-NE as needed They must curtail electrical usage within 30 minutes of receiving a dispatch instruction and until receiving a releaserecall dispatch instruction
bull Real-Time Emergency Generation is distributed generation whose state air quality permit limits operation to ldquoemergencyrdquo conditions Generators must curtail the customerrsquos electrical usage within 30 minutes of receiving a dispatch instruction and until receiving a releaserecall dispatch instruction The amount of emergency generation that can be used to meet ISO-NErsquos capacity requirement is limited to 600 MW If the amount of real-time emergency generation that clears the auction exceeds this level payments to generators are reduced on a pro-rated basis All real-time emergency generation is treated as existing capacity
In contrast to PJM all demand-side resources in ISO-NE are eligible to bid capacity for their full measure life an approach that recognizes the full contribution of these resources to regional resource adequacy requirements and adds value to long-lived energy efficiency assets
87 FERC has directed PJM to evaluate the impact of its capacity payment period for energy efficiency resources
88 Eric Winkler and Abimael Santana ISO-NE ldquoNew Demand Resource Qualificationrdquo May 5 2009 at httpwwwiso-necomsupporttrainingcoursesfcmfcm_forum_may_5pdf
89 Summer on-peak hours are 1300 to 1700 non-holiday weekdays in June July and August Winter on-peak hours are 1700 to 1900 non-holiday weekdays in December and January
The Regulatory Assistance Project (RAP) is a global non-profit team of experts that focuses on the long-term economic and environmental sustainability of the power and natural gas sectors providing technical and policy assistance to government officials on a broad range of energy and environmental issues RAP has deep expertise in regulatory and market policies that promote economic efficiency protect the environment ensure system reliability and fairly allocate system benefits among all consumers We have worked extensively in the US since 1992 and in China since 1999 and have assisted governments in nearly every US state and many nations throughout the world RAP is now expanding operations with new programs and offices in Europe and plans to offer similar services in India in 2011 RAP functions as the hub of a network that includes many international experts and is primarily funded by foundations and federal grants
Home office
50 State Street Suite 3Montpelier Vermont 05602
802-223-8199wwwraponlineorg
RegulatoRy assistance PRoject
24
Auction rules could disqualify inefficient generators from participating (and from receiving capacity revenue) or more generally require their retirement through financial incentives regulations or both66 Since 2007 China has been phasing out such plants and intends to retire approximately 50 gigawatts (GW) of small inefficient coal-fired power plants nationwide and 7 GW to 10 GW of small natural gas-fired units as well as halt construction of small inefficient power plants The policy is being put in place three ways the direct rescission of operating permits the transfer of generation rights and price reductions
Capacity payments could vary by the emissions rate of the resource Instead of one price paid to all generation that clears the auction adders could be applied to payments for low-emitting units and deductions could be applied to high-emitting units67 For example a sliding-scale percentage reduction to the per-unit ($kW-month or $MW-day) clearing price could be established based on the average annualized carbon footprint of fossil-fuel resources whereas a price adder above the clearing price could be established for zero-emitting resources
Imputed ldquocarbon addersrdquo could help curtail high-emitting resources Carbon adders are imputed costs that reflect at least a portion of the societal cost of emissions They are generally
used in the context of resource planning and acquisition by a regulated LSE mdash as a way of ensuring that high-carbon risks and low-carbon alternatives are properly valued in the resource selection process But these imputed costs do not get passed on to ratepayers or consumers for every unit of power consumed in contrast to carbon pricing68 Similarly the rules in a forward capacity market could be modified so that carbon adders are applied in determining what resources clear the auction (and will receive the market clearing price for their capacity commitment)
A ldquozero-carbon resource portfolio standardrdquo could establish auctions for separate tranches of resources by emissions level For example one tranche could include energy efficiency and renewable resources The size of each tranche would be based on carbon reduction goals for the region The higher the goals the larger the tranche for energy efficiency and renewable resources These resources decrease carbon emissions because at the margin most power systems are running higher carbon resources
bull Policymakers should consider a longer price commitment in forward capacity markets mdash at least for low-carbon resources The contract period for new capacity in these markets is short (one year in PJM up to five years in ISO-NE) in part so there is greater certainty over forecasts of resource needs for system reliability (to mitigate the risk of over-supply)
66 Small and old coal plants are the most inefficient and polluting both in terms of greenhouse gases and particulate matter By some estimates 50 MW plants may use as much as 200 grams more per unit of electricity output than a plant larger than 300 MW See Frederick Weston Rebecca A Schultz David Moskovitz and Max Dupuy Regulatory Assistance Project ldquoChinarsquos Climate Change Initiatives Do new policies adopted in China offer any guidance for the transformation of the US power sector in a carbon-constrained worldrdquo November 2009 at httpwwwraponlineorgdocsRAP_China20Climate20Initiatives_NARUC_2009_11_01docx
67 See N Jonathan Peress and Kenneth A Colburn ldquoElectrical Connections Aligning Capacity Market Changes With RGGI in the Northeastrdquo Discussion Draft March 2005 at httpwwwpucnhgovEPABSymbiotic202005-03-1820Peress-Colburn20Letter20to20FERC-Woodpdf
68 Both high carbon resources and low carbon resources clearing in power markets (characterized by single-price auctions) are paid the same price So whenever fossil resources are on the margin (most of the time in most places) consumers are seeing the same price for both fossil and clean resources and the cost of carbon allowances (or carbon taxes) for that marginal resource is reflected in the clearing price for all power bought in the market Carbon adders on the other hand are not actually paid to any resource or reflected in prices for all units sold in the market
25
the Role of foRwaRd caPacity MaRkets in incReasing deMand-side and otheR low-caRbon ResouRces
Auction winners can generally participate in future auctions and receive the market clearing price but have no assurance of future prices Moreover under current rules in PJM energy efficiency resources cannot receive capacity payments over the full life of the measures mdash only for four consecutive delivery years This constraint puts energy efficiency on a different footing than other demand resources mdash as well as all supply-side resources mdash which are paid for their capacity as long as they provide the benefit
The short commitment period and lack of price certainty may not provide market signals that are strong and consistent enough to ensure sufficient new generation or encourage plant operators and investors to make efficient choices for the long-term mdash even where carbon prices are expected to increase substantially in the future due to a dramatically declining carbon cap or a high carbon tax Allowing clean resources to opt for a longer period of time over which the price is known would in particular facilitate renewable resources whose typically high upfront capital costs and low operating costs mdash compared to natural gas-fired plants in particular mdash may require such a long-term commitment to procure financing69 Another option might be to establish fixed floor prices for clean energy resources for a long-term period to provide assurance of a minimum revenue stream
bull Regional load forecasting should be reviewed for treatment of demand-side resources acquired outside the capacity market In particular the system operator determines the capacity that will be auctioned for each delivery year (three years hence) based on a 10-year load forecast which is updated on
an annual basis Under the current planning process in forward capacity markets this forecast only reflects the demand-side resources that have cleared in prior auctions The system operatorrsquos load projections do not take into consideration any load reductions from demand-side resources procured outside of the auction such as energy efficiency programs that LSEs have committed (or are obligated) to fund and implement in the coming one to three years or beyond70 If the magnitude of these load reductions is substantial the ISO may be systematically overstating the level of capacity put out to bid for each delivery year Depending upon the existing mix of resources and market conditions in the region this overstatement may have a sizeable impact not only on the level of cleared capacity and the market price but on the resulting resource mix and level of carbon emissions as well
Additional Actions
Careful design of the planning process and auctions undertaken through forward capacity markets can help to ensure that they reinforce and do not work at cross purposes with climate reduction goals and targets However forward capacity market signals (capacity prices) are only one component of a market and regulatory landscape that affects investment and operating decisions in the power sector Market rules and procurement policies that affect system energy requirements ndash as well as policies and regulations that affect access location and cost recovery for transmission and distribution facilities ndash have an enormous impact on both the short- and long-term resource mix
It is beyond the scope of this paper to fully explore how
69 LSEs in PJM and ISO-NE can contract for generating resources through the bilateral market to hedge energy and capacity costs and to meet renewable energy standards Renewable resource projects that successfully negotiate such contracts if they are long term may not need a long-term commitment in the forward capacity market Still a short-term capacity payment stream with uncertain prices thereafter weakens the ability of renewable resources to secure long-term financing
70 Some of the econometric models that the system operators use for their load forecasts may capture the impacts of federal appliance standards and building codes However to our knowledge there has been no explicit accounting to date for the impacts of state and utility energy efficiency programs where the capacity is not bid into the auctions
RegulatoRy assistance PRoject
26
market rules and other policies and regulations can be harmonized and strengthened to meet customersrsquo energy needs reliably in a carbon-constrained world Larger and longer lasting commitments to demand-side and renewable resources are certainly needed to ensure a mix of resources that will significantly reduce greenhouse gas emissions in the power sector This has been the conclusion of US policymakers who have put in place additional policies to facilitate long-term acquisition of low-carbon resources in regions that operate both forward capacity markets and a cap-and-trade program (under RGGI)71
bull States have adopted a variety of mechanisms for sustained and aggressive energy efficiency programs
bull Strong building codes and equipment standards
bull Stable funding through a system benefit charge
bull Third-party administration of programs or where the utility is the efficiency portfolio manager decoupling of utility profits from revenues financial incentives for shareholders or both
bull Recycling of carbon auction proceeds into energy efficiency investments
bull Some states require long-term resource plans or resource procurement plans that must include energy efficiency Therersquos renewed interest in long-term planning and procurement particularly for demand-side and renewable resources following a period
where these efforts were largely abandoned with electric industry restructuring and development of organized markets72
bull Several states have adopted energy efficiency resource standards that require achievement of specified energy-saving targets73
bull Most of the states have renewable energy standards74 and several states require long-term contracting of renewable resources to meet the standards75
bull Connecticut Maryland Pennsylvania and Rhode Island require contract terms of 10 years or longer
bull New York requires central procurement of renewable energy credits by a state agency under long-term contract Illinois is likely to acquire long-term contracts for renewable resources under its central procurement mandate
bull Massachusettsrsquo Green Power Partnership purchases renewable energy credits for up to 10 years using its renewable energy fund
These are just examples and certainly not an exhaustive list of the ways in which careful design of forward capacity markets coupled with additional policies at the federal regional and state level can serve to reinforce both resource adequacy requirements and carbon reduction goals
71 Regulatory Assistance Project policy grids summarize state-by-state requirements for resource planning and energy efficiency at httpwwwraponlineorgFeatureaspselect=116 For a summary of renewable energy standards in the US see Ryan Wiser and Galen Barbose Lawrence Berkeley National Laboratory ldquoState of the States Update on RPS Policies and Progressrdquo State-Federal RPS Collaborative Nov 18 2009 at httpwwwcleanenergystatesorgMeetingsRPS_Summit_09WISER_RPS_Summit2009pdf
72 More broadly 30 states nationwide require integrated resource plans or resource procurement plans that include energy efficiency
73 Includes states with strict energy efficiency standards states with Commission-ordered efficiency targets states that allow efficiency to count toward renewable energy standards and states with a rate cap that triggers a relaxation of requirements See Laura A Furrey Steven Nadel and John A ldquoSkiprdquo Laitner ACEEE Laying the Foundation for Implementing a Federal Energy Efficiency Resource Standard March 2009 at httpaceeeorgpubse091htm
74 Some 29 US states and the District of Columbia have renewable energy standards five other states have non-binding goals See Wiser and Barbose
75 For a US database of state incentives for renewable energy and energy efficiency see httpwwwdsireusaorg
27
the Role of foRwaRd caPacity MaRkets in incReasing deMand-side and otheR low-caRbon ResouRces
An example of an approach that attempts to ldquomarryrdquo integrated least-cost resource planning with forward capacity markets is the resource planning and procurement process recently established by the Connecticut Legislature76 The law requires the utilities Energy Advisory Board and Department of Public Utility Control to plan for current and future energy and capacity needs and provide a mechanism for procuring resources that meet specified economic reliability and environmental objectives77 to satisfy the identified need Further the law requires that resource needs first be met through energy efficiency and demand reduction resources that are cost effective reliable and feasible Based on the resulting resource plans LSEs enter into
contracts to acquire the required capacity (level and mix) through a competitive bidding process The law also requires that any resources winning contracts for capacity agree to let the LSE bid that capacity into the forward capacity auction as a ldquoself-suppliedrdquo resource This approach permits LSEs to determine both the quantity and mix of resources through integrated resource planning that will meet their resource adequacy requirements and state policy goals (eg carbon reduction) The LSE pays the contracted capacity price (under its bilateral contracts) instead of paying the auction clearing price to everyone that offers capacity into the forward capacity market (eg existing fossil fuel or nuclear plants)78
Connecticutrsquos Marriage of Resource Planning and Markets
76 Conn Gen Stat sectsect 16a-3a 16a-3b and 16a-3c
77 Costs and benefits cost-effectiveness cost impacts on customers the extent to which load growth can be eliminated and peak demand reduced reliability including energy security and economic risks impacts on meeting state environmental standards including emissions goals optimization of existing generation and generation sites the extent to which renewable resources can be used to meet needs and fuel types diversity and supply See Department of Public Utility Control Final Order in Docket No 08-07-01 Feb 18 2009
78 This approach is not without some controversy A contracted new resource in Connecticut has the potential to displace an alternative ldquocompetitiverdquo new resource in the region that would have bid at a higher price mdash had Connecticut not been allowed to designate the contract as self-supply ISO-NErsquos Internal Market Monitoring Unit has commented on this issue in a report to FERC See Internal Market Monitoring Unit ISO-NE June 5 2009
RegulatoRy assistance PRoject
28
Conclusions and Recommendations
Auction-based capacity markets in the US have been successful to date in attracting the capacity needed to maintain system reliability in an economically efficient manner In particular these markets have been successful in facilitating new demand-side resources
with ratepayers and society reaping the economic and environmental benefits However policymakers also should consider capacity markets in the context of carbon reduction policies and targets for the power sector Even markets that successfully integrate demand-side and renewable resources into the auction process are still encouraging the construction or continued operation of high-emitting supply-side resources to meet reliability targets
Existing capacity markets should be evaluated to assess whether the market is responding in this way And if it is policymakers need to critically assess whether a continuation of that market response over the coming years will make it possible to achieve the cumulative level of carbon reductions required from the power sector to avoid the worst effects of climate change Depending on the results of this inquiry policymakers may need to refine the auction rules and adopt additional policies for the power sector mdash such as those described in this paper mdash to ensure the alignment of capacity markets with both short- and long-term carbon reduction goals
More generally forward capacity markets create a revenue stream for resources that can commit to being available at times of system peak several years in the future mdash but this financial incentive is clearly not the only factor driving the mix of resources in the power sector and their resulting carbon footprint Market rules policies and regulations that affect investment and operating decisions for meeting the systemrsquos energy requirements mdash as well as those that affect access location and cost recovery for transmission and distribution facilities mdash have an enormous impact on both the short- and long-term resource mix in the electric system Policymakers will need to consider how this entire market and regulatory landscape mdash including forward capacity markets mdash can be strengthened and harmonized to reliably meet customer demand for electricity in a carbon-constrained world
29
the Role of foRwaRd caPacity MaRkets in incReasing deMand-side and otheR low-caRbon ResouRces
Cleared capacity values in the following tables represent all capacity committed by existing resources remaining in the market and all new resources that bid into the auction at or below
the market clearing price Cleared capacity includes ldquoself-suppliedrdquo or ldquoself-scheduledrdquo resources entered into the auction by LSEs However as described in this paper when the monthly billingsettlement process is completed the capacity charges allocated to the LSE will be offset (credited) for the cleared capacity delivered by these resources
Incremental capacity in the tables below reflects 1) new generation resources 2) capacity upgrades to existing generation resources 3) partial offsets to
incremental generation capacity due to capacity de-ratings to existing generation resources 4) new demand response resources 5) upgrades to existing demand response resources and 6) new energy efficiency resources
PJM Results79
PJM has conducted five Base Residual Auctions since its inception in 2007 for delivery years beginning in 20082009 (that each run from June 1 to May 31) Capacity cleared in the PJM auction is defined in terms of ldquounforcedrdquo capacity that is the capacity of a resource adjusted for availability and deliverability based on historical performance (eg forced outages)
Appendix 1
Detailed Results for PJM and ISO-NE Capacity Markets
Table 1 Generation Demand Resources and Energy Efficiency Resources
Offered and Cleared in PJM Base Residual Auctions (Unforced Capacity in MW)
Delivery Year 20082009 20092010 20102011 20112012 20122013
Generation Offered 1311648 1326142 1321248 1360679 1348730
DR Offered 7158 9368 9679 16524 98476
EE Offered - - - - 6527
Total Offered 1318806 1335510 1330927 1377203 1453733
Generation Cleared 1290614 1313389 1312515 1308566 1285274
DR Cleared 5362 8929 9390 13649 70473
EE Cleared 00 00 00 00 5689
Total Cleared 1295976 1322318 1321905 1322215 1361436
Energy efficiency resources were first eligible in the 20122013 auction
79 All information for PJM compiled from ldquo20122013 RPM Base Residual Auction Resultsrdquo at httpwwwpjmcom~mediamarkets-opsrpmrpm-auction-info2012-13-base-residual-auction-report-document-pdfashx
RegulatoRy assistance PRoject
30
Table 2 Incremental Capacity Additions and Reductions in PJM Base Residual Auctions(Installed Capacity in MW)
Delivery Year 20072008 20082009 20092010 20102011 20112012 20122013 Total
Increase inGenerationCapacity 6020 7242 12723 17762 35763 18935 98445
Decrease inGenerationCapacity -6746 -3754 -5502 -3018 -2647 -32539 -54206
Net Increase inDemand ResourceCapacity 5550 5747 2150 287 6617 79381 99732
Net Increasein EnergyEfficiency Capacity 0 0 0 0 0 6323 6323
Net Increasein InstalledCapacity 4824 9235 9371 15031 39733 72100 150294
Note Change in generation capacity is cumulative net increase in demand-side resources is relative to previous yearrsquos Base Residual Auction
Table 3 Breakdown of Incremental Capacity Resource Additionsin PJM Base Residual Auctions (Installed Capacity in MW)
Delivery Year CTGT Combined Diesel Hydro Steam Nuclear Solar Wind Total Cycle (Coal)
New 20072008 187 03 190Capacity 20082009 270 661 931Units 20092010 3995 238 530 4763 20102011 2833 5800 230 1414 10277 20112012 4164 11350 7048 11 752 23325 20122013 4038 5850 78 363 751 11080
Capacity 20072008 470 470From 20082009 1310 1310Reactivated 20092010 0Units 20102011 1600 107 1707 20112012 800 1010 1810 20122013 0
Uprates to 20072008 1145 139 800 2356 920 5360Existing 20082009 1082 340 180 1055 1960 384 5001Capacity 20092010 1522 2060 1625 614 1974 165 7960Resources 20102011 1173 1630 480 892 1603 5778 20112012 3692 1486 574 1868 2921 87 10628 20122013 2312 1643 142 1930 1260 568 7855
Total 28356 30159 2145 3963 20351 9062 11 4398 98445
Note Values represent capacity commitments Nameplate ratings of variable resources (solar and wind) are far larger than shown here
31
the Role of foRwaRd caPacity MaRkets in incReasing deMand-side and otheR low-caRbon ResouRces
Table 4 Changes to Generation Retirement Decisions
Since Reliability Pricing Model Approval (Unforced Capacity in MW)
Generation Resource Decision Changes Capacity Cleared
Withdrawn Deactivation Requests 17987
Postponed or Cancelled Retirement 13029
Reactivation 1752
ToTal 3276 8
Note Unforced capacity cleared in Base Residual Auctions from resources that withdrew their request to deactivate postponed retirement or were reactivated (ie came out of retirement or mothball state)
Table 5 PJM Base Residual Auction Clearing Price
Delivery Year Clearing Prices ($MW-day)
20072008 $4080
20082009 $11192
20092010 $10204
20102011 $17429
20112012 $11000
20122013 $1646
Note Values do not include any locational price adders Simple conversion of $MW-day to $kW-month multiply by 3 and divide by 100
Table 6 Effect of Demand-Side Resources on PJM Market Clearing Price
20122013 Base Residual Auction80
Actual Auction Results Calculated Results Without Demand-Side Resources
Clearing Prices Cleared Unforced Clearing Prices Cleared Unforced Savings
($MW-day) Capacity (MW) ($MW-day) Capacity (MW) ($MW-day)
$1646 1361435 $17878 1335682 $16232
80 Bowring Monitoring Analytics Table 20
RegulatoRy assistance PRoject
32
ISO-NE ResultsISO-NE has held three forward capacity auctions to
date The first auction (FCA 1) in February 2008 was for capacity delivery beginning in June 2010 (20102011 delivery year) The second auction (FCA 2) was held in December 2008 for delivery in 20112012 and the third
Table 7 Summary Results for ISO-NE Capacity Auctions81
Net Installed Total Resources Excess Clearing Net Price Capacity Cleared Capacity Price ($kW-month)82
Requirement (MW) (MW) ($kW-month)
FCA 1 32305 34077 1772 $450 $425
FCA 2 32528 37283 4755 $360 $312
FCA 3 31965 36996 4649 $295 $254
Table 8 Demand-Side Resources Cleared in ISO-NE Capacity Auctions (MW)81
Distributed Distributed Energy Real-Time Demand Real-Time Total Generation- Generation- Efficiency ResponseLoad Emergency Demand-Side Fossil Fuels Renewable Resources Management Generation Resources
FCA 1 46 lt02 655 978 875 2554
FCA 2 93 lt02 890 1195 759 2937
FCA 3 86 07 975 1206 630 2898
auction (FCA 3) was held in October 2009 for delivery in 20122013 ldquoClearedrdquo amounts in these tables include resources from earlier auctions that remain listed as well as new resources less resources that drop out
Note Net Installed Capacity Requirement values exclude the interconnection benefits associated with the Hydro-Queacutebec Phase III interface Excess capacity is not adjusted for Real-Time Emergency Generation in excess of the 600 MW limit Net prices reflect prorating of clearing prices due to excess capacity clearing the auction Simple conversion of $kW-month to $MW-day divide by 3 and multiply by 100
Note Demand-side values are grossed-up for avoided transmission and distribution losses and reserve margin (no reserve margin forFCA 3) Total resources cleared include excess capacity above the Net Installed Capacity Requirement Real-time emergency generation refers to distributed generation whose state air quality permit limits operation to ldquoemergencyrdquo conditions See Appendix 3
81 ISO-NE Forward Capacity Market Results at httpwwwiso-necommarketsothrmkts_datafcmcal_resultsindexhtml
82 Communication with Henry Yoshimura director Demand Resource Strategy ISO-NE March 2009
83 Eric Winkler ISO-New England ldquoThird Regional Energy Efficiency Initiative Meetingrdquo July 7 2009 and ldquoFCA Updaterdquo Demand Response Working Group Meeting Dec 2 2009 Total resources cleared (Capacity Supply Obligation) from Forward Capacity Market Auction Results for the 20102011 20112012 and 20122013 auctions at httpwwwiso-necommarketsothrmkts_datafcmcal_resultsindexhtml
33
the Role of foRwaRd caPacity MaRkets in incReasing deMand-side and otheR low-caRbon ResouRces
Step 1
System Operator (SO) Plans ldquoForwardrdquo for the Region
2012 Projection of Peak Demand = 10000 MW (incl reserves) Each ldquoLoad Serving Entityrdquo (LSE) is obligated for its 50 share
Appendix 2
Illustration of ldquoHow Forward Capacity Markets Workrdquo
SO purchases capacity in 2012 at the 2009 auction clearing price
LSE can be regulated utility or competitive retail supplier
LSE1 5000 MW
LSE2 5000 MW
R1
R1 =3500 MW capacity ldquoSelf Supplyrdquo Resources (LSE1 ownedunder contract)
RegulatoRy assistance PRoject
34
Step 2
The Regional Capacity Auction (3 Years ldquoForwardrdquo)
Step 3
System Operator Pays Cleared Resources at P and Bills LSEs(Note Self-Supply capacity is a ldquowashrdquo)
R1 R2 R3 R4 R5 R6 R7
P
R1
R3
R3
R5
R5
R2
R2
R4
R4
R6
R7
Bid Price = $ per MW-day
Quantity = MW
6500 MW P
Cleared Capacity = 10000
Supply = Capacity Committed ldquoForwardrdquo
P= Clearing price paid to all capacity clearing auction
Demand = SO Forecast of Capacity Requirements
R1-R7 = Capacity offered by Supply-Side (New built Existing Uprates) and Demand-Side (Energy Efficiency Demand Response Distrib Gen) Self-supply (R1) bids in a ldquozerordquo price New Resources set clearing price
LSE1 5000 MW
LSE2 5000 MW
R1
SOSO pays R1 3500 MW P
LSE2 pays its share of regional demand
5000 MW P
LSE1 pays its share of regional demand (5000 MW) adjusted for self-supply R1 for a net payment of 1500MW P
R1 = 3500 MW of ldquoSelf-Supplyrdquo Resources (LSE1 ownedunder contract)
In 2010Total regional peak demand of 10000 MW supplied by R1 + R2 + R3 + R4 + R5 LSE1 and LSE2 are each responsible for 50 of regional peak demand
35
the Role of foRwaRd caPacity MaRkets in incReasing deMand-side and otheR low-caRbon ResouRces
PJM Eligibility Requirements
Eligibility of demand-side resources has changed significantly over the years in PJMrsquos capacity markets In particular it was not until the most recent capacity auction (May 2009) for the
20122013 delivery year that energy efficiency became eligible to bid in PJMrsquos Base Residual Auction PJM is currently considering a tariff change to also allow energy efficiency to bid into incremental auctions
Under PJMrsquos eligibility rules an energy efficiency resource must achieve a ldquopermanentrdquo continuous reduction in electric energy consumption Examples of such a resource include lighting retrofit programs for residential commercial and industrial customers and programs to retrofit buildings with heating and cooling systems that exceed current efficiency standards To be eligible an energy efficiency resource must meet the following criteria
bull It is fully implemented throughout the delivery year without any requirement of notice dispatch or additional customer action
bull It is not reflected as a reduction in the peak load forecast used for the Base Residual Auction for the proposed delivery year
bull It exceeds relevant standards (such as building codes or appliance standards) at the time of commitment
bull It achieves the specified load reduction (expected average demand in MW) during defined summer on-peak hours84
Demand response on the other hand must be dispatchable mdash that is customer demand must be reduced when instructed For example a large supermarket with
coolers and freezers could install load management equipment that would cycle them on or off mdash and bid that demand response capability into the market85 More specifically a demand response resource must meet the following criteria
bull It is able to reduce demand for electricity up to 10 times each year for up to six consecutive hours per interruption during defined periods86
bull It is fully implemented within one hour (short lead time) or two hours (long lead time) of notice from PJM
bull In a year without calls for demand reductions it must demonstrate reliability through a test of reduction capability
bull It is registered in the Emergency Load Response Program and thus available for dispatch during PJM-declared emergency events
bull Compliance and status reports are filed as required
Multiple end-use customers can be aggregated in order to submit a single demand response offer in the capacity auction if those customers share the same curtailment service provider electric distribution company and transmission zone
In addition customer-sited distributed generation may be offered into auctions as a demand resource A hospital for example could offer to run its back-up generator on certain peak demand (eg hot summer) days to reduce its load on the system Or an industrial plant could cut back on production on such days and continue to run its on-site combustion or steam-cycle turbine
Currently energy efficiency resources may participate
Appendix 3
Eligibility Requirements for Demand-Side Resourcesin US Capacity Markets
84 Weekdays excluding holidays June through August between the hours ending 1500 and 1800 Eastern Prevailing Time (EPT)
85 If instead the supermarket replaced the existing coolers and freezers with more energy efficient ones it would bid that proposal in as an energy efficiency resource Or it could do both (replace and cycle) and bid in the capacity from the permanent savings (replacements) as energy efficiency and the dispatchable capacity (the cycling) as demand response
86 Weekdays excluding holidays from 1200 to 2000 EPT May through September and 1400 to 2200 EPT October through April
RegulatoRy assistance PRoject
36
in Base Residual Auctions for up to four consecutive delivery years In effect this means that PJM limits capacity payments for efficiency measures to four years of their measure life (rather than for the full measure life)87 In contrast a demand response resource (including distributed generation) can participate in the PJM capacity market for as long as its ability to reduce demand continues
ISO-NE Eligibility RequirementsSince the inception of ISO-NErsquos forward capacity market
in 2006 energy efficiency has qualified as an eligible demand-side resource ISO-NE defines demand resources as installed measures (products equipment systems services practices and strategies) that result in verifiable reductions in end-use consumption of electricity in the New England power system These are further categorized into ldquopassiverdquo (energy efficiency and non-dispatchable distributed generation) and ldquoactiverdquo (demand response emergency generation and dispatchable distributed generation) resources Passive demand resources are non-dispatchable but permanently reduce energy demand during peak hours Active demand resources are designed to reduce peak loads and to reduce load based on real-time system conditions or ISO-NE instructions Following are descriptions of eligible demand-side resources and performance requirements88
Passive Demand Resourcesbull On-Peak Demand Resources are measures that are
not weather-sensitive and reduce demand across a fixed set of on-peak hours such as energy-efficient commercial lighting and motors89
bull Seasonal Peak Demand Resources are weather-sensitive measures that reduce load during high-demand conditions such as energy-efficient heating and air conditioning systems Seasonal Peak Demand Resources must reduce load when actual system load is equal to 90 percent of the most recent peak load forecast for the applicable summer or winter season
Active Demand Resourcesbull Real-Time Demand Response Resources are
measures including load management and distributed generation that can be dispatched by ISO-NE as needed They must curtail electrical usage within 30 minutes of receiving a dispatch instruction and until receiving a releaserecall dispatch instruction
bull Real-Time Emergency Generation is distributed generation whose state air quality permit limits operation to ldquoemergencyrdquo conditions Generators must curtail the customerrsquos electrical usage within 30 minutes of receiving a dispatch instruction and until receiving a releaserecall dispatch instruction The amount of emergency generation that can be used to meet ISO-NErsquos capacity requirement is limited to 600 MW If the amount of real-time emergency generation that clears the auction exceeds this level payments to generators are reduced on a pro-rated basis All real-time emergency generation is treated as existing capacity
In contrast to PJM all demand-side resources in ISO-NE are eligible to bid capacity for their full measure life an approach that recognizes the full contribution of these resources to regional resource adequacy requirements and adds value to long-lived energy efficiency assets
87 FERC has directed PJM to evaluate the impact of its capacity payment period for energy efficiency resources
88 Eric Winkler and Abimael Santana ISO-NE ldquoNew Demand Resource Qualificationrdquo May 5 2009 at httpwwwiso-necomsupporttrainingcoursesfcmfcm_forum_may_5pdf
89 Summer on-peak hours are 1300 to 1700 non-holiday weekdays in June July and August Winter on-peak hours are 1700 to 1900 non-holiday weekdays in December and January
The Regulatory Assistance Project (RAP) is a global non-profit team of experts that focuses on the long-term economic and environmental sustainability of the power and natural gas sectors providing technical and policy assistance to government officials on a broad range of energy and environmental issues RAP has deep expertise in regulatory and market policies that promote economic efficiency protect the environment ensure system reliability and fairly allocate system benefits among all consumers We have worked extensively in the US since 1992 and in China since 1999 and have assisted governments in nearly every US state and many nations throughout the world RAP is now expanding operations with new programs and offices in Europe and plans to offer similar services in India in 2011 RAP functions as the hub of a network that includes many international experts and is primarily funded by foundations and federal grants
Home office
50 State Street Suite 3Montpelier Vermont 05602
802-223-8199wwwraponlineorg

RegulatoRy assistance PRoject
26
market rules and other policies and regulations can be harmonized and strengthened to meet customersrsquo energy needs reliably in a carbon-constrained world Larger and longer lasting commitments to demand-side and renewable resources are certainly needed to ensure a mix of resources that will significantly reduce greenhouse gas emissions in the power sector This has been the conclusion of US policymakers who have put in place additional policies to facilitate long-term acquisition of low-carbon resources in regions that operate both forward capacity markets and a cap-and-trade program (under RGGI)71
bull States have adopted a variety of mechanisms for sustained and aggressive energy efficiency programs
bull Strong building codes and equipment standards
bull Stable funding through a system benefit charge
bull Third-party administration of programs or where the utility is the efficiency portfolio manager decoupling of utility profits from revenues financial incentives for shareholders or both
bull Recycling of carbon auction proceeds into energy efficiency investments
bull Some states require long-term resource plans or resource procurement plans that must include energy efficiency Therersquos renewed interest in long-term planning and procurement particularly for demand-side and renewable resources following a period
where these efforts were largely abandoned with electric industry restructuring and development of organized markets72
bull Several states have adopted energy efficiency resource standards that require achievement of specified energy-saving targets73
bull Most of the states have renewable energy standards74 and several states require long-term contracting of renewable resources to meet the standards75
bull Connecticut Maryland Pennsylvania and Rhode Island require contract terms of 10 years or longer
bull New York requires central procurement of renewable energy credits by a state agency under long-term contract Illinois is likely to acquire long-term contracts for renewable resources under its central procurement mandate
bull Massachusettsrsquo Green Power Partnership purchases renewable energy credits for up to 10 years using its renewable energy fund
These are just examples and certainly not an exhaustive list of the ways in which careful design of forward capacity markets coupled with additional policies at the federal regional and state level can serve to reinforce both resource adequacy requirements and carbon reduction goals
71 Regulatory Assistance Project policy grids summarize state-by-state requirements for resource planning and energy efficiency at httpwwwraponlineorgFeatureaspselect=116 For a summary of renewable energy standards in the US see Ryan Wiser and Galen Barbose Lawrence Berkeley National Laboratory ldquoState of the States Update on RPS Policies and Progressrdquo State-Federal RPS Collaborative Nov 18 2009 at httpwwwcleanenergystatesorgMeetingsRPS_Summit_09WISER_RPS_Summit2009pdf
72 More broadly 30 states nationwide require integrated resource plans or resource procurement plans that include energy efficiency
73 Includes states with strict energy efficiency standards states with Commission-ordered efficiency targets states that allow efficiency to count toward renewable energy standards and states with a rate cap that triggers a relaxation of requirements See Laura A Furrey Steven Nadel and John A ldquoSkiprdquo Laitner ACEEE Laying the Foundation for Implementing a Federal Energy Efficiency Resource Standard March 2009 at httpaceeeorgpubse091htm
74 Some 29 US states and the District of Columbia have renewable energy standards five other states have non-binding goals See Wiser and Barbose
75 For a US database of state incentives for renewable energy and energy efficiency see httpwwwdsireusaorg
27
the Role of foRwaRd caPacity MaRkets in incReasing deMand-side and otheR low-caRbon ResouRces
An example of an approach that attempts to ldquomarryrdquo integrated least-cost resource planning with forward capacity markets is the resource planning and procurement process recently established by the Connecticut Legislature76 The law requires the utilities Energy Advisory Board and Department of Public Utility Control to plan for current and future energy and capacity needs and provide a mechanism for procuring resources that meet specified economic reliability and environmental objectives77 to satisfy the identified need Further the law requires that resource needs first be met through energy efficiency and demand reduction resources that are cost effective reliable and feasible Based on the resulting resource plans LSEs enter into
contracts to acquire the required capacity (level and mix) through a competitive bidding process The law also requires that any resources winning contracts for capacity agree to let the LSE bid that capacity into the forward capacity auction as a ldquoself-suppliedrdquo resource This approach permits LSEs to determine both the quantity and mix of resources through integrated resource planning that will meet their resource adequacy requirements and state policy goals (eg carbon reduction) The LSE pays the contracted capacity price (under its bilateral contracts) instead of paying the auction clearing price to everyone that offers capacity into the forward capacity market (eg existing fossil fuel or nuclear plants)78
Connecticutrsquos Marriage of Resource Planning and Markets
76 Conn Gen Stat sectsect 16a-3a 16a-3b and 16a-3c
77 Costs and benefits cost-effectiveness cost impacts on customers the extent to which load growth can be eliminated and peak demand reduced reliability including energy security and economic risks impacts on meeting state environmental standards including emissions goals optimization of existing generation and generation sites the extent to which renewable resources can be used to meet needs and fuel types diversity and supply See Department of Public Utility Control Final Order in Docket No 08-07-01 Feb 18 2009
78 This approach is not without some controversy A contracted new resource in Connecticut has the potential to displace an alternative ldquocompetitiverdquo new resource in the region that would have bid at a higher price mdash had Connecticut not been allowed to designate the contract as self-supply ISO-NErsquos Internal Market Monitoring Unit has commented on this issue in a report to FERC See Internal Market Monitoring Unit ISO-NE June 5 2009
RegulatoRy assistance PRoject
28
Conclusions and Recommendations
Auction-based capacity markets in the US have been successful to date in attracting the capacity needed to maintain system reliability in an economically efficient manner In particular these markets have been successful in facilitating new demand-side resources
with ratepayers and society reaping the economic and environmental benefits However policymakers also should consider capacity markets in the context of carbon reduction policies and targets for the power sector Even markets that successfully integrate demand-side and renewable resources into the auction process are still encouraging the construction or continued operation of high-emitting supply-side resources to meet reliability targets
Existing capacity markets should be evaluated to assess whether the market is responding in this way And if it is policymakers need to critically assess whether a continuation of that market response over the coming years will make it possible to achieve the cumulative level of carbon reductions required from the power sector to avoid the worst effects of climate change Depending on the results of this inquiry policymakers may need to refine the auction rules and adopt additional policies for the power sector mdash such as those described in this paper mdash to ensure the alignment of capacity markets with both short- and long-term carbon reduction goals
More generally forward capacity markets create a revenue stream for resources that can commit to being available at times of system peak several years in the future mdash but this financial incentive is clearly not the only factor driving the mix of resources in the power sector and their resulting carbon footprint Market rules policies and regulations that affect investment and operating decisions for meeting the systemrsquos energy requirements mdash as well as those that affect access location and cost recovery for transmission and distribution facilities mdash have an enormous impact on both the short- and long-term resource mix in the electric system Policymakers will need to consider how this entire market and regulatory landscape mdash including forward capacity markets mdash can be strengthened and harmonized to reliably meet customer demand for electricity in a carbon-constrained world
29
the Role of foRwaRd caPacity MaRkets in incReasing deMand-side and otheR low-caRbon ResouRces
Cleared capacity values in the following tables represent all capacity committed by existing resources remaining in the market and all new resources that bid into the auction at or below
the market clearing price Cleared capacity includes ldquoself-suppliedrdquo or ldquoself-scheduledrdquo resources entered into the auction by LSEs However as described in this paper when the monthly billingsettlement process is completed the capacity charges allocated to the LSE will be offset (credited) for the cleared capacity delivered by these resources
Incremental capacity in the tables below reflects 1) new generation resources 2) capacity upgrades to existing generation resources 3) partial offsets to
incremental generation capacity due to capacity de-ratings to existing generation resources 4) new demand response resources 5) upgrades to existing demand response resources and 6) new energy efficiency resources
PJM Results79
PJM has conducted five Base Residual Auctions since its inception in 2007 for delivery years beginning in 20082009 (that each run from June 1 to May 31) Capacity cleared in the PJM auction is defined in terms of ldquounforcedrdquo capacity that is the capacity of a resource adjusted for availability and deliverability based on historical performance (eg forced outages)
Appendix 1
Detailed Results for PJM and ISO-NE Capacity Markets
Table 1 Generation Demand Resources and Energy Efficiency Resources
Offered and Cleared in PJM Base Residual Auctions (Unforced Capacity in MW)
Delivery Year 20082009 20092010 20102011 20112012 20122013
Generation Offered 1311648 1326142 1321248 1360679 1348730
DR Offered 7158 9368 9679 16524 98476
EE Offered - - - - 6527
Total Offered 1318806 1335510 1330927 1377203 1453733
Generation Cleared 1290614 1313389 1312515 1308566 1285274
DR Cleared 5362 8929 9390 13649 70473
EE Cleared 00 00 00 00 5689
Total Cleared 1295976 1322318 1321905 1322215 1361436
Energy efficiency resources were first eligible in the 20122013 auction
79 All information for PJM compiled from ldquo20122013 RPM Base Residual Auction Resultsrdquo at httpwwwpjmcom~mediamarkets-opsrpmrpm-auction-info2012-13-base-residual-auction-report-document-pdfashx
RegulatoRy assistance PRoject
30
Table 2 Incremental Capacity Additions and Reductions in PJM Base Residual Auctions(Installed Capacity in MW)
Delivery Year 20072008 20082009 20092010 20102011 20112012 20122013 Total
Increase inGenerationCapacity 6020 7242 12723 17762 35763 18935 98445
Decrease inGenerationCapacity -6746 -3754 -5502 -3018 -2647 -32539 -54206
Net Increase inDemand ResourceCapacity 5550 5747 2150 287 6617 79381 99732
Net Increasein EnergyEfficiency Capacity 0 0 0 0 0 6323 6323
Net Increasein InstalledCapacity 4824 9235 9371 15031 39733 72100 150294
Note Change in generation capacity is cumulative net increase in demand-side resources is relative to previous yearrsquos Base Residual Auction
Table 3 Breakdown of Incremental Capacity Resource Additionsin PJM Base Residual Auctions (Installed Capacity in MW)
Delivery Year CTGT Combined Diesel Hydro Steam Nuclear Solar Wind Total Cycle (Coal)
New 20072008 187 03 190Capacity 20082009 270 661 931Units 20092010 3995 238 530 4763 20102011 2833 5800 230 1414 10277 20112012 4164 11350 7048 11 752 23325 20122013 4038 5850 78 363 751 11080
Capacity 20072008 470 470From 20082009 1310 1310Reactivated 20092010 0Units 20102011 1600 107 1707 20112012 800 1010 1810 20122013 0
Uprates to 20072008 1145 139 800 2356 920 5360Existing 20082009 1082 340 180 1055 1960 384 5001Capacity 20092010 1522 2060 1625 614 1974 165 7960Resources 20102011 1173 1630 480 892 1603 5778 20112012 3692 1486 574 1868 2921 87 10628 20122013 2312 1643 142 1930 1260 568 7855
Total 28356 30159 2145 3963 20351 9062 11 4398 98445
Note Values represent capacity commitments Nameplate ratings of variable resources (solar and wind) are far larger than shown here
31
the Role of foRwaRd caPacity MaRkets in incReasing deMand-side and otheR low-caRbon ResouRces
Table 4 Changes to Generation Retirement Decisions
Since Reliability Pricing Model Approval (Unforced Capacity in MW)
Generation Resource Decision Changes Capacity Cleared
Withdrawn Deactivation Requests 17987
Postponed or Cancelled Retirement 13029
Reactivation 1752
ToTal 3276 8
Note Unforced capacity cleared in Base Residual Auctions from resources that withdrew their request to deactivate postponed retirement or were reactivated (ie came out of retirement or mothball state)
Table 5 PJM Base Residual Auction Clearing Price
Delivery Year Clearing Prices ($MW-day)
20072008 $4080
20082009 $11192
20092010 $10204
20102011 $17429
20112012 $11000
20122013 $1646
Note Values do not include any locational price adders Simple conversion of $MW-day to $kW-month multiply by 3 and divide by 100
Table 6 Effect of Demand-Side Resources on PJM Market Clearing Price
20122013 Base Residual Auction80
Actual Auction Results Calculated Results Without Demand-Side Resources
Clearing Prices Cleared Unforced Clearing Prices Cleared Unforced Savings
($MW-day) Capacity (MW) ($MW-day) Capacity (MW) ($MW-day)
$1646 1361435 $17878 1335682 $16232
80 Bowring Monitoring Analytics Table 20
RegulatoRy assistance PRoject
32
ISO-NE ResultsISO-NE has held three forward capacity auctions to
date The first auction (FCA 1) in February 2008 was for capacity delivery beginning in June 2010 (20102011 delivery year) The second auction (FCA 2) was held in December 2008 for delivery in 20112012 and the third
Table 7 Summary Results for ISO-NE Capacity Auctions81
Net Installed Total Resources Excess Clearing Net Price Capacity Cleared Capacity Price ($kW-month)82
Requirement (MW) (MW) ($kW-month)
FCA 1 32305 34077 1772 $450 $425
FCA 2 32528 37283 4755 $360 $312
FCA 3 31965 36996 4649 $295 $254
Table 8 Demand-Side Resources Cleared in ISO-NE Capacity Auctions (MW)81
Distributed Distributed Energy Real-Time Demand Real-Time Total Generation- Generation- Efficiency ResponseLoad Emergency Demand-Side Fossil Fuels Renewable Resources Management Generation Resources
FCA 1 46 lt02 655 978 875 2554
FCA 2 93 lt02 890 1195 759 2937
FCA 3 86 07 975 1206 630 2898
auction (FCA 3) was held in October 2009 for delivery in 20122013 ldquoClearedrdquo amounts in these tables include resources from earlier auctions that remain listed as well as new resources less resources that drop out
Note Net Installed Capacity Requirement values exclude the interconnection benefits associated with the Hydro-Queacutebec Phase III interface Excess capacity is not adjusted for Real-Time Emergency Generation in excess of the 600 MW limit Net prices reflect prorating of clearing prices due to excess capacity clearing the auction Simple conversion of $kW-month to $MW-day divide by 3 and multiply by 100
Note Demand-side values are grossed-up for avoided transmission and distribution losses and reserve margin (no reserve margin forFCA 3) Total resources cleared include excess capacity above the Net Installed Capacity Requirement Real-time emergency generation refers to distributed generation whose state air quality permit limits operation to ldquoemergencyrdquo conditions See Appendix 3
81 ISO-NE Forward Capacity Market Results at httpwwwiso-necommarketsothrmkts_datafcmcal_resultsindexhtml
82 Communication with Henry Yoshimura director Demand Resource Strategy ISO-NE March 2009
83 Eric Winkler ISO-New England ldquoThird Regional Energy Efficiency Initiative Meetingrdquo July 7 2009 and ldquoFCA Updaterdquo Demand Response Working Group Meeting Dec 2 2009 Total resources cleared (Capacity Supply Obligation) from Forward Capacity Market Auction Results for the 20102011 20112012 and 20122013 auctions at httpwwwiso-necommarketsothrmkts_datafcmcal_resultsindexhtml
33
the Role of foRwaRd caPacity MaRkets in incReasing deMand-side and otheR low-caRbon ResouRces
Step 1
System Operator (SO) Plans ldquoForwardrdquo for the Region
2012 Projection of Peak Demand = 10000 MW (incl reserves) Each ldquoLoad Serving Entityrdquo (LSE) is obligated for its 50 share
Appendix 2
Illustration of ldquoHow Forward Capacity Markets Workrdquo
SO purchases capacity in 2012 at the 2009 auction clearing price
LSE can be regulated utility or competitive retail supplier
LSE1 5000 MW
LSE2 5000 MW
R1
R1 =3500 MW capacity ldquoSelf Supplyrdquo Resources (LSE1 ownedunder contract)
RegulatoRy assistance PRoject
34
Step 2
The Regional Capacity Auction (3 Years ldquoForwardrdquo)
Step 3
System Operator Pays Cleared Resources at P and Bills LSEs(Note Self-Supply capacity is a ldquowashrdquo)
R1 R2 R3 R4 R5 R6 R7
P
R1
R3
R3
R5
R5
R2
R2
R4
R4
R6
R7
Bid Price = $ per MW-day
Quantity = MW
6500 MW P
Cleared Capacity = 10000
Supply = Capacity Committed ldquoForwardrdquo
P= Clearing price paid to all capacity clearing auction
Demand = SO Forecast of Capacity Requirements
R1-R7 = Capacity offered by Supply-Side (New built Existing Uprates) and Demand-Side (Energy Efficiency Demand Response Distrib Gen) Self-supply (R1) bids in a ldquozerordquo price New Resources set clearing price
LSE1 5000 MW
LSE2 5000 MW
R1
SOSO pays R1 3500 MW P
LSE2 pays its share of regional demand
5000 MW P
LSE1 pays its share of regional demand (5000 MW) adjusted for self-supply R1 for a net payment of 1500MW P
R1 = 3500 MW of ldquoSelf-Supplyrdquo Resources (LSE1 ownedunder contract)
In 2010Total regional peak demand of 10000 MW supplied by R1 + R2 + R3 + R4 + R5 LSE1 and LSE2 are each responsible for 50 of regional peak demand
35
the Role of foRwaRd caPacity MaRkets in incReasing deMand-side and otheR low-caRbon ResouRces
PJM Eligibility Requirements
Eligibility of demand-side resources has changed significantly over the years in PJMrsquos capacity markets In particular it was not until the most recent capacity auction (May 2009) for the
20122013 delivery year that energy efficiency became eligible to bid in PJMrsquos Base Residual Auction PJM is currently considering a tariff change to also allow energy efficiency to bid into incremental auctions
Under PJMrsquos eligibility rules an energy efficiency resource must achieve a ldquopermanentrdquo continuous reduction in electric energy consumption Examples of such a resource include lighting retrofit programs for residential commercial and industrial customers and programs to retrofit buildings with heating and cooling systems that exceed current efficiency standards To be eligible an energy efficiency resource must meet the following criteria
bull It is fully implemented throughout the delivery year without any requirement of notice dispatch or additional customer action
bull It is not reflected as a reduction in the peak load forecast used for the Base Residual Auction for the proposed delivery year
bull It exceeds relevant standards (such as building codes or appliance standards) at the time of commitment
bull It achieves the specified load reduction (expected average demand in MW) during defined summer on-peak hours84
Demand response on the other hand must be dispatchable mdash that is customer demand must be reduced when instructed For example a large supermarket with
coolers and freezers could install load management equipment that would cycle them on or off mdash and bid that demand response capability into the market85 More specifically a demand response resource must meet the following criteria
bull It is able to reduce demand for electricity up to 10 times each year for up to six consecutive hours per interruption during defined periods86
bull It is fully implemented within one hour (short lead time) or two hours (long lead time) of notice from PJM
bull In a year without calls for demand reductions it must demonstrate reliability through a test of reduction capability
bull It is registered in the Emergency Load Response Program and thus available for dispatch during PJM-declared emergency events
bull Compliance and status reports are filed as required
Multiple end-use customers can be aggregated in order to submit a single demand response offer in the capacity auction if those customers share the same curtailment service provider electric distribution company and transmission zone
In addition customer-sited distributed generation may be offered into auctions as a demand resource A hospital for example could offer to run its back-up generator on certain peak demand (eg hot summer) days to reduce its load on the system Or an industrial plant could cut back on production on such days and continue to run its on-site combustion or steam-cycle turbine
Currently energy efficiency resources may participate
Appendix 3
Eligibility Requirements for Demand-Side Resourcesin US Capacity Markets
84 Weekdays excluding holidays June through August between the hours ending 1500 and 1800 Eastern Prevailing Time (EPT)
85 If instead the supermarket replaced the existing coolers and freezers with more energy efficient ones it would bid that proposal in as an energy efficiency resource Or it could do both (replace and cycle) and bid in the capacity from the permanent savings (replacements) as energy efficiency and the dispatchable capacity (the cycling) as demand response
86 Weekdays excluding holidays from 1200 to 2000 EPT May through September and 1400 to 2200 EPT October through April
RegulatoRy assistance PRoject
36
in Base Residual Auctions for up to four consecutive delivery years In effect this means that PJM limits capacity payments for efficiency measures to four years of their measure life (rather than for the full measure life)87 In contrast a demand response resource (including distributed generation) can participate in the PJM capacity market for as long as its ability to reduce demand continues
ISO-NE Eligibility RequirementsSince the inception of ISO-NErsquos forward capacity market
in 2006 energy efficiency has qualified as an eligible demand-side resource ISO-NE defines demand resources as installed measures (products equipment systems services practices and strategies) that result in verifiable reductions in end-use consumption of electricity in the New England power system These are further categorized into ldquopassiverdquo (energy efficiency and non-dispatchable distributed generation) and ldquoactiverdquo (demand response emergency generation and dispatchable distributed generation) resources Passive demand resources are non-dispatchable but permanently reduce energy demand during peak hours Active demand resources are designed to reduce peak loads and to reduce load based on real-time system conditions or ISO-NE instructions Following are descriptions of eligible demand-side resources and performance requirements88
Passive Demand Resourcesbull On-Peak Demand Resources are measures that are
not weather-sensitive and reduce demand across a fixed set of on-peak hours such as energy-efficient commercial lighting and motors89
bull Seasonal Peak Demand Resources are weather-sensitive measures that reduce load during high-demand conditions such as energy-efficient heating and air conditioning systems Seasonal Peak Demand Resources must reduce load when actual system load is equal to 90 percent of the most recent peak load forecast for the applicable summer or winter season
Active Demand Resourcesbull Real-Time Demand Response Resources are
measures including load management and distributed generation that can be dispatched by ISO-NE as needed They must curtail electrical usage within 30 minutes of receiving a dispatch instruction and until receiving a releaserecall dispatch instruction
bull Real-Time Emergency Generation is distributed generation whose state air quality permit limits operation to ldquoemergencyrdquo conditions Generators must curtail the customerrsquos electrical usage within 30 minutes of receiving a dispatch instruction and until receiving a releaserecall dispatch instruction The amount of emergency generation that can be used to meet ISO-NErsquos capacity requirement is limited to 600 MW If the amount of real-time emergency generation that clears the auction exceeds this level payments to generators are reduced on a pro-rated basis All real-time emergency generation is treated as existing capacity
In contrast to PJM all demand-side resources in ISO-NE are eligible to bid capacity for their full measure life an approach that recognizes the full contribution of these resources to regional resource adequacy requirements and adds value to long-lived energy efficiency assets
87 FERC has directed PJM to evaluate the impact of its capacity payment period for energy efficiency resources
88 Eric Winkler and Abimael Santana ISO-NE ldquoNew Demand Resource Qualificationrdquo May 5 2009 at httpwwwiso-necomsupporttrainingcoursesfcmfcm_forum_may_5pdf
89 Summer on-peak hours are 1300 to 1700 non-holiday weekdays in June July and August Winter on-peak hours are 1700 to 1900 non-holiday weekdays in December and January
The Regulatory Assistance Project (RAP) is a global non-profit team of experts that focuses on the long-term economic and environmental sustainability of the power and natural gas sectors providing technical and policy assistance to government officials on a broad range of energy and environmental issues RAP has deep expertise in regulatory and market policies that promote economic efficiency protect the environment ensure system reliability and fairly allocate system benefits among all consumers We have worked extensively in the US since 1992 and in China since 1999 and have assisted governments in nearly every US state and many nations throughout the world RAP is now expanding operations with new programs and offices in Europe and plans to offer similar services in India in 2011 RAP functions as the hub of a network that includes many international experts and is primarily funded by foundations and federal grants
Home office
50 State Street Suite 3Montpelier Vermont 05602
802-223-8199wwwraponlineorg

RegulatoRy assistance PRoject
28
Conclusions and Recommendations
Auction-based capacity markets in the US have been successful to date in attracting the capacity needed to maintain system reliability in an economically efficient manner In particular these markets have been successful in facilitating new demand-side resources
with ratepayers and society reaping the economic and environmental benefits However policymakers also should consider capacity markets in the context of carbon reduction policies and targets for the power sector Even markets that successfully integrate demand-side and renewable resources into the auction process are still encouraging the construction or continued operation of high-emitting supply-side resources to meet reliability targets
Existing capacity markets should be evaluated to assess whether the market is responding in this way And if it is policymakers need to critically assess whether a continuation of that market response over the coming years will make it possible to achieve the cumulative level of carbon reductions required from the power sector to avoid the worst effects of climate change Depending on the results of this inquiry policymakers may need to refine the auction rules and adopt additional policies for the power sector mdash such as those described in this paper mdash to ensure the alignment of capacity markets with both short- and long-term carbon reduction goals
More generally forward capacity markets create a revenue stream for resources that can commit to being available at times of system peak several years in the future mdash but this financial incentive is clearly not the only factor driving the mix of resources in the power sector and their resulting carbon footprint Market rules policies and regulations that affect investment and operating decisions for meeting the systemrsquos energy requirements mdash as well as those that affect access location and cost recovery for transmission and distribution facilities mdash have an enormous impact on both the short- and long-term resource mix in the electric system Policymakers will need to consider how this entire market and regulatory landscape mdash including forward capacity markets mdash can be strengthened and harmonized to reliably meet customer demand for electricity in a carbon-constrained world
29
the Role of foRwaRd caPacity MaRkets in incReasing deMand-side and otheR low-caRbon ResouRces
Cleared capacity values in the following tables represent all capacity committed by existing resources remaining in the market and all new resources that bid into the auction at or below
the market clearing price Cleared capacity includes ldquoself-suppliedrdquo or ldquoself-scheduledrdquo resources entered into the auction by LSEs However as described in this paper when the monthly billingsettlement process is completed the capacity charges allocated to the LSE will be offset (credited) for the cleared capacity delivered by these resources
Incremental capacity in the tables below reflects 1) new generation resources 2) capacity upgrades to existing generation resources 3) partial offsets to
incremental generation capacity due to capacity de-ratings to existing generation resources 4) new demand response resources 5) upgrades to existing demand response resources and 6) new energy efficiency resources
PJM Results79
PJM has conducted five Base Residual Auctions since its inception in 2007 for delivery years beginning in 20082009 (that each run from June 1 to May 31) Capacity cleared in the PJM auction is defined in terms of ldquounforcedrdquo capacity that is the capacity of a resource adjusted for availability and deliverability based on historical performance (eg forced outages)
Appendix 1
Detailed Results for PJM and ISO-NE Capacity Markets
Table 1 Generation Demand Resources and Energy Efficiency Resources
Offered and Cleared in PJM Base Residual Auctions (Unforced Capacity in MW)
Delivery Year 20082009 20092010 20102011 20112012 20122013
Generation Offered 1311648 1326142 1321248 1360679 1348730
DR Offered 7158 9368 9679 16524 98476
EE Offered - - - - 6527
Total Offered 1318806 1335510 1330927 1377203 1453733
Generation Cleared 1290614 1313389 1312515 1308566 1285274
DR Cleared 5362 8929 9390 13649 70473
EE Cleared 00 00 00 00 5689
Total Cleared 1295976 1322318 1321905 1322215 1361436
Energy efficiency resources were first eligible in the 20122013 auction
79 All information for PJM compiled from ldquo20122013 RPM Base Residual Auction Resultsrdquo at httpwwwpjmcom~mediamarkets-opsrpmrpm-auction-info2012-13-base-residual-auction-report-document-pdfashx
RegulatoRy assistance PRoject
30
Table 2 Incremental Capacity Additions and Reductions in PJM Base Residual Auctions(Installed Capacity in MW)
Delivery Year 20072008 20082009 20092010 20102011 20112012 20122013 Total
Increase inGenerationCapacity 6020 7242 12723 17762 35763 18935 98445
Decrease inGenerationCapacity -6746 -3754 -5502 -3018 -2647 -32539 -54206
Net Increase inDemand ResourceCapacity 5550 5747 2150 287 6617 79381 99732
Net Increasein EnergyEfficiency Capacity 0 0 0 0 0 6323 6323
Net Increasein InstalledCapacity 4824 9235 9371 15031 39733 72100 150294
Note Change in generation capacity is cumulative net increase in demand-side resources is relative to previous yearrsquos Base Residual Auction
Table 3 Breakdown of Incremental Capacity Resource Additionsin PJM Base Residual Auctions (Installed Capacity in MW)
Delivery Year CTGT Combined Diesel Hydro Steam Nuclear Solar Wind Total Cycle (Coal)
New 20072008 187 03 190Capacity 20082009 270 661 931Units 20092010 3995 238 530 4763 20102011 2833 5800 230 1414 10277 20112012 4164 11350 7048 11 752 23325 20122013 4038 5850 78 363 751 11080
Capacity 20072008 470 470From 20082009 1310 1310Reactivated 20092010 0Units 20102011 1600 107 1707 20112012 800 1010 1810 20122013 0
Uprates to 20072008 1145 139 800 2356 920 5360Existing 20082009 1082 340 180 1055 1960 384 5001Capacity 20092010 1522 2060 1625 614 1974 165 7960Resources 20102011 1173 1630 480 892 1603 5778 20112012 3692 1486 574 1868 2921 87 10628 20122013 2312 1643 142 1930 1260 568 7855
Total 28356 30159 2145 3963 20351 9062 11 4398 98445
Note Values represent capacity commitments Nameplate ratings of variable resources (solar and wind) are far larger than shown here
31
the Role of foRwaRd caPacity MaRkets in incReasing deMand-side and otheR low-caRbon ResouRces
Table 4 Changes to Generation Retirement Decisions
Since Reliability Pricing Model Approval (Unforced Capacity in MW)
Generation Resource Decision Changes Capacity Cleared
Withdrawn Deactivation Requests 17987
Postponed or Cancelled Retirement 13029
Reactivation 1752
ToTal 3276 8
Note Unforced capacity cleared in Base Residual Auctions from resources that withdrew their request to deactivate postponed retirement or were reactivated (ie came out of retirement or mothball state)
Table 5 PJM Base Residual Auction Clearing Price
Delivery Year Clearing Prices ($MW-day)
20072008 $4080
20082009 $11192
20092010 $10204
20102011 $17429
20112012 $11000
20122013 $1646
Note Values do not include any locational price adders Simple conversion of $MW-day to $kW-month multiply by 3 and divide by 100
Table 6 Effect of Demand-Side Resources on PJM Market Clearing Price
20122013 Base Residual Auction80
Actual Auction Results Calculated Results Without Demand-Side Resources
Clearing Prices Cleared Unforced Clearing Prices Cleared Unforced Savings
($MW-day) Capacity (MW) ($MW-day) Capacity (MW) ($MW-day)
$1646 1361435 $17878 1335682 $16232
80 Bowring Monitoring Analytics Table 20
RegulatoRy assistance PRoject
32
ISO-NE ResultsISO-NE has held three forward capacity auctions to
date The first auction (FCA 1) in February 2008 was for capacity delivery beginning in June 2010 (20102011 delivery year) The second auction (FCA 2) was held in December 2008 for delivery in 20112012 and the third
Table 7 Summary Results for ISO-NE Capacity Auctions81
Net Installed Total Resources Excess Clearing Net Price Capacity Cleared Capacity Price ($kW-month)82
Requirement (MW) (MW) ($kW-month)
FCA 1 32305 34077 1772 $450 $425
FCA 2 32528 37283 4755 $360 $312
FCA 3 31965 36996 4649 $295 $254
Table 8 Demand-Side Resources Cleared in ISO-NE Capacity Auctions (MW)81
Distributed Distributed Energy Real-Time Demand Real-Time Total Generation- Generation- Efficiency ResponseLoad Emergency Demand-Side Fossil Fuels Renewable Resources Management Generation Resources
FCA 1 46 lt02 655 978 875 2554
FCA 2 93 lt02 890 1195 759 2937
FCA 3 86 07 975 1206 630 2898
auction (FCA 3) was held in October 2009 for delivery in 20122013 ldquoClearedrdquo amounts in these tables include resources from earlier auctions that remain listed as well as new resources less resources that drop out
Note Net Installed Capacity Requirement values exclude the interconnection benefits associated with the Hydro-Queacutebec Phase III interface Excess capacity is not adjusted for Real-Time Emergency Generation in excess of the 600 MW limit Net prices reflect prorating of clearing prices due to excess capacity clearing the auction Simple conversion of $kW-month to $MW-day divide by 3 and multiply by 100
Note Demand-side values are grossed-up for avoided transmission and distribution losses and reserve margin (no reserve margin forFCA 3) Total resources cleared include excess capacity above the Net Installed Capacity Requirement Real-time emergency generation refers to distributed generation whose state air quality permit limits operation to ldquoemergencyrdquo conditions See Appendix 3
81 ISO-NE Forward Capacity Market Results at httpwwwiso-necommarketsothrmkts_datafcmcal_resultsindexhtml
82 Communication with Henry Yoshimura director Demand Resource Strategy ISO-NE March 2009
83 Eric Winkler ISO-New England ldquoThird Regional Energy Efficiency Initiative Meetingrdquo July 7 2009 and ldquoFCA Updaterdquo Demand Response Working Group Meeting Dec 2 2009 Total resources cleared (Capacity Supply Obligation) from Forward Capacity Market Auction Results for the 20102011 20112012 and 20122013 auctions at httpwwwiso-necommarketsothrmkts_datafcmcal_resultsindexhtml
33
the Role of foRwaRd caPacity MaRkets in incReasing deMand-side and otheR low-caRbon ResouRces
Step 1
System Operator (SO) Plans ldquoForwardrdquo for the Region
2012 Projection of Peak Demand = 10000 MW (incl reserves) Each ldquoLoad Serving Entityrdquo (LSE) is obligated for its 50 share
Appendix 2
Illustration of ldquoHow Forward Capacity Markets Workrdquo
SO purchases capacity in 2012 at the 2009 auction clearing price
LSE can be regulated utility or competitive retail supplier
LSE1 5000 MW
LSE2 5000 MW
R1
R1 =3500 MW capacity ldquoSelf Supplyrdquo Resources (LSE1 ownedunder contract)
RegulatoRy assistance PRoject
34
Step 2
The Regional Capacity Auction (3 Years ldquoForwardrdquo)
Step 3
System Operator Pays Cleared Resources at P and Bills LSEs(Note Self-Supply capacity is a ldquowashrdquo)
R1 R2 R3 R4 R5 R6 R7
P
R1
R3
R3
R5
R5
R2
R2
R4
R4
R6
R7
Bid Price = $ per MW-day
Quantity = MW
6500 MW P
Cleared Capacity = 10000
Supply = Capacity Committed ldquoForwardrdquo
P= Clearing price paid to all capacity clearing auction
Demand = SO Forecast of Capacity Requirements
R1-R7 = Capacity offered by Supply-Side (New built Existing Uprates) and Demand-Side (Energy Efficiency Demand Response Distrib Gen) Self-supply (R1) bids in a ldquozerordquo price New Resources set clearing price
LSE1 5000 MW
LSE2 5000 MW
R1
SOSO pays R1 3500 MW P
LSE2 pays its share of regional demand
5000 MW P
LSE1 pays its share of regional demand (5000 MW) adjusted for self-supply R1 for a net payment of 1500MW P
R1 = 3500 MW of ldquoSelf-Supplyrdquo Resources (LSE1 ownedunder contract)
In 2010Total regional peak demand of 10000 MW supplied by R1 + R2 + R3 + R4 + R5 LSE1 and LSE2 are each responsible for 50 of regional peak demand
35
the Role of foRwaRd caPacity MaRkets in incReasing deMand-side and otheR low-caRbon ResouRces
PJM Eligibility Requirements
Eligibility of demand-side resources has changed significantly over the years in PJMrsquos capacity markets In particular it was not until the most recent capacity auction (May 2009) for the
20122013 delivery year that energy efficiency became eligible to bid in PJMrsquos Base Residual Auction PJM is currently considering a tariff change to also allow energy efficiency to bid into incremental auctions
Under PJMrsquos eligibility rules an energy efficiency resource must achieve a ldquopermanentrdquo continuous reduction in electric energy consumption Examples of such a resource include lighting retrofit programs for residential commercial and industrial customers and programs to retrofit buildings with heating and cooling systems that exceed current efficiency standards To be eligible an energy efficiency resource must meet the following criteria
bull It is fully implemented throughout the delivery year without any requirement of notice dispatch or additional customer action
bull It is not reflected as a reduction in the peak load forecast used for the Base Residual Auction for the proposed delivery year
bull It exceeds relevant standards (such as building codes or appliance standards) at the time of commitment
bull It achieves the specified load reduction (expected average demand in MW) during defined summer on-peak hours84
Demand response on the other hand must be dispatchable mdash that is customer demand must be reduced when instructed For example a large supermarket with
coolers and freezers could install load management equipment that would cycle them on or off mdash and bid that demand response capability into the market85 More specifically a demand response resource must meet the following criteria
bull It is able to reduce demand for electricity up to 10 times each year for up to six consecutive hours per interruption during defined periods86
bull It is fully implemented within one hour (short lead time) or two hours (long lead time) of notice from PJM
bull In a year without calls for demand reductions it must demonstrate reliability through a test of reduction capability
bull It is registered in the Emergency Load Response Program and thus available for dispatch during PJM-declared emergency events
bull Compliance and status reports are filed as required
Multiple end-use customers can be aggregated in order to submit a single demand response offer in the capacity auction if those customers share the same curtailment service provider electric distribution company and transmission zone
In addition customer-sited distributed generation may be offered into auctions as a demand resource A hospital for example could offer to run its back-up generator on certain peak demand (eg hot summer) days to reduce its load on the system Or an industrial plant could cut back on production on such days and continue to run its on-site combustion or steam-cycle turbine
Currently energy efficiency resources may participate
Appendix 3
Eligibility Requirements for Demand-Side Resourcesin US Capacity Markets
84 Weekdays excluding holidays June through August between the hours ending 1500 and 1800 Eastern Prevailing Time (EPT)
85 If instead the supermarket replaced the existing coolers and freezers with more energy efficient ones it would bid that proposal in as an energy efficiency resource Or it could do both (replace and cycle) and bid in the capacity from the permanent savings (replacements) as energy efficiency and the dispatchable capacity (the cycling) as demand response
86 Weekdays excluding holidays from 1200 to 2000 EPT May through September and 1400 to 2200 EPT October through April
RegulatoRy assistance PRoject
36
in Base Residual Auctions for up to four consecutive delivery years In effect this means that PJM limits capacity payments for efficiency measures to four years of their measure life (rather than for the full measure life)87 In contrast a demand response resource (including distributed generation) can participate in the PJM capacity market for as long as its ability to reduce demand continues
ISO-NE Eligibility RequirementsSince the inception of ISO-NErsquos forward capacity market
in 2006 energy efficiency has qualified as an eligible demand-side resource ISO-NE defines demand resources as installed measures (products equipment systems services practices and strategies) that result in verifiable reductions in end-use consumption of electricity in the New England power system These are further categorized into ldquopassiverdquo (energy efficiency and non-dispatchable distributed generation) and ldquoactiverdquo (demand response emergency generation and dispatchable distributed generation) resources Passive demand resources are non-dispatchable but permanently reduce energy demand during peak hours Active demand resources are designed to reduce peak loads and to reduce load based on real-time system conditions or ISO-NE instructions Following are descriptions of eligible demand-side resources and performance requirements88
Passive Demand Resourcesbull On-Peak Demand Resources are measures that are
not weather-sensitive and reduce demand across a fixed set of on-peak hours such as energy-efficient commercial lighting and motors89
bull Seasonal Peak Demand Resources are weather-sensitive measures that reduce load during high-demand conditions such as energy-efficient heating and air conditioning systems Seasonal Peak Demand Resources must reduce load when actual system load is equal to 90 percent of the most recent peak load forecast for the applicable summer or winter season
Active Demand Resourcesbull Real-Time Demand Response Resources are
measures including load management and distributed generation that can be dispatched by ISO-NE as needed They must curtail electrical usage within 30 minutes of receiving a dispatch instruction and until receiving a releaserecall dispatch instruction
bull Real-Time Emergency Generation is distributed generation whose state air quality permit limits operation to ldquoemergencyrdquo conditions Generators must curtail the customerrsquos electrical usage within 30 minutes of receiving a dispatch instruction and until receiving a releaserecall dispatch instruction The amount of emergency generation that can be used to meet ISO-NErsquos capacity requirement is limited to 600 MW If the amount of real-time emergency generation that clears the auction exceeds this level payments to generators are reduced on a pro-rated basis All real-time emergency generation is treated as existing capacity
In contrast to PJM all demand-side resources in ISO-NE are eligible to bid capacity for their full measure life an approach that recognizes the full contribution of these resources to regional resource adequacy requirements and adds value to long-lived energy efficiency assets
87 FERC has directed PJM to evaluate the impact of its capacity payment period for energy efficiency resources
88 Eric Winkler and Abimael Santana ISO-NE ldquoNew Demand Resource Qualificationrdquo May 5 2009 at httpwwwiso-necomsupporttrainingcoursesfcmfcm_forum_may_5pdf
89 Summer on-peak hours are 1300 to 1700 non-holiday weekdays in June July and August Winter on-peak hours are 1700 to 1900 non-holiday weekdays in December and January
The Regulatory Assistance Project (RAP) is a global non-profit team of experts that focuses on the long-term economic and environmental sustainability of the power and natural gas sectors providing technical and policy assistance to government officials on a broad range of energy and environmental issues RAP has deep expertise in regulatory and market policies that promote economic efficiency protect the environment ensure system reliability and fairly allocate system benefits among all consumers We have worked extensively in the US since 1992 and in China since 1999 and have assisted governments in nearly every US state and many nations throughout the world RAP is now expanding operations with new programs and offices in Europe and plans to offer similar services in India in 2011 RAP functions as the hub of a network that includes many international experts and is primarily funded by foundations and federal grants
Home office
50 State Street Suite 3Montpelier Vermont 05602
802-223-8199wwwraponlineorg

RegulatoRy assistance PRoject
30
Table 2 Incremental Capacity Additions and Reductions in PJM Base Residual Auctions(Installed Capacity in MW)
Delivery Year 20072008 20082009 20092010 20102011 20112012 20122013 Total
Increase inGenerationCapacity 6020 7242 12723 17762 35763 18935 98445
Decrease inGenerationCapacity -6746 -3754 -5502 -3018 -2647 -32539 -54206
Net Increase inDemand ResourceCapacity 5550 5747 2150 287 6617 79381 99732
Net Increasein EnergyEfficiency Capacity 0 0 0 0 0 6323 6323
Net Increasein InstalledCapacity 4824 9235 9371 15031 39733 72100 150294
Note Change in generation capacity is cumulative net increase in demand-side resources is relative to previous yearrsquos Base Residual Auction
Table 3 Breakdown of Incremental Capacity Resource Additionsin PJM Base Residual Auctions (Installed Capacity in MW)
Delivery Year CTGT Combined Diesel Hydro Steam Nuclear Solar Wind Total Cycle (Coal)
New 20072008 187 03 190Capacity 20082009 270 661 931Units 20092010 3995 238 530 4763 20102011 2833 5800 230 1414 10277 20112012 4164 11350 7048 11 752 23325 20122013 4038 5850 78 363 751 11080
Capacity 20072008 470 470From 20082009 1310 1310Reactivated 20092010 0Units 20102011 1600 107 1707 20112012 800 1010 1810 20122013 0
Uprates to 20072008 1145 139 800 2356 920 5360Existing 20082009 1082 340 180 1055 1960 384 5001Capacity 20092010 1522 2060 1625 614 1974 165 7960Resources 20102011 1173 1630 480 892 1603 5778 20112012 3692 1486 574 1868 2921 87 10628 20122013 2312 1643 142 1930 1260 568 7855
Total 28356 30159 2145 3963 20351 9062 11 4398 98445
Note Values represent capacity commitments Nameplate ratings of variable resources (solar and wind) are far larger than shown here
31
the Role of foRwaRd caPacity MaRkets in incReasing deMand-side and otheR low-caRbon ResouRces
Table 4 Changes to Generation Retirement Decisions
Since Reliability Pricing Model Approval (Unforced Capacity in MW)
Generation Resource Decision Changes Capacity Cleared
Withdrawn Deactivation Requests 17987
Postponed or Cancelled Retirement 13029
Reactivation 1752
ToTal 3276 8
Note Unforced capacity cleared in Base Residual Auctions from resources that withdrew their request to deactivate postponed retirement or were reactivated (ie came out of retirement or mothball state)
Table 5 PJM Base Residual Auction Clearing Price
Delivery Year Clearing Prices ($MW-day)
20072008 $4080
20082009 $11192
20092010 $10204
20102011 $17429
20112012 $11000
20122013 $1646
Note Values do not include any locational price adders Simple conversion of $MW-day to $kW-month multiply by 3 and divide by 100
Table 6 Effect of Demand-Side Resources on PJM Market Clearing Price
20122013 Base Residual Auction80
Actual Auction Results Calculated Results Without Demand-Side Resources
Clearing Prices Cleared Unforced Clearing Prices Cleared Unforced Savings
($MW-day) Capacity (MW) ($MW-day) Capacity (MW) ($MW-day)
$1646 1361435 $17878 1335682 $16232
80 Bowring Monitoring Analytics Table 20
RegulatoRy assistance PRoject
32
ISO-NE ResultsISO-NE has held three forward capacity auctions to
date The first auction (FCA 1) in February 2008 was for capacity delivery beginning in June 2010 (20102011 delivery year) The second auction (FCA 2) was held in December 2008 for delivery in 20112012 and the third
Table 7 Summary Results for ISO-NE Capacity Auctions81
Net Installed Total Resources Excess Clearing Net Price Capacity Cleared Capacity Price ($kW-month)82
Requirement (MW) (MW) ($kW-month)
FCA 1 32305 34077 1772 $450 $425
FCA 2 32528 37283 4755 $360 $312
FCA 3 31965 36996 4649 $295 $254
Table 8 Demand-Side Resources Cleared in ISO-NE Capacity Auctions (MW)81
Distributed Distributed Energy Real-Time Demand Real-Time Total Generation- Generation- Efficiency ResponseLoad Emergency Demand-Side Fossil Fuels Renewable Resources Management Generation Resources
FCA 1 46 lt02 655 978 875 2554
FCA 2 93 lt02 890 1195 759 2937
FCA 3 86 07 975 1206 630 2898
auction (FCA 3) was held in October 2009 for delivery in 20122013 ldquoClearedrdquo amounts in these tables include resources from earlier auctions that remain listed as well as new resources less resources that drop out
Note Net Installed Capacity Requirement values exclude the interconnection benefits associated with the Hydro-Queacutebec Phase III interface Excess capacity is not adjusted for Real-Time Emergency Generation in excess of the 600 MW limit Net prices reflect prorating of clearing prices due to excess capacity clearing the auction Simple conversion of $kW-month to $MW-day divide by 3 and multiply by 100
Note Demand-side values are grossed-up for avoided transmission and distribution losses and reserve margin (no reserve margin forFCA 3) Total resources cleared include excess capacity above the Net Installed Capacity Requirement Real-time emergency generation refers to distributed generation whose state air quality permit limits operation to ldquoemergencyrdquo conditions See Appendix 3
81 ISO-NE Forward Capacity Market Results at httpwwwiso-necommarketsothrmkts_datafcmcal_resultsindexhtml
82 Communication with Henry Yoshimura director Demand Resource Strategy ISO-NE March 2009
83 Eric Winkler ISO-New England ldquoThird Regional Energy Efficiency Initiative Meetingrdquo July 7 2009 and ldquoFCA Updaterdquo Demand Response Working Group Meeting Dec 2 2009 Total resources cleared (Capacity Supply Obligation) from Forward Capacity Market Auction Results for the 20102011 20112012 and 20122013 auctions at httpwwwiso-necommarketsothrmkts_datafcmcal_resultsindexhtml
33
the Role of foRwaRd caPacity MaRkets in incReasing deMand-side and otheR low-caRbon ResouRces
Step 1
System Operator (SO) Plans ldquoForwardrdquo for the Region
2012 Projection of Peak Demand = 10000 MW (incl reserves) Each ldquoLoad Serving Entityrdquo (LSE) is obligated for its 50 share
Appendix 2
Illustration of ldquoHow Forward Capacity Markets Workrdquo
SO purchases capacity in 2012 at the 2009 auction clearing price
LSE can be regulated utility or competitive retail supplier
LSE1 5000 MW
LSE2 5000 MW
R1
R1 =3500 MW capacity ldquoSelf Supplyrdquo Resources (LSE1 ownedunder contract)
RegulatoRy assistance PRoject
34
Step 2
The Regional Capacity Auction (3 Years ldquoForwardrdquo)
Step 3
System Operator Pays Cleared Resources at P and Bills LSEs(Note Self-Supply capacity is a ldquowashrdquo)
R1 R2 R3 R4 R5 R6 R7
P
R1
R3
R3
R5
R5
R2
R2
R4
R4
R6
R7
Bid Price = $ per MW-day
Quantity = MW
6500 MW P
Cleared Capacity = 10000
Supply = Capacity Committed ldquoForwardrdquo
P= Clearing price paid to all capacity clearing auction
Demand = SO Forecast of Capacity Requirements
R1-R7 = Capacity offered by Supply-Side (New built Existing Uprates) and Demand-Side (Energy Efficiency Demand Response Distrib Gen) Self-supply (R1) bids in a ldquozerordquo price New Resources set clearing price
LSE1 5000 MW
LSE2 5000 MW
R1
SOSO pays R1 3500 MW P
LSE2 pays its share of regional demand
5000 MW P
LSE1 pays its share of regional demand (5000 MW) adjusted for self-supply R1 for a net payment of 1500MW P
R1 = 3500 MW of ldquoSelf-Supplyrdquo Resources (LSE1 ownedunder contract)
In 2010Total regional peak demand of 10000 MW supplied by R1 + R2 + R3 + R4 + R5 LSE1 and LSE2 are each responsible for 50 of regional peak demand
35
the Role of foRwaRd caPacity MaRkets in incReasing deMand-side and otheR low-caRbon ResouRces
PJM Eligibility Requirements
Eligibility of demand-side resources has changed significantly over the years in PJMrsquos capacity markets In particular it was not until the most recent capacity auction (May 2009) for the
20122013 delivery year that energy efficiency became eligible to bid in PJMrsquos Base Residual Auction PJM is currently considering a tariff change to also allow energy efficiency to bid into incremental auctions
Under PJMrsquos eligibility rules an energy efficiency resource must achieve a ldquopermanentrdquo continuous reduction in electric energy consumption Examples of such a resource include lighting retrofit programs for residential commercial and industrial customers and programs to retrofit buildings with heating and cooling systems that exceed current efficiency standards To be eligible an energy efficiency resource must meet the following criteria
bull It is fully implemented throughout the delivery year without any requirement of notice dispatch or additional customer action
bull It is not reflected as a reduction in the peak load forecast used for the Base Residual Auction for the proposed delivery year
bull It exceeds relevant standards (such as building codes or appliance standards) at the time of commitment
bull It achieves the specified load reduction (expected average demand in MW) during defined summer on-peak hours84
Demand response on the other hand must be dispatchable mdash that is customer demand must be reduced when instructed For example a large supermarket with
coolers and freezers could install load management equipment that would cycle them on or off mdash and bid that demand response capability into the market85 More specifically a demand response resource must meet the following criteria
bull It is able to reduce demand for electricity up to 10 times each year for up to six consecutive hours per interruption during defined periods86
bull It is fully implemented within one hour (short lead time) or two hours (long lead time) of notice from PJM
bull In a year without calls for demand reductions it must demonstrate reliability through a test of reduction capability
bull It is registered in the Emergency Load Response Program and thus available for dispatch during PJM-declared emergency events
bull Compliance and status reports are filed as required
Multiple end-use customers can be aggregated in order to submit a single demand response offer in the capacity auction if those customers share the same curtailment service provider electric distribution company and transmission zone
In addition customer-sited distributed generation may be offered into auctions as a demand resource A hospital for example could offer to run its back-up generator on certain peak demand (eg hot summer) days to reduce its load on the system Or an industrial plant could cut back on production on such days and continue to run its on-site combustion or steam-cycle turbine
Currently energy efficiency resources may participate
Appendix 3
Eligibility Requirements for Demand-Side Resourcesin US Capacity Markets
84 Weekdays excluding holidays June through August between the hours ending 1500 and 1800 Eastern Prevailing Time (EPT)
85 If instead the supermarket replaced the existing coolers and freezers with more energy efficient ones it would bid that proposal in as an energy efficiency resource Or it could do both (replace and cycle) and bid in the capacity from the permanent savings (replacements) as energy efficiency and the dispatchable capacity (the cycling) as demand response
86 Weekdays excluding holidays from 1200 to 2000 EPT May through September and 1400 to 2200 EPT October through April
RegulatoRy assistance PRoject
36
in Base Residual Auctions for up to four consecutive delivery years In effect this means that PJM limits capacity payments for efficiency measures to four years of their measure life (rather than for the full measure life)87 In contrast a demand response resource (including distributed generation) can participate in the PJM capacity market for as long as its ability to reduce demand continues
ISO-NE Eligibility RequirementsSince the inception of ISO-NErsquos forward capacity market
in 2006 energy efficiency has qualified as an eligible demand-side resource ISO-NE defines demand resources as installed measures (products equipment systems services practices and strategies) that result in verifiable reductions in end-use consumption of electricity in the New England power system These are further categorized into ldquopassiverdquo (energy efficiency and non-dispatchable distributed generation) and ldquoactiverdquo (demand response emergency generation and dispatchable distributed generation) resources Passive demand resources are non-dispatchable but permanently reduce energy demand during peak hours Active demand resources are designed to reduce peak loads and to reduce load based on real-time system conditions or ISO-NE instructions Following are descriptions of eligible demand-side resources and performance requirements88
Passive Demand Resourcesbull On-Peak Demand Resources are measures that are
not weather-sensitive and reduce demand across a fixed set of on-peak hours such as energy-efficient commercial lighting and motors89
bull Seasonal Peak Demand Resources are weather-sensitive measures that reduce load during high-demand conditions such as energy-efficient heating and air conditioning systems Seasonal Peak Demand Resources must reduce load when actual system load is equal to 90 percent of the most recent peak load forecast for the applicable summer or winter season
Active Demand Resourcesbull Real-Time Demand Response Resources are
measures including load management and distributed generation that can be dispatched by ISO-NE as needed They must curtail electrical usage within 30 minutes of receiving a dispatch instruction and until receiving a releaserecall dispatch instruction
bull Real-Time Emergency Generation is distributed generation whose state air quality permit limits operation to ldquoemergencyrdquo conditions Generators must curtail the customerrsquos electrical usage within 30 minutes of receiving a dispatch instruction and until receiving a releaserecall dispatch instruction The amount of emergency generation that can be used to meet ISO-NErsquos capacity requirement is limited to 600 MW If the amount of real-time emergency generation that clears the auction exceeds this level payments to generators are reduced on a pro-rated basis All real-time emergency generation is treated as existing capacity
In contrast to PJM all demand-side resources in ISO-NE are eligible to bid capacity for their full measure life an approach that recognizes the full contribution of these resources to regional resource adequacy requirements and adds value to long-lived energy efficiency assets
87 FERC has directed PJM to evaluate the impact of its capacity payment period for energy efficiency resources
88 Eric Winkler and Abimael Santana ISO-NE ldquoNew Demand Resource Qualificationrdquo May 5 2009 at httpwwwiso-necomsupporttrainingcoursesfcmfcm_forum_may_5pdf
89 Summer on-peak hours are 1300 to 1700 non-holiday weekdays in June July and August Winter on-peak hours are 1700 to 1900 non-holiday weekdays in December and January
The Regulatory Assistance Project (RAP) is a global non-profit team of experts that focuses on the long-term economic and environmental sustainability of the power and natural gas sectors providing technical and policy assistance to government officials on a broad range of energy and environmental issues RAP has deep expertise in regulatory and market policies that promote economic efficiency protect the environment ensure system reliability and fairly allocate system benefits among all consumers We have worked extensively in the US since 1992 and in China since 1999 and have assisted governments in nearly every US state and many nations throughout the world RAP is now expanding operations with new programs and offices in Europe and plans to offer similar services in India in 2011 RAP functions as the hub of a network that includes many international experts and is primarily funded by foundations and federal grants
Home office
50 State Street Suite 3Montpelier Vermont 05602
802-223-8199wwwraponlineorg

RegulatoRy assistance PRoject
32
ISO-NE ResultsISO-NE has held three forward capacity auctions to
date The first auction (FCA 1) in February 2008 was for capacity delivery beginning in June 2010 (20102011 delivery year) The second auction (FCA 2) was held in December 2008 for delivery in 20112012 and the third
Table 7 Summary Results for ISO-NE Capacity Auctions81
Net Installed Total Resources Excess Clearing Net Price Capacity Cleared Capacity Price ($kW-month)82
Requirement (MW) (MW) ($kW-month)
FCA 1 32305 34077 1772 $450 $425
FCA 2 32528 37283 4755 $360 $312
FCA 3 31965 36996 4649 $295 $254
Table 8 Demand-Side Resources Cleared in ISO-NE Capacity Auctions (MW)81
Distributed Distributed Energy Real-Time Demand Real-Time Total Generation- Generation- Efficiency ResponseLoad Emergency Demand-Side Fossil Fuels Renewable Resources Management Generation Resources
FCA 1 46 lt02 655 978 875 2554
FCA 2 93 lt02 890 1195 759 2937
FCA 3 86 07 975 1206 630 2898
auction (FCA 3) was held in October 2009 for delivery in 20122013 ldquoClearedrdquo amounts in these tables include resources from earlier auctions that remain listed as well as new resources less resources that drop out
Note Net Installed Capacity Requirement values exclude the interconnection benefits associated with the Hydro-Queacutebec Phase III interface Excess capacity is not adjusted for Real-Time Emergency Generation in excess of the 600 MW limit Net prices reflect prorating of clearing prices due to excess capacity clearing the auction Simple conversion of $kW-month to $MW-day divide by 3 and multiply by 100
Note Demand-side values are grossed-up for avoided transmission and distribution losses and reserve margin (no reserve margin forFCA 3) Total resources cleared include excess capacity above the Net Installed Capacity Requirement Real-time emergency generation refers to distributed generation whose state air quality permit limits operation to ldquoemergencyrdquo conditions See Appendix 3
81 ISO-NE Forward Capacity Market Results at httpwwwiso-necommarketsothrmkts_datafcmcal_resultsindexhtml
82 Communication with Henry Yoshimura director Demand Resource Strategy ISO-NE March 2009
83 Eric Winkler ISO-New England ldquoThird Regional Energy Efficiency Initiative Meetingrdquo July 7 2009 and ldquoFCA Updaterdquo Demand Response Working Group Meeting Dec 2 2009 Total resources cleared (Capacity Supply Obligation) from Forward Capacity Market Auction Results for the 20102011 20112012 and 20122013 auctions at httpwwwiso-necommarketsothrmkts_datafcmcal_resultsindexhtml
33
the Role of foRwaRd caPacity MaRkets in incReasing deMand-side and otheR low-caRbon ResouRces
Step 1
System Operator (SO) Plans ldquoForwardrdquo for the Region
2012 Projection of Peak Demand = 10000 MW (incl reserves) Each ldquoLoad Serving Entityrdquo (LSE) is obligated for its 50 share
Appendix 2
Illustration of ldquoHow Forward Capacity Markets Workrdquo
SO purchases capacity in 2012 at the 2009 auction clearing price
LSE can be regulated utility or competitive retail supplier
LSE1 5000 MW
LSE2 5000 MW
R1
R1 =3500 MW capacity ldquoSelf Supplyrdquo Resources (LSE1 ownedunder contract)
RegulatoRy assistance PRoject
34
Step 2
The Regional Capacity Auction (3 Years ldquoForwardrdquo)
Step 3
System Operator Pays Cleared Resources at P and Bills LSEs(Note Self-Supply capacity is a ldquowashrdquo)
R1 R2 R3 R4 R5 R6 R7
P
R1
R3
R3
R5
R5
R2
R2
R4
R4
R6
R7
Bid Price = $ per MW-day
Quantity = MW
6500 MW P
Cleared Capacity = 10000
Supply = Capacity Committed ldquoForwardrdquo
P= Clearing price paid to all capacity clearing auction
Demand = SO Forecast of Capacity Requirements
R1-R7 = Capacity offered by Supply-Side (New built Existing Uprates) and Demand-Side (Energy Efficiency Demand Response Distrib Gen) Self-supply (R1) bids in a ldquozerordquo price New Resources set clearing price
LSE1 5000 MW
LSE2 5000 MW
R1
SOSO pays R1 3500 MW P
LSE2 pays its share of regional demand
5000 MW P
LSE1 pays its share of regional demand (5000 MW) adjusted for self-supply R1 for a net payment of 1500MW P
R1 = 3500 MW of ldquoSelf-Supplyrdquo Resources (LSE1 ownedunder contract)
In 2010Total regional peak demand of 10000 MW supplied by R1 + R2 + R3 + R4 + R5 LSE1 and LSE2 are each responsible for 50 of regional peak demand
35
the Role of foRwaRd caPacity MaRkets in incReasing deMand-side and otheR low-caRbon ResouRces
PJM Eligibility Requirements
Eligibility of demand-side resources has changed significantly over the years in PJMrsquos capacity markets In particular it was not until the most recent capacity auction (May 2009) for the
20122013 delivery year that energy efficiency became eligible to bid in PJMrsquos Base Residual Auction PJM is currently considering a tariff change to also allow energy efficiency to bid into incremental auctions
Under PJMrsquos eligibility rules an energy efficiency resource must achieve a ldquopermanentrdquo continuous reduction in electric energy consumption Examples of such a resource include lighting retrofit programs for residential commercial and industrial customers and programs to retrofit buildings with heating and cooling systems that exceed current efficiency standards To be eligible an energy efficiency resource must meet the following criteria
bull It is fully implemented throughout the delivery year without any requirement of notice dispatch or additional customer action
bull It is not reflected as a reduction in the peak load forecast used for the Base Residual Auction for the proposed delivery year
bull It exceeds relevant standards (such as building codes or appliance standards) at the time of commitment
bull It achieves the specified load reduction (expected average demand in MW) during defined summer on-peak hours84
Demand response on the other hand must be dispatchable mdash that is customer demand must be reduced when instructed For example a large supermarket with
coolers and freezers could install load management equipment that would cycle them on or off mdash and bid that demand response capability into the market85 More specifically a demand response resource must meet the following criteria
bull It is able to reduce demand for electricity up to 10 times each year for up to six consecutive hours per interruption during defined periods86
bull It is fully implemented within one hour (short lead time) or two hours (long lead time) of notice from PJM
bull In a year without calls for demand reductions it must demonstrate reliability through a test of reduction capability
bull It is registered in the Emergency Load Response Program and thus available for dispatch during PJM-declared emergency events
bull Compliance and status reports are filed as required
Multiple end-use customers can be aggregated in order to submit a single demand response offer in the capacity auction if those customers share the same curtailment service provider electric distribution company and transmission zone
In addition customer-sited distributed generation may be offered into auctions as a demand resource A hospital for example could offer to run its back-up generator on certain peak demand (eg hot summer) days to reduce its load on the system Or an industrial plant could cut back on production on such days and continue to run its on-site combustion or steam-cycle turbine
Currently energy efficiency resources may participate
Appendix 3
Eligibility Requirements for Demand-Side Resourcesin US Capacity Markets
84 Weekdays excluding holidays June through August between the hours ending 1500 and 1800 Eastern Prevailing Time (EPT)
85 If instead the supermarket replaced the existing coolers and freezers with more energy efficient ones it would bid that proposal in as an energy efficiency resource Or it could do both (replace and cycle) and bid in the capacity from the permanent savings (replacements) as energy efficiency and the dispatchable capacity (the cycling) as demand response
86 Weekdays excluding holidays from 1200 to 2000 EPT May through September and 1400 to 2200 EPT October through April
RegulatoRy assistance PRoject
36
in Base Residual Auctions for up to four consecutive delivery years In effect this means that PJM limits capacity payments for efficiency measures to four years of their measure life (rather than for the full measure life)87 In contrast a demand response resource (including distributed generation) can participate in the PJM capacity market for as long as its ability to reduce demand continues
ISO-NE Eligibility RequirementsSince the inception of ISO-NErsquos forward capacity market
in 2006 energy efficiency has qualified as an eligible demand-side resource ISO-NE defines demand resources as installed measures (products equipment systems services practices and strategies) that result in verifiable reductions in end-use consumption of electricity in the New England power system These are further categorized into ldquopassiverdquo (energy efficiency and non-dispatchable distributed generation) and ldquoactiverdquo (demand response emergency generation and dispatchable distributed generation) resources Passive demand resources are non-dispatchable but permanently reduce energy demand during peak hours Active demand resources are designed to reduce peak loads and to reduce load based on real-time system conditions or ISO-NE instructions Following are descriptions of eligible demand-side resources and performance requirements88
Passive Demand Resourcesbull On-Peak Demand Resources are measures that are
not weather-sensitive and reduce demand across a fixed set of on-peak hours such as energy-efficient commercial lighting and motors89
bull Seasonal Peak Demand Resources are weather-sensitive measures that reduce load during high-demand conditions such as energy-efficient heating and air conditioning systems Seasonal Peak Demand Resources must reduce load when actual system load is equal to 90 percent of the most recent peak load forecast for the applicable summer or winter season
Active Demand Resourcesbull Real-Time Demand Response Resources are
measures including load management and distributed generation that can be dispatched by ISO-NE as needed They must curtail electrical usage within 30 minutes of receiving a dispatch instruction and until receiving a releaserecall dispatch instruction
bull Real-Time Emergency Generation is distributed generation whose state air quality permit limits operation to ldquoemergencyrdquo conditions Generators must curtail the customerrsquos electrical usage within 30 minutes of receiving a dispatch instruction and until receiving a releaserecall dispatch instruction The amount of emergency generation that can be used to meet ISO-NErsquos capacity requirement is limited to 600 MW If the amount of real-time emergency generation that clears the auction exceeds this level payments to generators are reduced on a pro-rated basis All real-time emergency generation is treated as existing capacity
In contrast to PJM all demand-side resources in ISO-NE are eligible to bid capacity for their full measure life an approach that recognizes the full contribution of these resources to regional resource adequacy requirements and adds value to long-lived energy efficiency assets
87 FERC has directed PJM to evaluate the impact of its capacity payment period for energy efficiency resources
88 Eric Winkler and Abimael Santana ISO-NE ldquoNew Demand Resource Qualificationrdquo May 5 2009 at httpwwwiso-necomsupporttrainingcoursesfcmfcm_forum_may_5pdf
89 Summer on-peak hours are 1300 to 1700 non-holiday weekdays in June July and August Winter on-peak hours are 1700 to 1900 non-holiday weekdays in December and January
The Regulatory Assistance Project (RAP) is a global non-profit team of experts that focuses on the long-term economic and environmental sustainability of the power and natural gas sectors providing technical and policy assistance to government officials on a broad range of energy and environmental issues RAP has deep expertise in regulatory and market policies that promote economic efficiency protect the environment ensure system reliability and fairly allocate system benefits among all consumers We have worked extensively in the US since 1992 and in China since 1999 and have assisted governments in nearly every US state and many nations throughout the world RAP is now expanding operations with new programs and offices in Europe and plans to offer similar services in India in 2011 RAP functions as the hub of a network that includes many international experts and is primarily funded by foundations and federal grants
Home office
50 State Street Suite 3Montpelier Vermont 05602
802-223-8199wwwraponlineorg

RegulatoRy assistance PRoject
34
Step 2
The Regional Capacity Auction (3 Years ldquoForwardrdquo)
Step 3
System Operator Pays Cleared Resources at P and Bills LSEs(Note Self-Supply capacity is a ldquowashrdquo)
R1 R2 R3 R4 R5 R6 R7
P
R1
R3
R3
R5
R5
R2
R2
R4
R4
R6
R7
Bid Price = $ per MW-day
Quantity = MW
6500 MW P
Cleared Capacity = 10000
Supply = Capacity Committed ldquoForwardrdquo
P= Clearing price paid to all capacity clearing auction
Demand = SO Forecast of Capacity Requirements
R1-R7 = Capacity offered by Supply-Side (New built Existing Uprates) and Demand-Side (Energy Efficiency Demand Response Distrib Gen) Self-supply (R1) bids in a ldquozerordquo price New Resources set clearing price
LSE1 5000 MW
LSE2 5000 MW
R1
SOSO pays R1 3500 MW P
LSE2 pays its share of regional demand
5000 MW P
LSE1 pays its share of regional demand (5000 MW) adjusted for self-supply R1 for a net payment of 1500MW P
R1 = 3500 MW of ldquoSelf-Supplyrdquo Resources (LSE1 ownedunder contract)
In 2010Total regional peak demand of 10000 MW supplied by R1 + R2 + R3 + R4 + R5 LSE1 and LSE2 are each responsible for 50 of regional peak demand
35
the Role of foRwaRd caPacity MaRkets in incReasing deMand-side and otheR low-caRbon ResouRces
PJM Eligibility Requirements
Eligibility of demand-side resources has changed significantly over the years in PJMrsquos capacity markets In particular it was not until the most recent capacity auction (May 2009) for the
20122013 delivery year that energy efficiency became eligible to bid in PJMrsquos Base Residual Auction PJM is currently considering a tariff change to also allow energy efficiency to bid into incremental auctions
Under PJMrsquos eligibility rules an energy efficiency resource must achieve a ldquopermanentrdquo continuous reduction in electric energy consumption Examples of such a resource include lighting retrofit programs for residential commercial and industrial customers and programs to retrofit buildings with heating and cooling systems that exceed current efficiency standards To be eligible an energy efficiency resource must meet the following criteria
bull It is fully implemented throughout the delivery year without any requirement of notice dispatch or additional customer action
bull It is not reflected as a reduction in the peak load forecast used for the Base Residual Auction for the proposed delivery year
bull It exceeds relevant standards (such as building codes or appliance standards) at the time of commitment
bull It achieves the specified load reduction (expected average demand in MW) during defined summer on-peak hours84
Demand response on the other hand must be dispatchable mdash that is customer demand must be reduced when instructed For example a large supermarket with
coolers and freezers could install load management equipment that would cycle them on or off mdash and bid that demand response capability into the market85 More specifically a demand response resource must meet the following criteria
bull It is able to reduce demand for electricity up to 10 times each year for up to six consecutive hours per interruption during defined periods86
bull It is fully implemented within one hour (short lead time) or two hours (long lead time) of notice from PJM
bull In a year without calls for demand reductions it must demonstrate reliability through a test of reduction capability
bull It is registered in the Emergency Load Response Program and thus available for dispatch during PJM-declared emergency events
bull Compliance and status reports are filed as required
Multiple end-use customers can be aggregated in order to submit a single demand response offer in the capacity auction if those customers share the same curtailment service provider electric distribution company and transmission zone
In addition customer-sited distributed generation may be offered into auctions as a demand resource A hospital for example could offer to run its back-up generator on certain peak demand (eg hot summer) days to reduce its load on the system Or an industrial plant could cut back on production on such days and continue to run its on-site combustion or steam-cycle turbine
Currently energy efficiency resources may participate
Appendix 3
Eligibility Requirements for Demand-Side Resourcesin US Capacity Markets
84 Weekdays excluding holidays June through August between the hours ending 1500 and 1800 Eastern Prevailing Time (EPT)
85 If instead the supermarket replaced the existing coolers and freezers with more energy efficient ones it would bid that proposal in as an energy efficiency resource Or it could do both (replace and cycle) and bid in the capacity from the permanent savings (replacements) as energy efficiency and the dispatchable capacity (the cycling) as demand response
86 Weekdays excluding holidays from 1200 to 2000 EPT May through September and 1400 to 2200 EPT October through April
RegulatoRy assistance PRoject
36
in Base Residual Auctions for up to four consecutive delivery years In effect this means that PJM limits capacity payments for efficiency measures to four years of their measure life (rather than for the full measure life)87 In contrast a demand response resource (including distributed generation) can participate in the PJM capacity market for as long as its ability to reduce demand continues
ISO-NE Eligibility RequirementsSince the inception of ISO-NErsquos forward capacity market
in 2006 energy efficiency has qualified as an eligible demand-side resource ISO-NE defines demand resources as installed measures (products equipment systems services practices and strategies) that result in verifiable reductions in end-use consumption of electricity in the New England power system These are further categorized into ldquopassiverdquo (energy efficiency and non-dispatchable distributed generation) and ldquoactiverdquo (demand response emergency generation and dispatchable distributed generation) resources Passive demand resources are non-dispatchable but permanently reduce energy demand during peak hours Active demand resources are designed to reduce peak loads and to reduce load based on real-time system conditions or ISO-NE instructions Following are descriptions of eligible demand-side resources and performance requirements88
Passive Demand Resourcesbull On-Peak Demand Resources are measures that are
not weather-sensitive and reduce demand across a fixed set of on-peak hours such as energy-efficient commercial lighting and motors89
bull Seasonal Peak Demand Resources are weather-sensitive measures that reduce load during high-demand conditions such as energy-efficient heating and air conditioning systems Seasonal Peak Demand Resources must reduce load when actual system load is equal to 90 percent of the most recent peak load forecast for the applicable summer or winter season
Active Demand Resourcesbull Real-Time Demand Response Resources are
measures including load management and distributed generation that can be dispatched by ISO-NE as needed They must curtail electrical usage within 30 minutes of receiving a dispatch instruction and until receiving a releaserecall dispatch instruction
bull Real-Time Emergency Generation is distributed generation whose state air quality permit limits operation to ldquoemergencyrdquo conditions Generators must curtail the customerrsquos electrical usage within 30 minutes of receiving a dispatch instruction and until receiving a releaserecall dispatch instruction The amount of emergency generation that can be used to meet ISO-NErsquos capacity requirement is limited to 600 MW If the amount of real-time emergency generation that clears the auction exceeds this level payments to generators are reduced on a pro-rated basis All real-time emergency generation is treated as existing capacity
In contrast to PJM all demand-side resources in ISO-NE are eligible to bid capacity for their full measure life an approach that recognizes the full contribution of these resources to regional resource adequacy requirements and adds value to long-lived energy efficiency assets
87 FERC has directed PJM to evaluate the impact of its capacity payment period for energy efficiency resources
88 Eric Winkler and Abimael Santana ISO-NE ldquoNew Demand Resource Qualificationrdquo May 5 2009 at httpwwwiso-necomsupporttrainingcoursesfcmfcm_forum_may_5pdf
89 Summer on-peak hours are 1300 to 1700 non-holiday weekdays in June July and August Winter on-peak hours are 1700 to 1900 non-holiday weekdays in December and January
The Regulatory Assistance Project (RAP) is a global non-profit team of experts that focuses on the long-term economic and environmental sustainability of the power and natural gas sectors providing technical and policy assistance to government officials on a broad range of energy and environmental issues RAP has deep expertise in regulatory and market policies that promote economic efficiency protect the environment ensure system reliability and fairly allocate system benefits among all consumers We have worked extensively in the US since 1992 and in China since 1999 and have assisted governments in nearly every US state and many nations throughout the world RAP is now expanding operations with new programs and offices in Europe and plans to offer similar services in India in 2011 RAP functions as the hub of a network that includes many international experts and is primarily funded by foundations and federal grants
Home office
50 State Street Suite 3Montpelier Vermont 05602
802-223-8199wwwraponlineorg

Home office
50 State Street Suite 3Montpelier Vermont 05602
802-223-8199wwwraponlineorg