the role of ipo underwriting syndicates - university of notre dame
TRANSCRIPT

The Role of IPO Underwriting Syndicates:
Pricing, Information Production, and Underwriter Competition
SHANE A. CORWIN AND PAUL SCHULTZ
Journal of Finance 60(1), February 2005, 443-486.
This is an electronic version of an article published in the Journal of Finance: complete citation information for the final version of the paper, as published in the print edition of the Journal of Finance, is available on the Blackwell Synergy online delivery service, accessible via the journal’s website at www.blackwellpublishing.com/journals/jofi or http://www.blackwell-synergy.com.

THE JOURNAL OF FINANCE • VOL. LX, NO. 1 • FEBRUARY 2005
The Role of IPO Underwriting Syndicates:Pricing, Information Production, and
Underwriter Competition
SHANE A. CORWIN and PAUL SCHULTZ∗
ABSTRACT
We examine syndicates for 1,638 IPOs from January 1997 through June 2002. Wefind strong evidence of information production by syndicate members. Offer pricesare more likely to be revised in response to information when the syndicate has moreunderwriters and especially more co-managers. More co-managers also result in moreanalyst coverage and additional market makers following the IPO. Relationships be-tween underwriters are critical in determining the composition of syndicates, perhapsbecause they mitigate free-riding and moral hazard problems. While there appear tobe benefits to larger syndicates, we discuss several factors that may limit syndicatesize.
ALMOST ALL IPO SYNDICATES INCLUDE ONE or more co-managers and several non-managing underwriters. Despite this, there has been almost no recent academicresearch on the functions of syndicate members or the determinants of syndi-cate participation. What determines the structure of an IPO syndicate? Whatpurpose do co-managers and non-managing syndicate members serve? In thispaper, we use a sample of 1,638 IPOs from January 1997 through June 2002 toexamine these questions.
We find evidence of information production by syndicate members. Specifi-cally, we examine how syndicate structure affects the likelihood and magnitudeof offer price revisions in response to information revealed during the filing pe-riod. As a proxy for this information, we use the total return from the midpointof the filing price range to the closing price on the first day of trading. We findthat offer prices are more likely to be adjusted up (down) in response to positive(negative) information when the underwriting syndicate is less concentrated
∗Shane A. Corwin and Paul Schultz are with Mendoza College of Business, University of NotreDame. We thank Rick Green and an anonymous referee for valuable suggestions. We also thankAndrew Blum, Stuart Cable, Hsuan-Chi Chen, Michel Habib, Andrew Karolyi, AlexanderLjungqvist, Michelle Lowry, Jay Ritter, Ann Sherman, Per Stromberg, Britt Tunick, Bill Wilhelm,Kent Womack, members of the Securities Industry Association Syndicate Committee, participantsat the NYSE/Stanford Joint Conference on Entrepreneurial Finance and Initial Public Offerings,participants at the Second EVI Conference on Entrepreneurship, Venture Capital, and InitialPublic Offerings at NYU, and seminar participants at Dartmouth College, the University of NotreDame, the Ohio State University, and Pennsylvania State University for comments. We are grate-ful to I/B/E/S for providing data on analyst coverage and to Jay Ritter for providing underwriterrankings.
443
444 The Journal of Finance
or has more co-managers. We note that upward price revisions generally resultin reduced underpricing. However, after controlling for price revisions, we findno additional relation between syndicate structure and IPO underpricing.
Information from co-managers can be conveyed to the book manager in twoways. First, underwriters may relay information about market interest in anIPO directly to the book manager. Underwriters that we spoke with said they of-ten talked to some book managers during the IPO process. Second, co-managersmay convey information indirectly through conversations with the issuer, whothen uses this information in negotiations with the book manager. Since issuersare more likely to bring up positive information during pricing negotiations, weexpect that information conveyed by co-managers “whispering in the issuer’sear” will more likely lead to upward than downward price revisions. Thus, ourfinding that syndicate structure affects both upward and downward price revi-sions suggests that co-managers relay information directly to the book managerin at least some cases.
Syndicate members also provide analyst coverage and market-making ser-vices in the aftermarket. All else being equal, we show that each additionalco-manager in a syndicate results in one additional market maker. We alsofind that each additional co-manager results in 0.8 additional analysts issuingreports in the three months after an IPO. The number of non-managing syndi-cate members is not significantly related to either analyst coverage or marketmaking in the aftermarket.
Additional evidence on the importance of analyst coverage comes from ourprobit model estimates of the determinants of syndicate participation. For largeIPOs, we find that having a top-ranked analyst in the issuer’s industry signif-icantly increases the likelihood that an underwriter is included in a syndicateeither as a co-manager or in a non-managing role. We also find that geographyis a significant determinant of syndicate participation. Underwriters are morelikely to be included in a syndicate if they are in the same state as the issuer,particularly if the book manager is based elsewhere. This suggests that localunderwriters are better able to market an issue to local investors or may bebetter equipped to assess demand from these investors.
The single strongest determinant of whether an underwriter is included ina syndicate is participation in recent syndicates led by the same book man-ager. Almost as important is whether the book manager participated in recentofferings managed by the syndicate member. In other words, underwriter rela-tionships are critical. Pichler and Wilhelm (2001) note that syndicate membersare required to exert effort that may be difficult to observe, resulting in poten-tial agency problems. We hypothesize that ongoing relationships may reducethese agency problems in syndicates. The importance of relationships suggeststhat syndicate members are expected to play an active role in selling IPOs,determining IPO value, or providing aftermarket services.
Our results suggest that issuers benefit from including more underwritersand particularly more co-managers in the IPO syndicate. However, syndicatesize may be limited for several reasons. First, prestigious book managers andco-managers demand sizeable share allocations in order to participate in an

The Role of IPO Underwriting Syndicates 445
IPO syndicate. Thus, syndicate size may be limited by the size of the offer andthe choice of book manager. In addition, we find that being a co-manager in theIPO significantly increases an underwriter’s chances of becoming the book man-ager in follow-on offerings. As a result of this competition, book managers mayactively discourage the inclusion of additional co-managers. The importance ofexisting underwriter relationships may further limit the set of potential syn-dicate members. Finally, it may not be costless to add co-managers. At leastfor small IPOs, we find that underwriting spreads increase as the number ofco-managers in the syndicate increases.
We note that our results may not apply to IPO syndicates from other periods.Even during our relatively short sample period, the nature of IPO syndicateschanged. Syndicate size decreased significantly from 1997 to 2002 even as offerproceeds increased. Over the same period, the mean number of co-managers peroffer rose. Finally, many smaller underwriters disappeared during our sampleperiod, while the proportion of IPOs underwritten by the largest investmentbanks increased. These patterns are consistent with those documented by Chenand Ritter (2000) and Ljungqvist and Wilhelm (2003) and suggest that theimportance and functions of underwriting syndicates may be changing overtime.
The rest of the paper is organized as follows. In Section I, we discuss syndi-cate formation and operation. In Section II, we review potential functions forsyndicate members and related empirical hypotheses. We describe our data inSection III. Section IV presents evidence on the determinants of the size andcomposition of syndicates, while Section V provides evidence on the functionsof syndicate members. Section VI addresses the question of the optimal size forsyndicates. We summarize our findings and draw conclusions in Section VII.
I. The Formation and Operation of Underwriting Syndicates
Syndicate formation begins with the selection of the book manager (or leadunderwriter) by the issuing firm. Competition to be the book manager can befierce for the largest, most desirable IPOs, as underwriters vie for top positionsin underwriting rankings and seek the higher fees associated with the leadposition. For these large IPOs, issuing firms can choose from a number of po-tential book managers. The Securities Industry Association’s Capital MarketsHandbook (2003), the source of much of our discussion in this section, statesthat general reputation, research support, industry knowledge, and prior rela-tionships are likely to be important factors in the selection of the book manager.For smaller, less desirable IPOs, issuing firms may not have a choice of bookmanagers. Krigman, Shaw, and Womack (2001) report that many issuers choosea book manager because it is the only one that will underwrite their IPO.
If several underwriters participate in the “bake sale” to be the book manager,the issuer is likely to select some to be co-managers. Co-managers may bechosen because of their ability to provide analyst coverage or market making, orbecause their distribution system complements that of the book manager. Bookmanagers may, on occasion, advise issuers on the best co-managers to include

446 The Journal of Finance
in a syndicate. They may also affect the choice of co-managers indirectly. Bookmanagers typically set a lower bound on the portion of the fees that they mustget to agree to be the book manager, thereby limiting the potential number of co-managers and their allocations. The book manager may also limit the numberof co-managers to avoid competition during the IPO process. As one investmentbanker told us, “if we’re the lead, the best number of co-managers is zero.”
Both the issuer and book manager choose non-managing syndicate mem-bers. These underwriters do less work than co-managers, but are also relativelycheap to include. Underwriters may be included in the syndicate because theyhave loaned money to the issuer, because of relationships with the customersof the issuer, or because of personal ties between people at the issuing firm andthe underwriter. Others get a place in the syndicate because they clear throughor purchase research from the book manager, or because the book manager andissuer want minority-owned firms participating in the IPO.
In a typical IPO, the number of shares underwritten varies substantiallyacross syndicate members. These allocations represent the number of shareseach syndicate member agrees to buy from the issuer and are listed in thefinal prospectus. Underwriting allocations for co-managers are usually decidedupfront, but allocations for other syndicate members are at the sole discretionof the book manager and are usually assigned at the due diligence meeting,about 48 hours before the IPO becomes effective. In the analysis to follow, weuse these underwriting allocations to measure the distribution of shares withinthe syndicate.
The number of shares each syndicate member is credited with selling is usu-ally very different from the number they underwrite, and is again at the discre-tion of the book manager. The Capital Markets Handbook states that a standardpractice in recent years has been for the book manager to credit each syndicatemember with selling 10% of its underwriting allocation. However, the actualselling allocation for a syndicate member may vary, if for instance, the syndicatemember provides research coverage or other services for the IPO.
Typically, all of the shares to be sold to institutional investors are allocatedto an “institutional pot.” This central source for institutional sales serves sev-eral purposes. First, it allows institutions to establish large positions withoutplacing orders with numerous syndicate members. Second, it gives the bookmanager a clearer picture of institutional demand. Finally, an institutional potallows the book manager to ensure that shares are distributed as they see fit.In general, the book manager does most of the marketing to institutions and re-ceives credit for selling most of the shares in the institutional pot. In an increas-ing number of IPOs, a “jump ball” or competitive pot is used. In these cases,institutions apportion credit for the shares they purchase to one or more ofthe syndicate members (including the book manager). This provision providesincentives for all syndicate members to exert institutional selling effort. Re-gardless of whether the institutional pot includes a jump ball portion, the bookmanager is usually credited with selling the majority of institutional shares,and co-managers receive more institutional selling credits than non-managingsyndicate members.

The Role of IPO Underwriting Syndicates 447
An underwriter’s role within the syndicate and its share allocation have asubstantial impact on the fees it receives. Chen and Ritter (2000) provide anexample of the fee distribution within an underwriting syndicate. The grossspread, which is typically 7% of offer proceeds, is divided between managementfees, underwriting fees, and selling concessions. Management fees are sharedbetween the book manager and co-managers, with the book manager typicallyreceiving a larger share. Underwriting fees, less any underwriting and stabi-lization expenses, are shared among all syndicate members according to thenumber of shares underwritten. Finally, the selling concession, which is usu-ally about 60% of the gross spread, is divided among syndicate members basedon the number of shares each is credited with selling. Since the vast majorityof selling credits are assigned to the book manager, and to a lesser extent tothe co-managers, this breakdown awards most of the fees to the book manager,with non-managing syndicate members earning only a small fraction of thetotal fees paid by the issuer.
We show below that ongoing relationships among underwriters play a crit-ical role in syndicate formation. Book managers tend to include underwriterswith whom they have worked in the past or with whom they have other busi-ness relationships. These relationships may serve to mitigate agency problemswithin syndicates. For example, underwriters complain that co-managers shirk,do not work with them, and may undermine their efforts with issuing firms.1
The possibility of future syndicate work may align the incentives of syndicatemembers.2 One underwriter told us that it is included in syndicates managedby specific underwriters who “know what we can do.”
II. The Potential Functions of Underwriting Syndicates
Practitioners and academics suggest several potential roles for syndicatemembers. In this section, we discuss these roles and derive related testablepredictions.3
1 Co-managers may also be hurt by the self-serving behavior of book managers. The December 14,1998 edition of Investment Dealers Digest (p. 11) provides an example. NationsBanc Montgomerywas the book manager for a secondary stock offering for Flextronics International. After the dealwas priced, NationsBanc decided instead to sell it as a block trade, and all co-managers were cutout of their fees. Syndicate members were described as angry and shocked.
2 Pichler and Wilhelm (2001) observe that the reliance on reputation and relationships in syn-dicates makes it harder for new firms to break into the business and may allow members to earnquasirents.
3 The hypotheses discussed in this section generally refer to active functions of syndicate mem-bers. Barzel, Habib, and Johnsen (2000) suggest a motivation for including passive syndicate mem-bers. In their model, underwriters are included in a syndicate to avoid the costs of excess search.Excess search occurs when securities firms that are not in the syndicate engage in a costly searchfor information about an IPO’s value that allows them to profit from aftermarket trades, but doesnot result in more accurate pricing of the IPO or better placement of the shares. The formationof syndicates decreases costly excess search by other underwriters and compensates them for re-maining passive.
448 The Journal of Finance
A. Information Production
Underwriters are faced with the difficult task of assigning a price to a stockwith no prior trading history. One underwriter offered that pricing an IPO is“part art and part science.” The science is using comparable traded companiesto assign a price to the IPO. The art is determining the market’s interest inthe offering. Since valuation methods and the choice of comparables are likelyto be similar across underwriters, syndicate members are unlikely to play animportant role in the science part of the pricing process. However, differentunderwriters have different investor clienteles. Some firms, like Merrill Lynchare known for their retail investor base. Others, like Goldman Sachs, specializein institutional clients. Underwriters also specialize by geographic region. Tra-ditionally, Piper, Jaffrey, and Hopwood’s customers were based in the Midwest,while Janney Montgomery Scott’s customers came from the East coast. Be-cause their customer bases may differ from the book manager’s, co-managers’,and syndicate members’ demand channels may provide the book manager withadditional sources of information about market demand for the IPO. If syndica-tion improves information production, we expect larger syndicates to uncovermore information between the filing of the preliminary prospectus and the offerdate, resulting in more accurately priced IPOs. The information production hy-pothesis also suggests that issuers or book managers select syndicate memberswith different client bases.
Even if co-managers do not provide information directly to the book man-ager, they may affect IPO pricing through their conversations with issuingfirms. Because co-managers are concerned with furthering their own interests,competition among underwriters may continue even after selection of the bookmanager. While participating in the IPO syndicate, co-managers may work tosecure a place as lead manager in follow-on offerings or other future under-writing business. In our conversations with underwriters, they suggested thatco-managers influence pricing by “whispering in the issuer’s ear.” For example,a co-manager might tell the issuer that the book manager mispriced the IPOand that “we would have done better for you.” The positive information thatco-managers convey to the issuer is likely to be used by the issuer to pressurethe book manager to revise the price upward during the pricing negotiations.The underwriters we spoke to stressed that this is a significant problem withinsyndicates.
We note that the role of syndicate members in IPO pricing may differ fromoffer to offer. Our conversations with underwriters indicate that some book man-agers discuss an IPO’s progress with co-managers and other syndicate mem-bers, while other book managers completely ignore their syndicate. The COOof one smaller underwriter we spoke to noted that even as a non-managingsyndicate member, their firm is expected to actively participate in selling andconveys information to book managers about demand from smaller institu-tional investors. When asked how often they speak to book managers whenselling IPOs, she said “about twice a day.” At a recent New York Stock Ex-change conference, the CEO of Veridian provided an example of information

The Role of IPO Underwriting Syndicates 449
being transferred indirectly through the issuer. During his firm’s IPO, he ac-tively sought out a co-manager for information on the market’s reception of theoffering.
B. Certification and Underwriter Reputation
Another potential reason for including underwriters in a syndicate is to pro-vide additional certification of the issuer’s quality. The certification hypothesissuggests that reputable underwriters (or auditors) are associated with reduceduncertainty, and as a consequence, with less underpricing.4 This follows fromtheories that predict a positive relation between IPO underpricing and the levelof asymmetric information or uncertainty about IPO value (e.g., Rock (1986) andBeatty and Ritter (1986)).5
We argue that participation by highly reputable syndicate members and es-pecially co-managers may provide additional certification beyond that of thebook manager. This certification is meaningful because underwriters may bejointly and severally liable for damage resulting from false or misleading infor-mation provided in the IPO registration statement (Beatty and Welch (1996)).An underwriter’s appearance “on the cover” may also signal that it competedto be the book manager for the IPO and was then invited to participate by theissuer. If underwriting syndicates provide incremental certification, we expectIPOs with high-quality syndicate members to be less underpriced than otherIPOs, all else being equal. This effect should be strongest for IPOs with highlyreputable co-managers.
Of course, an underwriter’s reputation and ability to certify an IPO is harmedif the underwriter participates in the syndicates of mispriced IPOs. Thus, co-managers as well as book managers have an incentive to make sure that IPOsare correctly priced. In particular, prestigious co-managers may want to see theoffering price revised downward if their assessment of market demand indicatesthat an IPO is overpriced.
C. Analyst Coverage
Among the services provided by underwriters, aftermarket analyst coverageis perhaps the most often cited. Practitioner guides to going public counselpotential issuers to select underwriters that can provide good analyst cover-age and that will continue to follow the stock in the aftermarket (e.g., Cable
4 For a more formal presentation of these arguments, see Booth and Smith (1986), Carter andManaster (1990), Titman and Trueman (1986), and Balvers, McDonald, and Miller (1988).
5 Empirical support for the certification hypothesis is mixed. Carter and Manaster (1990) andCarter, Dark, and Singh (1998), among others, find that offers that are taken public by highlyreputable underwriters are associated with reduced underpricing. Beatty (1989) finds similar re-sults related to auditor quality, and Balvers et al. (1988) find evidence of significant reductions inunderpricing from both underwriter and auditor quality. However, Beatty and Welch (1996) findthat the effects of underwriter quality reversed in the 1990s, with high-quality underwriters beingassociated with higher, rather than lower, underpricing.

450 The Journal of Finance
(2001)). Academic studies also note the importance of analyst coverage. Forexample, Krigman et al. (2001) report that issuers cite analyst coverage as animportant determinant when selecting underwriters. Chen and Ritter (2000,p. 1116) state that “an implicit understanding is that the managing underwrit-ers of an IPO will each assign a securities analyst to cover the company, produceresearch reports, and issue buy recommendations for the stock.” The COO ofone smaller underwriter tells us that even as a non-managing syndicate mem-ber, they are expected to provide aftermarket research coverage (and marketmaking). If underwriters are included in a syndicate to increase aftermarketanalyst coverage, we expect the number of analysts covering a stock to increasewith syndicate size. If the quality of analyst coverage is also important, weexpect that underwriters with a top-ranked analyst will be more likely to beincluded in a syndicate.
D. Market Making
The great majority of IPOs begin trading on Nasdaq, where the lead under-writer almost always acts as the dominant market maker (see Schultz andZaman (1994) and Ellis, Michaely, and O’Hara (2000)). Though Ellis et al.find that co-managers play a negligible role in aftermarket trading, under-writers told us that co-managers, and even non-managing syndicate mem-bers with market-making operations are expected to make a market in thestock once trading begins. If securities firms that participate in a syndicateare more likely to make a market than others, we would expect larger syndi-cates to be associated with a larger number of market makers for Nasdaq-listedIPOs.
III. Data and Sample Characteristics
A. Data
We collect an initial sample of 2,146 IPOs issued between January 1997and June 2002 from the Securities Data Company’s (SDC) Global New IssuesDatabase. For each IPO, SDC includes data on offer characteristics, book man-ager and syndicate member identity, underwriter roles within the syndicate,and share allocations across underwriters. Again, we note that these alloca-tions reflect the shares underwritten, not the shares sold, by each syndicatemember. We begin our sample in 1997 because SDC’s syndicate data is veryincomplete for earlier IPOs.
Detailed data on syndicate participation is missing for 273 IPOs. For theseIPOs, syndicate data and underwriter roles are collected from the final prospec-tuses. As a check of the underwriting allocation data, we then examine whetherthe total shares underwritten by all syndicate members equals the total sharesoffered in the issue (including international shares) as listed in SDC. Discrep-ancies are evident for 453 IPOs. Where possible, syndicate participation and
The Role of IPO Underwriting Syndicates 451
share allocation data for these IPOs are corrected using information in the finalprospectus.6
From the initial sample, we exclude issues by non-U.S. firms, investmentfunds, REITs, and Units. These restrictions reduce the sample by 208, 100, 41,and 100 issues, respectively. We also exclude 53 IPOs for which discrepancies inunderwriting allocations and total shares could not be reconciled and six issueswith incomplete share data. The final sample includes 1,638 IPOs.
SDC assigns one of six role designations to each underwriter in the syndicate:book manager, joint book manager, joint-lead manager, co-manager, syndicatemember, or global lead. For IPOs that include shares offered outside the UnitedStates, syndicate participation and underwriting allocations for internationallyoffered shares are generally listed separately. In many cases, this results in thesame underwriter being listed twice within the syndicate. When this occurs, wecombine domestic and international underwriting allocations to determine thetotal allocations received by each underwriter and the total number of under-writers within the syndicate. In most cases, underwriters listed as global leadsare also listed as co-managers, allowing us to ignore the global lead designa-tion. We also performed several checks of the SDC co-manager designations toremove potential data errors. These checks resulted in underwriter role correc-tions for 17 IPOs.7
There is a large number of mergers in the securities industry over our sam-ple period. We treat underwriters who change names following a merger asnew firms. So, for example, we examine Morgan Stanley Dean Witter sepa-rately from either Morgan Stanley or Dean Witter and we study U.S. BancorpPiper Jaffrey separately from Piper, Jaffrey, and Hopwood. Our reasoning isthat different clienteles and financial capabilities after mergers may changethe motives for and characteristics of syndicates. See the Appendix for a list ofunderwriter merger and acquisition events during our sample period and theassociated name adjustments applied to the data. A more detailed description ofthe name adjustments is available from the authors at www.nd.edu/∼scorwin.Merger and acquisition events are identified using Mergers and Acquisitions
6 Forty-three of the sample’s IPOs include a joint book manager, 94 include one underwritercoded as joint lead, and 5 include two underwriters coded as joint lead. For each of these cases, weverify the underwriter roles using the final IPO prospectus. Of the 43 joint book managers listed inthe data, 34 are explicitly referred to as joint book managers in the final prospectus. The remainingnine cases could not be verified, but are not changed. Of the managers designated as joint leads,we found no cases in which this underwriter was explicitly referred to as a joint book-runningmanager. Throughout the paper, we therefore treat joint leads as co-managers rather than as jointbook managers. A detailed description of checks and corrections of the data is available from theauthors at www.nd.edu/∼scorwin.
7 Underwriter roles were verified using the final prospectus in 7 cases where an underwriterreceived the same underwriting allocation as the book manager, but was not coded as a co-manager,and in 53 cases where the syndicate included more than five co-managers or was made up of morethan 75% co-managers. These checks resulted in 14 corrections. We also verified 66 cases wherean underwriter was coded as a global lead, but was not also listed as a co-manager or joint-leadmanager. This check resulted in three corrections.

452 The Journal of Finance
(1997–2002) and the Securities Industry Yearbook (Securities Industry Associ-ation (1995–2002)). It is also likely that some underwriters enter or exit duringour sample period for reasons unrelated to mergers. In the analysis to followwe examine the robustness of the results to this possibility.
We collect data on aftermarket analyst coverage from I/B/E/S. We first iden-tify the number of analysts issuing reports on each IPO firm within threemonths of the offer. As a measure of the quality of an underwriter’s analystcoverage, we then identify all underwriters that employ an Institutional In-vestor (henceforth II) All-Star analyst for the IPO’s industry. Every October,II names the top three analysts in each of several dozen industries. For eachof these industries, we obtain the identities of the All-Star analysts and theirunderwriter affiliations from 1996 through 2002. We then assign each IPO toone or more II industries. An underwriter is classified as having a top analystfor an IPO if it employs any of the top three II analysts in any of the industriesinto which the IPO is classified.
Deciding which II industries correspond to a particular IPO can be diffi-cult, since II industries do not correspond directly to SIC codes, and analyststhat II places in different industries often follow the same stocks. As a firststep in assigning IPOs to industries, we identify up to 10 stocks mentionedin association with each II industry. We then output I/B/E/S industry descrip-tions for each IPO and each firm identified in association with an II indus-try. Finally, we match the I/B/E/S industry description for each IPO with theI/B/E/S industry descriptions corresponding to the II industries. We are ableto match 1,248 IPOs with II industries using this methodology. The remain-ing IPOs are assigned to industries by hand after examining descriptions oftheir business. I/B/E/S industry descriptions often correspond to more thanone II industry. As a result, 682 IPOs fit into one II industry, 339 are classi-fied into two industries, and 598 fit into three or more industries. Nineteen ofthe IPOs defy classification into any of the industries covered by II (e.g., soilpreparation).
B. Summary Statistics
Panel A of Table I provides descriptive statistics for the sample IPOs. Onaverage, sample IPOs raised $115 million. The mean and median values ofunderpricing are 39.5 and 14.3%, respectively, and the mean and median ad-justments from the filing range midpoint to the offer price are 6.8 and 0.0%.As a measure of risk, we estimate the standard deviation of continuously com-pounded daily returns from day 21 through day 125 after the offer. The meanaftermarket standard deviation in the sample is 5.9%.
The mean number of underwriters in a syndicate is 15.9, while the number ofbook managers and co-managers average 1.04 and 2.01, respectively. On aver-age 41.6% of the shares are underwritten by book managers and another 38.2%are underwritten by co-managers. This leaves only 20% of the shares to be un-derwritten by other syndicate members. As an additional measure of syndicate

The Role of IPO Underwriting Syndicates 453
Table ISummary Statistics for Offer and Syndicate Characteristics
Panel A describes the distribution of each variable. Panel B shows the mean value of each variableby year. In Panel B, the last column lists a p-value from an F-test of the restriction that meansare equal across years. The sample includes 1,638 U.S. IPOs issued between January 1997 andJune 2002, excluding units, rights, investment funds, and REITs. Underpricing is defined as thepercentage return from the offer price to the first day’s closing price. Offer proceeds and offeredshares include both United States and international tranches. The adjustment from the filing priceis the percentage return from the midpoint of the original filing range to the offer price. Aftermar-ket standard deviation is estimated using continuously compounded daily returns from days 21through 125 after the IPO and is missing for three IPOs. Carter–Manaster ranks range from oneto nine and are based on the relative placement of underwriter names in tombstone ads (see Carterand Manaster (1990)). Adjusted Carter–Manaster ranks are obtained from Jay Ritter’s web pageat http://bear.cba.ufl.edu/ritter/Rank.HTM. Syndicate characteristics are based on underwritingallocations as listed in the final prospectus or in SDC. Allocations and proceeds for book and co-managers are based on the underwriting allocations assigned to each class of underwriter. TheHerfindahl Index is the sum of the squared percentages of total shares underwritten by each in-vestment bank. The number of active underwriters is a count of all underwriters that participate inat least one syndicate during a given year. The numbers of active book managers and co-managersare calculated similarly.
Panel A: Distribution of Offer and Underwriter Characteristics
Mean Min 25th Percentile Median 75th Percentile Max
Offer proceeds ($mil) 114.99 2.32 30.00 52.33 92.40 8680.00Underpricing (%) 39.51 −43.27 1.35 14.29 43.00 697.50Adjustment from
filing price (%)6.82 −65.91 −9.09 0.00 16.67 344.44
Aftermarket standarddeviation (%)
5.90 0.52 3.84 5.71 7.62 38.34
Book manager’sCarter–Manasterrank
7.67 1.10 7.10 8.10 9.10 9.10
No. of Book managersper issue
1.04 1.00 1.00 1.00 1.00 2.00
No. of Co-managersper issue
2.01 0.00 1.00 2.00 3.00 25.00
Total underwritersper issue
15.85 1.00 10.00 15.00 21.00 128.00
Herfindahl Index (%) 29.38 3.00 19.85 24.69 31.06 100.00Book manager
allocation (%)41.57 4.76 31.00 38.70 45.29 100.00
Co-managers’allocation (%)
38.23 0.00 32.00 41.07 48.75 82.50
Book managerproceeds ($mil)
38.30 0.38 10.80 19.76 34.19 2761.65
Co-managerproceeds ($mil)
57.11 0.00 9.96 21.57 40.50 5077.80
(continued )

454 The Journal of Finance
Table I—Continued
Panel B: Offer and Underwriter Characteristics by Year
1997 1998 1999 2000 2001–2002 p-value
Number of IPOs 440 287 456 339 116 –Offer proceeds ($mil) 54.68 79.16 124.19 123.80 370.49 0.000Underpricing (%) 13.99 20.14 71.27 55.36 13.11 0.000Adjustment from
filing price (%)−1.62 −0.21 17.91 11.78 −1.91 0.000
Aftermarket standarddeviation (%)
4.22 5.45 6.64 7.93 4.55 0.000
Book manager’sCarter–Manasterrank
6.94 7.08 8.05 8.35 8.34 0.000
No. of Book managersper issue
1.00 1.01 1.04 1.06 1.19 0.000
No. of Co-managersper issue
1.38 1.56 2.27 2.43 3.21 0.000
Total underwritersper issue
17.84 14.66 15.89 14.59 14.79 0.000
Herfindahl Index (%) 29.80 32.83 27.63 28.12 29.85 0.003Book managers’
allocation (%)39.64 42.98 40.63 42.41 46.70 0.001
Co-managers’allocation (%)
32.78 33.63 41.34 43.16 43.67 0.000
Book managerproceeds ($mil)
16.67 23.72 39.44 47.21 125.88 0.000
Co-manager proceeds($mil)
22.43 38.18 61.87 59.89 208.73 0.000
No. of of Activeunderwriters
391 336 372 259 213 –
No. of of Active bookmanagers
128 100 72 51 28 –
No. of of Activeco-managers
135 105 116 81 72 –
structure, we calculate a Herfindahl Index of underwriting allocations withinthe syndicate. This index is defined as the sum of the squared percentagesof shares allocated to each underwriter. The mean and median values of thesyndicate Herfindahl Index are 29.4 and 24.7, respectively. For comparison, anIPO with four syndicate members underwriting equal numbers of shares wouldhave a Herfindahl Index of 25.0.
Panel B of Table I provides information on offer and syndicate character-istics by year. Although our sample period covers less than 6 years, thereare significant differences in IPO and syndicate characteristics over time. Of-fer proceeds increased substantially during the sample period. Aftermarketstandard deviation increased through 2000 and then decreased in 2001–2002.Mean underpricing is 14.0% in 1997 and 20.1% in 1998, increases to 71.3% in

The Role of IPO Underwriting Syndicates 455
1999 and 55.4% in 2000, and decreases to 13.1% in 2001–2002.8 As a measureof underwriter prestige, we obtain adjusted Carter–Manaster rankings fromJay Ritter’s website at http://bear.cba.ufl.edu/ritter/rank.htm (see Carter andManaster (1990)). The average ranking for book managers increases steadilyover the sample period from 6.94 in 1997 to 8.34 in 2001–2002.
The mean number of co-managers increased steadily from 1.38 in 1997 to 3.21in 2001–2002. At the same time, the total number of underwriters fell from 17.8in 1997 to 14.8 in 2001–2002.9 All co-managers together underwrote an averageof 32.8% of offered shares in 1997 compared to 43.7% in 2001–2002. Finally, thenumber of active underwriters decreased over the sample period. The sampleincludes 391 different underwriters, 135 co-managers, and 128 book managersduring 1997, but only 213 underwriters, 72 co-managers, and 28 book managersduring 2001–2002.
IV. The Size and Composition of Syndicates
A. Syndicate Size and Concentration
As a first look at the determinants of syndicate structure, Table II reportsregressions of syndicate size and concentration on expected offer proceeds (de-fined as shares offered times the midpoint of the initial filing price range), thenatural logarithm of the expected proceeds, aftermarket volatility, a dummy fora book manager with a Carter–Manaster ranking of eight or higher, a dummyvariable for IPOs listed on the NYSE or AMEX, a dummy for venture capitalbacking, and year dummy variables. Five measures of syndicate compositionare used as dependent variables: the number of underwriters in the syndicate,the number of co-managers, the proportion of shares underwritten by the bookmanager, the proportion of shares underwritten by the co-managers, and theIPO syndicate’s Herfindahl Index. Poisson regressions are run when the depen-dent variable is a count (number of underwriters or number of co-managers)and ordinary least squares (OLS) regressions are used for the other dependentvariables.
As the table shows, the natural log of offer proceeds is highly significant ineach of the regressions. Both the number of underwriters and the number ofco-managers increase as the amount raised increases, while the Herfindahl In-dex and the proportion of shares underwritten by the book manager decrease.Venture capitalist participation is associated with more co-managers and lessconcentrated syndicates. The regressions in Table II also confirm that syndi-cates have changed over our sample period. After controlling for other factors,the number of underwriters in syndicates declines steadily over the sampleperiod, while the number of co-managers increases. It is also interesting that
8 While the level of underpricing in 1999 and 2000 is large by historical standards, it is similarto that found by Loughran and Ritter (2002) for the same period. See Loughran and Ritter, andLjungqvist and Wilhelm (2003) for possible explanations.
9 These patterns are consistent with those documented by Ljungqvist and Wilhelm (2003) for1996–2000 and Chen and Ritter (2000) for 1985–1997.

456 The Journal of Finance
Tab
leII
Det
erm
inan
tsof
Syn
dic
ate
Siz
ean
dC
once
ntr
atio
nT
he
tabl
eli
sts
coef
fici
ente
stim
ates
from
regr
essi
ons
ofsy
ndi
cate
size
and
con
cen
trat
ion
mea
sure
son
vari
ous
offe
rch
arac
teri
stic
s.T
he
sam
ple
con
sist
sof
1,63
8IP
Os
issu
edbe
twee
nJa
nu
ary
1997
and
Jun
e20
02,e
xclu
din
gu
nit
s,ri
ghts
,in
vest
men
tfu
nds
,an
dR
EIT
s.A
fter
mar
ket
stan
dard
devi
atio
nis
esti
mat
edu
sin
gco
nti
nu
ousl
yco
mpo
un
ded
dail
yre
turn
sfr
omda
ys21
thro
ugh
125
afte
rth
eIP
Oan
dis
mis
sin
gfo
rth
ree
IPO
s.E
xpec
ted
offe
rpr
ocee
dseq
ual
sth
efi
lin
gpr
ice
mu
ltip
lied
byth
en
um
ber
ofsh
ares
offe
red
glob
ally
.Car
ter–
Man
aste
rra
nks
ran
gefr
omon
eto
nin
ean
dar
eba
sed
onth
ere
lati
vepl
acem
ent
ofu
nde
rwri
ter
nam
esin
tom
bsto
ne
ads
(see
Car
ter
and
Man
aste
r(1
990)
).A
dju
sted
Car
ter–
Man
aste
rra
nks
are
obta
ined
from
Jay
Rit
ter’
sw
ebpa
geat
htt
p://b
ear.
cba.
ufl
.edu
/rit
ter/
Ran
k.H
TM
.T
he
NY
SE
/AM
EX
dum
my
take
sa
valu
eof
one
ifth
eIP
Ois
list
edon
the
NY
SE
orA
ME
X,a
nd
zero
oth
erw
ise.
Th
eV
Cdu
mm
yta
kes
ava
lue
ofon
eif
the
IPO
had
ven
ture
capi
tal
back
ing
and
zero
oth
erw
ise.
Poi
sson
regr
essi
ons
are
esti
mat
edw
hen
the
depe
nde
nt
vari
able
isa
cou
nt
(nu
mbe
rof
un
derw
rite
rsan
dn
um
ber
ofco
-man
ager
s).O
LS
regr
essi
ons
are
repo
rted
for
oth
ersy
ndi
cate
mea
sure
s.T
he
t-st
atis
tics
and
z-st
atis
tics
base
don
robu
stst
anda
rder
rors
are
list
edin
pare
nth
eses
belo
wth
eco
effi
cien
ts.A
llre
gres
sion
sh
ave
dum
my
vari
able
sfo
rpr
imar
ytw
o-di
git
SIC
code
sof
28,3
5,36
,38,
48,6
0,73
,87,
and
for
Inte
rnet
stoc
ks.
.01
×L
ogof
Boo
kN
YS
E/
Exp
ecte
dE
xpec
ted
Man
ager
AM
EX
VC
1998
1999
2000
2001
–200
2D
epen
den
tV
aria
bles
Inte
rcep
tP
roce
eds
Pro
ceed
sR
ank
>8
σD
um
my
Du
mm
yD
um
my
Du
mm
yD
um
my
Du
mm
yR
2
Poi
sson
Reg
ress
ion
sN
um
ber
ofu
nde
rwri
ters
1.68
2−0
.005
0.35
2−0
.047
−0.4
94−0
.076
−0.0
54−0
.208
−0.2
52−0
.421
−0.6
670.
1897
(19.
76)
(−1.
25)
(17.
30)
(−1.
34)
(−0.
62)
(−1.
70)
(−1.
81)
(−4.
87)
(−6.
09)
(−8.
20)
(−12
.45)
Nu
mbe
rof
co-m
anag
ers
−1.2
61−0
.002
0.35
70.
351
−0.6
660.
058
0.10
80.
076
0.19
40.
172
0.27
20.
1728
(−13
.12)
(−0.
48)
(14.
96)
(9.0
1)(−
0.91
)(1
.53)
(4.6
5)(1
.87)
(4.7
4)(3
.91)
(5.8
7)
Ord
inar
yL
east
Squ
ares
Reg
ress
ion
sB
ook
man
ager
%0.
721
0.00
3−0
.087
−0.0
550.
492
0.00
6−0
.019
0.01
90.
067
0.11
70.
195
0.35
49u
nde
rwri
tten
(22.
62)
(2.4
8)(−
10.2
9)(−
4.73
)(1
.94)
(0.4
3)(−
2.25
)(1
.39)
(4.8
9)(7
.89)
(10.
91)
Co-
man
ager
s%
0.02
3−0
.002
0.07
10.
084
−0.3
680.
016
0.03
10.
012
0.01
90.
007
−0.0
090.
4410
un
derw
ritt
en(0
.96)
(−2.
42)
(10.
86)
(8.3
9)(−
2.41
)(1
.24)
(4.1
7)(1
.12)
(1.7
2)(0
.61)
(−0.
60)
Her
fin
dah
lIn
dex
0.65
50.
005
−0.0
96−0
.061
0.51
60.
030
−0.0
190.
016
0.04
70.
086
0.13
020.
3870
(19.
05)
(3.3
8)(−
11.2
1)(−
5.20
)(1
.81)
(2.1
1)(−
2.35
)(1
.07)
(3.3
1)(5
.45)
(8.3
8)

The Role of IPO Underwriting Syndicates 457
aftermarket volatility is not associated with larger or less concentrated syn-dicates in any of the five regressions. Thus we find no evidence that largersyndicates handle riskier offers, as predicted by the traditional risk-sharingexplanation for syndicates.
B. Syndicate Participation
In this section, we estimate a probit model to determine the likelihood thatspecific underwriters are included in an IPO syndicate. The effects of offercharacteristics provide additional evidence on the determinants of syndicatestructure, while the relative importance of various underwriter characteris-tics sheds light on the potential functions of syndicate members. In estimatingthe probit model, we use all 1,638 IPOs and include one observation for ev-ery eligible underwriter for each IPO, where the set of eligible underwriters isadjusted for mergers and acquisitions during the sample period. This resultsin approximately 1,000,000 observations. Because the probit model includesmultiple observations for each IPO, standard errors are adjusted to allow forIPO-specific effects. The model assumes that observations for a particular IPOare correlated, while observations across IPOs are independent. We examinetwo alternative dependent variables. The first is set to one if a particular under-writer is included in the IPO syndicate and zero otherwise. The second is set toone if a particular underwriter is included as a co-manager and zero otherwise.The independent variables include offer characteristics, underwriter size andquality measures, geographic characteristics, and measures of relationships be-tween underwriters. These variables and the related results are discussed inmore detail below.
Table III presents results for the probit model. Columns 1–3 list results forsyndicate inclusion and columns 4–6 list results for co-manager inclusion. Themodel is estimated separately for the full sample of IPOs and for the smallestand largest offer size quintiles. Standard errors are listed in parentheses belowthe coefficient estimates. Given the large sample size, it is not surprising thatnearly all of the coefficient estimates are statistically significant at standardlevels. Nevertheless, the significance differs markedly across variables, as il-lustrated by the standard errors. The economic importance of the explanatoryvariables is discussed in more detail below.
The results for offer characteristics and year dummy variables are consistentwith results from the previous section. The year dummy variables indicate thatthe likelihood of being included in a syndicate declines steadily from 1997 to2002, while the likelihood of being included as a co-manager increases duringthis period. The coefficient on offer proceeds is positive and significant in boththe syndicate and co-manager models, suggesting that underwriters are morelikely to be included in a syndicate for larger offers. This result is consistentwith the finding from Table II that larger offers are associated with more syndi-cate members and more co-managers. The coefficient on aftermarket standarddeviation is negative and is generally insignificant. Consistent with our earlierfindings, this suggests that risk sharing is not an important determinant ofsyndicate structure.

458 The Journal of Finance
Table IIIProbit Models for Syndicate and Co-manager Participation
The sample includes 669 underwriters and 1,638 U.S. IPOs issued between January 1997 and June2002, excluding units, rights, investment funds, and REITs. The models include one observationfor each eligible underwriter for each IPO, where the set of eligible underwriters is adjusted formergers and acquisitions among underwriters. In columns 1–3, the dependent variable equalsone if the underwriter is included in the IPO syndicate and zero otherwise. In columns 4–6, thedependent variable equals one if the underwriter is included as a co-manager and zero otherwise.Results are also provided separately for the full sample of IPOs and for small and large IPOs,where small and large are defined as the lowest and highest quintiles of offer size, respectively.Aftermarket standard deviation is estimated using continuously compounded daily returns fromdays 21 through 125 after the IPO and is missing for 3 IPOs. Adjusted Carter–Manaster ranks forunderwriters are taken from Jay Ritter’s web page at http://bear.cba.ufl.edu/ritter/Rank.HTM. Top3 analyst is a dummy variable equal to one if the underwriter employs one of the top three analystsin the IPO’s industry, as ranked by II. Book manager analyst is a dummy variable equal to one ifthe book manager employs one of the top three analysts in the IPO’s industry. Dummy variablesare created to identify underwriters in the same state or an adjacent state to the book manager andin the same state or an adjacent state to the issuer. Participation in the previous ten syndicatesis defined as the proportion of the book manager’s last 10 syndicates in which the underwriterwas included. Participation in the most recent syndicate is a dummy variable equal to one if theunderwriter was included in the book manager’s most recent syndicate. Reciprocal participationin the previous 10 syndicates is defined as the proportion of the underwriter’s last 10 syndicatesin which the book manager was included. Reciprocal participation in the most recent syndicate isa dummy variable equal to one if the book manager was included in the underwriter’s most recentsyndicate. Panel A lists the coefficients from the probit models. Standard errors are adjusted toallow for IPO-specific effects and are listed in parentheses below the coefficients. Panel B listsestimated probabilities based on the probit model coefficients and median offer characteristics.
Panel A: Probit Model Coefficients
Syndicate Participation Co-Manager Participation
All Small Large All Small LargeIPOs IPOs IPOs IPOs IPOs IPOs
Intercept −2.297 −2.849 −2.559 −3.258 −3.431 −3.777(0.046) (0.121) (0.149) (0.054) (0.132) (0.156)
Year 1998 dummy −0.114 −0.064 −0.097 0.031 0.001 0.006(0.023) (0.070) (0.046) (0.020) (0.080) (0.049)
Year 1999 dummy −0.169 −0.199 −0.140 0.080 0.132 0.007(0.022) (0.072) (0.052) (0.021) (0.072) (0.055)
Year 2000 dummy −0.188 −0.254 −0.193 0.121 0.105 0.099(0.025) (0.077) (0.062) (0.023) (0.076) (0.064)
Year 2001–2002 dummy −0.263 −0.442 −0.306 0.207 0.202 0.239(0.032) (0.097) (0.080) (0.027) (0.092) (0.060)
Ln(Offer proceeds) 0.141 0.311 0.199 0.110 0.157 0.186(0.011) (0.049) (0.028) (0.011) (0.047) (0.023)
Aftermarket standarddeviation
−1.039 −0.592 −2.206 −0.077 0.072 −0.006(0.344) (0.746) (0.865) (0.313) (0.694) (0.976)
Carter–Manaster rank ≥ 8 0.103 −0.111 0.325 0.402 0.092 0.755(0.102) (0.041) (0.032) (0.025) (0.069) (0.049)
Regional underwriter −0.491 −0.383 −0.547 −0.442 −0.334 −0.572(0.012) (0.031) (0.025) (0.024) (0.066) (0.046)
Top 3 analyst 0.073 0.086 0.267 −0.002 0.078 0.304(0.033) (0.082) (0.077) (0.043) (0.142) (0.080)
Top 3 analyst × bookmanager analyst
−0.159 −0.220 −0.059 0.192 −0.280 0.110(0.072) (0.246) (0.147) (0.077) (0.526) (0.121)
(continued )

The Role of IPO Underwriting Syndicates 459
Table III—Continued
Panel A: Probit Model Coefficients
Syndicate Participation Co-Manager Participation
All Small Large All Small LargeIPOs IPOs IPOs IPOs IPOs IPOs
Probability of being bookmanager
3.372 3.497 1.601 3.769 3.678 2.954(0.213) (0.671) (0.325) (0.196) (0.615) (0.302)
Book manager’s state −0.025 0.066 −0.056 −0.032 0.025 0.009(0.013) (0.039) (0.026) (0.019) (0.059) (0.047)
Adjacent state to book manager 0.056 0.086 −0.032 −0.069 0.082 −0.152(0.072) (0.038) (0.026) (0.032) (0.066) (0.079)
Issuer state 0.291 0.313 0.232 0.165 0.320 0.155(0.031) (0.078) (0.060) (0.042) (0.102) (0.072)
Adjacent state to issuer 0.172 0.118 0.157 0.116 0.059 0.139(0.017) (0.055) (0.035) (0.029) (0.073) (0.055)
Issuer state × not bookmanager state
0.235 0.154 0.324 0.285 0.177 0.415(0.038) (0.096) (0.075) (0.049) (0.118) (0.100)
Participation in previous 10syndicates
2.340 2.227 2.527 1.153 1.350 1.036(0.052) (0.134) (0.122) (0.048) (0.130) (0.105)
Participation in the most recentsyndicate
0.199 0.321 0.130 0.116 0.113 0.071(0.024) (0.079) (0.046) (0.034) (0.115) (0.066)
Reciprocal participation inprevious 10 syndicates
0.747 0.778 0.652 0.497 0.623 0.459(0.035) (0.097) (0.069) (0.046) (0.140) (0.085)
Reciprocal participation in themost recent syndicate
0.116 0.275 0.094 0.131 0.183 0.153(0.025) (0.079) (0.047) (0.034) (0.122) (0.059)
N 997,868 198,235 197,760 997,868 198,235 197,760Pseudo-R2 0.2944 0.2625 0.3100 0.3027 0.2226 0.4203
Panel B: Estimated Probability of Syndicate Participation Based on Median Offer Characteristics
Syndicate Participation Model Co-Manager Participation Model
Regional National National Regional National NationalUW UW UW UW UW UW
All IPOs All IPOs Lg IPOs All IPOs All IPOs Lg IPOs
Offer year1997 1.10% 3.60% 5.08% 0.05% 0.23% 0.24%1998 0.81 2.79 4.14 0.06 0.26 0.241999 0.70 2.46 3.78 0.07 0.30 0.242000 0.66 2.35 3.36 0.08 0.34 0.322001–2002 0.54 1.96 2.60 0.11 0.44 0.49
Underwriter characteristics (year = 1999)Ranked ≥ 8 0.92% 3.11% 7.32% 0.26% 0.95% 1.96%Top-ranked analyst 0.85 2.90 6.55 0.07 0.30 0.60In issuer’s state 1.51 4.68 6.12 0.12 0.49 0.39In issuer’s state and not
book manager’s state2.67 7.48 11.10 0.31 1.08 1.23
In book manager’s mostrecent synd.
1.19 3.84 4.98 0.11 0.43 0.30
First four effects combined 3.95 10.27 26.46 0.96 2.88 11.75First five effects combined 7.46 17.07 34.27 1.82 4.93 16.78In most recent synd. and
50% of last 1013.78 27.45 35.06 0.63 1.99 1.30
All effects combined andin 50% of last 10syndicates
39.26 58.64 80.46 6.46 14.12 32.81
460 The Journal of Finance
The next variables reflect underwriter characteristics. The coefficient onthe Carter–Manaster rank dummy suggests that prestigious underwriters aremore likely to be included both as syndicate members and co-managers in largeoffers, and as co-managers for small offers. In contrast, the coefficient on theCarter–Manaster rank dummy is negative for small IPOs. This suggests thatlarge prestigious underwriters are unwilling to participate in small IPO syndi-cates. We also find for both small and large offers that regional underwritersare less likely to be included in a syndicate or as a co-manager than are under-writers with a national presence.
To test whether potential analyst coverage is an important determinant ofsyndicate participation, we include in the probit model an indicator of whetheran underwriter employs one of II’s top three analysts for the IPO’s industry.We also interact this variable with a dummy variable that equals one if thebook manager also has a top-rated analyst. As expected, we find that an un-derwriter with a top-ranked analyst is significantly more likely to be includedin an underwriting syndicate and is more likely to be a co-manager. However,comparing the results for small and large IPOs suggests that this effect is sig-nificant only for large IPOs. One explanation is that top-rated analysts tend tobe employed by the largest underwriters and that these underwriters do nottypically participate in small IPOs.
If issuers choose syndicate members from among the potential book man-agers, we would expect a book manager’s main competitors to appear in an IPOsyndicate. To account for this effect, we include in the probit model an estimateof each underwriter’s ex ante probability of being selected as book manager.For each underwriter who leads five or more IPOs, we estimate a probit modelfor the probability of being book manager using the full sample of 1,638 IPOs.The independent variables are offer proceeds, the log of the offer proceeds, af-termarket standard deviation, a dummy variable for whether the underwriteris in the same state as the issuer, a dummy variable for whether the under-writer has one of the top three analysts in the issuer’s industry, and quarterlydummy variables. This estimation results in an estimated probability of be-ing book manager for each underwriter for each IPO. Underwriters who werebook manager for fewer than five IPOs during the sample period are assigneda probability of zero.10
The probability of being selected as the lead is a highly significant determi-nant of whether an underwriter is included in a syndicate. One interpretation ofthis result is that issuing firms often ask the lead underwriter to include in thesyndicate other underwriters who vied for the lead position. In addition, leadprobability is highly correlated with other measures of underwriter size thathave already been shown to be important determinants of syndicate inclusion.
10 We also estimated the probability of being lead including industry and state dummy variables,where industries are defined using the four-digit SIC classification of Fama and French (1997).The conclusions based on this alternative estimation are similar, but the convergence of the leadprobability models is problematic. Since the lead probability estimates are based on all offeringsduring the sample period, our results may suffer from a look-ahead bias. Results for all othervariables are similar if the lead probability estimate is excluded from the model.

The Role of IPO Underwriting Syndicates 461
The information production hypothesis suggests that book managers favorsyndicate members, and particularly co-managers, with a different client basefrom their own. As a test of this hypothesis, we include in the probit modelseveral geographic variables to reflect differences in customer bases betweenunderwriters. The first two dummy variables identify underwriters who arein the same state as the book manager or an adjacent state. The next twovariables identify underwriters who are in the same state as the issuer or anadjacent state. Finally, the fifth variable is an interaction term that identifiesunderwriters who are in the same state as the issuer but in a different statefrom the book manager.11
The results suggest that being in the same state as the book manager de-creases the likelihood of being included in a syndicate. This is consistent withthe information production hypothesis and suggests that underwriters are morelikely to be included in a syndicate if they do not duplicate the customer base ofthe book manager. A much more significant determinant of syndicate inclusionis whether an underwriter is located in the same state as the issuer or in anadjacent state. Underwriters located near an issuer are far more likely to beincluded in the syndicate, especially if the book manager is not based in theissuer’s state. Because local investors may have a preference for investing innearby companies, these results support the hypothesis that underwriters areadded to syndicates to gather information about demand for an IPO. Alterna-tively, the importance of underwriter location may reflect the book manager’sdesire to include syndicate members who can more easily place shares withlocal investors.12
The final four variables in the table are proxies for the strength of relation-ships between the book manager and potential syndicate members. As notedabove, ongoing relationships may serve to mitigate agency problems withinsyndicates when syndicate members are expected to actively participate in ac-quiring information and distributing shares. We define four relationship vari-ables. The first two variables are the proportion of the book manager’s last10 syndicates in which the underwriter participated and a dummy variablethat equals one if the underwriter was included in the book manager’s mostrecent IPO syndicate. The remaining two variables are the proportion of theunderwriter’s last 10 syndicates in which the book manager participated as asyndicate member (reciprocal participation) and a dummy variable for whetherthe book manager was included in the underwriter’s most recent IPO syndicate.
11 We also examined whether the likelihood of syndicate inclusion is affected by an underwriter’sfocus on institutional versus retail clients. We classified underwriters as institutional if they haveat least as many institutional as retail representatives and as retail if they have at least four timesas many retail as institutional representatives. All other underwriters are classified as mixed.After controlling for other factors, we find no evidence that book managers attempt to includeunderwriters with different client bases. This may reflect the inherent difficulty in classifyingunderwriters as retail or institutional. For example, Merrill Lynch and Morgan Stanley Dean Witterare classified as retail, but both have large institutional as well as retail businesses. Alternativeclassification methods do not alter the results.
12 Several recent papers document that investors disproportionately hold stocks of local com-panies (see Coval and Moskowitz (1999), Grinblatt and Keloharju (2001), Huberman (2001), andLoughran and Schultz (2004)).
462 The Journal of Finance
If relationships are an important determinant of syndicate participation, un-derwriters who have previously worked with the book manager should be morelikely to be included in a syndicate.
We find that the single most important determinant of whether an under-writer is included in the syndicate is the proportion of the book manager’sprevious 10 syndicates in which the underwriter participated. Reciprocal rela-tionships, or whether the underwriter included the book manager in its recentsyndicates, are also very important. Notably, excluding the relationship vari-ables from the model decreases the pseudo-R2 in the syndicate participationmodel from 0.294 to 0.153 and in the co-manager model from 0.303 to 0.241.The importance of the relationship variables is consistent with ongoing rela-tionships mitigating agency problems within the syndicate, but may also reflecta broader set of links between underwriters. For example, an underwriter maybe included in a syndicate because it buys research from or clears through thebook manager.
The role of relationships in picking co-managers is somewhat puzzling, sinceunderwriters tell us that co-managers are selected primarily by issuers andthat relationships would therefore seem irrelevant. On the other hand, conver-sations with underwriters also suggest that they discuss potential co-managerswith issuers and may provide advice on which ones would contribute the mostto the syndicate. In this case, relationships would be an important determinantof co-manager roles. In addition, both book managers and co-managers have asort of veto power, since each specifies the fee and share structure needed fortheir participation.
One potential problem with these probit models is that some underwritersmay have entered or exited during the sample period for reasons other thanmergers. As a result, an underwriter could be included in the probit regressionfor a specific IPO although it was not in business at the time. As a robustnesscheck, we reestimated the probit models (not shown) including only those un-derwriters that appeared in syndicates during both the first half of 1997 andthe first half of 2002. The coefficients are almost unchanged, suggesting thatour results are not seriously affected by entry and exit of underwriters. Of par-ticular interest is that the likelihood of being included in a syndicate declinesover time, even for underwriters that participated during the entire sampleperiod. We also estimated the model separately by year. While there are minordifferences year by year, the main results are confirmed.
To get a sense of the economic significance of the explanatory variables, wecalculate the probability that an underwriter is included in a syndicate or is aco-manager using the probit model coefficient estimates and the median val-ues for all variables. We then alter specific variables to see how the probabilityof syndicate participation is affected. Panel B of Table III reports these prob-ability estimates. Results are shown separately for regional and for nationalunderwriters. In addition, we provide separate results for national underwrit-ers based on estimates from the large IPO subsample.
Based on the median offer characteristics, the probability of syndicate par-ticipation for a regional underwriter decreases from 1.1% in 1997 to 0.54% in

The Role of IPO Underwriting Syndicates 463
2001–2002. During this same period, the probability of participation for a na-tional underwriter decreases from 3.6 to 1.96% in the full IPO sample and from5.1 to 2.6% in the large IPO subsample. To compare the effects of other explana-tory variables, we focus on large IPOs from 1999. A national underwriter has a3.8% chance of inclusion in the syndicate of a large IPO in 1999. The likelihoodof inclusion increases to over 26% if the underwriter is based in the issuer’sstate, has a top-ranked analyst, and has a Carter–Manaster rank of at leasteight. What is particularly striking though is that if the underwriter was alsoin the book manager’s previous syndicate and in 50% of the last 10, the prob-ability of inclusion in the syndicate jumps to more than 80%. The conclusionsbased on the co-manager model are similar, though the probability of participa-tion as a co-manager is much lower. Together, the results in Panel B highlightthe economic importance of underwriter quality, analyst coverage, underwriterlocation, and especially relationships among underwriters.
V. Evidence of Underwriter Functions
A. Syndicate Structure and Offer Price Revisions
In this section, we test whether syndicate members produce valuable infor-mation about market demand for IPOs. If the underwriting process successfullyuncovers information during the filing period, we would expect part of this in-formation to be reflected in a change from the expected offer price to the actualoffer price.13 Our proxy for the expected offer price is the midpoint of the initialfiling range, which we henceforth refer to as the filing price. As Table I shows,the median revision from the filing price to the offer price is zero in our sample,suggesting that the filing price is a useful estimate of the expected offer price.
A key to testing how syndicate composition affects information production isto condition on the information that a syndicate could possibly uncover. Ourmeasure of this information is the return from the filing price to the closingprice on the first day of trading. We refer to this measure as the IPO’s totalreturn. We then perform two alternative tests. First, we use probit models totest whether syndicate structure affects the likelihood of positive and nega-tive offer price revisions in response to this information. Second, we use OLSregressions to test whether syndicate structure affects the magnitude of priceadjustments in response to information. As an additional control, we includethe total return on the CRSP equal-weighted market index from the filingdate to the first day of trading. Since this information is publicly available,additional syndicate members should not influence whether or not it is re-flected in offer price revisions.
The probit results for positive price revisions are presented in Panel A ofTable IV. The dependent variable equals one if the offer price is greater than
13 Hanley (1993) compares underpricing for IPOs that are priced above, below, and within thefiling price range and documents that underwriters only partially adjust to information learnedbefore the offering. The result is that underpricing is particularly severe for IPOs whose offer pricesare adjusted upward from the filing range.

464 The Journal of Finance
Table IVSyndicate Structure and Offer Price Revisions
Panels A and B of the table report estimates of probit regressions for the likelihood of offer pricerevisions. Panel C reports OLS regressions where the dependent variable is the percentage changefrom the midpoint of the initial filing price range to the offer price. The sample includes 1,638 U.S.IPOs issued between 1997 and June 2002, excluding units, rights, investment funds, and REITs. InPanel A, the dependent variable takes a value of one if the offer price is greater than the midpointof the initial filing range and zero otherwise. In Panel B, the dependent variable takes a valueof one if the offer price is less than the midpoint of the initial filing range and zero otherwise.Total return >20% is defined as the return from the midpoint of the filing range to the first day’sclosing price, if greater than 20%, and zero otherwise. The # Co-managers ≥ (<) 8 is the numberof co-managers with Carter–Manaster rankings of at least (below) 8. Ranks are obtained from JayRitter’s web page at http://bear.cba.ufl.edu/ritter/Rank.HTM. The Negative total return dummy isdefined as one if the return from the midpoint of the filing range to the first day’s closing priceis zero or negative. Positive (negative) market return is the return on the CRSP equal-weightedindex from the filing date to the offer date if it is positive (negative) and zero otherwise. Expectedoffer proceeds is defined as the number of shares issued globally times the midpoint of the initialfiling price range. The model also includes dummy variables for two-digit SIC codes 28, 35, 36,38, 48, 60, 73, and 87. Heteroskedasticity-consistent z-statistics are reported in parentheses belowthe coefficients in Panels A and B. The t-statistics are reported under coefficients for the OLSregressions in Panel C.
Panel A: Probit Regressions with Upward Price Revision Dependent Variable
Intercept −1.355 −1.243 −1.145 −1.302 −1.422 −1.300 −1.492(−7.77) (−6.89) (−6.26) (−7.37) (−6.12) (−5.50) (−7.34)
Natural log exp. 0.239 0.211 0.186 0.226 0.203 0.174 0.222proceeds (6.09) (5.12) (4.43) (5.65) (3.92) (3.29) (5.17)
Dummy for total 0.962 0.908 0.899 0.964 0.847 0.857 0.914return > 20% (5.53) (6.34) (5.96) (5.49) (5.94) (5.71) (5.14)
Total return 0.747 0.383 0.176 0.956 0.490 0.237 0.941if > 20% (2.93) (1.70) (0.53) (2.81) (2.11) (0.71) (2.70)
Positive market 1.437 1.329 3.266return (1.76) (1.66) (4.39)
Negative total −1.425 −1.419 −1.399 −1.422 −1.489 −1.494 −1.490return dummy (−10.86) (−10.93) (−10.80) (−10.89) (−11.02) (−11.02) (−11.01)
Total Return > 20% TimesNo. of Non-managers −0.010 −0.016
(−0.75) (−1.18)No. of Co-managers 0.297 0.323
(2.84) (2.91)No. of Co-managers ≥ 8 0.359 0.323
(3.33) (2.91)No. of Co-managers < 8 0.124 0.346
(0.94) (2.92)Herfindahl Index −0.762 −0.541
(−1.71) (−1.15)
(continued)
the filing price and zero otherwise. Independent variables include three totalreturn measures: a dummy variable that equals one if the total return is zero ornegative, a dummy variable that equals one if the total return is greater than20%, and the total return itself if it exceeds 20%. We focus on total returns

The Role of IPO Underwriting Syndicates 465
Table IV—Continued
Panel A: Probit Regressions with Upward Price Revision Dependent Variable
Positive Market Return TimesNo. of Non-managers 0.065
(1.60)No. of Co-managers 0.074
(0.31)No. of Co-managers ≥ 8 0.319
(1.30)No. of Co-Managers < 8 0.037
(0.99)Herfindahl Index −2.828
(−1.40)
Pseudo-R2 0.5401 0.5444 0.5429 0.5410 0.5596 0.5593 0.5560
Panel B: Probit Regressions with Downward Price Revision Dependent Variable
Intercept −0.807 −0.382 −0.586 −0.437 −0.378 −0.533 −0.431(−4.51) (−2.02) (−3.02) (−2.48) (−1.99) (−2.81) (−2.44)
Natural log exp. 0.043 −0.067 −0.016 −0.053 −0.068 −0.028 −0.054proceeds (1.06) (−1.51) (−0.36) (−1.30) (−1.52) (−0.64) (−1.33)
Dummy for total −0.972 −0.959 −0.949 −0.960 −0.961 −0.964 −0.959return > 20% (−5.11) (−5.06) (−4.98) (−5.07) (−5.06) (−5.08) (−5.06)
Total return −0.313 −0.314 −0.315 −0.314 −0.313 −0.314 −0.314if > 20% (−1.44) (−1.45) (−1.45) (−1.45) (−1.45) (−1.45) (−1.45)
Negative total 1.709 0.996 1.425 2.352 0.997 1.396 2.349return dummy (16.75) (5.34) (9.62) (16.18) (5.35) (9.51) (16.12)
Negative market 0.009 −0.018 −0.016return (0.21) (−0.24) (−0.34)
Negative Total Return TimesNo. of Non-managers 0.031 0.031
(2.90) (2.87)No. of Co-managers 0.183 0.180
(2.81) (2.74)No. of Co-managers ≥ 8 0.165 0.183
(2.46) (2.74)No. of Co-managers < 8 0.249 0.184
(2.43) (2.61)Herfindahl Index −1.870 −1.857
(−6.40) (−6.32)
Negative Market Return TimesNo. of Non-managers 0.001
(0.44)No. of Co-managers −0.012
(−0.81)No. of Co-managers ≥ 8 −0.002
(−0.24)No. of Co-managers < 8 −0.001
(−0.10)Herfindahl Index 0.064
(0.60)
Pseudo-R2 0.5289 0.5409 0.5342 0.5472 0.5411 0.5331 0.5473
(continued)

466 The Journal of Finance
Table IV—Continued
Panel C: Percentage Price Update Regressions
Intercept 0.013 0.029 0.048 0.009 0.003 0.007 −0.005(0.48) (0.80) (1.44) (0.31) (0.11) (0.28) (−0.18)
Natural log exp. −0.004 −0.008 −0.013 −0.003 −0.001 −0.002 0.001proceeds (−0.54) (−0.85) (−1.52) (−0.37) (−0.17) (−0.36) (0.13)
Dummy for total 0.091 0.053 0.021 0.113 0.095 0.093 0.090return > 20% (7.78) (2.80) (0.82) (6.81) (8.10) (7.94) (7.78)
Total return 0.127 0.125 0.125 0.127 0.120 0.105 0.110if > 20% (13.83) (13.60) (13.68) (13.82) (3.75) (2.66) (5.05)
Negative total −0.174 −0.165 −0.175 −0.200 −0.155 −0.162 −0.203return dummy (−21.78) (−8.55) (−9.21) (−15.67) (−9.07) (−9.00) (−16.04)
Market return 0.001 0.001 0.016 0.000 0.001 0.010 0.001(0.23) (0.36) (1.60) (0.07) (0.19) (1.27) (0.23)
Negative Total Return Dummy TimesNo. of Non-managers −0.001 −0.001
(−0.75) (−1.05)No. of Co-managers −0.001 −0.005
(−0.17) (−0.85)No. of Co-managers ≥ 8 0.003 −0.006
(0.43) (−0.69)No. of Co-managers < 8 −0.003 −0.003
(−0.38) (−0.62)Herfindahl Index 0.083 0.092
(2.52) (2.83)
Return Greater than 20% Dummy TimesNo. of Non-managers −0.001
(−0.81)No. of Co-managers 0.022
(3.01)No. of Co-managers ≥ 8 0.026
(3.74)No. of Co-managers < 8 0.015
(1.25)Herfindahl Index −0.081
(−1.90)
Return Greater than 20% TimesNo. of Non-managers −0.001
(−0.58)No. of Co-managers 0.005
(0.49)No. of Co-managers ≥ 8 0.005
(0.39)No. of Co-managers < 8 0.009
(0.95)Herfindahl Index 0.070
(0.96)
Pseudo-R2 0.6901 0.6930 0.6950 0.6921 0.6914 0.6926 0.6920
The Role of IPO Underwriting Syndicates 467
greater than 20% because some underpricing may be desired and offer pricesmay only be updated if underpricing is revealed to be significantly larger thanexpected. We use a dummy for negative or zero returns because aftermarketsupport by underwriters constrains prices from falling below the offer price(Ruud (1993)). The model also includes several measures of syndicate structureand the natural log of expected offer proceeds, where expected offer proceedsequal offered shares times the filing price.
The first probit regression in Panel A includes only the IPO total returnvariables and the log of expected proceeds. As expected, the coefficient on thedummy for a return greater than 20% is positive and highly significant, as isthe coefficient on the return if it is greater than 20%. Also, as expected, thecoefficient on the negative return dummy is negative and significant. If thetotal return from the filing price is large and positive, the offer price is likelyto be revised upward. If the total return is negative, an upward revision in theoffer price is less likely.
The probit regressions reported in the next three columns of the table in-clude interactions between positive total returns greater than 20% and mea-sures of syndicate structure. The regression with separate interaction termsfor co-managers and non-managing syndicate members reveals that the offerprice is more likely to be revised upward when additional co-managers are in-cluded, but the inclusion of non-managing syndicate members has no effect.Thus, more co-managers make it more likely that information will be incorpo-rated into offer prices. Similarly, when the return variable is interacted with thesyndicate’s Herfindahl Index, the coefficient on the interaction term is nega-tive and marginally significant (z-statistic = −1.71), suggesting that offer pricerevisions are more likely with less-concentrated syndicates.
The last three columns of Table IV report probit regressions including mar-ket return variables. As expected, the coefficient on a positive market returnis positive in each of the three regressions, indicating that a positive returnon the market is associated with upward revisions in the offer price. Evenafter including the market return, however, the coefficient on the interac-tion between the number of co-managers and the positive total IPO returnis positive and statistically significant. With more co-managers, positive in-formation about the value of an IPO is more likely to be reflected in an up-ward revision of the offer price. In contrast, interactions between the largepositive market return and the syndicate structure measures are insignifi-cant in all regressions. Thus, having more syndicate members or more co-managers does not increase the likelihood that publicly available informationleads to an upward revision in the offer price. Overall, the results in Panel Aprovide strong evidence that syndicate structure has a significant impacton the likelihood of positive offer price revisions in response to firm-specificinformation.
Panel B replicates the probit model of Panel A, except that the dependentvariable is now set to one if the IPO offer price is revised downward from themidpoint of the filing range. Here the variables of primary interest are the

468 The Journal of Finance
interactions between the dummy variable for a zero or negative total returnand measures of syndicate size. The results are consistent with but muchstronger than those in Panel A. A negative or zero return is more likely toresult in a downward price revision if there are many syndicate members,and particularly if there are many co-managers. Negative returns are lesslikely to lead to a downward revision if the Herfindahl Index for the IPO ishigh. These results provide strong evidence that larger syndicates, and par-ticularly more co-managers, increase the likelihood that the offer price will berevised downward in response to negative information learned during the filingperiod.
The last three columns of Panel B include market return variables and in-teractions. The results are similar to those for positive price revisions. Thelikelihood that negative market returns lead to a downward price revision isunrelated to syndicate structure. On the other hand, even after controllingfor market returns, a negative total IPO return is more likely to result in adownward price revision if there are more co-managers or if the IPO’s Herfind-ahl Index is small. These results, like those in Panel A, indicate that moreco-managers and a larger syndicate increase the likelihood that firm-specificinformation will be incorporated in offer prices, but do not affect the likelihoodthat IPO prices will reflect public information.
As a robustness check, we reestimated by year the probit models with themost explanatory power in Panels A and B (not shown). In the probit model witha positive price revision as the dependent variable, the interaction term betweena positive total return greater than 20% and the number of co-managers ispositive for each year from 1997 through 2000, and is significant at the 5% levelin 1998 and 1999. For 2001–2002, it is negative and insignificant, perhaps asa result of the smaller number of observations during this period (N = 116)and the lack of IPOs with positive total returns. In the probit regressions witha negative price revision as the dependent variable, the interaction betweenthe negative return dummy and the IPO’s Herfindahl Index is negative andsignificant in 1997, 1998, and 1999. It is negative but insignificant in 2000 and2001–2002.
Given the high correlation between offer size and syndicate size, it is possi-ble that the results in Table IV are partly driven by offer size. As an additionalrobustness check, we therefore reestimate the probit models with the most ex-planatory power, including an interaction between the log of expected proceedsand the total return variables (not shown). In the upward price revision model,the interaction between offer size and positive total return greater than 20% isinsignificant, while the interaction between the number of co-managers and alarge positive return remains positive and significant. Similarly, in the modelfor downward price revisions, the interaction between offer size and the neg-ative total return dummy is insignificant, while the interaction between thenegative return dummy and the Herfindahl Index is negative and significant.We conclude that it is the size of the syndicate, not the size of the offering,that determines whether an offering price will be updated in response to newinformation.

The Role of IPO Underwriting Syndicates 469
Panel C of Table IV examines how syndicate structure affects the magnitudeof offer price revisions rather than the likelihood that a revision occurs. Inthese OLS regressions, the dependent variable is the percentage change fromthe filing price to the offer price. As in prior panels, the regressions include asexplanatory variables a dummy for a total return less than or equal to zero, adummy for total return greater than 20%, and the total return itself if greaterthan 20%. We note that the intercept is close to zero and insignificant in allregressions in Panel C. This suggests that the average offer price revision isclose to zero when the total IPO return is between zero and 20%.
The first regression in Panel C provides results excluding interactions be-tween total returns and syndicate structure. It shows that offering prices de-cline by 17.4% when the total return is negative. If the total return is greaterthan 20%, the offering price is raised by 9.1% plus 12.7% of the total return. Thesecond regression adds interactions between the total return dummies andthe numbers of non-managing and co-managing underwriters. Both of the neg-ative return interactions are insignificant. In contrast, the interaction betweenthe number of co-managers and the dummy for returns greater than 20% ispositive and significant. The coefficients suggest that if the total return ex-ceeds 20%, the offer price is adjusted upward by an additional 2.2% for eachadditional co-manager.
In the next regression, we interact the total return dummy variables withthe number of co-managers ranked below eight and the number ranked eight orhigher. Again, interactions between negative total returns and the co-managercounts are insignificant. The interaction between total return greater than20% and the number of highly ranked co-managers is positive and highly sig-nificant, while the interaction with the number of low-ranked co-managersis positive but insignificant. When the total return is greater than 20%, alarger number of highly ranked co-managers is associated with larger offerprice revisions. This suggests that high-quality co-managers are either betterat producing information, or better able to convey that information to bookmanagers.
The fourth regression includes interactions between the total return dum-mies and the IPO syndicate’s Herfindahl Index. The coefficient on the interac-tion with the negative total return dummy is positive and significant, while thecoefficient on the interaction with total returns greater than 20% is negativeand marginally significant. These findings suggest that offer price revisions inresponse to information tend to be smaller when the IPO is concentrated amongonly a few underwriters.
In the last three regressions in the table, syndicate measures are interactedwith the actual return when greater than 20%, rather than with the dummyvariable for large positive returns. In each case, the coefficient on the interactionis insignificant. It appears that having additional co-managers increases thesize of positive price revisions, but the effect diminishes for the largest totalreturns.
To summarize, the likelihood that an offer price is revised in response tonew information increases when a syndicate is larger and shares are more
470 The Journal of Finance
broadly distributed across underwriters. The size of offer price revisions alsoincreases with syndicate size, particularly if more highly ranked co-managersare included. While market-wide returns do lead to offer price revisions, thelikelihood that this publicly available information results in a price revisionis unaffected by syndicate structure. As noted in Section II, information canbe conveyed to the book manager in two ways; directly through conversationswith the book manager or indirectly through conversations with issuers, whothen use the information in their negotiations with the book manager. It isunclear which is more common. However, our conversations with underwriterssuggest that both methods of information transmission occur. In addition, ourresults for downward price revisions suggest that at least some informationproduction results from co-managers conveying information directly to the bookmanager.
One last potential explanation for the relation between syndicate size andoffer price revisions is in order. It is possible that book managers bring in largersyndicates when a lot of information is revealed during the filing period. Thisexplanation is unlikely to explain our results, however, since co-managers tendto be included in the syndicate from the start of the process. Also, the issuerhas a lot of influence on the number of co-managers, leaving the book managerwith only a limited ability to alter the set of managing underwriters when facedwith a difficult offering.
B. Syndicate Structure and IPO Underpricing
To the extent that larger syndicates increase the likelihood of upward offerprice revisions, they also reduce underpricing. But does syndicate size have anyadditional effect on underpricing after accounting for offer price revisions? Ifco-managers and non-managing syndicate members help to certify an offerings’quality or reduce asymmetric information associated with IPO value, we mightexpect a further reduction in underpricing for larger syndicates with high-quality co-managers.
To examine this possibility, we estimate two-stage least squares (2SLS) re-gressions of underpricing on syndicate characteristics and a set of control vari-ables that have been shown in previous research to affect IPO underpricing.The control variables include expected proceeds, the log of expected proceeds,a dummy variable for lead underwriters with a Carter–Manaster rank of atleast eight, a dummy variable for venture-backed issues, aftermarket stan-dard deviation, and the percentage adjustment from the filing price to the offerprice. We use 2SLS to account for the endogeneity of syndicate size. In the firststage, we regress the number of underwriters (or co-managers) on the indepen-dent variables from the second stage regression as well as a dummy variablefor NYSE/AMEX listing, the number of co-managers (or the Herfindahl In-dex) from the most recent syndicate led by the same book manager, and theprevious syndicate measure interacted with the ratio of offer proceeds in thecurrent and previous issues. The latter two variables control for changes overtime and for underwriter-specific effects. While these variables significantly

The Role of IPO Underwriting Syndicates 471
increase the explanatory power of the regressions, the total number of observa-tions is reduced because we require the book manager to have a prior IPO dur-ing the sample period. The estimated number of underwriters (or co-managers)from the first stage is used as an explanatory variable in the second-stageregression.
Table V provides the regression results. The price adjustment from the filingprice to the offer price is significantly related to the number of co-managers andis also a highly significant predictor of underpricing. However, after adjustingfor price revisions, syndicate composition has no further effect on underpricing.We conclude that syndicate structure has no effect on underpricing beyondthat associated with the adjustment of the offer price. Although not shown,results based on simple OLS regressions and results based on other syndicatecomposition measures provide similar conclusions. Thus, our results indicatethat additional co-managers and larger syndicates may reduce underpricingonly to the extent that their presence increases the likelihood of offer pricerevisions.
The coefficient on price adjustment requires some additional explanation.The positive coefficient on price adjustment seems to suggest that offerings inwhich syndicates make upward price revisions result in higher underpricing.Our interpretation though is that the positive coefficient on price adjustmentreflects the partial adjustment phenomena predicted by book-building theories.In the model of Benveniste and Spindt (1989), offer prices are only partly ad-justed to compensate investors for revealing positive information. As a result,offers with large positive price revisions typically have large initial returns.Hanley (1993) provides empirical support for the model by demonstrating thatinitial returns are highest for stocks with offering prices above the filing pricerange. Viewed in the light of book-building theories, upward price adjustmentoccurs for those IPOs that are later revealed to be the most underpriced whenthe filing price is set. The adjustment itself reduces ex post underpricing whileleaving money on the table for information providers. Thus, while upward priceadjustment typically occurs for the most underpriced IPOs, the greater likeli-hood of a price adjustment with a larger syndicate may result in diminishedunderpricing for these offerings.
C. Syndicates and Aftermarket Services
As noted above, syndicate members may be included to increase aftermarketanalyst coverage or market making. To test whether large underwriting syn-dicates are associated with more market makers, we obtain the first numberof market makers on the CRSP tape following Nasdaq IPOs. For tests of ana-lyst coverage, we obtain the number of analysts listed on I/B/E/S that issuedreports on the issuer within 3 months of the offer date. We then regress thesevariables on the number of underwriters or co-managers in the syndicate andseveral control variables, including offer proceeds, the natural log of proceeds,industry and date dummy variables, underpricing, and aftermarket standarddeviation.
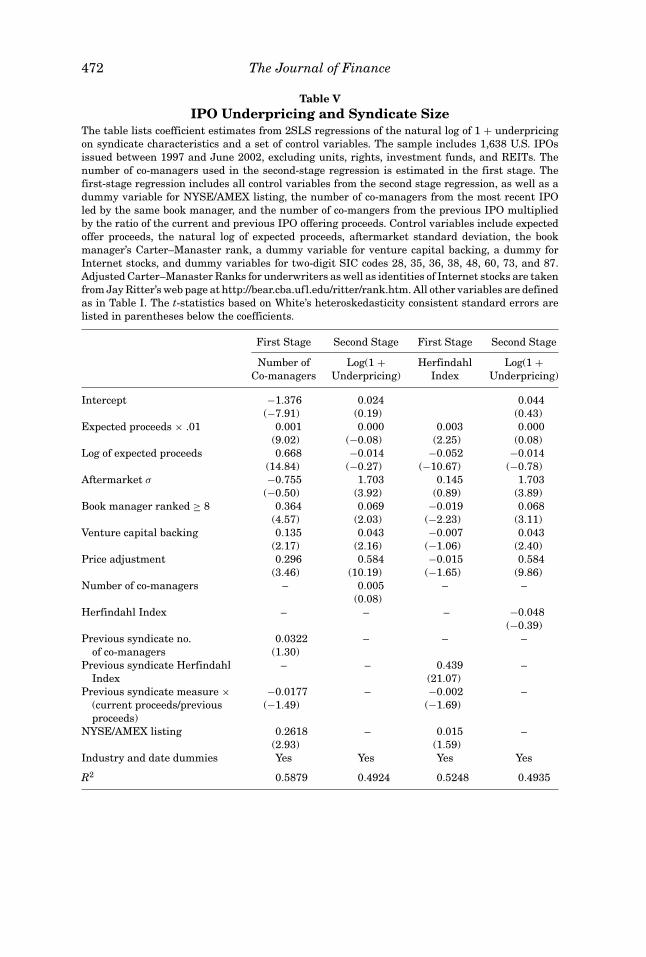
472 The Journal of Finance
Table VIPO Underpricing and Syndicate Size
The table lists coefficient estimates from 2SLS regressions of the natural log of 1 + underpricingon syndicate characteristics and a set of control variables. The sample includes 1,638 U.S. IPOsissued between 1997 and June 2002, excluding units, rights, investment funds, and REITs. Thenumber of co-managers used in the second-stage regression is estimated in the first stage. Thefirst-stage regression includes all control variables from the second stage regression, as well as adummy variable for NYSE/AMEX listing, the number of co-managers from the most recent IPOled by the same book manager, and the number of co-mangers from the previous IPO multipliedby the ratio of the current and previous IPO offering proceeds. Control variables include expectedoffer proceeds, the natural log of expected proceeds, aftermarket standard deviation, the bookmanager’s Carter–Manaster rank, a dummy variable for venture capital backing, a dummy forInternet stocks, and dummy variables for two-digit SIC codes 28, 35, 36, 38, 48, 60, 73, and 87.Adjusted Carter–Manaster Ranks for underwriters as well as identities of Internet stocks are takenfrom Jay Ritter’s web page at http://bear.cba.ufl.edu/ritter/rank.htm. All other variables are definedas in Table I. The t-statistics based on White’s heteroskedasticity consistent standard errors arelisted in parentheses below the coefficients.
First Stage Second Stage First Stage Second Stage
Number of Log(1 + Herfindahl Log(1 +Co-managers Underpricing) Index Underpricing)
Intercept −1.376 0.024 0.044(−7.91) (0.19) (0.43)
Expected proceeds × .01 0.001 0.000 0.003 0.000(9.02) (−0.08) (2.25) (0.08)
Log of expected proceeds 0.668 −0.014 −0.052 −0.014(14.84) (−0.27) (−10.67) (−0.78)
Aftermarket σ −0.755 1.703 0.145 1.703(−0.50) (3.92) (0.89) (3.89)
Book manager ranked ≥ 8 0.364 0.069 −0.019 0.068(4.57) (2.03) (−2.23) (3.11)
Venture capital backing 0.135 0.043 −0.007 0.043(2.17) (2.16) (−1.06) (2.40)
Price adjustment 0.296 0.584 −0.015 0.584(3.46) (10.19) (−1.65) (9.86)
Number of co-managers – 0.005 – –(0.08)
Herfindahl Index – – – −0.048(−0.39)
Previous syndicate no. 0.0322 – – –of co-managers (1.30)
Previous syndicate Herfindahl – – 0.439 –Index (21.07)
Previous syndicate measure × −0.0177 – −0.002 –(current proceeds/previous (−1.49) (−1.69)proceeds)
NYSE/AMEX listing 0.2618 – 0.015 –(2.93) (1.59)
Industry and date dummies Yes Yes Yes Yes
R2 0.5879 0.4924 0.5248 0.4935

The Role of IPO Underwriting Syndicates 473
Table VIAftermarket Services and Syndicate Size
The table lists coefficient estimates from 2SLS regressions of the number of analysts and numberof market makers on measures of syndicate size and a set of control variables. Results are shownbased on both 2SLS and Poisson regressions. The sample includes 1,638 U.S. IPOs issued between1997 and June 2002, excluding units, rights, investment funds, and REITs. The initial number ofmarket makers is obtained from CRSP and is defined only for the 1,338 IPOs listed on Nasdaq. Thenumber of analysts is obtained from I/B/E/S and is defined as the number of unique analysts whoissued reports on the company during the first three months of trading. Aftermarket standard de-viation is estimated using continuously compounded daily returns from days 21 through 125 afterthe IPO and is missing for 3 IPOs. Underpricing is the return from the offer price to the closing priceon the first day of trading. The model also includes dummy variables for each offer year and forindustries defined by two-digit SIC codes 28, 35, 36, 38, 48, 60, 73, and 87. In the 2SLS regressions,the number of underwriters (co-managers) is estimated in a first-stage regression (not shown) us-ing the dependent variables from the second stage, as well as a dummy variable that equals onefor book managers with Carter–Manaster rankings greater than or equal to eight, the number ofunderwriters (co-managers) in the most recent IPO led by the same book manager, and the pre-vious number of underwriters (co-managers) multiplied by the ratio of expected offer proceeds inthe current and previous offers. The first-stage regression for the number of analysts also includesa dummy variable for NYSE/AMEX listing. For OLS regressions, heteroskedasticity-consistentt-statistics are reported in parentheses below the coefficients. For the Poisson regressions,z-statistics are reported.
Number of Market Makers Number of Analysts
2SLS Poisson 2SLS PoissonRegressions Regressions Regressions Regressions
Intercept 0.576 1.413 1.797 1.825 −1.146 −0.236 −0.954 −0.820(0.68) (1.48) (42.29) (44.59) (−4.25) (−0.67) (−10.57) (−7.95)
Log of proceeds 2.750 2.024 0.167 0.143 0.882 0.285 0.416 0.354(11.95) (4.98) (16.38) (12.78) (10.83) (1.90) (20.66) (12.94)
.01 × proceeds 0.532 0.452 0.003 −0.001 0.147 0.036 −0.001 −0.014(5.52) (3.16) (1.14) (−0.13) (4.72) (0.89) (−0.39) (−1.76)
Aftermarket 24.901 26.555 1.119 1.184 1.357 1.935 −0.185 −0.533std. dev. (3.84) (4.14) (3.57) (3.85) (0.58) (0.83) (−0.23) (−0.67)
Underpricing 2.444 2.554 0.087 0.090 0.211 0.297 0.049 0.057(14.40) (15.11) (12.71) (13.25) (3.58) (5.04) (3.20) (3.78)
No. of underwriters −0.022 – −0.000 – −0.006 – 0.002 –(−0.85) (−0.47) (−0.54) (1.03)
No. of co-managers – 1.056 – 0.038 – 0.843 – 0.096(1.97) (4.42) (4.51) (4.17)
Year dummies Yes Yes Yes Yes Yes Yes Yes YesIndustry Yes Yes Yes Yes Yes Yes Yes Yes
dummiesNumber of 1,177 1,177 1,338 1,338 1,425 1,425 1,634 1,634
observations
R2 (pseudo-R2) 0.7771 0.7833 0.3077 0.3097 0.4320 0.4964 0.1565 0.1693
Results for two types of regressions are shown in Table VI. First, we re-port 2SLS regressions, where the first-stage regression is similar to that usedfor the underpricing regression. We also report Poisson regression estimates.These regressions do not adjust for endogeneity, but do explicitly incorporate the

474 The Journal of Finance
discrete nature of the dependent variables as well as the higher residual vari-ance that accompanies a higher predicted number of market makers.
The market-making regressions are shown in the first four columns ofTable VI. In both types of regressions, the number of market makers increaseswith the size of the offer, the amount of underpricing, and aftermarket standarddeviation. After controlling for these effects, the total number of underwriters ina syndicate does not appear to affect the number of market makers. However,the number of co-managers is significantly related to the number of marketmakers. The 2SLS estimates suggest that the number of market makers in-creases approximately one for one with co-managers.
Results for analyst coverage are shown in the last four columns of Table VI.The number of analysts, like the number of market makers, is unaffected by thetotal number of syndicate members, but increases significantly with the numberof co-managers. The 2SLS estimates suggest that each co-manager increasesthe number of analysts by 0.8. The coefficient on the number of co-managers ishighly significant in both regressions.
Overall, the results in Table VI provide strong support for the hypothesisthat including co-managers in a syndicate increases aftermarket analyst cov-erage and market making. This finding is also consistent with our probit modelresults, which suggest that high-quality analyst coverage is an important de-terminant of syndicate participation.
VI. Should Issuers Demand Large Syndicates?
From the standpoint of the issuing firm, our results suggest that a largeunderwriting syndicate, and particularly more co-managers, provide severalbenefits. Additional co-managers lead to increased analyst coverage and moremarket makers. In addition, employing more co-managers results in more ac-curate offer prices and possibly less underpricing if the initial filing price is settoo low. Should issuers demand as many co-managers as possible? A partnerin the law firm of Goodwin Proctor tells us that he advises clients that it isbetter to “have more banks on your cover than fewer” because the total feesare the same regardless of the number of co-managers, while adding managersincreases analyst coverage.
But while it appears that issuers should include as many co-managers as pos-sible, their ability to do so may be limited by several factors. On the one hand,issuers themselves may benefit from limited syndicate size if fees increase withthe number of underwriters in the syndicate. Specifically, lead managers maybe unwilling to increase the number of co-managers without increasing the feesthey charge. On the other hand, underwriters may exert pressure to limit syn-dicate size for reasons that benefit the underwriter but impose potential costson the issuer. First, high-quality underwriters will require a substantial shareallocation in order to participate in a syndicate. Second, lead managers mayseek to limit the number of co-managers in order to diminish competition forfuture underwriting business and reduce the number of underwriters talkingto the issuer during the IPO process. Third, lead managers may only be willing

The Role of IPO Underwriting Syndicates 475
to work with underwriters with whom they have an ongoing relationship, andmay refuse to work with some co-managers altogether. We discuss each of thesefactors in more detail below.
A. Underwriter Spreads
While underwriting fees are almost always set at 7% for U.S. IPOs (see Chenand Ritter (2000)), it may not always be costless for the issuer to include ad-ditional co-managers in the IPO syndicate.14 Because underwriting fees mustbe shared with syndicate members, book managers may be unwilling to addadditional co-managers without charging higher fees. To address this issue,we provide both OLS and 2SLS regressions of underwriter gross spreads on aset of control variables and the number of co-managers in the IPO syndicate.In the 2SLS regressions, the number of co-managers is estimated in a first-stage regression including the control variables from the second-stage, as wellas dummy variables for venture capital backing and NYSE/AMEX listing. Wereport separate results for the full sample of IPOs and for the smallest andlargest offer size quintiles, where spreads are most likely to deviate from thestandard 7%. The results are presented in Table VII.
As expected, underwriter spreads are generally negatively related to offersize and positively related to aftermarket standard deviation. In the full sampleand the large offer subsample, spreads are also negatively related to lead un-derwriter rank. After controlling for these effects, the full sample results showthat underwriter spreads are increasing in the number of co-managers. Thissuggests that it is not always costless to add additional co-managers to the IPOsyndicate. Comparing the small and large IPO subsamples, we see that the pos-itive relation between underwriter spreads and the number of co-managers isdriven by the spreads on small IPOs. One possible explanation for this finding isthat co-managers are more difficult to attract for small IPOs, while underwrit-ers compete more aggressively for positions in large IPO syndicates. Based onthe 2SLS coefficient estimates for the full sample, each additional co-managerresults in a 40 basis point increase in the gross spread.
B. Allocation Requirements
Underwriters, especially high-quality underwriters, will refuse to participateas book managers or co-managers without a sufficiently large allocation. In oursample, the average dollar allocation to underwriters with a Carter–Manasterrank of eight (nine) is $24.2 million ($58.1 million), and these underwritersobtain allocations of at least $3 million ($2.9 million) 99% of the time. Similarly,book managers with Carter–Manaster ranks of nine underwrite an average of$58.5 million per IPO and retain allocations of at least $7.8 million 99% of thetime. For comparison, the median offer size in our sample is $52.3 million.
14 Underwriter gross spreads are exactly 7% in 76.7% of the sample IPOs. For the smallest andlargest offer size quintiles, the percentage is 52.3 and 49.4, respectively.

476 The Journal of Finance
Table VIIUnderwriter Spreads and Syndicate Size
The table lists coefficient estimates from 2SLS regressions of underwriter gross spreads on thenumber of co-managers in the IPO syndicate and a set of control variables. The sample includes1,638 U.S. IPOs issued between 1997 and June 2002, excluding units, rights, investment funds,and REITs. The number of co-managers is estimated in a first-stage regression (not shown) us-ing the independent variables from the second-stage regression, as well as dummy variables forNYSE/AMEX listing and venture capital backing. Expected offer proceeds equals offered sharestimes the midpoint of the initial filing price range. Aftermarket standard deviation is estimatedusing continuously compounded daily returns from days 21 through 125 after the IPO. Lead un-derwriters ranked greater than eight are defined based on adjusted Carter–Manaster ranks. ForOLS regressions, heteroskedasticity-consistent t-statistics are reported in parentheses below thecoefficients.
All IPOs Small IPOs Large IPOs
OLS 2SLS OLS 2SLS OLS 2SLS
Intercept 9.166 9.639 11.710 11.949 10.426 10.988(70.04) (35.18) (31.43) (28.31) (39.63) (13.89)
1998 dummy −0.066 −0.094 −0.139 −0.149 −0.027 −0.033(−1.28) (−1.66) (−0.76) (−0.80) (−0.39) (−0.39)
1999 dummy −0.064 −0.216 −0.218 −0.449 0.056 −0.018(−1.35) (−2.59) (−1.33) (−1.79) (0.92) (−0.17)
2000 dummy 0.045 −0.086 0.078 −0.009 0.275 0.190(0.86) (−1.06) (0.47) (−0.05) (3.46) (1.36)
2001–2002 dummy 0.290 0.032 0.053 0.013 0.308 −0.022(3.93) (0.24) (0.20) (0.05) (2.01) (−0.05)
Exp. offer proceeds × .01 −0.012 −0.051 1.600 0.900 −0.005 −0.016(−2.02) (−1.79) (3.31) (1.35) (−0.73) (−0.85)
Log (exp. proceeds) −0.589 −0.834 −1.706 −1.884 −0.749 −0.928(−18.07) (−6.90) (−11.42) (−9.59) (−12.68) (−3.82)
Aftermarket std. dev. 4.229 3.665 7.562 7.257 2.00 1.506(5.63) (4.05) (2.94) (2.96) (1.73) (0.86)
Lead rank ≥ 8 −0.063 −0.260 −0.034 −0.393 −0.184 −0.304(−1.82) (−2.69) (−0.35) (−1.32) (−1.66) (−1.73)
No. of co-managers 0.010 0.403 0.196 0.758 −0.022 0.166(0.62) (2.35) (3.53) (1.83) (−1.30) (0.74)
N 1,634 1,634 325 325 323 323Adj. R2 0.5735 0.3725 0.5987 0.4961 0.8016 0.6720
To control for offer size and changes over time, we regressed dollar under-writing allocations for managers and co-managers on IPO proceeds, dummyvariables for Carter–Manaster rankings, and year dummy variables. We esti-mate that a co-manager ranked five or lower typically receives an allocationof $4.2 million plus 5.4% of offer proceeds. The coefficients on dummy vari-ables for Carter–Manaster ranks of eight and nine are $7.9 million and $26.6million, respectively, and reflect the additional allocation required by highlyranked underwriters. We estimate that a book manager that is ranked five orlower typically receives an allocation of $4.8 million plus 17.6% of proceeds.

The Role of IPO Underwriting Syndicates 477
The incremental allocation for a book manager who is ranked nine is $7.7 mil-lion. Thus, while issuers may benefit from including additional co-managers intheir IPO syndicates, syndicate size may be limited by the amount of stock theyintend to issue and their choice of book manager.
C. Underwriter Competition
As noted in Section II, competition among underwriters may continuethroughout the IPO process as underwriters work to capture the lead posi-tion in future underwriting business. Although our results suggest that thiscan result in more accurate pricing, it can also lead to disruptions in the IPOprocess because the various investment banks work in their own interests. Asa result, book managers often seek to limit the number of co-managers on anissue. One underwriter we talked to joked that he spends most of his time tryingto keep additional co-managers off the cover.
To examine the importance of underwriter competition more closely, we ana-lyze the likelihood that co-managers in the IPO syndicate are given the lead rolein the issuer’s follow-on offerings. If co-managers provide a significant sourceof competition for the book manager, we would expect their position as co-managers to have a positive impact on their likelihood of being selected to leadfuture offerings. For each IPO firm, we use SDC’s Global New Issues databasefrom January 1997 through June 2003 to identify the first seasoned equity offer(SEO) following the IPO. This search resulted in seasoned offers for 414 IPOfirms. Using this sample, we then estimate a probit model for the likelihood ofbeing selected as the book manager in the follow-on offer. The model includesone observation per SEO per eligible underwriter, where eligible underwritersare defined as all underwriters who were in business at the time of the SEOand managed at least one IPO or SEO during our sample period. As in thesyndicate participation probit model, standard errors are adjusted to allow forIPO-specific effects. Results are reported in Table VIII.
The first column reports estimates based only on offer and underwriter char-acteristics. The results are similar to our IPO probit model. An underwriteris more likely to be an SEO’s book manager if it has a high Carter–Manasterrank, is located in the issuer’s state, and has a top-ranked analyst in the issuer’sindustry. The second probit model incorporates dummy variables for whetheran underwriter was the book manager or a co-manager of the firm’s IPO. Theinclusion of these two variables more than doubles the pseudo-R2 of the pro-bit model. Of particular interest is that even after adjusting for underwriterranking, location, and analyst quality, an underwriter is much more likely tobe a book manager if it was a co-manager in the IPO. To account for joint SEObook managers, the third probit model includes an interaction between an un-derwriter’s status as an IPO co-manager and a dummy variable that equalsone if the IPO book manager is not selected as a book manager of the SEO.The coefficients on the co-manager variable and interaction term indicate that

478 The Journal of Finance
Table VIIIProbit Model for Follow-on Offer Book Manager Selection
The table lists coefficient estimates from probit models of SEO book manager choice. The sampleincludes 414 follow-on offers between January 1997 and June 2003 that involve firms in the IPOsample. The IPO sample includes 1,638 U.S. IPOs issued between January 1997 and June 2002,excluding units, rights, investment funds, and REITs. The models include one observation foreach underwriter that was in business at the time of the SEO and who managed at least oneIPO or SEO during the sample period. The set of eligible underwriters is adjusted for mergersand acquisitions among underwriters. The dependent variable equals one if the underwriter isselected as a book manager in the follow-on offering. Dependent variables are defined as follows.Aftermarket standard deviation is estimated using continuously compounded daily returns fromdays 21 through 125 after the IPO. Adjusted Carter–Manaster ranks for underwriters range fromone to nine and are taken from Jay Ritter’s web page at http://bear.cba.ufl.edu/ritter/Rank.HTM.Top 3 analyst is a dummy variable equal to one if the underwriter employs one of the top threeanalysts in the IPO’s industry, as ranked by II. Issuer state is a dummy variable that equals one ifthe underwriter is in the same state as the issuer. Dummy variables are also included to identifyunderwriters who were either book managers or co-managers in the IPO syndicate and SEOs forwhich the IPO book manager is not selected as a book manager in the SEO. Standard errors areadjusted to allow for IPO-specific effects and are listed in parentheses below the coefficients.
Probit Model Coefficients for SEO Book Manager SelectionIntercept −2.685 −2.770 −2.798
(0.078) (0.125) (0.128)Ln(SEO offer proceeds) −0.015 −0.087 −0.081
(0.010) (0.021) (0.022)Standard deviation −1.699 −1.398 −1.551
(0.390) (0.779) (0.806)Carter–Manaster rank ≥ 8 0.904 0.700 0.713
(0.061) (0.080) (0.080)Regional underwriter −0.454 −0.375 −0.366
(0.065) (0.082) (0.082)Top 3 analyst 0.580 0.320 0.325
(0.050) (0.074) (0.074)Located in issuer state 0.178 0.027 0.040
(0.050) (0.067) (0.069)Book manager in IPO – 3.180 3.177
(0.092) (0.092)Co-manager in IPO – 1.163 0.987
(0.077) (0.087)Co-manager in IPO × lead change – – 0.626
(0.129)Year dummy variables Yes Yes Yes
N 80,362 80,362 80,362Pseudo-R2 0.2690 0.5905 0.6281
a co-manager is particularly likely to become a book manager of an SEO ifthe IPO book manager is dropped. These findings demonstrate that compe-tition between underwriters does not end when one is named book manager.Underwriters may continue to compete during the IPO process in order to earnthe lead position on the more lucrative follow-on offerings.

The Role of IPO Underwriting Syndicates 479
To better understand the economic importance of the variables, we examinedthe estimated probability of being selected book manager of an SEO based onthe probit model coefficients and median offer characteristics (not shown). Anational underwriter located in the same state as the issuer, with a Carter–Manaster rank of eight or greater, and a top-ranked analyst, has a 2.3% chanceof being selected as the SEO book manager. If, in addition, the underwriter wasa co-manager of the IPO, the chance of being selected as a book manager jumpsto 15.6%. Further, if we condition on the IPO book manager being dropped, theprobability that the co-manager is selected to lead the follow-on offer increasesto nearly 35%. Being a co-manager in the IPO puts an underwriter in a goodposition to compete for future underwriting business. As a result, book man-agers may have an incentive to limit the number of co-managers in the IPO. Inaddition to its effects on IPO pricing, this reduction in competition may lead tohigher future underwriting costs for the issuer.
D. Underwriter Relationships
Another factor that may limit the size of IPO syndicates is the importanceof underwriter relationships. Book managers may balk at including an under-writer in a syndicate if they do not have a working relationship. Our probitregressions in Table III show that prior relationships are a critical determi-nant of inclusion in an underwriting syndicate. In this section, we take a closerlook at the role of relationships by examining how often specific pairs of under-writers work together.
Table IX reports the percentage of time that each of the ten underwriters thatmanaged the most IPOs included each of the other nine in their syndicates.Each column corresponds to a book manager and each row corresponds to asyndicate member. So, for example, in the DLJ (fifth) column and the GoldmanSachs (first) row, we see 53.41. This means that Goldman Sachs was includedin 53.41% of the IPO syndicates led by DLJ. For comparison, the last columngives the percentage of all IPOs that included the underwriter as a syndicatemember. As an example, Goldman Sachs is included in 17.87% of all syndicatesduring the sample period.
For each book manager–syndicate member pair, we test whether the fre-quency of syndicate participation differs between offers led by the listed bookmanager and offers led by all other book managers. The large number of bookmanager–syndicate member pairs that occur significantly more or less fre-quently than expected confirms the importance of relationships. Specific ex-amples are illuminating. Goldman Sachs appears in 53.4% of DLJ’s syndicatesbut in less than 9% of Hambrecht and Quist’s and none of Fleet Robertson’ssyndicates. CS First Boston appears in 26.8% of Goldman’s IPO syndicates andin 51.1% of Citigroup Salomon Smith Barney’s syndicates. For Hambrecht andQuist the pattern is just the opposite. They are included in 46.9% of Goldman’sIPO syndicates, but only in 29.4% of Citigroup Salomon’s.
These results confirm the importance of relationships in syndicate formation.Book managers appear with the same syndicate members again and again.

480 The Journal of Finance
Tab
leIX
Boo
kM
anag
er–S
ynd
icat
eM
emb
erF
req
uen
cies
Th
eta
ble
list
sfr
equ
enci
esof
book
man
ager
–syn
dica
tem
embe
rco
mbi
nat
ion
sin
volv
ing
the
top
10bo
okm
anag
ers
inth
esa
mpl
e(b
ased
onth
en
um
ber
ofIP
Os
un
derw
ritt
en).
Fre
quen
cies
are
show
nfo
rth
eto
p10
un
derw
rite
rsan
dar
est
ated
asa
perc
enta
geof
IPO
sta
ken
publ
icby
the
list
edbo
okm
anag
er.
Th
ela
stco
lum
nli
sts
the
perc
enta
ge(n
um
ber)
ofal
lIP
Osy
ndi
cate
sin
wh
ich
the
un
derw
rite
rpa
rtic
ipat
ed.
Pro
port
ion
sar
ead
just
edto
acco
un
tfo
ru
nde
rwri
ters
that
wer
en
otel
igib
lefo
ral
lIP
Osy
ndi
cate
sdu
eto
mer
gers
and
acqu
isit
ion
s.∗∗
∗ ,∗∗
,an
d∗
indi
cate
that
the
freq
uen
cyof
syn
dica
tepa
rtic
ipat
ion
for
apa
rtic
ula
ru
nde
rwri
ter
diff
ers
sign
ific
antl
ybe
twee
nth
eli
sted
book
man
ager
and
all
oth
erbo
okm
anag
ers
atth
e1,
5,an
d10
%le
vels
,res
pect
ivel
y.T
he
sam
ple
incl
ude
s1,
638
U.S
.IP
Os
issu
edbe
twee
nJa
nu
ary
1997
and
Jun
e20
02,e
xclu
din
gu
nit
s,ri
ghts
,in
vest
men
tfu
nds
,an
dR
EIT
s.
Ret
ailB
ook
Man
ager
sIn
stit
uti
onal
Boo
kM
anag
ers
Mix
edB
ook
Man
ager
sC
itig
rou
p%
ofE
ligi
ble
Syn
dica
teG
oldm
anC
SF
irst
Fle
etB
ear
Mor
gan
Mer
rill
Sal
omon
(Tot
alM
embe
rS
ach
sB
osto
nL
ehm
anR
ober
tson
DL
JS
tear
ns
Ham
brec
ht
Sta
nle
yD
WL
ynch
Sm
ith
Bar
ney
Syn
dica
tes)
Gol
dman
Sac
hs
–11
.59∗
∗30
.56∗
∗∗0.
00∗∗
∗53
.41∗
∗∗33
.93∗
∗∗8.
8933
.04∗
∗∗24
.71∗
31.9
1∗∗
17.8
7(4
06)
CS
Fir
stB
osto
n26
.81∗
∗∗–
31.9
4∗∗∗
0.00
∗∗∗
37.5
0∗∗∗
37.5
0∗∗∗
0.00
∗∗∗
27.8
3∗∗∗
30.5
9∗∗∗
51.0
6∗∗∗
17.0
0(3
93)
Leh
man
18.8
4∗21
.01
–6.
25∗∗
∗56
.82∗
∗∗44
.64∗
∗∗28
.89
33.0
4∗28
.24
36.1
7∗25
.61
(473
)F
leet
Rob
erts
on31
.40
44.6
6∗∗∗
34.6
9–
40.9
132
.26
28.5
740
.00
22.8
147
.50∗
∗31
.81
(278
)D
LJ
37.8
230
.70
47.4
6∗∗
15.5
6∗∗∗
–64
.71∗
∗∗51
.11∗
∗39
.22
42.6
541
.67
34.3
5(5
74)
Bea
rS
tear
ns
21.0
1∗23
.19
44.4
4∗∗∗
20.8
367
.05∗
∗∗–
42.2
2∗∗
30.4
331
.76
42.5
5∗∗
28.0
7(5
00)
Ham
brec
ht
46.9
1∗∗
45.7
1∗∗
43.5
941
.18
50.0
0∗∗∗
54.7
6∗∗∗
–42
.11
23.9
129
.41
34.6
1(4
33)
Mor
gan
Sta
nle
yD
W26
.52
13.6
4∗∗∗
29.5
82.
08∗∗
∗48
.19∗
∗∗38
.46∗
∗∗19
.51
–25
.61
42.5
5∗∗∗
22.5
8(4
27)
Mer
rill
Lyn
ch42
.03∗
∗∗28
.99
56.9
4∗∗∗
2.08
∗∗∗
75.0
0∗∗∗
55.3
6∗∗∗
13.3
3∗∗
48.7
0∗∗∗
–46
.81∗
∗∗27
.95
(519
)C
itig
rou
pS
alom
on46
.00∗
∗∗28
.45
36.3
66.
25∗∗
∗82
.46∗
∗∗43
.59∗
45.8
335
.44
38.4
6–
31.4
7S
mit
hB
arn
ey(3
29)
Tot
alof
fers
by(1
38)
(138
)(7
2)(4
8)(8
8)(5
6)(4
5)(1
15)
(85)
(47)
book
man
ager
The Role of IPO Underwriting Syndicates 481
Continuing relationships may serve to limit opportunistic behavior on the partof the book manager. For example, syndicate members may avoid participa-tion in a book manager’s future offers if the book manager cuts back on sellingcredits after the syndicate members have expended time and effort to sell theoffer. Likewise, a syndicate member who talks to the issuer behind the bookmanager’s back or fails to provide market making or analyst coverage follow-ing an IPO may not be included in the book manager’s future syndicates. Ofcourse, relationships in some cases reflect other business linkages between un-derwriters. For example, both Wainright and Cruttenden Roth cleared throughMontgomery Securities and appeared in over 90% of its IPO syndicates duringthe sample period.
VII. Conclusions
In this paper, we use data on more than 1,600 IPOs from 1997 to 2002 totest hypotheses about the role of IPO syndicates. We find strong evidence ofinformation production by syndicate members. In IPOs underwritten by largesyndicates, and particularly by syndicates with a lot of co-managers, the offerprice is more likely to be revised away from the midpoint of the filing price rangein response to information. An obvious explanation for this is that syndicatemembers produce useful information about the market demand for an IPOand convey it to the book manager. Indeed, some underwriters have told usthat they speak to the book manager regularly about demand for an IPO whenthey are in the syndicate. However, information from co-managers may alsobe transferred indirectly through conversations with the issuer. Practitionerstell us that underwriters continue to compete with each other even after thesyndicate has been established. If the book manager prices the offering too low,co-managers will be sure to tell the issuer “we could have gotten a higher price.”Thus, even if the book manager ignores the co-managers, their information maybe passed along through the issuer.
In forming syndicates, relationships are critical. An underwriter is muchmore likely to be included in a syndicate if it has appeared in past syndicatesled by the same book manager. In fact, some underwriters appear in virtuallyevery IPO syndicate led by a particular underwriter. An underwriter is alsomore likely to be included in a syndicate if the book manager received sharesin the underwriter’s recent deals. While some relationships appear to reflectbusiness ties between underwriters, we argue that these ongoing relationshipsserve to minimize free-riding and moral hazard problems in syndicates whenmembers are expected to actively participate in information production and inmarketing the IPO.
Another reason for including underwriters in syndicates is that they performaftermarket services. We find that adding co-managers to an IPO syndicateincreases both the number of market makers and the number of analysts is-suing reports in the aftermarket. In contrast, syndicate members other thanco-managers seem to have little effect on either analyst coverage or market
482 The Journal of Finance
making after controlling for offer characteristics. For large IPOs, we also findthat underwriters who can provide coverage by a top-ranked analyst are morelikely to be included in the syndicate.
Our results suggest that issuers benefit from increasing the number of syn-dicate members and especially the number of co-managers who underwritetheir IPO. However, several factors may limit syndicate size. First, presti-gious book managers and co-managers demand sizeable allocations to partic-ipate in syndicates, so that syndicate size is limited by the amount offeredand the choice of book manager. In addition, we find that co-managers com-pete with the book manager for future underwriting business, giving bookmanagers an additional incentive to limit the number of co-managers. Ourresults also suggest that the set of potential syndicate members may be limitedto those with existing relationships with the book manager. Finally, at leastfor small IPOs, underwriting spreads appear to increase with the number ofco-managers.
Even over our relatively short sample period, syndicates have changed dra-matically. While IPO proceeds increased from 1997 to 2002, syndicates grewsmaller. At the same time, the number of co-managers increased. One explana-tion for this change is that the importance of co-managers in producing informa-tion or providing aftermarket services has increased over time. Alternatively,underwriters have told us that issuers have become more sophisticated andnow demand more co-managers. The changes in syndicate structure over timeprovide an interesting area for future research.
Appendix. Underwriter Name Adjustments Relatedto Mergers and Acquisitions
The table lists merger and acquisition events involving sample under-writers and associated name adjustments applied in the data. The sampleincludes 1,638 IPOs from January 1997 through June 2002. Merger andacquisition events are identified using the Securities Industry Yearbook listof mergers and acquisitions for SIA firms and the publication Mergers &Acquisitions. Announcement and event dates are identified using Lexis/Nexisand the Securities Data Company’s Merger and Acquisition database. Eventsare listed in chronological order, except where multiple events involving thesame firm are grouped together. A more detailed description of the name ad-justments applied to the data is available from the authors at www.nd.edu/∼scorwin.

The Role of IPO Underwriting Syndicates 483
Ap
pen
dix
—C
onti
nu
ed
An
n.D
ate
Eff
.Dat
eT
arge
tN
ame
Acq
uir
erN
ame
New
Nam
eA
ppli
edaf
ter
Eff
ecti
veD
ate
1997
0220
1997
0502
Equ
ity
Sec
uri
ties
Tra
din
gC
o.S
outh
wes
tS
ecu
riti
esG
rou
p,In
c.S
outh
wes
tS
ecu
riti
esG
rou
p19
9702
0519
9705
31M
orga
nS
tan
ley
Gro
up,
Inc.
Dea
nW
itte
rD
isco
ver
&C
o.M
orga
nS
tan
ley
Dea
nW
itte
r19
9706
1219
9707
31F
irst
ofM
ich
igan
Cap
ital
Cor
p.Fa
hn
esto
ckV
iner
Hol
din
gs,I
nc.
Fah
nes
tock
–20
0109
18Jo
seph
thal
Lyo
n&
Ros
sFa
hn
esto
ck&
Co.
Fah
nes
tock
2001
1017
2001
1112
Gra
nd
Ch
arte
rG
rou
p,In
c.Fa
hn
esto
ck&
Co.
Fah
nes
tock
1997
0407
1997
0902
Ale
xB
row
n,I
nc.
Ban
kers
Tru
stN
ewYo
rkC
orp.
BT
Ale
xB
row
n19
9811
3019
9906
04B
anke
rsT
rust
New
York
Cor
p.D
euts
che
Ban
kA
GD
euts
che
Ale
xB
row
n19
9705
1519
9709
02D
illo
nR
ead
&C
o.S
BC
War
burg
(Sw
iss
Ban
kC
orp.
)W
arbu
rgD
illo
nR
ead
1997
1208
1998
0629
Sw
iss
Ban
kC
orp.
(SB
C)
Un
ion
Ban
kof
Sw
itze
rlan
d(U
BS
)U
BS
War
burg
(in
clu
des
War
burg
Dil
lon
Rea
d)–
1998
0828
SB
CW
arbu
rgP
rem
ier
Un
ion
Ban
kof
Sw
itze
rlan
d(U
BS
)U
BS
War
burg
Sec
(Th
aila
nd)
2000
0428
2000
0612
JCB
radf
ord
&C
o.P
ain
eWeb
ber
Gro
up,
Inc.
Pai
neW
ebbe
r20
0007
1220
0011
03P
ain
eWeb
ber
Gro
up,
Inc.
UB
SA
GU
BS
Pai
neW
ebbe
r19
9705
0119
9710
01C
raig
ie,I
nc.
Sou
ther
nN
atl,
Win
ston
-Sal
em,N
CS
outh
ern
Nat
ion
aln
otin
sam
ple
afte
rE
ff.D
ate
–19
9710
02C
raig
ie,I
nc.
BB
&T
Cor
p.,W
inst
on-S
alem
,NC
BB
&T
Cor
p.19
9706
3019
9710
01M
ontg
omer
yS
ecu
riti
es,C
AN
atio
nsB
ank
Cor
p.,C
har
lott
e,N
CN
atio
nsB
ank
Mon
tgom
ery
Sec
uri
ties
1997
0609
1997
1001
Rob
erts
onS
teph
ens
&C
o.B
ankA
mer
ica
Cor
p.B
AR
ober
tson
Ste
phen
s19
9709
1619
9802
02Q
uic
k&
Rei
lly
Gro
up,
Inc.
Fle
etF
inan
cial
Gro
up
Inc.
,MA
Fle
etF
inan
cial
1998
0529
1998
0901
Rob
erts
onS
teph
ens
&C
o.B
ankB
osto
nC
orp.
,Bos
ton
,MA
Ban
kB
osto
nR
ober
tson
Ste
phen
s19
9804
1319
9809
30B
ankA
mer
ica
Cor
p.N
atio
nsB
ank
Cor
p.,C
har
lott
e,N
CB
ank
ofA
mer
ica
1999
0314
1999
1001
Ban
kBos
ton
Cor
p.,B
osto
n,M
AF
leet
Fin
anci
alG
rou
pIn
c.,M
AF
leet
Rob
erts
onS
teph
ens
1997
0828
1997
1008
Fu
rman
Sel
zL
LC
ING
Bar
ings
(IN
GG
roep
NV
)IN
GB
arin
gsF
urm
anS
elz
2001
0130
2001
0430
ING
Bar
ing-
US
Ope
rati
ons
AB
N-A
MR
OH
oldi
ng
NV
AB
N-A
MR
O19
9707
2219
9711
03O
ppen
hei
mer
(Opp
enh
eim
erG
rou
p)C
IBC
Woo
dG
un
dyS
ecu
riti
es,I
nc.
CIB
CW
orld
Mar
kets
1997
1119
1997
1120
Ham
psh
ire
Sec
uri
ties
Cor
p.G
run
tal&
Co.
,In
c.G
run
tal&
Co.
,In
c.19
9709
2419
9711
28S
alom
on,I
nc.
Tra
vele
rsG
rou
p,In
c.S
alom
onS
mit
hB
arn
ey19
9804
0619
9810
08C
itic
orp
Tra
vele
rsG
rou
p,In
c.S
alom
onS
mit
hB
arn
ey20
0001
1820
0005
01S
chro
ders
—W
orld
wid
eIn
vest
men
tS
alom
onS
mit
hB
arn
eyH
oldi
ngs
Sal
omon
Sm
ith
Bar
ney
1997
0925
1998
0102
Equ
itab
leS
ecu
riti
esC
orp.
Su
nT
rust
Ban
ksIn
c.,A
tlan
ta,G
AS
un
Tru
stE
quit
able
Sec
uri
ties
2001
0514
2001
0727
Rob
inso
n-H
um
phre
y(f
rom
Cit
igro
up)
Su
nT
rust
Ban
ksIn
c.,A
tlan
ta,G
AS
un
Tru
stR
obin
son
-Hu
mph
rey
(con
tin
ued
)

484 The Journal of FinanceA
pp
end
ix—
Con
tin
ued
An
n.D
ate
Eff
.Dat
eT
arge
tN
ame
Acq
uir
erN
ame
New
Nam
eA
ppli
edaf
ter
Eff
ecti
veD
ate
1997
1112
1998
0105
Ern
st&
Co.
(In
vest
ecB
ank
Ltd
.)In
vest
ecB
ank
(In
vest
ecH
ldgs
)In
vest
ecE
rnst
&C
o.–
2001
0410
PM
GG
rou
pIn
vest
ecU
SA
Hol
din
gsIn
vest
ecE
rnst
&C
o.–
1999
1101
Roy
ceIn
vest
men
tG
rou
pIn
vest
ecE
rnst
&C
o.In
vest
ecE
rnst
&C
o.20
0101
0920
0102
08H
erzo
gH
ein
eG
edu
ld-R
etai
lIn
vest
ecE
rnst
&C
o.In
vest
ecE
rnst
&C
o.19
9712
1219
9801
09P
rin
cipa
lFin
anci
alS
ecu
riti
esE
vere
nC
apit
alC
orp.
Eve
ren
Cap
ital
1997
0819
1998
0202
Wh
eat
Fir
stB
utc
her
Sin
ger
Fir
stU
nio
nC
orp.
,Ch
arlo
tte,
NC
Fir
stU
nio
n19
9904
2619
9910
01E
vere
nC
apit
alC
orp.
Fir
stU
nio
nC
orp.
,Ch
arlo
tte,
NC
Fir
stU
nio
n20
0104
1620
0109
04F
irst
Un
ion
Wac
hov
iaW
ach
ovia
Cor
p.–
1998
0102
Rau
sch
erP
ierc
eR
efsn
esD
ain
Bos
wor
thD
ain
Rau
sch
er19
9802
0919
9804
06W
esse
lsA
rnol
d&
Hen
ders
onL
LC
Dai
nR
ausc
her
Cor
p.D
ain
Rau
sch
erW
esse
ls20
0009
2820
0101
10D
ain
Rau
sch
erC
orp.
Roy
alB
ank
ofC
anad
aD
ain
Rau
sch
erW
esse
ls19
9712
1819
9801
21B
arcl
ays
deZ
oete
Wed
dA
UL
td.
AB
N-A
MR
OH
oldi
ng
NV
AB
N-A
MR
O–
1998
0217
Jen
sen
Sec
uri
ties
Co.
DA
Dav
idso
n&
Co
(DA
DC
OIn
c.)
DA
Dav
idso
n19
9712
1519
9805
01P
iper
Jaff
ray
Com
pan
ies
US
Ban
corp
,Min
nea
poli
s,M
NU
SB
anco
rpP
iper
Jaff
rey
1998
0903
1999
0104
Lib
raIn
vest
men
ts,I
nc.
US
Ban
corp
,Min
nea
poli
s,M
NU
SB
anco
rpP
iper
Jaff
rey
1997
1117
1998
0511
Ron
ey&
Co.
,Det
roit
,MI
Fir
stC
hic
ago
NB
DC
orp.
Fir
stC
hic
ago
1998
0413
1998
1002
Fir
stC
hic
ago
NB
DC
orp.
BA
NC
ON
EC
orp.
,Col
um
bus,
OH
Ron
eyC
apit
alM
arke
ts(B
anc
On
e)19
9904
1419
9906
14R
oney
&C
o.,D
etro
it,M
IR
aym
ond
Jam
esF
inan
cial
,In
c.R
aym
ond
Jam
es19
9712
2319
9806
12O
hio
Co.
Fif
thT
hir
dB
anco
rp,C
inci
nn
ati
Fif
thT
hir
dB
anco
rp19
9802
2319
9806
30C
owen
&C
o.S
ocie
teG
ener
ale
Sec
uri
ties
SG
Cow
en19
9806
2219
9808
27M
idla
nd
Wal
wyn
,In
c.M
erri
llL
ynch
&C
o.,I
nc.
Mer
rill
Lyn
ch19
9806
2919
9809
08E
ssex
Cap
ital
Mar
kets
,In
c.M
cDon
ald
&C
oIn
vest
men
ts,I
nc.
McD
onal
d&
Co.
1998
0612
1998
1026
McD
onal
d&
Co
Inve
stm
ents
,In
c.K
eyC
orp,
Cle
vela
nd,
OH
Key
Cor
p19
9809
2319
9902
16V
anK
aspe
r&
Co.
Fir
stS
ecu
rity
Cor
p.,U
tah
Fir
stS
ecu
rity
Van
Kas
per
2000
0125
2000
0428
Bla
ck&
Co.
,In
c.F
irst
Sec
uri
tyV
anK
aspe
r&
Co.
Fir
stS
ecu
rity
Van
Kas
per
2000
0410
2000
1026
Fir
stS
ecu
rity
Cor
p.,U
tah
Wel
lsFa
rgo
&C
o.,C
alif
orn
iaW
ells
Farg
o19
9808
1019
9903
26S
cott
&S
trin
gfel
low
Fin
anci
alB
B&
TC
orp.
,Win
ston
-Sal
em,N
CB
B&
T19
9810
2719
9904
01In
ters
tate
/Joh
nso
nL
ane,
Inc.
Wac
hov
iaC
orp.
,Win
ston
-Sal
em,N
CW
ach
ovia
1999
0609
1999
0731
Vec
tor
Sec
uri
ties
Intl
,In
c.P
rude
nti
alS
ecu
riti
es,I
nc.
Pru
den
tial
Vec
tor
Hea
lth
care
–19
9912
13V
olpe
Bro
wn
Wh
elan
&C
o.P
rude
nti
alS
ecu
riti
es,I
nc.
Pru
den
tial
Vol
pe19
9904
1619
9908
13B
utl
erW
ick
Cor
p.U
nit
edC
omm
un
ity
Fin
anci
alC
orp.
Un
ited
Com
mu
nit
yF
inan
cial
Cor
p.

The Role of IPO Underwriting Syndicates 485
1999
0325
1999
0830
Fec
hto
r,D
etw
iler
&C
o.,I
nc.
JMC
Gro
up
JMC
Gro
up
1999
0928
1999
1210
Ham
brec
ht
&Q
uis
tG
rou
p,In
c.C
has
eM
anh
atta
nC
orp.
,NY
Ch
ase
H&
Q20
0009
1320
0012
31JP
Mor
gan
&C
o.,I
nc.
Ch
ase
Man
hat
tan
Cor
p.,N
YJP
Mor
gan
Ch
ase
1999
1214
2000
0112
Han
ifen
Imh
off
Hol
din
g,In
c.S
tife
lFin
anci
alC
orp.
Sti
felF
inan
cial
Cor
p.19
9911
0120
0001
31S
oun
dvie
wT
ech
nol
ogy
Gro
up
Wit
Cap
ital
Gro
up,
Inc.
Wit
Sou
ndv
iew
1999
1013
2000
0131
San
ders
Mor
ris
Mu
ndy
Har
ris
Web
b&
Gar
riso
n,I
nc.
San
ders
Mor
ris
Har
ris
2000
0627
2000
0630
Bla
ckfo
rdS
ecu
riti
esP
inn
acle
Glo
balG
rou
p,In
c.S
ande
rsM
orri
sH
arri
s19
9911
1020
0002
01P
arib
asS
A(B
NP
)B
NP
BN
PP
arib
as19
9909
2820
0003
16R
agen
Mac
Ken
zie
Gro
up,
Inc.
Wel
lsFa
rgo
&C
o.,C
alif
orn
iaW
ells
Farg
o20
0006
0520
0007
12H
erzo
gH
ein
eG
edu
ldM
erri
llL
ynch
&C
o.,I
nc.
Mer
rill
Lyn
ch20
0009
1420
0010
03B
ran
chC
abel
l&C
o.,I
nc.
Tu
cker
An
thon
yS
utr
oT
uck
erA
nth
ony
(Tu
cker
An
thon
yS
utr
oaf
ter
6/1/
01)
2001
0801
2001
1101
Tu
cker
An
thon
yS
utr
oR
oyal
Ban
kof
Can
ada
RB
CC
apit
alM
arke
ts20
0008
3020
0011
03D
onal
dson
Lu
fkin
&Je
nre
tte
Cre
dit
Su
isse
Fir
stB
osto
nC
redi
tS
uis
seF
irst
Bos
ton
2000
0926
2000
1115
Edg
arM
Nor
ris
&C
o.,I
nc.
BB
&T
Cor
p.,W
inst
on-S
alem
,NC
BB
&T
Cor
p.20
0009
1820
0101
05W
asse
rste
inP
erel
laG
rou
p,In
c.D
resd
ner
Ban
kA
GD
resd
ner
–20
0103
21Q
uar
terd
eck
Inve
stm
ent
Jeff
erie
s&
Co.
(Jef
feri
esG
rou
p)Je
ffer
ies
2001
1009
2001
1203
Leb
enth
al&
Co.
,In
c.M
ON
YG
rou
p,In
c.M
ON
YG
rou
p20
0204
2220
0204
29G
MS
Gro
up
(fro
mG
run
tal&
Co.
)R
yan
Bec
k&
Co.
Rya
nB
eck
2002
0208
2002
0619
Pu
tnam
Lov
ellG
rou
p,In
c.N
atio
nal
Ban
kF
inan
cial
Inc.
Nat
ion
alB
ank
ofC
anad
a(a
un
itof
Nat
ion
alB
ank
ofC
anad
a)19
9703
2119
9703
21V
olpe
Bro
wn
Wh
elan
&C
o.C
redi
tS
uis
seF
irst
Bos
ton
Ltd
.V
olpe
Bro
wn
&W
hel
an(s
till
ase
para
teu
nit
)

486 The Journal of Finance
REFERENCESBalvers, Ronald J., Bill McDonald, and Robert E. Miller, 1988, Underpricing new issues and the
choice of auditor as a signal of investment banker reputation, Accounting Review 63, 605–622.Barzel, Yoram, Michel Habib, and D. Bruce Johnsen, 2000, IPO syndicates, private foreknowledge,
and the economics of excess search, Working paper, George Mason University School of Law.Beatty, Randolph P., 1989, Auditor reputation and the pricing of initial public offerings, Accounting
Review 64, 693–709.Beatty, Randolph P., and Jay Ritter, 1986, Investment banking, reputation, and the underpricing
of initial public offerings, Journal of Financial Economics 15, 213–232.Beatty, Randolph P., and Ivo Welch, 1996, Issuer expenses and legal liability in initial public
offerings, Journal of Law and Economics 39, 545–601.Benveniste, Lawrence, and Paul Spindt, 1989, How investment bankers determine the offer price
and allocation of new issues, Journal of Financial Economics 24, 343–361.Booth, James R., and Richard Smith, 1986, Capital raising, underwriting and the certification
hypothesis, Journal of Financial Economics 15, 261–281.Cable, Stuart, 2001, Top ten to-do’s for CEOs of the next new thing, IPO Journal 4(11), 11–13.Carter, Richard, and Steven Manaster, 1990, Initial public offerings and underwriter reputation,
Journal of Finance 45, 1045–1067.Carter, Richard, Frederick H. Dark, and Ajai K. Singh, 1998, Underwriter reputation, initial re-
turns, and the long-run performance of IPO stocks, Journal of Finance 53, 285–311.Chen, Hsuan-Chi, and Jay Ritter, 2000, The seven % solution, Journal of Finance 55, 1105–1131.Coval, Joshua, and Tobias Moskowitz, 1999, Home bias at home: Local equity preference in domestic
portfolios, Journal of Finance 54, 2045–2073.Ellis, Katrina, Roni Michaely, and Maureen O’Hara, 2000, When the underwriter is the market
maker: An examination of trading in the IPO aftermarket, Journal of Finance 55, 1039–1074.Fama, Eugene F., and Kenneth French, 1997, Industry costs of equity, Journal of Financial Eco-
nomics 43, 153–193.Grinblatt, Mark, and Matti Keloharju, 2001, How distance, language and culture influence stock-
holdings and trades, Journal of Finance 56, 1053–1073.Hanley, Kathleen, 1993, The underpricing of initial public offerings and the partial adjustment
phenomenon, Journal of Financial Economics 34, 231–150Huberman, Gur, 2001, Familiarity breeds investment, Review of Financial Studies 14, 659–680.Krigman, Laurie, Wayne Shaw, and Kent Womack, 2001, Why do firms switch underwriters? Jour-
nal of Financial Economics 60, 245–284.Ljungqvist, Alexander, and William Wilhelm, 2003, IPO pricing in the dot-com bubble, Journal of
Finance 58, 723–752.Loughran, Tim, and Jay Ritter, 2002, Why has IPO underpricing changed over time? Working
paper, University of Florida and University of Notre Dame.Loughran, Tim, and Paul Schultz, 2004, Weather, stock returns, and the impact of localized trading
behavior, Journal of Financial and Quantitative Analysis 39, 343–364.Mergers and Acquisitions, 1997–2002 (Mergers and Acquisitions Inc., New York, NY).Pichler, Pegaret, and William Wilhelm, 2001, A theory of the syndicate: Form follows function,
Journal of Finance 56, 2237–2264.Rock, Kevin, 1986, Why new issues are underpriced, Journal of Financial Economics 15, 187–212.Ruud, Judith, 1993, Underwriter price support and the IPO underpricing puzzle, Journal of Fi-
nancial Economics 34, 135–151.Schultz, Paul, and Mir Zaman, 1994, Aftermarket support and underpricing of initial public offer-
ings, Journal of Financial Economics 35, 199–219.Securities Industry Association, Securities Industry Yearbook, 1995–2002, New York, NY.Securities Industry Association, 2003, in John C. Burch, Jr. and Bruce S. Foerster, eds. Capital
Markets Handbook, 4th edition (Aspen Publishers, New York, NY).Titman, Sheridan, and Brett Trueman, 1986, Information quality and the valuation of new issues,
Journal of Accounting and Economics 8, 159–172.