the role of lmo4 in t cell acute lymphoblastic leukaemia
TRANSCRIPT

The role of LMO4 in T cell acute lymphoblastic leukaemia
by
Eleni Georgiades
A thesis submitted to the University of Birmingham for the degree of MRes in Cancer Sciences.
Supervisor: Dr. Maarten Hoogenkamp Co-supervisor: Dr.Vesna Stanulovic
School of Cancer Sciences Institute for Biomedical Research University of Birmingham August 2014

University of Birmingham Research Archive
e-theses repository This unpublished thesis/dissertation is copyright of the author and/or third parties. The intellectual property rights of the author or third parties in respect of this work are as defined by The Copyright Designs and Patents Act 1988 or as modified by any successor legislation. Any use made of information contained in this thesis/dissertation must be in accordance with that legislation and must be properly acknowledged. Further distribution or reproduction in any format is prohibited without the permission of the copyright holder.

ABSTRACT
The combination of chemotherapy regimens has markedly improved the survival rates of patients
suffering with T-cell acute lymphoblastic leukaemia (T-ALL). Nevertheless, there are still patients with
poor prognoses, particularly for those experiencing a relapse of the disease. Early T-cell precursor
ALL (ETP-ALL) is a subtype of T-ALL with such a poor prognosis and has an immature
immunophenotype with a gene expression signature similar to ETPs. The LIM-only 4 (LMO4) protein
has recently been found to be overexpressed in this subgroup, where it is supposed to play a critical
role in early T-cell development. However, overexpression of other LMO family members such as
LMO1 and LMO2 was suggested to displace LMO4 from a DNA-binding complex and thus deregulate
the normal T-cell maturation process. To address the role of LMO4 in T-cell maturation we first
sought to determine its presence in ETP-ALL cell lines and to identify potential interacting partners
that could be present in the same transcriptional complex. We also performed LMO4 gene silencing
experiments in order to investigate if it is indeed fundamental for T-cell maturation and survival
processes. This research allowed us to characterise two cell lines that can serve as a model for ETP-
ALL and provided us with a better insight into the role of the LMO proteins in this type of leukaemia.
The presence of LMO4 during ETP maturation process indicates that it could be directly involved
during the onset of ETP-ALL.

ACKNOWLEDGEMENTS
I would first like to thank my laboratory supervisors Dr.Maarten Hoogenkamp and Dr.Vesna
Stanulovic and my module leader Dr. Roger Watson for their strong support, encouragement and
advice. Dr. A.W. Langerak, Erasmus Medical Centre, Rotterdam, The Netherlands for providing the
cell lines and Dr. Ashley Martin from the Mass spectrometry Proteomic Facility for running and
analysing my samples. Finally, I am very grateful to my family and boyfriend for their love and
support throughout this current year.
AIMS
The purpose of this project was to investigate the role of the LMO4 protein in T-ALL and more
specifically in immature T-ALL cases. To achieve this, we first had to examine whether this protein
was present in our ETP-ALL cell lines. We also wanted to determine whether it was present in the
transcriptional complex comprising Ldb1 and whether it was indeed displaced from the complex by
LMO2 overexpression. Finally, silencing of the LMO4 gene would allow us to assess its involvement in
T-cell development and check whether it is a critical factor for the survival of the immature T-cell
lineages.

TABLE OF CONTENTS INTRODUCTION ....................................................................................................................................... 1
T-lymphocyte development ................................................................................................................ 1
Genetic rearrangements during lymphopoiesis induce T-ALL ............................................................ 8
Investigating the role of the LMO proteins in T-ALL ........................................................................... 9
Characterization of LMO2 ................................................................................................................. 11
Characterization of LMO4 ................................................................................................................. 13
MATERIALS AND METHODS .................................................................................................................. 16
Cell culture ........................................................................................................................................ 16
RNA isolation and cDNA synthesis .................................................................................................... 16
Quantitative PCR ............................................................................................................................... 16
Whole cell and nuclear extract preparation ..................................................................................... 17
Protein pull down assays and mass spectrometry ............................................................................ 18
Immunoprecipitation .................................................................................................................... 18
Mass spectrometry ........................................................................................................................ 19
siRNA electroporation ....................................................................................................................... 19
Flow cytometry ................................................................................................................................. 20
Single-cell sorting .............................................................................................................................. 20
RESULTS ................................................................................................................................................. 21
T-ALL cell lines ................................................................................................................................... 21
CD3 expression on T-ALL cells ........................................................................................................... 22
Exponential growth of the cell lines .................................................................................................. 23
Relative mRNA and protein expression ............................................................................................ 25
Ldb1 pull-down and mass spectrometry analysis ............................................................................. 27
LMO4 gene silencing in ARR and DU.528 cells .................................................................................. 32
DISCUSSION ........................................................................................................................................... 36
Phenotypical analysis of utilised cell lines ........................................................................................ 37
Expression of LMO proteins and functionally related transcription factors ..................................... 38
Identification of new interacting partners of Ldb1 ........................................................................... 43
LMO4 knockdown using siRNA transfection ..................................................................................... 46
LIST OF REFERENCES ............................................................................................................................. 52
LIST OF ILLUSTRATIONS
Figure 1.1 .T-cell developmental stages (Michael Litt et al., 2013).
Figure 1.2. Regulatory factors in early T-cell development (Michael Litt et al., 2013).
Figure 1.3. Diagrammatic respresentation of LMO2 protein structure and transcription complex (Nam
CH, Rabbitts TH, 2006).
Figure 2.1. Flow cytometry analysis of CD3 expression.
Figure 2.2. Exponential growth of the T-ALL cell lines.
Figure 2.3. Relative mRNA and protein expression in the four T-ALL cell lines.
Figure 2.4. A) Immunoprecipitation of Ldb1 shows LMO2-Ldb1 interaction in the four cell lines.
B) Ldb1 pulled down proteins.
Figure 2.5. LMO4 gene silencing in the ARR cell line.
LIST OF TABLES
Table 1.1. Recurring translocations in T-ALL (Michael Litt et al., (2013).
Table 2.1. Forward and reverse primers.
Table 3.1. 30 human T-cell lines (Sandberg et al., 2007).

LIST OF ABBREVIATIONS
AKT1: RAC-alpha serine/threonine-protein kinase
bHLH: basic helix-loop-helix
BMP: Bone morphogenic protein
BRCA1: Breast cancer type 1
C/EBPα: CCAAT-enhancer binding protein α
CBFβ: Core-binding factor beta subunit
CHIP: C terminus of HSC70-Interacting protein
CLP: Common lymphoid progenitor
CtIP: CtBP interacting protein
Cy5: Cyanine 5
DC: Dentritic cell
DLL4: Delta-like ligand 4
DN: Double negative
DP: Double positive
DSB: Double-strand break
ELISA: Enzyme-linked immunosorbent assay
ETP: Early thymic progenitor
ETP-ALL: Early T-cell precursor acute lymphoblastic leukaemia
FACS: Fluorescence-activated cell sorting
GATA: GATA sequence-binding factor
GFI1: Zinc-finger repressor growth factor independence 1
GFP: Green Fluorescent Protein
GM-CSF: Granulocyte-macrophage colony-stimulating factor
H2AFV: H2A histone family member V

HDAC1: Histone deacetylase 1
Hes1: Hairy and enhancer of split 1
Hhex: Haematopoietically-expressed homeobox protein
hnRNP: heterogeneous ribonucleoprotein particles
HNRNPA1: Heterogeneous nuclear ribonucleoprotein A1
HNRNPC: Heterogeneous nuclear ribonucleoprotein C
HSC: Haematopoietic Stem Cell
HSPA9: Heat shock protein 9
Ig: Immunoglobulin
IL-3: Interleukin-3
IL-7: Interleukin-7
KHDRBS1: KH domain containing RNA binding signal transduction associated 1
LCK: Lymphocyte specific protein tyrosine kinase
Ldb1: LIM domain binding protein 1
LGALS1: Lectin galactoside-binding soluble 1
LIM: Linl-1, Isl-1 and Mec-3
LMO: LIM-only
LRF: Leukaemia/lymphoma related factor
Lyl1: Lymphoblastic leukaemia derived sequence 1
MHC: Major histocompatibility complex
MINT: MSX2-interacting protein
MPP: Multipotent progenitor
MYB: Myeloblastosis proto-oncogene
NHEJ: Non-homologous end joining
NK: Natural killer cell
PPP1CA: Protein phosphatase 1 catalytic subunit alpha isoform

PRKDC: Protein kinase DNA-activated catalytic polypeptide
q-PCR: Quantitative polymerase chain reaction
RAG: Recombination activating gene
RUNX-CBFβ: Acute myelogenous leukaemia factor-core binding factor β
Sca-1: Stem cell antigen-1
SCF: Skp, cullin, F-box containing complex
SCL: Stem cell leukaemia
SF3B1: Splicing factor 3b, subunit 1
Shh: Sonic hedgehog
shRNA: small hairpin RNA
SIL: SCL interrupting locus
siRNA: small interfering RNA
Skp2: S-phase kinase-associated enzyme
SP: Single positive
STRING: Search Tool for the Retrieval of Interacting Genes/Proteins
TAL1: T-cell acute lymphoblastic leukaemia protein 1
T-ALL: T-cell acute lymphoblastic leukaemia
TCF-1: T-cell factor 1
TCR: T-cell receptor
TGF- β: Transforming growth factor beta
VDJ: Variable, Diverse, Joining
YWHAQ: Tyrosine 3-monooxygenase/tryptophan 5-monooxygenase activation protein, theta
1
INTRODUCTION
Blood cell production, or haematopoiesis, is a process that starts during embryonic development and
continues throughout life (1). There are two waves of haematopoiesis in verterbrates, the primitive
and definitive wave (2). The primitive wave produces red blood cells, in order to enable tissue
oxygenation during the embryo growth and myeloid cells (3), but these cells do not exhibit long term
self-renewal. In contrast, definitive haematopoiesis occurs later in development and involves
Haematopoietic Stem Cells (HSCs) which are able to give rise to myeloid, erythroid and lymphoid
blood lineages of the adult organism (1). In humans, primitive haematopoiesis begins in the yolk sac
and subsequently definitive haematopoietic stem cells are generated in the ventral wall of the dorsal
aorta. These stem cells then migrate temporarily into the liver, before reaching at their final
destination, the bone marrow. Although most cell types are specified within the bone marrow, some
early progenitors move from the bone marrow into the thymus, where T-cell development occurs (1).
The main focus of this research was childhood T-cell acute lymphoblastic leukaemia (T-ALL). In order
to better define the molecular processes causing blood disorders, such as T-ALL, it is important to
have an understanding of the same processes during normal T-cell development.
T-lymphocyte development
The progenitors of T-lymphocytes arise in the bone marrow from the pool of HSCs that progress via
multipotent progenitors (MPPs) into common lymphoid progenitors (CLPs). These then migrate into
the blood circulation and through a chemotaxis process end up in the thymus (Figure 1.1) (4). The
immigrant precursors differentiate into early thymic progenitors (ETPs), also called double negative 1
(DN1) (5). These are double negative for the T-cell markers CD4 and CD8 that contain multilineage

2
differentiation potential, which means they can still give rise to dendritic cells (DCs), natural killer
cells (NKs) and macrophages when given the right stimuli (5).
Figure 1.1. T-cell developmental stages. The progression of haematopoietic stem cells (HSCs), multipotent
progenitors (MPPs) and common lymphoid progenitors (CLPs) in the bone marrow are shown to the left.
Lymphoid progenitors migrate through the blood to the cortico-medullary junction of the thymus where they
differentiate into early T-cell progenitors (ETPs). Migration of ETPs to the cortex and then to the subcapsular
zone initiates their differentiation to the double negative (DN) stages. The return of DN cells from the sub-
capsular zone to the medulla induces their differentiation to double positive (DP) and then single positive (SP)
stages. Complete T-cell lineage commitment is shown with a line between the DN2b and DN3a stages. β or γδ
selection is indicated between the DN3a and DN3b stages. This figure was taken from Michael Litt et al.,(2013)
(7).
Many factors contribute to T-cell differentiation, one of which is the thymic microenvironment,
which expresses Notch ligands, interleukin-7 (IL-7)and sonic hedgehog (Shh) proteins that control cell
fate specification and progressively turn off genes that maintain the ETP/stem cell phenotype (6, 7).
The Notch signalling pathway was the first to be demonstrated as critical for the generation of ETPs
(8), where the Delta-like 4(DLL4) ligand, which is present in the thymus, interacts with the Notch1
receptor and initiates T-cell development (9, 10).However, Notch signalling is not sufficient to
activate T-cell lineage genes directly (11). Blood cells can generally be identified by the presence of
specific combinations of surface molecules. During T-cell maturation, T-cells express multiple CD

3
molecules on their membrane that change in their expression levels during their migration into the
different thymic areas and thereby developmental stages. Such markers are the CD4, CD8, CD25,
CD44, CD3, CD117 (c-kit), CD24 and the T-cell receptor (TCR) chains (12). The DN thymocytes do not
express the cell surface glycoproteins CD4 and CD8 until they become double positive (DP; CD4+
CD8+) and thereafter, single positive (SP; CD4+ CD8- or CD4-CD8+). The differentiation process of the
DN subpopulation is divided into four stages according to their expression of CD25 and CD44 and the
thymus microenvironment (Figure 1.1) (12). Starting from the ETP/DN1 (CD44+CD25-) heterogeneous
population that contains high levels of CD117, stem cell antigen-1 (Sca-1) but not CD3, this group can
be further divided to DN2a(CD44+CD25+CD117+) and DN2b (CD44+CD25+CD117int) in the thymic
cortex(13, 14). This is followed by T-cell lineage commitment and differentiation into a DN3a (CD44-
CD25+CD117-CD27-) and subsequently DN3b (CD44-CD25+CD117-CD27+) population in the sub-
capsular thymic zone (7). After gaining T-lineage properties, the DN3 T-cells stop proliferating (12). T-
cells pass from a proliferative expansion stage to cell-cycle arrest that enables the TCR gene
rearrangement process to be activated (12). Successful V (D) J rearrangement is required to express
functional TCRβ, TCRγ and/or TCRδ chains and components of CD3 chains. This is initiated by the
recombinases RAG-1,RAG-2 and the Notch pathway which together activate the V(D)J recombination
process where the Variable, Diverse, Joining (VDJ) gene segments are randomly combined to form a
unique TCR (21). After acquiring a TCRβ chain, the resulting β chain pairs with a surrogate α chain
(pre-Tα) and forms a pre-TCR. The expression of the pre-TCR on the cell surface allows cells to pass a
check-point, known as β-selection and proceed through the DN4 (CD44-CD25-CD117-CD27+) stage
where they lose their dependence on Notch ligand, IL-7 and sonic hedgehog (15, 16). Then, the cells
with a correctly assembled αβTCR, recognizing the peptide-major histocompatibility complex (MHC)
ligand on thymic epithelial cells, undergo positive selection. Depending on the class of MHC
recognition, T-cells become either CD4 SP (CD4+CD8-) if they have previously interacted with an MHC
class II or CD8 SP (CD4-CD8+) if they interacted with an MHC class I .Finally, SP cells undergo negative

4
selection in order to eliminate T-cells which have high affinity to self-antigens and thus reduce
chances of generating auto-reactive T-cells (17). Alternatively, DN3 T cells that successfully rearrange
TCRγ and TCRδ chains are selected as γδ T-cells and are CD4- CD8-.
The existence of a transcription factor group during T-cell development is essential for the T-cell
differentiation process from the ETP/DN1 to the DN4 stage. It is composed of different types of
transcription factors or transcription factor families that work with Notch and includes GATA
sequence-binding factor 3(GATA3)(18), the myeloblastosis proto-oncogene (MYB), the acute
myelogenous leukaemia factor-core binding factor β (RUNX-CBFβ) complexes, the basic helix-loop-
helix E-proteins E2A (E47/E12) and HEB(19),the dominant negative helix-loop-helix protein ID3, the
transcription factor Bcl11b, the T-cell factor 1(TCF-1),the zinc-finger repressor growth factor
independence 1(GFI1) and the tumour suppressor Ikaros family member (20-23). Moreover, T-cell
development depends on the decreased expression of some other transcription factors such as the
transcriptional activator PU.1, the stem cell leukaemia (SCL/ TAL1) protein, CCAAT-enhancer binding
protein α (C/EBPα), GATA-2, LIM-domain-only protein 2 (LMO2) and haematopoietically-expressed
homeobox protein (Hhex) between the DN1-DN3 stages (24, 25).
5
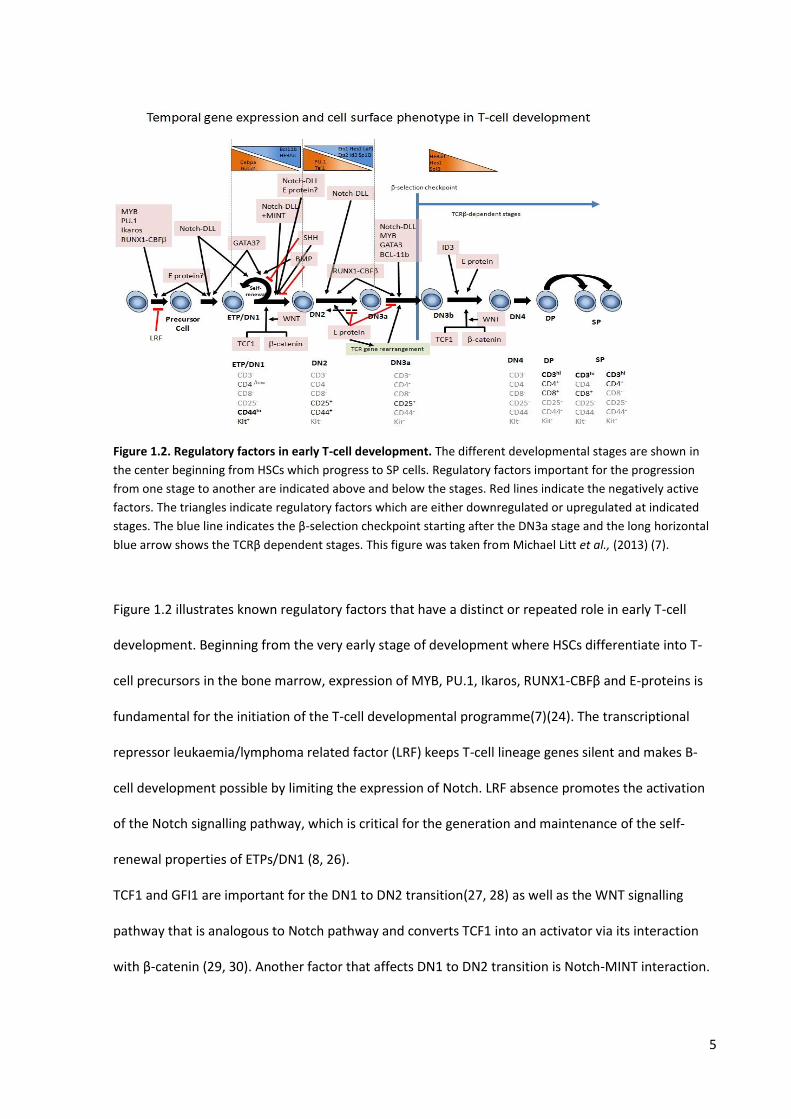
Figure 1.2. Regulatory factors in early T-cell development. The different developmental stages are shown in
the center beginning from HSCs which progress to SP cells. Regulatory factors important for the progression
from one stage to another are indicated above and below the stages. Red lines indicate the negatively active
factors. The triangles indicate regulatory factors which are either downregulated or upregulated at indicated
stages. The blue line indicates the β-selection checkpoint starting after the DN3a stage and the long horizontal
blue arrow shows the TCRβ dependent stages. This figure was taken from Michael Litt et al., (2013) (7).
Figure 1.2 illustrates known regulatory factors that have a distinct or repeated role in early T-cell
development. Beginning from the very early stage of development where HSCs differentiate into T-
cell precursors in the bone marrow, expression of MYB, PU.1, Ikaros, RUNX1-CBFβ and E-proteins is
fundamental for the initiation of the T-cell developmental programme(7)(24). The transcriptional
repressor leukaemia/lymphoma related factor (LRF) keeps T-cell lineage genes silent and makes B-
cell development possible by limiting the expression of Notch. LRF absence promotes the activation
of the Notch signalling pathway, which is critical for the generation and maintenance of the self-
renewal properties of ETPs/DN1 (8, 26).
TCF1 and GFI1 are important for the DN1 to DN2 transition(27, 28) as well as the WNT signalling
pathway that is analogous to Notch pathway and converts TCF1 into an activator via its interaction
with β-catenin (29, 30). Another factor that affects DN1 to DN2 transition is Notch-MINT interaction.

6
The MSX2-interacting protein (MINT) is a natural negative regulator of the Notch-dependent
transcription (31) and is normally expressed in ETPs, but its levels decline while cells enter the DN3
stage and β-selection (24). Moreover, although GATA-3 is also essential for ETPs to become DN2, its
overexpression leads ETPs and DN2 cells to differentiate into mast cells (32). This shows that it is
fundamental to have a balance between T-cell activator and repressor genes in order for the
immature T-cells to further differentiate and in this case Notch-DLL interaction maintains GATA-3
levels down (32). Finally, Bcl11b which is important to fully commit to the T-lineage, starts being
expressed at the DN2 stage (33) and causes, through an unknown mechanism, the downregulation of
PU.1, which is a transcription factor known for its importance for the B-cell and myeloid lineage
development (34).
The DN2 to DN3 stage transition is depended on RUNX1-CBFβ, MYB, Notch-DLL, GATA-3,Bcl11b and
the E-proteins E2A and HEB, which are also needed for TCRβ gene rearrangement and the ability to
undergo β-selection (35).Conditional deletion of MYB causes a developmental block at the DN3 stage
with decreased V(D)J recombination at the TCRβ locus (36). Deletion of GATA-3 also leads to an
accumulation of DN3 cells with a defect in the TCRβ protein expression and RUNX1 is essential for
the proliferative expansion of cells after β-selection (22, 23). As during all the previous stages, Notch
and E-proteins are very important as they “give a ticket” to pass the DN3 stage and recent studies
have shown that E2A and Notch pathways converge (37). Activation of the Notch1 gene is
downstream of E2A and together they regulate the previously called Notch1 targets such as hairy
and enhancer of split 1(Hes1) and Ptcra (21), which in turn decrease the MINT expression of Notch
(31). Before cells enter the β-selection checkpoint, cell-cycle arrest is crucial for TCRβ gene
rearrangement (19) and for the normal β-selection process to occur. This is achieved by the activity
of E2A and HEB proteins which also prevent DN3 cells to undergo reverse differentiation and return
to a DN2-cell-like phenotype (38). At this point we can conclude that the DN3 stage depends on both
7
Notch and E-protein activity and it is important to bear in mind that removal of E-protein activity can
be enough to restore the progenitor-cell regulatory factors.
Moving through the TCRβ-dependent stages which are the final T-cell developmental stages (DN3b to
SP). ID3 protein is upregulated and inhibits the bHLH activity of the E2A protein, as well as Notch1,
and is a mechanism that apparently ensures allelic exclusion and allows cell expansion (20, 39).
Finally, the existence of non-T-cell factors that promote specific alternative pathways are sufficient to
change the cell fate of the immature T-cells into other lineages so it is important to keep their levels
low. Such factors are ID2, SCL/TAL1, C/EBPα, PU.1, LMO2, GATA-2 and the bone morphogenic protein
(BMP). If C/EBPα and PU.1 are expressed ectopically at the DN2 stage, they can impose a myeloid or
dendritic cell developmental programme on T-cell precursors (40). Similarly, ID2 and TAL1 work as E-
protein antagonists of the DN2 cells, which is sufficient for ID2 to promote natural killer-cell
development (41).
In conclusion, lineage commitment from multipotent HSCs to mature T-cells is a continuous process
involving coordinated developmental stages regulated through receptor-ligand pair interactions and
an underlying complex transcriptional network. Thus, limiting the potential of progenitor cells to
differentiate into other lineages and inducing their survival and proliferation. It is therefore likely that
these transcriptional networks are mis-regulated when normal blood development transforms into
malignant haematopoiesis.

8
Genetic rearrangements during lymphopoiesis induce T-ALL
Carcinogenesis is a multistep process that accumulates various molecular, genetic and epigenetic
abnormalities such as point mutations, amplifications, deletions, and chromosomal translocations
which usually activate oncogenes or inactivate tumour suppressor genes and thus deregulate the
normal balance between proliferation and cell death of the cell (42, 43). Lymphoid malignancies have
been best described to carry tumour-associated chromosomal rearrangements (17) that lead to the
activation of genes. Lymphoid gene activation occurs most commonly by bringing a gene presumed
oncogenic into the same chromosomal context as an immunoglobulin (Ig) or a TCR gene (17). This
shows that the enzyme systems (RAG-1, RAG-2) responsible for the normal V(D)J recombination get
deregulated and create tumour-specific chromosomal rearrangements(44).
T-cell acute lymphoblastic leukaemia (T-ALL) is a good example of a disease often caused by gene
activation as a result of genomic translocations as it helped to discover many different novel genes
that could lead to tumourigenesis (45). However, there are many T-ALL cases where no obvious
genomic translocation is detected and where the underlying mechanism leading to leukaemogenesis
is unclear. This needs to be further investigated in order to better understand how these diseases are
initiated and develop, as this is vital information that can be utilised to improve leukaemia therapy.
T-ALL is a malignant clonal expansion of immature T-cells that happens in 10-15% of childhood and
25% of adult leukaemic cases (46). Nowadays, intensive use of chemotherapy has improved
childhood prognosis and nearly 90% of children can be currently cured (47). Recent studies have
observed that the genetic deregulations involving T-ALL development correlated with prognosis but
this information is not sufficient for the use of these abnormalities in treatment planning (48).
Coustan-Smith et al.,(2009) hypothesized that a part of T-ALL cases would arise from oncogenically
transformed ETPs and this would be the reason why patients and more specifically children, respond
poorly to lymphoid cell-directed chemotherapy (46). The high risk of remission induction failure or

9
relapse of children treated with ALL intensive chemotherapy, lead scientists to center their research
on this genomically unstable subtype of childhood T-ALL. ETPs-ALL have distinct cell surface markers
such as CD1a-,CD5 low ,CD8- and one or more myeloid or stem cell-associated markers which facilitate
their identification. Moreover, gene expression profiling studies showed that paediatric T-ALL seems
to involve four subgroups of genetic rearrangements including TAL/LMO, TLX3/HOX11L2,
TLX1/HOX11 and HOXA (48-50). Recently, an additional immature T-ALL subgroup was identified that
was enriched for ETP-ALL cases (49). This subgroup was characterised by a gene expression signature
containing a number of genes generally associated with the early T-cell stages, including LMO4 and
Hhex (51).In this research we wanted to further investigate the immature subgroup of childhood T-
ALL and in particular the role of LMO proteins and their interacting partners have in its development.
Investigating the role of the LMO proteins in T-ALL
During the last two decades many studies have been done on the LIM-only domain (LMO) family of
nuclear and cytoplasmic proteins in various types of human cancers but more specifically in T cell
acute lymphoblastic leukaemia (T-ALL). To date, four LMO proteins (LMO1-LMO4) have been
identified after the first characterization of LMO1 (previously called RBTN1 or TTG1) near the
breakpoint of the chromosomal translocation t(11;14)(p15;q11) involving the TCR- δ gene (52-54).
By using the LMO1 cDNA as a probe, researchers managed to isolate the two related genes LMO2
(previously called RBTN2 or TTG2) and LMO3 (previously called RBTN3), of which LMO2 was found in
T-ALL cases located at the junction of the chromosomal translocations t(11;14)(p13;q11) or
t(7;11)(q34;p13), involving TCR-α and TCR-δ or TCR-β respectively (55, 56) (Table 1.1).

10
Table 1.1. Table showing recurring translocations in T-ALL. The rearrangements are divided into those
involving TCR and non-TCR loci. This table was taken from Michael Litt et al., (2013) (7).
11
The LMO proteins are a subclass of LIM (Linl-1, Isl-1 and Mec-3) proteins that are characterized by
the presence of two LIM domains, with limited additional amino acids at the N- and C-termini (57).
Each LIM domain defines a conserved cysteine-rich structure comprising two tandem-repeated zinc
fingers and has a size of 50-60 amino acids(Figure 1.3A)(58). It acts as a DNA recognition scaffolding
site for the formation of multiprotein complexes that can regulate gene transcription, cell cycle
progress and apoptosis (59-61). Even though the LIM domain is structurally similar to GATA-type zinc
fingers (62, 63), it does not bind directly to DNA but functions as a protein-protein linker. Proteins
containing LIM domains are found both in the cytoplasm and the nucleus, suggesting that the LMO
proteins can bind to a vast number of proteins involved in different biological processes. As
mentioned before, the LMO proteins are generally involved in transcriptional regulation, through
nucleating the formation of transcription factor complexes. This is the reason why they are important
in cell differentiation and cell fate (64).
Characterization of LMO2
The LMO2 protein is the most researched protein within the LMO family as it is involved in
haematopoiesis and more particular leukaemogenesis. It has an important role during
embryogenesis and angiogenesis as it is required for the production of primitive erythrocytes and the
haemogenic endothelium which leads to the generation of the definitive haematopoietic system
(65).
During haematopoiesis, LMO2 is found in multiprotein complexes comprising the LIM domain
binding protein 1 (Ldb1), TAL1 a bHLH protein, which dimerizes with the bHLH proteins E12 and E47
(66), and GATA-1, GATA-2 or GATA-3 (67). More specifically, LMO2 bridges between the DNA binding
GATA factors and E-box factors, thereby recognizing a bipartite DNA-binding motif of an E-box
sequence separated about one helix turn from the GATA site (Figure 1.3B) (68). This complex

12
regulates transcription and it was confirmed by other studies that it is essential for erythropoiesis as
Lmo2-null mice did not survive after day 10 of embryogenesis (65).
Figure 1.3. Diagrammatic respresentation of LMO2 protein structure and transcription complex. A)
Represents the LMO protein structure composed of two LIM domains. Each LIM domain has two zinc-binding
LIM fingers. B) Transcription complex where LMO2 binds to TAL1, E47, Ldb1, GATA-1 in normal erythroid
cells.C) In leukaemic T-cells, a different complex occurs which comprises LMO2, Ldb1, TAL1 and E47. This figure
was taken from Nam CH, Rabbitts TH (2006) (69).
What is more, LMO2 and TAL1 are translocated in T-ALL due to RAG recombination mistakes during
T-cell development. This induces an overexpression of LMO2 and TAL1 which bind to two E-box
binding sites in the bipartite DNA binding elements. As a result, abnormal regulation of the
downstream target genes is observed, a blockade of the T-cell development and activation of HSC-
associated genes that cause self-renewal of the DN cells (Figure 1.3C)(69) . A possible explanation of
this transcriptional deregulation would be the simple mass action effect, based on the LMO2, TAL1
concentrations which affect the availability of individual proteins (74). LMO2-TAL1 complex could
apply its tumourigenic effects by inhibiting the normal functions of E2A and HEB, important in ETP
cell differentiation and displace GATA-2 from its normal function (74). It is also important to know
that although LMO2 disrupts the normal functioning of T-cell development, T-ALL takes place only
13
after a long latency period (2-6 years) (70). This is because these mutations are not sufficient on their
own to cause leukaemia. Inactivation of tumour suppressor genes, activation of other proto-
oncogenes or disruption of the Notch pathway are extra mutations that need to happen in order to
cause T-ALL(64).
Characterization of LMO4
Lmo4 was the most recently characterized family member and was identified as an auto-antigen in
breast cancer patients (71) were its overexpression induced mammary hyperplasia in transgenic mice
(72). The exact pathway by which Lmo4 causes tumour induction is still unknown, but a number of
potential roads have been identified in different types of cancers. One of these, is its involvement in
the cell cycle progress. Montañez‐Wiscovich et al., (2010) demonstrated that Lmo4 knock-down in all
murine breast cancer subtypes resulted in G2/M arrest in the cell cycle (73), as well as increased cell
death, amplification of centromeres and faults in spindle formation. Lmo4 knock-down also causes
exencephaly in mice due to defective neuronal tube closure. Cranial nerve abnormalities and skeletal
defects were also observed (74).This suggests that Lmo4 expression levels have to be highly
controlled for keeping the normal balance of cells.
Despite its presence in many human tissues such as the brain, skin, pancreas and the oral cavity (75),
Lmo4 was also detected in mice thymocytes and more specifically in the DN and DP immature T cells
(76, 77). Similar to Lmo2, Lmo4 is also a binding partner of Ldb1 in T-cells (78). Lmo4 exists in a
complex comprising the tumour suppressor gene BRCA1 and CtIP in breast epithelial mice cells (77).
Lmo4 inactivates the transcriptional activation of BRCA1, promoting cancerous cell growth in breast
tissues (79). Moreover, Grutz et al., (1998) hypothesised that the enforced expression of LMO1 and
LMO2 would displace the interaction of LMO4 in a complex comprising Ldb1 and thus influence the
normal T cell differentiation programme (75).However, the most intriguing finding was that of
Matthews et al., (2008) ten years later where the binding affinities of LMO2 and LMO4 for Ldb1 were

14
measured by developing a competition ELISA strategy (78). The dissociation constants of binding of
Ldb1 for the LIM domains of LMO4 and LMO2 demonstrated that LMO4 had a higher affinity for Ldb1
(Kd=10nM) than LMO2 (Kd=20nM) (78). Previous work within the Hoogenkamp lab was performed on
mouse ES cell lines, using a shRNA construct, which indicated that the knockdown of Lmo4 lead to a
loss of cells, at least in part through increased apoptosis. Our hypothesis is that LMO4 is present at
the very early T-cell developmental stage (ETP) in a complex comprising Ldb1. Under normal
expression levels, LMO4 would allow ETP cells to differentiate and keep their cell number constant.
However, mutations occurring in the T-cell progenitor stage would disrupt the transcriptional
network, upregulating transcription factors associated with stem cell/early progenitor properties,
including LMO4, thereby preventing the normal T-cell differentiation process. Finally, accumulation
of secondary mutations would induce T-ALL by complementing the increased self-renewal with a
proliferative and survival advantage.
To further understand the role of LMO4 in human T-ALL, we performed a number of experiments on
four immature T cell lines. We have characterized and measured its relative mRNA expression level
by doing quantitative polymerase chain reaction (q-PCR). Western Blot analysis using an anti-LMO4
antibody was also performed on the T-cell protein extracts, in order to confirm that the LMO4
protein is expressed. We also performed immunoprecipitation of Ldb1, followed by mass
spectrometry in order to validate and identify novel interacting partners that could be part of the
DNA-binding complex. Western blots were performed on already known interacting partners such as
Ldb1, TAL1, GATA-2, GATA-3 and on a new LMO2 target, Hhex. Finally, we decided to knock-down
LMO4 in order to assess the viability and growth of the transfected T cells.
This project is one of the first to focus on the role of the LMO4 protein in human T-ALL. Identification
of novel interacting partners in the transcriptional complex suggests that there are still many
interacting processes that have not yet been characterized. Moreover, knocking-down the LMO4

15
protein will help us to ascertain if LMO4 is fundamental to the T-cell development and whether it
might hopefully be used as a future therapeutic target.

16
MATERIALS AND METHODS
Cell culture
T-ALL cell lines were grown in RPMI 1640 medium (Sigma Aldrich) supplemented with 10% Fetal bovine
serum, 2mM Glutamax (GIBCO), 5 U/ml Penicillin/Streptomycin and 0.075mM MTG. The cell lines were
grown in a humidified incubator at 37°C and 5% CO2. Molt-4 cells were kept at a cell density between 0.4 - 2
million/ml and the other cell lines between 0.2 - 2 million/ml. Human lymphoid progenitor cell lines ARR
and DU.528 were kindly provided by Dr. A.W. Langerak, Erasmus Medical Centre, Rotterdam, The
Netherlands.
RNA isolation and cDNA synthesis
RNA was isolated from the cells using an RNeasy Mini Kit (QIAGEN) according to the enclosed protocol. RNA
concentration and quality was determined on a NanoDrop 2000 UV-Vis Spectrophotometer (Thermo
Scientific). For cDNA synthesis, 2μg RNA was denatured at 70°C for 10minutes in the presence of 0.1mM
Oligo(dT)20 and cDNA was synthesized using 200U SuperScript II Reverse Transcriptase, 1mM dNTPs in 1X
first-strand buffer in a total volume of 20ul at 40°C for 30minutes (Life Technologies).
Quantitative PCR
Quantitative PCR (qPCR) was performed using cDNA in order to assess the expression of GAPDH, LMO1,
LMO2, LMO4 and Tal1.The forward and reverse primers that were used are listed in Table 2.1. qPCR
reactions were composed of 5μl 2X SYBR Green master mix (Life technologies), 0.25μl forward and reverse
primers (0.25μM final concentration each), 2.5μl of 10X diluted cDNA in H2O and 2.25μl H2O. A standard
curve was produced for each set of primers and each time they were used, using serial dilutions of cDNA.
Primers for the GAPDH gene were used for normalisation. Reactions were loaded on 96 well plates and the
17
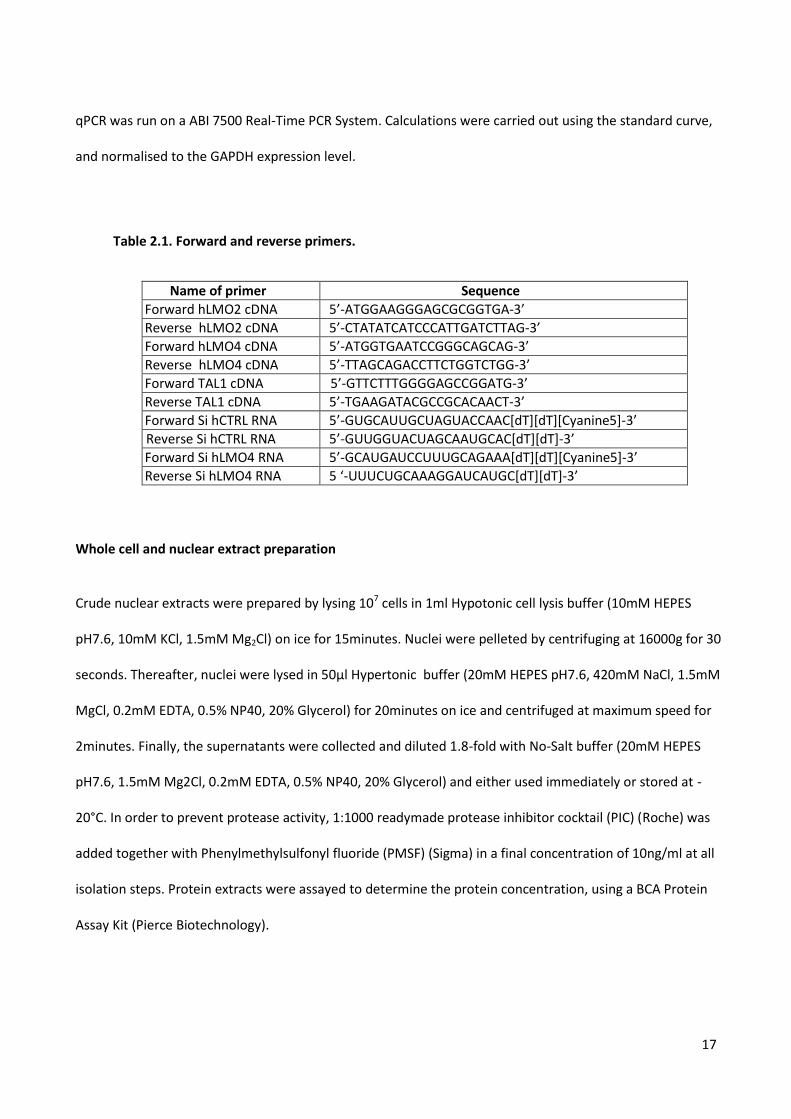
qPCR was run on a ABI 7500 Real-Time PCR System. Calculations were carried out using the standard curve,
and normalised to the GAPDH expression level.
Table 2.1. Forward and reverse primers.
Name of primer Sequence
Forward hLMO2 cDNA 5’-ATGGAAGGGAGCGCGGTGA-3’
Reverse hLMO2 cDNA 5’-CTATATCATCCCATTGATCTTAG-3’
Forward hLMO4 cDNA 5’-ATGGTGAATCCGGGCAGCAG-3’
Reverse hLMO4 cDNA 5’-TTAGCAGACCTTCTGGTCTGG-3’
Forward TAL1 cDNA 5’-GTTCTTTGGGGAGCCGGATG-3’
Reverse TAL1 cDNA 5’-TGAAGATACGCCGCACAACT-3’
Forward Si hCTRL RNA 5’-GUGCAUUGCUAGUACCAAC[dT][dT][Cyanine5]-3’
R Reverse Si hCTRL RNA 5’-GUUGGUACUAGCAAUGCAC[dT][dT]-3’
Forward Si hLMO4 RNA 5’-GCAUGAUCCUUUGCAGAAA[dT][dT][Cyanine5]-3’
Reverse Si hLMO4 RNA 5 ‘-UUUCUGCAAAGGAUCAUGC[dT][dT]-3’
Whole cell and nuclear extract preparation
Crude nuclear extracts were prepared by lysing 107 cells in 1ml Hypotonic cell lysis buffer (10mM HEPES
pH7.6, 10mM KCl, 1.5mM Mg2Cl) on ice for 15minutes. Nuclei were pelleted by centrifuging at 16000g for 30
seconds. Thereafter, nuclei were lysed in 50μl Hypertonic buffer (20mM HEPES pH7.6, 420mM NaCl, 1.5mM
MgCl, 0.2mM EDTA, 0.5% NP40, 20% Glycerol) for 20minutes on ice and centrifuged at maximum speed for
2minutes. Finally, the supernatants were collected and diluted 1.8-fold with No-Salt buffer (20mM HEPES
pH7.6, 1.5mM Mg2Cl, 0.2mM EDTA, 0.5% NP40, 20% Glycerol) and either used immediately or stored at -
20°C. In order to prevent protease activity, 1:1000 readymade protease inhibitor cocktail (PIC) (Roche) was
added together with Phenylmethylsulfonyl fluoride (PMSF) (Sigma) in a final concentration of 10ng/ml at all
isolation steps. Protein extracts were assayed to determine the protein concentration, using a BCA Protein
Assay Kit (Pierce Biotechnology).

18
Western blot analysis
Nuclear extracts (75μg) were separated on 4-12% gradient Bis-Tris Plus Bolt Mini Gels (Novex by Life
Technologies) at 165V for 40minutes. The gel was transferred to nitrocellulose, using gel transfer stacks (Life
Technologies), for 330 seconds and the membrane was blocked in 5% skimmed milk (Marvel) for 30 minutes.
The membrane was incubated overnight with primary antibody, and for 1hour with the appropriate
secondary antibody. The membrane was washed in excess PBS between each incubation step and just before
the exposure. The antibodies used were: TAL1 (sc-12984X), GATA-2 (sc-9008), GATA-3 (sc-9009) from Santa
Cruz Biotechnology; LMO4 (ab131030), Ldb1 (ab96799), Hhex (ab34222) from Abcam; LMO2 (AF2726, R&D
systems) and secondary antibodies IRDye 680RD or 800RD Donkey anti-Rabbit IgG, IRDye 680RD or 800RD
Donkey anti-Mouse IgG and IRDye 680RD Donkey anti-Goat IgG. Membranes were exposed and fluorescence
was detected on a Odyssey CLx. Infrared imaging system (Li-Cor).
Protein pull down assays and mass spectrometry
Immunoprecipitation
60μl Protein G coated Dynabeads (Life Technologies) were first washed twice with PBS-0.03% tween, then
with BSA/PBS-0.03% tween and mixed with 4μg anti-Ldb1 or rabbit IgG antibodies and rotated for 30minutes
at 4°C. 600μg of the ARR and DU.528 nuclear extracts were incubated with beads for 2hours at 4°C. Beads
were washed 3 times between each incubation step in 10 volumes (600μl) of beads wash buffer (20mM
HEPES pH7.6, 150mM NaCl, 1.5mM MgCl, 0.2mM EDTA, 0.5% NP40, 20% Glycerol and 1:1000 PIC and PMSF).
Pulled-down proteins were resuspended in 40μl 4X LDS sample loading buffer (Novex) and 5μl 10X sample
reducing agent (Novex) and boiled at 95°C for 5minutes. Successful immunopreciptiation was confirmed by
LMO2 western blot analysis.

19
Mass spectrometry
For mass spectrometry analysis, the immunoprecipitates were separated on 4-12% Bis-Tris Plus Bolt Mini
Gels, on 165V for 40minutes, stained with coomassie blue staining dye for 2 hours and destained with 1%
acetic acid overnight. Each lane was cut into approximately 16 small slices. Each slice was placed into low
binding-polypropylene tubes and washed with 500μl of 50% acetonitrile, 50mM ammonium bicarbonate for
30minutes, followed by incubation in 250μl of 100mM iodoacetamide in 50% acetonitrile, 50mM ammonium
bicarbonate at room temperature and in the dark for 30minutes. Finally, gel slices were washed with 500μl of
10% acetonitrile, 50mM ammonium bicarbonate for 30minutes at room temperature with agitation. Organic
solvent was evaporated in a vacuum centrifuge for 2 hours or till dry. Trypsin protein digestion to peptides
was achieved with 20μg of trypsin (Promega) which was dissolved in 500μl of 10% acetonitrile, 50mM
ammonium bicarbonate and desiccated acrylamide-gel slice were incubated in 20μl trypsin solution over
night at room temperature. Peptides were extracted in 3 steps; the first incubation in 100μl of 1% formic acid
in 10% acetonitrile for 1 hour, the second incubation in 100μl of 2% formic in 60% acetonitrile, and the third
incubation again in 100μl of 1% formic acid in 10% acetonitrile for 1 hour. Extracted volumes were pooled
and peptides were lyophilised in a vacuum centrifuge until dry. Finally, the pellets were reconstituted in 20μl
1% formic acid. Samples were sent for analysis at the mass spectrometry facility of the School of Cancer
Sciences, University of Birmingham and run on a Bruker Impact ESI-TOF machine with the running software
Otof control/hystar.
siRNA electroporation
Cells were spun down at 300g and resuspended at 10⁷ cells per 700μl of PBS. 300nM of the control siRNA
(siCtrl) or hLMO4 siRNA (siLMO4) were added to cuvettes, followed by 700μl of the cells and kept on ice.
Electroporation was performed at 350V for 15ms, unless stated otherwise, on a Pischer EPI 3500
electroporator. Immediately after electroporation cells were transferred into flasks with 12ml culture
medium to recover and after an hour cells were gently pelleted and resuspended in fresh medium to remove
20
free siRNA. The next day the cells were analysed by flow cytometry or single-cell sorted on a MoFlo
Fluorescence-activated cell sorting (FACS) machine. siRNAs were tagged with a fluorescent Cyanine(Cy5)
group at the 3’ end of the upper strand, which gives emission in the far red spectrum and can be detected by
flow cytometry as for the detection of APC (650nm).This facilitates the analysis of transfection efficiency and
can be used to specifically FACS sort the transfected cells. siRNA sequences are shown in Table 2.1.
Flow cytometry
Cells were analysed by flow cytometry to check their differentiation stage for expression of cell surface
receptor with an APC-conjugated antibody specific for human CD3 (17-0036-41, eBioscience). Samples were
washed with PBS and then incubated in 100μl of 0.25ng/μl hCD3 antibody in PBS, 0.5% BSA, 0.2mM EDTA
buffer for 20-30minutes on ice. Samples were then washed from the antibody with PBS, 0.5% BSA, 0.2mM
EDTA and resuspended in 500μl of the same buffer. Analysis on a CyanADP (DakoCytomation-Beckman
Coulter) machine was performed afterwards. As a gating strategy, live cells were selected on basis of the
forward and side scatter profile, followed by gating on single cells using the pulse width plot.
Analysis of siRNA transfected cells was similarly performed by spinning down a small volume of cells at 1100g
for 3 minutes. Cells were resuspended in 1ml of PBS, 0.5% BSA, 0.2mM EDTA buffer and analysed on a
CyanADP machine, gating live single cells, detecting Cy5 using the APC laser/filter settings.
Single-cell sorting
Three 96 well plates were prepared for each siCtrl or siLMO4 triplicate transfection. To each well 300μl of
culture medium was added and Cy5 positive single ARR cells were sorted into each well by a MoFlo High-
Speed Cell Sorter (Beckman Coulter). As a control for sorting efficiency and the effect of cell sorting on cell
viability, a plate of untransfected ARR was also prepared.
21
RESULTS
LMO4 was recently identified as part of an expression signature characterising a subgroup of
paediatric T-ALL, namely T-ALL with an immature phenotype (51). As LMO4 is a known oncogene in
other tissues, such as breast cancer (76), we wished to gain insight in the involvement of LMO4 in
childhood T-ALL with an immature phenotype and identify its interaction partners. To this end we
first had to identify cell lines that would best suit to our criteria. As previously mentioned, ETP/DN T-
ALL cell lines do not possess TCRs or CD3 chains and have distinct cell surface markers such as CD1a-
,CD5 low ,CD8- and one or more myeloid or stem cell-associated markers. The more differentiated T-
ALL cell lines that have entered further into the recombination process start expressing CD1a,CD3
and CD5.
T-ALL cell lines
In 2007, Sandberg et al. characterized 30 T-cell lines, amongst which 23 human T-ALL cell lines (Table
3.1), performing immunophenotypical analyses, which was very helpful for the set-up of our
experiments (80). At the top of the list in Table 3.1, ARR and DU.528 are the least differentiated T-
ALL cell lines. We were kindly provided with these two cell lines by the corresponding author of the
publication, Dr. A.W. Langerak, Erasmus Medical Centre, Rotterdam,The Netherlands. We decided to
analyse the Molt-4 (DP) and Jurkat (SP) T-ALL cell lines as well, to compare the different genes,
markers and proteins of interest between the early and later T-ALL developmental stages.

22
Table 3.1. Shown are 30 human T-cell lines, of which the first 23 represent T-ALL cells. At the top of the list,
ARR and DU.528 are the least differentiated T-ALL cell lines, as indicated by their surface marker expression
profile. Further down Molt-4 and Jurkat cell lines are indicated. This table was taken from Sandberg et al.,
(2007).
CD3 expression on T-ALL cells
In order to confirm the developmental hierarchy between the four cell lines, cells were incubated
with an APC-conjugated antibody recognising the human CD3ε subunit. This was followed by flow
cytometry analysis. Unstained controls were run for every cell line and the unstained Jurkat is shown
(Figure 2.1). After gating on the live single cells, the results showed that the ARR and DU.528 cell
lines did not express the CD3 marker on their cell surface, as shown by the absence of any APC
staining. Molt-4 and Jurkat were both positive for CD3 with Jurkat showing clearly higher
fluorescence expression levels.

23
Figure 2.1.Flow cytometry analysis of CD3 expression. Unstained controls and CD3 stained samples were run
for the ARR, DU.528, Molt-4 and Jurkat cell lines in duplicate. The unstained Jurkat (control) as well as the CD3
stained cells are shown. After gating on live-single cells, the graphs show the APC fluorescence on the x-axis
and the numbers of events (cell counts) on the y-axis. αCD3 stained ARR and DU.528 cell lines graphs are
similar to unstained Jurkat, indicating that these cells do not express CD3 on their cell surface. Molt-4 and
Jurkat graphs show an increase in fluorescence emission, indicating CD3 surface expression.
Exponential growth of the cell lines
In order to properly culture the different cell lines, we examined the growth characteristics of each of
the four cell lines. We aimed to maintain their density relatively low and subculture them at the right
time. Therefore the cells were maintained at densities between 0.2 to 2.0 x10⁶/ml and subcultured
every two or three days. At regular intervals a small amount of culture medium was removed, the
cells were counted, and the resulting numbers were plotted to perform a growth curve analysis.

24
Starting with an initial concentration of 0.4x10⁶/ml cells, all cell lines grew exponentially. The ARR cell
line was the fastest growing of the four, following a daily growth rate of 2.06 (y = e0.7233x ), which
translates into a doubling time of 23.3 hours. Next was Jurkat, with a daily growth rate of 1.81
(y = e0.5951x), doubling in 26.5 hours , followed by DU.528 at a daily growth rate of 1.7 (y = e0.5337x),
doubling in 28 hours and finally Molt-4, which doubled in 29.8 hours having a daily growth rate of 1.6
(y = e0.4754x ). Further observations showed that Molt-4 did not grow as well when its density was
clearly below 0.4x10⁶/ml, whereas the other three cell lines grew equally well at 0.2x10⁶/ml.
Figure 2.2. Exponential growth of the T-ALL cell lines. Starting from an initial concentration of 0.4x10⁶/ml,
each cell line was counted every 24hours. The graph shows the cell counts on the y-axis and the hours in
culture on the x-axis. An exponential growth curve was fitted through the data points and the formula was
used to calculate the doubling times.
Being aware of the doubling times of each cell line enabled us to grow the cells at an appropriate
density and at the right time to isolate their RNA, or their protein extracts. Cells were kept growing in
their exponential phase and usually harvested for RNA or protein isolation when these were at a
density of around 0.8-1.5x10⁶/ml.

25
Relative mRNA and protein expression
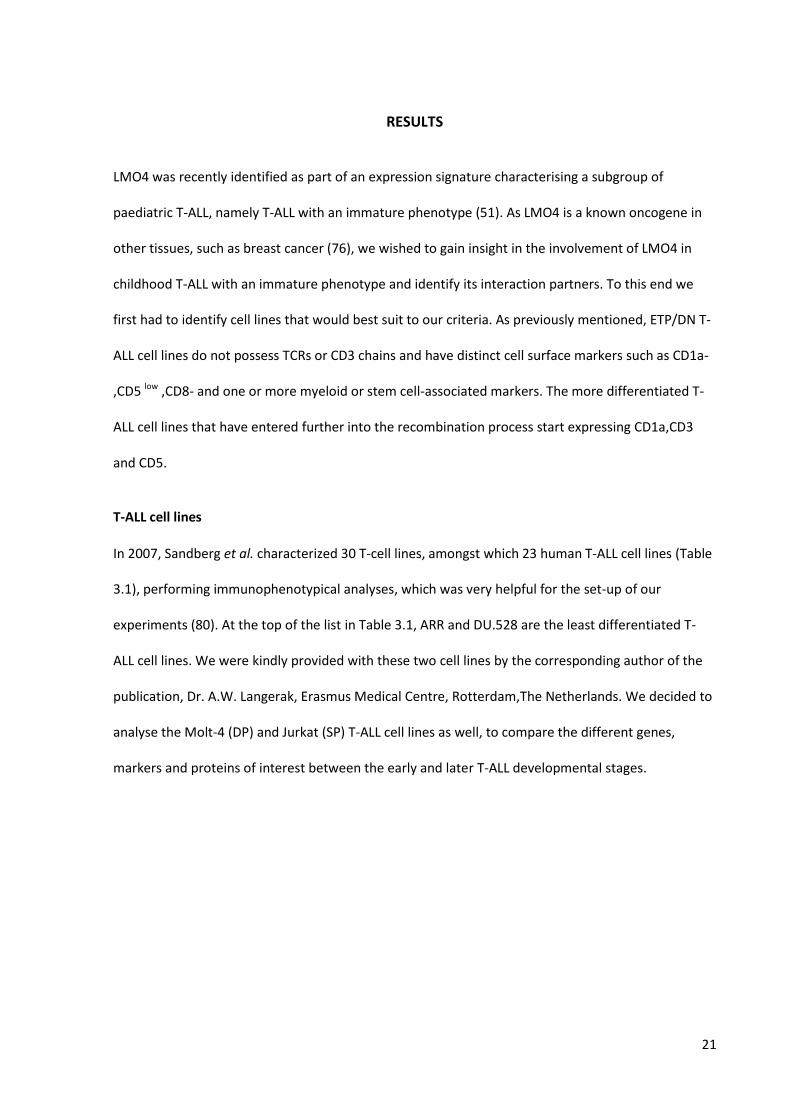
The quantitative PCR data for LMO1 showed that it was expressed at high levels in Jurkat, to a lesser
extent in Molt-4 and was absent in ARR and DU.528 (Figure 2.3A). These data are in line with
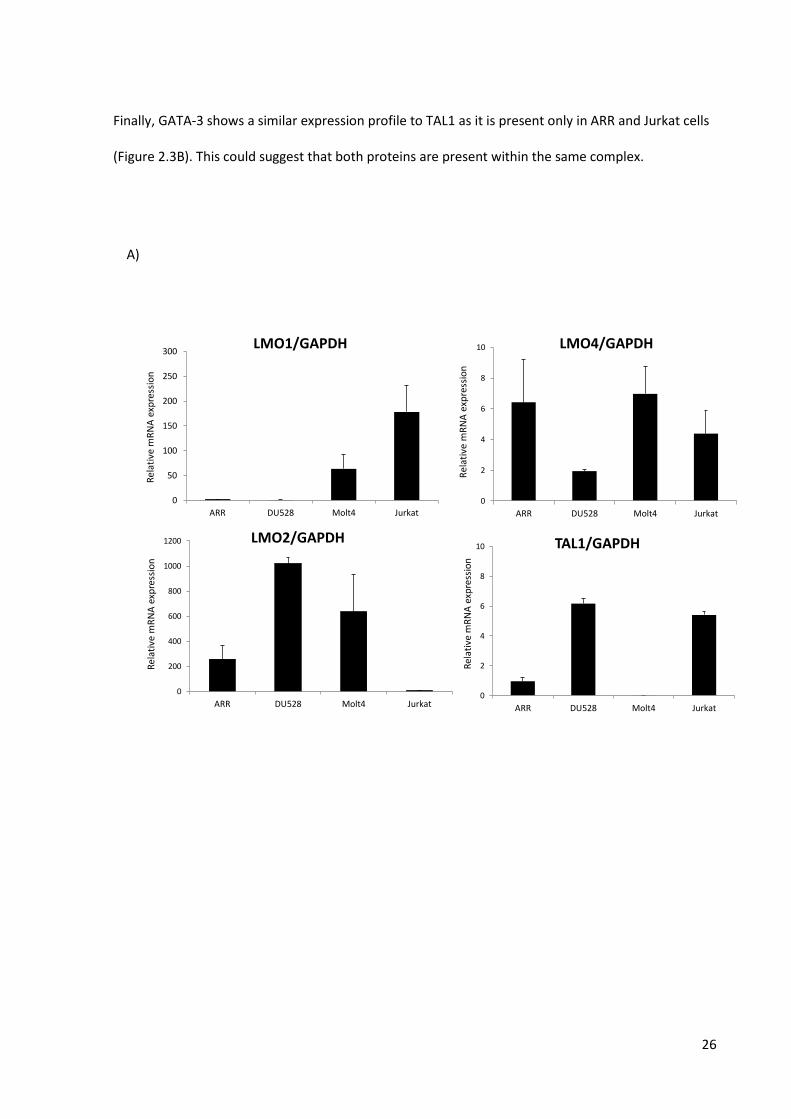
published data on LMO1 mRNA expression levels in Molt-4 and Jurkat (81). LMO2 mRNA and protein
expression was undetectable in the Jurkat cell line, which was expected as high LMO1 and LMO2
seem usually mutually exclusive (Figure 2.3A). In the remaining three cell lines, Western blot analysis
showed that LMO2 was more abundant in the DU.528 and Molt-4 cell lines than in ARR. A similar
protein expression pattern was observed for Ldb1, showing a low, but detectable, level in Jurkat, a
higher level in ARR and more in DU.528 and Molt-4 (Figure 2.3B).
LMO4 protein expression levels followed an anti-correlation with the differentiation stages of the cell
lines, as it was more abundant in ARR and DU.528 than in Molt-4 and further reduced in Jurkat cells
(Figure 2.3B). Interestingly, the protein expression pattern was not fully concurrent with its mRNA
levels as it had clearly lower mRNA levels in DU.528 (Figure 2.3A). This indicates that there is a level
of post-transcriptional regulation taking place. Similar to LMO4, also the protein expression of Hhex
and GATA-2 followed a decrease over the four cell lines representing increasing differentiation
stages. This was within expectation, as these factors are known to be associated with a
haematopoietic stem cell / early progenitor phenotype and not the committed T-cell phenotype.
An intriguing result was observed for TAL1 expression. Previous studies showed that the DU.528 cell
line carried a SIL-TAL1 translocation, which normally causes high TAL1 expression. As expected, TAL1
mRNA is most highly expressed in DU.528 and Jurkat cell lines, less in ARR and absent in Molt-4
(Figure 2.3A). Surprisingly, TAL1 Western blots show that it is only present at detectable levels in ARR
and Jurkat cells. These data show that although the mRNA expression of a gene is high, this not
always automatically means that protein levels are high as well.
26
Finally, GATA-3 shows a similar expression profile to TAL1 as it is present only in ARR and Jurkat cells
(Figure 2.3B). This could suggest that both proteins are present within the same complex.
A)
0
2
4
6
8
10
ARR DU528 Molt4 Jurkat
LMO4/GAPDH
Rel
ativ
e m
RN
A e
xpre
ssio
n
0
200
400
600
800
1000
1200
ARR DU528 Molt4 Jurkat
LMO2/GAPDH
Rel
ativ
e m
RN
A e
xpre
ssio
n
0
2
4
6
8
10
ARR DU528 Molt4 Jurkat
TAL1/GAPDH
0
50
100
150
200
250
300
ARR DU528 Molt4 Jurkat
LMO1/GAPDH
Rel
ativ
e m
RN
A e
xpre
ssio
nR
elat
ive
mR
NA
exp
ress
ion
27
Figure 2.3.Relative mRNA and protein expression in the four T-ALL cell lines. Figure A) shows the relative mRNA
expression data of LMO1, LMO2, LMO4 and TAL1 as a ratio to GAPDH mRNA expression. For each cell line
biological triplicates of cDNAs were synthesized, each measured in duplicate. Figure B) shows the protein levels
of LMO2 (17kDa) and LMO4 (18kDa), as well as that of some of their potential interaction partners in the four
T-ALL cell lines.Ldb1 (49kDa), TAL1(42kDa), Hhex(42kDa),GATA-2(50kDa),GATA-3(50kDa). Equal amounts (75μg)
of the four nuclear extracts were loaded on the gel which is confirmed by the tubulin (49kDa) expression. The
qPCR and Western Blot experiments were both performed at least twice.
Ldb1 pull-down and mass spectrometry analysis
The mRNA and protein expression level experiments presented in figure 2.3 showed to which extent
the three LMO proteins are expressed, as well as the levels of several proteins generally associated
with them. However, transcription factor complexes are composed of many proteins and by
performing protein pull downs followed by mass spectrometry analysis, we aimed to identify more
proteins, including those unknown to be interacting partners. By performing a αLdb1
immunoprecipitation we wanted to see whether this protein indeed interacts in the early human T-
B)

28
ALL cell complex of the cell lines and whether known and novel interacting proteins could be found.
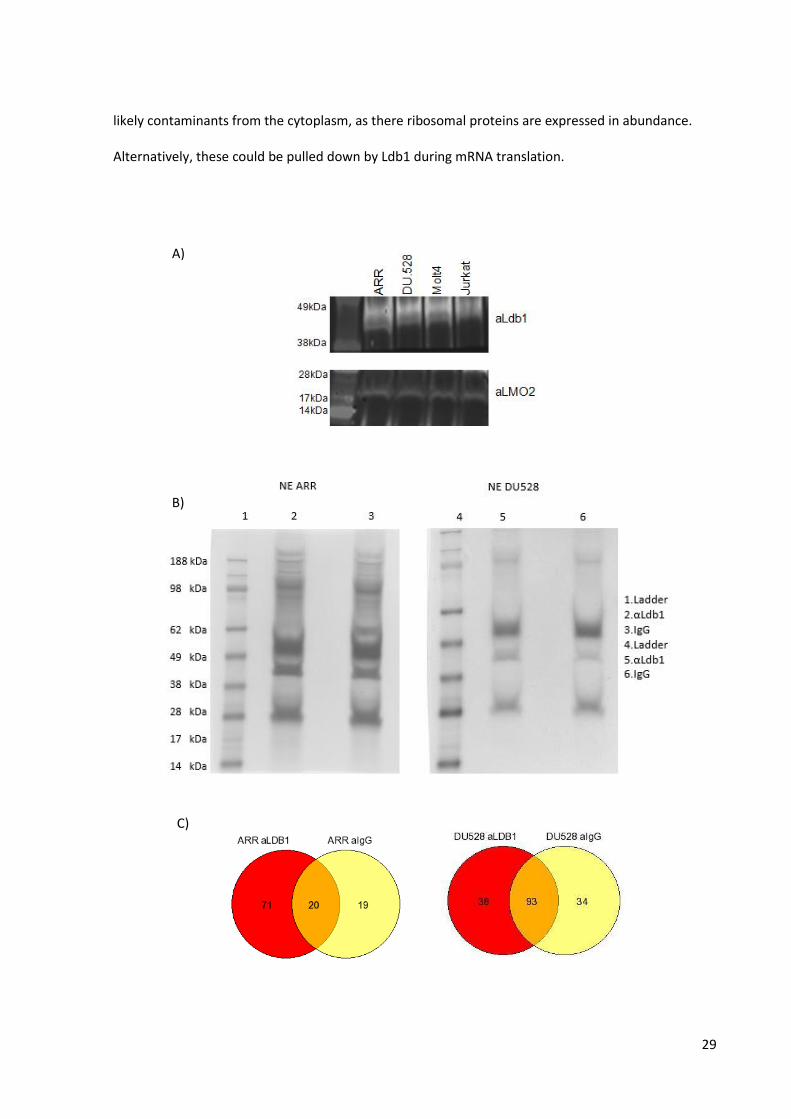
We first sought to control if LMO2 was indeed interacting with Ldb1 and decided to run the pulled
down proteins on a 4-12% Bis-Tris Plus Bolt Mini gel. The gel was then transferred to a nitrocellulose
membrane, separated into two parts and incubated either with an Ldb1 or LMO2 antibody (Figure
2.4A). We showed that LMO2 was present in the Ldb1 pulled down proteins, thus interacting
together.
We then performed the same immunoprecipitation using an αLdb1 antibody or IgG as a control on
the ARR and DU.528 nuclear extracts and the pulled down proteins were run on a 4-12% Bis-Tris Plus
Bolt Mini gel. The gel was stained with coomassie blue dye, staining all the pulled down proteins
(Figure 2.4B). This facilitated the cutting of each of the lanes into 16 individual gel slices. These were
then processed as described in the Material and Methods section, trypsin digested and analysed on a
mass spectrometer.
The results revealed a number of already known proteins involved in the complex and proteins that
have still not well defined roles in it (Appendix 1). The generation of Venn Diagrams helped us to
better see the number of unique proteins identified in this pull down assay (Figure 2.4C). The ARR
Venn diagram shows 71 unique proteins that supposedly interact with Ldb1 and only 20 common
proteins between the Ldb1 and IgG immunoprecipitates. The DU.528 Venn diagram identifies 38
unique proteins that could interact with Ldb1 and 93 proteins that are common to Ldb1 and IgG
immunoprecipitates.
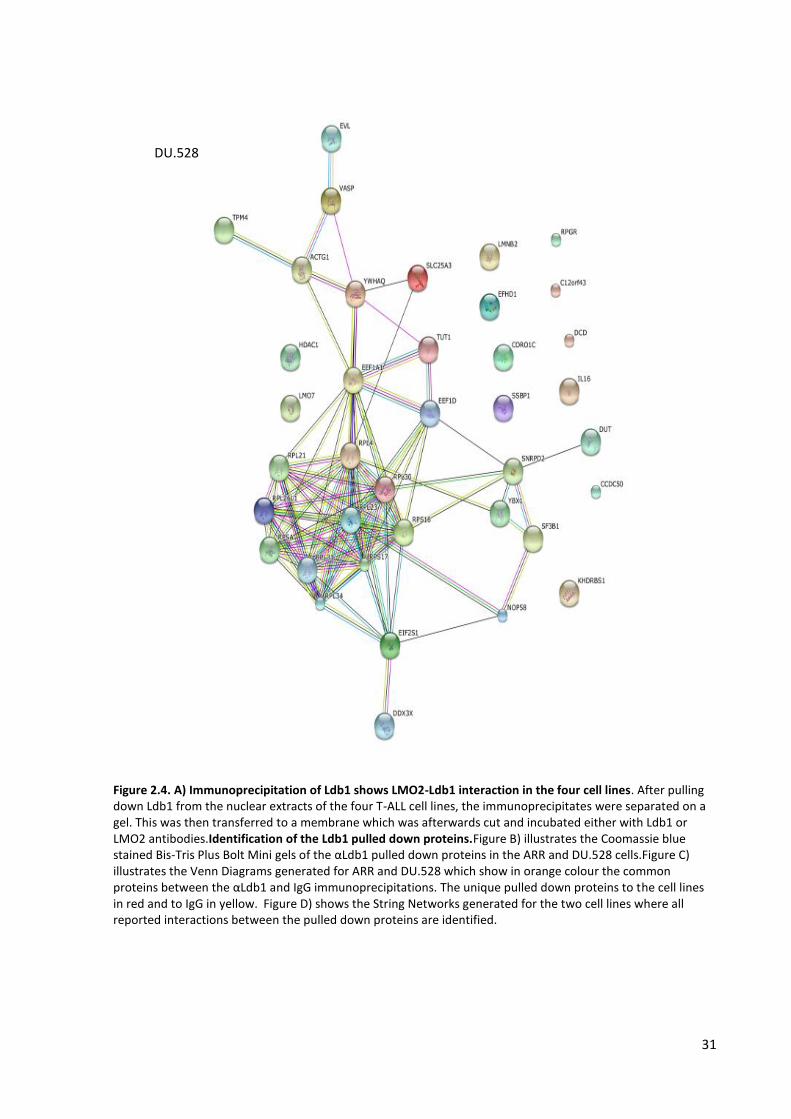
In order to understand the pathways where all these proteins are involved in, STRING (Search Tool
for the Retrieval of Interacting Genes/Proteins) networks were generated, using the online database
STRING 9.1, and showed all reported interactions between the proteins (Figure 2.4D). Many
ribosomal subunits were identified, which show within the network as a dense cluster. These are
29
likely contaminants from the cytoplasm, as there ribosomal proteins are expressed in abundance.
Alternatively, these could be pulled down by Ldb1 during mRNA translation.
A)
B)
C)

30
ARR D)
31
Figure 2.4. A) Immunoprecipitation of Ldb1 shows LMO2-Ldb1 interaction in the four cell lines. After pulling down Ldb1 from the nuclear extracts of the four T-ALL cell lines, the immunoprecipitates were separated on a gel. This was then transferred to a membrane which was afterwards cut and incubated either with Ldb1 or LMO2 antibodies.Identification of the Ldb1 pulled down proteins.Figure B) illustrates the Coomassie blue stained Bis-Tris Plus Bolt Mini gels of the αLdb1 pulled down proteins in the ARR and DU.528 cells.Figure C) illustrates the Venn Diagrams generated for ARR and DU.528 which show in orange colour the common proteins between the αLdb1 and IgG immunoprecipitations. The unique pulled down proteins to the cell lines in red and to IgG in yellow. Figure D) shows the String Networks generated for the two cell lines where all reported interactions between the pulled down proteins are identified.
DU.528

32
LMO4 gene silencing in ARR cell line
To study the role of LMO4 protein in early T-ALL, we decided to silence its gene in the ARR cell line
by using double stranded small interfering RNA (siRNA).
Previously, our laboratory silenced Lmo4 in mouse cells by using a Retrovirus that expressed shRNA
sequences from a miR-30 background. The ability and specificity of this shRNA in targeting the Lmo4
gene was used for the design of the siRNA. In order to target the human LMO4 gene we first
compared the human and mouse LMO4 DNA/RNA sequences. We then identified which nucleotides
did not blast the sequence to find out the differences and changed them in order to be an exact
match to the human sequence (siLMO4). The oligonucleotides were ordered from Sigma-Aldrich with
a Cyanine5 (Cy5) tag at the 3’ of the top strand, which is the one that will not bind to the LMO4
mRNA. This fluorescent label facilitated the determination of transfection efficiency by flow
cytometry or FACS. A control siRNA was designed (siCtrl), with no predicted binding to any human
mRNA, as a negative control for nonspecific effects of the transfection procedure.
Our first round of transfections was performed by placing 200nM of the siCtrl or siLMO4 into
cuvettes with 10⁷/ml ARR cells and electroporating at 350V for 10ms. An extra control sample, where
the siCtrl was added to cells, but in the absence of electroporation was also generated. After 24h, we
analysed their fluorescence signal by flow cytometry. Surprisingly, we observed that all samples were
stained with the Cy5 dye, including the non-electroporated sample (data not shown). We concluded
from these first results that the siRNA was either binding to the cell membrane or taken up by the
cells. Thus, we decided to perform a wash to remove free siRNA from the medium 1h after
electroporation, giving the cells time to recover after electroporation.
From further optimisations we concluded that the best voltage and pulse length for transfecting ARR
cells was 350v for 15ms. Three hundred nanomolar of the siCtrl or siLMO4 were placed into cuvettes
with 10⁷ ARR cells and electroporated. The experiment was performed in duplicate and the
33
electroporated cells were transferred into flasks together with 12ml of medium. Again an extra
control sample similar to the siRNA control was also used, which has not been electroporated. One
hour later, the medium was replaced and the fluorescence signal was analyzed by flow cytometry.
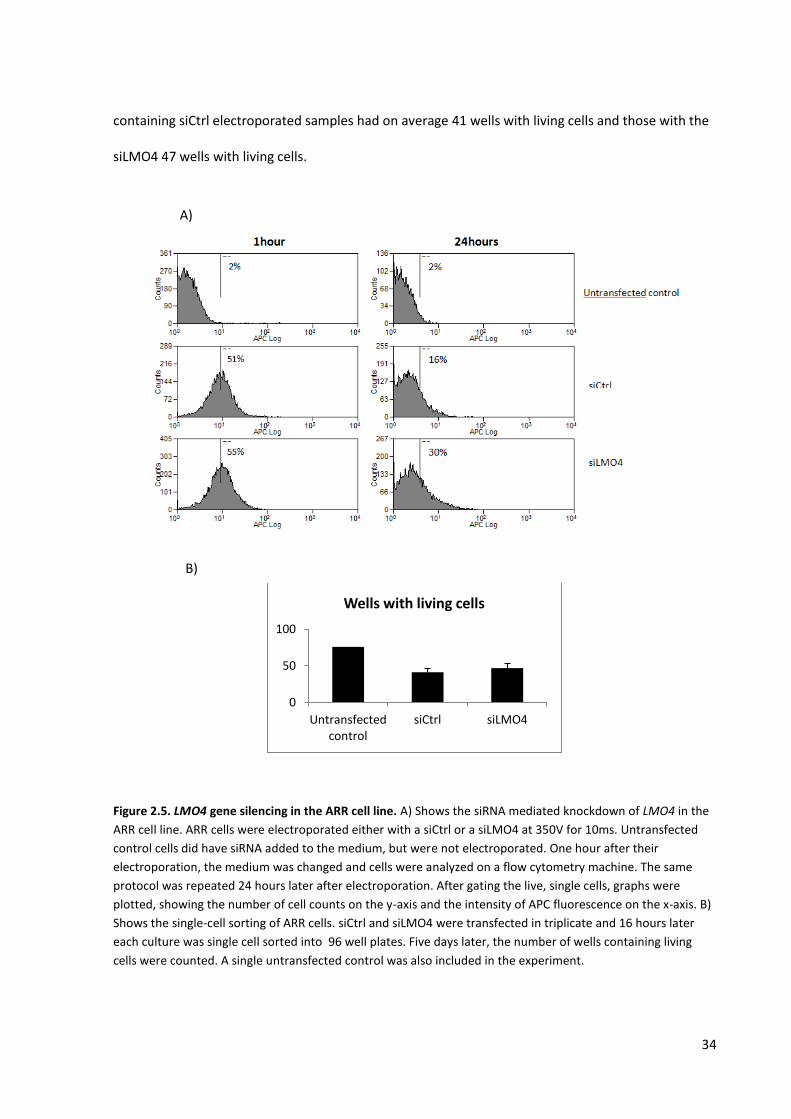
Analysis of the graphs showed efficient transfection (Fig.2.5A). The shift of the siCtrl and siLMO4
curves to the right according to the population of untransfected ARR cells, indicated that more than
half of the cells were having a fluorescence intensity higher than the control. In fact, the appearance
that the whole peak had shifted and the absence of a separate negative peak within the samples,
indicates that it is likely that all cells were containing the siRNA. Twenty-four hours after transfection,
cells lost a high percentage of the Cy5 fluorescence signal; i.e. 35% for the control and 25% for the
siLMO4 siRNA. We expected this to be due to the cellular degradation of the Cy5 dye. Unfortunately,
we did not detect any clear differences between the cells that were transfected with siLMO4
compared to the siCtrl transfected cells. We obtained more cell death than we had expected with the
square wave electroporator, which obscured potential effects on cell population scale.
Therefore, we performed another experiment in triplicate, where we sorted the cells by FACS. We
decided to sort single cells using a droplet-based microfluid sorter (MoFlo), enabling single-cell
sorting into 96-well plates. This technique allowed us to quantify the number of successfully
transfected cells that could grow on and see if the LMO4 gene is important for the survival and
proliferation of T-ALL cells.
For each of the triplicates of the siCtrl or siLMO4 transfections we sorted one 96-well plate with
single cells. In addition, we sorted one plate of untransfected cells in order to determine the
efficiency of single cell sorting and the influence of FACS on cell viability. After approximately one
week, all the wells were assessed for the presence of cells. The results, as shown in figure 2.5B,
showed that 76 out of 96 wells contained living cells for the untransfected cells. The three plates
34
containing siCtrl electroporated samples had on average 41 wells with living cells and those with the
siLMO4 47 wells with living cells.
Figure 2.5. LMO4 gene silencing in the ARR cell line. A) Shows the siRNA mediated knockdown of LMO4 in the
ARR cell line. ARR cells were electroporated either with a siCtrl or a siLMO4 at 350V for 10ms. Untransfected
control cells did have siRNA added to the medium, but were not electroporated. One hour after their
electroporation, the medium was changed and cells were analyzed on a flow cytometry machine. The same
protocol was repeated 24 hours later after electroporation. After gating the live, single cells, graphs were
plotted, showing the number of cell counts on the y-axis and the intensity of APC fluorescence on the x-axis. B)
Shows the single-cell sorting of ARR cells. siCtrl and siLMO4 were transfected in triplicate and 16 hours later
each culture was single cell sorted into 96 well plates. Five days later, the number of wells containing living
cells were counted. A single untransfected control was also included in the experiment.
0
50
100
Untransfected control
siCtrl siLMO4
Wells with living cells
A)
B)
35
These results indicate that the LMO4 gene is not easily silenced when siRNAs are introduced into ARR
cells. A reason would be that the Cy5 fluorescent dye is degraded by the cells and that the
transfection approaches are not as efficient as we would expect. Thus, LMO4 knock down should be
tested by other approaches.

36
DISCUSSION
Definitive haematopoiesis is a process that involves HSCs which can give rise to all blood lineages of
the adult organism (1). T lymphocytes are derived from these HSCs through a series of differentiation
stages, becoming functional and protecting the organism from harmful antigens. During
differentiation, ETPs are subjected to multiple cellular and molecular changes, switching off non-
lymphoid genes and procuring a functional T-cell phenotype. The DN3 stage is fundamental for T-cell
fate as it is at this point where immature cells stop proliferating and enter the process of V(D) J
recombination. Successful recombination will allow cells to express a functional TCR, important for
recognizing multiple cells and antigens. However, when the recombination system gets deregulated,
translocations occur which together with other mutations lead to malignant clonal expansion of
immature T-cells called T-ALL (46).
Our research mainly focused on a phenotypically immature T-ALL subtype, where it has been
hypothesized that ETPs are oncogenically transformed and respond poorly to lymphoid cell-directed
chemotherapy (46). Analysis of this ETP-ALL subgroup demonstrated that LMO4 gene was present at
relatively high expression levels in this early T-ALL group (49). As LMO4 has a known role in
carcinogenesis in several non-haematopoietic tissues and is closely related to LMO1 and LMO2,
which are well known for their role in T-ALL, we wanted to find out more about its involvement in T-
ALL. In order to enlighten the role of LMO4 in the transcriptional complex of T-ALL, we aimed to
characterize it by performing proteomics approaches together with gene knockdown.

37
Phenotypical analysis of utilised cell lines
The first objective that we wanted to study was to investigate the presence of the LMO1, LMO2, and
LMO4 proteins in immature T-ALL cell lines. Identification of human early T-cell progenitor T-ALL cell
lines was of major importance as it would help us to set up all our experiments. Previous studies of
Sandberg et al., (2007), characterized 23 human T-ALL cell lines by doing immunophenotypical
analyses (80). In their list the ARR and DU.528 cell lines had a distinct cell immunophenotype (CD1a-
,CD2-,CD3-,CD4-,CD5- ,CD7+,CD8- and TCR-) which correlated with studies done on ETP-ALL (46). As
controls we decided to work on Jurkat cells, a T-ALL cell line blocked at a relatively mature stage,
with a TCR expression and was SP (CD4+, CD8-). We also wanted to include Molt-4 cells in our
experiments as it is a DP (CD4+, CD8+) cell line that does not express a TCR. Together these cell lines
offered the opportunity to put our data in the context of developmental stages.
Before starting the experiments, we first wanted to confirm the developmental hierarchy between
the four cell lines. Flow cytometry was performed with an APC-conjugated antibody recognising the
human CD3ε subunit. We decided to analyze the CD3 expression as it is a defining feature of cells
fully committing to the T-cell lineage, together with the TCR. CD3 is composed of four polypeptide
chains (ε , γ ,δ, ζ) which together assemble as three pairs of dimmers (εγ,εδ,ζζ) and act as a T-cell co-
receptor (82). Thus, if cells do express the CD3 marker, under normal circumstances they will also
express the TCR, which means that they are not very immature anymore.
The flow cytometry results showed the relative fluorescence of the CD3 conjugated antibody to APC
on a logarithmic scale. Comparing the CD3 stained ARR and DU.528 cell lines to the control, this
showed that they did not express the CD3 marker on their cell surface. Molt-4 and Jurkat did both
express CD3 with Jurkat showing clearly higher expression levels on the logarithmic scale. These data
were in line with a developmental hierarchy of ARR and DU.528 as CD4, CD8 double negative early T-
cells, followed by the CD4, CD8 double positive Molt-4 and CD4 single positive Jurkat having the most
38
mature T-cell phenotype. These results correlated with the published research of Sandberg et al.,
(2007) (46).
As part of the characterisation of the four cell lines, we wanted to measure their growth rates. Cells
were counted regularly during one week. A growth curve analysis was performed showing the
doubling time of each cell line. All four cell lines were fast growing with relatively similar doubling
times. Faster growth could be an indication of a more aggressive form of leukaemia. In this case, the
early progenitor cell line ARR was the fastest growing of the four, following a doubling time of 23.3
hours. However, DU.528 was third out of the four cell lines with 28 hours, which makes it less likely
that the immature T-ALL are characterized by particularly fast proliferation as compared to other T-
ALL.
Expression of LMO proteins and functionally related transcription factors
T-ALL is a type of blood cancer that can lead to rapid progression and relapse within the first years
following diagnosis. During the last decades, much effort was put in characterizing the molecular and
genetic alterations that cause leukaemia. As a result, novel genes and molecular mechanisms have
been identified in being involved in T-ALL. Although a number of specific translocations have been
well studied, many details on the alterations at the molecular level have yet to be unravelled,
especially in those cases where the underlying initiating event is not known. The purpose of our work
was to gain a better understanding of the genetic and molecular expression of the LMO proteins and
interaction partners in immature ETP or T-ALL.
We started our experiments by quantifying the mRNA expression levels of the LMO1, LMO2, LMO4
and TAL1 genes in the four cell lines. The qPCR results showed that the LMO1 relative mRNA level
was expressed at high levels in Jurkat, to a lesser extent in Molt-4 and absent in ARR and DU.528.
These results correlated with studies by Oram SH et al., (2013), who used these two cell lines and

39
looked at the regulation of the LMO1 gene in T-ALL (81). The absence of LMO1 in the ETP-ALL (ARR
and DU.528) lead us to exclude LMO1 as focus of any further experiments. Following this, we found
that LMO2 mRNA and protein expression was not detectable in Jurkat cells, which was expected, as
high expression of LMO1 and LMO2 seem to be mutually exclusive. This is likely to be due to their
highly similar role in leukaemogenesis, i.e. once high expression of either LMO1 or LMO2 is
established, there is no advantage for cells to gain high expression of the other (83). Furthermore,
the other three cell lines were found to express LMO2 protein, being at higher levels in DU.528 and
Molt-4. This shows that the mRNA abundance of LMO2 is successfully transcribed into a functional
protein with a high stability against proteosomal degradation, e.g. due to its interaction with TAL1.
TAL1-LMO2 interaction links protein stabilization with higher order protein complex assembly and
thus modulates its post-transcriptional degradation (84), which is not always the case as it will be
explained below.
For the LMO4 protein expression levels, Western blot analysis showed an anti-correlation with the
differentiation stages of the cell lines, as it was more abundant in ARR and DU.528 than in Molt-4 and
further reduced in Jurkat cells. Interestingly, the mRNA expression levels were not fully correlating
with the protein expression pattern as DU.528 cells had clearly lower LMO4 mRNA levels. A
hypothesis would be that the post-transcriptional regulation renders it more stable in DU.528,
producing higher amounts of steady state protein levels per mRNA than in the other cell lines.
These results are of high importance as it allowed us to evaluate the LMO protein expression in
different developmental stages of human T-ALL cell lines. To begin with, it seems that LMO4 is
expressed during all the developmental stages of T-ALL with higher levels in the most immature
stages, declining during differentiation. This may represent normal development and can point in the
direction that LMO4 is necessary during the ETP stage and that a failure to downregulate LMO4 leads
to aberrant differentiation. On the other hand, LMO2 is highly expressed in DU.528 cell line which
40
carries a TAL1 gene alteration, as detailed below, which together with secondary hit mutations is
sufficient for the T-cell developmental arrest and clonal expansion at immature stages (85, 86).
Furthermore, despite that LMO2 is expressed in immature T-ALL cell lines, it is also present in more
differentiated stages. This indicates that the exact developmental stage at which leukaemic cells with
LMO2 overexpression are blocked is dependent on more parameters than LMO2 alone.
Having studied the LMO transcriptomic and proteomic expression in the cell lines, we decided to
perform the same experimental approaches to the proteins that are present in the same
transcription complex as LMOs. Ldb1 is a ubiquitously nuclear LIM domain binding protein, which
does not bind to DNA but participates in large transcriptional complexes as a co-factor (87). It
dimerizes through its N-terminal domain and binds LMO proteins or other LIM homeodomains
through its C-terminal LID domain (88). As mentioned before, there are differences in affinities of
LMO proteins for Ldb1 (78). Enforced expression of LMO2 as a result of chromosomal translocations
was hypothesized to displace LMO4 from Ldb1 causing T-cell developmental arrest (75). This may
indeed be the case in DU.528 and Molt-4, as the protein expression levels of Ldb1 are higher in these
cell lines, as is LMO2.This also indicates that different components of the same complex have a
similar mode of regulation of their expression, possibly through positive feedback mechanisms. We
can also predict that Ldb1 interacts more with LMO4 in the ARR cell lines where LMO2 is less
abundant. Finally, Ldb1 interacts with LMO1 in Jurkat cells as LMO2 and LMO4 are nearly absent.
TAL1 is another protein of the transcriptional complex which in normal haematopoiesis gets
downregulated. TAL1 is a bHLH protein which binds to other E-box factors, such as E2A (E47/E12).
E2A and the bHLH component of TAL1 are able to bind the E-box motif found in transcriptional
enhancers regulating transcription during haematopoiesis (89). What is more, TAL1 binds to LMO2
and GATA-2 in normal conditions. However, TAL1 gets frequently deregulated exerting its oncogenic

41
effect by inhibiting the tumour suppressor characteristics of E2A and thus stopping lymphoid cell
differentiation (90).
It is also important to mention that 12-25% of T-ALL cases have a submicroscopic 90 kb deletion that
fuses the coding sequence of TAL1 to the first exon of the SCL interrupting locus (SIL) gene and
results to a SIL/TAL1 fusion gene (91, 92). Although the latter leads to a fusion transcript, there is no
SIL-TAL1 fusion protein formation, but only TAL1 deregulated expression (93). The DU.528 cell line
has been shown to contain the SIL-TAL fusion (103).Interestingly, our results indicate that TAL1
protein expression is only detectable in the ARR and Jurkat cell lines. Intriguingly, TAL1 mRNA
expression levels are high in DU.528, as would be expected. We therefore conclude that although the
DU.528 cell line possesses the SIL-TAL translocation, which leads to high levels of transcription, this is
not reflected in high protein levels. This may be due to high levels of protein degradation, or possibly
mutations in the coding region causing a frame shift. Published data have identified two ways of
degrading TAL1 through the ubiquitin-proteasome pathway. The first pathway involves Notch
signalling which requires Skp2, a substrate-binding subunit of SCF ubiquitin ligase complexes which
together with CHIP, a protein with a ubiquitin ligase activity degrade TAL1 (94).The second pathway
induces TAL1 degradation through TGF-β which activates AKT1, phosphorylates TAL1 and binds to
CHIP (95). Importantly, this data shows that the analysis of mRNA expression levels in leukaemia
does not always automatically represent protein levels. This indication should be considered in
studies on gene expression in T-ALL, or other cells, as protein expression levels have to be considered
in order to confirm gene expression levels.
It would be interesting to perform whole cell extract mass spectrometry analysis on patient samples
to see whether this improves the link between expression profile clustering and clinical outcome.
Another fascinating fact is that in DU.528 cells, the TAL1 translocation was the reason for the
leukaemia to develop, but that at a later stage the TAL1 protein was apparently not needed any more

42
for an unknown reason. It needs to be kept in mind however, that the time point when this occurred,
may have been after isolation and establishment of the cell line, rather than within the patient.
An alternative oncogenic factor would be Lyl1, a bHLH transcription factor which also interacts with
LMO1 and LMO2 (96). Lyl1 and Tal1 are both important during haematopoiesis but in different
devepmental stages. During early haematopoietic development, LMO2 and Tal1 interact in a DNA
binding complex that we previously explained. However, gene expression analyses of LMO2
transgenic thymocytes have demonstrated a gene expression profile that is similar to human
immature T-ALL cases where LYL1 is overexpressed instead of TAL1 (97). Researchers showed that
LMO2 binding to LYL1 induced its promoter activation, which together with the downstream target
gene Hhex caused T-ALL growth (98). Thus, it may be that the DU.528 cell line expresses LYL1 instead
of TAL1.
As mentioned above, GATA-2 and GATA-3 are also important for lymphoid differentiation. GATA-2
needs to become downregulated at early stages and GATA-3 is needed for T-cell lineage commitment
and regulates TCR gene rearrangement (7). To check the expression levels of GATA-2 and GATA-3,
Western blot analysis was performed. The results showed that GATA-2 had a similar expression
profile to LMO4 protein, showing that it followed its normal downregulation during differentiation.
Whether the presence of LMO4 and GATA-2 in ARR cells means they can co-occupy the same
transcriptional complex, as is the case for LMO2 and GATA-2, remains to be determined. GATA-3 was
clearly detected in the ARR and Jurkat cell lines. As a true T-cell transcription factor this was expected
for the Jurkat cell line, but it is interesting that also the early ARR cells already contain relatively high
levels of GATA-3.
Finally, identification of the Haematopoietically-expressed homeobox (Hhex) gene in ETP-ALL cell
lines (99) has raised our curiosity to analyse its protein expression. Hhex is a divergent orphan
homeobox gene essential for the embryonic formation of the foregut, the central nervous system, as

43
well as the endothelial and haematopoietic cells (100).High levels of Hhex expression in
haematopoietic lymphoid precursor cells inhibit their maturation process disrupting normal T-cell
development. Alex George et al., (2003) demonstrated that lower levels of Hhex expression in the
same progenitors induced immature T-cell lymphomas in bone marrow recipient mice (101). They
also suggested that Hhex can act as an oncogene in lymphoid cells and that it is fundamental for
progenitor cell contribution to mature blood cell lineages. Recently, Stephen Smith et al., (2014)
identified ETP-ALL oncogenes that are upregulated such as Lyl1, Hhex and Mycn in LMO2 transgenic
T-ALL mice (99). They also showed that by knocking down LMO2 gene, Hhex and Mycn mRNAs
decreased by 40% in ETP-ALL cells, suggesting that LMO2 induces the expression of Hhex to trigger T-
ALL. We concluded from these data that Hhex is a transcriptional target of LMO2 which can be
involved in the onset of T-ALL by an as yet unidentified mechanism. We performed Western blot
analysis to identify the Hhex protein and found its expression pattern to be similar to that of LMO4
and GATA-2, i.e. protein levels decreased as in the normal T-cell maturation stages. Despite the high
levels of LMO1 in Jurkat cells, Hhex levels were relatively low in these cells. It is interesting to
speculate whether this means that LMO1 cannot activate the Hhex gene in the way LMO2 does. This
would be interesting to follow up, as it is currently unclear whether LMO1 and LMO2 are having
completely identical functions in the onset and maintenance of T-ALL.
Identification of new interacting partners of Ldb1
In our effort to better understand the transcription factor complexes containing LMO2 or LMO4, we
decided to start with a focus on Ldb1. We expect Ldb1 to be an obligate partner for both LMO2 and
LMO4 and have an antibody that recognises it efficiently. We performed immunoprecipitations of
the Ldb1 protein from the nuclear extracts of the two immature cell lines ARR and DU.528. This was
followed by several preparation processes in order to prepare the samples for mass spectrometry
analysis. The results identified many proteins, some of which were common to the negative control

44
and some of which were unique and therefore potentially interacting with Ldb1. To analyse this list
further, we only kept the unique pulled down proteins from Ldb1 and generated a “String Network”,
which reports all known common interactions between proteins. Many ribosomal subunits were
identified, which show within the network as a dense cluster, especially in ARR. These are likely
contaminants from the cytoplasm, as these ribosomal proteins are expressed in abundance.
Alternatively, these could be pulled down during Ldb1 mRNA translation. A suggestion to improve
the results would be to completely purify nuclei by following a longer and more laborious nuclear
extraction protocol.
Despite this, we managed to identify proteins such as the core-binding factor beta subunit (CBFβ)
which binds to the core site, 5'-PYGPYGGT-3', of a number of enhancers and promoters, including
murine leukaemia virus, polyomavirus enhancer, T-cell receptor enhancers, LCK, IL-3 and GM-CSF
promoters in the ARR cell line. CBFβ enhances DNA binding by RUNX1 and is important in inducing T-
cell differentiation. The protein kinase DNA-activated catalytic polypeptide (PRKDC) is a
Serine/threonine-protein kinase that acts as a molecular sensor for DNA damage. It is involved in
DNA non-homologous end joining (NHEJ) required for double-strand break (DSB) repair and V (D) J
recombination. PRKDC interacts with the heterogeneous nuclear ribonucleoprotein A1 and C
(HNRNPA1, HNRNPC) involved in the packaging of pre-mRNA into hnRNP particles and modulate the
stability and level of translation of mRNA molecules. The protein phosphatase 1 catalytic subunit
alpha isoform (PPP1CA) is essential for cell division, and participates in the regulation of glycogen
metabolism, muscle contractility and protein synthesis. It also may play an important role in
dephosphorylating substrates. The H2A histone family member V (H2AFV) which replaces
conventional H2A in a subset of nucleosomes. Nucleosomes wrap and compact DNA into chromatin,
limiting DNA accessibility to the cellular machineries which require DNA as a template. Histones
thereby play a central role in transcription regulation, DNA repair, DNA replication and chromosomal
stability. The heat shock 70kDa protein 9 (HSPA9) is related in the control of cell proliferation and

45
cellular aging. Lectin galactoside-binding soluble 1(LGALS1) may regulate apoptosis, cell proliferation
and cell differentiation.
Concerning the pulled down proteins in DU.528 cell line, more intriguing proteins were identified,
such as histone deacetylase 1(HDAC1), which is responsible for the deacetylation of lysine residues
on the N-terminal part of the core histones (H2A, H2B, H3 and H4). Histone deacetylation gives a tag
for epigenetic repression and plays an important role in transcriptional regulation, cell cycle
progression and developmental events. The splicing factor 3b, subunit 1 (SF3B1) may be involved in
the assembly of the E-complex. The LIM domain 7 (LMO7) protein, which may be involved in protein-
protein interaction. The KH domain containing RNA binding signal transduction associated
1(KHDRBS1) which has a role in G2-M progression in the cell cycle. It represses CBP-dependent
transcriptional activation apparently by competing with other nuclear factors for binding to CBP. The
tyrosine 3-monooxygenase/tryptophan 5-monooxygenase activation protein, theta polypeptide
(YWHAQ) is an adapter protein implicated in the regulation of a large spectrum of both general and
specialized signalling pathway. We conclude that many interacting proteins are important in the
regulation of T-cell maturation such as CBP, the E-complex and possibly LMO7. Identifying LMO7 is
very interesting as little is known about its functions and mode of action especially in lymphoid cell
lines. A suggestion would be that LMO7 could be associated to DU.528 tumourigenesis as a
consequence of TAL1 translocation and absence in this cell line.
Identification of these different proteins as potential interactors with Ldb1 show that Ldb1 might be
important in T-cell differentiation as its interacting partners are involved in DNA replication, DNA
repair, transcription regulation, cell proliferation and differentiation. However, the interactions of
these proteins need to be further confirmed by repeating the mass spectrometry analysis and
performing pull down experiments followed by Western blotting. Interestingly, the LMO proteins
themselves were not identified, despite our ability to detect LMO2 by Western blotting in the Ldb1
46
pull down samples that were sent for mass spectrometry. After assessing the prediction of the tryptic
digestion on the relatively small LMO proteins within the procedure, it is likely that the generated
peptides are not ideal for detection by the mass spectrometer. Usage of a different enzyme to digest
proteins could improve this, but may have detrimental effects on the detection of other proteins.
LMO4 knockdown using siRNA transfection
The purpose of knocking down the LMO4 gene was to study its role in early T-ALL. siRNA was
transferred into the cells by electroporation. The siRNA is subsequently intracellularly separated into
two strands, one of which is specific for a region of the target mRNA, in this case LMO4. This strand
then interacts with the mRNA targeting it for degradation and inhibiting mRNA translation (102).
Two possibilities to perform LMO4 knockdown in ARR cells were considered. One was by
transduction of the cells with a Lentivirus, the other by delivery of siRNA by electroporation. Previous
work within the Hoogenkamp laboratory had the Lmo4 gene successfully silenced in mouse cells by
expressing shRNAs from a mir-30 backbone by a Retrovirus. This work lead to the conclusion that
there was an apoptotic phenotype upon knockdown of Lmo4, which was problematic for the
analysis, as cells were dying at the same time or before the Green Fluorescent Protein (GFP) selection
marker was becoming expressed. This made, that for the current research, we would need a
Lentivirus with a doxycycline inducible siRNA module. Time constraints related to obtaining and
cloning the Lentiviral vector, made us choose for the transfection of siRNA. The siRNA sequence was
designed based on the successful mouse shRNA knockdown.
We performed several optimizations concerning the voltage, pulse length and siRNAs concentration
and the results indicated that the majority of cells were transfected. Initially we found that the
addition of siRNA to the medium without electroporation lead to an accumulation of Cy5 in or on the
cells after several hours. When we changed to washing the free dye out of the medium one hour

47
after transfection this problem was solved, however, we noticed that the presence of the dye was
quickly reduced at later time points. We related this to the cellular degradation of the Cy5 dye,
suggesting that with future experiments we could change the type of fluorescence tag to see
whether that would be more long-lived.
The fact that we could not detect any clear differences between the total siLMO4 and siCtrl cultures,
lead us to sort single cells into individual wells and quantify the surviving cells several days after
transfection. The results showed that the same number of single cell derived colonies were observed
for cells transfected with a shLMO4 or siCtrl. This means that either the LMO4 gene was not
sufficiently silenced, which we hoped to avoid by having a siRNA sequence that was proven to work
in mouse, or that the siRNA works faster, at the time many cells are already going into apoptosis due
to the transfection procedure itself. Because of this it would be wiser to perform silencing of LMO4
by cloning the sequence of interest (shLMO4) into a doxycycline inducible Lentiviral vector. Cells can
then be transduced and the addition of doxycycline to the medium can induce silencing. In this way,
cells that are successfully transduced can be selected for using a selectable marker, while the
knockdown is not yet occurring keeping the cells in a non-stressed state that is effectively wild type.
Upon induction the effect of the knockdown can then be analysed in isolation.
This research allowed us to characterise two cells lines that can serve as a model for ETP-ALL and
provided us with a better insight into the role of the LMO proteins in this leukaemia. The presence of
LMO4 during ETP maturation process indicates that it could be directly involved during the onset of
ETP-ALL, but this has to be further confirmed. The results with TAL1 can also be very significant for
future research, as we showed that it is not present at high levels despite the SIL/TAL fusion. An
interesting approach would be to perform mass spectrometry analyses on whole cell extracts of T-
ALL samples. Additionally, as LYL1 is a protein that can have similar functions within the same
complexes as TAL1, this oncogenic factor should be included in future studies within ETP-ALL. Thus,

48
more investigations still have to be done on this genetic instable ETP-ALL subtype with poor
prognosis in order to understand and prevent transformed ETPs from entering proliferation and self-
renewal.
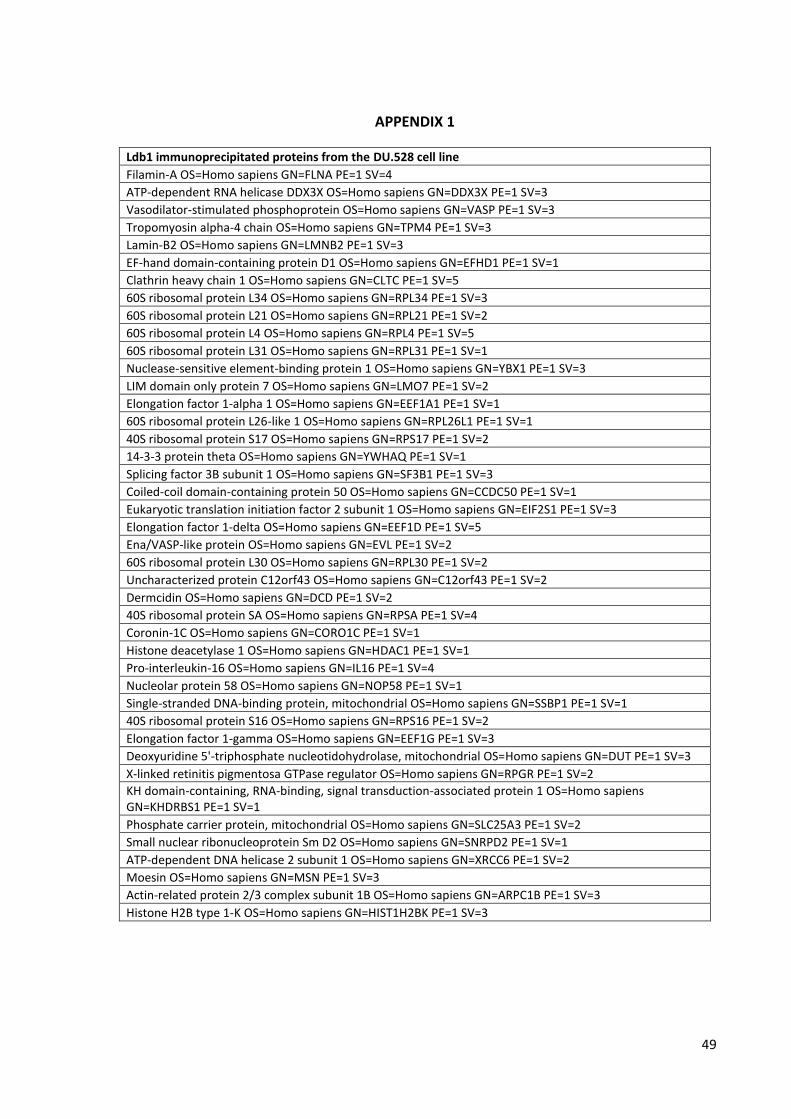
49
APPENDIX 1
Ldb1 immunoprecipitated proteins from the DU.528 cell line
Filamin-A OS=Homo sapiens GN=FLNA PE=1 SV=4
ATP-dependent RNA helicase DDX3X OS=Homo sapiens GN=DDX3X PE=1 SV=3
Vasodilator-stimulated phosphoprotein OS=Homo sapiens GN=VASP PE=1 SV=3
Tropomyosin alpha-4 chain OS=Homo sapiens GN=TPM4 PE=1 SV=3
Lamin-B2 OS=Homo sapiens GN=LMNB2 PE=1 SV=3
EF-hand domain-containing protein D1 OS=Homo sapiens GN=EFHD1 PE=1 SV=1
Clathrin heavy chain 1 OS=Homo sapiens GN=CLTC PE=1 SV=5
60S ribosomal protein L34 OS=Homo sapiens GN=RPL34 PE=1 SV=3
60S ribosomal protein L21 OS=Homo sapiens GN=RPL21 PE=1 SV=2
60S ribosomal protein L4 OS=Homo sapiens GN=RPL4 PE=1 SV=5
60S ribosomal protein L31 OS=Homo sapiens GN=RPL31 PE=1 SV=1
Nuclease-sensitive element-binding protein 1 OS=Homo sapiens GN=YBX1 PE=1 SV=3
LIM domain only protein 7 OS=Homo sapiens GN=LMO7 PE=1 SV=2
Elongation factor 1-alpha 1 OS=Homo sapiens GN=EEF1A1 PE=1 SV=1
60S ribosomal protein L26-like 1 OS=Homo sapiens GN=RPL26L1 PE=1 SV=1
40S ribosomal protein S17 OS=Homo sapiens GN=RPS17 PE=1 SV=2
14-3-3 protein theta OS=Homo sapiens GN=YWHAQ PE=1 SV=1
Splicing factor 3B subunit 1 OS=Homo sapiens GN=SF3B1 PE=1 SV=3
Coiled-coil domain-containing protein 50 OS=Homo sapiens GN=CCDC50 PE=1 SV=1
Eukaryotic translation initiation factor 2 subunit 1 OS=Homo sapiens GN=EIF2S1 PE=1 SV=3
Elongation factor 1-delta OS=Homo sapiens GN=EEF1D PE=1 SV=5
Ena/VASP-like protein OS=Homo sapiens GN=EVL PE=1 SV=2
60S ribosomal protein L30 OS=Homo sapiens GN=RPL30 PE=1 SV=2
Uncharacterized protein C12orf43 OS=Homo sapiens GN=C12orf43 PE=1 SV=2
Dermcidin OS=Homo sapiens GN=DCD PE=1 SV=2
40S ribosomal protein SA OS=Homo sapiens GN=RPSA PE=1 SV=4
Coronin-1C OS=Homo sapiens GN=CORO1C PE=1 SV=1
Histone deacetylase 1 OS=Homo sapiens GN=HDAC1 PE=1 SV=1
Pro-interleukin-16 OS=Homo sapiens GN=IL16 PE=1 SV=4
Nucleolar protein 58 OS=Homo sapiens GN=NOP58 PE=1 SV=1
Single-stranded DNA-binding protein, mitochondrial OS=Homo sapiens GN=SSBP1 PE=1 SV=1
40S ribosomal protein S16 OS=Homo sapiens GN=RPS16 PE=1 SV=2
Elongation factor 1-gamma OS=Homo sapiens GN=EEF1G PE=1 SV=3
Deoxyuridine 5'-triphosphate nucleotidohydrolase, mitochondrial OS=Homo sapiens GN=DUT PE=1 SV=3
X-linked retinitis pigmentosa GTPase regulator OS=Homo sapiens GN=RPGR PE=1 SV=2
KH domain-containing, RNA-binding, signal transduction-associated protein 1 OS=Homo sapiens GN=KHDRBS1 PE=1 SV=1
Phosphate carrier protein, mitochondrial OS=Homo sapiens GN=SLC25A3 PE=1 SV=2
Small nuclear ribonucleoprotein Sm D2 OS=Homo sapiens GN=SNRPD2 PE=1 SV=1
ATP-dependent DNA helicase 2 subunit 1 OS=Homo sapiens GN=XRCC6 PE=1 SV=2
Moesin OS=Homo sapiens GN=MSN PE=1 SV=3
Actin-related protein 2/3 complex subunit 1B OS=Homo sapiens GN=ARPC1B PE=1 SV=3
Histone H2B type 1-K OS=Homo sapiens GN=HIST1H2BK PE=1 SV=3

50
Ldb1 immunoprecipitated proteins from the ARR cell line
Heat shock cognate 71 kDa protein OS=Homo sapiens GN=HSPA8 PE=1 SV=1
Transferrin receptor protein 1 OS=Homo sapiens GN=TFRC PE=1 SV=2
78 kDa glucose-regulated protein OS=Homo sapiens GN=HSPA5 PE=1 SV=2
Myosin-Va OS=Homo sapiens GN=MYO5A PE=1 SV=1
Calmodulin OS=Homo sapiens GN=CALM1 PE=1 SV=2
Myosin-10 OS=Homo sapiens GN=MYH10 PE=1 SV=3
F-actin-capping protein subunit alpha-1 OS=Homo sapiens GN=CAPZA1 PE=1 SV=3
Guanine nucleotide-binding protein Gsubunit alpha-2 OS=Homo sapiens GN=GNAI2 PE=1 SV=3
Dedicator of cytokinesis protein 8 OS=Homo sapiens GN=DOCK8 PE=1 SV=3
Probable ATP-dependent RNA helicase DDX5 OS=Homo sapiens GN=DDX5 PE=1 SV=1
40S ribosomal protein S13 OS=Homo sapiens GN=RPS13 PE=1 SV=2
AP-2 complex subunit beta OS=Homo sapiens GN=AP2B1 PE=1 SV=1
Polyadenylate-binding protein 1 OS=Homo sapiens GN=PABPC1 PE=1 SV=2
LIM domain and actin-binding protein 1 OS=Homo sapiens GN=LIMA1 PE=1 SV=1
Serine/threonine-protein phosphatase PP1-alpha catalytic subunit OS=Homo sapiens GN=PPP1CA PE=1 SV=1
60S ribosomal protein L24 OS=Homo sapiens GN=RPL24 PE=1 SV=1
40S ribosomal protein S10 OS=Homo sapiens GN=RPS10 PE=1 SV=1
Heat shock 70 kDa protein 6 OS=Homo sapiens GN=HSPA6 PE=1 SV=2
ATP-dependent RNA helicase DDX3X OS=Homo sapiens GN=DDX3X PE=1 SV=3
60S ribosomal protein L27a OS=Homo sapiens GN=RPL27A PE=1 SV=2
Peroxiredoxin-1 OS=Homo sapiens GN=PRDX1 PE=1 SV=1
40S ribosomal protein S9 OS=Homo sapiens GN=RPS9 PE=1 SV=3
Guanine nucleotide-binding protein G subunit alpha OS=Homo sapiens GN=GNAI3 PE=1 SV=3
AP-2 complex subunit alpha-1 OS=Homo sapiens GN=AP2A1 PE=1 SV=3
60S acidic ribosomal protein P2 OS=Homo sapiens GN=RPLP2 PE=1 SV=1
60S ribosomal protein L30 OS=Homo sapiens GN=RPL30 PE=1 SV=2
Putative tubulin-like protein alpha-4B OS=Homo sapiens GN=TUBA4B PE=5 SV=2
Putative heterogeneous nuclear ribonucleoprotein A1-like 3 OS=Homo sapiens GN=HNRPA1L3 PE=5 SV=1
60S ribosomal protein L11 OS=Homo sapiens GN=RPL11 PE=1 SV=2
Trypsin-3 OS=Homo sapiens GN=PRSS3 PE=1 SV=2
60S acidic ribosomal protein P0 OS=Homo sapiens GN=RPLP0 PE=1 SV=1
Core-binding factor subunit beta OS=Homo sapiens GN=CBFB PE=1 SV=2
Actin-related protein 2/3 complex subunit 4 OS=Homo sapiens GN=ARPC4 PE=1 SV=3
40S ribosomal protein S25 OS=Homo sapiens GN=RPS25 PE=1 SV=1
60S ribosomal protein L6 OS=Homo sapiens GN=RPL6 PE=1 SV=3
DNA-dependent protein kinase catalytic subunit OS=Homo sapiens GN=PRKDC PE=1 SV=3
Ras-related protein Rab-7a OS=Homo sapiens GN=RAB7A PE=1 SV=1
40S ribosomal protein S4, X isoform OS=Homo sapiens GN=RPS4X PE=1 SV=2
60S ribosomal protein L18a OS=Homo sapiens GN=RPL18A PE=1 SV=2
Actin-related protein 2/3 complex subunit 3 OS=Homo sapiens GN=ARPC3 PE=1 SV=3
Keratin, type II cytoskeletal 8 OS=Homo sapiens GN=KRT8 PE=1 SV=7
40S ribosomal protein S16 OS=Homo sapiens GN=RPS16 PE=1 SV=2
40S ribosomal protein S20 OS=Homo sapiens GN=RPS20 PE=1 SV=1
Galectin-1 OS=Homo sapiens GN=LGALS1 PE=1 SV=2
Cyclin-Y OS=Homo sapiens GN=CCNY PE=1 SV=2
Heterogeneous nuclear ribonucleoprotein U OS=Homo sapiens GN=HNRNPU PE=1 SV=6
Profilin-1 OS=Homo sapiens GN=PFN1 PE=1 SV=2
40S ribosomal protein S23 OS=Homo sapiens GN=RPS23 PE=1 SV=3
Dermokine OS=Homo sapiens GN=DMKN PE=1 SV=3

51
Golgi-associated plant pathogenesis-related protein 1 OS=Homo sapiens GN=GLIPR2 PE=1 SV=3
60S ribosomal protein L37a OS=Homo sapiens GN=RPL37A PE=1 SV=2
60S ribosomal protein L14 OS=Homo sapiens GN=RPL14 PE=1 SV=4
Thioredoxin OS=Homo sapiens GN=TXN PE=1 SV=3
Tubulin beta-4 chain OS=Homo sapiens GN=TUBB4 PE=1 SV=2
Heterogeneous nuclear ribonucleoproteins C1/C2 OS=Homo sapiens GN=HNRNPC PE=1 SV=4
40S ribosomal protein S24 OS=Homo sapiens GN=RPS24 PE=1 SV=1
40S ribosomal protein S18 OS=Homo sapiens GN=RPS18 PE=1 SV=3
ADP/ATP translocase 3 OS=Homo sapiens GN=SLC25A6 PE=1 SV=4
Stress-70 protein, mitochondrial OS=Homo sapiens GN=HSPA9 PE=1 SV=2
Clathrin interactor 1 OS=Homo sapiens GN=CLINT1 PE=1 SV=1
Cofilin-1 OS=Homo sapiens GN=CFL1 PE=1 SV=3
Histone H2A.V OS=Homo sapiens GN=H2AFV PE=1 SV=3
Raftlin OS=Homo sapiens GN=RFTN1 PE=1 SV=4
40S ribosomal protein S15a OS=Homo sapiens GN=RPS15A PE=1 SV=2

52
LIST OF REFERENCES
1. Jagannathan-Bogdan M, Zon LI. Haematopoiesis. Development (Cambridge, England). 2013;140(12):2463-7. 2. Galloway JL, Zon LI. Ontogeny of haematopoiesis: examining the emergence of haematopoietic cells in the vertebrate embryo. Current topics in developmental biology. 2003;53:139-58. 3. Orkin SH, Zon LI. Haematopoiesis: an evolving paradigm for stem cell biology. Cell. 2008;132(4):631-44. 4. Scimone ML, Aifantis I, Apostolou I, von Boehmer H, von Andrian UH. A multistep adhesion cascade for lymphoid progenitor cell homing to the thymus. Proceedings of the National Academy of Sciences of the United States of America. 2006;103(18):7006-11. 5. Bell JJ, Bhandoola A. The earliest thymic progenitors for T cells possess myeloid lineage potential. Nature. 2008;452(7188):764-7. 6. Anderson MK. At the crossroads: diverse roles of early thymocyte transcriptional regulators. Immunological reviews. 2006;209:191-211. 7. Michael Litt, Bhavita Patel, Ying Li, Yi Qiu and Suming Huang (2013). Molecular Morphogenesis of T-Cell Acute Leukemia, T-Cell Leukemia - Characteristics, Treatment and Prevention, Dr. Mariko Tomita (Ed.), ISBN: 978-953-51-0996-9, InTech, DOI: 10.5772/55144. Available from: http://www.intechopen.com/books/t-cell-leukemia-characteristics-treatment-and-prevention/molecular-morphogenesis-of-t-cell-acute-leukemia 8. Sambandam A, Maillard I, Zediak VP, Xu L, Gerstein RM, Aster JC, et al. Notch signaling controls the generation and differentiation of early T lineage progenitors. Nature immunology. 2005;6(7):663-70. 9. Koch U, Fiorini E, Benedito R, Besseyrias V, Schuster-Gossler K, Pierres M, et al. Delta-like 4 is the essential, nonredundant ligand for Notch1 during thymic T cell lineage commitment. The Journal of experimental medicine. 2008;205(11):2515-23. 10. Hozumi K, Mailhos C, Negishi N, Hirano K, Yahata T, Ando K, et al. Delta-like 4 is indispensable in thymic environment specific for T cell development. The Journal of experimental medicine. 2008;205(11):2507-13. 11. Weerkamp F, Luis TC, Naber BA, Koster EE, Jeannotte L, van Dongen JJ, et al. Identification of Notch target genes in uncommitted T-cell progenitors: No direct induction of a T-cell specific gene program. Leukemia. 2006;20(11):1967-77. 12. Koch U, Radtke F. Mechanisms of T cell development and transformation. Annual review of cell and developmental biology. 2011;27:539-62. 13. Porritt HE, Rumfelt LL, Tabrizifard S, Schmitt TM, Zuniga-Pflucker JC, Petrie HT. Heterogeneity among DN1 prothymocytes reveals multiple progenitors with different capacities to generate T cell and non-T cell lineages. Immunity. 2004;20(6):735-45. 14. Allman D, Sambandam A, Kim S, Miller JP, Pagan A, Well D, et al. Thymopoiesis independent of common lymphoid progenitors. Nature immunology. 2003;4(2):168-74. 15. El Andaloussi A, Graves S, Meng F, Mandal M, Mashayekhi M, Aifantis I. Hedgehog signaling controls thymocyte progenitor homeostasis and differentiation in the thymus. Nature immunology. 2006;7(4):418-26. 16. Di Santo JP, Radtke F, Rodewald HR. To be or not to be a pro-T? Current opinion in immunology. 2000;12(2):159-65. 17. Klein L, Hinterberger M, Wirnsberger G, Kyewski B. Antigen presentation in the thymus for positive selection and central tolerance induction. Nature reviews Immunology. 2009;9(12):833-44. 18. Ho IC, Pai SY. GATA-3 - not just for Th2 cells anymore. Cellular & molecular immunology. 2007;4(1):15-29.

53
19. Murre C. Helix-loop-helix proteins and lymphocyte development. Nature immunology. 2005;6(11):1079-86. 20. Agata Y, Tamaki N, Sakamoto S, Ikawa T, Masuda K, Kawamoto H, et al. Regulation of T cell receptor beta gene rearrangements and allelic exclusion by the helix-loop-helix protein, E47. Immunity. 2007;27(6):871-84. 21. Ikawa T, Kawamoto H, Goldrath AW, Murre C. E proteins and Notch signaling cooperate to promote T cell lineage specification and commitment. The Journal of experimental medicine. 2006;203(5):1329-42. 22. Pai SY, Truitt ML, Ting CN, Leiden JM, Glimcher LH, Ho IC. Critical roles for transcription factor GATA-3 in thymocyte development. Immunity. 2003;19(6):863-75. 23. Egawa T, Tillman RE, Naoe Y, Taniuchi I, Littman DR. The role of the Runx transcription factors in thymocyte differentiation and in homeostasis of naive T cells. The Journal of experimental medicine. 2007;204(8):1945-57. 24. Rothenberg EV, Moore JE, Yui MA. Launching the T-cell-lineage developmental programme. Nature reviews Immunology. 2008;8(1):9-21. 25. Zhang JA, Mortazavi A, Williams BA, Wold BJ, Rothenberg EV. Dynamic transformations of genome-wide epigenetic marking and transcriptional control establish T cell identity. Cell. 2012;149(2):467-82. 26. Tan JB, Visan I, Yuan JS, Guidos CJ. Requirement for Notch1 signals at sequential early stages of intrathymic T cell development. Nature immunology. 2005;6(7):671-9. 27. Yucel R, Karsunky H, Klein-Hitpass L, Moroy T. The transcriptional repressor Gfi1 affects development of early, uncommitted c-Kit+ T cell progenitors and CD4/CD8 lineage decision in the thymus. The Journal of experimental medicine. 2003;197(7):831-44. 28. Hock H, Hamblen MJ, Rooke HM, Traver D, Bronson RT, Cameron S, et al. Intrinsic requirement for zinc finger transcription factor Gfi-1 in neutrophil differentiation. Immunity. 2003;18(1):109-20. 29. Schilham MW, Wilson A, Moerer P, Benaissa-Trouw BJ, Cumano A, Clevers HC. Critical involvement of Tcf-1 in expansion of thymocytes. Journal of immunology. 1998;161(8):3984-91. 30. Weerkamp F, Baert MR, Naber BA, Koster EE, de Haas EF, Atkuri KR, et al. Wnt signaling in the thymus is regulated by differential expression of intracellular signaling molecules. Proceedings of the National Academy of Sciences of the United States of America. 2006;103(9):3322-6. 31. Tsuji M, Shinkura R, Kuroda K, Yabe D, Honjo T. Msx2-interacting nuclear target protein (Mint) deficiency reveals negative regulation of early thymocyte differentiation by Notch/RBP-J signaling. Proceedings of the National Academy of Sciences of the United States of America. 2007;104(5):1610-5. 32. Taghon T, Yui MA, Rothenberg EV. Mast cell lineage diversion of T lineage precursors by the essential T cell transcription factor GATA-3. Nature immunology. 2007;8(8):845-55. 33. Li P, Burke S, Wang J, Chen X, Ortiz M, Lee SC, et al. Reprogramming of T cells to natural killer-like cells upon Bcl11b deletion. Science. 2010;329(5987):85-9. 34. Ikawa T, Hirose S, Masuda K, Kakugawa K, Satoh R, Shibano-Satoh A, et al. An essential developmental checkpoint for production of the T cell lineage. Science. 2010;329(5987):93-6. 35. Kawazu M, Asai T, Ichikawa M, Yamamoto G, Saito T, Goyama S, et al. Functional domains of Runx1 are differentially required for CD4 repression, TCRbeta expression, and CD4/8 double-negative to CD4/8 double-positive transition in thymocyte development. Journal of immunology. 2005;174(6):3526-33. 36. Lieu YK, Kumar A, Pajerowski AG, Rogers TJ, Reddy EP. Requirement of c-myb in T cell development and in mature T cell function. Proceedings of the National Academy of Sciences of the United States of America. 2004;101(41):14853-8. 37. Naito T, Tanaka H, Naoe Y, Taniuchi I. Transcriptional control of T-cell development. International immunology. 2011;23(11):661-8.

54
38. Wojciechowski J, Lai A, Kondo M, Zhuang Y. E2A and HEB are required to block thymocyte proliferation prior to pre-TCR expression. Journal of immunology. 2007;178(9):5717-26. 39. Engel I, Johns C, Bain G, Rivera RR, Murre C. Early thymocyte development is regulated by modulation of E2A protein activity. The Journal of experimental medicine. 2001;194(6):733-45. 40. Laiosa CV, Stadtfeld M, Xie H, de Andres-Aguayo L, Graf T. Reprogramming of committed T cell progenitors to macrophages and dendritic cells by C/EBP alpha and PU.1 transcription factors. Immunity. 2006;25(5):731-44. 41. Ikawa T, Fujimoto S, Kawamoto H, Katsura Y, Yokota Y. Commitment to natural killer cells requires the helix-loop-helix inhibitor Id2. Proceedings of the National Academy of Sciences of the United States of America. 2001;98(9):5164-9. 42. Sanchez-Garcia I. Consequences of chromosomal abnormalities in tumor development. Annual review of genetics. 1997;31:429-53. 43. Meijerink JP. Genetic rearrangements in relation to immunophenotype and outcome in T-cell acute lymphoblastic leukaemia. Best practice & research Clinical haematology. 2010;23(3):307-18. 44. Tsujimoto Y, Gorham J, Cossman J, Jaffe E, Croce CM. The t(14;18) chromosome translocations involved in B-cell neoplasms result from mistakes in VDJ joining. Science. 1985;229(4720):1390-3. 45. Rabbitts TH. Chromosomal translocations in human cancer. Nature. 1994;372(6502):143-9. 46. Coustan-Smith E, Mullighan CG, Onciu M, Behm FG, Raimondi SC, Pei D, et al. Early T-cell precursor leukaemia: a subtype of very high-risk acute lymphoblastic leukaemia. The lancet oncology. 2009;10(2):147-56. 47. Patrick K, Wade R, Goulden N, Mitchell C, Moorman AV, Rowntree C, et al. Outcome for children and young people with Early T-cell precursor acute lymphoblastic leukaemia treated on a contemporary protocol, UKALL 2003. British journal of haematology. 2014;166(3):421-4. 48. Ferrando AA, Neuberg DS, Staunton J, Loh ML, Huard C, Raimondi SC, et al. Gene expression signatures define novel oncogenic pathways in T cell acute lymphoblastic leukemia. Cancer cell. 2002;1(1):75-87. 49. Soulier J, Clappier E, Cayuela JM, Regnault A, Garcia-Peydro M, Dombret H, et al. HOXA genes are included in genetic and biologic networks defining human acute T-cell leukemia (T-ALL). Blood. 2005;106(1):274-86. 50. Van Vlierberghe P, van Grotel M, Tchinda J, Lee C, Beverloo HB, van der Spek PJ, et al. The recurrent SET-NUP214 fusion as a new HOXA activation mechanism in pediatric T-cell acute lymphoblastic leukemia. Blood. 2008;111(9):4668-80. 51. Homminga I, Pieters R, Langerak AW, de Rooi JJ, Stubbs A, Verstegen M, et al. Integrated transcript and genome analyses reveal NKX2-1 and MEF2C as potential oncogenes in T cell acute lymphoblastic leukemia. Cancer cell. 2011;19(4):484-97. 52. Boehm T, Baer R, Lavenir I, Forster A, Waters JJ, Nacheva E, et al. The mechanism of chromosomal translocation t(11;14) involving the T-cell receptor C delta locus on human chromosome 14q11 and a transcribed region of chromosome 11p15. The EMBO journal. 1988;7(2):385-94. 53. Boehm T, Foroni L, Kennedy M, Rabbitts TH. The rhombotin gene belongs to a class of transcriptional regulators with a potential novel protein dimerisation motif. Oncogene. 1990;5(7):1103-5. 54. McGuire EA, Hockett RD, Pollock KM, Bartholdi MF, O'Brien SJ, Korsmeyer SJ. The t(11;14)(p15;q11) in a T-cell acute lymphoblastic leukemia cell line activates multiple transcripts, including Ttg-1, a gene encoding a potential zinc finger protein. Molecular and cellular biology. 1989;9(5):2124-32. 55. Garcia IS, Kaneko Y, Gonzalez-Sarmiento R, Campbell K, White L, Boehm T, et al. A study of chromosome 11p13 translocations involving TCR beta and TCR delta in human T cell leukaemia. Oncogene. 1991;6(4):577-82.

55
56. Sanchez-Garcia I, Rabbitts TH. LIM domain proteins in leukaemia and development. Seminars in cancer biology. 1993;4(6):349-58. 57. Deane JE, Ryan DP, Sunde M, Maher MJ, Guss JM, Visvader JE, et al. Tandem LIM domains provide synergistic binding in the LMO4:Ldb1 complex. The EMBO journal. 2004;23(18):3589-98. 58. Zheng Q, Zhao Y. The diverse biofunctions of LIM domain proteins: determined by subcellular localization and protein-protein interaction. Biology of the cell / under the auspices of the European Cell Biology Organization. 2007;99(9):489-502. 59. Sanchez-Garcia I, Rabbitts TH. The LIM domain: a new structural motif found in zinc-finger-like proteins. Trends in genetics : TIG. 1994;10(9):315-20. 60. Dawid IB, Toyama R, Taira M. LIM domain proteins. Comptes rendus de l'Academie des sciences Serie III, Sciences de la vie. 1995;318(3):295-306. 61. Laity JH, Lee BM, Wright PE. Zinc finger proteins: new insights into structural and functional diversity. Current opinion in structural biology. 2001;11(1):39-46. 62. Perez-Alvarado GC, Miles C, Michelsen JW, Louis HA, Winge DR, Beckerle MC, et al. Structure of the carboxy-terminal LIM domain from the cysteine rich protein CRP. Nature structural biology. 1994;1(6):388-98. 63. Perez-Alvarado GC, Kosa JL, Louis HA, Beckerle MC, Winge DR, Summers MF. Structure of the cysteine-rich intestinal protein, CRIP. Journal of molecular biology. 1996;257(1):153-74. 64. Matthews JM, Lester K, Joseph S, Curtis DJ. LIM-domain-only proteins in cancer. Nature reviews Cancer. 2013;13(2):111-22. 65. Kerenyi MA, Orkin SH. Networking erythropoiesis. The Journal of experimental medicine. 2010;207(12):2537-41. 66. El Omari K, Hoosdally SJ, Tuladhar K, Karia D, Vyas P, Patient R, et al. Structure of the leukemia oncogene LMO2: implications for the assembly of a haematopoietic transcription factor complex. Blood. 2011;117(7):2146-56. 67. Ono Y, Fukuhara N, Yoshie O. TAL1 and LIM-only proteins synergistically induce retinaldehyde dehydrogenase 2 expression in T-cell acute lymphoblastic leukemia by acting as cofactors for GATA3. Molecular and cellular biology. 1998;18(12):6939-50. 68. Wadman IA, Osada H, Grutz GG, Agulnick AD, Westphal H, Forster A, et al. The LIM-only protein Lmo2 is a bridging molecule assembling an erythroid, DNA-binding complex which includes the TAL1, E47, GATA-1 and Ldb1/NLI proteins. The EMBO journal. 1997;16(11):3145-57. 69. Nam CH, Rabbitts TH. The role of LMO2 in development and in T cell leukemia after chromosomal translocation or retroviral insertion. Molecular therapy : the journal of the American Society of Gene Therapy. 2006;13(1):15-25. 70. Hacein-Bey-Abina S, Garrigue A, Wang GP, Soulier J, Lim A, Morillon E, et al. Insertional oncogenesis in 4 patients after retrovirus-mediated gene therapy of SCID-X1. The Journal of clinical investigation. 2008;118(9):3132-42. 71. Racevskis J, Dill A, Sparano JA, Ruan H. Molecular cloning of LMO41, a new human LIM domain gene. Biochimica et biophysica acta. 1999;1445(1):148-53. 72. Sum EY, Segara D, Duscio B, Bath ML, Field AS, Sutherland RL, et al. Overexpression of LMO4 induces mammary hyperplasia, promotes cell invasion, and is a predictor of poor outcome in breast cancer. Proceedings of the National Academy of Sciences of the United States of America. 2005;102(21):7659-64. 73. Montanez-Wiscovich ME, Shelton MD, Seachrist DD, Lozada KL, Johnson E, Miedler JD, et al. Aberrant expression of LMO4 induces centrosome amplification and mitotic spindle abnormalities in breast cancer cells. The Journal of pathology. 2010;222(3):271-81. 74. Hahm K, Sum EY, Fujiwara Y, Lindeman GJ, Visvader JE, Orkin SH. Defective neural tube closure and anteroposterior patterning in mice lacking the LIM protein LMO4 or its interacting partner Deaf-1. Molecular and cellular biology. 2004;24(5):2074-82.

56
75. Grutz G, Forster A, Rabbitts TH. Identification of the LMO4 gene encoding an interaction partner of the LIM-binding protein LDB1/NLI1: a candidate for displacement by LMO proteins in T cell acute leukaemia. Oncogene. 1998;17(21):2799-803. 76. Kenny DA, Jurata LW, Saga Y, Gill GN. Identification and characterization of LMO4, an LMO gene with a novel pattern of expression during embryogenesis. Proceedings of the National Academy of Sciences of the United States of America. 1998;95(19):11257-62. 77. Sum EY, O'Reilly LA, Jonas N, Lindeman GJ, Visvader JE. The LIM domain protein Lmo4 is highly expressed in proliferating mouse epithelial tissues. The journal of histochemistry and cytochemistry : official journal of the Histochemistry Society. 2005;53(4):475-86. 78. Matthews JM, Bhati M, Craig VJ, Deane JE, Jeffries C, Lee C, et al. Competition between LIM-binding domains. Biochemical Society transactions. 2008;36(Pt 6):1393-7. 79. Sum EY, Peng B, Yu X, Chen J, Byrne J, Lindeman GJ, et al. The LIM domain protein LMO4 interacts with the cofactor CtIP and the tumor suppressor BRCA1 and inhibits BRCA1 activity. The Journal of biological chemistry. 2002;277(10):7849-56. 80. Sandberg Y, Verhaaf B, van Gastel-Mol EJ, Wolvers-Tettero IL, de Vos J, Macleod RA, et al. Human T-cell lines with well-defined T-cell receptor gene rearrangements as controls for the BIOMED-2 multiplex polymerase chain reaction tubes. Leukemia. 2007;21(2):230-7. 81. Oram SH, Thoms J, Sive JI, Calero-Nieto FJ, Kinston SJ, Schutte J, et al. Bivalent promoter marks and a latent enhancer may prime the leukaemia oncogene LMO1 for ectopic expression in T-cell leukaemia. Leukemia. 2013;27(6):1348-57. 82. Chetty R, Gatter K. CD3: structure, function, and role of immunostaining in clinical practice. The Journal of pathology. 1994;173(4):303-7. 83. Asnafi V, Beldjord K, Libura M, Villarese P, Millien C, Ballerini P, et al. Age-related phenotypic and oncogenic differences in T-cell acute lymphoblastic leukemias may reflect thymic atrophy. Blood. 2004;104(13):4173-80. 84. Lecuyer E, Lariviere S, Sincennes MC, Haman A, Lahlil R, Todorova M, et al. Protein stability and transcription factor complex assembly determined by the SCL-LMO2 interaction. The Journal of biological chemistry. 2007;282(46):33649-58. 85. Larson RC, Osada H, Larson TA, Lavenir I, Rabbitts TH. The oncogenic LIM protein Rbtn2 causes thymic developmental aberrations that precede malignancy in transgenic mice. Oncogene. 1995;11(5):853-62. 86. Larson RC, Lavenir I, Larson TA, Baer R, Warren AJ, Wadman I, et al. Protein dimerization between Lmo2 (Rbtn2) and Tal1 alters thymocyte development and potentiates T cell tumorigenesis in transgenic mice. The EMBO journal. 1996;15(5):1021-7. 87. Meier N, Krpic S, Rodriguez P, Strouboulis J, Monti M, Krijgsveld J, et al. Novel binding partners of Ldb1 are required for haematopoietic development. Development (Cambridge, England). 2006;133(24):4913-23. 88. Jurata LW, Gill GN. Functional analysis of the nuclear LIM domain interactor NLI. Molecular and cellular biology. 1997;17(10):5688-98. 89. Hsu HL, Cheng JT, Chen Q, Baer R. Enhancer-binding activity of the tal-1 oncoprotein in association with the E47/E12 helix-loop-helix proteins. Molecular and cellular biology. 1991;11(6):3037-42. 90. Bain G, Engel I, Robanus Maandag EC, te Riele HP, Voland JR, Sharp LL, et al. E2A deficiency leads to abnormalities in alphabeta T-cell development and to rapid development of T-cell lymphomas. Molecular and cellular biology. 1997;17(8):4782-91. 91. Bash RO, Crist WM, Shuster JJ, Link MP, Amylon M, Pullen J, et al. Clinical features and outcome of T-cell acute lymphoblastic leukemia in childhood with respect to alterations at the TAL1 locus: a Pediatric Oncology Group study. Blood. 1993;81(8):2110-7.
57
92. Brown L, Cheng JT, Chen Q, Siciliano MJ, Crist W, Buchanan G, et al. Site-specific recombination of the tal-1 gene is a common occurrence in human T cell leukemia. The EMBO journal. 1990;9(10):3343-51. 93. Janssen JW, Ludwig WD, Sterry W, Bartram CR. SIL-TAL1 deletion in T-cell acute lymphoblastic leukemia. Leukemia. 1993;7(8):1204-10. 94. Nie L, Wu H, Sun XH. Ubiquitination and degradation of Tal1/SCL are induced by notch signaling and depend on Skp2 and CHIP. The Journal of biological chemistry. 2008;283(2):684-92. 95. Terme JM, Lhermitte L, Asnafi V, Jalinot P. TGF-beta induces degradation of TAL1/SCL by the ubiquitin-proteasome pathway through AKT-mediated phosphorylation. Blood. 2009;113(26):6695-8. 96. McCormack MP, Shields BJ, Jackson JT, Nasa C, Shi W, Slater NJ, et al. Requirement for Lyl1 in a model of Lmo2-driven early T-cell precursor ALL. Blood. 2013;122(12):2093-103. 97. McCormack MP, Young LF, Vasudevan S, de Graaf CA, Codrington R, Rabbitts TH, et al. The Lmo2 oncogene initiates leukemia in mice by inducing thymocyte self-renewal. Science. 2010;327(5967):879-83. 98. Nagel S, Venturini L, Meyer C, Kaufmann M, Scherr M, Drexler HG, et al. Multiple mechanisms induce ectopic expression of LYL1 in subsets of T-ALL cell lines. Leukemia research. 2010;34(4):521-8. 99. Smith S, Tripathi R, Goodings C, Cleveland S, Mathias E, Hardaway JA, et al. LIM domain only-2 (LMO2) induces T-cell leukemia by two distinct pathways. PloS one. 2014;9(1):e85883. 100. Mack DL, Leibowitz DS, Cooper S, Ramsey H, Broxmeyer HE, Hromas R. Down-regulation of the myeloid homeobox protein Hhex is essential for normal T-cell development. Immunology. 2002;107(4):444-51. 101. George A, Morse HC, 3rd, Justice MJ. The homeobox gene Hhex induces T-cell-derived lymphomas when overexpressed in haematopoietic precursor cells. Oncogene. 2003;22(43):6764-73. 102. Judge AD, Robbins M, Tavakoli I, Levi J, Hu L, Fronda A, et al. Confirming the RNAi-mediated mechanism of action of siRNA-based cancer therapeutics in mice. The Journal of clinical investigation. 2009;119(3):661-73.
103. Bernard O, Azogui O, Lecointe N, Mugneret F, Berger R, Larsen CJ, et al. A third tal-1 promoter is specifically used in human T cell leukemias. The Journal of experimental medicine. 1992;176(4):919-25.