the role of patents in chinese enterprises’ business strategy · the role of patents in chinese...
TRANSCRIPT

The Role of Patents in
Chinese Enterprises’
Business Strategy
State Intellectual Property Office
December, 2013

Contents
1. Basic Information of the Project
2. Brief Introduction to China’s Patents
Survey
3. Major Conclusions
4. Summary and Further Studies

1 Basic information of the project 1.1 Research background
The project background April 2012,WIPO’s chief economist Mr. Fink visited SIPO to
talk about the joint research project. June 2012, Mr. Zhou Hao visited SIPO and confirmed the
research issues in “what role does patent play in the business strategies in Chinese companies?”
2012-10-03, SIPO and WIPO signed bilateral cooperation Memorandum, putting forward "to strengthen cooperation in the field of statistical data, to carry out joint research project"
2013-02-01, SIPO started the cooperative research project, and 4 departments took part in the project, which included the general office, the Planning Department, International Department and Intellectual Property Development and Research Center(IPDRC).

Timing Background: China has become the largest patent applications country in the world, and is on the mission of building an innovation-oriented country. Now we are gradually learning how to use the patent system. During the catch-up phase, China must improve the level of innovation and promote the quality of economic.
Theoretical background :many surveys to firms from high income countries have revealed that the importance of patent rights as an appropriation mechanism differs significantly in different industry. Evidence shows that companies’ strategies have much evolved in recent decades, including motivations of licensing, preempting litigation, blocking competitors, negotiating cross-licenses and others.
So, what about the situation in China?
1 Basic information of the project 1.1 Research background

Objective 1: To understand the role of patents in Chinese enterprises’
business strategy ; to learn how many patent put into actual production,to reveal the status of patent implementation and industrialization, and to do some international comparison .
Objective 2: To find the basic characteristics in China and to analyze the
influential and restrictive factors for providing basic research to optimize management.
1 Basic information of the project 1.2 Objective of research

Survey & statistics Since 2008, China has carried out the patents investigation
work at national level and has accumulated a large number of data for the research(the Planning Department of SIPO).
Research of literature: whether or not patents are used for implementation and
industrialization (Mansfield, Cohen, Mansfield, Harter, Harabi, Arundel), the basic condition of international patent implementation and industrialization , the influence of patent implementation and industrialization(Adam,Duguet,Blind,Arunde,Darroch,OECD)
Empirical analysis: modeling the factors affecting patent implementation and
industrialization, the multiple regression method. Forum, field research:
to understand the characteristics and the real condition of development of patent implementation and industrialization of Chinese patents
1 Basic information of the project 1.3 Research Methods

2.Brief introduction to China’s patent survey 2. 1 Survey Sampling Principle
The survey has begun from 2008 and has been taken annually .
The samples were based on the granted patents of the last year. Some special samples are : PCT & State-owned enterprises’ patent (2010);patent in emerging industry(2011) …..
More than 40,000 patents and 15,000 patentees every year, and the selected sample in 70 cities more or less.
SIPO took full responsibility of the whole survey while the local bureau issued and recovered questionnaires.
Annual Recovering Ratio all exceeds 80%.10% samples were chosen to recheck.

**Stratification Sampling Patent type: invention / utility model / design (3)
Applicant type: non-service / enterprises / universities and colleges / scientific research institutes (4)
The year of grant: for example 2011 (1)
Stratification = 3×4×1 = 12
**Quota Control
**PPS: Probability Proportionate to Size Sampling
The samples were selected by stratified sampling methods & Probability Proportionate to Size Sampling.
2.Brief introduction to China’s patent survey 2. 2 Survey Sampling Method
The choice of sample cities depends on a procedure of “Important cities pre-determined + PPS sampling”. First, big cities with large number of granted patents are
picked out into the sample.
Second, those cities with only limited number of granted patents are kicked out from the sample.
Third, a random sampling procedure based on PPS sampling
is implemented upon all other cities left.
2.Brief introduction to China’s patent survey 2. 2 Survey Sampling Method

2.Brief introduction to China’s patent survey 2. 3 Survey Sampling Procedure
Survey Sample Begin
Beijing Shanghai GuangzhouNanjing
Uni & CL Non-serviceScien..Enterprise
Draw N patent rights
Step1:Drawing a certain amount of cities all over the country
Step2:Setting the quota of the drawn cities in 36 stratifications
Sample Procedure
Step3:Drawing a certain amount of patents granted of the cities in the 36 stratifications
Step4:Confirm the patentees of the patents
Patentee1 Patentee2 Patentee3 Patentee n
U.M DesignInvention

Basic information: Scale, ownership types, qualification, R&D info, main financial
indicators.
Management Survey: Intellectual property activities, applications prediction, Patent
validity and maintenance, market competition, patent protection and infringement, Intellectual property services, patent quality, training and education, etc.
Patent Implementation Survey :
Patent cost(R&D ), patent implementation status, implementation stage, patent transfer and patent license, social benefit & economic benefit, patent implement difficulty.
2.Brief introduction to China’s patent survey 2. 4 Survey Questionnaires

History data:
Patent Survey 2008-2012
Patent survey 2012 (most recent): 44850 Granted Patents in 2011, among which
Firms patent 30759,Universities patent 8642,Scientific Research Institutes patent 3234,Non-service patent 2215, Invention 23021,Utility Mode12082,Design 9747
17249 patentee, among whom Firms 13744,Universities and Scientific Research
Institutes 1468, non-service 2037
Data Used: mainly from patent survey

3. Major Conclusions 3.1 Motivations of Patents Application
Literature Review Patent is not always the best way to gain benefits from
innovations: 1. Mansfield(1981) pointed out that “easy to imitation” is the
main reason why firms choose not to patent a new technology, Cohen(2002) found that 56% of European firms and 54% of Japanese firms admit being affected by “easy to imitation” when considering whether to apply a patent.
2. Cohen (2002) found that 15% of European firms and 25% of American firms claim that the “high costs of protecting patents” discouraged them to apply for a patent.
3. When alternatives are possible, lead time, learning curves, sales or service efforts may be more favorable than patents in terms of protecting benefits from innovations.

3. Major Conclusions 3.1 Motivations of Patents Application Literature Review
Cohen(2002), Harab(1995) , Arundel(1995),Duguet(1998)
,Pitkethly(2001),OECD(2003): “protecting from imitation” is still a significant factor leading to patent application, but other motivations go far beyond , such as patent blockage, bargaining advantages in negotiations, prevention of rights invasion, measurement of internal R&D performance and corporate reputation.
FAN Yaofeng (2011) spotted a significant influence of market competitiveness and favorable policies on the patenting motivations.
Jenny (2005) pointed out that firms will focus more on patent protection and transference in the context of globalization.

Goals of Patent Applications the basic goals of patent applications are market-
oriented, such as protecting new technology from imitation (62.4%), occupying the market to get benefits (60.8%).
Besides, technology reserve, marketing for better reputation and establishment of self-owned product standards account for 49.9%, 48.6% and 36.0% respectively.
3. Major Conclusions 3.1 Motivations of Patents Application

Goals of Patens Applications (continued)
Why chinese firms apply for much more utility model and design ? Basic goals :fast occupancy of the market and patent
license (66.5%), combination of utility model, design and invention patent (41.4%), easier implementation in production under current situations (39.1%), reduction of patent application and maintenance costs (16.5%), limited capability in R&D (16.4%) and recommendation from patent agents (8.9%).
3. Major Conclusions 3.1 Motivations of Patents Application
3. Major Conclusions 3.1 Motivations of Patents Application
Goals of Patens Applications (Continued)
Heterogeneity in motivations across firms of different sizes and types Large firms tend to occupy 25% of all strategic
motivations, but they account for only 18.6% in terms of firm numbers.
On the other hand, Small firms tend to focus more on molding product image (44.8%) and establishing self-owned product standards (46.4%)
Central-directed SOEs tend to have higher percentages in technology reserve

Patent Pools and Patent Standards 3116 corporate patents are included in the patent pool,
accounting for 11.6% of the whole valid sample.
6474 corporate patents are included in related standards, accounting for 24.1%.
---Patents of large firms are more easily to enter patent
pools and standards ---Patents of High-tech firms are more easily to enter patent
pools. ---In terms of technology fields, mechanical engineering,
chemical engineering and electronic engineering take the Top 3 leading positions.
3. Major Conclusions 3.1 Motivations of Patents Application

Patents used in cross-licensing Cross-licensing showed an uprising tendency during 2006-
2011.
Large firms are the main players in cross-licensing (57.4%); Small firms are more likely to conduct cross-licensing than middle-sized firms.
In terms of technology fields, electronic engineering leads more patents accounting for 54.3% ; Mechanical engineering (45) and chemical engineering (29) follow.
3. Major Conclusions 3.1 Motivations of Patents Application

Patents used in advertising for better corporate image and recognition The survey in 2012 showed that 48.6% of all firms admit
using patents as a way of advertising, which rises by 10% compared with two years ago.
Patents used as technology reserve
49.9% of firms with new patent licensed in 2011 admit technology reserve as a purpose of patent application.
How Chinese patent-owners perceive technology reserve? Invention only occupies 12.2% in technology reserve,
which is relatively low. More than 40% of firms don’t have a strategic patent plan
when applying for a patent.
3. Major Conclusions 3.1 Motivations of Patents Application

Literature Review : International comparison Robert P. Morgan (2001): Patent commercialization rate of
private firms in USA is roughly 48.9% EU-6 (2004) : 50.5% of patent-holders employ their own
patents for industrial and commercial purposes, 14% of patent holders transfer, cross-license or joint-use their patents with other parties.
JPO (2009) Patent Utilization in Japan: Patents (51.5%),
Design (63.4%), Brand (64.3%) KIPO (2011) For firms, patent utilization rate is as high as
82.4% and commercialization rate is 56.5%.
3. Major Conclusions 3.2 Patent Implementation and Industrialization

The Relationship between patent implementation and industrialization
3. Major Conclusions 3.2 Patent Implementation and Industrialization

Patent Implementation and Industrialization Rate in China During 2005-2011, patent implementation rate fluctuated
mildly between 66.2% and 71.4%.
3. Major Conclusions 3.2 Patent Implementation and Industrialization

Patent Implementation and Industrialization Rate Market Entities-firms
Patent implementation rate in firms is significantly higher than that of average level. About 84.9% of total patents granted to firms have been implemented.
Firm Size Medium-sized firms have the highest patent
implementation rate (86.8%), while the rate is roughly lower (80%) for large and small firms.
High-tech firms are more active in patent implementation (83.9%)
3. Major Conclusions 3.2 Patent Implementation and Industrialization

Patent Implementation and Industrialization Rate (Continued)
Self-implementation In all patents implemented in 2011, self-implementation
accounts for 97.1% for firms, far higher than the rate of colleges (61.3%) or research institutions (87.7%).
Patent Transfer In firms, only 11.9% of their implemented patents are
transferred, lower than universities and research Institutes . Utility model and industry design patents are more likely to
be transferred than invention. In 2011, for 90% of all cases the licensing or transferring
targets are domestic organizations or individuals. 59.9% choose large-to-medium-sized firms as targets and 51.8% choose small firms.
Different Patent Implementation Methods During 2005-2011, self-implemented patents tend to have
decreasing share, compared to a significant increase of patents transferred or licensed to others (including pure transference and joint-use).
3. Major Conclusions 3.2 Patent Implementation and Industrialization

Patent Industrialization The overall rate of granted patents(2011) which have been
applied to large-scale production is: Firms 48.9% ( 2010 is 51.1%) Universities and Colleges 0.9% ( 2010 is 1.3%) Scientific Research Institutes 7.7% ( 2010 is 8.7% ) Non-service 17.9% (2010 is 23.2%)
Only 48.9% of all granted patents to firms are industrialized,
which is lower than that in 2010 by 2.2%. The reason may relate to changes in motivations of patent application. The percentage of “patents as technology reserve”
increases by 17% The percentage of “patents as advertisements to mold
corporate image” increases by 10% A relatively large decrease in the percentage of “patents
used to occupy or expand the market”
3. Major Conclusions 3.2 Patent Implementation and Industrialization

Literature review in Developed countries:
Factors like industry, regulation rules (law and patent policy), and strategic goal of the enterprise are all found influential. Mansfield (1991), e.g., figures out the length of patent commercial process differs between industries.
in developing countries: Hemantkumar(2010) finds that in India, entrepreneurship
and business knowledge of patent holders, and strength of support from government are prevailing success factors for the holders to self-commercialize their patents.
Chandran(2010), based on evidence from Malaysia, concludes that Crucial factors limiting commercialization success includes availability of industry and university linkages, commercialization funds, better internal structure and intellectual property management systems and effective institutional supports.
3. Major Conclusions 3.3 Factors influencing implementation and industrialization of patents of Chinese enterprises

Factor Classification
In terms of sources, we can classify the effect factors into following categories: Subjective vs Objective, Theoretical vs Practical, Internal vs External, etc. One classification could be:
3. Major Conclusions 3.3 Factors influencing implementation and industrialization of patents of Chinese enterprises

Variable Selection
To exam the effect factors for Chinese enterprises, we follow two
principles in variable selection. 1) Universality: to include as many relevant variables discovered in existing
researches as possible. 2) Feasibility: attainable from data of China Patent Survey.
3. Major Conclusions 3.3 Factors influencing implementation and industrialization of patents of Chinese enterprises

Label Type Variable Value type
SSR Dependent variables
Patent Implementation 0-1
INR Patent Industrialization 0-1
IVs-company related
QYS Trait
company scale continuous
QYQ company qualification 0-1
RDA
Capability
R&D Efficiency continuous
RDIC R&D Intensity continuous
MAA Combination of IP assets 0-1
PATM
Function evaluation
Motivation of patent application 0-1
PATC Evaluation on patent
implementation 0-1
RDPM
Maturity
HR input on patent management continuous
PATS IP management stage 0-1
PATE IP management experience 0-1
IVs-patent related
PATSP Positioning Patent strategic positioning 0-1
PATI Economical R&D cost of patent 0-1
PATTP Trait Invention 0-1
IVs-external
PATPR Positive Infringement experience 0-1
PATP Negative Supportive policy knowledge 0-1
3. Major Conclusions 3.3 Factors influencing implementation and industrialization of patents of Chinese enterprises

It includes company traits (scale and qualification), capability, IP maturity of enterprises, as well as patent qualities and external factors in our model.
In the regression results of patent implementation and patent industrialization, most influential factors are the same and perform unanimous effects. However, some differences of the factors cannot be ignored.
Consistency: company scale, R&D cost, etc.
Inconformity: IP management stage, Infringement experience, etc.
3. Major Conclusions 3.3 Factors influencing implementation and industrialization of patents of Chinese enterprises
2014/4/2
Label Variable Model1 Model2 Model3 Model4-Logit C Constant 1.7046***
(25.78) 1.5839***
(23.64) 1.5994***
(23.66) 2.8375***
(22.15)
QYS company scale -0.1686*** (-10.12)
-0.1401*** (-8.27)
-0.1418*** (-8.35)
-0.2662*** (-8.33)
QYQ company qualification -0.0468 (-1.59)
-0.0513* (-1.71)
-0.0177 (-0.57)
-0.0394 (-0.70)
RDA R&D Efficiency 3.07E-07 (0.61)
2.95E-07 (0.55)
3.48E-07 (0.62)
7.88E-07 (0.66)
RDIC R&D Intensity -0.9319*** (-8.97)
-0.8359*** (-7.85)
-0.8601*** (-8.01)
-1.5599*** (-8.41)
MAA Combination of IP assets 0.1157*** (3.87)
0.1272*** (4.22)
0.1236*** (4.09)
0.2147*** (3.94)
PATM Motivation of application -0.2087*** (-7.72)
-0.2023*** (-7.40)
-0.1712*** (-6.11)
-0.3105*** (-6.03)
PATC Evaluation on implementation 0.1754*** (5.20)
0.1635*** (4.78)
0.1489*** (4.35)
0.2578*** (4.19)
RDPM HR input on PM -0.0871 (-1.49)
-0.1309** (-2.24)
-0.1160** (-1.98)
-0.1966* (-1.86)
PATS IP management stage -0.0107 (-0.38)
-0.0184 (-0.65)
-0.0171 (-0.60)
-0.0329 (-0.64)
PATE IP management experience -0.2019***
(-7.09) -0.1782***
(-6.13) -0.1617***
(-5.51) -0.3020***
(-5.63)
PATSP Patent strategic positioning 0.1514*** (5.51)
0.1492*** (5.43)
0.2613*** (5.29)
PATI R&D cost of patent 0.3899***
(10.86) 0.3968***
(11.05) 0.7482***
(10.84)
PATTP Invention -0.3014*** (-11.62)
-0.2881*** (-11.06)
-0.5154*** (-10.95)
PATPR Infringement experience 0.1521*** (4.39)
0.3115*** (4.83)
PATP Supportive policy knowledge -0.1222***
(-4.25) -0.2365***
(-4.51)
Prob(LR) Model Significance 0.00 0.00 0.00 0.00
OBS Observations 15851 15851 15851 15851
Adj.R2 Adj.R square 0.03 0.05 0.05 0.05
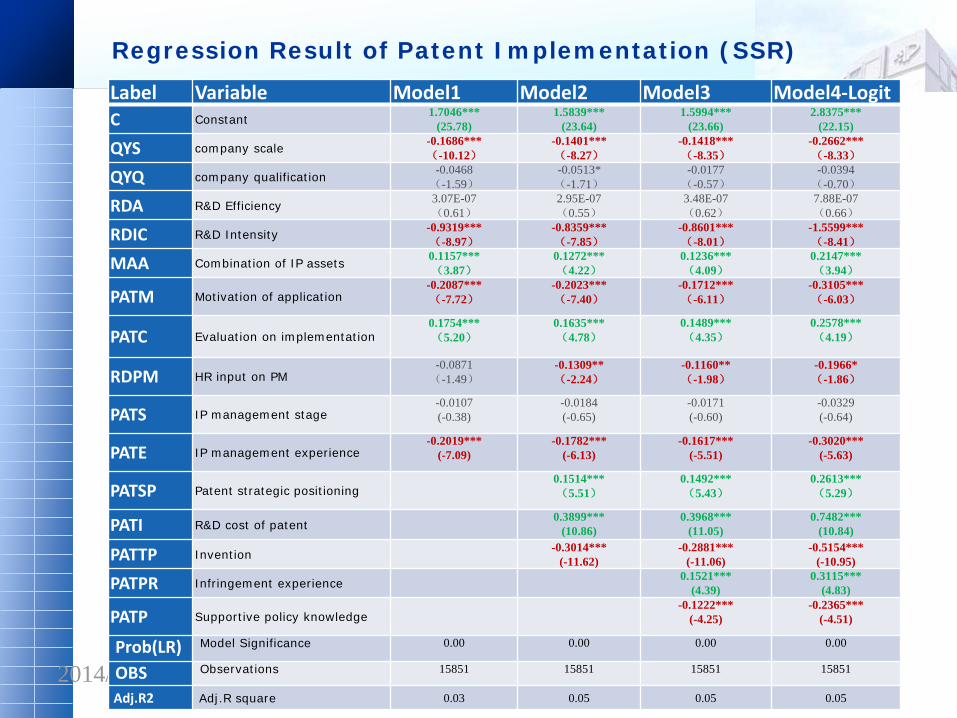
Regression Result of Patent Implementation (SSR)

Specifically, regression result of patent implementation
(1) Factors show significant positive effect: Combination of IP assets, Evaluation on patent implementation, Patent strategic positioning, R&D cost of patent.
(2) Factors show significant negative effect: company scale, R&D Intensity, Motivation of patent application, HR input on patent management, IP management experience, Invention, Supportive policy knowledge.
(3) Factors with no significant effect: company qualification, R&D Efficiency, IP management stage.
3. Major Conclusions 3.3 Factors influencing implementation and industrialization of patents of Chinese enterprises

2014/4/2
Label Variable Model1 Model2 Model3 Model4-Logit C Constant -0.6841***
(-11.96) -0.8844***
(-15.00) -0.8236***
(-13.84) -1.3706***
(-13.58)
QYS company scale -0.0762*** (-5.39)
-0.0476*** (-3.29)
-0.0516*** (-3.56)
-0.0867*** (-3.57)
QYQ company qualification 0.1526*** (5.99)
0.1038*** (3.98)
0.1264*** (4.73)
0.2156*** (4.72)
RDA R&D Efficiency 6.18E-07* (1.81)
4.91E-07* (1.80)
5.20E-07* (1.83)
8.39E-07* (1.78)
RDIC R&D Intensity -0.8686*** (-8.18)
-0.9884*** (-8.98)
-0.9010*** (-8.18)
-1.5851*** (-7.97)
MAA Combination of IP assets 0.2521*** (9.31)
0.2699*** (9.81)
0.2835*** (10.28)
0.4846*** (10.17)
PATM Motivation of application -0.1167*** (-5.12)
-0.1364*** (-5.90)
-0.1107*** (-4.64)
-0.1935*** (-4.83)
PATC Evaluation on implementation 0.1975*** (6.41)
0.1700*** (5.44)
0.1664*** (5.32)
0.2870*** (5.33)
RDPM HR input on PM -0.1217** (-2.25)
-0.1198** (-2.19)
-0.1193** (-2.17)
-0.2038** (-2.18)
PATS IP management stage 0.1430***
(5.88) 0.1204***
(4.87) 0.1319***
(5.32) 0.2335***
(5.57)
PATE IP management experience -0.0472**
(-1.96) -0.0288 (-1.17)
-0.0211 (-0.85)
-0.0314 (-0.75)
PATSP Patent strategic positioning 0.1130*** (4.61)
0.1131*** (4.62)
0.1954*** (4.70)
PATI R&D cost of patent 0.6641***
(24.36) 0.6655***
(24.39) 1.0953***
(24.51)
PATTP Invention -0.0731*** (-3.20)
-0.0683*** (-2.97)
-0.1149*** (-2.96)
PATPR Infringement experience -0.2002*** (-6.62)
-0.3395*** (-6.55)
PATP Supportive policy knowledge -0.1221***
(-5.01) -0.2133***
(-5.19)
Prob(LR) Model Significance 0.00 0.00 0.00 0.00
OBS Observations 15851 15851 15851 15851
Adj.R2 Adj.R square 0.03 0.06 0.07 0.07
Regression Result of Patent Industrialization (INR)

Regression results of patent industrialization
(1) “Company qualification” shows positive significance from the simplest model.
(2) “IP management stage” also shows positive effect at 1% significance level.
(3) “HR input on patent management” demonstrates stronger negative significance: on the significance level and standardized coefficients.
Above results support that comparing with implementation, successful patent industrialization accords with stronger enterprise capacity and higher IP management level.
3. Major Conclusions 3.3 Factors influencing implementation and industrialization of patents of Chinese enterprises

Factors of Company traits Smaller enterprises tend to implement more.
Larger enterprises are more likely to apply for patent out of non-implementation motivations.
A “High-tech” qualification helps little to push the company to implement its patent;Such a qualification only shows strong positive effect on patent industrialization
Regression Analysis on different types of factors
3.3 Factors influencing implementation and industrialization of patents of Chinese enterprises

Factors of Company capability Strong R&D capacity (efficiency) has no significant
contribution to improve patent implementation.
“Combination of IP assets” shows positive influences in both models.
R&D intensity shows significant negative influences on both DVs. It may be explained that higher the R&D intensity, higher the importance of IP to the company. Thus the company is usually more matured in terms of IP management, which indicates it has more considerations in using patents other than simple monetary implementation.
Regression Analysis on different types of factors
3.3 Factors influencing implementation and industrialization of patents of Chinese enterprises

Factors of IP management maturity More higher the level (stage) of patent management of the
company, more lower the possibility to implement patent directly.
Variables of “HR input on patent management” and “IP management experience” show significant negative effect both on implementation and industrialization.
“IP management stage” shows no significance in the implementation model; while has significant positive effect in the industrialization model.
Regression Analysis on different types of factors
3.3 Factors influencing implementation and industrialization of patents of Chinese enterprises

Factors of Patent traits
Patents of invention are less likely to be implemented, other
things equal.
R&D cost of patent, intuitively, shows significant positive effect on implementation: the more the firm has paid on the patent, the stronger the tendency to utilize it.
Regression Analysis on different types of factors
3.3 Factors influencing implementation and industrialization of patents of Chinese enterprises

Factors of External ones Infringement experience shows positive effect on patent
implementation but negative effect on industrialization. Above mixed influence may come from two contrasting
effects: there is a pull effect caused by the tort, victim will tend to decrease implementation since it lower the company’s benefit from patent implementation. At the same time, infringement also causes a push effect since after being hurt, the company needs to implement new patent to compensate the loss and generate new income.
Which effect is the prevailing one may depend on the potential value of infringed patent: if it is considerably large, or large enough to be industrialized, pull effect dominates; so total effect is negative. In the opposite case, push effect will dominate to make aggregate effect positive.
Regression Analysis on different types of factors
3.3 Factors influencing implementation and industrialization of patents of Chinese enterprises

3 Major Conclusions 3.4 Restrictive factors
The existing problems for patent implementation in China---low realization of the market value and industrialization revenue Among the self-implemented patents of Chinese firms in
2011, almost two thirds may not gain market revenue, and the percentage of patents that gain over 1 million RMB market revenue is 8.4%,while the firms that gain over 50 million RMB account for only 0.1%.
Proportion of the Chinese companies that received less than
500 thousand RMB for patent transfer and license in 2011 was 64.0%, while payment of patent transfer and licensing expense that over 3 million accounts for less than 1 percent.

R&D investment in patent and cycle for the implementation of the patent More than 70% Chinese firms invested less than 100, 000 in
R&D, less than 5% firms invested more than 1 million, only 1% invested more than 10 million.
10% of Patent’s R&D cost more than 500, 000 RMB. Before 2010, half of Patent’s R&D cost less than 50,000 RMB, and after that the proportion goes down.
3 Major Conclusions 3.4 Restrictive factors

R&D investment amount and cycle for the implementation of the patent From 2005 to 2011, the percentage of patent with long
development cycle (3 years and above) shrinks.
3 Major Conclusions 3.4 Restrictive factors

Lack of effectively support for firms’ patent industrialization from national institutional level.
Before 2008, the proportion of using IP service is 1/4, but
after that the proportion is more than 1/3.
3 Major Conclusions 3.4 Restrictive factors

Lack of effectively support for firms’ patent industrialization from national institutional level. Lack of effective institutional support: patent protection,
investment and financing industrial patent system, the existing production tax.
Weak continuous innovating driving force: state-owned enterprises (SOE) and SME issues, inherent social thinking (performance-oriented government, consumer attitudes and research institution), the importance of intellectual property rights, Industry-Academy-Research cooperation and research management system.
IP services comes to be a bottleneck: institutional mechanisms and policy system development of IP services, demand cultivation and optimizing the supply chain, public service resources and market resources.
3 Major Conclusions 3.4 Restrictive factors and data

4. Summary and Further Studies 4.1 Summary
Willingness of patent implementation and industrialization are both high while the motivation of patent implementation dominates. Over 80% of firms’ patents are used in real production, and
over 40% patents are applied in industrialization, which is quite similar to international standards. The main problem lies in the quality and benefits of patent.
In terms of contributing factors influencing motivations of
patent application: Traditional factors still affect the market behavior of Chinese
innovative firms, yet strategic factors such as promoting image, adding bargaining chip, and inhibiting opponents gradually dominate the motivations for patenting.

Many traits of firms’ patenting behavior are found for example, smaller firms pay more attention to patent
implementation, Infringement experience shows positive effect on patent implementation but negative effect on industrialization.
Patent implementation and industrialization closely
correlate with China’ innovation and economic development level. It is predictable that Chinese enterprises will pay more
attention to the quality and market profits of patent as China’s economy and innovation abilities grow.
4. Summary and Further Studies 4.1 Summary

4. Summary and Further Studies 4.2 Further studies
What changes will take place in the role that patent plays in the business strategies of Chinese firms after the ability of Chinese firms to use patent regime becomes stronger?
What’s the impact of the changes in the motivation of Chinese firms’ patenting behavior on the world and on the patent regime?
How to improve the effectiveness of patent survey from the perspective of methodology and questionnaire design so as to better justify the impact of patent survey on policy making?
Deeper research into patent implementation and patent industrialization, and to participate more in international communication on the patent statistic and calculation issues.
Summarize the characteristics of Chinese firms’ patenting behaviors and compare them with those of other developing countries so as to detect certain laws and further analyze the reasons behind those traits.

The Role of Patents in Chinese
Enterprises’ Business Strategy
State Intellectual Property Office
Mao Hao Email:[email protected]
TEL: +86-10-62083873
Thank You!