the role of perceptions of remediation on the persistence ... · pdf filethe role of...
TRANSCRIPT
The Role of Perceptions of Remediation on the Persistence of Developmental Students in Higher Education
Amaury NoraProfessor and Director
National Center for Student SuccessUniversity of Houston

2
Introduction78% of postsecondary institutions offer at least one remedial reading, writing or mathematics course100% of public two-year institutions and 94% of institutions with high minority enrollments offer remedial coursesEstimated that up to 80% of minority students at two-year colleges are enrolled in developmental coursesOnly a handful of minority students initially enrolled in remedial courses advance to degree-credit, non-remedial courses at community colleges
Even a smaller number ever persist to graduationOnly 8% of Mexican American college students initially enrolled in community colleges transfer to four-year institutions and earn a bachelor’s degree

3
Understanding Remediation
Implied Positive Association: Remediation is necessary for academic success in non-developmental courses and for student persistence in college.Perceived Limitation: Remedial efforts may only prepare students for other remedial courses, and not for non-remedial ones.Not Yet Fully Examined: The potential influence of remedial-related perceptions, attitudes and values of students in developmental courses.

4
Review of Literature
Previous focus:Remediation and academic achievement (e.g. Boylan, 1996; Brattin, 1993; England, 1993; Richardson, Martens, & Fisk, 1981)
Persistence and academic performance (e.g. Bean, 1982; Nora & Cabrera, 1996; Nora, 2000) Pascarella & Terenzini, 1991)

5
Gaps in the Literature: Unexplored RelationshipsDevelopmental students’ attitudes and perceptions:
As learners
On developmental programs
Regarding faculty-student and peer-student relationships and interactions
Impact of these perceptions on academic progress in developmental courses and persistence to graduation

6
Purpose of the Study
To examine in an integrated, comprehensive conceptual framework (Nora, 2000) what pre-college, academic, social, institutional and other factors contribute to persistence decisions
To examine the extent to which the addition of the perceptions of remediation construct improves the predictive function of the Student Engagement Model

7
Hierarchical Sequencing in the Conceptual Framework
Persistence= Pre-College Factors + Environmental Factors + Social Integration Factors + Academic Experiences +Academic Performance + Institutional/Goal Commitment Factors +Perceptions of Remediation Factors

8
Research MethodsSample:
n = 339 68.9% full-time students96.7% unmarried54% commuted 11 or more miles to campus1,329 female; 1,037 maleAsian/Pacific Islander (29.5%); African American/Black (20.5%); Hispanic (44.3%)Age 18-19 (58%); 20-22 (27.9%)
86% were between the ages of 18 and 22
Data CollectionAdministered to students in English, Reading and Math developmental classes at an urban, open admissions, commuter university

9
Research MethodsInstrument:
Adopted and modified from the following:Collegiate Assessment of Academic Proficiency (CAAP)College Student Experiences Questionnaire (CSEQ)NCTLA College SurveysResearch (e.g. Bean, 1985; Cabrera et al., 1992; Cabrera, Nora, & Castaneda, 1992; Nora, 1987; Nora, Attinasi, & Matonak, 2000; Pascarella & Terenzini, 1979, 1980)

10
Methods: Data Analysis
Overall Measures of Goodness-of-Fit of ModelG²/df ratio (<2.5)Pseudo R² (reduction in error variance)PCP (Percent of cases correctly predicted by model)-2 log likelihood (reduction in values)
Individual VariablesExponential of Beta Weight (Odds Ratio)Only variables found to be significant within each block (model)t-value >1.96
11
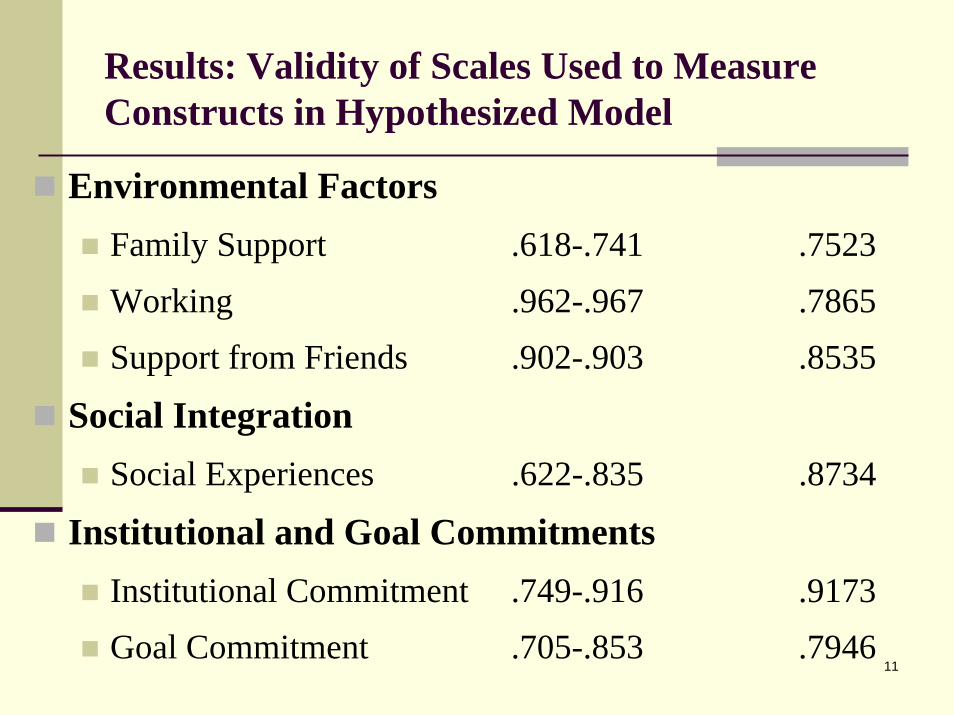
Results: Validity of Scales Used to Measure Constructs in Hypothesized Model
Environmental FactorsFamily Support .618-.741 .7523Working .962-.967 .7865Support from Friends .902-.903 .8535
Social IntegrationSocial Experiences .622-.835 .8734
Institutional and Goal CommitmentsInstitutional Commitment .749-.916 .9173Goal Commitment .705-.853 .7946

12
Results: Validity of Scales Used to Measure Constructs in Hypothesized Model (Cont.)
Academic ExperiencesPositive Academic Experiences .760-.865 .7945Classroom Participation .601-.779 .6575Academic Resources Utilization .733-.745 .7008Mentoring .653-.714 .6908Informal Interactions w/Faculty .531-.761 .6118Academic Functions .721-.756 .7561

13
Results: Validity of Scales Used to Measure Constructs in Hypothesized Model (Cont.)
Perceptions of RemediationValue Remediation .511-.854 .8658Transitioning to Classes .793-.830 .6116Utility of Remediation .691-.853 .6967Feelings of Marginalization .703-.806 .7774Pre-College Underpreparedness .642-.795 .6162Fairness in Placement .738-.878 .7399Learning Deficiencies .741-.769 .6325Acquisition of Literacy Skills .827-.827 .5378Practical Meaningfulness .521-.791 .6003

14
Table 2. Indicators of Overall Goodness-of-Fit.
Indicators of Fit Pre-college Environmental Social Academic Academic Institutional/ PerceptionsFactors Factors Integration Experiences Performance Goal Commit of Remediation
G2 1568.896 1528.743 1509.290 1484.553 1463.919 1456.310 1380.158
(df) 1257 1249 1248 1242 1241 1237 1228G2/df .248 1.223 1.209 1.195 1.179 1.177 1.123Pseudo R2 0.01 0.04 0.05 0.08 0.09 0.10 0.16PCP 68.25% 69.84% 69.05% 68.65% 69.05% 69.05% 73.02%Change in G2 13.5168 40.153 59.606 84.343 104.977 112.586 188.738Change in df 3 8 1 6 1 4 9Improvement of fit .0036 .0000 .0000 .0004 .0000 .1070 .0000(p-value)
15
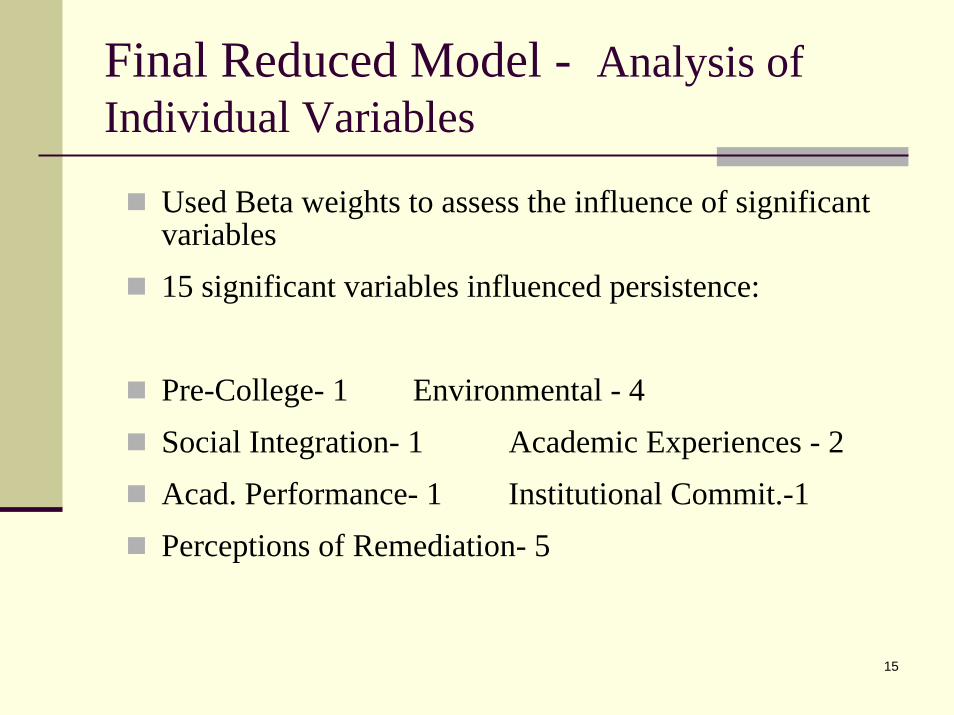
Final Reduced Model - Analysis of Individual Variables
Used Beta weights to assess the influence of significant variables15 significant variables influenced persistence:
Pre-College- 1 Environmental - 4Social Integration- 1 Academic Experiences - 2Acad. Performance- 1 Institutional Commit.-1Perceptions of Remediation- 5
16
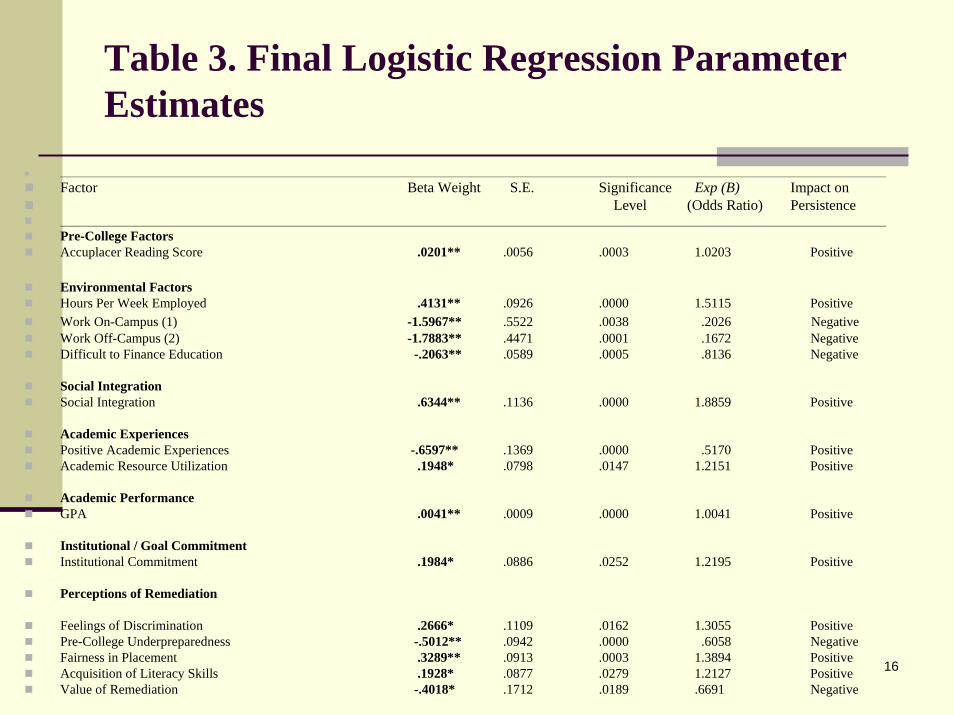
Table 3. Final Logistic Regression Parameter Estimates
Factor Beta Weight S.E. Significance Exp (B) Impact onLevel (Odds Ratio) Persistence
Pre-College FactorsAccuplacer Reading Score .0201** .0056 .0003 1.0203 Positive
Environmental FactorsHours Per Week Employed .4131** .0926 .0000 1.5115 PositiveWork On-Campus (1) -1.5967** .5522 .0038 .2026 NegativeWork Off-Campus (2) -1.7883** .4471 .0001 .1672 NegativeDifficult to Finance Education -.2063** .0589 .0005 .8136 Negative
Social IntegrationSocial Integration .6344** .1136 .0000 1.8859 Positive
Academic ExperiencesPositive Academic Experiences -.6597** .1369 .0000 .5170 PositiveAcademic Resource Utilization .1948* .0798 .0147 1.2151 Positive
Academic PerformanceGPA .0041** .0009 .0000 1.0041 Positive
Institutional / Goal Commitment Institutional Commitment .1984* .0886 .0252 1.2195 Positive
Perceptions of Remediation
Feelings of Discrimination .2666* .1109 .0162 1.3055 PositivePre-College Underpreparedness -.5012** .0942 .0000 .6058 NegativeFairness in Placement .3289** .0913 .0003 1.3894 PositiveAcquisition of Literacy Skills .1928* .0877 .0279 1.2127 PositiveValue of Remediation -.4018* .1712 .0189 .6691 Negative
17
Overall ConclusionsValidation of the Theoretical Framework
Components of all six blocks in the original framework (pre-college, environmental, social experiences, academic integration, academic performance and institutional commitment) included statistically significant influences on student persistence.

18
Overall ConclusionsImproved the ability of the Student Engagement Model (Nora, 2000) to predict student persistence.
Demonstrated the validation of remedial attitudes and their impact on the persistence of developmental students.

19
Findings
Reading proficiency plays an important role in the successes of developmental students in college.
Working (on- or off-campus) and the stress associated with financial concerns significantly pushes the developmental student to choose to leave college.
Students with higher levels of involvement in the social aspects of university life are more likely to remain in college.
High GPAs are a positive motivator for students to stay in college.

20
Findings (cont.)
Five factors related to perceptions of remediation predict the likelihood of persistence:
1. Value placed on remediationStudents value support, assistance and encouragementStudents who perceive remediation as beneficial and necessary are more likely to re-enroll after their first yr
2. Perceived feelings of discrimination and marginalization (in class and off-campus)
Students exposed to discriminatory behavior from faculty and peers are more likely to persist“I’ll show you” phenomenon

21
Findings: Five Factors (cont.)3. Self-perceptions of under-preparedness prior to enrolling in college
The more students perceive that they are unprepared, the less likely they are to decide to re-enroll in the second year with graduation as their goal.
4. Sense of fairness in the assessment and placement of developmental students
Students that realize that their academic ability has been accurately measured, that placement tests are fair assessments, and believe that they belong in developmental classes enter their remediation with positive attitudes that they were fairly placed; these attitudes are instrumental in affecting persistence attitudes.
5. Conviction that acquiring literacy skills through remediation isnecessary to perform well in college
Students that value the acquisition of these skills are affected by these positive academic attitudes in that they are more likely to return to campus the following year.

22
Concluding RemarksInstitutional researchers and policy makers must consider the interplay between institutional, personal, perceptual, and external factors in developing and assessing remediation programs. Current study provides empirical evidence that attitudes and perceptions related to remediation are influential in impacting developmental student withdrawal decisions.Developmental efforts may be offset by the negative perceptions that remedial students hold of being placed in developmental courses.In contrast, doing a better job of conveying the positive aspects of developmental courses to those that are labeled as needing remediation will offset those negative attitudes resulting in student persistence.