the role of performance incentives in need-based...
TRANSCRIPT

The role of performance incentives inneed-based grants for higher education:
Evidence from the Spanish Becas∗
José Montalbán†
Paris School of Economics
January 2018
Abstract
There is limited empirical evidence that allows to disentangle the specific contribution ofminimum academic standards (from the income effects) to the impact of need-based financialaid on student outcomes. In addition, there is scarce research that is able to isolate the effectsof those programs on the intensive margin responses of student performance. This paper in-vestigates the causal effect of financial aid on the academic performance (average GPA andfraction of credits passed) and degree completion of low-income students in higher education.The specific design of the Spanish national need-based grant program allows to disentanglethe effect of grant eligibility under different intensities of performance-based incentives andon the intensive margin response on student performance. I use the sharp discontinuitiesinduced by family income thresholds to estimate the effect of being eligible for different cat-egories of allowances, and exploit the fact that academic performance requirements becamemore stringent for students who applied for a grant after 2012. I find no effects of the granton student performance under a framework comparable to the weak performance incentivesthat characterize the typical need-based grant programs around the world. By contrast, Ifind strong positive effects under a setting with more demanding performance standards.Student’s also enhance their final exams attendance rate, their average GPA in final examstaken, and their probability of degree completion. There is neither evidence of an impact ofgrants on student course selection nor on the probability of dropout from higher education.
Keywords: Need-based grants; performance incentives; college achievement
JEL Classification: I21, I22, I23, I28, H52
∗I would like to specially thank Julien Grenet for his excellent, devoted and generous advise. I would like toexpress my gratitude to José E. Boscá, Antonio Cabrales, Natalie Cox, Gabrielle Fack, Javier Ferri, Martín Fernán-dez, Jesús Gonzalo, Marc Gurgand, Xavier Jaravel, Clara Martínez-Toledano, Sandra McNally, Guy Michaels,Chrstopher A. Neilson, Fanny Landaud, Michele Pellizzari, Steve Pischke, Olmo Silva, Daniel Reck, MarionaSegú, and Alessandro Tondini for their useful and wise comments. I am also grateful to the staff of UniversidadCarlos III de Madrid: Paloma Arnaiz Tovar, Gloria del Rey Gutiérrez, Luis Losada Romo and Elena ZamarroParra, for their invaluable help in collecting the data. I thank seminar participants at Paris School of Economics,London School of Economics, University College of London, and Queens Mary University, as well as conferenceparticipants at the IWAEE 2018, XXVI Meeting of the Economics of Education Association, VIII Workshop onEconomics of Education, 16th “Brucchi Luchino” Labor Economics Workshop and Impact of Grants on Educationand Research Seminar at AIReF. Finally, I am thankful to Fundación Ramón Areces and Bank of Spain for itsfinancial support. An earlier version of this work was circulated under the title: “The role of need-based grantson higher education achievement”.†Paris School of Economics, Boulevard Jourdan, 48, Paris 75014, France. Email:

1 Introduction
The existing empirical evidence suggests strong college degree premium on individuals’ life-
time income.1 Despite the considerable general increase in access to higher education over the
last decades,2 students with low-educated parents report substantially lower attainment rates
(OECD, 2016).3 This gap is driven both by their difficulty to access higher education, mainly
due to financial barriers, and by the fact that their average performance is below that of their
peers.4 To relax low-income students’ budget constraints, financial aid is provided conditional
on meeting several need-based criteria and minimum performance-based standards (i.e. having
passed a certain number of credits and/or having earned a minimum average GPA). The literature
on financial aid shows positive effects on several students’ outcomes, capturing the joint income
and incentive effect of grants (i.e. the complementarity between the awarded cash amounts and
performance-based standards). However, there is a particular lack of empirical evidence disen-
tangling the specific contribution of performance-based incentives on student performance in the
national large scale need-based grant programs.
In this paper, I test the effect of the Spanish national large-scale need-based grant program
on student performance and degree completion. Specifically, I investigate whether the intensity
of performance-based components alone matters for student achievement. In a nutshell, I find
no effects under a setting comparable to the weak performance incentives that characterize the
typical need-based grant programs around the world. By contrast, I find strong positive effects
on student performance and degree completion under a setting with more demanding incentive
components.
To increase access to post-secondary education for low-income students, many countries pro-
vide need-based grants that typically cover tuition fees and award cash transfers to alleviate
students’ budget constraints. Examples of such programs are the Pell Grant in the US, the
Maintenance Grant in the UK, the Bourses sur critères sociaux in France, or the Becas de1See, e.g., Kane and Rouse (1995).2Over the period 1995 to 2014, the percentage of young adults who enter university increased from 37 to 59
percent on average among OECD countries.3Of the adults with at least one college-educated parent, 67 percent attained a tertiary qualification, compared
to only 23 percent among those with low-educated parents.4The main deterrent to enter college education has been found to be financial barriers (Ellwood, Kane et al.,
2000; Baum, Ma and Payea, 2013; Berg, 2016). In addition, evidence that highlights the existence of an abilitygap between low-income children and their peers, starting in preschool education (Heckman, 2006) and carryingon in adolescence (Cunha and Heckman, 2009), is complemented with papers showing that conditional on beingenrolled in higher education, students with low-educated parents generally attain lower grades, take fewer credits,and have higher dropout rates than students with college graduated parents (Terenzini et al., 1996; Lowe andCook, 2003; Pascarella et al., 2004; Sirin, 2005; Bowen et al., 2006).
2

Carácter General in Spain. Those plans benefit a large number of college students, around one
third in the US and France, and one quarter in Spain. In addition to the need-based criteria,
most of the programs request applicants to meet minimum performance-based standards. In the
US, such academic criteria are the Satisfactory Academic Progress (SAP) requirements for fed-
eral need-based aid programs, which generally require students to maintain a cumulative grade
point average (GPA) of 2.0 or higher and to complete at least two thirds of the course credits
that they attempt.
A particularly difficult and controversial debate is at stake, specially in the US, on whether
academic incentives ought to be incorporated (and if so under which form) to the national large-
scale need-based grant programs. While some academics and policymakers have supported the
idea, others have alerted on whether need-based grant programs attached to academic incentives
would lead low-income students to disadvantage situations. Dynarski and Scott-Clayton (2013)
claim that “grants that link financial aid to academic achievement appear to boost college out-
comes more than do grants with no strings attached”. However, the precise role that performance
standards tied to grant aid plays on aid effectiveness is not yet clear, due to the limited available
empirical evidence disentangling their specific contribution.
This paper aims at brings new evidence on this central issue using a large-scale national
need-based grant program. Based on linked administrative micro-data covering the universe of
students applying for the Spanish national need-based grant program at Carlos III University of
Madrid over the six academic-year period 2010–2015, I exploit the sharp discontinuities induced
by family income thresholds to estimate the effect of being eligible for different categories of
allowances and performance standards on applicants’ outcomes.
This paper makes several contributions to the literature on student financial aid. First, I
exploit the fact that grant setting and academic performance requirements became more stringent
for students who applied for a need-based grant after 2012, in order to test whether the effect
of the grant is affected by the intensity of academic standards. The unique design of the policy
allows me to disentangle the grant effects under two different settings of performance standards,
holding income effects almost constant. Second, the timing of grant applications in Spain and
the fact that students are already enrolled in higher education when they apply for the grant,
allow to isolate the effects of grants on the intensive margin responses on student performance,
since the extensive margin responses (college enrollment) are essentially muted due to the timing
of grant applications. Third, thanks to the richness of the administrative data, I am able to
3
examine the effects of this reform on a broader set of outcomes (e.g. GPA, dropout, final exam
attendance or selection on courses) than have been previously considered in the literature.
I find no effects of large discontinuous changes in grant amounts at the eligibility cutoff on
student performance in the period during which performance requirements were relatively weak
and comparable to those found in other need-based grant programs around the world, e.g. the
SAP requirement for the renewal of the Pell Grant. By contrast, I find that being eligible for an
average of 760 euros grant (relatively to being eligible for only fee waiver) in the period when
performance requirements were made more stringent, increases student average GPA and and
fraction of credits passed by 0.46 points (on a 0 to 10 scale) and 4.5 percentage points, which
corresponds to an increase of approximately 7.6 and 6 percent with respect to the baseline mean.
Furthermore, results are found to persist over time, enhancing the student cumulative average
GPA over two consecutive years. I investigate the possible mechanisms behind the results showing
that neither dropout nor student selection on courses can explain the grant’s positive effects on
performance. Instead, I find that the effects are driven both by students attending more often
to final exams, and by students earning a higher GPA on the final exams taken, including those
courses which are compulsory, and hence cannot be avoided by students. In addition, I find
positive effects on student’s probability of degree completion.
One of the most prominent study in this literature and the closest to this paper is Scott-
Clayton (2011), which evaluates the West Virginia’s PROMISE grant using a regression discon-
tinuity design. The paper shows positive effects on student GPAs and credits earned during the
first three years of university, only when students faced a minimum GPA requirement to main-
tain award eligibility, suggesting larger incentive effects of the scholarship than income effects
obtained from greater financial aid. On the other hand, Scott-Clayton and Schudde (2016) ex-
plore the consequences of SAP failure, finding negative impacts on persistence but positive effects
on grades for students who remain in college. A recurrent potential limitation of related papers
is the potential endogenous selection around the eligibility cutoffs, which may bias the results.5
Together with these papers, the Manpower Demonstration Research Corporation (MDRC) has
performed several randomized evaluations,6 as well as Angrist, Lang and Oreopoulos (2009) and
Angrist, Oreopoulos and Williams (2014), offering financial incentives for good grades. These5Lindo, Sanders and Oreopoulos (2010), Schudde and Scott-Clayton (2016), Scott-Clayton and Schudde (2016),
and Casey et al. (2015) all find similar concerns at the eligibility cutoff, implementing “donut-RD” designs.6See, e.g. Barrow et al. (2014), Cha and Patel (2010), Miller et al. (2011) or Richburg-Hayes, Sommo and
Welbeck (2011).
4
papers point out the importance of performance-based incentives on student performance. In
contrast, they cannot entirely disentangle the specific contributions of income and incentive
effects, they are narrowly defined programs devoted to specific groups and/or operating at a
particular state or university, and often include additional components (such as academic and
support services) that make difficult to isolate the specific role of performance standards.
The previous empirical literature exhibits two crucial identification challenges. The first dif-
ficulty is to identify incentive effects. Several need-based grant programs report performance
requirements for renewal, but it is still not entirely clear which is the relevance of those stan-
dards in explaining the effects on student performance. The empirical evidence has found that
incentives matter for enhancing student performance, but the majority of need-based programs
schemes do not allow for disentangle between income and incentive effects. Second, identifying
the effect of need-based grants on student performance when they affect college enrollment is
not straightforward. Most of the literature focuses on the extensive margin effects on enroll-
ment, implying that when there exists an impact on enrollment is challenging to disentangle
the intensive margin effect on performance. Furthermore, the vast majority of papers looking
at the impacts of merit-based and need-based allowances on student achievement may not be
entirely representative to all population of college students, due to the fact that they focus on
non-enrolled or freshmen students, who report the highest probability of dropout.
Financial aid may influence low-income students’ outcomes through two main channels: cost-
of-college and incentive effects. First, the relaxation of budget constraints may prevent financially
constrained students from working part-time, inducing them to devote more time to study.
Second, if students lack of sufficient motivation, have high time preferences, or are not aware of
the exact returns to schooling, performance-based incentives may increase their motivation to
exert higher academic effort and self-improve. Nevertheless, Fryer (2011) remarks that financial
incentives may have two additional effects that work in the opposite direction. First, incentives
will have little impact if students lack the structural resources or knowledge to convert effort into
a measurable achievement or if the production function has important complementarities out of
their control (e.g. effective teachers, engaged parents or social interactions). Second, some argue
that financial rewards for students (or any kind of external reward or incentive) will undermine
intrinsic motivation and lead to negative outcomes. The main theoretical models of this literature
are Manski (1989) “schooling as experimentation” model, and Bénabou and Tirole (2002) model
of student behavior under performance standards. In addition, Scott-Clayton and Schudde (2016)
5
propose the most connected model to a context of need-based grants with performance standards
and three periods: an evaluation period, a warning period, and an enforcement period. Their
theoretical results show that discouragement (dropout) effects will be concentrated among those
in the lower part of the ability distribution, while the encouragement (improved GPA) effects
should be concentrated among those who are close to the performance requirement threshold.
They conclude that a minimum standard is desirable, but determining whether the standard is
too high or too low would require weighting the value of encouragement and discouragement
effects.
These papers suggest that academic standards might increase the efficiency of aid expendi-
tures by reducing time spent in higher education and improving student performance, but they
could also intensify inequalities by inducing low-income students to dropout. As time spent in
tertiary education is highly subsidized by the state, performance standards may reduce costs for
taxpayers on repeated subjects failures and long attainment time rates, but at the same time,
dropout might be private and socially costly.
Related to this paper is the literature on the effects of financial aid. The empirical evidence
has mainly focused on the effects of need-based grants programs on college enrollment (Dynarski,
2003; Fack and Grenet, 2015; Castleman and Long, 2016), college persistence (Bettinger, 2004;
Goldrick-Rab et al., 2012), and earnings (Angrist, 1993; Bound and Turner, 2002; Stanley, 2003).
Existing studies have documented the positive influence of such programs on low-income stu-
dents’ enrollment, persistence, graduation and earnings, for the sub-population of students who
would not have entered university without financial support (“marginal” students). Hence, the
available evidence suggests that need-based grants are effective in expanding higher education
opportunities for low-income students, raising those students’ capacity to access higher educa-
tion. In spite of the fair amount of research documenting the effects of these grants on college
entrance, there is far less evidence on the incentive effects of such programs. Empirical evidence
devoted to clarify the potential impacts of grants on student performance has been developed
mainly in the context of merit-based aid, which is granted conditional on academic achievement.
Generally, these grants have been found to exert positive but small effects on student perfor-
mance. In the first place, those programs, such as the US National Merit program and Canadian
Excellence Awards, were targeted only at top-performers. In the 1990’s, several merit-based
grants were introduced for non-top students, such as Georgia’s Helping Outstanding Pupils Ed-
ucationally (HOPE), which provided fee waiver for college students who maintain at least an
6

average of B. Numerous HOPE-style programs have been implemented in different US states
as Florida or Arkansas, finding positive results for key students’ outcomes.7 Few papers have
explored performance effects of need-based grants, with evidence mostly coming from programs
devoted to specific groups of population in a particular state or university (see, e.g Goldrick-Rab
et al., 2012 for a random assignment of a private Wisconsin need-based grant or Brock and
Richburg-Hayes, 2006 for an evaluation of the Opening Doors program for two New Orleans
universities), where overall, there is non-conclusive evidence of a positive impact of need-based
grants on credit accumulation and GPA.
The remainder of this paper is structured as follows. Section 2 provides institutional back-
ground on the Spanish higher education system and on the national need-based grant program.
Section 3 describes the data used in the paper. Section 4 explains the empirical strategy. Sec-
tion 5 discusses the internal validity of the research design, analyzes the main results, explores
heterogeneous effects and examines the different mechanisms that could explain the results. Sec-
tion 6 concludes with a discussion.
2 Institutional Background
2.1 Higher Education in Spain
The Spanish educational system is organized as six years of primary schooling (from the
age of 6 to the age of 12), four years of secondary education (from the age of 13 to the age
of 16), and two years of non-compulsory education, which is divided into a vocational track
(Ciclos Formativos) and an academic track (Bachillerato). After graduating from high school,
students choose whether to pursue into higher education. The vast majority decide to enroll in
college education, leading to vocational undergraduate degrees (CFGS ), academic undergraduate
degrees (four-year degree called Grado), graduate degrees (Master) and doctoral studies. To
access higher education, students must pass the standard access to university test (PAU ),8 which
consist on two-year college preparation courses and a standardized entry exam (Selectividad).9
Spanish public universities accept all students who apply to their programs. If the demand for a7See, e.g. Cornwell, Mustard and Sridhar (2006) for an evaluation of Georgia’s HOPE program, Dynarski
(2008) and Sjoquist and Winters (2012) for an investigation of Georgia and Arkansas HOPE-like programs, andCastleman (2014) for an analysis of the Florida Bright Futures Scholarship.
8The name has changed from 2017 onward to Evaluación de Bachillerato para el Acceso a la Universidad(EBAU). 92 percent of the students who took the test in 2015 passed it.
9The final grade of PAU is composed by a preponderated average with weights 0.6 for Bachillerato and 0.4for Selectividad.
7

specific program exceeds the number of available seats, students are admitted in the order of their
PAU grades until all seats are filled. Outside of these two main tracks, a minority of students
enroll in artistic education (arts, music, dance, dramatic arts, etc.), which offers undergraduate
and graduate degrees.
The cost of higher education in Spain is mainly composed by tuition fees and living expenses.
Tuition costs vary depending on the region where the university is located, the degree program
undertaken, and the number of times registered in the same subject. These costs are set at
relatively high level, especially in relative terms for low-income students, as the national average
tuition fees for a full year was 1,100 euros for undergraduate students in 2015 and between
1,634 and 2,347 euros for graduate students.10 Given the fact that most of the universities are
located in large urban areas, students face relatively high living costs. In 2011, a survey on living
conditions of Spanish college students indicated that the majority were living with their parents,
and that only 6.3 percent were living in university residence halls.11 Furthermore, according to
current estimations of the first semester of 2015, the average cost of living expenses in Spain for a
nine-month period was 5,069 euros,12 which represent a significant financial barrier to emancipate
from their family home and to access higher education. A loan system was functioning in Spain
from 2009 to 2011, but the timing – in the midst of a recession – was unpropitious and many
students defaulted on their loan payments. The loan system was discontinued as a result.13
2.2 The Becas de Carácter General Need-Based Grant Program
Grant Program. The Becas de Carácter General (BCG hereafter) is the Spanish national
financial aid program for low-income students in post-secondary education. BCG is the most
ambitious program for college students in Spain, since it represents about 86 percent of the total
budget for grants in higher education. About a quarter of the academic undergraduates and 15
percent of graduate students enrolled received this grant in 2014, for a total cost of 829 millions
of euros. The official objectives assigned to this grant program by the Ministry of Education
is to contribute to the equality of opportunities and to improve the educational efficiency by
promoting low-income students’ potentiality.
The program consists on three main levels of grant: (i) the Fee Waiver (Threshold 0) exempts10Public prices are detailed in Estadísticas de precios públicos universitarios del MECD.11See Ariño (2011).12These estimates are based on the CJE (2015), using the rent prices offered by Idealista.com and the Censo
de Población y Viviendas de 2011.13See OECD (2015).
8

eligible applicants from paying tuition fees; (ii) the Residence Grant (Threshold 1) provides cash
allowance which is intended to cover home expenses of students who live away from their family
home by reasons of college distance; and (iii) the Compensate Grant (Threshold 2) provides
cash allowance to compensate the student’s lack of family income. Students who qualify for the
Residence Grant (RG grant hereafter) receive an average annual cash allowance of approximately
1,068 euros (or about 2,300 euros) for those living inside (outside) the family home. When
students fulfill the Compensate Grant (CG grant hereafter) requirements, the average amount
increases on an additional 3,000 euros (3,500 euros) for those who live in (away) their parents’
home. Before 2013, there was an additional level of grant, the Displacement and Other Needs
Grant (Threshold 3). This level of allowance provided students with different cash endowments
as displacement to the university, urban transport, academic material or final undergraduate
degree project. A student who received this grant (DG grant hereafter) could obtain only one
or a combination of those different endowments.
Eligibility Rules. Students are eligible to the BCG grant if they are citizens of member states
of the European Union, are enrolled in a Spanish higher education institution, and do not hold
a degree of equivalent or higher level than the one they are applying for.14 Students can receive
a BCG grant for at most one year more than the official length of the program which they are
enrolled in, and for a maximum of two additional years of the program length for students who
are enrolled in STEM (Science, Technology, Engineering and Mathematics) degrees.
Grant eligibility is assessed on the basis of student needs and academic performance. The
need condition is evaluated on the basis of the applicant’s annual household income the year
before application. Qualification for a grant and the amount awarded depend on the students’
household taxable income, as well as the number of household members.15 The applicant’s
annual household income is computed as the household taxable income minus specific quantities
to which student’s may qualify (such as large family or disability).16 The grant can be denied14From 2013 onward, students from post-compulsory degrees (such as college preparation or vocational track)
in the educational system are also eligible. Detailed information about the students’ eligibility rules is providedin Real Decreto 1721/2007 de 21 de diciembre, Boletín Oficial del Estado (BOE). Furthermore, each coursesapplication specifics are detailed in the BOE : Orden EDU/1781/2010 de 29 de junio, EDU/2098/2011 de 21 dejulio, Resolución de 2 de agosto de 2012, Resolución de 13 de agosto de 2013, Resolución de 28 de julio de 2014,and Resolución de 30 de julio de 2015.
15The definition of a student’s household includes the student’s father, mother, siblings under the age of 25,grandparents, and the applicant. All of them are counted only if they live in the same family dwelling. In case ofparental divorce, only the household members who live with the applicant are considered.
16For instance, if income sources are coming from any other household member but student’s parents, thehousehold is classified as large family, or there is a family disabled member, among others.
9
based on household income as well as when household wealth, family business activity and capital
returns exceed certain thresholds.
Family income thresholds determine applicant’s eligibility to different levels of grant depend-
ing on the number of household members. The fact that income eligibility thresholds change with
the number of family members creates multiple discontinuities, which are graphically displayed
in Figure 1. To be eligible to the first and second levels of grant (fee waiver and RG grant), for
a household with four members (which is the average value in the sample), the annual family
income must fall behind 38,831 and 36,421 euros respectively, which corresponds approximately
to the fourth and top quintiles of the Spanish income distribution.17 To be eligible to the highest
level of grant (CG grant), the same household must earn less than 13,909 euros, which roughly
corresponds to the bottom quintile of the income distribution in Spain.
The grant’s academic requirement is met conditional on having passed a minimum fraction
of credits the year before application. Applicants must be enrolled in at least 60 ECTS credits,
which corresponds to the number of credits obtained in a typical academic year.18 In 2013, the
framework of the program and the performance-based incentives were modified.19 From now on
I will refer to the three academic year terms of 2010–2012 as Period I, and the years 2013–2015
as Period II, concerning two different BCG setups.
Freshmen students must show an average grade in PAU of: (i) 5/10 points (corresponding to
having passed the university entrance exam) to qualify for all grant levels in Period I; (ii) 6.5/10
to qualify for all grant levels, and 5.5/10 to be only eligible for the fee waiver allowance in Period
II. Students who are not in their first year of higher education, must provide evidence on have
passed a certain fraction of credits the year before applying:
• Period I (2010–2012): 60 percent if the student is enrolled on a STEM degree, and 80
percent in any other degree.
• Period II (2013–2015): 65 (90) percent if enrolled on a STEM (non STEM) degree to
be only eligible for the fee waiver endowment. In order to qualify for all grant types,
the student must have passed either: (i) 85 (100) percent if enrolled on a STEM (non
STEM) degree; or (ii) 65 (90) percent if enrolled on a STEM (non STEM) degree, plus17Computations based on de España et al. (2017).18There are some special exceptions where students are allowed to be enrolled in less than 60 credits, e.g. when
the attended program is made of less than 60 credits per year or when the student is affected by a disability.19Detailed information about the change in BCG setup is provided at the end of this section and in the online
appendix, section F.
10

have obtained an average GPA of 6/10 (6.5/10) respectively for STEM (non STEM) degree.
Application Process. The allowance is set up on a yearly application process that is common
to all applicants. A summary of the application procedure follows:
• July-early August : the official call is made public in the Official State Gazette.
• Mid August-Mid October : applications are submitted to the Ministry of Education. The
application form consists of an online questionnaire. No document transfer is needed since
the Ministry contacts directly the institutions concerned, i.e., the Tax Authority and the
university where the student is enrolled.
• December : applications start to be denied for non-eligible students. Application outcomes
are not necessarily disclosed at the same time for all applicants. Denied grants are revealed
in December, on average, while awarded grants are notified after January until the end of
the academic year.20 Usually, the total amount granted is transferred to the students one
month after the notification.
The unique application process of this program allows to estimate the cash allowance effect on
student performance with no concerns of enrollment effects that may bias the results. Students
are already enrolled at the higher education institution when they apply, and the vast majority
of grant decisions are not notified before the end of the first term of the academic year. Hence,
estimations are based on “intramarginal” students (students who would have enrolled in university
irrespective of receiving financial support) and measure intensive margin responses.
The potential manipulation of information by applicants might be a concern for this type
of allowances. It should be noted, however, that the Ministry directly contacts the Tax Agency
and the university in order to check applicants’ household income and academic status. Hence,
students have only limited ability to misreport this information. A more serious concern is that
students may be more likely to apply if they are below the income family thresholds, generating
a discontinuity in application rates at the cutoffs. Before 2009, income eligibility thresholds
changed every year complicating the applicant’s knowledge of their accurate situation, but over
2010–2015, income thresholds remained unchanged. Discontinuities in application rates would
be more likely to occur at the Fee Waiver grant cutoff, since, at other levels of grants, students20Denied grants are disclose on average at the same time for both Period I and II. In contrast, conceded grants
were divulged in February-March on average for Period I, and in June for Period II.
11

remain eligible for at least some form of aid (e.g., tuition fees) and hence have strong incentives
to apply even if they anticipate being below the corresponding cutoffs. Moreover, the existence
of multiple income reductions that affect the computation of students’ annual household income,
makes it difficult for students to accurately evaluate their relative distance to the grant eligibility
cutoffs. The complexity of the eligibility rules may encourage students to apply even in cases
when they are unsure on whether they meet the criteria. Manipulation on eligibility threshold
is discussed extensively in section 5.1.
Change into the BCG grant: Period I vs. Period II. As mentioned previously, the grant
structure was changed in the academic year 2013, affecting the design of the program and its
performance-based incentive components.
First, in addition to the three main cash allowances, the previous framework included the
DG grant, which was based on a number of criteria such as distance to university, educational
material, academic performance, etc. In 2013, these different components were merged into a
single individual variable element, with conceded allowance if the student’s family income was
below the RG threshold. The variable component of the grant is set at a minimum amount of
60 euros, and is computed as a deterministic function of the student’s average GPA, the average
GPA distribution of grant holders, the applicant’s income, and the income distribution of all
applicants.21 Likewise, the average per capita cash allowance amounts were reduced from one
period to the other, for those receiving the CG grant, and for those living away from their family
and eligible to the RG grant (discontinuities in average grant amounts are discussed extensively
in section 5).
Second, more demanding academic performance requirements were set to be eligible to the
grant, as explained above in this section. Overall, performance-based requirements became more
stringent. The changes between the two periods can be therefore summarized as: (i) an increase
in the minimum fraction of credits passed the year before application; (ii) the inclusion of the
average GPA the year before application among the academic performance requirements; (iii)
the incorporation of the grant’s variable component which award students with different grant
amounts depending on their GPAs in the current academic year.22
21The exact formula of the variable component of the grant is provided in the online appendix (sectionF). The Ministry of Education offers an online simulator for the variables amounts at the following address:http://www.mecd.gob.es/educacion-mecd/mc/becas/2016/estudios-universitarios/simulador.html
22A detailed summary of the policy change regarding academic performance requirements is provided in theonline appendix (section F).
12

3 Data and Descriptive Statistics
Data. The data used in this paper are a combination of different administrative micro-data of
BCG grant applicants over the six academic-year period 2010–2015, who were enrolled in Carlos
III University of Madrid. I exploit the SIGMA database which consists of four administrative
data files, which can be matched on the basis of an encrypted student identifier: i) household
information, ii) awarded grants, iii) university enrollment, iv) grades in university. The household
information database contain the set of variables that determine grant eligibility (household
taxable income, number of family members, household wealth, family business, large family
condition and whether a family member suffers a disability), the administrative status of the
scholarship (grant final status, denied reason and type of scholarship), and reference parent’s
occupation. The awarded grants database provide details about the BCG grant amounts, the
type of allowance and the date of concession. The university enrollment database embrace
information about grant applicants at the time they enter university, such as gender, nationality,
postal code and the score in the PAU entrance exam. The database on university grades covers
all academic curricula of students who at least applied once to the BCG grant between 2004 and
2015, providing information on the department, degree and subjects in which each student is
enrolled, as well as each subject’s course and the final grade obtained.
Sample restrictions. On average, 5,300 Carlos III students apply for a grant in a given year.
Table 1 displays the number of BCG applicants by year and degree program. The analysis is
restricted to undergraduate students, who represent 93 percent of total applicants. Graduate
students are not included in the analysis due to their limited sample size, which separate esti-
mations at each income-eligibility threshold would be imprecise. Moreover, I focus on students
who were not denied the grant due to problems with the Tax Agency and were not declared in-
eligible by excess wealth or business income, in order to make the regression discontinuity design
sharper.23.
Descriptive Statistics. Table 2 shows descriptive statistics on the sample of BCG grant
applicants who were considered in the analysis. I split the estimation sample into two groups: (i)23Students excluded from the sample of analysis represented 16.17 percent of the total applicants over the
six-year period. Excluding such students would be a problem if the probability of being denied a grant due to thereasons explained above was discontinuous at the grant eligibility cutoffs, thus leading to sample selection. Thispotential threat to identification is not a concern here, since rejection probabilities are continuous on either sidesof the cutoffs (results available upon request).
13

the RG grant sample (Threshold 1) includes applicants who are in the vicinity of the RG grant
threshold; (ii) the CG grant sample (Threshold 2) includes applicants whose relative household
income is close to the CG grant threshold. Most of the applicants are Spanish, were living
with their parents when they entered university, and are enrolled in non-STEM degrees. The
average household taxable income is approximately 32,000 euros for the RG grant sample, and
approximately 14,000 euros for the CG grant sample. The average household size is four people
and 11 to 17 percent of applicants in the treatment samples qualify for the large family bonus.
The majority of applicants’ family head member worked as blue collar.
4 Conceptual Framework and Empirical Strategy
Conceptual Framework. A basic “law of behavior” is that stronger incentives should lead to
more effort and higher performance (Gneezy, Meier and Rey-Biel, 2011). A number of studies
have provided empirical support for the claim that the higher the payment, the higher the effort
(Gneezy and Rustichini, 2000), but whether monetary incentives are large enough depends on
the specific case under consideration. If incentives are sizable enough, their direct price effects
will be larger than the crowd-out effect, but if they are too high, individuals can “choke under
pressure” and incentives can backfire (Ariely et al., 2009).
A theoretical framework is convenient to rationalize the potential effects that grants may have
on student performance under different cash amounts granted and performance standards, given
individual income levels. Let student performance (y) depends on the cash amount awarded (a),
the performance standards required (s), and the individual income level (c):
y = f(a, s, c) (1)
where f(.) is a deterministic function.
To simplify, assume that performance standards can be either high (s̄) or low (s), and that
grant amounts may take three values (a′′ > a′ > 0). Generally, it is reasonable to expect positive
performance differential effects for a marginal increase in the level of amount and performance
standards, conditional on the level of income. Formally, fa(a, s, c) > 0 and fs(a, s, c) > 0.
Without loss of generality, define ∆y = f(a1, s1, c) − f(a0, s0, c), as the change in student
performance under different levels of grant amounts (a0, a1) and performance standards (s0, s1).
14

This equation can be written as a function of the partial derivatives using a Taylor expansion:
∆y = f(a′′, s, c)− f(a′, s, c) ∼ fa(a′, s, c) ∗ (a′′ − a′) (2)
where a′ denotes the amount of financial aid above a certain cutoff and a′′ the grant amount
below the specific threshold. Intuitively, this can be interpreted as the performance differential
effect of receiving a′′ level of financial aid, relative to obtaining a′ (where a′′ > a′).
The two scenarios analyzed in this paper are the following:
(i) Scenario 1: RG grant (cash grant amounts relative to zero). Consider two different settings
similar to the situations of Period I and Period II at RG grant threshold. A first setting where
performance standards are weak (s) and ∆yRGI is defined as fa(0, s, c)∗a′, and a second situation
where performance standards are strong (s̄) and ∆yRGII is settle as fa(0, s̄, c) ∗ a′, where the
reference group is awarded with zero cash grant amount. Comparing both states lead to the
following equation:
∆yRGII −∆yRG
I = [fa(0, s̄, c)− fa(0, s, c)] ∗ a′ (3)
Since a′ is similar in both periods, the sign of this difference depends on the cross-derivative
sign, fas(0, s, c). The cross-derivative would be positive if a given increase in grant amount has
stronger effects on performance when performance incentives are higher (s̄ vs. s). This scenario
is comparable to the design of BCG at RG grant in the different periods. The average amount
conceded is almost the same in Period I and Period II, but the incentive components are more
demanding in Period II than in Period I.
(ii) Scenario 2: CG grant (cash grant amounts relative to a′). Consider two different scenarios
similar to the situations in Period I and Period II at CG grant threshold. A first setting where
performance standards are weak (s) and ∆yCGI is defined as fa(a′, s, c) ∗ (a′′ − a′), and a second
situation where performance standards are strong (s̄) and ∆yCGII is settle as fa(a′, s̄, c)∗ (a′′−a′),
where the reference group is awarded with certain cash grant amount a′. Comparing both states
lead to the following equation:
∆yCGII −∆yCG
I =[fa(a′, s̄, c)− fa(a′, s, c)
]∗ (a′′ − a′) (4)
In this situation, the result is non-trivial. First, since (a′′−a′) is larger than a′ (the cash grant
15

amount awarded in CG grant is larger than in RG grant), and the sign of the difference depends
on the cross-derivative fas(a′, s, c) evaluated at a higher level of grant than in scenario 1, it may
be the case that higher increments of grant amounts lead to higher performance enhance in a
setting with more demanding performance standards. On the other hand, as a′ > 0, following
Kahneman and Tversky (1979) and Tversky and Kahneman (1991) notion of reference dependent
preferences and loss aversion, along with papers testing this type of behavior in the education
literature (Fryer et al., 2012; Levitt et al., 2016), it may be the case that the cross-derivative,
evaluated at greater amount of grant, is close to zero, regardless of the performance standards
required. This concept shows that people underweight outcomes that are merely probable in
comparison with outcomes that are obtained with certainty, and this tendency contributes to
risk aversion in choices involving sure gains and to risk seeking in choices implicating sure losses.
In scenario 1, students are awarded with financial aid relative to zero cash amount. In scenario
2, students are grant awarded relative to a positive reference cash amount (a′). The opportunity
cost of not complain with the grant performance standards for the reference group (i.e., those
students who are not receiving the grant) is lower in scenario 1 (zero) than in scenario 2 (a′).
As the reference group is awarded with certain cash amount in scenario 2, it is likely that they
behave as loss averse and the potential loss encourage them to perform better. This scenario is
comparable to the design of BCG on CG grant in the different periods. The average amount
conceded and the grant quantity starting with are larger than in RG grant, but the incentive
components are more demanding in Period II than in Period I.
Therefore, it seems clear that fas(a, s, c) > 0 when evaluated at a equal to zero (i.e., an
increase in grant amount will have larger effect on performance when incentives are stronger),
but it may be that when evaluated at high enough a, fas(a, s, c) ∼ 0 (i.e., the effect of an increase
in grant amount on performance, starting from large a, will not be higher when performance
incentives are stronger), or fas(a, s, c) > 0 (i.e., an increase in grant amount will have larger
effect on performance when incentives are stronger, irrespective of the amount of financial aid
starting with).
Empirical Strategy. The goal is to estimate the causal effect of being eligible for a need-
based grant on student performance and degree completion under two different grant settings.
The estimates of a simple OLS regression of college achievement on a dummy variable indicating
whether the student receives a grant would be subject to omitted variable bias, even after con-
16

trolling for observable characteristics such as parental income, gender or predetermined ability
measures, since the investigation would not account for unobservable determinants of student
performance that are likely to be correlated with financial aid status (e.g., motivation).
To identify the treatment effect of being eligible for a need-based grant, I exploit the sharp
discontinuities in the amount of cash allowances awarded using a regression discontinuity design
(RDD). The BCG grant generates two different discontinuities at the RG and CG grant eligibility
thresholds. Let Ei,k,t denote a dummy variable that takes value one if applicant i is eligible for
a grant of level k (k = 1, 2) at year t, and zero otherwise. Eligibility for a level k grant is a
deterministic function of the applicant’s net household taxable income cit, and the number of
family members, mit:
Ei,k,t = 1{cit ≤ c̄k(mit)} (5)
where 1{·} is the indicator function and c̄k(·) is a deterministic function that returns the
household taxable income threshold when the number of family members is mit.
Let Ait denote the amount of conditional aid awarded to student i at time t. The total
amount granted is determined as the sum of the different allowances increments αk,p for which
students are eligible at k level of grant in period p, where p = 1 for Period I (2010–2012) and
p = 2 for Period II (2013-2015):
Ait = 1{t ≤ 2012} ∗2∑
k=1
αk,1Ei,k,t + 1{t > 2012} ∗2∑
k=1
αk,2Ei,k,t (6)
The allowance increments in Period I and Period II are defined as follows:
αk,1 = γk,1 (7)
αk,2 = γk,2 + 1{t > 2012} ∗ zi(ci, ci, gi, gi) (8)
where γk,1 and γk,2 are period-specific fixed amounts, and zi(·, ·, ·, ·) is a deterministic function
that returns the amount of variable component granted to applicant i with household income ci
and grades gi when average household income and average grades among applicants are ci and
gi respectively.
The reduced-form equation capturing the relationship between the eligibility formula and the
17
outcome variable is the following:
Yit = α+ 1{t ≤ 2012} ∗2∑
k=1
βk,1Ei,k,t + 1{t > 2012} ∗2∑
k=1
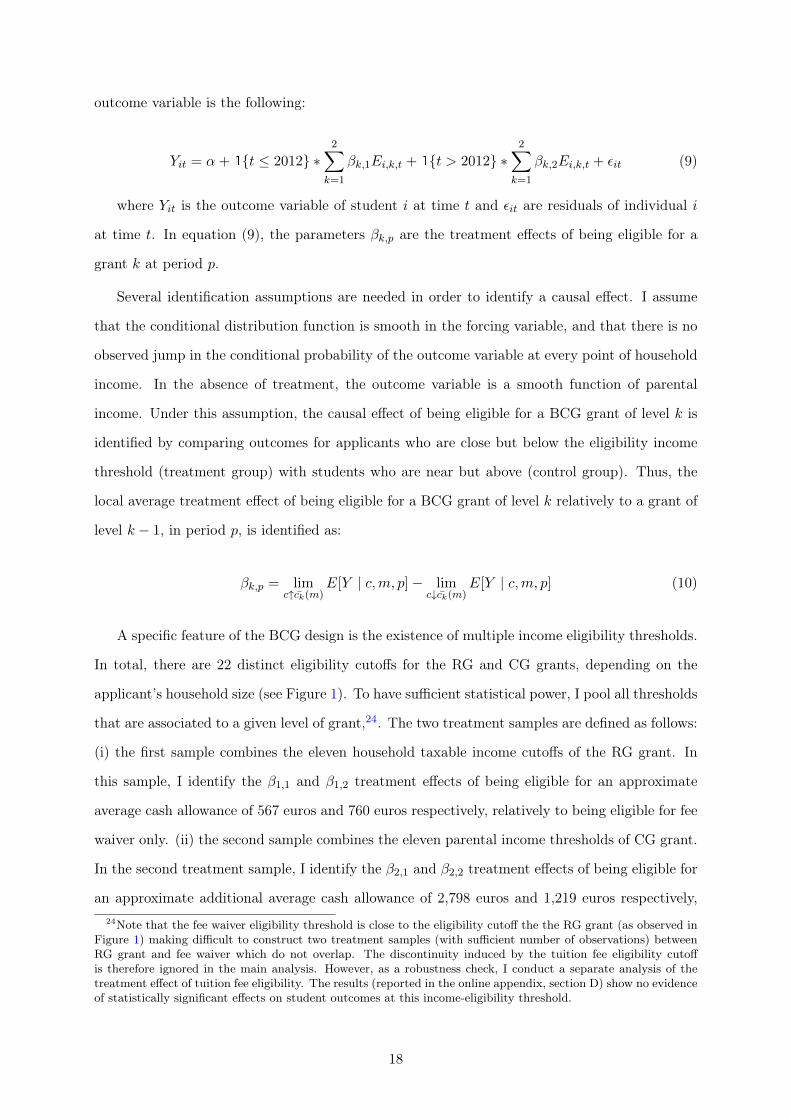
βk,2Ei,k,t + εit (9)
where Yit is the outcome variable of student i at time t and εit are residuals of individual i
at time t. In equation (9), the parameters βk,p are the treatment effects of being eligible for a
grant k at period p.
Several identification assumptions are needed in order to identify a causal effect. I assume
that the conditional distribution function is smooth in the forcing variable, and that there is no
observed jump in the conditional probability of the outcome variable at every point of household
income. In the absence of treatment, the outcome variable is a smooth function of parental
income. Under this assumption, the causal effect of being eligible for a BCG grant of level k is
identified by comparing outcomes for applicants who are close but below the eligibility income
threshold (treatment group) with students who are near but above (control group). Thus, the
local average treatment effect of being eligible for a BCG grant of level k relatively to a grant of
level k − 1, in period p, is identified as:
βk,p = limc↑c̄k(m)
E[Y | c,m, p]− limc↓c̄k(m)
E[Y | c,m, p] (10)
A specific feature of the BCG design is the existence of multiple income eligibility thresholds.
In total, there are 22 distinct eligibility cutoffs for the RG and CG grants, depending on the
applicant’s household size (see Figure 1). To have sufficient statistical power, I pool all thresholds
that are associated to a given level of grant,24. The two treatment samples are defined as follows:
(i) the first sample combines the eleven household taxable income cutoffs of the RG grant. In
this sample, I identify the β1,1 and β1,2 treatment effects of being eligible for an approximate
average cash allowance of 567 euros and 760 euros respectively, relatively to being eligible for fee
waiver only. (ii) the second sample combines the eleven parental income thresholds of CG grant.
In the second treatment sample, I identify the β2,1 and β2,2 treatment effects of being eligible for
an approximate additional average cash allowance of 2,798 euros and 1,219 euros respectively,24Note that the fee waiver eligibility threshold is close to the eligibility cutoff the the RG grant (as observed in
Figure 1) making difficult to construct two treatment samples (with sufficient number of observations) betweenRG grant and fee waiver which do not overlap. The discontinuity induced by the tuition fee eligibility cutoffis therefore ignored in the main analysis. However, as a robustness check, I conduct a separate analysis of thetreatment effect of tuition fee eligibility. The results (reported in the online appendix, section D) show no evidenceof statistically significant effects on student outcomes at this income-eligibility threshold.
18

relative to being eligible for RG grant (567 euros and 760 euros respectively).
Notice that the framework offers a clear advantage to identify the effect of incentive com-
ponents alone, since the difference between β1,1 and β1,2 are the more demanding performance
standards of the second period, under very similar average cash allowances on both periods (less
than 200 euros of difference). In contrast, β2,1 and β2,2 identify the effect of the program under
different performance standards and average cash allowances granted (1,579 euros), blurring a
clear distinction between incentives and income effects.
Following Lee and Lemieux (2010), the treatment effects are estimated using a rectangu-
lar kernel.25 The standard errors are computed using standard least squares methods (robust
standard errors) clustered at the student level.26 The bandwidth is computed as the optimal
bandwidth proposed by Imbens and Kalyanaraman (2012).
A reasonable potential concern regards the presence of treated (untreated) students for com-
plaining (not meeting) the academic requirements in both sides of the income-eligibility thresh-
olds. A potential empirical analysis to account for it may be to develop a two-dimensional RDD,
with two running variables: relative distance to income-eligibility thresholds, and distance to the
academic requirement thresholds. Two problems arise to implement this type of RDD. First, due
to sample size limitations, separate estimations at each academic requirements threshold would
be very imprecise. Second, there are multiple academic requirement thresholds, since in the sec-
ond period additional thresholds where incorporated in order to combine the fraction of credits
passed and average GPA on the year before application. The presence of multiple dimensions
of academic cutoffs reduces the sample size even more and complicate the identification (a nor-
malization for all academic cutoffs may be a solution but results would be difficult to interpret).
Likewise, the proportion of students who were denied a need-based grant for not complained with
the performance minimum standards was 6.6 and 8.6 percent in the RG and CG grant treatment
samples respectively. In the online appendix (section D), I perform a robustness check testing
the significance of the baseline results on a treatment sample that do not include students who
did not complain with academic standards. The results are robust to this test.25Results are larger and robust when a triangular kernel is used. Results available upon request.26Standard errors are clustered at the student level due to the fact that the same student may be observed
several times in the same treatment sample if she applied more than once in the period studied.
19
5 Results
5.1 Internal Validity of the Empirical Strategy
The internal validity of the RDD requires that there is no endogenous sorting on either side of
grant eligibility cutoffs. This behavior may lead to a continuity break in applicants’ density at the
cutoff, and would imply that the treatment group (eligible students) cannot be compared to the
control group (non-eligible students). As emphasized by Imbens and Lemieux (2008), this type
of endogenous sorting is more likely to occur in the common case where the treatment assignment
rule is public knowledge, as in this setting. Since precise thresholds are public information and
have not changed since 2010, a concern of manipulation at the cutoff arises specially for the first
income-eligibility threshold (fee waiver). In contrast, manipulation is less likely at higher cutoffs,
since students have incentives to apply on either side given the fact that students on both sides
are awarded with certain amount of aid.
A formal investigation of the non-random sorting of applicants at the income eligibility thresh-
olds is key to the validity of the RDD estimation strategy. McCrary (2008) proposes a test based
on an estimator for the discontinuity in the density function of the running variable at the cutoff,
checking the no systematic manipulation of household parental income around the thresholds.
Figure 3 shows the graphical representation of the density estimates in the vicinity of the cutoffs,
displaying evidence of no density break at the two thresholds examined, RG and CG grant. As
expected, density of applicants increased as parental income decreased in RG grant, given the
fact that more students may be encouraged to apply as they were closer to the cutoff. Density
estimates at CG grant were roughly constant, since applicants have incentives to apply on both
sides as they would be awarded with fee waiver plus a positive cash allowance. McCrary test
statistics confirm that the null hypothesis of no density jump at the eligibility cutoffs cannot be
rejected.27
An additional test for local random assignment is to check whether applicants baseline char-
acteristics are “locally” balanced on either side of the thresholds. If some groups of students are
more likely to sort on the “good” side of a threshold may indicate endogenous sample selection,
and treatment assignment cannot influence variables that are predetermined with respect to the
treatment. Local linear regressions are performed for each of the applicants’ observable character-
istics (gender, nationality, parental income, PAU score and parents’ occupation, among others)27See online appendix (section B) for details of McCrary test’s estimates for all treatment samples used in this
paper (i.e., by period, gender, predetermined ability, etc.).
20

as dependent variable. Panel A of Table 3 presents the regression results, showing that none
of the baseline students’ characteristics change discontinuously at income eligibility thresholds,
since none of the coefficients are statistically significant. Furthermore, I combine the multiple
test developed on a single test statistic in order to observe whether all observable variables are
jointly non-significantly different from zero. A chi-squared test based on a system of seemingly
unrelated regression with as many equations as baseline characteristics is performed. Panel B
indicates that the null hypothesis that the discontinuity gaps are jointly equal to zero cannot be
rejected.
An additional concern is that parental income, at constant prices of 2015, was highly corre-
lated over time (regressing applicants’ income in a given year on income the year before leads
to a coefficient estimate of 0.73), which may lead to a persistent sorting of applicants on either
side of eligibility cutoffs and may confound the effects of current year discontinuities in grant
amounts with those from previous years. In fact, there was variation in income, since the fraction
of applicants who reported the same parental income than the one registered the year before was
only 3.2 percent, which may explain why there was no endogenous sorting in the previous tests.
Students’ who were awarded a grant in a given year might be more likely to re–apply the next
year, especially for those below the cutoff of the RG grant. It may suggest that impacts would be
driven by this group, with no density break for applicants at the cutoffs but so for re–applicants.
A robustness check testing the discontinuity in the density of re-applicants cannot reject the null
hypothesis of zero discontinuity in re-applicants’ density.28
5.2 Discontinuities in Grant Amounts
In this subsection, I examine the discontinuities in average grant amounts awarded on the
income-eligibility thresholds, which is a necessary condition for the empirical design to identify
the causal effects of grants on student outcomes.
Figure 4 shows the average fraction of applicants who were awarded either with a RG or
CG grant plotted against the relative income-distance to the relevant eligibility thresholds. The
figure indicates that 90 percent of the applicants received the grant. The remaining 10 percent
are applicants who either did not comply with the grant achievement criteria or the Tax Agency
found administrative problems with their tax records.
Figure 5 presents the average conditional grant amount for all treatment samples as a function28See online appendix, section B.
21

of applicants’ relative distance to the thresholds over the two periods under study. The results
indicate a clear discontinuity in the average conditional cash allowance for RG and CG grants
over the two periods, reinforced by the statistically significant results showed in Table 5 (Panel
A). RG grant provides a similar average grant amount for both periods, with an average cash
amount of 567 euros in Period I and 760 euros in Period II (relatively to been awarded with
fee waiver). CG grant reports a drastic decrease in the average grant amounts awarded between
periods, with an average increment in the cash amount of 2,798 euros in Period I and 1,219 euros
in Period II (relatively to RG grant cash awards).
5.3 Impact on Student Performance
I focus on the average GPA as a measure of student performance, which in Spain can take
values between 0 (the minimum grade) and 10 (the maximum).29 Likewise, results are robust
to using other measures of student performance, such as the fraction of credits passed over the
total credit attempted (Panel C of Table 5).
Baseline Estimates: current year effects. Figure ?? plots the average GPA for all treat-
ment samples as a function of applicants relative income-distance to the thresholds over the two
periods studied. The solid black lines are the fitted values from a quadratic polynomial approx-
imation. The average GPA is similar across the two samples of applicants (around the RG and
CG grant thresholds respectively), but over time, the average GPA was around 5.9 points in Pe-
riod I and 6.15 points in Period II. Table 5 presents the RDD estimates (Panel B). I find no effect
of relatively large cash allowance (neither for 567 nor for 2,798 euros) on student performance in
Period I, when performance requirements were comparable to the weak performance incentives
that characterize the typical need-based grant programs around the world. By contrast, I find
that being eligible for an average grant of 760 euros (relatively to being eligible for fee waiver) in
Period II, when performance requirements were made more stringent, increased students’ average
GPA by 0.46 points, which corresponds to an increase of approximately 7.6 percent with respect
to the baseline mean. Furthermore, being eligible for an average grant of 760 euros (relatively
to being eligible for fee waiver) in Period II, increased the students’ fraction of credits passed of
approximately 6 percent with respect to the baseline mean.30
29GPA’s equivalence is the following: less than 5 points corresponds to a D grade, 5 points to a C grade, 7points to a B grade, 8 to a B+, 9 to an A, and 10 to a A+.
30In online appendix, section E, displays a t–test of the difference in baseline means of students’ observablecharacteristics by period and treatment sample, for an attempt to test the comparability of the two periods for
22

The RG grant threshold offers a unique opportunity to analyze the role that performance-
incentives play in BCG grant, since average grant amounts were very similar between Period I
and Period II (527 vs. 760 euros), but performance-based incentives were different. The results
suggests that academic incentives augment the effectiveness of aid in improving student perfor-
mance. The interpretation of the non-significant results at the CG threshold over the two periods
is ambiguous. It can be explained through a loss aversion behavior, i.e. the incentive components
affect differently students who are entitled to different levels of grants (the loss opportunity cost
of not complain with academic standards is higher at CG grant than at RG grant), though the
incapacity of the poorest students (CG grant applicants) to react to incentives due to their lack
of ability for developing effective study strategies, or as the positive effect of a higher incentive
component being offset by the negative effect of large decrease in the cash allowance awarded
between Period I and Period II.31
Baseline estimates are robust to several specification checks. The sensitivity of the baseline
results is tested by investigating different bandwidth selection criteria, where the bandwidth is set
to be half and twice as large of the optimal bandwidth proposed by Imbens and Kalyanaraman
(2012), and by performing the local polynomial regression with robust bias-corrected confidence
intervals proposed by Calonico, Cattaneo and Titiunik (2014). Moreover, the baseline results are
robust to control for applicants’ predetermined observable characteristics as well as year fixed
effects that capture time trends in the outcome variable. The results are robust to all different
specifications and vary from an effect of 0.27 to 0.5 points, which corresponds to about 4.5 to
8.3 percent with respect to the baseline mean.32 Although the magnitude of estimates varies
across specifications due to the limited sample size, the direction of the effects hold over the
different specifications, indicating a robust impact of grant eligibility on student performance
when the academic standards were stronger. In addition, the null effect of the grant under the
other different thresholds (CG and fee waiver grant) and periods is also robust.33
Most of the literature focuses on the extensive-margin effect of grants on enrollment, mainly
for entry students. When there is an effect on enrollment (which is often stronger for freshmen
students), disentangle the intensive margin response on performance is challenging (due to the
each of the two allowances studied. The null hypothesis of equality of the observable characteristics betweenperiods cannot be rejected for three quarters and more than half of the variables in RG and CG respectively.
31The interpretation of the results is discussed extensively in the Discussion section of the paper.32The results of each robustness check are presented in the online appendix, section D.33The null effect of the grant at the Fee Waiver cutoff, where students are relieved from tuition fees but are not
granted with cash amounts are presented in the online appendix, section D.
23

potential bias that the enrollment effect provides). An advantage of this paper’s identification
strategy is the specific timing of grant applications in Spain, that allow to estimate their effects
on students who are already enrolled, and for whom dropout rates are relatively small. Table 6
displays the RDD estimates on university dropout. The null hypothesis of a zero effect of cash
allowance on dropout cannot be rejected for all types of grants and periods. The results are
reassuring the fact that the effect of the grant on student performance is not biased by the
dropout effects.
Persistence of effects over time. Being eligible for a need-based grant may have dynamic
effects over students’ academic careers. Grants may produce long-lasting effects over time im-
pacting students outcomes in several subsequent years. I compute the effect of being eligible
for a grant on applicants’ cumulative performance over several academic years: conditional on
applying for a grant at time t with a certain household income, it is possible to compute the
cumulative average GPA over subsequent years. This method would provide unbiased estimates
and no sample selection concerns, but potentially the first stage would decrease over time due
to the variability of applicants’ application status and household income over years.34 Local lin-
ear regression estimates indicate that being eligible for a grant under strong performance-based
incentives increased the cumulative average GPA over two years by 0.39 points per year, which
corresponds to an increment of about 6.5 percent per year with respect to the baseline mean. The
results are robust to the inclusion of predetermined applicants variables and time fixed effects,
and to set the regression bandwidth to be twice as large of the optimal bandwidth proposed
by Imbens and Kalyanaraman (2012),with results ranging from 0.23 to 0.39, which corresponds
to a 4.0 to 6.5 percent increase with respect to the baseline mean. Nonetheless, results are not
robust to set the regression bandwidth to be half as large of the optimal bandwidth nor to the
local polynomial regression with robust bias-corrected confidence intervals proposed by Calonico,
Cattaneo and Titiunik (2014).35 Need-based grant with high performance standards seems to
have a positive impact on student performance that last for two consecutive years.34First stages and a test for discontinuity in the density function of the running variable at the cutoff are
presented in the online appendix, section C.35Results available upon request.
24
5.4 Heterogeneous Effects of the Impact on Student Performance
Despite of the robust baseline estimates, investigating the existence of heterogeneous results
for different subgroups of population is necessary to understand if there are differential effects
by gender, predetermined academic ability and residence status, using separate regressions for
each of the subgroups.
Table 8 presents the RDD estimates for the RG and CG by period and sample subgroups.
The positive effects of the RG grants on student performance coupled with more stringent per-
formance incentives are found for both males and females, but the magnitudes differ (Panel
A). The coefficient estimates are statistically significant and indicates that being eligible for a
RG allowance under strong academic incentives has larger effect on performance for males than
for females, with the difference across gender being statistically significant. Panel B explores
heterogeneous effects by academic ability. Being eligible for a RG grant in a setting with high
incentives has significantly positive effects on student performance for students both above and
below the median percentile rank in PAU. The null hypothesis that both effects are equal across
groups below and above the median cannot be rejected. Panel C presents the results divided by
the different applicants’ residence conditions. It seems that the positive impacts are driven by
applicants who were living with their parents in the Region of Madrid (non-movers hereafter)
when they enter university, while students who were living away from their family home (movers
hereafter) are not affected by grant qualification. The null hypothesis of equality of coefficients
is rejected. While students living away from their family home receive positive amounts decreas-
ing in the second period (from 2,500 to 1,600 euros on average), applicants who live with their
parents earned a zero amount in the first period and 410 euros on average in the second period.36
The grant structure allows to consider the first period of non–movers as a placebo test, when
this group of applicants did not receive a positive average amount and incentive components
were weaker. A change from zero to a positive cash allowance of 410 euros, interacted with
strong academic incentive components leads to a positive impact on students’ average GPA of
0.41 points (7 percent with respect to the baseline mean).
The importance of the performance standards intensity. Figure 5 and Figure ?? dis-
play the fact that with similar average cash amount granted, an allowance setting with strong
performance-based components is more effective at enhancing student performance, as opposed36See online appendix, section C.
25

to a setting with weaker incentives. Nevertheless, Table 8 shows that the effect is only driven by
non-movers. Those students received zero cash allowance in Period I, but 410 euros on average
in Period II, while the effect is only statistically significant in Period II. Effects might be derived
by the cash allowance award, the performance-based incentives or the complementary of both.
In order to test the policy’s efficiency, a deeper inquiry is needed.
An ideal test would be a similar amount of cash awarded for non-movers at Period I and II
for RG grant, but unfortunately this is not the case. As a robustness check, I use the DG grant
for non–movers as comparison group for RG non–movers at Period I, since both thresholds are
very close to each other.
This analysis is useful to investigate the role of grant’s performance-based incentive compo-
nents. The key advantages of using the DG cutoff are twofold. First, the DG grant was located
15 percent of the relative distance below the RG threshold, which mitigates concerns regarding
the comparability of students in the vicinity of these two cutoffs. The sample of non-movers
received their first cash award at DG in Period I, which makes the comparable group similar
to non-movers at RG in Period II. Second, the discontinuities in average cash grant amounts
were very similar (543 vs. 410 euros). Hence, using non-movers in Period I for DG grant as a
comparison group for RG non-movers in Period II is convenient due to the fact that it offers
an scenario where entitlement to the grant, cash allowances and sample are comparable, but
performance-incentives are different in the two periods.
The average increase in cash allowance at DG in Period I was 543 euros for non-movers, and
cash endowments at RG in Period II was 410 euros for non–movers. However, the null hypothesis
of zero effect of being eligible for the DG grant on non-movers student performance cannot be
rejected. Results are robust to different treatment sample sizes, regarding the predetermined
characteristics of applicants, year fixed effects, to set the optimal bandwidth proposed by Imbens
and Kalyanaraman (2012) as half and twice of its value, and to perform the local polynomial
regression with robust bias-corrected confidence intervals proposed by Calonico, Cattaneo and
Titiunik (2014).37
Student performance was not impacted by DG grant in Period I, and it was positively im-
pacted in Period II by the RG, under approximately the same cash allowance amounts but
different incentives. This finding suggests that performance-based incentive components seems37See online appendix (sections B, C and D) to see the validity of the research design, the discontinuities in
grant amount and the RDD estimates.
26
to play a crucial role on enhancing student achievement. Nevertheless, performance standards
alone do not seem to be enough to improve student outcomes, since monetary incentives appear
to be also crucial (there is no grant effect on fee waiver grant). The results point out to a com-
plementarity between certain cash allowance and strong performance-based incentives as drivers
of the grant’s effect on performance.
5.5 Mechanisms
The goal of this section is to analyze whether the performance increments observed are due
to an actual rise in student success or are spurious, e.g. if they are driven by students taking
easier subjects. Table 9 presents the results of the RDD estimates on different variables for RG
and CG by period, and Figure 9 plots these different channels, reinforcing the results of the
non-parametric estimates.
Final exam attendance rate. Panel A shows that being eligible for an average cash allowance
of 760 euros (relative to fee waiver only) increased the final exam attendance rate when perfor-
mance incentives were more demanding. Although the average fraction of grant applicants who
attended final exams was already high (92 percent), qualifying for such level of grant enhances
this average by 3.3 percentage points, which corresponds to an increase of about 3.6 percent with
respect to the baseline mean.
GPA on final exams taken. Students may attend with higher frequency to final exams,
while their performance on them may remain unchanged. The fact that students showed-up more
often to final exams may enhance their total average GPA due to the less frequent inclusion of
subjects graded as zero points (grade given to students who fail to attend) in the total average
GPA computation, but no for actual improvement in their performance. To test this hypothesis,
I examine the discontinuity in the average GPA on final exams taken, in order to capture the
increase in performance over the subjects that students finally took. Panel B displays that
students who were eligible for an average cash allowance of 760 euros (relative to fee waiver only)
under a setting with strong performance-based incentives improved their average GPA in final
exams taken by 0.24 points, which corresponds to an increase of about 3.7 percent with respect
to the baseline mean. The null hypothesis of zero effect is rejected at the 5 percent confidence
level, indicating a genuine improvement in student performance.
27

Selection on courses. The need-based grant seems to help students to perform higher on
subjects attended to the final exam. Even so, applicants may self-select on easier subjects when
they are below the income eligibility thresholds, in order to increase their probability to meet the
performance standards for grant renewal for the next academic year or enhance their probability
to receive a higher amount of grant in the current year thought the variable component. Then,
the average selection on courses may be different on both sides of the cutoffs, leading to a
positive impact on performance which would be difficult to interpret. An intuitive measure of
selection on courses would be to compute the average GPA by subject-year, and then compute
the average subject-GPA over the total subjects that a student enroll by year. Though, this
measure is strongly correlated with applicants’ average GPA, especially in the same academic
year, leading to endogeneity concerns. To test this conjecture, I examine the discontinuity of
the average academic ability of the students’ enrolled in each subject. First, I compute the
average academic ability (measured as the percentile rank in PAU access to university test) by
subject-year. Second, I calculate the average academic ability of the total subjects enrolled in by
student-year. Since relatively better performing students tend take more challenging subjects,
this measure provides a proxy for the degree of subject selection. Endogeneity concerns of
this variable given by subject-grade-student selection are relaxed by choosing a predetermined
measure of academic ability, which may be correlated with the average GPA but not endogenous
to it. There is no evidence that being eligible for an average cash allowance of 760 euros (relative
to fee waiver only) under strong academic standards impact the students’ selection on courses.
The null hypothesis of an allowance qualification effects on the average selection on courses
cannot be rejected.
GPA on mandatory and elective subjects. Finally, I investigate the differential results on
the average GPA for mandatory and elective courses as an additional test. Students are required
to pass a certain number of elective courses chosen from a determined set of subjects which
are degree-course specific, and several mandatory courses which are compulsory and degree-
course specific. If applicants were to self-select in easier subjects, it is reasonable to expect it to
happened for elective courses, due to the fact that such courses were those for which students had
room for subject selection. Panel D and E analyze the effects of the grant on the average GPA
for mandatory and elective courses. The results clarify that the effect is driven by an increase in
the average GPA on mandatory subjects, since applicants who were eligible for an average cash
28

allowance of 760 euros (relative to fee waiver only) under strong performance-based incentives,
increased their average GPA by 0.43 points, which corresponds to an increase of 7 percent with
respect to the baseline mean. Despite the higher average GPA on elective courses compared with
mandatory, the null hypothesis of zero grant effect on average GPA in elective courses cannot be
rejected.
5.6 Impact on Degree Completion
Table 10 expands the analysis by investigating the impact of financial aid on degree com-
pletion. The table focuses on students who applied for the grant in the final year of a degree
program, i.e., in their fourth year of a bachelor’s degree. The non–parametric estimates indicate
that being eligible for 760 euros (relatively to the tuition waiver) in the period when perfor-
mance requirements were more stringent, increased student’s chances of obtain a degree by 8.3
percentage points, which corresponds to an increase of approximately 9 percent with respect to
the baseline mean. In contrast, the null hypothesis of zero effect on degree completion under
a setting with the typical performance incentives of the national large-scale need-based grant
programs around the world cannot be rejected.
6 Discussion
The Spanish national need-based grant program provides a unique design to analyze its causal
effect on student performance and graduation. I find no effect of relatively high cash amounts on
student performance (average GPA and fraction of credits passed) and degree completion in a
setting with weak performance incentives comparable to the typical need-based grant programs
around the world. In contrast, I find that an average provision of 760 euros cash allowance
(relatively to receive only fee waiver) increased student performance and probability of degree
completion in a setting with more demanding performance-based incentives. Students also en-
hance their final exam attendance rate and their GPA on final exams taken. There is no concerns
on student selection on courses or dropout effects that may bias the results.
6.1 External Validity
The estimates are based on a sample of low-income high school graduates enrolled in Carlos
III University who applied to a BCG grant to start or to continue undergraduate college studies.
29

Carlos III University is a public higher education institution. An analysis comparing the edu-
cational attainment of Carlos III students with the rest of collegian enrolled in Spanish public
universities presents that these students scored higher in the standardized university access exam,
reported higher graduation rates and presented lower dropout rates (among other measures) than
the rest of their fellows in Spain. However, the group of students who drive these differences are
non-BCG grant recipients. In contrast, BCG grant recipients in Carlos III are highly compara-
ble with BCG grant recipients in Spain, reporting similar GPAs, number of credits passed (over
the total credits enrolled and the final exams taken), and time to graduation.38 The sample of
grant applicants is reasonably representative of the general population of low-income students
in Spain. This group can be considered as comparable to the typical targeted population of
most large-scale need-based grant programs around the world, e.g students graduated from high
school and admitted to college. The results cannot be directly extrapolated to the population of
low-income students who fail in high school graduation and might respond differently to financial
aid, whereas they can be comparable to non-traditional students.39
The institutional features of higher education systems are decisive for the external validity
of the results. Spain is part of the group of countries (along with France, Italy, Belgium or
Austria) where post-secondary systems are mainly public and tuition fees charged are relatively
low (OECD, 2016). In these countries, the student level of debt is considerably low, and the
need-based programs cover tuition fees and part of the living expenses for low-income students.
The results of this paper cannot be immediately compared with the US students who are not
eligible to fee waivers (e.g. the Pell Grant), due to the fact that they present substantially larger
levels of debt, higher tuition fees, and greater probabilities of working to pay for college. On the
other hand, the effects of this paper are potentially comparable to the population of US students
who are entitle to both fee waiver and need-based grants.
6.2 Interpretation of Results: Efficiency, Equity and Grant’s Design
This paper points out to the importance of performance-incentive schemes on need-based
grant’s cost-effectiveness. From the efficiency point of view, a program with strong academic
requirements presented a differential performance improvement for those students whose com-
parison group was receiving only fee waiver and zero cash amount. By contrast, the grant did not38Details of the analysis are provided in the online appendix, section A.39The Spanish BCG grant eligibility criteria do not impose any upper age limit, neither as the US Pell Grant.
30

seem to affect performance of those students whose comparison group was awarded with certain
cash amount, neither under a setting with weak academic standards nor stronger performance-
based components. Two hypothesis may help to interpret the results. First, the results seem
to be consistent with the large literature on reference dependent preferences that demonstrates
behavior consistent with a notion of loss aversion (Kahneman and Tversky, 1979; Tversky and
Kahneman, 1991), including papers testing this type of behavior in the education literature
(Fryer et al., 2012; Levitt et al., 2016). This concept presents that people underweight outcomes
that are merely probable in comparison with outcomes that are obtained with certainty, and this
tendency contributes to risk aversion in choices involving sure gains and to risk seeking in choices
implicating sure losses. An increase in the provision of financial aid on a group of low-income
students whose counter-factual was receiving a certain positive cash amount does not appear to
have a differential effect on student performance, due to the fact that the reference group may
behave as loss averse, independently of the magnitude of performance incentives. The opportu-
nity cost of not complain with performance standards is higher when some previous cash amount
was awarded. This result is consistent with Fack and Grenet (2015), which largest effects of the
French national need-based grant program were concentrated on those students receiving the first
endowment of cash allowance and not for students entitled to higher levels of grant. In addition,
several studies find large behavioral responses to small-scale interventions (Bettinger et al., 2012;
Hoxby, Turner et al., 2013). Second, the null impact of the grant may be due to the fact that
the poorest students are not as able as their peers to respond to performance incentives, even
under the fairly large cash amounts granted. This result is consistent with Fryer (2011), which
found no effect of financial incentives on student achievement on a sample of urban schools in
the US. Perhaps, the muted effectiveness of the grant on those students may partly reflect the
trouble struggling students have developing effective study strategies (Angrist, Oreopoulos and
Williams, 2014; Daly and Lavy, 2009; Fryer, 2011).
It is not entirely clear that these hypothesis are the solely explanations. RG grant offers a
unique setting to test the effects of performance standards alone by comparing both periods with
broadly the same income effect but different incentives. In contrast, the same comparison is not
possible for CG grant, since it is not viable to investigate whether low-income students would
react under the same income effects on both periods but different incentives. The large decrease
in average amounts between periods may offset the positive effect induced by the stronger perfor-
mance standards presented at this grant level. In this setting the “law of behavior” which states
31

that incentives are stronger when amounts are higher is only verified at the extensive margin of
the entitlement to the grant.
From an equity stance, there is no evidence of an effect of the grant on dropout from higher
education, neither for students whose comparison group was awarded with fee waiver nor for
those whose counter-factual group was receiving certain cash amount. Stronger performance
standards do not seem to induce grant applicants to significantly dropout with higher intensity.
These results seem to contradict the evidence that performance incentives have negative impacts
on student persistence (specially for those lower in the ability distribution) showed by Scott-
Clayton and Schudde (2016). Perhaps the discouragement effects are concentrated on non-grant
applicants, who could perceive the academic standards as draconian.
The results support a need-based grant setting with stronger academic requirements than the
typical need-based grant programs around the world. A framework with such level of incentives
seem to be the clear driver of the increase in student achievement and degree completion, and
therefore, to enhance grant’s efficiency at least for those low-income students whose comparison
group was awarded with zero cash amount. Overall, the grant appear to be cost-effective under
this structure, at least partially.
The design of performance-based incentives on need-based grants is an important policy
question. Scott-Clayton and Schudde (2016) suggest that some minimum performance standard
is desirable. Scott-Clayton (2011) shows that incentives tied to minimum course loads (not just
GPAs) may be one promising tool for increasing educational attainment and speeding time-
to-degree. The results of Angrist, Oreopoulos and Williams (2014) and Angrist, Lang and
Oreopoulos (2009), along with the evidence showed in Cha and Patel (2010) and Barrow et al.
(2014), among others, suggest that students react to thresholds targets more strongly than to
marginal incentives beyond the initial target. Broadly, a performance standard framework with
clear minimum thresholds targets combining minimum course loads and certain GPAs seems to
be desirable.
6.3 Further Research
Further research needs to be undertaken to identify potential equity effects of such a grant
design change, which requires assessing the potential adverse effects of performance-based in-
centives on college dropout for low-income students. Although the paper does not raise equity
concerns among grant applicants, with the available data it is not possible to determine whether
32

college entrants and continuing students were discouraged to enroll or to apply to the grant un-
der such performance-incentive scheme. Despite the clear effect on student performance, further
investigation on non-applicants’ college dropout effects is required to fully conclude that the new
setting is cost-effective.
33

References
Angrist, Joshua D. 1993. “The effect of veterans benefits on education and earnings.” ILR
Review, 46(4): 637–652.
Angrist, Joshua, Daniel Lang, and Philip Oreopoulos. 2009. “Incentives and services for
college achievement: Evidence from a randomized trial.” American Economic Journal: Applied
Economics, 1(1): 136–163.
Angrist, Joshua, Philip Oreopoulos, and Tyler Williams. 2014. “When opportunity
knocks, who answers? New evidence on college achievement awards.” Journal of Human Re-
sources, 49(3): 572–610.
Ariely, Dan, Uri Gneezy, George Loewenstein, and Nina Mazar. 2009. “Large stakes
and big mistakes.” The Review of Economic Studies, 76(2): 451–469.
Ariño, Antonio. 2011. ¿ Universidad sin clases? Condiciones de vida de los estudiantes uni-
versitarios en España (Eurostudent IV). Ministerio de Educación.
Barrow, Lisa, Lashawn Richburg-Hayes, Cecilia Elena Rouse, and Thomas Brock.
2014. “Paying for performance: The education impacts of a community college scholarship
program for low-income adults.” Journal of Labor Economics, 32(3): 563–599.
Baum, Sandy, Jennifer Ma, and Kathleen Payea. 2013. “Education Pays, 2010: The
Benefits of Higher Education for Individuals and Society. Trends in Higher Education Series.”
College Board Advocacy & Policy Center.
Bénabou, Roland, and Jean Tirole. 2002. “Self-confidence and personal motivation.” The
Quarterly Journal of Economics, 117(3): 871–915.
Berg, Gary A. 2016. Low-income students and the perpetuation of inequality: Higher education
in America. Routledge.
Bettinger, Eric. 2004. “How financial aid affects persistence.” In College choices: The economics
of where to go, when to go, and how to pay for it. 207–238. University of Chicago Press.
Bettinger, Eric P, Bridget Terry Long, Philip Oreopoulos, and Lisa Sanbonmatsu.
2012. “The role of application assistance and information in college decisions: Results from the
H&R Block FAFSA experiment.” The Quarterly Journal of Economics, 127(3): 1205–1242.
34

Bound, John, and Sarah Turner. 2002. “Going to war and going to college: Did World War
II and the GI Bill increase educational attainment for returning veterans?” Journal of labor
economics, 20(4): 784–815.
Bowen, William G, Martin A Kurzweil, Eugene M Tobin, and Susanne C Pichler.
2006. Equity and excellence in American higher education. Univ of Virginia Pr.
Brock, Thomas, and Lashawn Richburg-Hayes. 2006. “Paying for Persistence. Early Re-
sults of a Louisiana Scholarship Program for Low-Income Parents Attending Community Col-
lege.” MDRC.
Calonico, Sebastian, Matias D Cattaneo, and Rocio Titiunik. 2014. “Robust Nonpara-
metric Confidence Intervals for Regression-Discontinuity Designs.” Econometrica, 82(6): 2295–
2326.
Casey, M, J Cline, B Ost, and J Qureshi. 2015. “Academic probation, student performance
and strategic behavior.”
Castleman, Benjamin L. 2014. “The impact of partial and full merit scholarships on college
entry and success: Evidence from the Florida Bright Futures Scholarship program.” EdPoli-
cyWorks Working Paper Series No. 17.
Castleman, Benjamin L, and Bridget Terry Long. 2016. “Looking beyond enrollment: The
causal effect of need-based grants on college access, persistence, and graduation.” Journal of
Labor Economics, 34(4): 1023–1073.
Cha, Paulette, and Reshma Patel. 2010. “Rewarding progress, reducing debt: Early results
from the performance-based scholarship demonstration in Ohio.”
CJE. 2015. “Observatorio de la Emancipación del primer semestre de 2015 (no 10).” Madrid.
www. cje. org.
Cornwell, Christopher, David B Mustard, and Deepa J Sridhar. 2006. “The enrollment
effects of merit-based financial aid: Evidence from Georgia’s HOPE program.” Journal of
Labor Economics, 24(4): 761–786.
Cunha, Flavio, and James J Heckman. 2009. “The economics and psychology of inequality
and human development.” Journal of the European Economic Association, 7(2-3): 320–364.
35

Daly, Herman, and Victor Lavy. 2009. “The effects of high stakes high school achievement
awards: Evidence from a randomized trial.” The American Economic Review, 99(4): 1384–
1414.
de España, Banco, et al. 2017. “Encuesta Financiera de las Familias (EFF) 2014: métodos,
resultados y cambios desde 2011.” Boletín Económico, , (MAR).
DesJardins, Stephen L, and Brian P McCall. 2007. “The impact of the Gates Millen-
nium Scholars Program on selected outcomes of low-income minority students: A regression
discontinuity analysis.” Bill and Melinda Gates Foundation Working Paper.
Dynarski, Susan. 2008. “Building the stock of college-educated labor.” Journal of human re-
sources, 43(3): 576–610.
Dynarski, Susan, and Judith Scott-Clayton. 2013. “Financial aid policy: Lessons from
research.” National Bureau of Economic Research.
Dynarski, Susan M. 2003. “Does aid matter? Measuring the effect of student aid on college
attendance and completion.” American Economic Review, 93: 279–288.
Ellwood, David, Thomas J Kane, et al. 2000. “Who is getting a college education? Family
background and the growing gaps in enrollment.” Securing the future: Investing in children
from birth to college, 283–324.
Fack, Gabrielle, and Julien Grenet. 2015. “Improving college access and success for low-
income students: Evidence from a large need-based grant program.” American Economic
Journal: Applied Economics, 7(2): 1–34.
Fryer, Roland G. 2011. “Financial incentives and student achievement: Evidence from ran-
domized trials.” The Quarterly Journal of Economics, 126(4): 1755–1798.
Fryer, Roland G, Steven D Levitt, John List, and Sally Sadoff. 2012. “Enhancing the
efficacy of teacher incentives through loss aversion: A field experiment.” National Bureau of
Economic Research.
Gneezy, Uri, and Aldo Rustichini. 2000. “Pay enough or don’t pay at all.” The Quarterly
Journal of Economics, 115(3): 791–810.
36

Gneezy, Uri, Stephan Meier, and Pedro Rey-Biel. 2011. “When and why incentives (don’t)
work to modify behavior.” The Journal of Economic Perspectives, 25(4): 191–209.
Goldrick-Rab, Sara, Douglas N Harris, James Benson, and Robert Kelchen. 2012.
“Need-based financial aid and college persistence experimental evidence from Wisconsin.” In-
stitute for Research on Poverty Discussion Paper, , (1393-11).
Heckman, James J. 2006. “Skill formation and the economics of investing in disadvantaged
children.” Science, 312(5782): 1900–1902.
Hoxby, Caroline, Sarah Turner, et al. 2013. “Expanding college opportunities for high-
achieving, low income students.” Stanford Institute for Economic Policy Research Discussion
Paper, , (12-014).
Imbens, Guido, and Karthik Kalyanaraman. 2012. “Optimal bandwidth choice for the
regression discontinuity estimator.” The Review of economic studies, 79(3), pp. 933–959.
Imbens, Guido W, and Thomas Lemieux. 2008. “Regression discontinuity designs: A guide
to practice.” Journal of econometrics, 142(2): 615–635.
Kahneman, Daniel, and Amos Tversky. 1979. “Prospect theory: An analysis of decision
under risk.” Econometrica: Journal of the econometric society, 263–291.
Kane, Thomas J, and Cecilia Elena Rouse. 1995. “Labor-market returns to two-and four-
year college.” The American Economic Review, 85(3): 600–614.
Lee, David S, and Thomas Lemieux. 2010. “Regression discontinuity designs in economics.”
Journal of economic literature, 48(2): 281–355.
Levitt, Steven D, John A List, Susanne Neckermann, and Sally Sadoff. 2016. “The
behavioralist goes to school: Leveraging behavioral economics to improve educational perfor-
mance.” American Economic Journal: Economic Policy, 8(4): 183–219.
Lindo, Jason M, Nicholas J Sanders, and Philip Oreopoulos. 2010. “Ability, gender, and
performance standards: Evidence from academic probation.” American Economic Journal:
Applied Economics, 2(2): 95–117.
Lowe, Houston, and Anthony Cook. 2003. “Mind the gap: are students prepared for higher
education?” Journal of further and higher education, 27(1): 53–76.
37

Manski, Charles F. 1989. “Schooling as experimentation: a reappraisal of the postsecondary
dropout phenomenon.” Economics of Education review, 8(4): 305–312.
McCrary, Justin. 2008. “Manipulation of the running variable in the regression discontinuity
design: A density test.” Journal of econometrics, 142(2): 698–714.
Miller, Cynthia, Melissa Binder, Vanessa Harris, and Kate Krause. 2011. “Staying on
track: Early findings from a performance-based scholarship program at the University of New
Mexico.”
OECD. 2015. “Skills Strategy Diagnostic Report. Spain.” Editions OECD.
OECD. 2016. “Education at a glance 2016.” Editions OECD.
Pascarella, Ernest T, Christopher T Pierson, Gregory C Wolniak, and Patrick T
Terenzini. 2004. “First-generation college students: Additional evidence on college experiences
and outcomes.” The Journal of Higher Education, 75(3): 249–284.
Richburg-Hayes, Lashawn, Colleen Sommo, and Rashida Welbeck. 2011. “Promot-
ing Full-Time Attendance among Adults in Community College: Early Impacts from the
Performance-Based Scholarship Demonstration in New York.” MDRC.
Schudde, Lauren, and Judith Scott-Clayton. 2014. “Pell Grants as Performance-Based
Aid? An Examination of Satisfactory Academic Progress Requirements in the Nation’s Largest
Need-Based Aid Program. A CAPSEE Working Paper.” Center for Analysis of Postsecondary
Education and Employment.
Schudde, Lauren, and Judith Scott-Clayton. 2016. “Pell Grants as Performance-Based
Scholarships? An Examination of Satisfactory Academic Progress Requirements in the Na-
tion’s Largest Need-Based Aid Program.” Research in Higher Education, 57(8): 943–967.
Scott-Clayton, Judith. 2011. “On money and motivation a quasi-experimental analysis of
financial incentives for college achievement.” Journal of Human Resources, 46(3): 614–646.
Scott-Clayton, Judith, and Lauren Schudde. 2016. “Performance Standards in Need-Based
Student Aid.” National Bureau of Economic Research.
Sirin, Selcuk R. 2005. “Socioeconomic status and academic achievement: A meta-analytic
review of research.” Review of educational research, 75(3): 417–453.
38

Sjoquist, David L, and John V Winters. 2012. “Building the stock of college-educated labor
revisited.” Journal of Human Resources, 47(1): 270–285.
Stanley, Marcus. 2003. “College education and the midcentury GI Bills.” The Quarterly Journal
of Economics, 118(2): 671–708.
Terenzini, Patrick T, Leonard Springer, Patricia M Yaeger, Ernest T Pascarella,
and Amaury Nora. 1996. “First-generation college students: Characteristics, experiences,
and cognitive development.” Research in Higher education, 37(1): 1–22.
Tversky, Amos, and Daniel Kahneman. 1991. “Loss aversion in riskless choice: A reference-
dependent model.” The quarterly journal of economics, 106(4): 1039–1061.
39

Figure 1: Income eligibility thresholds for the different levels of the BCG grant.
CG RG FW
Not
Eligible
1
2
3
4
5
6
7
8
8
10
11
12Nu
mbe
r of H
ouse
hold
Mem
bers
0 10,000 20,000 30,000 40,000 50,000 60,000Family Taxable Income A Year Before The Application (Euros)
Notes: The figure depicts family income thresholds for different number of household members in the period 2010–2015. Thresholds areexactly the same amounts over the six-year period. FW refers to the fee waiver grant (Threshold 0), RG to Threshold 1 endowment, and CGto Threshold 2 allowance. Thresholds are expressed in 2015 euros.
Figure 2: Amount of annual cash allowance awarded to applicants with 4 family members, as afunction of their parents’ taxable income by period
Fee WaiverRG grantCG grant
010
0020
0030
0040
0050
00
Amou
nt of
Cash
Allow
ance
Award
ed (E
uros)
0 10,000 20,000 30,000 40,000 50,000 60,000 70,000
Family Taxable Income A Year Before The Application (Euros)
PERIOD I (2010-2012)
Fee WaiverRG grantCG grant
010
0020
0030
0040
0050
00
Amou
nt of
Cash
Allow
ance
Award
ed (E
uros)
0 10,000 20,000 30,000 40,000 50,000 60,000 70,000
Family Taxable Income A Year Before The Application (Euros)
PERIOD II (2013-2015)
Notes: The figure depicts family income thresholds for different number of household members in the period 2010–2015. Thresholds areexactly the same amounts over the six-year period. FW refers to the fee waiver grant (Threshold 0), RG to Threshold 1 endowment, and CGto Threshold 2 allowance.
‘
40

Figure 3: McCrary (2008) test for 2010–2015
RG grantCG grant
01
23
45
Dens
ity E
stima
te
-.2 -.15 -.1 -.05 0 .05 .1 .15 .2
Relative Income-Distance to Eligibility Cutoff
(Threshold 2)CG Grant Discontinuity
Fee WaiverRG grant
01
23
45
Dens
ity E
stima
te
-.2 -.15 -.1 -.05 0 .05 .1 .15 .2
Relative Income-Distance to Eligibility Cutoff
(Threshold 1)RG Grant Discontinuity
Notes: The figure shows the results of the test proposed by McCrary (2008). The weighted kernel density estimates are plotted, computedseparately for each of the sides of the income thresholds RG and CG. The RG treatment sample includes applicants whose household parentaltaxable income is within 50 percent of the eligibility thresholds between fee waiver and Residence Grant allowances. The CG treatmentsample includes applicants whose household parental taxable income is within 60 percent of the eligibility thresholds between ResidenceGrant and Compensate Grant allowances. Optimal bandwidth and bin size are computed by McCrary (2008) selection procedure. ‘RelativeIncome-Distance to Eligibility Cutoff” refers to the relative distance of household taxable income to the income eligibility thresholds.
Figure 4: Fraction of Awarded a Conditional Grant for RG and CG (2010–2015).
CG grant RG grant
0.2
.4.6
.81
Frac
tion A
warde
d a C
ondit
ional
Gran
t
-.06 -.04 -.02 0 .02 .04 .06
Relative Income-Distance to Eligibility Cutoff
(Threshold 2)CG Grant Discontinuity
RG grant Fee Waiver
0.2
.4.6
.81
Frac
tion A
warde
d a C
ondit
ional
Gran
t
-.06 -.04 -.02 0 .02 .04 .06
Relative Income-Distance to Eligibility Cutoff
(Threshold 1)RG Grant Discontinuity
Notes: The dots represent the average fraction of applicants who were awarded a conditional grant per interval of relative income-distance tothe eligibility thresholds. The solid lines are fitted values from a third-order polynomial approximation which is estimated separately on bothsides of the cutoffs. "Relative Income-Distance to Eligibility Cutoff" refers to the relative distance of household taxable income to the incomeeligibility thresholds. Red vertical lines identify the income eligibility thresholds.
41

Figure 5: Average Grant Amounts for RG and CG by period.
CG grant RG grant
010
0020
0030
0040
0050
00
-.4 -.3 -.2 -.1 0 .1 .2 .3 .4
Relative Income-Distance to Eligibility Cutoff
Period I (2010-2012) Period II (2013-2015)
Amou
nt of
Cash
Allow
ance
Award
ed (E
uros)
(Threshold 2)CG Discontinuity
RG grant Fee Waiver
010
0020
0030
0040
0050
00-.3 -.2 -.1 0 .1 .2 .3
Relative Income-Distance to Eligibility Cutoff
Period I (2010-2012) Period II (2013-2015)
Amou
nt of
Cash
Allow
ance
Award
ed (E
uros)
(Threshold 1)RG Discontinuity
Notes: The dots represent the average grant amount per interval of relative income-distance to the eligibility thresholds. The solid linesare fitted values from a third-order polynomial approximation which is estimated separately on both sides of the cutoffs. "Relative Income-Distance to Eligibility Cutoff" refers to the relative distance of household taxable income to the income eligibility thresholds. Red verticallines identify the income eligibility thresholds.
Figure 6: Average GPA (0-10) for RG and CG over Period I and II
5.45.8
6.26.6
7.0
Avera
ge G
PA (0
-10)
-.15 -.1 -.05 0 .05 .1 .15Relative Income-Distance to Eligibility Cutoff
PERI
OD I (
2010
-2012
)
(Threshold 2)CG Discontinuity
5.45.8
6.26.6
7.0
Avera
ge G
PA (0
-10)
-.1 -.075 -.05 -.025 0 .025 .05 .075 .1Relative Income-Distance to Eligibility Cutoff
(Threshold 1)RG Discontinuity
5.45.8
6.26.6
7.0
Avera
ge G
PA (0
-10)
-.15 -.1 -.05 0 .05 .1 .15Relative Income-Distance to Eligibility Cutoff
PERI
OD II
(2013
-2015
)
5.45.8
6.26.6
7.0
Avera
ge G
PA (0
-10)
-.1 -.075 -.05 -.025 0 .025 .05 .075 .1Relative Income-Distance to Eligibility Cutoff
Notes: The dots represent the average grant amount per interval of relative income-distance to the eligibility thresholds. The solid linesare fitted values from a third-order polynomial approximation which is estimated separately on both sides of the cutoffs. "Relative Income-Distance to Eligibility Cutoff" refers to the relative distance of household taxable income to the income eligibility thresholds. Red verticallines identify the income eligibility thresholds.
42
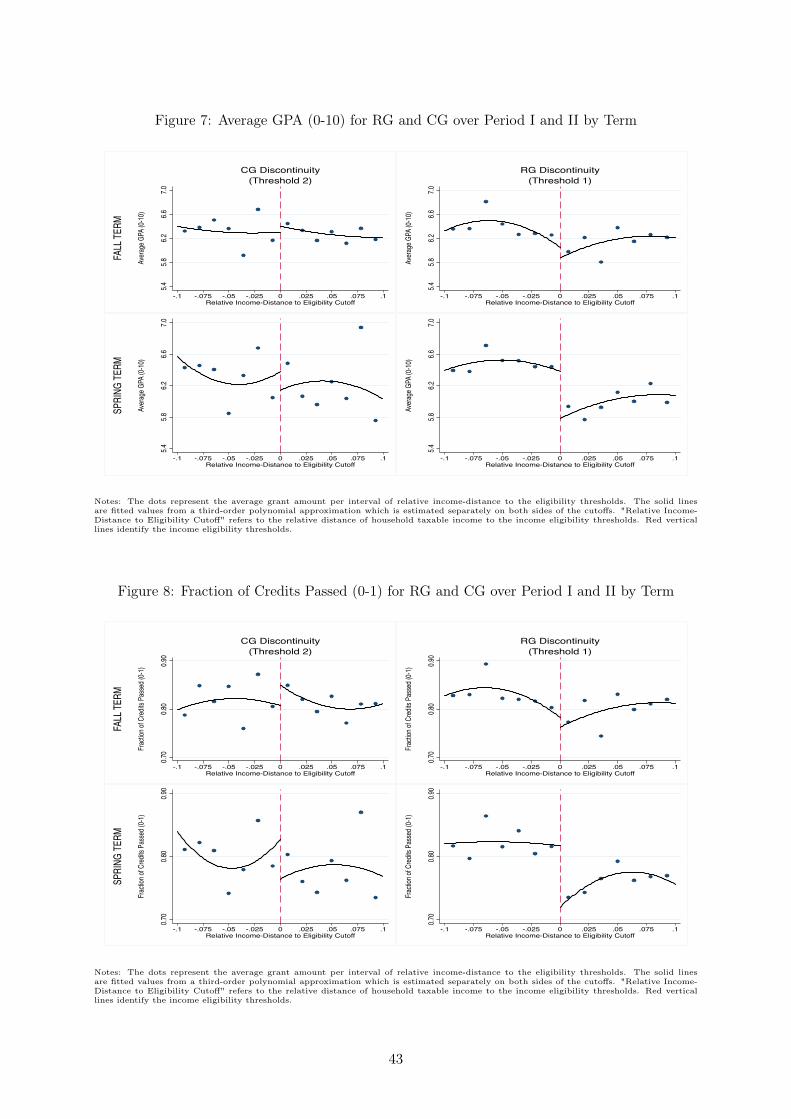
Figure 7: Average GPA (0-10) for RG and CG over Period I and II by Term
5.45.8
6.26.6
7.0
Avera
ge G
PA (0
-10)
-.1 -.075 -.05 -.025 0 .025 .05 .075 .1Relative Income-Distance to Eligibility Cutoff
FALL
TERM
(Threshold 2)CG Discontinuity
5.45.8
6.26.6
7.0
Avera
ge G
PA (0
-10)
-.1 -.075 -.05 -.025 0 .025 .05 .075 .1Relative Income-Distance to Eligibility Cutoff
(Threshold 1)RG Discontinuity
5.45.8
6.26.6
7.0
Avera
ge G
PA (0
-10)
-.1 -.075 -.05 -.025 0 .025 .05 .075 .1Relative Income-Distance to Eligibility Cutoff
SPRI
NG TE
RM
5.45.8
6.26.6
7.0
Avera
ge G
PA (0
-10)
-.1 -.075 -.05 -.025 0 .025 .05 .075 .1Relative Income-Distance to Eligibility Cutoff
Notes: The dots represent the average grant amount per interval of relative income-distance to the eligibility thresholds. The solid linesare fitted values from a third-order polynomial approximation which is estimated separately on both sides of the cutoffs. "Relative Income-Distance to Eligibility Cutoff" refers to the relative distance of household taxable income to the income eligibility thresholds. Red verticallines identify the income eligibility thresholds.
Figure 8: Fraction of Credits Passed (0-1) for RG and CG over Period I and II by Term
0.70
0.80
0.90
Frac
tion o
f Cred
its P
asse
d (0-1
)
-.1 -.075 -.05 -.025 0 .025 .05 .075 .1Relative Income-Distance to Eligibility Cutoff
FALL
TERM
(Threshold 2)CG Discontinuity
0.70
0.80
0.90
Frac
tion o
f Cred
its P
asse
d (0-1
)
-.1 -.075 -.05 -.025 0 .025 .05 .075 .1Relative Income-Distance to Eligibility Cutoff
(Threshold 1)RG Discontinuity
0.70
0.80
0.90
Frac
tion o
f Cred
its P
asse
d (0-1
)
-.1 -.075 -.05 -.025 0 .025 .05 .075 .1Relative Income-Distance to Eligibility Cutoff
SPRI
NG TE
RM
0.70
0.80
0.90
Frac
tion o
f Cred
its P
asse
d (0-1
)
-.1 -.075 -.05 -.025 0 .025 .05 .075 .1Relative Income-Distance to Eligibility Cutoff
Notes: The dots represent the average grant amount per interval of relative income-distance to the eligibility thresholds. The solid linesare fitted values from a third-order polynomial approximation which is estimated separately on both sides of the cutoffs. "Relative Income-Distance to Eligibility Cutoff" refers to the relative distance of household taxable income to the income eligibility thresholds. Red verticallines identify the income eligibility thresholds.
43

Figure 9: Mechanisms for Spring term at RG (2013–2015)
0.85
0.90
0.95
Frac
tion o
f exa
m tur
n-up (
0-1)
-.1 -.075 -.05 -.025 0 .025 .05 .075 .1Relative Income-Distance to Eligibility Cutoff
A. Final Exam Attendance Rate
5.86.2
6.67.0
7.4
Avg.
GPA o
f turne
d-up s
ubjec
ts (0-
10)
-.1 -.075 -.05 -.025 0 .025 .05 .075 .1Relative Income-Distance to Eligibility Cutoff
B. GPA on Final Exams Taken
5.45.8
6.26.6
Avera
ge G
PA (0
-10)
-.1 -.075 -.05 -.025 0 .025 .05 .075 .1Relative Income-Distance to Eligibility Cutoff
C. GPA on Mandatory Subjects
6.26.6
7.07.4
7.8
Avera
ge G
PA (0
-10)
-.1 -.075 -.05 -.025 0 .025 .05 .075 .1Relative Income-Distance to Eligibility Cutoff
D. GPA on Elective Subjects
Notes: The dots represent the average grant amount per interval of relative income-distance to the eligibility thresholds. The solid linesare fitted values from a third-order polynomial approximation which is estimated separately on both sides of the cutoffs. "Relative Income-Distance to Eligibility Cutoff" refers to the relative distance of household taxable income to the income eligibility thresholds. Red verticallines identify the income eligibility thresholds.
44

Table 1: Number of BCG applicants (2010–2015).
Undergraduate Undergraduate Graduate Others TotalOld system European system Programs
2010 % 28.78 68.12 3.09 0 100N 1,555 3,680 167 0 5,402
2011 % 12.99 82.24 4.76 0 100N 701 4,436 257 0 5,497
2012 % 6.11 86.96 6.07 0.86 100N 334 4,754 332 47 5,552
2013 % 2.34 90.39 7.03 0.24 100N 119 4,602 358 12 5,174
2014 % 0.81 90.26 8.89 0.18 100N 41 4,560 449 9 5,128
2015 % 0.04 88.84 10.97 0.17 100N 2 4,721 582 9 5,314
Total % 8.65 84.34 6.76 0.24 100N 2,745 26,755 2,145 77 31,722
Notes Total number of BCG applicants to UC3M over the period studied 2010–2015. Undergraduate students studied arethe addition of applicants in the old and new system. Undergraduate new system is typically four years degree program,harmonized with the European Union using ECTS credits.
45
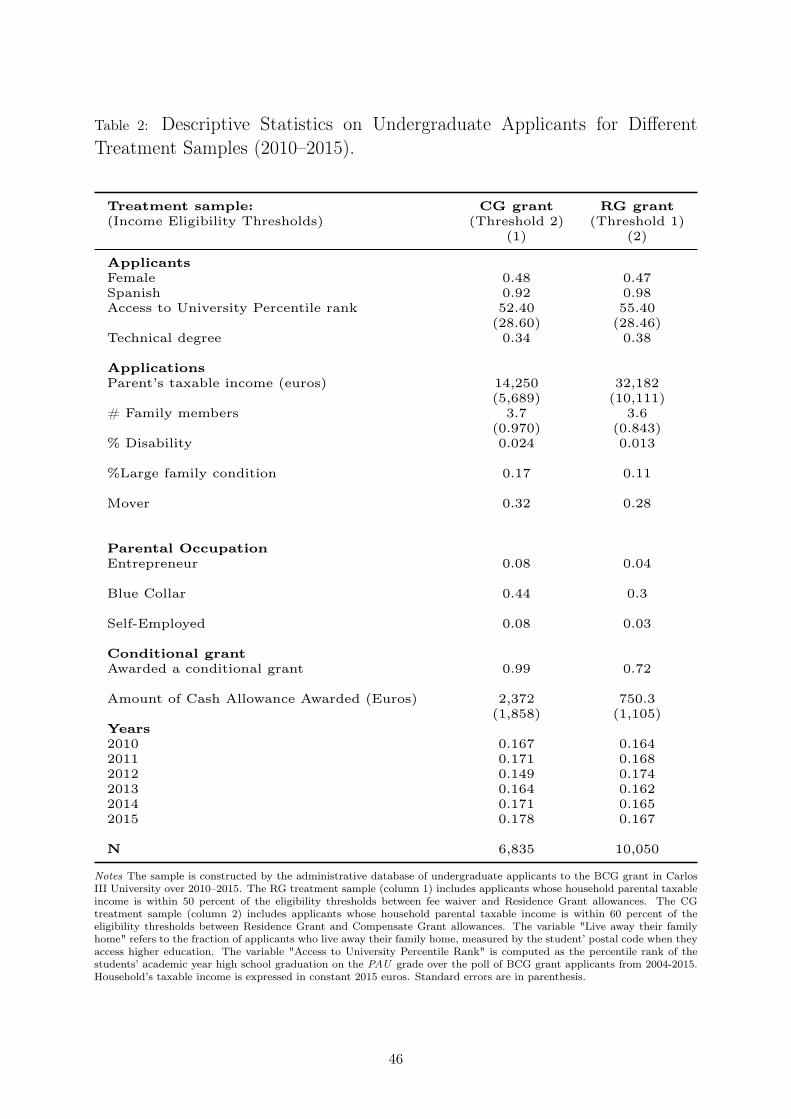
Table 2: Descriptive Statistics on Undergraduate Applicants for DifferentTreatment Samples (2010–2015).
Treatment sample: CG grant RG grant(Income Eligibility Thresholds) (Threshold 2) (Threshold 1)
(1) (2)
ApplicantsFemale 0.48 0.47Spanish 0.92 0.98Access to University Percentile rank 52.40 55.40
(28.60) (28.46)Technical degree 0.34 0.38
ApplicationsParent’s taxable income (euros) 14,250 32,182
(5,689) (10,111)# Family members 3.7 3.6
(0.970) (0.843)% Disability 0.024 0.013
%Large family condition 0.17 0.11
Mover 0.32 0.28
Parental OccupationEntrepreneur 0.08 0.04
Blue Collar 0.44 0.3
Self-Employed 0.08 0.03
Conditional grantAwarded a conditional grant 0.99 0.72
Amount of Cash Allowance Awarded (Euros) 2,372 750.3(1,858) (1,105)
Years2010 0.167 0.1642011 0.171 0.1682012 0.149 0.1742013 0.164 0.1622014 0.171 0.1652015 0.178 0.167
N 6,835 10,050
Notes The sample is constructed by the administrative database of undergraduate applicants to the BCG grant in CarlosIII University over 2010–2015. The RG treatment sample (column 1) includes applicants whose household parental taxableincome is within 50 percent of the eligibility thresholds between fee waiver and Residence Grant allowances. The CGtreatment sample (column 2) includes applicants whose household parental taxable income is within 60 percent of theeligibility thresholds between Residence Grant and Compensate Grant allowances. The variable "Live away their familyhome" refers to the fraction of applicants who live away their family home, measured by the student’ postal code when theyaccess higher education. The variable "Access to University Percentile Rank" is computed as the percentile rank of thestudents’ academic year high school graduation on the PAU grade over the poll of BCG grant applicants from 2004-2015.Household’s taxable income is expressed in constant 2015 euros. Standard errors are in parenthesis.
46

Table 3: Balance of Baseline Characteristics for Different Treatment Samples(2010–2015).
Treatment Sample: CG grant RG grant(Income Eligibility Thresholds) (Threshold 2) (Threshold 1)
Baseline Non-parametric Baseline Non-parametricmean Estimates mean Estimates(1) (2) (3) (4)
A. Each baseline charcteristic separatelly
Female 0.48 0.015 0.46 0.033(0.031) (0.026)[6,951] [11,965]
Spanish 0.94 -0.014 0.99 0.003(0.016) (0.006)[6,951] [11,965]
Access to University Percentile rank 53.41 -2.044 56.36 3.46**(1.858) (1.594)[6,951] [11,965]
STEM degree 0.35 0.004 0.41 -0.031(0.031) (0.025)[6,951] [11,965]
Households taxable income (euros) 17,282 -1.882 42,126 123.971(233.841) (308.907)[6,951] [11,965]
Disability 0.015 0.005 0.012 0.003(0.009) (0.006)[6,951] [11,965]
Large family condition 0.13 -0.000 0.13 0.007(0.024) (0.020)[6,951] [11,965]
#Family members 3.664 -0.004 3.651 -0.015(0.068) (0.047)[6,951] [11,965]
Live outside the family home 0.3 0.006 0.3 0.023(0.028) (0.023)[6,951] [11,965]
Entrepreneur Parent 0.073 0.007 0.04 -0.008(0.017) (0.009)[6,951] [11,965]
Blue Collar Parent 0.45 0.019 0.22 -0.041**(0.032) (0.020)[6,951] [11,965]
Self-Employed Parent 0.061 0.026 0.021 -0.003(0.017) (0.008)[6,951] [11,965]
# Awarded Grants 0.061 -0.107 0.37 -0.020(0.097) (0.061)[6,951] [11,965]
B. All baseline charcteristic jointlyX2-stat 5.92 19.75P-value 0.92 0.07
Notes The table shows the RDD non-parametric estimates for the different applicants’ observable variables. The treatmenteffect is estimated using a rectangular kernel and the bandwidth is computed as the optimal bandwidth proposed by Imbensand Kalyanaraman (2012) for each separated regression. Baseline mean refers to the average value of the observable variableabove the eligibility threshold. The RG treatment sample (column 1) includes applicants whose household parental taxableincome is within 50 percent of the eligibility thresholds between fee waiver and Residence Grant allowances. The CGtreatment sample (column 2) includes applicants whose household parental taxable income is within 60 percent of theeligibility thresholds between Residence Grant and Compensate Grant allowances. The variable "Live away their familyhome" refers to the fraction of applicants who live away their family home, measured by the student’ postal code when theyaccess higher education. The variable "Access to University Percentile Rank" is computed as the percentile rank of thestudents’ academic year high school graduation on the PAU grade over the poll of BCG grant applicants from 2004-2015.Household’s taxable income is expressed in constant 2015 euros. Robust standard errors are clustered at the student leveland displayed in parenthesis. Total number of observations are in squared brackets. * p < 0.10, ** p < 0.05, *** p < 0.01.
47

Table 4: Discontinuities in Allowance Amounts, GPA and Fraction of Credits Passed at DifferentIncome Eligibility Thresholds and Periods.
Treatment Sample: CG grant RG grant(Income Eligibility Thresholds) (Threshold 2) (Threshold 1)Period: Period I Period II Period I Period II(academic years) (2010-2012) (2013-2015) (2010-2012) (2013-2015)
(1) (2) (3) (4)
A. Average Allowance Amounts (euros)
Non-parametric 2,955*** 1,240*** 675*** 825***Estimates (147.657) (108.270) (98.806) (37.662)
[3,402] [3,549] [6,095] [5,87]
Baseline 1,481 1,415 25.89 10.81mean
B. Average GPA (0-10)Non-parametric -0.092 0.057 -0.031 0.455***Estimates (0.190) (0.157) (0.124) (0.144)
[3402] [3549] [6093] [5868]
Baseline 5.97 6.29 5.91 6.15mean
C. Fraction of Credits Passed (0-1)Non-parametric -0.017 0.016 0.006 0.059***Estimates (0.028) (0.026) (0.020) (0.021)
[3402] [3549] [6093] [5868]
Baseline 0.78 0.80 0.77 0.79mean
D. Average Accumulated GPA over two years (0-10)Non-parametric -0.017 -0.246 0.048 0.511**Estimates (0.197) (0.170) (0.124) (0.205)
[2,801] [1,851] [5,086] [3,178]
Baseline 6.00 6.29 5.96 6.14mean
E. Fraction of passed credits accumulated over two years (0-1)
Non-parametric -0.008 0.021 0.025 0.063***Estimates (0.024) (0.037) (0.019) (0.023)
[2,806] [1,86] [5,088] [3,184]
Baseline 0.85 0.86 0.85 0.85mean
Notes The table shows the RDD non-parametric estimates for the different applicants’ average grant allowance received(Panel A), average GPA (Panel B), fraction of credits passed (Panel C) and average accumulated GPA over two years (PanelD). The treatment effect is estimated using a rectangular kernel and the bandwidth is computed as the optimal bandwidthproposed by Imbens and Kalyanaraman (2012) for each separated regression. Baseline mean refers to the average grantamount above the eligibility threshold. The RG treatment sample (column 1) includes applicants whose household parentaltaxable income is within 50 percent of the eligibility thresholds between fee waiver and Residence Grant allowances. TheCG treatment sample (column 2) includes applicants whose household parental taxable income is within 60 percent of theeligibility thresholds between Residence Grant and Compensate Grant allowances. Robust standard errors are clusteredat the student level and displayed in parenthesis. Total number of observations are in squared brackets. * p < 0.10, **p < 0.05, *** p < 0.01.
48

Table 5: Discontinuities in Average GPA and Fraction of Credits Passed at Different IncomeEligibility Thresholds and Periods by Term.
Treatment Sample: CG grant RG grant(Income Eligibility Thresholds) (Threshold 2) (Threshold 1)Period: Period I Period II Period I Period II(academic years) (2010-2012) (2013-2015) (2010-2012) (2013-2015)
(1) (2) (3) (4)
A. Average GPA (0-1)A.1. Baseline Estimates
Non-parametric -0.092 0.057 -0.031 0.455***Estimates (0.190) (0.157) (0.124) (0.144)
[3,402] [3,549] [6,093] [5,868]
Baseline 5.97 6.29 5.91 6.15mean
A.2. First Term (Fall)
Non-parametric -0.024 0.020 0.030 0.282**Estimates (0.213) (0.159) (0.127) (0.136)
[3,299] [3,470] [5,904] [5,703]
Baseline 6.01 6.33 5.91 6.20mean
A.3. Second Term (Spring)
Non-parametric -0.187 0.050 -0.118 0.560***Estimates (0.222) (0.190) (0.138) (0.154)
[3,282] [3,400] [5,885] [5,600]
Baseline 6.02 6.33 5.99 6.19mean
B. Fraction of Credits Passed (0-1)B.1. Baseline Estimates
Non-parametric -0.017 0.016 0.006 0.059***Estimates (0.028) (0.026) (0.020) (0.021)
[3,402] [3,549] [6,093] [5,868]
Baseline 0.78 0.80 0.77 0.79mean
B.2. First Term (Fall)
Non-parametric -0.010 -0.003 0.018 0.037**Estimates (0.029) (0.023) (0.023) (0.018)
[3,299] [3,470] [5,904] [5,703]
Baseline 0.79 0.82 0.77 0.80mean
B.3. Second Term (Spring)
Non-parametric -0.019 0.029 -0.012 0.073***Estimates (0.031) (0.034) (0.020) (0.022)
[3,282] [3,400] [5,885] [5,600]
Baseline 0.78 0.80 0.78 0.79mean
Notes The table shows the RDD non-parametric estimates for the different applicants’ average grant allowance received(Panel A), average GPA (Panel B), fraction of credits passed (Panel C) and average accumulated GPA over two years (PanelD). The treatment effect is estimated using a rectangular kernel and the bandwidth is computed as the optimal bandwidthproposed by Imbens and Kalyanaraman (2012) for each separated regression. Baseline mean refers to the average grantamount above the eligibility threshold. The RG treatment sample (column 1) includes applicants whose household parentaltaxable income is within 50 percent of the eligibility thresholds between fee waiver and Residence Grant allowances. TheCG treatment sample (column 2) includes applicants whose household parental taxable income is within 60 percent of theeligibility thresholds between Residence Grant and Compensate Grant allowances. Robust standard errors are clusteredat the student level and displayed in parenthesis. Total number of observations are in squared brackets. * p < 0.10, **p < 0.05, *** p < 0.01.
49

Table 6: Discontinuities in Official Dropout from higher education at RG and CG grants byperiod.
Treatment Sample: CG grant RG grant(Income Eligibility Thresholds) (Threshold 2) (Threshold 1)Period: Period I Period II Period I Period II(academic years) (2010-2012) (2013-2015) (2010-2012) (2013-2015)
(1) (2) (3) (4)
Non-parametric 0.007 0.017 0.020 -0.014Estimates (0.010) (0.014) (0.015) (0.014)
[3,402] [3,549] [6,095] [5,87]
Baseline 0.019 0.02 0.03 0.03mean
Notes The table shows the RDD non-parametric estimates for the different applicants’ dropout from higher education. Thetreatment effect is estimated using a rectangular kernel and the bandwidth is computed as the optimal bandwidth proposedby Imbens and Kalyanaraman (2012) for each separated regression. Baseline mean refers to the average dropout above theeligibility threshold. The RG treatment sample (column 1) includes applicants whose household parental taxable income iswithin 50 percent of the eligibility thresholds between fee waiver and Residence Grant allowances. The CG treatment sample(column 2) includes applicants whose household parental taxable income is within 60 percent of the eligibility thresholdsbetween Residence Grant and Compensate Grant allowances. Robust standard errors are clustered at the student leveland displayed in parenthesis. The number of observations used in the non-parametric estimations are reported below thestandard errors. Total number of observations are in squared brackets. * p < 0.10, ** p < 0.05, *** p < 0.01.
50

Table 7: Discontinuities in Average GPA (0-10) at RG and CG grants by period and subgroupof applicants.
Treatment Sample: CG grant RG grant(Income Eligibility Thresholds) (Threshold 2) (Threshold 1)Period: Period I Period II Period I Period II(academic years) (2010-2012) (2013-2015) (2010-2012) (2013-2015)
(1) (2) (3) (4)
A. By Gender
A. By GenderFemale Non-parametric -0.038 0.078 0.063 0.250
Estimates (0.264) (0.184) (0.209) (0.166)[1,644] [1,689] [2,879] [2,735]
Baseline 6.32 6.69 6.27 6.56mean
Male Non-parametric -0.167 -0.021 -0.110 0.465**Estimates (0.262) (0.231) (0.202) (0.189)
[1,758] [1,859] [3,209] [3,132]
Baseline 5.64 5.94 5.58 5.83mean
B. PAU entrance exam percentile rank
Above Median Non-parametric -0.403 0.000 -0.179 0.523***Estimates (0.249) (0.220) (0.175) (0.180)
[1,838] [1,772] [3,433] [3,254]
Baseline 6.41 6.75 6.32 6.61mean
Below Median Non-parametric 0.344 0.129 0.104 0.295Estimates (0.335) (0.213) (0.217) (0.219)
[1,484] [1,722] [2,504] [2,516]
Baseline 5.44 5.76 5.35 5.53mean
C. By residence status
Living with parents Non-parametric 0.044 -0.018 -0.083 0.450***Estimates (0.273) (0.195) (0.142) (0.158)
[2,346] [2,388] [4,417] [4,11]
Baseline 5.90 6.19 5.81 6.03mean
Living outside the family home Non-parametric -0.385 0.160 -0.045 0.524*Estimates (0.258) (0.257) (0.272) (0.299)
[1,056] [1,16] [1,671] [1,757]
Baseline 6.15 6.52 6.15 6.45mean
Notes The table shows the RDD non-parametric estimates for the different applicants’ variables. The treatment effect isestimated using a rectangular kernel and the bandwidth is computed as the optimal bandwidth proposed by Imbens andKalyanaraman (2012) for each separated regression. Baseline mean refers to the average variable value above the eligibilitythreshold. The RG treatment sample (column 1) includes applicants whose household parental taxable income is within 50percent of the eligibility thresholds between fee waiver and Residence Grant allowances. The CG treatment sample (column2) includes applicants whose household parental taxable income is within 60 percent of the eligibility thresholds betweenResidence Grant and Compensate Grant allowances. The variable "Live away their family home" refers to the fractionof applicants who live away their family home, measured by the student’ postal code when they access higher education.Robust standard errors are clustered at the student level and displayed in parenthesis.Total number of observations are insquared brackets. * p < 0.10, ** p < 0.05, *** p < 0.01.
51

Table 8: Discontinuities in the Fraction of Credits Passed (0-1) at RG and CG grants by periodand subgroup of applicants.
Treatment Sample: CG grant RG grant(Income Eligibility Thresholds) (Threshold 2) (Threshold 1)Period: Period I Period II Period I Period II(academic years) (2010-2012) (2013-2015) (2010-2012) (2013-2015)
(1) (2) (3) (4)
A. By Gender
Female Non-parametric 0.016 0.008 0.019 0.039Estimates (0.038) (0.025) (0.026) (0.026)
[1,644] [1,689] [2,879] [2,735]
Baseline 0.830 0.856 0.818 0.841mean
Male Non-parametric -0.063 -0.006 -0.004 0.054**Estimates (0.044) (0.033) (0.033) (0.027)
[1,758] [1,859] [3,209] [3,132]
Baseline 0.730 0.760 0.726 0.744mean
B. PAU entrance exam percentile rank
Above Median Non-parametric -0.058* -0.019 -0.004 0.068***Estimates (0.033) (0.022) (0.019) (0.025)
[1,838] [1,772] [3,433] [3,254]
Baseline 0.825 0.862 0.817 0.845mean
Below Median Non-parametric 0.034 0.029 0.010 0.032Estimates (0.051) (0.036) (0.035) (0.031)
[1,484] [1,722] [2,504] [2,516]
Baseline 0.723 0.739 0.703 0.706mean
C. By residence status
Living with parents Non-parametric 0.004 -0.012 0.007 0.058**Estimates (0.036) (0.029) (0.025) (0.023)
[2,346] [2,388] [4,417] [4,110]
Baseline 0.771 0.793 0.757 0.773mean
Living outside the family home Non-parametric -0.063 0.044 -0.007 0.056Estimates (0.045) (0.037) (0.034) (0.039)
[1,056] [1,160] [1,671] [1,757]
Baseline 0.799 0.830 0.798 0.822mean
Notes The table shows the RDD non-parametric estimates for the different applicants’ variables. The treatment effect isestimated using a rectangular kernel and the bandwidth is computed as the optimal bandwidth proposed by Imbens andKalyanaraman (2012) for each separated regression. Baseline mean refers to the average variable value above the eligibilitythreshold. The RG treatment sample (column 1) includes applicants whose household parental taxable income is within 50percent of the eligibility thresholds between fee waiver and Residence Grant allowances. The CG treatment sample (column2) includes applicants whose household parental taxable income is within 60 percent of the eligibility thresholds betweenResidence Grant and Compensate Grant allowances. The variable "Live away their family home" refers to the fractionof applicants who live away their family home, measured by the student’ postal code when they access higher education.Robust standard errors are clustered at the student level and displayed in parenthesis.Total number of observations are insquared brackets. * p < 0.10, ** p < 0.05, *** p < 0.01.
52

Table 9: Discontinuities for the mechanisms variables at RG and CG grants by period.
Treatment Sample: CG grant RG grant(Income Eligibility Thresholds) (Threshold 2) (Threshold 1)Period: Period I Period II Period I Period II(academic years) (2010-2012) (2013-2015) (2010-2012) (2013-2015)
(1) (2) (3) (4)
A. Final exam attendance rate (0-1)
Non-parametric -0.001 0.006 0.006 0.032***Estimates (0.016) (0.012) (0.012) (0.010)
[3,402] [3,549] [6,093] [5,868]
Baseline 0.904 0.932 0.912 0.929mean
B. GPA on final exams taken (0-10)Non-parametric -0.040 0.074 -0.049 0.351***Estimates (0.156) (0.139) (0.106) (0.129)
[3,392] [3,541] [6,077] [5,859]
Baseline 6.512 6.699 6.396 6.552mean
C. Selection on courses (0-100)Non-parametric 0.097 0.639 2.117** 1.649*Estimates (1.152) (1.164) (1.026) (0.935)
[3,402] [3,549] [6,093] [5,868]
Baseline 51.31 50.95 52.48 52.69mean
D. GPA on Mandatory Subjects (0-10)Non-parametric -0.084 0.107 -0.050 0.462***Estimates (0.200) (0.172) (0.128) (0.152)
[3,397] [3,548] [6,089] [5,865]
Baseline 5.908 6.210 5.868 6.103mean
E. GPA on Elective Subjects (0-10)Non-parametric -0.689** -0.056 0.136 0.553Estimates (0.326) (0.288) (0.205) (0.385)
[1,298] [1,288] [2,134] [1,924]
Baseline 6.954 7.370 6.802 7.236mean
Notes The table shows the RDD non-parametric estimates for the different applicants’ Average GPA. The treatment effectis estimated using a rectangular kernel and the bandwidth is computed as the optimal bandwidth proposed by Imbens andKalyanaraman (2012) for each separated regression. Baseline mean refers to the average GPA value above the eligibilitythreshold. The RG treatment sample (column 1) includes applicants whose household parental taxable income is within50 percent of the eligibility thresholds between fee waiver and Residence Grant allowances. The CG treatment sample(column 2) includes applicants whose household parental taxable income is within 60 percent of the eligibility thresholdsbetween Residence Grant and Compensate Grant allowances. Robust standard errors are clustered at the student level anddisplayed in parenthesis. Total number of observations are in squared brackets. * p < 0.10, ** p < 0.05, *** p < 0.01.
53

Table 10: Discontinuities in Degree Completion in Graduation Year at RG and CG grants byperiod.
Treatment Sample: CG grant RG grant(Income Eligibility Thresholds) (Threshold 2) (Threshold 1)Period: Period I Period II Period I Period II(academic years) (2010-2012) (2013-2015) (2010-2012) (2013-2015)
(1) (2) (3) (4)
Non-parametric -0.1879 0.2251* -0.1140 0.2713*Estimates (0.181) (0.136) (0.164) (0.155)
[548] [640] [915] [1,065]
Baselinemean 0.395 0.394 0.421 0.367
Notes The table shows the RDD non-parametric estimates for the different applicants’ degree completion. The treatmenteffect is estimated using a rectangular kernel and the bandwidth is computed as the optimal bandwidth proposed by Imbensand Kalyanaraman (2012) for each separated regression. Baseline mean refers to the average GPA value above the eligibilitythreshold. The RG treatment sample (column 1) includes applicants whose household parental taxable income is within50 percent of the eligibility thresholds between fee waiver and Residence Grant allowances. The CG treatment sample(column 2) includes applicants whose household parental taxable income is within 60 percent of the eligibility thresholdsbetween Residence Grant and Compensate Grant allowances. Robust standard errors are clustered at the student level anddisplayed in parenthesis. Total number of observations are in squared brackets. * p < 0.10, ** p < 0.05, *** p < 0.01.
54

Online Appendix to:
“The role of performance incentives in need-based
grants for higher education: Evidence from the
Spanish Becas”
(not intended for publication)
José Montalbán
Paris School of Economics
October 2017
The online appendix supplements the paper “The role of performance incentives in need-based
grants for higher education: Evidence from the Spanish Becas”. It presents details on low-income
students’ performance in higher education (section A), validity of the research design (section B),
the discontinuities in BCG grants awarded to applicants (section C), the robustness of baseline
estimates (section D), the comparability between Period I and Period II (section E), and the
minimum academic requirements to being eligible for a BCG grant (section F).
55

A Low-Income Students’ Performance in Higher Education
The analysis of the BCG grant is performed on low-income high school graduates enrolled
in Carlos III University who applied to a BCG grant to start or to continue undergraduate
college studies. To compare Carlos III students with the rest of collegian enrolled in the Spanish
public universities, and more precisely, with the population of low-income students enrolled in
higher education, I use data on student attainment in higher education provided by the Ministry
of Education for the academic year 2014/2015. Dropout rates were computed for the cohort of
students who enrolled Spanish higher education in the academic year 2010/2011 (which expected
graduation from undergraduate program was 2013/2014 or 2014/2015).
The summary statistics presented in Table A1 show substantial differences between Carlos
III undergraduate students and their peers enrolled in the rest of the Spanish public higher edu-
cation institutions. Students enrolled in Carlos III University scored higher in the standardized
university access exam, reported higher graduation rates, passed a higher number of credits,
and presented lower dropout rates. In contrast, BCG grant recipients in Carlos III are highly
comparable to BCG grant recipients in Spain. These students reported similar GPAs, number
of credits passed (over the total credits enrolled and the final exams taken), and time to gradu-
ation. The sample of grant applicants is reasonably representative of the general population of
low-income students in Spain. These students can be considered as comparable to the typical
targeted population of most large-scale need-based grant programs around the world, e.g students
graduated from high school and admitted to college. The results cannot be directly generalized
to the population of low-income students who fail in high school graduation and might respond
differently to financial aid.
B Validity of the Research Design: McCrary (2008) Test
In order to perform a formal investigation of the validity of the research design, I test the
non-random sorting of applicants at the income eligibility thresholds. I use the test proposed
in McCrary (2008), which is a test based on an estimator for the discontinuity in the density
function of the running variable at the cutoff, checking the non-systematic manipulation of
household parental income around the thresholds.
The results of the McCrary (2008) test for Fee Waiver (FW) and Displacement and Other
Needs Grant (DG) are presented in Table B1. McCrary test statistics confirm that the null
56

hypothesis of no density jump at the eligibility cutoffs cannot be rejected for these income
eligibility cutoffs. Table B2 shows the results of McCrary (2008) test developed for all the
different treatment samples used in this paper. Regardless of the treatment sample considered,
the test statistic fails to reject the null hypothesis that the log difference in height around the
discontinuity points is equal to zero. In addition, Figure B1 displays the fraction of re-applicants
and McCrary (2008) test for this sub-population of students. Applicants’ who were awarded a
grant in a given year might be more likely to reapply the next year, especially those below the
cutoff of the RG grant. If it is the case, it may suggest that the impacts would be driven by this
group of students, with no density break for applicants at the cutoffs but so for re-applicants.
A robustness check testing the discontinuity in the density of re-applicants rejects this concern.
Overall, these tests suggest that the probability of submitting an application does not change
discontinuously at the income eligibility threshold, and thus applicants immediately above the
cutoff are not able to manipulate their household parental income to being eligible for higher
levels of grant.
C Discontinuities in Awarded Grants
This section test the different discontinuities of average awarded grants at the different income
eligibility thresholds. Table C1 presents the average allowance amounts (in constant euros of
2015) at RG and CG grants for the two periods studied and all the treatment samples used
in the paper. This table shows that all the treatment groups present strong and statistically
significant increments in average cash amount awarded at the discontinuity thresholds, except
for students living with their parents when they enter university (non-movers) for RG grant at
Period I. These subgroup of students were not eligible for financial aid at this specific threshold
and period. Table C2 shows the average cash amount at RG and CG grants for being eligible
for a grant over two academic years. Conditional on applying for a grant at time t with a
certain household income, it is possible to compute the average allowance amounts awarded over
two years. This method would provide no sample selection concerns. However, the first stage
decrease over time due to the variability of applicants’ application status and household income
over years. The discontinuities in the actual amount of conditional grant awarded to applicants
are about 300 euros for RG grant on both periods, and similar estimates for CG grant but not
statistically significant.
57

D Robustness Checks
In this section, I perform a number of tests in order to check the robustness of baseline
estimates. Specifically, I i) investigate the sensitivity of estimates to the choice of bandwidth; ii)
perform the local polynomial regression with robust bias-corrected confidence intervals proposed
by Calonico, Cattaneo and Titiunik (2014); iii) run the baseline regressions adding student
individual predetermined variables and year fixed effects; iv) test for jumps at non-discontinuity
points by running placebo regressions.
D.1 Sensitivity to the Choice of Bandwidth
I analyze the sensitivity of the non-parametric estimates to the choice of the bandwidth and
that changing the bandwidth size to half or twice the value of the optimal bandwidth proposed
by Imbens and Kalyanaraman (2012). Panel B in Table D1 shows that results are very similar
to those obtained in the baseline estimates, but larger when using half the optimal bandwidth
than double.
D.2 Local Polynomial Regression with Robust Bias-Corrected Confidence
Intervals
To test for the variability of the results under local polynomial regression and a different
computation for confidence intervals (robust bias-corrected) proposed by Calonico, Cattaneo
and Titiunik (2014). Panel C in Table D1 presents non-parametric estimates very close to the
baseline.
D.3 Individual Control Variables and Year Fixed Effects
I investigate the volatility of baseline results when adding individual predetermined control
variables (such as PAU percentile rank, gender, or being enrolled in a STEM degree) and year
fixed effects that capture time trends in the outcome variable to the main regression. Panel D
in Table D1 shows that results are statistically significant at the 5 percent confidence level, but
magnitudes is smaller than baseline estimates and similar to changing the bandwidth size to half
of the optimal bandwidth proposed by Imbens and Kalyanaraman (2012).
58
D.4 Testing for Jumps at Non-Discontinuity Points
To test for jumps at non-discontinuity points, I run a placebo regression in which the income
thresholds are artificially set at the midpoint between the actual eligibility thresholds by period.
Since these midpoint do not correspond to any change in applicants’ grant eligibility status, I
should expect to find no significant jumps in average GPA. Panel E in Table D1 presents that
the points estimates are close to zero and non-significant in all specifications.
Overall, baseline results are robust to all different specifications and vary from an effect of
0.27 to 0.5 points, which corresponds to about 4.5 to 8.3 percent with respect to the baseline
mean. Although the magnitude of estimates varies across specifications due to the limited sample
size, the direction of the effects hold over the different specifications, indicating a robust impact
of grant eligibility on student performance when the academic standards are strong. In addition,
the null effect of the grant under the other different thresholds (CG and fee waiver grant) and
periods is also robust and persistent for every sensitivity check performed.
D.5 Fee Waiver Grant (FW, Threshold 0)
The fee waiver is the first type of grant that students may receive, and covers the tuition fees
but does not award with amounts of cash. This eligibility threshold (FW or Threshold 0) is very
close to the eligibility cutoff the the RG grant. It makes difficult to construct two treatment
samples between RG grant and fee waiver which do not overlap. The discontinuity induced by
the tuition fee eligibility cutoff was ignored in the analysis, in order to focus on the grants types
where students were awarded with cash amounts (in RG and CG grant).
As a robustness check, I have conducted a separate analysis of the treatment effect of being
eligible for only tuition fee. Table D2 reports the discontinuities in average cash amount awarded
and average GPA. This table shows no evidence of statistically significant effects on awarded cash
amounts and average GPA at this threshold.
D.6 Displacement and Other Needs Grant (DG, Threshold 3)
The heterogeneous effects (section 5) shows that the positive effects of being eligible for
760 euros on average relative to only fee waiver is only driven by non-movers. Those students
received zero cash allowance in Period I, but 410 euros on average in Period II, while the effect
is only statistically significant in Period II. Effects might be derived only by cash allowance
59

award with no influence of performance-based incentives. In order to test the policy’s efficiency,
a deeper inquiry is needed to determine whether impacts are caused by the cash endowment,
performance-incentive components, or the complementarity of both. As a robustness check, I use
the DG grant for non-movers as comparison group for RG non-movers at Period I, since both
thresholds are very close to each other. This analysis is useful to investigate the role of grant’s
performance-based incentive components.
The key advantages of using the DG cutoff are twofold. First, the DG grant is located 15
percent of the relative distance below the RG threshold, which mitigates concerns regarding
the comparability of students in the vicinity of these two cutoffs.36 The sample of non-movers
receives their first cash award at DG in Period I, which makes the comparable group similar
to non-movers at RG in Period II. Second, the discontinuities in average cash grant amounts
are very similar (543 vs. 410 euros). Hence, using non-movers in Period I for DG grant as
a robustness check for RG non-movers in Period II is convenient due to the fact that it offers
an scenario where entitlement to the grant, cash allowances and sample are comparable, but
performance-incentives are different in the two periods.
Table D2 presents that the average discontinuity in cash allowance at DG in Period I
is 543 euros for non-movers, and cash endowments at RG in Period II is 410 euros for non-
movers. However, the null hypothesis of zero effect of being eligible for the DG grant on non-
movers student performance cannot be rejected. Results are robust to different treatment sample
sizes, regarding the predetermined characteristics of applicants (PAU percentile rank, gender,
STEM degree, etc), year fixed effects, to set the optimal bandwidth proposed by Imbens and
Kalyanaraman (2012) as half and twice of its value, and to perform the local polynomial regression
with robust bias-corrected confidence intervals proposed by Calonico, Cattaneo and Titiunik
(2014).40
This suggests that performance-based incentive components seems to play a crucial role on
enhancing student achievement. Nevertheless, performance standards alone do not seem to be
enough to improve student outcomes, since monetary incentives appear to be also crucial (there
is no grant effect on fee waiver grant). The results point out to a complementarity between
certain cash allowance and strong performance-based incentives as drivers of the effect of the
grant on student performance.40Results available upon request.
60

D.7 Differential effects on 2012
This section test for specific effects of the grant in 2012. The paper focus on the results on
two periods, Period I and Period II. While academic incentives in Period II were homogeneous
throughout the three academic years, Period II reported a change in 2012. Students had to
passed 60 (80) percent of the credits attempted if the student was enrolled in STEM (non-STEM)
degrees in 2010 and 2011. In 2012 the requirements rose to 65 (90) percent for students enrolled
in STEM (non-STEM) degrees. Table D3 presents the results of non-parametric estimates of
being eligible for a need-based grant in this academic year. The null hypothesis of a null effect
of the grant on student performance (average GPA and fraction of credits passed) and dropout
cannot be rejected.
The results suggest that a single increase in the fraction of credits passed does not affect
student performance. This points toward the direction of this paper’s conclusion concerning
the design of academic incentives. A performance standard framework with clear minimum
thresholds targets combining minimum course loads and certain GPAs seems to be desirable in
terms of the cost-effectiveness of the policy.
D.8 Student performance by academic term
The BCG’s application process is described in section 2.2. Students are already enrolled at
the higher education institution when they apply, and the vast majority of grant decisions are
not notified before the end of the first term of the academic year. In addition, denied grants are
disclose on average at the same time for both Period I and II, but conceded grants were divulged
in February-March on average for Period I, and in June for Period II. This unique process may
create an unclear view of when the grant incentives are created to improve student performance,
due to the fact that students faced a different timing of acceptance/rejection disclosure. It is
crucial to notice that student disclosure time is not a continuous variable, but rather discrete,
since groups of students were receiving notification at the same time. An ideal way to test whether
the effect of the grant on student performance was more powerful after the student received the
notification is to compare the effect on students who received it before the term exams versus
those who were informed after. Unfortunately, this sample split creates endogenous selection
at the eligibility cutoffs, since denied grants were disclosed before accepted grants on average,
arising to a break in the density at income thresholds.
61

A way to test this conjecture is to look at the impact of BCG grant on student performance
by academic term (Fall and Spring). Students had a higher probability to get an answer on the
second rather than on the first term. Then, it is reasonable to believe that student reaction to the
allowance would be stronger for Spring than Fall grades. Table D4 presents the non-parametric
estimates by academic term, confirming this hypothesis. The size of grant effects are larger for
the second than first term when testing the average GPA, and results for fraction of credits
passed were not statistically significant for the Fall term, while in the Spring term were larger
than the baseline results.
E Comparability between Period I and Period II
An important concern corresponds to the degree of comparability between applicants for a
need-based grant in Period I and Period II. I test whether the students’ observable characteristics
of the comparison group at RG and CG grant in Period I are similar to applicants in Period II. I
test the comparability of these students performing a t-test of the difference in observable char-
acteristics between period. Table E1 presents the results of this analysis. The null hypothesis of
equality of the observable characteristics between periods cannot be rejected for three quarters
of the variables at RG grant, and for more than half in CG grant.
F Academic requirements for BCG grant
This section summarizes the academic standards for being eligible for a BCG grant over the
six-year period studied (2010–2015). In order to be eligible for a need-based grant, students must
have complained with a minimum fraction of credits passed and average GPA the year before
application. Table F1 shows a summary of the different performance standards required by
year, degree and cohort. It is remarkable the increase in the fraction of credits passed required
in 2012, and the posterior change of the entire framework of academic incentives in 2013, which
incorporates the average GPA of the year before application plus a variable component which
depends on performance and family income the year of grant application (the variable compo-
nent formula is described in equation 11). Figure displays a graphical summary of academic
requirements for non-freshmen students. Academic incentives varied between the two periods:
• Period I (2010–2012): incentives were based on the fraction of credits passed the year
before application.
62

• Period II (2013–2015): academic standards were based on the fraction of credits passed the
year before application, the average GPA the year before application and in the application
year (through the grant’s individual variable component).
63

Table Appendix A1: BCG grant academic requirements.
All BCG Grant Non BCG GrantStudents Recipients Recipients
Spain Carlos III Diff. Spain Carlos III Diff. Spain Carlos III Diff.(1) (2) (2)-(1) (3) (4) (4)-(3) (5) (6) (6)-(5)
Avg. PAU score 8,5 10,29 1,79 8,67 10,28 1,61 8,76 10,51 1,75
Avg. GPA of enrolled students 7,24 6,95 -0,29 7,3 7 -0,3 7,2 6,9 -0,3
Number of credits passed 92,8 90,2 -2,6 88 88,6 0,6 74,9 82,3 7,4over total enrolled
Number of credits passed 94,9 93,3 -1,6 92,1 93 0,9 84,9 89,7 4,8over total final exam taken
Avg. time to graduation 4,4 4,8 0,4 4,4 4,8 0,4 4,5 4,8 0,3(4-year program)
Graduation rate 15,9 20,3 4,4(graduates in 2014/ total enrolled)
Dropout rate (cohort 2010/2011) 28,42 24,7 -3,72 25,6 28,8 3,2 29,1 23,7 -5,4
# Enrolled 1,187,976 15,394 326,693 2,879 861,283 12,515
Notes
64

Table Appendix B1: McCrary (2008) Test for Manipulation of the Forcing Variable for DifferentTreatment Samples in FW and DG grant.
Treatment sample Fee Waiver Grant (FW)(Income Eligibility Thresholds) (Threshold 0)
Log Difference Z-stat Bandwidth Binin frequency bins size
(1) (2) (3) (4)
A. Total samplePeriod I .175 .907 .047 .004
(2010–2012) (.193)
Period II .228 1.47 .061 .004(2013–2015) ( .15)
Treatment sample Displacement and Other Needs Grant (DG)(Income Eligibility Thresholds) (Threshold 3)
Log Difference Z-stat Bandwidth Binin frequency bins size
(5) (6) (7) (8)
A. Total samplePeriod I -.02 .23 .09 .004
(2010-2012) (.12)
Period II .09 .62 .06 .004(2013-2015) (.15)
B. By residence condition
Living with parents Period I -.12 .69 .06 .005(2010-2012) (.17)
Period II .26 1.49 .06 .005(2013-2015) (.17)
Living outside the family home Period I -.07 .23 .05 .008(2010-2012) (.29)
Period II -.42 1.43 .06 .007(2013-2015) (.29)
Notes The McCrary test is performed separately for each treatment sample. The FW treatment sample includes applicantswhose household parental taxable income is within 30 percent of the eligibility thresholds. The DG treatment sampleincludes applicants whose household parental taxable income is within 30 percent of the eligibility thresholds. The variable"Live away their family home" refers to the fraction of applicants who live away their family home, measured by the student’postal code when they access higher education. Standard deviations are in parenthesis.p < 0.10, ** p < 0.05, *** p < 0.01.
65

Figure Appendix B1: Fraction of re-applicants and McCrary (2008) test for re-applicants density.
0.00
0.20
0.40
0.60
0.80
1.00
Frac
tion o
f reap
plica
nts (0
-1)
-.3 -.2 -.1 0 .1 .2 .3Relative Income-Distance to Eligibility Cutoff
RG G
rant D
iscon
tinuit
y
Frac. of Re-applicants
01
23
45
Dens
ity E
stima
te
-.2 -.1 0 .1 .2
Relative Income-Distance to Eligibility Cutoff
McCrary (2008) Test
0.00
0.20
0.40
0.60
0.80
1.00
Frac
tion o
f reap
plica
nts (0
-1)
-.3 -.2 -.1 0 .1 .2 .3Relative Income-Distance to Eligibility Cutoff
CG G
rant D
iscon
tinuit
y
01
23
45
Dens
ity E
stima
te
-.2 -.1 0 .1 .2
Relative Income-Distance to Eligibility Cutoff
Notes: The dots represent the average fraction of re-applicants and density estimates of McCrary (2008) test per interval of relative income-distance to the eligibility thresholds. The solid lines are fitted values from a second-order polynomial approximation which is estimatedseparately on both sides of the cutoffs. "Relative Income-Distance to Eligibility Cutoff" refers to the relative distance of household taxableincome to the income eligibility thresholds. Red vertical lines identify the income eligibility thresholds.
66

Table Appendix B2: McCrary (2008) Test for Manipulation of the Forcing Variable for DifferentTreatment subamples.
Treatment sample CG grant RG grant(Income Eligibility Thresholds) (Threshold 2) (Threshold 1)
Log Difference Z-stat Bandwidth Bin Log Difference Z-stat Bandwidth Binin frequency bins size in frequency bins size
(1) (2) (3) (4) (5) (6) (7) (8)
A. By PeriodTotal Applicants Period I .13 .60 .06 .006 -.079 .647 .10 .004
(2010-2012) (.22) (.12)
Total Applicants Period II .18 .79 .07 .006 -.107 .80 .10 .004(2013-2015) (.23) (.13)
B. By Gender
Females Period I -.14 .33 .05 .009 -.06 .34 .096 .006(2010-2012) (.43) (.17)
Period II .29 .81 .05 .009 .004 .02 .072 .006(2013-2015) (.36) (.23)
Males Period I .16 .61 .07 .009 -.11 .55 .074 .006(2010-2012) (.25) (.2)
Period II .18 .49 .06 .008 -.03 .16 .10 .006(2013-2015) (.36) (.18)
C. By PAU Percentile Rank
Above Median Period I -.05 .19 .07 .008 -.14 .75 .07 .005(2010-2012) (.27) (.19)
Period II .05 .17 .07 .008 -.096 .48 .08 .005(2013-2015) (.28) (.19)
Below Median Period I .28 .83 .07 .01 -.016 .07 .06 .007(2010-2012) (.34) (.24)
Period II .20 .47 .06 .009 -.016 .07 .08 .007(2013-2015) (.43) (.22)
D. By residence condition
Living with parents Period I .12 .45 .07 .007 .075 .52 .09 .005(2010-2012) (.26) (.14)
Period II -.11 .39 .07 .007 .054 .32 .09 .005(2013-2015) (.29) (.16)
Living outside the family home Period I .14 .38 .07 .012 -.65 1.76 .059 .008(2010-2012) (.38) (.37)
Period II .62 1.87 .09 .01 -.46 1.56 .078 .008(2013-2015) (.33) (.29)
Notes The McCrary test is performed separately for each treatment sample. The RG treatment sample includes applicantswhose household parental taxable income is within 50 percent of the eligibility thresholds between fee waiver and ResidenceGrant allowances. The CG treatment sample includes applicants whose household parental taxable income is within 60percent of the eligibility thresholds between Residence Grant and Compensate Grant allowances. The variable "Live awaytheir family home" refers to the fraction of applicants who live away their family home, measured by the student’ postalcode when they access higher education. The variable "Access to University Percentile Rank" is computed as the percentilerank of the students’ academic year high school graduation on the PAU grade over the poll of BCG grant applicants from2004-2015.. Standard deviations are in parenthesis.p < 0.10, ** p < 0.05, *** p < 0.01.
67

Table Appendix C1: Average Allowance Amounts (in euros) at RG and CG grants by periodand subgroup sample.
Treatment Sample: CG grant RG grant(Income Eligibility Thresholds) (Threshold 2) (Threshold 1)Period: Period I Period II Period I Period II(academic years) (2010-2012) (2013-2015) (2010-2012) (2013-2015)
(1) (2) (3) (4)
A. Total Applicants
Non-parametric 2,955*** 1,240*** 675*** 825***Estimates (147.657) (108.270) (98.806) (37.662)
[3,402] [3,549] [6,095] [5,87]
Baseline 1,481 1,415 25.89 10.81mean
B. By Gender
Female Non-parametric 3,231*** 1,339*** 878*** 946***Estimates (222.727) (158.675) (140.786) (57.538)
[1,644] [1,689] [2,881] [2,735]
Baseline 1,604 1,561 21.59 20.70mean
Male Non-parametric 2,715*** 1,103*** 472*** 696***Estimates (213.360) (178.747) (131.423) (54.368)
[1,758] [1,859] [3,209] [3,134]
Baseline 1,364 1,287 29.75 2.88mean
C. PAU entrance exam percentile rank
Above Median Non-parametric 2,773*** 1,372*** 895*** 1,029***Estimates (254.429) (160.635) (152.250) (73.145)
[1,838] [1,772] [3,435] [3,256]
Baseline 1,728 1,741 33.19 12.90mean
Below Median Non-parametric 2,985*** 1,124*** 454*** 607***Estimates (205.623) (168.346) (125.301) (71.740)
[1,484] [1,722] [2,504] [2,516]
Baseline 1,149 1,045 16.69 8.348mean
D. By residence status
Living with parents Non-parametric 2,984*** 1,235*** -13.324 445***Estimates (141.017) (115.897) (62.261) (19.519)
[2,346] [2,388] [4,419] [4,110]
Baseline 818.2 1,019 16.70 2.652mean
Living outside the family home Non-parametric 2,599*** 1,320*** 2,858*** 1,673***Estimates (227.727) (257.033) (187.492) (87.784)
[1,056] [1,160] [1,671] [1,759]
Baseline 3,123 2,281 47.47 30.42mean
Notes The table shows the RDD non-parametric estimates for the average allowance amount for different samples. Thetreatment effect is estimated using a rectangular kernel and the bandwidth is computed as the optimal bandwidth proposedby Imbens and Kalyanaraman (2012) for each separated regression. Baseline mean refers to the average variable valueabove the eligibility threshold. The RG treatment sample (column 1) includes applicants whose household parental taxableincome is within 50 percent of the eligibility thresholds between fee waiver and Residence Grant allowances. The CGtreatment sample (column 2) includes applicants whose household parental taxable income is within 60 percent of theeligibility thresholds between Residence Grant and Compensate Grant allowances. The variable "Live away their familyhome" refers to the fraction of applicants who live away their family home, measured by the student’ postal code whenthey access higher education. Robust standard errors are clustered at the student level and displayed in parenthesis. Thenumber of observations used in the non-parametric estimations are reported below the standard errors. Total number ofobservations are in squared brackets. * p < 0.10, ** p < 0.05, *** p < 0.01.
68

Table Appendix C2: Discontinuities in Average Allowance Amounts at t+1 for RG and CGgrants by period.
Treatment Sample: CG grant RG grant(Income Eligibility Thresholds) (Threshold 2) (Threshold 1)Period: Period I Period II Period I Period II(academic years) (2010-2012) (2013-2015) (2010-2012) (2013-2015)
(1) (2) (3) (4)
Non-parametric 394 405** 377** 406***Estimates (310.184) (181.193) (150.853) (67.479)
[1,039] [1,08] [1,861] [1,87]
Baseline 1,926 1,784 231.6 156.2mean
Notes The table shows the RDD non-parametric estimates for the different applicants’ average grant allowance received.The treatment effect is estimated using a rectangular kernel and the bandwidth is computed as the optimal bandwidthproposed by Imbens and Kalyanaraman (2012) for each separated regression. Baseline mean refers to the average grantamount above the eligibility threshold. The RG treatment sample (column 1) includes applicants whose household parentaltaxable income is within 50 percent of the eligibility thresholds between fee waiver and Residence Grant allowances. TheCG treatment sample (column 2) includes applicants whose household parental taxable income is within 60 percent of theeligibility thresholds between Residence Grant and Compensate Grant allowances. Robust standard errors are clusteredat the student level and displayed in parenthesis. The number of observations used in the non-parametric estimations arereported below the standard errors. Total number of observations are in squared brackets. * p < 0.10, ** p < 0.05, ***p < 0.01.
69

Table D1: Discontinuities in Average GPA at RG and CG grants by period.
Treatment Sample: CG grant RG grant(Income Eligibility Thresholds) (Threshold 2) (Threshold 1)Period: Period I Period II Period I Period II(academic years) (2010-2012) (2013-2015) (2010-2012) (2013-2015)
(1) (2) (3) (4)
A. Baseline Estimates
Non-parametric -0.092 0.057 -0.031 0.455***Estimates (0.190) (0.157) (0.124) (0.144)
[3,402] [3,549] [6,093] [5,868]
Baseline 5.97 6.29 5.91 6.15mean
B. Sensitivity Analysis
B. 1 Half of the optimal bandwidth
Non-parametric -0.131 0.087 -0.054 0.490**Estimates (0.270) (0.223) (0.172) (0.201)
[3,402] [3,549] [6,093] [5,868]
Baseline 5.971 6.291 5.908 6.155mean
B. 2 Twice of the optimal bandwidth
Non-parametric -0.158 0.013 -0.021 0.363***Estimates (0.150) (0.132) (0.114) (0.112)
[3,402] [3,549] [6,093] [5,868]
Baseline 5.971 6.291 5.908 6.155mean
C. RD Robust
Non-parametric -0.135 0.088 -0.001 0.501**Estimates (0.274) (0.225) (0.211) (0.201)
[3,402] [3,549] [6,093] [5,868]
Baseline 5.971 6.291 5.908 6.155mean
D. Baseline estimates with controls
Non-parametric -0.065 0.013 -0.159 0.273**Estimates (0.154) (0.140) (0.104) (0.124)
[3,402] [3,549] [6,093] [5,868]
Baseline 5.971 6.291 5.908 6.155mean
E. Placebo test with midpoint between RG and CG
Non-parametric 0.0026 0.1386Estimates (0.120) (0.136)
[3,833] [5,829]
Baseline 5.990 6.327mean
Notes The table shows the RDD non-parametric estimates for applicants’ average GPA. Panel A shows the baseline resultsestimated using a rectangular kernel and the bandwidth is computed as the optimal bandwidth proposed by Imbens andKalyanaraman (2012) for each separated regression. Panel B displays the estimated treatment effect for half and twicethe optimal bandwidth proposed by Imbens and Kalyanaraman (2012). Panel C reports the baseline results estimatedperforming the local polynomial regression with robust bias-corrected confidence intervals proposed by Calonico, Cattaneoand Titiunik (2014). Panel D exhibits the baseline estimated treatment effect controlling for year fixed effects, PAUpercentile rank, STEM degree, whether the student has the Spanish nationality, and dummies equal to one for studentswho lived away their family home at the university entrance, female, household disability, household is considered as largefamily, and if the student’s principal tutor is entrepreneur, blue collar or self-employed. Panel E shows a placebo test witha fictitious income eligibility threshold computed as the middle point between RG and CG cutoffs.Baseline mean refers tothe average GPA above the eligibility threshold. The RG treatment sample (column 1) includes applicants whose householdparental taxable income is within 50 percent of the eligibility thresholds between fee waiver and Residence Grant allowances.The CG treatment sample (column 2) includes applicants whose household parental taxable income is within 60 percent ofthe eligibility thresholds between Residence Grant and Compensate Grant allowances. Robust standard errors are clusteredat the student level and displayed in parenthesis. The number of observations used in the non-parametric estimations arereported below the standard errors. Total number of observations are in squared brackets. * p < 0.10, ** p < 0.05, ***p < 0.01.
70

Table D2: Discontinuities in Average Awarded Grant and Average GPA at Fee Waiver (FW) andDisplacement and other needs grant (DG) by period.
Fee Waiver Grant (FW)
Treatment Sample: Avg. Awarded Grant (euros) Avg. GPA (0-10)(Income Eligibility Thresholds) (Threshold 0) (Threshold 0)Period: Period I Period II Period I Period II(academic years) (2010-2012) (2013-2015) (2010-2012) (2013-2015)
(1) (2) (3) (4)
A. Baseline EstimatesNon-parametric 143* -75.927 0.146 -0.235Estimates (75.273) (50.125) (0.189) (0.272)
[1,787] [1,714] [1,787] [1,713]
Baseline 0.210 13.99 5.852 6.188
Displacement and Other Needs Grant (DG)
Treatment Sample: Avg. Awarded Grant (euros) Avg. GPA (0-10)(Income Eligibility Thresholds) (Threshold 3) (Threshold 3)Period: Period I Period II Period I Period II(academic years) (2010-2012) (2013-2015) (2010-2012) (2013-2015)
(5) (6) (7) (8)
A. Total Sample
Non-parametric 730*** 123 0.115 0.149Estimates (137.186) (89.571) (0.182) (0.168)
[3,936] [3,909] [3,935] [3,907]
Baseline 662.2 673.9 5.853 6.250mean
B. By residence status
Living with parents 693*** 56 0.200 0.172
Non-parametric (45.053) (48.702) (0.238) (0.193)Estimates [2,896] [2,724] [2,895] [2,724]
98.90 394.1 5.748 6.154Baselinemean
Living outside the family home
Non-parametric 888*** -240.677 0.095 -0.014Estimates (309.610) (183.962) (0.346) (0.320)
[1,037] [1,184] [1,037] [1,182]
Baseline 2,303 1,342 6.138 6.480mean
Notes The table shows the RDD non-parametric estimates for the average allowance amount received and average GPAfor different samples. The treatment effect is estimated using a rectangular kernel and the bandwidth is computed as theoptimal bandwidth proposed by Imbens and Kalyanaraman (2012) for each separated regression. Baseline mean refers tothe average variable value above the eligibility threshold. The FW treatment sample includes applicants whose householdparental taxable income is within 15 percent of the eligibility thresholds between fee waiver and zero.The DG treatmentsample includes applicants whose household parental taxable income is within 30 percent of the eligibility thresholds betweenfee waiver and Distance and Other Needs allowances. The variable "Live away their family home" refers to the fractionof applicants who live away their family home, measured by the student’ postal code when they access higher education.Robust standard errors are clustered at the student level and displayed in parenthesis. The number of observations usedin the non-parametric estimations are reported below the standard errors. Total number of observations are in squaredbrackets. * p < 0.10, ** p < 0.05, *** p < 0.01.
71

Table D3: Discontinuities in Average Awarded Grant, Average GPA, Fraction of Credits Passedand Dropout at Residence Grant and Compensate Grant in 2012.
Treatment Sample: CG grant RG grant(Income Eligibility Threshold) (Threshold 1) (Threshold 2)
(1) (2)
A. Average Allowance Amounts (euros)
Non-parametric 2,792*** 657***Estimates (213.989) (141.691)
[1,035] [2,038]
Baseline 1,461 14.20mean
B. Average GPA (0-10)
Non-parametric -0.660 -0.392Estimates (0.401) (0.298)
[1,035] [2,037]
Baseline 6.28 5.98mean
C. Fraction of Credits Passed (0-1)
Non-parametric -0.078 0.017Estimates (0.054) (0.029)
[1,035] [2,037]
Baseline 0.81 0.77mean
E. Dropout from higher education
Non-parametric 0.013 -0.000Estimates (0.011) (0.010)
[1,035] [2,038]
Baseline 0.02 0.02mean
Notes The table shows the RDD non-parametric estimates for the average allowance amount received and average GPAfor different samples. The treatment effect is estimated using a rectangular kernel and the bandwidth is computed as theoptimal bandwidth proposed by Imbens and Kalyanaraman (2012) for each separated regression. Baseline mean refersto the average variable value above the eligibility threshold. Robust standard errors are clustered at the student leveland displayed in parenthesis. The number of observations used in the non-parametric estimations are reported below thestandard errors. Total number of observations are in squared brackets. * p < 0.10, ** p < 0.05, *** p < 0.01.
72

Table D4: Discontinuities for the mechanisms variables at RG and CG grants by period andterm.
First Term (Fall) Second Term (Spring)Treatment Sample: CG grant RG grant CG grant RG grant(Income Eligibility Thresholds) (Threshold 2) (Threshold 1) (Threshold 2) (Threshold 1)Period: Period I Period II Period I Period II Period I Period II Period I Period II(academic years) (2010-2012) (2013-2015) (2010-2012) (2013-2015) (2010-2012) (2013-2015) (2010-2012) (2013-2015)
(1) (2) (3) (4) (1) (2) (3) (4)
A. Final exam attendance rate
Non-parametric -0.001 -0.004 0.014 0.022*** -0.014 0.018 -0.004 0.046***Estimates (0.015) (0.010) (0.012) (0.008) (0.016) (0.019) (0.013) (0.015)
[3,299] [3,47] [5,904] [5,703] [3,282] [3,4] [5,885] [5,6]
Baseline 0.916 0.947 0.920 0.941 0.901 0.921 0.911 0.922mean
B. GPA on final exams taken
Non-parametric -0.005 0.081 -0.033 0.185 -0.070 -0.007 -0.100 0.345***Estimates (0.151) (0.146) (0.105) (0.116) (0.168) (0.136) (0.107) (0.117)
[3,288] [3,461] [5,881] [5,693] [3,253] [3,343] [5,815] [5,545]
Baseline 6.482 6.631 6.349 6.541 6.564 6.811 6.485 6.610mean
C. Selection on courses
Non-parametric 0.333 0.623 2.288** 1.427 1.504 0.541 2.499** 1.683*Estimates (1.363) (1.293) (1.136) (0.992) (1.663) (1.504) (1.184) (1.006)
[3,299] [3,47] [5,904] [5,703] [3,282] [3,4] [5,885] [5,6]
Baseline 51.57 51.06 52.56 53.51 51.37 50.90 53.13 53.40mean
D. GPA on Mandatory Subjects
Non-parametric -0.058 0.041 0.086 0.293** -0.149 0.122 -0.183 0.491***Estimates (0.208) (0.160) (0.158) (0.140) (0.223) (0.205) (0.146) (0.155)
[3,274] [3,426] [5,865] [5,628] [3,261] [3,374] [5,85] [5,57]
Baseline 5.961 6.281 5.868 6.160 5.942 6.227 5.954 6.122mean
E. GPA on Elective Subjects
Non-parametric 0.089 -0.650* 0.055 -0.210 -1.136*** 0.312 0.089 0.516Estimates (0.381) (0.391) (0.306) (0.303) (0.396) (0.355) (0.262) (0.333)
[1,065] [1,038] [1,693] [1,48] [1,101] [1,021] [1,777] [1,509]
Baseline 7.077 7.451 6.992 7.394 7.029 7.381 6.875 7.230mean
Notes The table shows the RDD non-parametric estimates for the average allowance amount received and average GPAfor different samples. The treatment effect is estimated using a rectangular kernel and the bandwidth is computed as theoptimal bandwidth proposed by Imbens and Kalyanaraman (2012) for each separated regression. Baseline mean refersto the average variable value above the eligibility threshold. Robust standard errors are clustered at the student leveland displayed in parenthesis. The number of observations used in the non-parametric estimations are reported below thestandard errors. Total number of observations are in squared brackets. * p < 0.10, ** p < 0.05, *** p < 0.01.
73

Table E1: Difference in Baseline Means by period and treatment sample.
Treatment Sample: CG grant RG grant(Income Eligibility Thresholds) (Threshold 2) (Threshold 1)
Baseline Mean Difference Baseline Mean DifferencePI PI vs. PII PI PI vs. PII(1) (2) (3) (4)
Female .49 .017 .47 .025(.012) (.0091)
Spanish .95 .014** .99 -.023(.006) (.0027)
Access to University Percentile rank 54.57 2.27*** 56.54 .38(.692) (.527)
STEM degree .34 -.02 .40 -.025(.011) (.009)
Households taxable income (euros) 17,959 1,336*** 43,703 3,306***(136) (187)
Number of family members 3.7 .0074 3.7 .042(.0234) (.016)
Disability .011 -.007 .014 .005(.0037) (.0022)
Large family condition .12 -.016* .13 .012(.009) (.006)
Live outside the family home .29 -.027 .3 .005***(.011) (.0083)
Entrepreneur Parent .07 -.005*** .04 .003(.006) (.004)
Blue Collar Parent .42 -.05*** .2 -.034**(.012) (.008)
Self-Employed Parent .064 .004 .023 .0044(.006) (.003)
Awarded Grants 1 -.013 .41 .088(.026) (.019)
Notes The table shows a t–test for the differences in baseline means on different applicants’ observable variables. Baselinemean refers to the average value of the observable variable above the eligibility threshold. The RG treatment sample (column1) includes applicants whose household parental taxable income is within 50 percent of the eligibility thresholds betweenfee waiver and Residence Grant allowances. The CG treatment sample (column 2) includes applicants whose householdparental taxable income is within 60 percent of the eligibility thresholds between Residence Grant and Compensate Grantallowances. The variable "Live away their family home" refers to the fraction of applicants who live away their family home,measured by the student’ postal code when they access higher education. The variable "Access to University PercentileRank" is computed as the percentile rank of the students’ academic year high school graduation on the PAU grade overthe poll of BCG grant applicants from 2004-2015. Household’s taxable income is expressed in constant 2015 euros. Robuststandard errors are clustered at the student level and displayed in parenthesis. * p < 0.10, ** p < 0.05, *** p < 0.01.
74

Table F1: BCG grant academic requirements.
A. Non-First year students
Fraction of pass creditsin the last academic year Average GPA Grant
over 60 ECTS rightsSTEM Humanities and STEM Humanities and
Social Sciences Social SciencesBefore 2012 60% 80% None None All2012 65% 90% None None All2013 onward 85% 100% None None All
65% 90% >=6 >=6.5 All65% 90% <6 <=6.5 Only Fee Waiver
B. First year students
Average Grade in PAU Grantrights
Before 2013 5/10 All2013 onward 6.5/10 All
5.5/10 Only Fee Waiver
Notes
Figure Appendix F1: BCG grant academic requirements for non-freshmen students.
Notes: STEM refers to degrees in science, technology, engineering and mathematics. Non-STEM refers to all degrees but STEM, which atCarlos III University are degrees in Humanities and Social Sciences. Full Grant refers to the possibility of receiving one of the three levels ofgrant (Fee Waiver, Residence or Compensate). Partial Grant indicate that students can only be awarded with Fee Waiver grant independentlyof their parental income.
Variable component formula.
Cj = Cmin +
[(Ctotal − S ∗ Cmin) ∗
(Nj/Nmax ∗ (1− (Rj
Rmax))∑S
i=1(Ni/Nmax) ∗ (1− ( RiRmax
)
](11)
75
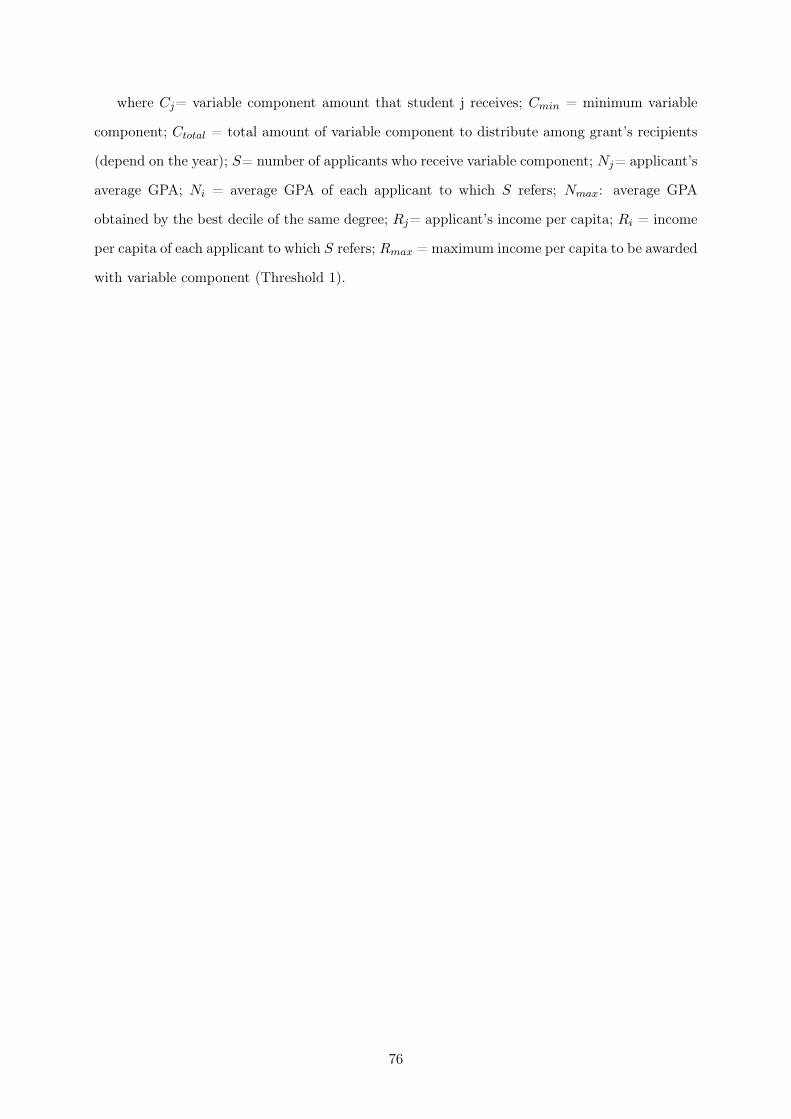
where Cj= variable component amount that student j receives; Cmin = minimum variable
component; Ctotal = total amount of variable component to distribute among grant’s recipients
(depend on the year); S= number of applicants who receive variable component; Nj= applicant’s
average GPA; Ni = average GPA of each applicant to which S refers; Nmax: average GPA
obtained by the best decile of the same degree; Rj= applicant’s income per capita; Ri = income
per capita of each applicant to which S refers; Rmax =maximum income per capita to be awarded
with variable component (Threshold 1).
76