the role of probabilistic tractocraphy in the surgical
TRANSCRIPT
The role of probabilistic tractocraphy in the surgical treatment of deep seated brain tumors
Ph.D Thesis
Dávid Kis, MD
Clinical and Experimental Neuroscience Program
Doctoral School of Clinical Medicine
Faculty of Medicine, University of Szeged
Supervisor: Pál Barzó, MD, Ph.D, MSc
Department of Neurosurgery, University of Szeged
Szeged
2019.
2
Table of contents Original publications related to the thesis 2 Original publications not directly related to the thesis 2
Abbrevations 4 Summary 5
1. Introduction 6 2. Objectives 8 3. Materials and methods 9 3.1 Thalamus tumor 9
3.1.1 Study population 9 3.1.2 MRI acquisition 9 3.1.3 Data processing 10 3.1.4 Data analysis 10 3.1.5 Surgery 11
3.2 Brainstem 13 3.2.1 Study population 13 3.2.2 MRI acquisition 13 3.2.3 Data preprocessing 13 3.2.4 Selection and definition of masks 14 3.2.5 Connectivity-based probabilistic brainstem segmentation 15
4. Results 17 4.1 Thalamus tumor 17
4.1.1. Representative cases 17 4.2 Brainstem 20
4.2.1 Segmentation pattern on the individual level 20 4.2.2 Segmentation pattern on the group level 21 4.2.3 Comparison of segmentation results with microscopic anatomy and anatomical reference material 22 4.2.4 Representative cases 24
5. Discussion 27 5.1 Thalamus tumor 27 5.2 Brainstem 29
5.2.1 Correspondence between the connectivity-defined brainstem regions and the known anatomy 29 5.2.2 Reproducibility of the connectivity-based brainstem segmentation 31 5.2.3 Potential clinical applicability 31 5.2.4 Limitations 32
6. Conclusions 33 7. Acknowledgement 34
8. References 35
3
Original publications related to the thesis I. Neurosurgery. 2014 Jun;10 Suppl 2:262-72.
The Role of Probabilistic Tractography in the Surgical Treatment of Thalamic Gliomas
Kis D, Mate A, Voros E, Kincses T, Barzo P
IF: 3.62
II. Brain Res. 2018 Jul 1;1690:74-88.
Connectivity-based segmentation of the brainstem by probabilistic tractography.
Máté A, Kis D, Czigner A, Fischer T, Halász L, Barzó P. IF: 3.125
Original publications not directly related to the thesis I. Brain Res. 2016 Oct 1;1648(Pt A):438-44.
Effect of subthalamic stimulation on distal and proximal upper limb movements in
Parkinson's disease.
Tamás G, Kelemen A, Radics P, Valálik I, Heldman D, Klivényi P, Vécsei L, Hidasi
E, Halász L, Kis D, Barsi P, Golopencza P, Erőss L.
IF: 2.746
II. Brain Res. 2009 Aug 4;1283:50-7.
PACAP and VIP differentially preserve neurovascular reactivity after global cerebral
ischemia in newborn pigs.
Lenti L, Zimmermann A, Kis D, Oláh O, Tóth GK, Hegyi O, Busija DW, Bari F,
Domoki F.
IF: 2.463
III. Brain Res. 2007 Aug 24;1165:81-8.
Pituitary adenylate cyclase-activating polypeptide induces pial arteriolar vasodilation
through cyclooxygenase-dependent and independent mechanisms in newborn pigs.
Lenti L, Domoki F, Kis D, Hegyi O, Toth GK, Busija DW, Bari F.
IF: 2.22
Scientometry Total impact factor: 14,174
Citation index: 40
H-index: 3

4
Abbrevations AC – anterior commissure
ALIC – anterior limb of internal capsule
ARAS – ascending reticular activating system
ASSET – array spatial sensitivity encoding technique
CDR – connectivity-defined region
CoGconn – center of gravity connectivity
CM – connectivity map
CST/CBT – corticospinal and corticobulbar tracts
DES – direct electrical stimulation
DOF – degree of freedom
DTI – diffusion tensor imaging
FA – fractional anisotropy
FDT – FMRIB’s Diffusion Toolbox
FLIRT – FMRIB’s Linear Image Registration Tool
FOV – field of view
FSL – FMRIB Software Library
MNI152 – Montreal Neurological Institute 152
MRI – magnetic resonance imaging
NEX – number of excitation
PDM – probability distribution map
PLIC – posterior limb of internal capsule
rp – Pearson’s coefficient
rs – Spearman’s rho
SNR – signal to noise ratio
TBI – traumatic brain injury
TE – echo time
TI – inversion time
TR – repetition time
5
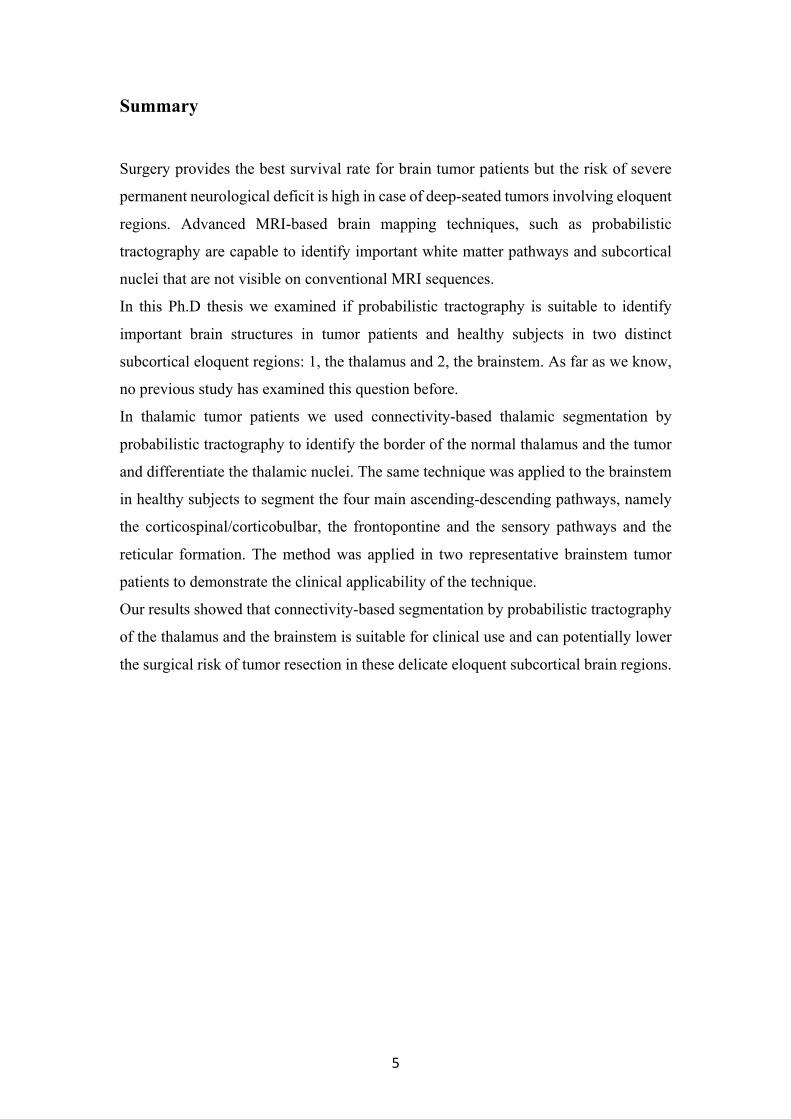
Summary
Surgery provides the best survival rate for brain tumor patients but the risk of severe
permanent neurological deficit is high in case of deep-seated tumors involving eloquent
regions. Advanced MRI-based brain mapping techniques, such as probabilistic
tractography are capable to identify important white matter pathways and subcortical
nuclei that are not visible on conventional MRI sequences.
In this Ph.D thesis we examined if probabilistic tractography is suitable to identify
important brain structures in tumor patients and healthy subjects in two distinct
subcortical eloquent regions: 1, the thalamus and 2, the brainstem. As far as we know,
no previous study has examined this question before.
In thalamic tumor patients we used connectivity-based thalamic segmentation by
probabilistic tractography to identify the border of the normal thalamus and the tumor
and differentiate the thalamic nuclei. The same technique was applied to the brainstem
in healthy subjects to segment the four main ascending-descending pathways, namely
the corticospinal/corticobulbar, the frontopontine and the sensory pathways and the
reticular formation. The method was applied in two representative brainstem tumor
patients to demonstrate the clinical applicability of the technique.
Our results showed that connectivity-based segmentation by probabilistic tractography
of the thalamus and the brainstem is suitable for clinical use and can potentially lower
the surgical risk of tumor resection in these delicate eloquent subcortical brain regions.
6
1. Introduction
In the treatment of intrinsic brain tumors, the gold standard is surgical resection.
Although it is now quite obvious that the efficacy of radiotherapy and survival time can
be increased by partial or total resection of these tumors (Krouwer et al. 1995; Steiger
et al. 2000; Nishio et al. 1997; Cuccia et al. 1997), in many cases only stereotactic
biopsy is carried out followed by radio- and/or chemotherapy on the basis of the
histological findings.
Although there have been many advances in radiosurgery in the past decade, its
usage is limited in primary intrinsic brain tumors and in metastases larger than 2 cm.
The goal of brain tumor surgery is maximum removal associated with no functional
deficit. Tumors involving eloquent (either cortical or subcortical) areas are at a high
risk of postoperative neurological deficit. This is especially true for deep-seated brain
tumors due to the following reasons:
1, the tumor is located in important subcortical eloquent areas (e.g. thalamus,
brainstem)
2, accessing these tumors has higher risk of injuring important subcortical
pathways due to their location and the long surgical trajectory.
Surgical resection of these tumors requires a highly experienced neurosurgeon
who must be aware of the cortical and subcortical functional neuroanatomy. However,
space occupying lesions distort and dislocate normal anatomy, and it can be extremely
challenging to recognize those structures that must be kept intact.
In eloquent brain tumor surgery, the gold standard for brain mapping is still
awake craniotomy combined with direct cortical and subcortical electrical stimulation
(DES) (Foster et al. 2019). Intraoperative electrophysiology (e.g., motor evoked
potential – MEP, somatosensory evoked potential - SSEP) can also be used in some
special cases for subcortical mapping and monitoring. Electrophysiological monitoring
is limited to sensory and motor functions. In case of deep-seated tumors several other
functional areas can be involved (motor coordination, cognitive, speech, memory
functions, awareness, etc.).
Noninvasive (preoperative) and invasive (intraoperative) brain mapping
techniques can help to reduce surgical risk, while maximizing the extent of resection.
MRI-based preoperative methods are widely used for cortical and subcortical mapping.
Functional MRI is a blood oxygen level-dependent method which can be used to
7
identify functional cortical areas (Bartos et al. 2009). Diffusion MRI-based
tractography techniques can depict subcortical white matter pathways (Costabile et al.
2019).
Although awake craniotomy and DES have the best sensitivity and specificity,
their application in case of deep-seated brain tumors is limited. Due to the location of
these tumors, these procedures may lead to severe and intolerable side effects and
symptoms (e.g., nausea, vomiting, unbearable headache, pain, wide range of
neurological symptoms), which would hinder the patients’ cooperation, making awake
surgery meaningless. In case of these tumors, preoperative brain mapping methods have
the highest impact to minimize risk and improve the extent of surgical resection. As
these tumors are located in deep white matter or in the basal ganglia, fMRI is not
suitable to map the surrounding brain around the lesion (Witwer et al. 2002).
Tractography on the other hand can identify white matter tracts and subcortical nuclei.
Conventional diffusion tensor imaging-based deterministic tractography can
visualize the major white matter pathways reliably (Mori et al. 2002; Mukherjee et al.
2008). Therefore, it can be used to identify white matter fibers around the tumor (e.g.,
corticospinal tract) and help to plan the surgical trajectory to avoid injuring important
pathways. Y.A. Moshel and colleagues showed, that surgical risk may be decreased by
mapping white matter tracts around the thalamus, but they did not identify thalamic
nuclei (Moshel et al. 2009). In eloquent subcortical regions, such as the thalamus and
brainstem, a well-planned trajectory alone is not enough to minimize functional deficit.
As the structure itself has important functions, its injury during the tumor removal can
lead to severe nerurological deficit and significant impairment of the quality of life. In
the past decade, diffusion MRI has been used to improve our knowledge on normal
brainstem anatomy (Stieltjes et al., 2001; Golay et al., 2002; Nagae-Poetscher et al.,
2004; Wakana et al., 2004; Salamon et al., 2005; Newton et al., 2006; Ramnani et al.,
2006; Habas and Cabanis, 2007; Upadhyay et al., 2008; Kamali et al., 2009; Naidich et
al., 2009; Hodaie et al., 2010; Hong et al., 2010; Kamali et al., 2010; Soria et al., 2011;
Edlow et al., 2012; Prats-Galino et al., 2012; Aggarwal et al., 2013; Ford et al., 2013;
McNab et al., 2013; Yeo et al., 2013) and on pathologies that distort it (Phillips et al.,
2005; Helton et al., 2006; Chen et al., 2007a, 2007b; Lui et al., 2007; Helton et al.,
2008; Giussani et al., 2010; Kovanlikaya et al., 2011; Prabhu et al., 2011; Ulrich et al.,
2014). These studies either used color-coded vector maps or diffusion tractography to
identify brainstem structures. However, color-coded vector maps cannot distinguish

8
between similarly oriented pathways connecting to different brain regions (like the
corticospinal, frontopontine, occipitoparietotemporopontine fibers in the cerebral
peduncle) (Soria et al., 2011), and in case of lesions that distort the normal course of
the pathways, color and intensity alterations make these maps difficult to interpret.
Most tractography studies of the brainstem have at least in part relied on anatomical
landmarks located within the brainstem itself. This may render their applicability
limited in case of space-occupying lesions when the identification of brainstem
anatomical landmarks becomes difficult and unreliable.
The ball and sticks model-based probabilistic tractography has several
advantages. It can track fibers in regions with low anisotropy values and visualize
crossing fibers. Moreover, it can provide quantitative measures representing the
connectivity properties of the seed region. It can be thresholded to exclude false positive
results and provides possibility to investigate connectivity of different brain areas, thus
subcortical nuclei and pathways become identifiable based on their connections.
(Behrens et al. 2003b; Elias et al. 2012)
2. Objectives
Our aim was to develop noninvasive, reliable and clinically applicable MRI-
based brain mapping methods to improve the surgical resection of deep-seated brain
tumors. We examined two distinct subcortical eloquent brain regions by probabilistic
tractography: the thalamus and the brainstem.
1. Connectivity based thalamus segmentation by probabilistic tractography has
been proven to be reliable and reproducible in healthy subjects (Behrens et al 2003b;
Johansen-Berg et al. 2005; Traynor et al. 2010). In our study we were the first to apply
this technique for thalamic tumor patients to differentiate between normal thalamus and
tumor tissue, make preoperative planning possible, optimize the surgical approach and
facilitate surgical resection. Thalamic segmentation classifies thalamic voxels
according to the cortical region with which they show the highest connection
probability (Behrens et al 2003b) and the specific connectivity pattern of each thalamic
nucleus allows determination of its location.
2. Part of the brainstem is potentially suitable for tractography studies, as it has
relatively simple fiber architecture (Stieltjes et al., 2001) and its main functional regions
maintain connections with supratentorial centers through white matter pathways mainly
9
running in rostrocaudal orientation. We were the first to apply connectivity based
segmentation technique in healthy subjects to identify four important brainstem
subregions (1, frontopontine pathways, which reach the brainstem through the anterior
limb of the internal capsule (ALIC); 2, corticospinal and corticobulbar tracts
(CST/CBT), dominant component of the posterior limb of the internal capsule (PLIC);
3, sensory connections involving the spinothalamic tract and the medial lemniscus
converging on the ventral posterior nucleus of the thalamus; 4, reticular formation and
ascending reticular activating system (ARAS)) based on their connectivity to
supratentorial structures, thereby avoiding the need for applying masks that rely on
anatomical landmarks within the brainstem. This can be significant help in the
preoperative planning of tumor resection, make preoperative planning possible,
optimize the surgical approach and facilitate surgical resection. Two representative
cases of brainstem tumor patients are included to this thesis to demonstrate the clinical
applicability of the introduced method.
3. Materials and methods
The applied MRI imaging and analysis methods differ in some aspects between
the two studies therefore they are presented separately. Both studies were approved by
the Institutional Review Board. Written informed consent was obtained from all
subjects.
3.1 Thalamus tumor 3.1.1 Study population
Five patients with thalamic gliomas were included in the study. Two of these
patients will be presented in details in the thesis as representative cases. For detailed
information about all patients, segmentation results, surgery and outcome, please see
Table 1. The Patient number has been changed in the thesis compared to the original
article, therefore the representative cases are assigned to be Patient 1 and 2. Please note
that Patient 2 in the thesis is presented as Patient 4 in the original article.
3.1.2 MRI acquisition
Scanning was conducted on 1.5 T GE Signa Excite scanner. High resolution T1
weighted (3D IR-FSPGR: TR/TE/TI:10.3/4.2/450 ms, flip angle: 15 u, ASSET: 2, FOV:
10
25*25 cm, matrix: 256*256, slice thickness:1 mm), FLAIR (TR/TE: 6 000/140 ms,
FOV: 25*25 cm, slice thickness: 1 mm, matrix: 256*256) and diffusion-weighted
images (DTI: TR/TE: 11 500/98.4 ms, flip angle: 90 u, FOV: 36*36 cm, matrix:
128*128, slice thickness: 3 mm, ASSET: 2, NEX:2,voxel size 2*2*3 mm, b value =
1000 s/mm2) in 30 independent directions and one nongradient set (b value = 0 s/mm2)
were made with 2 repetitions. Scans covered the whole brain. Total scan time took 25-
30 minutes/subject.
3.1.3 Data processing
Raw MRI data were processed using tools from the FMRIB Software Library
(FSL, version 2.0; Oxford Centre for Functional MRI of the Brain (FMRIB) (Smith et
al. 2004), UK; www.fmrib.ox.ac.uk/fsl) according to the method previously. (Behrens
et al. 2003b). DICOM images were converted into NIFTI format with MRICron
software (Rorden et al 2000), followed by eddy current correction, skull stripping,
reconstruction of diffusion tensors and modeling of diffusion parameters. Diffusion and
high resolution FLAIR images were registered to T1 weighted images with 6 degrees
of freedom (DOF).
3.1.4 Data analysis
Seven cortical masks were delineated manually on both hemispheres
(prefrontal-, premotor-, primary motor-, primary sensory-, posterior parietal-, occipital
and temporal cortex). These masks covered the whole cortical surface of each
hemisphere (Fig. 1). Masks were prepared based on the MNI Structural and Harvard-
Oxford Cortical Structural Atlas. Masks in standard space were co-registered to the
subject’s T1 images (with 12 DOF) and were corrected manually under visual control
to fit the patient’s anatomy. The thalamus and the thalamus-tumor complex were
outlined individually according to the gray matter areas between the posterior limb of
the internal capsule and the lateral and third ventricles (Fig. 1). The following step was
segmentation of the thalamus-tumor complex and the normal thalamus with the FDT
toolbox PROBTRACKX option using standard settings. After segmentation, seed areas
of the tumorous hemispheres were thresholded (lower threshold was 10% or less
connection probability) to extract possible cortical connections of the tumor (false
positive results). Finally, we performed the find_the_biggest command on the
thresholded output of PROBTRACKX. This is called hard segmentation (Behrens et

11
al., 2003b). Segmentations of both intact and tumorous hemispheres were carried out
to obtain comparable results. The average total time needed for the analysis was 3-4
days/subject.
Figure 1. The location of the seed and the target masks in a thalamus tumor patient: The thalamus (yellow) and thalamus-tumor complex (red) mask (left image) and the 7 cortical target (green – prefrontal, light blue – premotor, pink – primary motor, caribbean blue – primary sensor, red – dorsal parietal, dark blue occipital, yellow – temporal) masks (right image).
3.1.5 Surgery
Images of thalamic segmentation were fused with T1 and FLAIR images and
were reconverted into DICOM format (Matlab-based own software development).
Images were uploaded to neuronavigation system (StealthStation®, Medtronic). The
surgery of all patients was performed under neuronavigation. Preoperative planning
was not carried out in the case of Patient 1, because at that time thalamic segmentation
was not applied for this purpose at our department. Surgical approach was planned
individually for all the other patients based on preoperative MRI scans and safest access
was selected by the help of the results of thalamic segmentation. In the case of patients
3 and 4, awake surgery was performed to confirm the correlation between the expected
anatomic location based on the segmentation to the patient’s actual anatomic
circumstances explored during surgery.
12
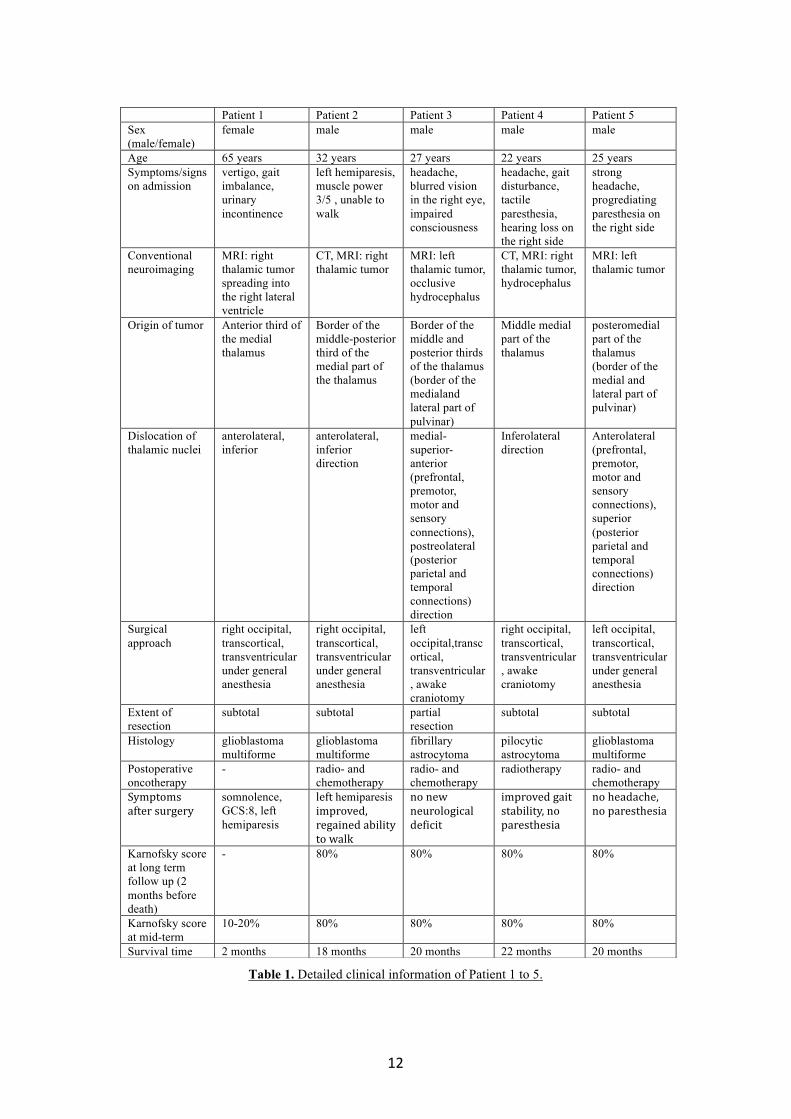
Table 1. Detailed clinical information of Patient 1 to 5.
Patient 1 Patient 2 Patient 3 Patient 4 Patient 5 Sex (male/female)
female male male male male
Age 65 years 32 years 27 years 22 years 25 years Symptoms/signs on admission
vertigo, gait imbalance, urinary incontinence
left hemiparesis, muscle power 3/5 , unable to walk
headache, blurred vision in the right eye, impaired consciousness
headache, gait disturbance, tactile paresthesia, hearing loss on the right side
strong headache, progrediating paresthesia on the right side
Conventional neuroimaging
MRI: right thalamic tumor spreading into the right lateral ventricle
CT, MRI: right thalamic tumor
MRI: left thalamic tumor, occlusive hydrocephalus
CT, MRI: right thalamic tumor, hydrocephalus
MRI: left thalamic tumor
Origin of tumor Anterior third of the medial thalamus
Border of the middle-posterior third of the medial part of the thalamus
Border of the middle and posterior thirds of the thalamus (border of the medialand lateral part of pulvinar)
Middle medial part of the thalamus
posteromedial part of the thalamus (border of the medial and lateral part of pulvinar)
Dislocation of thalamic nuclei
anterolateral, inferior
anterolateral, inferior direction
medial-superior-anterior (prefrontal, premotor, motor and sensory connections), postreolateral (posterior parietal and temporal connections) direction
Inferolateral direction
Anterolateral (prefrontal, premotor, motor and sensory connections), superior (posterior parietal and temporal connections) direction
Surgical approach
right occipital, transcortical, transventricular under general anesthesia
right occipital, transcortical, transventricular under general anesthesia
left occipital,transcortical, transventricular, awake craniotomy
right occipital, transcortical, transventricular, awake craniotomy
left occipital, transcortical, transventricular under general anesthesia
Extent of resection
subtotal subtotal partial resection
subtotal subtotal
Histology glioblastoma multiforme
glioblastoma multiforme
fibrillary astrocytoma
pilocytic astrocytoma
glioblastoma multiforme
Postoperative oncotherapy
- radio- and chemotherapy
radio- and chemotherapy
radiotherapy radio- and chemotherapy
Symptomsaftersurgery
somnolence, GCS:8, left hemiparesis
lefthemiparesisimproved,regainedabilitytowalk
nonewneurologicaldeficit
improvedgaitstability,noparesthesia
noheadache,noparesthesia
Karnofsky score at long term follow up (2 months before death)
- 80% 80% 80% 80%
Karnofsky score at mid-term
10-20% 80% 80% 80% 80%
Survival time 2 months 18 months 20 months 22 months 20 months

13
3.2 Brainstem
3.2.1 Study population
20 healthy subjects were included in the study (age [mean ± SD]: 31.7 ± 7 years, range:
21.7–43.2 years, 12 females) with no previous history of neurological or psychiatric disorders
and without any structural abnormalities on the anatomical scans.
3.2.2 Data acquisition
Scanning was conducted on a 1.5T GE Signa Excite scanner with an eight-channel head
coil and maximum gradient strength of 33 mTm-1. High resolution T1-weighted scans (3D IR-
FSPGR: TR/TE/TI: 10.3/4.2/450 ms, flip angle: 15°, ASSET, FOV: 25*25 cm, matrix:
256*256, slice thickness: 1 mm) and diffusion-weighted images (DTI: TR/TE: 11500/97.4 ms,
flip angle: 90°, FOV: 23*23 cm, matrix: 96*96, slice thickness: 2.4 mm, voxel size: 2.4 mm
isometric, the ASSET option was used to decrease image distortions of the posterior fossa and
acquisition time, NEX: 2 - to reduce artifacts of pulsatile motion, b = 1000 s/mm2) in 60
independent directions and six non-diffusion weighted sets (b = 0 s/mm2) (later referred as
nodif image) were acquired. Scans covered the whole brain. The total scan time was 35 to 40
minutes per subject. All images were acquired parallel to the anterior-posterior commissure
line.
3.2.3 Data preprocessing
MRI data were preprocessed using tools from the FMRIB Software Library (FSL, v5.0,
[Smith et al., 2004; Woolrich et al., 2009; Jenkinson et al., 2012]; FMRIB’s Diffusion Toolbox
[FDT], v3.0, [Behrens et al., 2003a, b]; Oxford Centre for Functional MRI of the Brain
[FMRIB], UK; www.fmrib.ox.ac.uk/fsl) according to the method previously described by
Behrens et al. (Behrens et al., 2003b). DICOM images were converted to NIFTI format by
MRICron (Rorden et al., 2007). Images were visually checked for artifacts, and no volume was
discarded, as data quality was found to be satisfactory in all subjects. Affine registration of the
diffusion dataset was performed to adjust for distortions caused by eddy currents and head
motion, followed by skull stripping (Smith, 2002), reconstruction of diffusion tensors, and
estimation of diffusion parameters. Transformation matrices between the structural, diffusion
(6 degrees of freedom, cost function: mutual information, interpolation: trilinear) and standard
(Montreal Neurological Institute, MNI152 2 mm brain) (12 degrees of freedom, cost function:
14
correlation ratio, interpolation: trilinear) spaces were obtained with FMRIB’s linear
registration tool FLIRT (Jenkinson and Smith, 2001; Jenkinson et al., 2002). Each subject’s
white matter mask was created from the T1 images by FMRIB’s model-based
segmentation/registration tool FIRST (Patenaude et al., 2011).
3.2.4 Selection and definition of masks
To reduce the effect of the distance dependence of tractography on the connectivity
results (Jbabdi and Johansen-Berg, 2011; Pelzer et al., 2013), targets were preferably chosen
to be located in the relative proximity of the seed mask and at a similar distance to it. According
to this, the following six target masks were applied: the left (1) and right (2) ALIC to detect
frontopontine connections (Kamali et al., 2010), the left (3) and right (4) PLIC to trace the
CST/CBT (Stieltjes et al., 2001; Wakana et al., 2004; Ulrich et al., 2014), the bilateral sensory
(Ulrich et al., 2014) (5) and medial (6) thalamus to find the main ascending sensory pathways
(medial lemniscus, spinothalamic pathways) and the reticular formation, respectively (Fig. 2).
The pontomesencephalic seed mask and all target masks were delineated in the
subject’s structural T1-weighted image space. The accuracy of the registration between the
subject’s structural T1-weighted and diffusion spaces was visually checked by identification
of anatomical landmarks (border of the lateral ventricles, anterior and posterior commissures,
basilar artery, fourth ventricle). Manual drawing of the masks took 15 to 30 minutes per subject.
3.2.4.1 Pontomesencephalic (seed) mask (Fig. 2A)
The pontomesencephalic region was manually delineated including the entire cross-
section of the brainstem in all slices starting from the pontomedullary junction to the
subthalamic region (to the uppermost slice, in which the red nucleus could be detected).
3.2.4.2 ALIC and PLIC (target) masks (Fig. 2B, C)
Masks of the ALIC and PLIC were created in a standardized fashion. In the first step,
all masks were created manually in the individual T1 space using the previously registered FA
and V1 maps as overlays. The anterior commissure (AC) was identified on the T1-weighted
images, and delineation of the ALIC masks was performed manually in one coronal slice
anterior to the AC, where the most prominent green (anterior-posterior main diffusion
direction) areas between the caudate nucleus and putamen-globus pallidus complex were
apparent bilaterally. Similarly, the PLIC mask was delineated manually in one axial slice
superior to the level of the AC, where the most prominent blue (superior-inferior main diffusion

15
direction) areas between the globus pallidus and the thalamus were apparent bilaterally. Then
all individuals’ ALIC and PLIC masks were transformed into MNI 2 mm space. Next, the
standard ALIC and PLIC masks were generated using the JHU ICBM-DTI 81 White-Matter
labels. The slice of the PLIC and ALIC of this standard atlas at the z=8 axial and y=8 coronal
slice, respectively, was chosen because the manually derived masks had the biggest overlap (8
or more subjects) at these levels. These standard ALIC and PLIC masks were then transformed
back to the individual space and masked by the previously generated white matter mask of each
subject.
3.2.4.3 Sensory and medial thalamic (target) masks (Fig.2D)
The sensory and medial thalamic masks were created according to the FSL’s Oxford
Thalamic Connectivity Probability Atlas (Behrens et al., 2003a, b) built in MNI standard space.
The thalamic region showing the highest connectivity to the primary sensory cortex was chosen
from this atlas to represent the sensory thalamus, and the thalamic region with the highest
connectivity to the prefrontal cortex was assigned to represent the medial thalamus. These
masks were registered to the individual T1-weighted image and were manually corrected to
remove voxels overlapping with the ventricles and the internal capsule.
Figure 2. The location of the seed and target masks of a brainstem segmentation subject: Pontomesencephalic seed (A) and supratentorial target masks (B – ALIC, C – PLIC, D – blue: sensory thalamus, yellow: medial thalamus).
3.2.5 Connectivity-based probabilistic brainstem segmentation
3.2.5.1 Probability distribution maps of the subregions
Probabilistic tractography was performed based on a multifiber model (Behrens et al.,
2007) using the seed and target regions described above. The default settings of the FDT (5000
samples, 0.5-mm step length, curvature threshold = 0.2) were applied (Behrens et al., 2003a,
b). On the individual level, these analyses resulted in a probability distribution map (PDM) for
each target mask, in which only voxels within the seed mask contained data. To eliminate low-
16
probability connections (false positive results) from these PDMs, they were thresholded to
contain only those voxels that represented a connectivity value equal to or higher than a certain
percentage of the maximum connectivity voxel of the given PDM (Bennett et al., 2011; Khalsa
et al., 2014). In this work, we defined connectivity as the total number of successful samples
per seed voxel that reach a particular target mask. Eight threshold levels were tested: 1%, 5%,
10%, 15%, 20%, 25%, 35% and 50%, of which the 25% threshold was found to yield the
anatomically most plausible results. This threshold level was arbitrarily chosen for further
analyses.
3.2.5.2 Brainstem connectivity maps derived by hard segmentation
On the individual level, the six PDMs thresholded at 25% were integrated into a single
representation corresponding to the connectivity map (CM) of the brainstem. It was created by
assigning each voxel in the seed mask with the identity of the target mask that had the highest
number of samples projecting to it. This method is called hard segmentation (Behrens et al.,
2003b). As a result, the CM of the brainstem consisted of six connectivity-defined regions
(CDR), namely the left and right frontopontine, the left and right motor, the sensory (involving
the left and right side as well) and the reticular subregions.
The total analysis time from data acquisition to the completion of the connectivity-
based brainstem segmentation was 24 to 48 hours per subject on an Apple Mac Pro, 2x2.4 GHz
6 Core Intel Xeon processor, 12 GB 1333 MHz DDR3 RAM (Apple Inc., California, USA).
To generate the group CM of the brainstem, all individual unthresholded PDMs were
registered to standard space. Then the individual PDMs of the same brainstem subregion were
mathematically summed and averaged to create a group PDM in standard space. The group
PDMs were also thresholded each at the eight different levels tested as it was described in
section 3.2.5.1. Then the six group PDMs thresholded with the same percentage level were
integrated into a single representation corresponding to the group CM of the brainstem as
described above (Fig. 5, 6).
3.2.5.3 Comparison of segmentation results with microscopic anatomy and anatomical
reference material
To qualitatively assess the correspondence between the results of the connectivity-
based brainstem segmentation and microscopic anatomy, horizontal histological sections
obtained from a single subject (41-year-old male without history of neurological disorders or
brain injury) and stained for myelin and for cells were consulted. These histological images

17
were courtesy of the Department of Anatomy, University of Szeged, Hungary. The results of
the connectivity-based brainstem segmentation were visually compared with the underlying
anatomical structures as defined by an experienced neuroanatomist on the histological images
and the standard brain MR images as well. The anatomical structures used for comparison were
as follows: frontopontine tract, corticospinal tract, occipitoparietotemporopontine tract, central
tegmental tract, superior cerebellar peduncle, dorsal longitudinal fasciculus, medial lemniscus,
and spinothalamic tract (Fig. 7).
4. Results
4.1 Thalamus tumor
4.1.1. Representative cases
4.1.1.1 Patient 1
A 65-year-old woman presented with a history of vertigo, gait imbalance and sudden
onset urinary incontinence. MRI revealed right thalamic tumor, spreading into the right lateral
ventricle. We decided to perform surgery from occipital, transcortical, transventricular access
based on the tumor’s appearance on conventional MRI sequences. Postoperative CT scan
showed marked diminution of the tumor mass, but unfortunately, the patient became somnolent
after surgery, she had no verbal response, did not cooperate and marked left hemiparesis
appeared (no spontaneous motor activity, withdrawal to painful stimuli, GCS score: 8). There
were no remarkable changes in her neurological state during the 10-day postoperative care at
our department. Histology revealed glioblastoma multiforme. She was transferred to the
Oncology Department of another institute. Her condition did not improve and she died in
pneumonia related sepsis 2 months after surgery. The retrospectively performed thalamic
segmentation showed that the tumor originated from the middle part of the medial thalamus
and dislocated thalamic nuclei in anterolateral and inferior direction, which could have helped
us to choose frontal, transcortical, transventricular approach instead of the applied one. We
suppose that in the background of her postoperative conscious state the injury of important
thalamic nuclei may have played a significant role due to the choice of an inappropriate surgical
approach (Fig. 3).
We present this case to emphasize the usefulness of thalamic segmentation in the
selection of the appropriate surgical approach. At the time of this patient’s surgery, thalamic
segmentation was not applied at our department. The additional information gained by this

18
retrospectively performed thalamic segmentation brought us to the idea to introduce this new
method to the preoperative planning of our thalamic glioma cases.
Figure 3. Segmentation results and surgical approach, trajectory and resection of Patient 1.: The upper two rows show the thalamus segmentation result of Patient 1. On the left, the axial and saggital T1 images show the tumor in the right thalamus. The thalamus cannot be differentiated from the tumor. In the middle the results of the thalamic segmentation of both sides are superimposed on the T1 (axial and saggital – right and left side) images (the colors represent the following connectivity: yellow- prefrontal, green- premotor, light blue – primary motor, dark blue – primary sensory, orange – dorsal parietal, purple – occipital, pink – temporal lobe). The black crosses indicate the point where the tumor growth probably started. The 3D reconstructions are on the right side. The tumor is marked in black. In the middle picture the tumor is partially transparent. According to the segmentation results the tumor originated from the medial part of the thalamus dislocating the nuclei to lateral and inferior dierction. The pictures in the lower row show the surgical approach. The white arrows illustrate the trajectory. In the middle picture the preoperative thalamic segmentation result of the right side is superimposed on the postoperative CT scans. According to these, during the surgery the pulvinar and partially the lateral group of nuclei probably suffered severe irreversible damage.
19
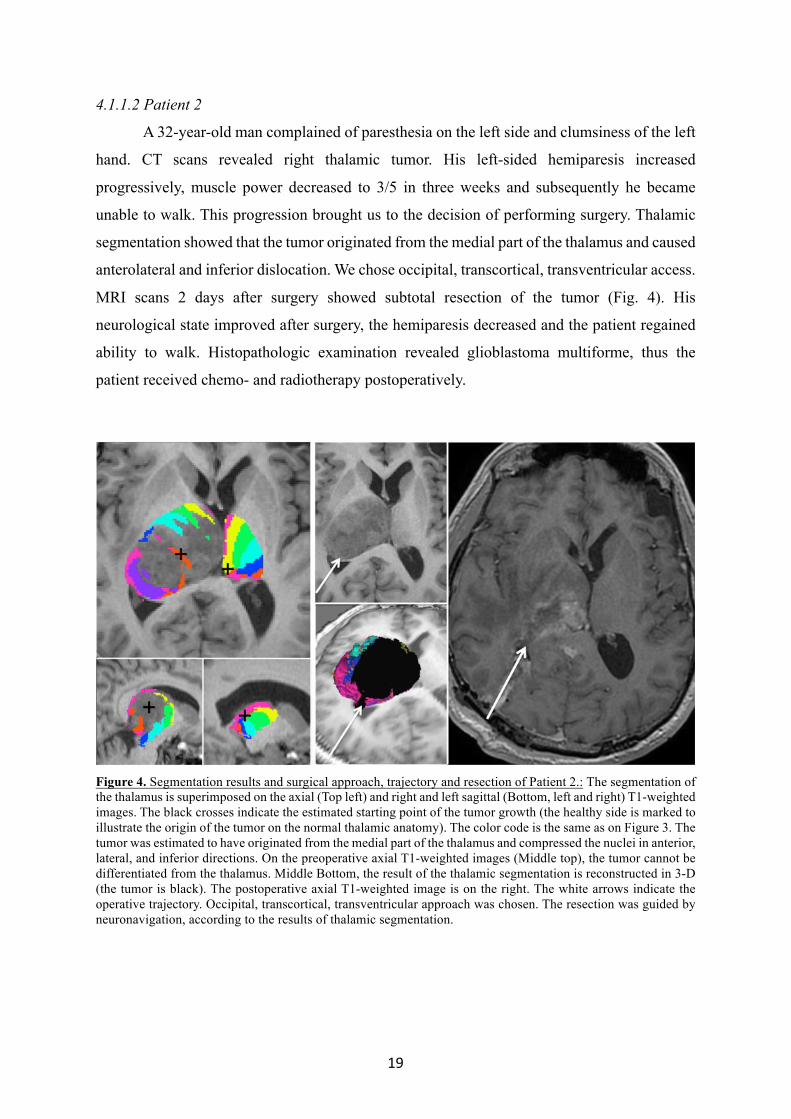
4.1.1.2 Patient 2
A 32-year-old man complained of paresthesia on the left side and clumsiness of the left
hand. CT scans revealed right thalamic tumor. His left-sided hemiparesis increased
progressively, muscle power decreased to 3/5 in three weeks and subsequently he became
unable to walk. This progression brought us to the decision of performing surgery. Thalamic
segmentation showed that the tumor originated from the medial part of the thalamus and caused
anterolateral and inferior dislocation. We chose occipital, transcortical, transventricular access.
MRI scans 2 days after surgery showed subtotal resection of the tumor (Fig. 4). His
neurological state improved after surgery, the hemiparesis decreased and the patient regained
ability to walk. Histopathologic examination revealed glioblastoma multiforme, thus the
patient received chemo- and radiotherapy postoperatively.
Figure 4. Segmentation results and surgical approach, trajectory and resection of Patient 2.: The segmentation of the thalamus is superimposed on the axial (Top left) and right and left sagittal (Bottom, left and right) T1-weighted images. The black crosses indicate the estimated starting point of the tumor growth (the healthy side is marked to illustrate the origin of the tumor on the normal thalamic anatomy). The color code is the same as on Figure 3. The tumor was estimated to have originated from the medial part of the thalamus and compressed the nuclei in anterior, lateral, and inferior directions. On the preoperative axial T1-weighted images (Middle top), the tumor cannot be differentiated from the thalamus. Middle Bottom, the result of the thalamic segmentation is reconstructed in 3-D (the tumor is black). The postoperative axial T1-weighted image is on the right. The white arrows indicate the operative trajectory. Occipital, transcortical, transventricular approach was chosen. The resection was guided by neuronavigation, according to the results of thalamic segmentation.
20
4.2 Brainstem
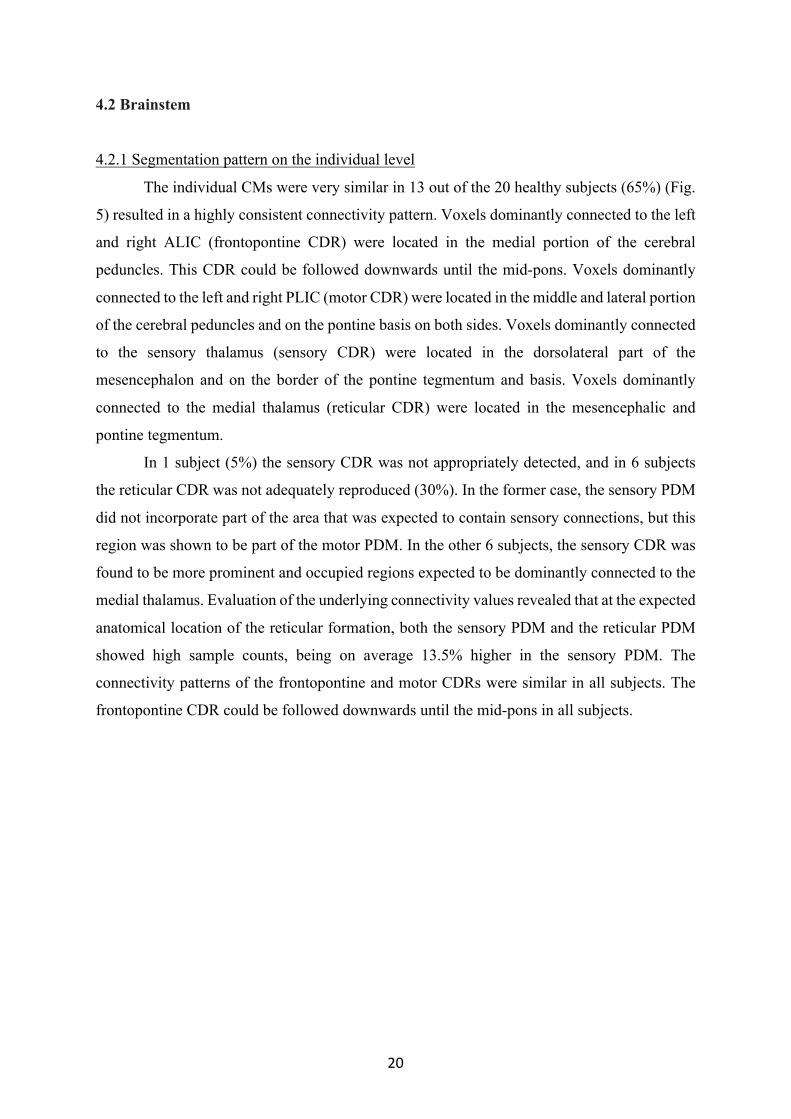
4.2.1 Segmentation pattern on the individual level
The individual CMs were very similar in 13 out of the 20 healthy subjects (65%) (Fig.
5) resulted in a highly consistent connectivity pattern. Voxels dominantly connected to the left
and right ALIC (frontopontine CDR) were located in the medial portion of the cerebral
peduncles. This CDR could be followed downwards until the mid-pons. Voxels dominantly
connected to the left and right PLIC (motor CDR) were located in the middle and lateral portion
of the cerebral peduncles and on the pontine basis on both sides. Voxels dominantly connected
to the sensory thalamus (sensory CDR) were located in the dorsolateral part of the
mesencephalon and on the border of the pontine tegmentum and basis. Voxels dominantly
connected to the medial thalamus (reticular CDR) were located in the mesencephalic and
pontine tegmentum.
In 1 subject (5%) the sensory CDR was not appropriately detected, and in 6 subjects
the reticular CDR was not adequately reproduced (30%). In the former case, the sensory PDM
did not incorporate part of the area that was expected to contain sensory connections, but this
region was shown to be part of the motor PDM. In the other 6 subjects, the sensory CDR was
found to be more prominent and occupied regions expected to be dominantly connected to the
medial thalamus. Evaluation of the underlying connectivity values revealed that at the expected
anatomical location of the reticular formation, both the sensory PDM and the reticular PDM
showed high sample counts, being on average 13.5% higher in the sensory PDM. The
connectivity patterns of the frontopontine and motor CDRs were similar in all subjects. The
frontopontine CDR could be followed downwards until the mid-pons in all subjects.
21
Figure 5. Individual connectivity maps derived by connectivity-based segmentation of the brainstem at the z = −20 axial slice of the MNI152 2 mm brain: The segmentation results of all Subjects are overlaid on their T1 images which were registered to the MNT152 2mm brain. The upper left picture indicates the magnified region of the brainstem displayed on the individual images, numbered according to the subject number (S1-S20). Colors represent the following connectivity-defined regions (CDR): yellow – right frontopontine CDR, light blue – left frontopontine CDR, orange – right motor CDR, dark blue – left motor CDR, pink – sensory CDR, purple – reticular CDR. All CDRs correspond well with the expected anatomical location in 13 subjects (except for S1, S2, S3, S4, S12, S18 and S19). Note that in case of S1, S2, S3, S4, S12 and S19, the connectivity-based segmentation of the brainstem failed to adequately identify the reticular CDR, and in S18, the sensory CDR was not appropriately detected. Orientation is radiological.
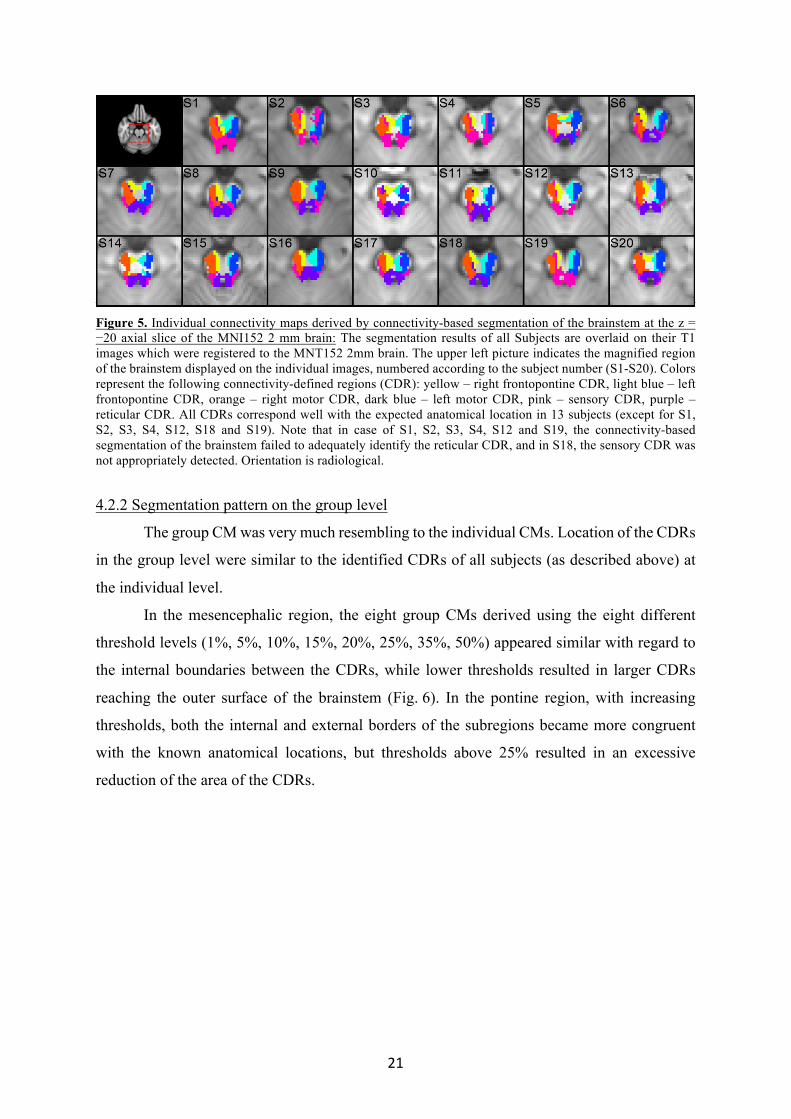
4.2.2 Segmentation pattern on the group level
The group CM was very much resembling to the individual CMs. Location of the CDRs
in the group level were similar to the identified CDRs of all subjects (as described above) at
the individual level.
In the mesencephalic region, the eight group CMs derived using the eight different
threshold levels (1%, 5%, 10%, 15%, 20%, 25%, 35%, 50%) appeared similar with regard to
the internal boundaries between the CDRs, while lower thresholds resulted in larger CDRs
reaching the outer surface of the brainstem (Fig. 6). In the pontine region, with increasing
thresholds, both the internal and external borders of the subregions became more congruent
with the known anatomical locations, but thresholds above 25% resulted in an excessive
reduction of the area of the CDRs.
22
Figure 6. Axial sections of the group connectivity maps (CM) derived by connectivity-based segmentation of the brainstem overlaid on axial slices of the MNI152 2 mm: A, B and C are shown at level of the mesencephalon (z = −20). D, E and F represent the level of the mid-pons (z = −36). A and D: group CM at 15% threshold, B and E: group CM at 25% threshold, C and F: group CM at 35% threshold. Color-coding: yellow – right frontopontine CDR, light blue – left frontopontine CDR, orange – right motor CDR, dark blue – left motor CDR, pink – sensory CDR, purple – reticular CDR. Note that the relative location of the CDRs corresponds well with the relative position of the anatomical structures they represent. With the increasing threshold, the internal boundaries of the CDRs in the mesencephalon remain similar, whereas in the mid-pons, higher thresholds cause more pronounced changes in their shape. Of the 8 threshold levels tested, the 25% level resulted in the anatomically most plausible results. Orientation is radiological.
4.2.3 Comparison of segmentation results with microscopic anatomy and anatomical reference
material
The group CM derived by the connectivity-based segmentation of the brainstem with a
25% threshold was in good overall visual concordance, with regard to the spatial distrbution
of the identified CDRs, with the pathways determined on the histological sections (Fig. 7). In
case of the sensory CDR, the medial lemniscus was located on the border of the motor and
sensory CDRs in the mesencephalon, whereas in the pontine region, part of it was identified in
the motor CDR.

23
Figure 7. Comparison of the group connectivity map (CM) with histological sections: A: Group CM (left) is overlaid on an axial slice of the MNI152 1 mm brain at the level of the oculomotor nerve root (axial plane of the MNI standard brain was adjusted to fit the horizontal position of the histological slice on panel B). B: Contours of the connectivity-defined regions (CDR) of the group CM (left) overlaid on a histological section showing the level matching panel A. Luxol blue – picrosirius red stain (by courtesy of the Department of Anatomy, Histology and Embryology, University of Szeged, Hungary). C: Group CM (left) overlaid on an axial slice of the MNI152 1 mm brain at the level of the trigeminal nerve root (axial plane of the MNI standard brain was adjusted to fit the horizontal position of the histological slice on panel D). D: Contours of the CDRs of the group CM (left) overlaid on a histological section showing the level matching panel C. Luxol blue – picrosirius red stain (by courtesy of the Department of Anatomy, Histology and Embryology, University of Szeged, Hungary). Color-coding of the CMs: yellow – frontopontine CDR, orange – motor CDR, red – sensory CDR, brown – reticular CDR. Anatomical structures identified: a – superior cerebellar peduncle, b – frontopontine tract, c – corticospinal tract, d – occipitoparietotemporopontine tract, e – medial lemniscus, f – central tegmental tract, g – spinothalamic tract, h – dorsal longitudinal fasciculus. Note the good overall visual concordance of the identified CDRs with the pathways determined on the histological sections. It can be seen that the medial lemniscus (e) is located on the border of the motor and sensory CDRs on panels A and B (mesencephalon), whereas on panels C and D (pons), part of it can be identified within the motor CDR.
24
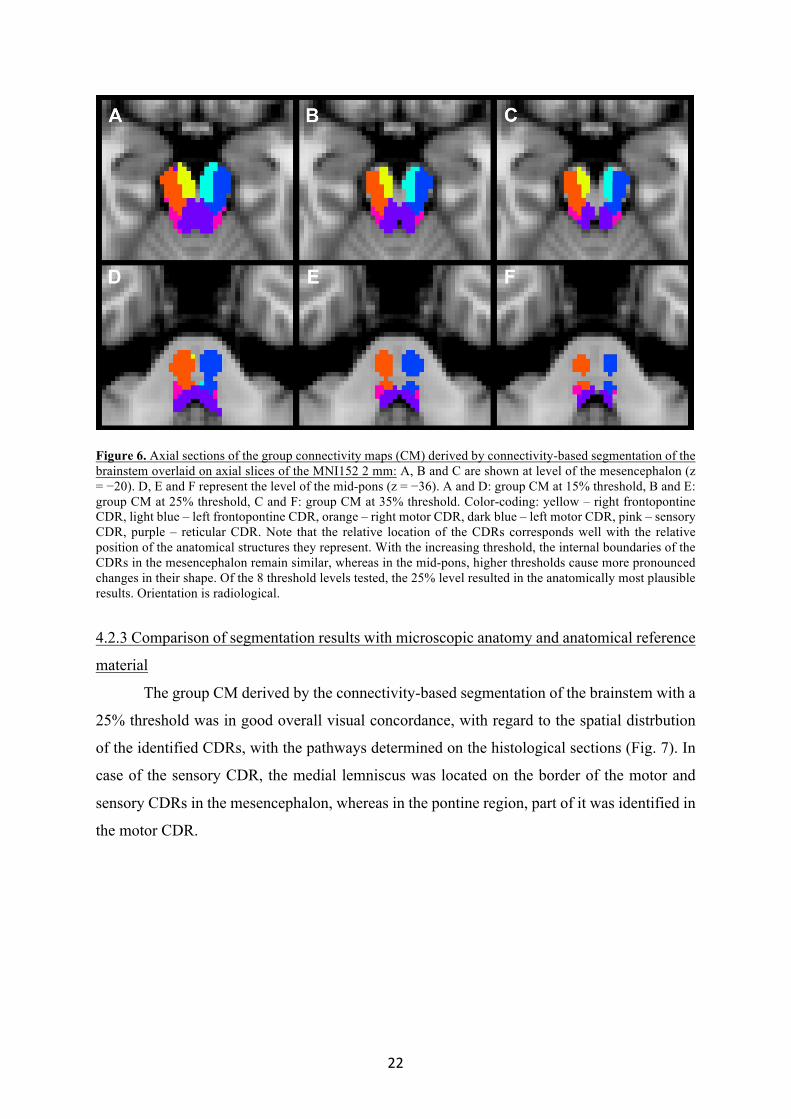
4.2.4 Representative cases
4.2.4.1 Patient 1 – Infiltrative tumor
A 6 years old female patient presented with vertigo. There were no other neurological
signs or symptoms. The conventional MRI images showed a mass lesion in the pons. According
to the images, the tumor seemed to be an expansive one as the dorsal and lateral brainstem was
intact. The connectivity based brainstem segmentation was done exactly as described above in
section 3.2.5. All of the six examined pathways (left and right motor-, left and right
frontopontine pathway, the bilateral sensory tracts and the reticular formation) were identified.
The results revealed that the tumor infiltrates the ventral pons and its pathways, namely the
corticospinal and frontopontin tracts (Fig. 8). Due to the infiltrative nature of the tumor it was
considered as inoperable and oncological treatment was initiated.
Figure 8. Segmentation results of Patient 1.: Representative case of an infiltrative tumor. The upper row shows sagittal, coronal and axial T1 images. The tumor – at least partially – seems to be an expansively growing one, as the dorsal and lateral part of the pons is intact. In the lower row the brainstem segmentation results are superimposed on the T1 images. Color-coding: yellow – right motor CDR, dark blue – right frontopontine CDR, light blue – left frontopontine CDR, green– left motor CDR, purple – sensory CDR, orange – reticular CDR. The results revealed that the tumor infiltrates the anterior pathways.

25
4.2.4.2 Patient 2 – Expansive tumor
A 16 years old male patient experienced vertigo, double vision, gait disturbances and
difficulty to swallow. His neurological condition resulted in inability to walk. The conventional
MRI images showed an expansive tumor in the left dorsal part of the pons and mesencephalon.
A biopsy was done in another institute. The histological examination showed a grade II-III
astrocytoma. The connectivity based brainstem segmentation was done as described in section
3.2.5. All of the six examined pathways (left and right motor-, left and right frontopontine
pathway, the bilateral sensory tracts and the reticular formation) were identified (Fig. 9). The
tumor did not infiltrate the normal brainstem but dislocated it from the left side to the right
side. A resective surgery was performed in our Department which was followed by chemo- and
radiotherapy. According to the segmentation results, an optimal site to reach the core of the
tumor with the least chance to injure normal pathways (similarly as it was done in cases of
thalamic tumors) was at its left dorsolateral part. To do so, the telovelar approach was chosen.
A subtotal tumor removal was performed (>90%). The patient experienced a significant
improvement, regained his normal vision and ability to walk, eat and drink.
26
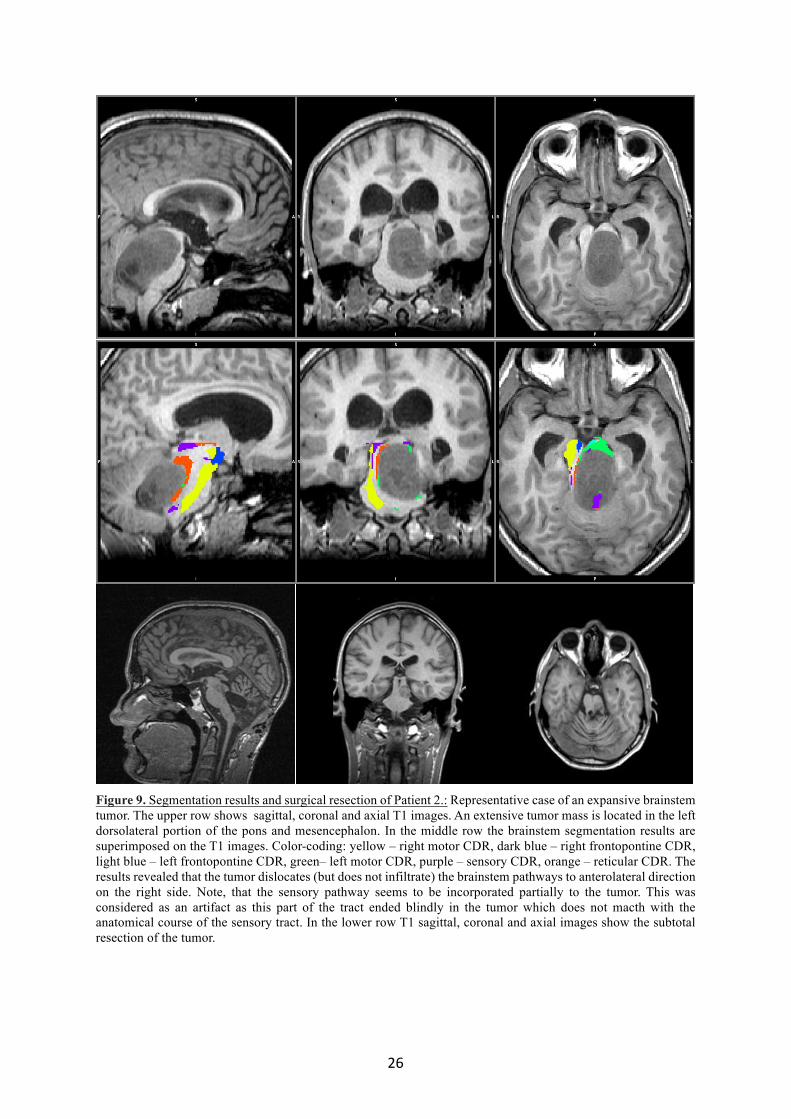
Figure 9. Segmentation results and surgical resection of Patient 2.: Representative case of an expansive brainstem tumor. The upper row shows sagittal, coronal and axial T1 images. An extensive tumor mass is located in the left dorsolateral portion of the pons and mesencephalon. In the middle row the brainstem segmentation results are superimposed on the T1 images. Color-coding: yellow – right motor CDR, dark blue – right frontopontine CDR, light blue – left frontopontine CDR, green– left motor CDR, purple – sensory CDR, orange – reticular CDR. The results revealed that the tumor dislocates (but does not infiltrate) the brainstem pathways to anterolateral direction on the right side. Note, that the sensory pathway seems to be incorporated partially to the tumor. This was considered as an artifact as this part of the tract ended blindly in the tumor which does not macth with the anatomical course of the sensory tract. In the lower row T1 sagittal, coronal and axial images show the subtotal resection of the tumor.
27
5. Discussion
5.1 Thalamus tumor
In the past few decades preoperative functional MRI and tractography became part of
the clinical routine to decrease the surgical risk of brain tumors in eloquent brain areas like
motor- (Kamada et al. 2005a), speech- (Kamada et al. 2007) and visual cortex (Kamada et al.
2005b), but it is not true yet for tumors of basal ganglia, brainstem and cerebellar peduncles.
Preoperative planning may similarly decrease the surgical risk of tumors affecting these areas,
but the thalamus and the brainstem contain important gray matter nuclei, that cannot be
identified by fMRI and deterministic tractography (Witwer et al. 2002).
Previous studies conducted with healthy subjects found that probabilistic tractography
provides possibility to perform thalamic segmentation in vivo, based on the cortical
connections of the thalamus, and these investigations proved to be reproducible intra- and
interindividually (Johansen-Berg et al. 2005; Traynor et al. 2010). Thalamic nuclei of different
function can be identified and differentiated by this method (prefrontal cortex – medial, midline
and anterior thalamic nuclei, premotor cortex – ventral lateral thalamic nuclei, primary motor
cortex – ventral anterior thalamic nuclei, primary sensory cortex – ventral posteromedial and
posterolateral thalamic nuclei, posterior parietal cortex – lateral part of pulvinar, occipital and
temporal cortex – medial part of pulvinar).
Sizable, inhomogenously enhancing tumors with considerable mass effect are not
possible to be distinguished from normal thalamus by conventional imaging techniques
(Garcia-Santos et al. 2002). Determining the location of thalamic nuclei may considerably help
the surgeon to plan the appropriate operative trajectory and to interpret intraoperative
anatomical circumstances properly.
With the technique described above, thalamic nuclei can be visualized separately from
the tumor, thus based on the normal anatomy of the opposite side it is possible to reconstruct
the origin of the tumor reliably. 3D reconstruction may provide further help to select the best
approach possible to reach the core of the tumor without damaging healthy tissue.
Yasargil suggested that brain tumors originate from a core and grow expansively
dislocating healthy tissues (Yasargil et al. 1994). In case of deep brain tumors, the surgeon has
limited space and the tumor is surrounded by eloquent white matter tracts. Hence the most
feasible strategy is to target the core of the tumor and start the resection there to remove it the
safest way, thus minimizing the risk of damaging healthy structures.

28
In the case of Patient 1, ventral thalamic nuclei were more dislocated, presumably
because the tumor originated from the anterior third of the medial thalamus, from the area
neighboring the anterior, medial and motor thalamic nuclei. In Patient 2, the dislocation of the
dorsal nuclei was more pronounced, pointing out that the possible origin of the tumor was the
middle-posterior third of the medial thalamus around the area surrounded by the ventrolateral,
ventroposterior nuclei and the pulvinar. Please see Table 1 for detailed information of all
Patients.
Occipital, transcortical approach seemed to be the safest in all patients except for Patient
1. We made our choice based upon the facts that occipital, transcortical approach spares
eloquent cortical areas and there are no important functional white matter tracts in the vicinity,
which decrease the risk of causing neurological deficit. Transventricular approach was
supported by the relatively easy access to the thalamus through the lateral ventricles and the
more spacious surgical field provided when using this approach (Ozek et al. 2002). Moreover,
this operative trajectory was favorable in all cases except for Patient 1 to reach the core of the
tumor without damaging normal thalamus. In Patient 1, on conventional MRI sequences the
tumor seemed to have an exophytic part growing into the occipital horn of the lateral ventricle,
suggesting an ideal location to start the resection. The retrospectively performed thalamic
segmentation showed that the area previously thought to be the exophytic component of the
tumor contained posterodorsal thalamic nuclei dislocated by the tumor. Based on the
postoperative neurological state of the patient, injury to these nuclei can be suspected.
Our results demonstrate that surgery performed with the help of our imaging algorithm
caused no deterioration in the neurological symptoms of our patients, indeed we noticed
neurological improvement in three cases and furthermore by two of them we achieved
complaint-free state. The border between the normal thalamus and the tumor was not
recognizable on conventional imaging in either case, but with the help of our method not only
the location of the normal thalamus, but also thalamic nuclei were identifiable. Based on the
results of the segmentation we were able to choose the safest way of surgical access combined
with the appropriate surgical technique.
For numerous reasons surgical therapy of thalamic tumors is considered a great
challenge even for experienced surgeons (Gaab et al. 1998; Broadway et al. 2011). With our
method, identifying the location of the thalamus became possible even when conventional
imaging has already reached its limits. In addition to this, knowing the location of thalamic
nuclei, preoperative planning could minimize surgical risk. Although data processing takes a

29
few days, thalamic gliomas mostly do not require acute resection, there is enough time for
investigating the patients.
Due to technical limitations (resolution of DTI, thresholding, manual delineation of
masks under visual control) the border of thalamic structures cannot be determined by thalamic
segmentation with complete consistency with the anatomy, but inaccuracies may not be greater
than a few millimeters. This technique is not capable to localize thalamic nuclei with
submillimetric accuracy, but for preoperative planning millimetric definition is satisfactory.
The accuracy of image guided techniques is anyway hampered by brain shift occurring after
incision of the dura mater. Tumor resection is performed under visual control and efficacy is
still mostly depending on the experience of the surgeon. Although computer-assisted
stereotactic resection of thalamic gliomas proved to be an effective and safe method (Kelly et
al. 1989), its availability is limited worldwide. Our method introduced here may further
enhance the latter technique and provide useful additional information to the preoperative
planning of conventional surgical strategies.
5.2 Brainstem
The aim of our study was to find a non-invasive, clinically feasible and reliable
technique that allows parcellation of the brainstem to subregions containing the major
components of the main functional systems that regulate cognitive, motor and sensory
functions, and consciousness.
5.2.1 Correspondence between the connectivity-defined brainstem regions and the known
anatomy
In this study we evaluated the frontopontine connections, the
corticospinal/corticobulbar tracts (CST/CBT), the main ascending sensory pathways (medial
lemniscus, spinothalamic pathways) and the reticular formation, because they represent
connections to fundamental functional systems, and their size allows identifying them on the
individual level with the imaging parameters used.
To limit low-probability connections (false positive results) between the seed and the
applied target areas, we tested eight different threshold levels both on the individual and the
group level, and found the anatomically most plausible results with 25% threshold (Fig. 6).
It has to be noted that even after thresholding, the probability distribution maps (PDMs)
necessarily contain more information than the connectivity defined regions (CDRs) derived
with hard segmentation. PDMs also involve collateral connections of the subregions (e.g.,

30
corticocerebellar fibers in case of tracking the CST/CBT). Each PDM contains a subset of
connectivity information regarding the voxels within the seed region, due to the limited
resolution of DTI. The hard segmentation synthesizes these pieces of information and
highlights the dominant connection in each voxel, while at the same time it ignores other, less
prominent collateral connections that are present in the PDMs.
The location of the CDRs produced by the brainstem segmentation corresponded with
the results of previous diffusion imaging studies (Wakana et al., 2004; Ramnani et al., 2006;
Habas and Cabanis, 2007; Kamali et al., 2010), as well as the neuroanatomy on the histological
slices (Fig. 5, 6, 7).
The frontopontine CDR was located in the medial portion of the cerebral peduncles
and, similarly to the findings of other studies (Habas and Cabanis, 2007; Kamali et al., 2010),
it could be followed downwards until the mid-pons, where these fibers end in the pontine
nuclei.
The motor CDR was located in the middle and lateral portion of the cerebral peduncles
and in the pontine basis on both sides.
Sensory thalamic regions as defined in the Oxford Thalamic Connectivity Atlas
(Behrens et al., 2003a, b) mainly correspond to the ventral posterior nucleus of the thalamus.
The main ascending sensory pathways that we focused on (medial lemniscus and spinothalamic
tract) target this thalamic region and run adjacent to each other in the pontomesencephalic
region. When comparing the location of the sensory CDR to the course of the main sensory
pathways identified on the histological specimen (Fig. 7), it is apparent that the medial
lemniscus was located on the border of the motor and sensory CDRs in the mesencephalon,
whereas in the pontine region, part of it could be identified in the motor CDR. This appearance
may be due to several factors, for example that the histological sections and the MNI152
standard brain cannot be brought into complete alignment, the segmentation result may suffer
from distortion caused by the registration to standard space, and the low specificity of the
posterior limb of the internal capsule (PLIC) target mask, as it involves sensory fibers as well
(thalamocortical projections). Although the thalamocortical sensory fibers originate from the
third neurons of the main ascending sensory pathways, and project to the cortex after synapsing
in the thalamus, diffusion tractography does not detect the presence of synapses (Johansen-
Berg and Behrens, 2006), making it possible to reconstruct the course of the sensory pathways
from the brainstem beyond the thalamus, potentially leading to incorporation of some medial
lemniscal fibers in the motor CDR traced from the PLIC. Albeit the sensory thalamus is a more
specific target mask than the PLIC for the tracking of sensory pathways, it is a gray matter area
31
with higher diffusion uncertainty, which could also contribute to this segmentation result.
Segmentation of the PLIC and selective inclusion of fibers arising from the motor cortex may
be a possible solution to this issue, however we did not implement this option in this study, as
it would have considerably lengthened processing time, and therefore would have been in
conflict with our aim to present a simple, clinically feasible method.
The reticular CDR was located in the median and paramedian areas of the
mesencephalic and pontine tegmentum surrounded laterally and anterolaterally by the sensory
CDR in the mesencephalon and in the pons, respectively. The area identified by the
connectivity-based brainstem segmentation as the mesencephalic and pontine reticular
formation corresponded well with its known anatomical location, indicating that this method
can be a potential tool to isolate this area, and thereby may allow its assessment even in disease
states (e.g., tumor, demyelination, hemorrhage).
5.2.2 Reproducibility of the connectivity-based brainstem segmentation
On the individual level, all four subregions were successfully identified by the hard
segmentation in 13 out of 20 subjects (65%). The sensory CDR was incompletely identified in
1 subject (5%), and the reticular subregion was not detectable in 6 cases (30%) (Fig. 5). In
these latter subjects, the underlying difference between the sensory and reticular connectivity
may be due to individual variations of the thalamic connectivity not accounted for by the
standard masks of the FSL’s Oxford Thalamic Connectivity Probability Atlas (Behrens et al.,
2003a, b). In such individual cases it may be helpful to determine the location of sensory
connections in the thalamus by performing connectivity-based segmentation of the thalamus
(Behrens et al., 2003b), and then use the resulting thalamic subregion that dominantly connects
to the primary sensory cortex as a target mask for connectivity-based brainstem segmentation.
A few studies are available in the literature that compared the accuracy of thalamus
segmentation to electrophysiological findings at the individual level. These studies have
revealed that the tractography-based method localizes sensory and motor thalamic nuclei with
high precision, as the deviation was approximately 1-1.5 mm (Pouratain et al., 2011; Elias et
al., 2012; Sammartino et al., 2016).
5.2.3 Potential clinical applicability
The results of the connectivity-based segmentation of the brainstem in 20 healthy adults
may provide reference for the investigation of patient populations. Eliminating the need for
using anatomical landmarks within the brainstem to start tractography analysis may be
32
particularly helpful in the preoperative evaluation of space-occupying lesions. In the other
study of this thesis, we reported on the application of connectivity-based segmentation by
probabilistic tractography in the preoperative planning of gliomas that distort the thalamus (Kis
et al., 2014). Connectivity-based brainstem segmentation may be a helpful tool in the
preoperative planning of brainstem gliomas in a similar way, facilitating the differentiation
between infiltrative and expansive tumor growth and the planning of the surgical trajectory.
We have presented two representative cases of brainstem glioma to demonstrate the
usefulness of probabilistic tractography-based brainstem segmentation in brain tumor surgery.
The presented method was able to detect all the six subregions in both patients. In case of
Patient 1, conventional MRI scans indicated an at least partially expansive tumor growth but
the tractography results have revealed that the tumor was actually an infiltrative one and
consequently inoperable. In Patient 2, the border between the tumor and the brainstem was
clear and the subregions were pushed to a right anterolateral direction by the tumor. According
to these, an ideal surgical access to reach the core of the tumor is at its left dorsolateral portion.
Using the results of the brainstem segmentation we were able to perform a subtotal resection
of the tumor followed by a significant improvement of the patients’ quality of life in the long
term.
We believe that the two representative cases demonstrate that the presented
tractography method is not only capable of identifying the important subregions in tumorous
brainstem but also makes it possible to distinguish between infiltrative and expansive tumors
in patients when conventional MRI scans are not obvious.
5.2.4 Limitations
There are well known limitations of diffusion tractography that apply to our study as
well. Diffusion MRI is sensitive to physiological noise (Bammer, 2003), but in this study we
used no cardiac gating (Habib et al., 2010) or navigator-corrected approach (Alhamud et al.,
2015) to adjust for distortion potentially induced by cardiac and respiratory motion. However,
the acquisition of the DTI sequence was repeated twice and ASSET was used to increase the
signal-to-noise ratio and improve image quality.
As it was underlined by the cases of those six subjects in whom the reticular subregion
could not be identified (Fig. 5), hard segmentation only considers the dominant connection of
the given region in the brainstem, therefore, it is insensitive to the extent of differences between
connectivity values, and can be driven even by small discrepancies. Verifying the PDMs may
help evaluate the connectivity in these cases.
33
The applied masks included other pathways beyond those of interest, like the
thalamocortical fibers in the anterior limb of the internal capsule (ALIC), and the
occipitoparietotemporopontine and some of the medial lemniscal fibers in the PLIC. Therefore,
the segmentation presented here cannot differentiate the fibers of the
occipitoparietotemporopontine pathways from the corticospinal and corticobulbar tracts, but
the spatial relationship of the frontopontine fibers relative to the corticospinal, corticobulbar
and the occipitoparietotemporopontine fibers corresponds well with the known anatomy and
also with the findings of previous DTI studies (Stieltjes, et al., 2001; Wakana et al., 2004;
Ramnani et al., 2006; Kamali et al., 2010).
The small number of investigated structures can be generally considered an important
limitation of our study. The identification of further brainstem structures by increasing the
complexity and specificity of this connectivity-based brainstem segmentation can potentially
be the subject of future studies.
The representative cases showed that in case of brainstem gliomas the presented method
could provide greater and safer tumor resection but the same technical limitations are present
as in thalamic tumor patients. These limitations and their clinical interpretation has been
discussed in details in section 5.1.
6. Conclusions Our aim was to develop new imaging algorithms that may help to decrease surgical risk
of deep seated brain tumors and broaden the range of tumors considered to be operable. We
suggest that these methods may be applied successfully and routinely in the surgical treatment
of thalamic and brainstem gliomas. By determining individual anatomy and identifying the
dislocation of subcortical functional regions, surgery can be planned targeting the core of the
tumor, which may be safer and more effective than applying empirical surgical techniques. On
the other hand, we were the first to apply connectivity-based segmentation by probabilistic
tractography to of the brainstem. It allows separation of four functionally important subregions
(the frontopontine, motor, and sensory pathways and the reticular formation) in the brainstem
based on connectivity to supratentorial structures, which may be an advantage when
pathologies within the brainstem hinder the identification of anatomical landmarks. The
detected subregions were in good concordance with microscopic anatomy, furthermore, they
were shown to be reproducible in a group of healthy subjects. Nevertheless, the representative
cases demonstrate the potential applicability of this technique in case of brainstem tumors.
34
7. Acknowledgement
I would never have been able to finish my dissertation without the guidance of my collagues,
help from friends, and support from my family.
I would like to thank to my supervisor, Prof. Pál Barzó for giving me the opportunity to work
in the Department of Neurosurgery and supporting my work. I would also like to express my
deepest gratitude to him for his kind support and excellent guidance.
Special thanks to Dr. Tamás Kincses, who was the first to introduce the mystery and beauty of
neuroimaging to me. As a good tutor and friend, he was always willing to help me and give his
best suggestions when needed.
I would like to express my special thanks and gratitude to my wife, Dr. Adrienn Máté. Without
her support and care I would have never been able to finish my Ph.D thesis. She was always
there for me either in private or professional life.
Many thanks to Dr. László Halász. My research would not have been the same without his help.
I would also like to thank to my Mother, who always supported me, to my Father, whose
commitment for science guided me from my childhood and to Prof. Ferenc Bari who gave me
the opportunity to start research work as a student.
Finally, I would like to thank to my little daughter, Emma, who always cheered me up with her
smile during hard times.
35
8. References 1. Aggarwal M, Zhang J, Pletnikova O, Crain B, Troncoso J, Mori S (2013), Feasibility
of creating a high-resolution 3D diffusion tensor imaging based atlas of the human
brainstem: A case study at 11.7 T. NeuroImage 1(74):117-127.
2. Alhamud A, Taylor PA, Laughton B, van der Kouwe AJ, Meintjes EM (2015), Motion
artifact reduction in pediatric diffusion tensor imaging using fast prospective
correction. J Magn Reson Imaging 41(5):1353-1364.
3. Bammer R (2003), Basic principles of diffusion-weighted imaging. Eur J Radiol
45(3):169-184.
4. Bartos R, Jech R, Vymazal J, Petrovický P, Vachata P, Hejcl A, Zolal A, Sames M
(2009), Validity of primary motor area localization with fMRI versus electric cortical
stimulation: a comparative study. Acta Neurochir (Wien). 151(9):1071-80
5. Behrens TEJ, Woolrich MW, Jenkinson M, Johansen-Berg H, Nunes RG, Clare S,
Matthews PM, Brady JM, Smith SM (2003a), Characterization and propagation of
uncertainty in diffusion-weighted MR imaging. Magn Reson Med 50(5):1077-1088.
6. Behrens TEJ, Johansen-Berg H, Jbabdi S, Rushworth MF, Woolrich MW (2007),
Probabilistic diffusion tractography with multiple fibre orientations: What can we gain?
NeuroImage 34(1):144-155.
7. Behrens TEJ, Johansen-Berg H, Woolrich MW, Smith SM, Wheeler-Kingshott CAM,
Boulby PA, Barker GJ, Sillery EL, Sheehan K, Ciccarelli O, Thompson AJ, Brady JM,
Matthews PM (2003b), Non-invasive mapping of connections between human
thalamus and cortex using diffusion imaging. Nat Neurosci 6(7):750-757.
8. Bennett IJ, Madden DJ, Vaidya CJ, Howard JH Jr, Howard DV (2011), White matter
integrity correlates of implicit sequence learning in healthy aging. Neurobiol Aging
32(12):2317.e1-12. doi: 10.1016/j.neurobiolaging.2010.03.017.
9. Broadway SJ, Ogg RJ, Scoggins MA, Sanford R, Patay Z, Boop FA. Surgical
management of tumors producing the thalamopeduncular syndrome of childhood
Clinical article. Journal of Neurosurgery-Pediatrics. 2011;7(6).
10. Chen X, Weigel D, Ganslandt O, Buchfelder M, Nimsky C (2007a), Diffusion tensor
imaging and white matter tractography in patients with brainstem lesions. Acta
Neurochir 149(11):1117-1131.

36
11. Chen X, Weigel D, Ganslandt O, Fahlbusch R, Buchfelder M, Nimsky C (2007b),
Diffusion tensor-based fiber tracking and intraoperative neuronavigation for the
resection of a brainstem cavernous angioma. Surg Neurol 68(3):285-291.
12. Costabile JD, Alaswad E, D'Souza S, Thompson JA, Ormond DR (2019), Current
Applications of Diffusion Tensor Imaging and Tractography in Intracranial Tumor
Resection. Front Oncol. 29;9:426.
13. Cuccia V, Monges J. Thalamic tumors in children. Childs Nervous System.
1997;13(10).
14. Edlow BL, Takahashi E, Wu O, Benner T, Dai G, Bu L, Grant PE, Greer DM,
Greenberg SM, Kinney HC, Folkerth RD (2012), Neuroanatomic connectivity of the
human ascending arousal system critical to consciousness and its disorders. J
Neuropathol Exp Neurol 71(6):531-546.
15. Elias WJ, Zheng ZA, Domer P, Quigg M, Pouratian N (2012), Validation of
connectivity-based thalamic segmentation with direct electrophysiologic recordings
from human sensory thalamus. NeuroImage. 59(3):2025-2034.
16. Ford AA, Colon-Perez L, Triplett WT, Gullett JM, Mareci TH, Fitzgerald DB (2013),
Imaging white matter in human brainstem. Front Hum Neurosci 7, Article 400.
doi: 10.3389/fnhum.2013.00400.
17. Foster CH, Morone PJ, Cohen-Gadol A (2019), Awake craniotomy in glioma surgery:
is it necessary? J Neurosurg Sci. 63(2):162-178.
18. Gaab MR, Schroeder HWS. Neuroendoscopic approach to intraventricular lesions. J
Neurosurg. 1998;88(3).
19. Garcia-Santos J, del Rio S, Sanchez A, Martinez-Lage J. Basal ganglia and thalamic
tumours: an imaging approximation. Childs Nervous System. 2002;18(8):412-425.
20. Giussani C, Poliakov A, Ferri RT, Plawner LL, Browd SR, Shaw DW, Filardi TZ,
Hoeppner C, Geyer JR, Olson JM, Douglas JG, Villavicencio EH, Ellenbogen RG,
Ojemann JG (2010), DTI fiber tracking to differentiate demyelinating diseases from
diffuse brainstem glioma. NeuroImage 52(1):217-223.
21. Golay X, Jiang H, van Zijl PC, Mori S (2002), High-resolution isotropic 3D diffusion
tensor imaging of the human brain. Magn Reson Med 47(5):837-843.
37
22. Habas C, Cabanis EA (2007), Anatomical parcellation of the brainstem and cerebellar
white matter: A preliminary probabilistic tractography study at 3 T. Neuroradiology
49(10):849-863.
23. Habib J, Auer DP, Morgan PS (2010), A quantitative analysis of the benefits of cardiac
gating in practical diffusion tensor imaging of the brain. Magn Reson Med 63(4):1098-
1103.
24. Helton KJ, Phillips NS, Khan RB, Boop FA, Sanford RA, Zou P, Li CS, Langston JW,
Ogg RJ (2006), Diffusion tensor imaging of tract involvement in children with pontine
tumors. AJNR Am J Neuroradiol 27(4):786-793.
25. Helton KJ, Weeks JK, Phillips NS, Zou P, Kun LE, Khan RB, Gajjar A, Fouladi M,
Broniscer A, Boop F, Li CS, Ogg RJ (2008), Diffusion tensor imaging of brainstem
tumors: axonal degeneration of motor and sensory tracts. J Neurosurg Pediatr 1(4):270-
276.
26. Hodaie M, Quan J, Chen DQ (2010), In vivo visualization of cranial nerve pathways in
humans using diffusion-based tractography. Neurosurgery 66(4):788-795.
27. Hong JH, Son SM, Jang SH (2010), Somatotopic location of corticospinal tract at pons
in human brain: A diffusion tensor tractography study. NeuroImage 51(3):952-955.
28. Jbabdi S, Johansen-Berg H (2011), Tractography: where do we go from here? Brain
Connect 1(3):169-183.
29. Jenkinson M, Bannister P, Brady M, Smith S (2002), Improved optimization for the
robust and accurate linear registration and motion correction of brain images.
NeuroImage 17(2):825-841.
30. Jenkinson M, Beckmann CF, Behrens TEJ, Woolrich M W, Smith SM (2012), FSL.
NeuroImage 62(2):782-790.
31. Jenkinson M, Smith SM (2001), A global optimisation method for robust affine
registration of brain images. Med Image Anal 5(2):143-156.
32. Johansen-Berg H, Behrens TE, Sillery E, et al. Functional-anatomical validation and
individual variation of diffusion tractography-based segmentation of the human
thalamus. Cereb Cortex. 2005;15(1):31-39.
33. Johansen-Berg H, Behrens TEJ (2006), Just pretty pictures? What diffusion
tractography can add in clinical neuroscience. Curr Opin Neurol 19(4):379-385.
34. Kamada K, Sawamura Y, Takeuchi F, et al. Functional identification of the primary
motor area by corticospinal tractography (Reprinted from Neurosurgery, vol 56, pg 98-
109, 2005). Neurosurgery. 2007;61(1):166-176.

38
35. Kamada K, Todo T, Masutani Y, et al. Visualization of the frontotemporal language
fibers by tractography combined with functional magnetic resonance imaging and
magnetoencephalography. J Neurosurg. 2007;106(1):90-98.
36. Kamada K, Todo T, Morita A, et al. Functional monitoring for visual pathway using
real-time visual evoked potentials and optic-radiation tractography. Neurosurgery.
2005;57(1):121-126.
37. Kamali A, Kramer LA, Butler IJ, Hasan KM (2009), Diffusion tensor tractography of
the somatosensory system in the human brainstem: Initial findings using high isotropic
spatial resolution at 3.0 T. Eur Radiol 19(6):1480-1488.
38. Kamali A, Kramer LA, Frye RE, Butler IJ, Hasan KM (2010), Diffusion tensor
tractography of the human brain cortico-ponto-cerebellar pathways: A quantitative
preliminary study. J Magn Reson Imaging 32(4):809-817.
39. Kelly P. Stereotactic Biopsy and Resection of Thalamic Astrocytomas. Neurosurgery.
1989;25(2):185-195.
40. Khalsa S, Mayhew SD, Chechlacz M, Bagary M, Bagshaw AP (2014), The structural
and functional connectivity of the posterior cingulate cortex: Comparison between
deterministic and probabilistic tractography for the investigation of structure-function
relationships. NeuroImage 102(Pt 1):118-127.
41. Kis D, Máté A, Kincses ZT, Vörös E, Barzó P (2014), The role of probabilistic
tractography in the surgical treatment of thalamic gliomas. Neurosurgery 10(Suppl
2):262-272.
42. Kovanlikaya I, Firat Z, Kovanlikaya A, Uluğ AM, Cihangiroglu MM, John M, Bingol
CA, Ture U (2011), Assessment of the corticospinal tract alterations before and after
resection of brainstem lesions using Diffusion Tensor Imaging (DTI) and tractography
at 3T. Eur J Radiol 77(3):383-391.
43. Krouwer HGJ, Prados MD. Infiltrative Astrocytomas of the Thalamus. J Neurosurg.
1995;82(4).
44. Lui YW, Law M, Chacko-Mathew J, Babb JS, Tuvia K, Allen JC, Zagzag D, Johnson
G (2007), Brainstem corticospinal tract diffusion tensor imaging in patients with
primary posterior fossa neoplasms stratified by tumor type: A study of association with
motor weakness and outcome. Neurosurgery 61(6):1199-1207.
45. McNab JA, Edlow BL, Witzel T, Huang SY, Bhat H, Heberlein K, Feiweier T, Liu K,
Keil B, Cohen-Adad J, Tisdall MD, Folkerth RD, Kinney HC, Wald LL (2013), The

39
Human Connectome Project and beyond: initial applications of 300 mT/m gradients.
NeuroImage 15(80):234-245.
46. Mori S, van Zijl PCM. Fiber tracking: principles and strategies - a technical review.
NMR Biomed. 2002;15(7-8).
47. Mukherjee P, Berman JI, Chung SW, Hess CP, Henry RG. Diffusion tensor MR
imaging and fiber tractography: Theoretic underpinnings. Am J Neuroradiol.
2008;29(4):632-641.
48. Moshel YA, Elliott RE, Monoky DJ, Wisoff JH. Role of diffusion tensor imaging in
resection of thalamic juvenile pilocytic astrocytoma Clinical article. Journal of
Neurosurgery-Pediatrics. 2009;4(6).
49. Nagae-Poetscher LM, Jiang H, Wakana S, Golay X, van Zijl PC, Mori S (2004), High-
resolution diffusion tensor imaging of the brainstem at 3 T. AJNR Am J Neuroradiol
25(8):1325-1330.
50. Naidich TP, Duvernoy HM, Delman BM, Sorensen AG, Kollias SS, Haacke EM
(2009), Duvernoy's Atlas of the Human Brainstem and Cerebellum. Vienna: Springer-
Verlag.
51. Newton JM, Ward NS, Parker GJ, Deichmann R, Alexander DC, Friston KJ,
Frackowiak RS (2006), Non-invasive mapping of corticofugal fibres from multiple
motor areas--relevance to stroke recovery. Brain 129(7):1844-1858.
52. Nishio S, Morioka T, Suzuki S, Takeshita I, Fukui M. Thalamic gliomas: A
clinicopathologic analysis of 20 cases with reference to patient age. Acta Neurochir.
1997;139(4).
53. Ozek MM, Ture U. Surgical approach to thalamic tumors. Childs Nervous System.
2002;18(8).
54. Patenaude B, Smith SM, Kennedy D, Jenkinson M. (2011), A Bayesian model of shape
and appearance for subcortical brain. NeuroImage, 56(3):907-922.
55. Pelzer EA, Hintzen A, Goldau M, von Cramon DY, Timmermann L, Tittgemeyer M
(2013), Cerebellar networks with basal ganglia: Feasibility for tracking cerebello-
pallidal and subthalamo-cerebellar projections in the human brain. Eur J Neurosci
38(8):3106-3114.
56. Phillips NS, Sanford RA, Helton KJ, Boop FA, Zou P, Tekautz T, Gajjar A, Ogg RJ
(2005), Diffusion tensor imaging of intraaxial tumors at the cervicomedullary and
pontomedullary junctions. Report of two cases. J Neurosurg 103(6 Suppl):557-562.

40
57. Pouratian N, Zheng Z, Bari AA, Behnke E, Elias WJ, Desalles AA (2011), Multi-
institutional evaluation of deep brain stimulation targeting using probabilistic
connectivity-based thalamic segmentation. J Neurosurg 115(5):995-1004.
58. Prabhu SP, Ng S, Vajapeyam S, Kieran MW, Pollack IF, Geyer R, Haas-Kogan D,
Boyett JM, Kun L, Poussaint TY (2011), DTI assessment of the brainstem white matter
tracts in pediatric BSG before and after therapy: A report from the Pediatric Brain
Tumor Consortium. Childs Nerv Syst 27(1):11-18.
59. Prats-Galino A, Soria G, de Notaris M, Puig J, Pedraza S (2012), Functional anatomy
of subcortical circuits issuing from or integrating at the human brainstem. Clin
Neurophysiol 123(1):4-12.
60. Ramnani N, Behrens TEJ, Johansen-Berg H, Richter MC, Pinsk MA, Andersson JL,
Rudebeck P, Ciccarelli O, Richter W, Thompson AJ, Gross CG, Robson MD, Kastner
S, Matthews PM (2006), The evolution of prefrontal inputs to the cortico-pontine
system: Diffusion imaging evidence from Macaque monkeys and humans. Cereb
Cortex 16(6):811-818.
61. Rorden C, Karnath HO, Bonilha L (2007), Improving lesion-symptom mapping. J Cogn
Neurosci 19(7):1081-1088.
62. Salamon N, Sicotte N, Alger J, Shattuck D, Perlman S, Sinha U, Schultze-Haakh H,
Salamon G (2005), Analysis of the brain-stem white-matter tracts with diffusion tensor
imaging. Neuroradiology 47(12):895-902.
63. Sammartino F, Krishna V, King NK, Lozano AM, Schwartz ML, Huang Y, Hodaie M
(2016), Tractography-based ventral intermediate nucleus targeting: Novel
methodology and intraoperative validation. Mov Disord 31(8):1217-1225.
64. Smith SM (2002), Fast robust automated brain extraction. Hum Brain Mapp 17(3):143-
155.
65. Smith SM, Jenkinson M, Woolrich MW, Beckmann CF, Behrens TEJ, Johansen-Berg
H,Bannister PR, De Luca M, Drobnjak I, Flitney DE, Niazy RK, Saunders J, Vickers
J, Zhang Y, De Stefano N, Brady JM, Matthews PM (2004), Advances in functional
and structural MR image analysis and implementation as FSL. NeuroImage
23(S1):208-219.
66. Soria G, De Notaris M, Tudela R, Blasco G, Puig J, Planas AM, Pedraza S, Prats-Galino
A (2011), Improved assessment of ex vivo brainstem neuroanatomy with high-
resolution MRI and DTI at 7 Tesla. Anat Rec 294(6):1035-1044.
41
67. Steiger HJ, Gotz C, Schmid-Elsaesser R, Stummer W. Thalamic astrocytomas: Surgical
anatomy and results of a pilot series using maximum microsurgical removal. Acta
Neurochir. 2000;142(12).
68. Stieltjes B, Kaufmann WE, van Zijl PC, Fredericksen K, Pearlson GD, Solaiyappan M,
Mori S (2001), Diffusion tensor imaging and axonal tracking in the human brainstem.
NeuroImage 14(3):723-735.
69. Traynor C, Heckemann RA, Hammers A, et al. Reproducibility of thalamic
segmentation based on probabilistic tractography. Neuroimage. 2010;52(1).
70. Ulrich NH, Kockro RA, Bellut D, Amaxopoulou C, Bozinov O, Burkhardt JK,
Sarnthein J, Kollias SS, Bertalanffy H (2014), Brainstem cavernoma surgery with the
support of pre- and postoperative diffusion tensor imaging: Initial experiences and
clinical course of 23 patients. Neurosurg Rev 37(3):481-491.
71. Upadhyay J, Knudsen J, Anderson J, Becerra L, Borsook D (2008), Noninvasive
mapping of human trigeminal brainstem pathways. Magn Reson Med 60(5):1037-1046.
72. Wakana S, Jiang H, Nagae-Poetscher LM, van Zijl PC, Mori S (2004), Fiber tract-based
atlas of human white matter anatomy. Radiology 230(1):77-87.
73. Witwer B, Moftakhar R, Hasan K, et al. Diffusion-tensor imaging of white matter tracts
in patients with cerebral neoplasm. J Neurosurg. 2002;97(3):568-575.
74. Woolrich MW, Jbabdi S, Patenaude B, Chappell M, Makni S, Behrens TEJ, Beckmann
C, Jenkinson M, Smith SM (2009), Bayesian analysis of neuroimaging data in FSL.
NeuroImage 45(1 Suppl):S173-186.
75. Yasargil MG. Neuropathology. In: Microneurosurgery vol. 3B. Vol 3B. Georg Thieme
Verlag; 1994:115-192.
76. Yeo SS, Chang PH, Jang SH (2013), The ascending reticular activating system from
pontine reticular formation to the thalamus in the human brain. Front Hum Neurosci
7:Article 416. doi: 10.3389/fnhum.2013.00416.