the role of sectoral growth patterns in labor market...
TRANSCRIPT

BACKGROUND PAPER FOR THE
WORLD DEVELOPMENT REPORT 2013
The Role of Sectoral Growth Patterns in Labor Market Development
Francisco Javier Arias-Vazquez
Jean N. Lee
David Newhouse

Acknowledgments
This is a background paper for the 2013 World Development Report on Jobs. The authors would
like to thank Arup Banerji, Kathleen Beegle, Samuel Freije, David Robalino and seminar
participants in Washington DC and the East Asia and Pacific region for helpful comments and
suggestions, as well as Claudio Montenegro and his team for compiling and providing the data.
The views expressed in this paper are those of the authors and do not necessarily reflect those of
the World Bank, its Board of Directors, or the countries they represent.
Abstract
This paper investigates the relationship between sectoral growth patterns and employment
outcomes both across and within countries. Consistent with the literature on sectoral growth
patterns and poverty alleviation, a broad cross-country analysis reveals that in middle-income
countries, employment responds more to growth in less productive and more labor-intensive
sectors. Employment in middle-income countries is susceptible to a resource curse, and grows
rapidly in response to manufacturing and export manufacturing growth. Sectoral growth patterns
have surprisingly few discernible effects on the prevalence of wage or agricultural employment.
In country case studies of Brazil, Indonesia, and Mexico, the effects of different sectoral growth
patterns are context dependent. Within these countries, differences in sectoral growth effects on
employment and wages are substantially reduced in states or provinces with higher measured
labor mobility. Consistent with this, aggregate employment and wage effects of growth by
sector are close to uniform when examined over longer time horizons, after labor has an
opportunity to adjust across sectors. The results reinforce the importance of growth in more
labor-intensive sectors and manufacturing in generating employment in middle-income countries,
although only manufacturing and natural resource growth show distinctive labor market effects,
and those are largely limited to employment and unemployment. Finally, job mobility may be an
important mechanism to diffuse the benefits of capital-intensive growth.
JEL codes: O11, J20
Keywords: Economic Growth, Production Structure, Employment, Unemployment, Productivity

- 1 -
Introduction
Developing countries are typically characterized by large and persistent productivity and
earnings differences across sectors, with large numbers of workers toiling in low-productivity
jobs in agriculture or small-scale trading. The reallocation of these workers into more productive
employment plays a critical role in increasing productivity, promoting living standards, and
ultimately lifting people out of poverty. This is consistent with the longstanding view that long-
term improvement in incomes and reductions in income inequality require a structural
transformation out of agriculture into more productive sectors, where wages are higher (Lewis,
1954; Chenery and Syrquin, 1975; Foster and Rosenzweig, 2007).
Because the reallocation of workers to more productive sectors is necessary for development,
both researchers and policymakers are often keenly interested in the implications of different
patterns of sectoral growth. Most discussion, based on the East Asian experience, focuses on the
importance of export-oriented manufacturing growth as an engine of employment and
productivity growth (Balassa, 1978; Amiti and Freund, 2010). This focus is at least partially
consistent with a recent study, based on 55 countries, which finds that growth in agriculture,
construction, and notably manufacturing lead to the most rapid poverty reduction (Loayza and
Raddatz, 2010). In this case, growth in sectors where the poor can easily be employed appears to
benefit them most.
Other studies, however, have emphasized the implications of growth in other economic sectors,
such as natural resources (Sachs and Warner, 1995; Sachs and Warner, 1999; Robinson et al,
2006). McMillan and Rodrik (2012), for example, consider 38 countries, 25 of which are low or
middle-income, and find evidence for a ―natural resource curse‖ reflected in employment
patterns in these countries. Countries with a higher share of exports in natural resources were
more likely to experience growth-reducing changes in labor allocation across sectors, because
the high productivity resource sector was unable to absorb large amounts of labor. This is
consistent with the results from two natural experiments, one following an increase in demand
for coca paste in rural Columbia and the other following the discovery of oil fields in Brazil, that
also suggest that natural resource booms lead to disappointing employment and growth
outcomes.1
Another study finds evidence for important increases in civil conflict in oil
producing regions of Colombia as oil prices rise, and further relates the ramifications of
commodity price shocks for political stability to the labor intensity and employment effects of
increased production, studying price shocks to oil, coal, gold, coffee, bananas, sugar, palm and
tobacco (Dube and Vargas, forthcoming). Nonetheless, a recent thorough review highlights the
paucity of evidence from panel-data and quasi-experimental studies on the economic effects of
the resource curse.2
Yet another strand of the literature has stressed the role of agricultural growth in promoting
structural change and reducing poverty (Sadoulet and de Janvry, 2010; Christiaenson et al, 2011).
One study, for example, reports the results of model simulations in which growth in agricultural
productivity hastens industrialization and is therefore central to development.3 A subsequent
1 Angrist and Kugler (2008), and Caselli and Michaels (2009).
2 Van Der Ploeg (2011), Haggblade et al (2002), Headey et al (2010), and Lanjouw and Lanjouw (2001). See also
Ferreira et al (2010) for evidence on service sector growth and poverty reduction in Brazil. 3 Gollin, et al (2002).

- 2 -
study, however, suggests that agricultural growth may be less important than non-agricultural
growth in low-income settings, and others emphasize the importance of the growth of non-farm
industries for poverty reduction even in rural areas. 4 Empirical evidence from China, India, and
Indonesia indicates that agricultural growth has strong effects on poverty reduction in some
contexts (Ravallion and Chen, 2007; Ravallion and Datt, 1996; Suryahadi et al, 2010).
In short, the published evidence on sectoral growth and poverty generally agrees that growth in
labor-intensive sectors such as manufacturing, construction, and agriculture may most benefit the
poor, while natural resource growth fails to spur productivity increases for the majority of
workers. However, this evidence varies considerably in different contexts and is far from
definitive, and the literature demonstrates no clear consensus on the role of sectoral growth
patterns in improving labor market outcomes and thus reducing poverty. The lack of clear
evidence on the link between growth and employment patterns is surprising, given the strong
interlinkage between employment status and poverty.5 Policymakers’ perceptions regarding
sectoral growth patterns and employment can have important implications for growth strategies
as well as policies towards trade, exchange rates, and industrial development.
This paper brings new evidence to bear on how changes in labor market outcomes, such as
employment rates, unemployment rates, wages, and wage and non-agricultural employment,
productivity, vary with sectoral growth patterns. We focus on whether growth in low
productivity sectors or higher-productivity sectors generates greater growth in wages and
employment. While broad labor market indicators such as employment are of interest in their
own right, more specific indicators such as wages, productivity, and types of employment are
closely related to poverty and economic development, but unfortunately less frequently observed
or analyzed. This analysis takes advantage of the wealth of labor market data available in the
World Bank’s International Income Distribution Database (I2D2) and in several country-specific
labor market surveys to include these more specific indicators in our empirical exploration of the
employment consequences of sector-specific growth.6
We begin with a cross-country analysis in which these data are combined with UN country-level
data on growth in seven sectors to estimate the impact of growth in different sectors on
employment growth, wage growth and productivity growth. The resulting database of growth
patterns and labor market outcomes includes 184 surveys in 81 countries.
The cross-country analysis is supplemented with three country case studies from Brazil,
Indonesia and Mexico. These case studies utilize annual and retrospective data from labor force
and household surveys, and use state- and province-level variation in sectoral growth rates to
identify the relationship between sectoral growth rates and labor market outcomes. A unique
feature of these three countries is the availability of panel data on workers, which allows us to
examine how the effect of different sectoral growth patterns is mediated by workers’ mobility
across jobs.
When looking across countries at the short-run effects of sectoral growth, growth in less
productive sectors, compared to more productive sectors, increases employment and reduces
4 Alvarez–Cuadrado and Poschke (2011).
5 See Gutierrez et al (2007).
6 For more information on an earlier version of the I2D2 database, see Montenegro and Hirn (2009).
- 3 -
unemployment. Growth in mining and utilities, in contrast, is associated with increased
unemployment and reduced employment, providing some empirical support to the notion of a
―resource curse‖ in employment outcomes. Meanwhile, manufacturing growth is associated with
a substantial increase in employment and decline in unemployment among middle-income
countries. Sectoral growth has surprisingly few noticeable impacts on other job characteristics
that are important indicators of economic development, such as earnings, sectoral productivity,
and the structural transformation out of agriculture and into wage employment. The analysis,
however, lacks sufficient statistical power to rule out potentially large effects of sectoral growth
patterns on these indicators.
The within-country analyses of recent growth patterns in Brazil, Indonesia and Mexico do not
conform to this or any other consistent pattern. In Brazil, employment outcomes are comparable
for high and low productivity sector growth. In Indonesia, in contrast, high productivity sector
growth reduces employment effects and increases wage growth. In Mexico, growth high
productivity sectors are associated with stronger employment growth, but, if anything, slower
growth in wages and labor productivity.
At the one digit level, employment rises with manufacturing growth in Brazil and Mexico, which
is in line with the cross-country finding that manufacturing growth increases employment in
middle-income countries. The Indonesian data also show some evidence of a type of ―resource
curse‖, as mining growth is associated with statistically significantly slower employment and
wage growth. In general, however, growth patterns at the 1-digit sector level fail to show a
consistent pattern across the three countries. Employment is boosted more by agriculture growth
in Indonesia and financial sector growth in Mexico. Meanwhile, wage increases are associated
with growth in manufacturing in Indonesia, but growth in the public and financial sectors and in
Mexico.
In analyses of growth over longer periods using census data from these countries, we find little
evidence for differential employment or wage effects of growth across sectors over longer
horizons, when technologies and labor markets have an opportunity to adjust, with strikingly
similar point estimates on agriculture, industry and services growth. Consistent with this
differential between short- and long-run effects, we find that higher measured labor mobility
strongly attenuates the differences between the growth effects of high and low productivity
sectors in all three countries in our shorter-run analyses.7
Overall, the results confirm some commonly held preconceptions, while challenging others. In
middle income countries, less productive sectors are more effective in increasing employment,
manufacturing growth increases employment and reduces unemployment, and natural resource
growth does the opposite. However, there is a notable lack of evidence that growth patterns
affect wages, wage employment, non-agricultural employment, and productivity, although most
of these estimated effects are admittedly imprecise and cannot rule out large effects.
Agricultural growth also has surprisingly minor effects on aggregate labor market outcomes,
even in low-income countries. Finally, the differential effects of sectoral growth are likely to be
more significant over the shorter run, when labor is relatively immobile. The results suggest that
7 Our result supports the notion that as in Topalova (2008), differential labor market mobility may affect the
distributional implications of growth patterns.

- 4 -
it may be appropriate for longer run employment generation and poverty reduction strategies to
maximize overall growth, rather than prioritizing growth in specific sectors.
In the next section we describe the data and provide summary statistics and background
information about the Brazilian, Indonesian and Mexican economies and labor market structures.
Section 3 describes the empirical methods. In section 4, we examine labor market outcomes and
how they respond to year-on-year shocks to sectoral growth rates, in both the cross-section and
the three countries. In section 4, we also discuss sectors that often receive special attention in
both the literature and popular discussion, such as agriculture, export manufacturing, and mining
and natural resource extraction. In section 5, we focus exclusively on the three case studies and
examine the role of labor mobility and longer-term estimates of sectoral growth impacts. Section
6 concludes.
Data and Background
To relate sectoral growth patterns to labor market outcomes, we first obtained information on
GDP by sector at the national level from the United Nations. The UN GDP data are
disaggregated according to the following sectors: agriculture, hunting, forestry, and fishing
(ISIC A-B); mining, manufacturing and utilities (ISIC C-E), manufacturing (ISIC D);
construction (ISIC F); wholesale, retail trade, restaurants and hotels (ISIC G-H); transport,
storage and communication (ISIC I); and other activities (ISIC J-P).8 We also use information
on GDP by sector and state or province from Mexico, Indonesia, and Brazil. These cover most
of the following sectors in each country: agriculture, mining, construction, electricity,
manufacturing, retail trade, transport and communication, finance and business services, social
services, other services and the public sector. Data on manufacturing exports come from the
World Bank’s World Development Indicators database, and data on labor regulation from the
World Bank’s Doing Business indicators database.
For information on labor market outcomes at the country level, we turn to the standardized
survey data included in the World Bank’s International Income Distribution Database (I2D2).
For the within-country analyses of annual growth and changes in employment outcomes, we
primarily use data from Brazil’s Monthly Employment Survey (PME) from 2003 to 2009; the
1997, 2000, and 2007 waves of the Indonesia Family Life Survey (IFLS); and the Mexican
National Survey of Occupation and Employment (ENOE) from 2005 to 2010 to measure changes
in labor market outcomes. Brazil’s Monthly Employment Survey (PME) is a rotating panel
survey, but it only covers major urban areas in six states of Brazil, making it the most limited in
scope of the country-level data sources we use. We therefore supplement the PME with
information from 2003 to 2009 from the Pesquisa Nacional por Amostra de Domicilios (PNAD),
which is conducted annually and broader in geographical coverage, but is not a panel survey.9
Unlike in Brazil, the Mexican labor force survey (ENOE) is representative of all 32 states,
includes a quarterly rotating panel of survey respondents, and is a rotating panel. We use the
first and last interview quarters for each individual to capture annual changes in employment
8 For the purposes of our analysis, we separate mining and utilities (ISIC C and E) from manufacturing (ISIC D).
9 We use aggregates at the state and sector level to generate estimates of average wage and productivity growth from
the PNAD.

- 5 -
status. Finally, the Indonesian estimates are obtained from the Indonesia Family Life Survey
(IFLS), which sampled households from 13 provinces representing 83 percent of the population
in its initial round in 1993. Unlike the Brazilian and Mexican data, the IFLS is not a rotating
panel and more than 90 percent of the original households were successfully re-contacted in
1997, 2000, and 2007. The survey also tracks movers, and obtains a complete retrospective
labor market history spanning from 1988 to 2007.10
For some outcomes, specifically to
distinguish between unemployment and nonparticipation in the labor force, we supplement this
with information from the National Labour Force Survey for Indonesia (SAKERNAS).
While these household surveys are valuable, largely because they are longitudinal, they do not
allow us to examine how sectoral growth patterns relate to labor market changes in the long run.
We therefore supplement the analysis using public use census microdata samples for Brazil in
1960, 1970, 1980, 1990 and 2000; for Indonesia in 1971, 1980, 1990, 2000 and 2010; and for
Mexico in 1990, 2000 and 2010. In these longer-run analyses, we are constrained by the
availability of sectoral GDP data at the sub-national level to analyze the three broad sectors of
agriculture, services and industry. Workers are matched to state- or province-specific data on
sectoral gross domestic product (GDP) from national statistical offices, based on their state or
province of residence.
Using each of these outcome datasets, we construct five main measures of workers’ labor market
outcomes: Whether they are employed, unemployed, or out of the labor force, their log wage,
and the sector’s log productivity (value added per worker) in the sector of employment. For the
cross-country analysis, this is also supplemented with an analysis of wage employment and non-
agricultural employment.
Based on average labor productivity estimates from these data, industries are characterized as
being ―high productivity‖ if they fall in the following set: manufacturing, transport and
communications, finance, electricity and utilities, or mining. We group the following industries
into the ―low productivity‖ set: other services, agriculture, retail and wholesale trade,
government and public administration, and construction. This classification was based on the
ranking of sectors according to their productivity.
The annual panel data cover periods in Indonesia and Mexico including two recent major
recessions: the Indonesian financial crisis of 1997-1998, and the more recent recession in Mexico
following the global financial crisis, beginning in 2008-2009. During both of these recessions,
industrial growth was hit the hardest: industrial growth declines disproportionately in Indonesia
in 1997 and never recovered to pre-crisis levels, and declines more than agricultural and service
sector growth in Mexico during the more recent recession there
Labor market mobility, as evidenced by transitions across sectors and transitions out of
unemployment, is very high in Mexico, with roughly one in six workers moving sectors in any
given year. Labor market transitions reported in the Indonesian data are markedly less frequent,
occurring for up to 9 percent of workers in any given sector, although changes in industry may
be underreported in these retrospective data. Labor market transitions are also very common in
Brazil’s PME, with approximately 1 in 5 workers moving sectors within a year, although this
10
Note that wage data are only available through 2000.

- 6 -
number only reflects the rate of transitions for urban workers. Mexico and Brazil’s higher labor
market mobility relative to Indonesia, if not an artifact of the nature of the data, may perhaps be
related to their much more diverse economic structures. Indonesia’s economy in 2007 was more
heavily agricultural than that of the other two countries, with 33 percent of workers employed in
agriculture, one of the sectors with the lowest labor productivity, relative to Mexico’s 13.5
percent share.
Empirical Methods
In our cross-country analysis, countries are observed in different years and at disparate intervals,
and we therefore follow Loayza and Raddatz (2010) in calculating annualized growth rates in
employment outcomes and in sector-specific GDP over these intervals. We also weight sectoral
growth by GDP share. Besides adjusting for the size of different sectors in the economy, this
allows for tests of the equality of coefficients across sectors, as in Loayza and Raddatz (2010)
and Ravallion and Chen (2007). As noted in those papers, the case in which the coefficients on
different share-weighted sectors are statistically indistinguishable corresponds to the case that
only overall growth matters and the sectoral composition of growth does not.
We regress these annualized changes in employment outcomes on share weighted GDP by sector:
(1)
where is the annualized change of an employment outcome in country c at period t, is
the GDP share of sector k in country c at period t, and is the growth rate of output in sector
k in country c at period t. We test for significant effects of growth composition on employment
outcomes by testing equality of through .
Unlike Loayza and Raddatz (2010), we are initially interested in the effects of shorter-run growth
on employment outcomes, to keep estimates comparable to those using annual growth and
individual-level panel data for Brazil, Indonesia and Mexico. Therefore, the analysis uses every
interval in which growth and changes in employment outcomes are observed to estimate the
relationship between sectoral growth patterns and employment outcomes. Because there are
multiple observations per country, we cluster standard errors at the country level.
We then restrict the coefficients to be equal among high and among low productivity sectors, and
estimate the following variant of equation (1):
(2)
To test for differences in effects of growth of high and low productivity sectors, we test for
equality of and .
Export-led manufacturing growth may have distinctive effects on labor markets. To test for this,
in the cross-country data, we simply regress growth in employment outcomes on total GDP
growth and growth in export manufacturing:

- 7 -
(3)
The specifications for the country-specific analysis using panel data for Brazil, Indonesia, and
Mexico are similar in spirit to the cross-country analysis. Where possible, the specifications
include individual-level fixed effects to empirically assess the relationship between sectoral
growth patterns and changes in employment status. Individual fixed effects, rather than state or
province-level dummies, are included to improve efficiency, as they affect consistency only in
the Indonesian case.11
We estimate the following specification:
(4)
where is employment outcome for person i in region (state or province) r at time t, is
the GDP share of sector k in region r at time t, and is output in sector k in region r at time t,
and is an individual fixed effect.
In practice, as we have an initial and final observation for each individual in the panel data, we
estimate this equation in first differences:
(5)
Then, as with the cross-country data, we restrict coefficients to be equal among high productivity
sectors and among low productivity sectors, and test for differences in effects of high and low
productivity sector growth12
:
(6)
The impact of sectoral growth patterns may depend on worker mobility between jobs. To assess
this, we construct state- or province-level measures of labor mobility in Brazil, Indonesia, and
Mexico, using the individual-level panel data on industry of employment. Our primary measure
is the average share of individuals in a state who change industries within one year. We also use
the occupational information to construct an alternative measure of labor mobility: the share of
individuals in a state who change occupations within a year. The results are largely robust to use
of this alternative measure.
For each country, to test whether the differential between the effects of high and low productivity
growth changes with flexibility in the labor market, we regress changes in labor market
outcomes on the share weighted growth rates of high and low productivity sectors, interacted
with these labor mobility measures:
(7)
where is the measure of average labor mobility at the state or province level.
11
This is because only the Indonesian data tracks interprovincial migrants. 12
For the specifications described above, we also test for robustness to the inclusion of country-, state- or province-
specific trends.

- 8 -
We attempt to conduct an analogous test in the cross-country data. Because empirical
information on labor market transitions are not available for a broad set of countries, we use
measures of labor regulation from the Doing Business database, despite the inconclusive
evidence on the link between labor regulations and job mobility.13
(8)
Finally, we turn to census data for Brazil, Indonesia and Mexico to assess the longer run effects
of sectoral growth patterns on employment outcomes. We estimate:
(9)
where are state or province fixed effects and are year effects and sectors include agriculture,
services and industry.
Sectoral growth impacts on employment
High and low productivity sector growth
Is growth in high or low-productivity sectors more strongly associated with employment creation?
Before addressing this question, we first put changes in employment and unemployment into
context by comparing how they evolve with per capita GDP. Figure 1a shows a smoothed
average of countries’ employment to population ratio at different levels of per capita GDP. For
low-income countries, employment falls rapidly as per capita GDP increases, as a larger share of
the population can afford to exit the labor force. This fall is dramatic, from about two thirds of
the population for the poorest countries, to a low of about half for lower middle-income countries,
at about $2000 per capita. Employment then gradually rises, to about 60 percent for the richest
countries. Figure 1b tells a similar story in reverse. Average unemployment rates start at about
12 percent and rise to just over 15 percent, as more workers can afford to search, before falling
again to 15 percent. These figures illustrate two key points. First, for low-income countries,
employment declines and unemployment increases may arguably be a welcome sign of economic
growth and development. Secondly, even a relatively small employment increase or
unemployment decline, on the order of one half to one percentage point, constitutes an important
employment improvement in middle and high-income countries.
Although the interpretation of employment changes depends heavily on the country’s level of
development, we begin first by presenting aggregate results in Table 2. These are taken from
13
For example, Kugler (2004) and Saavedra and Torrero (2004) found that loosening employment protection
legislation led to a moderate increase in job separations and hiring in Colombia and Peru, but Paes de Barros and
Corseuil (2004) and Petrin and Sivadasan (2006) find little evidence that increased regulations decreased mobility in
Brazil or Chile.

- 9 -
Equation (2), which estimates how annualized growth rates of employment relate to share-
weighted sectoral growth rates. They show moderate differences in the effects of high and low
productivity sector growth on employment and unemployment. In a sample of 81 countries with
matched growth and employment outcome data, low productivity growth appears to be
associated with significantly faster growth in employment and reductions in unemployment
relative to high productivity growth. However, if anything, high productivity growth may be
associated with faster wage and labor productivity growth, although the differences are not
statistically significant.
In terms of magnitudes, a one percentage point increase in overall GDP due to high-productivity
sectors raises employment, as a share of the population, by 0.2 percentage points (significant at
the 5 percent level), while low productivity growth is associated with an increase of 0.08
percentage points (not statistically different from zero), and the difference (
is marginally statistically significant at the 10 percent level (test p-value = 0.075). This
suggests that on average, low productivity growth leads to faster employment growth than does
high productivity growth. Similarly, low productivity sector growth appears to be associated
with faster declines in unemployment. High productivity growth is associated with a coefficient
of 0.067, meaning that a one percentage point increase in GDP growth due to the productive
sectors is associated with a roughly 0.07 percentage point increase in the unemployment rate.
Meanwhile, a comparable increase in the growth of low-productivity sectors is associated with a
reduction of 0.16 percentage points (significant at the 1 percent level). The difference ( is significant at the 5 percent level (test p-value = 0.021). With respect to
inactivity, growth in more productive sectors may marginally raise the share of population that
is out of the labor force, with a point estimate of 0.149, but the difference in coefficients for high
and low productivity growth is not significant ( . In contrast to these
results on employment growth, it appears that if anything, high productivity sector growth may
lead to faster wage and labor productivity growth relative to low productivity sector growth,
although the coefficients are imprecisely estimated and the differences between coefficients are
not statistically significant.14
As noted above, the interpretation of employment and unemployment changes depend on
countries’ stage of development, as declines in employment and increases in unemployment
often reflect economic growth in low-income countries. Figures 2, 3 and 4 show how the
estimated effects of growth in high and low productivity sectors vary according to countries’ per
capita GDP. For low-income countries, high-productivity sectors are associated with a slightly
greater reduction in employment, but differences with less productive sectors is not statistically
significant, as the top dashed blue line in figure 2 exceeds the lower dashed red line. The bigger
story, however, is the positive effect of low-productivity growth on employment for middle-
income countries, particularly those in the $2000 to $10,000 range. Here, a 1 percent increase in
aggregate growth due to more productive sectors is associated with an increase in employment of
half a percentage point, while growth in more productive sectors is associated with a slight
14
In specifications allowing for country-specific growth rates, we similarly find point estimates that suggest that
growth in lower productivity sectors differentially reduces unemployment. These estimates, however, suggest that
this reduction in unemployment may largely come from increases in dropout from the labor force, and that growth in
higher productivity sectors significantly increases non-agricultural employment relative to growth in lower
productivity sectors.

- 10 -
decline. The unemployment results also show a beneficial effect of less productive sectors in
middle-income countries. For low income countries, growth in more productive sectors is
associated with a slightly greater increase in unemployment, but the differences with less
productive sectors are relatively minor. Estimated impacts on unemployment start to diverge at
just under $2000 per capita, as growth in less productive sectors begins to have a substantial
negative and statistically significant effect; at its peak, a one percentage point increase in growth
due to less productive sectors lowers unemployment rates by half a percentage point. To sum up,
employment and unemployment in middle-income countries responds favorably to growth in less
productive, more labor-intensive, sectors.
Turning to our case study countries of Brazil, Indonesia and Mexico, we find that the effects of
high and low productivity sector growth are not uniform across contexts, and may potentially
differ based on institutional factors or structural features of the labor market. Within Brazil,
unlike the cross-country analysis, the effects of high and low productivity sector growth on
employment and unemployment are broadly similar. High productivity sector growth is
associated with weakly positive effects on employment growth, while low productivity sector
growth is associated with weakly negative effects on employment growth. The difference
between coefficients, however, is not statistically significant (test p-value = 0.384). A one
percentage point increase in aggregate GDP due to high-productivity sectors is associated with a
tiny 0.03 percentage point reduction in unemployment, though the estimate is precise (significant
at the 1 percent level). Low productivity growth is associated with an even weaker 0.02
percentage point reduction in the unemployment rate, and the difference between high
productivity and low productivity coefficients is not statistically distinguishable from zero (test
p-value = 0.274). High productivity growth and low productivity growth are also
indistinguishable in their effects on growth or reductions in the share of the population that is out
of the labor force (test p-value = 0.526).
One caveat is that for these three outcomes in Brazil, we use data from the PME, which is only
representative of urban workers in six states. We therefore supplement the PME with data from
the PNAD, which is a nationally representative household survey, to estimate effects on the
remaining two outcomes. In fact, using the PNAD makes little difference, as the results on high
productivity and low productivity sector growth on log wages and log productivity are
comparable to those from the PME. Both high productivity and low productivity sector growth
are associated with modest increases in wage growth, although both point estimates are
statistically indistinguishable from zero and from each other (test p-value = 0.256). The
estimates of the effects of high productivity and low productivity sector growth on productivity
growth are also strikingly similar in Brazil, with high productivity growth associated with a point
estimate of 0.277 (significant at the 1-percent level) and low productivity growth associated with
a point estimate of 0.254 (also significant at the 1-percent level). Despite the increased precision
due to the use of data from many more provinces, the point estimates are not statistically
different from each other (test p-value = 0.250).
Indonesia is more consistent with the results from the cross-country analysis, as high-
productivity growth appears to be more effective at reducing employment than growth in less
productive sectors. The coefficient on high productivity growth is larger in magnitude (-0.235)
than the coefficient and low productivity growth. Thus, in Indonesia, a one percentage point
increase in GDP growth due to more productive sectors is associated with a 0.2 percentage point

- 11 -
decline in the employment to population ratio. The difference between coefficients is marginally
significant (test p-value = 0.061). Because Indonesia’s per capita GDP was roughly $800 in
2000, it is possible that growth in more productive sectors proved more beneficial to workers by
allowing more to voluntarily exit the labor force.
The wage results also appear to match both the cross-country analysis and are consistent with
beneficial labor market effects from more productive sectors, with the caveat that most of the
wage data is retrospective. Specifically, high productivity growth appears to raise wages more
than low productivity growth in Indonesia. The coefficient on high productivity growth (1.790,
significant at the 1-percent level) suggests that a one percent increase in aggregate GDP
increases wages by 1.8 percent, and is much larger than and statistically distinguishable from the
coefficient on low productivity growth (0.022, not statistically distinguishable from zero), with a
test p-value of 0.010. However, the Indonesian results are heavily influenced by the events of
the 1998 financial crisis, which led simultaneously to a steep decline in higher-productivity
sectors and extraordinary real wage declines on the order of 40 percent. Looking at productivity
growth, which is available for a wider set of years, tells a different story. Low productivity
growth appears to raise labor productivity significantly more than does high productivity growth,
with the difference between coefficients significant at the 5 percent level.
Turning to Mexico, estimates of the impacts of high and low productivity growth also suggest
much larger effects of high productivity sector growth in that context. A 1 percent increase in
growth due to high productivity sectors is associated with employment growth that is faster by
0.25 percent (coefficient significant at the 1 percent level), while a 1 percent increase in growth
due to low productivity sectors is associated with employment growth that is faster by only 0.07
percent (not statistically different from zero). The difference between coefficients, however, is
not statistically different from zero (test p-value = 0.135). Unemployment rates also appear to
drop more with high productivity sector growth ( , significant at the 1 percent
level) than with low productivity sector growth ( , not statistically distinguishable
from zero). Results on the likelihood of being out of the labor force look very similar to those
for unemployment, with growth in high productivity sectors leading to much larger declines in
the likelihood of being out of the labor force ( , significant at the 1 percent level)
than growth in low productivity sectors ( , not statistically distinguishable from
zero), but again, the coefficients are not statistically different from each other (test p-value =
0.267).
In Mexico, the impacts of sectoral growth patterns on wage growth appear small, but as in
Indonesia, low productivity sector growth appears to lead to more rapid increases in average
labor productivity than does high productivity sector growth. Wage impacts of both high and
low productivity sector growth are small and statistically insignificant, as well as
indistinguishable from each other (test p-value = 0.733). The impact of low productivity sector
growth on labor productivity appears large and positive ( , significant at the 1
percent level). The impact of high productivity sector growth on labor productivity also appears
positive, but smaller ( , marginally significant at the 10 percent level). The
difference in coefficients for productivity appears to be significant (test p-value = 0.021).
In sum, the cross-country evidence suggests that growth in low-productivity sectors do more to
increase employment and reduce unemployment, especially in middle-income countries. The

- 12 -
country case studies are less conclusive, however, and suggest caution before generalizing cross-
country patterns to particular contexts. In none of the three cases did low-productivity sectors
clearly have stronger employment or unemployment effects than more productive sectors.
Growth disaggregated at the 1-digit sector level: Agriculture, export-led manufacturing, and
natural resources
The differences in the results between low and high-sector growth, both across and within
countries, suggest that growth in individual sectors may have distinctive effects. We therefore
turn to estimating the effects of growth in more finely disaggregated sectors on employment
outcomes.
In the cross-country data, we use data from the United Nations disaggregated primarily at the 1-
digit sector level to create seven output categories (table 4). In contrast to the literature
emphasizing the special importance of agricultural growth or manufacturing, we find only
evidence for strongly differentially negative effects of growth in mining and utilities on
employment growth.15
Similarly, we find large and significant increases in the unemployment
rate associated with mining and utilities growth in the cross-country analysis.16
Besides mining
and utilities, there is little evidence of other sectors differentially affecting employment
outcomes, except for the anomalous result that growth in ―other‖ industries (largely services) has
more positive effects on wage growth.
The previous section illustrated the importance of disaggregating the average effects presented in
the cross-country regressions, to consider how impacts on employment and unemployment
depend on countries’ level development. In low-income contexts, employment tends to declines
with growth, and open unemployment is typically a poor indicator of labor market health. For
this reason, we estimate impacts separately for each period using locally weighted regressions,
based on countries’ log GDP per capita in 2000, shown in Figures 5-7.17
Each dot represents a
different period for which both changes in GDP by sector and labor market outcomes are
observed. Figures 5a-5c indicate that manufacturing is strongly, significantly and positively
associated with employment in the range of about $3000 or $3500 to just under $20,000, with
effects largest for upper middle-income countries as defined by the World Bank. For these
countries, a 1 percent increase in aggregate growth due to manufacturing is associated with up to
a 1 percent increase in the employment to population ratio and a comparable decline in the
unemployment rate. In contrast, the correlation between natural resource growth and
employment is far more evenly spread among the distribution (Figure 6a). Figure 6b, however,
is suggestive of an unemployment effect even at low levels of GDP, which grows for upper
middle-income countries. There is also suggestive evidence that mining growth may be
associated with increased wages. 15
This result is somewhat sensitive to specification choice. We separately estimate effects of mining and utilities
growth and manufacturing growth by subtracting manufacturing output from the groupings of ISIC C-E (mining,
manufacturing and utilities) provided in the raw data from the United Nations. When using the raw data as provided,
we find a large and strongly positive coefficient of manufacturing growth on employment growth, although the net
effect, adding the coefficients on ISIC C-E and on ISIC-D, manufacturing alone, is much more weakly positive. 16
This result is robust to the inclusion of country or province-specific trends in both the cross-country analysis and
when looking at Indonesia, although in the latter case, in specifications including province-specific trends, the
negative effects of mining growth show up on wages rather than employment. 17
The bandwidth for log per capita GDP in the non-parametric regressions is 1 and the kernel is Gaussian.

- 13 -
In contrast to manufacturing and mining, there is strikingly little evidence of strong effects of
agricultural growth on employment growth or decline at low levels of income, where we would a
priori expect such effects to be most significant (Figure 7a). Agricultural growth does appear to
be associated with reduced unemployment among middle-income countries and surprisingly
increased employment in high income countries. Estimated wage effects at low levels of income
are also surprisingly small in magnitude, though in most cases wages are not defined for many in
agriculture, so this may also reflect changes in the composition of the work force. Regardless,
there is remarkably little evidence that agricultural growth is associated with improved labor
market outcomes for low and lower-middle income countries.
To assess the possibility of a differential impact of export manufacturing on employment and
wages, we combine data on export manufacturing from the World Bank’s World Development
Indicators database, and regress growth in employment outcomes on overall GDP growth and
growth in export manufacturing (table 9). Although export manufacturing does have an
independent effect on employment outcomes, the point estimate is small. Sustained growth over
five years at the 75th
percentile of growth in export manufacturing would correspond to a roughly
one hundred percent change in export manufacturing output, and a 2.8 percentage point increase
in employment rates. Growth in export manufacturing is also associated with a reduction in
unemployment, but is weakly associated with wage growth. It is possible that episodes of
growth in export manufacturing coincide with increases in overall openness to trade, which may
introduce competitive pressures that prevent wages from growing. The non-parametric results
(Figures 8a-8c) generally confirm these results, as effects on employment are generally positive
but small, and there is no particularly strong effect for upper-middle income countries.
Manufacturing exports are associated with reduced unemployment in middle income countries,
but the effects are mild, and there is little effect of wages. Overall, the results suggest that the
strong effects of manufacturing growth on employment and unemployment in middle income
countries are mainly captured in overall growth, and there is little additional benefit from
increasing manufacturing exports.
The evidence from Brazil is also consistent with a mild impact of manufacturing (Table 6).
Although manufacturing is the only sector significantly associated with employment growth, a 1
percent increase in growth from manufacturing growth would lead to only a 0.05 percent
increase in employment growth (point estimate significant at the 5 percent level). For
unemployment, government, transport and communications, and mining growth are all
associated with reductions in unemployment (at the 1 percent, 5 percent, and 10 percent level,
respectively), which the largest effects for growth in government and transportation and
communications. Looking at the point estimates on growth in the share of the population that is
inactive, however, suggests that these effects on unemployment are largely driven by increased
dropout from the labor force. We find no effects of individual sector growth on wage growth
that are statistically significantly different from zero, and find roughly similar effects of growth
in all sectors on growth in average labor productivity, although not all coefficients are
sufficiently precisely estimated to be statistically distinguishable from zero. In sum, although the
hypothesis that the coefficients are equal is rejected, the Brazilian evidence does not suggest
large differential effects between the seven sectors.
Within Indonesia, growth patterns suggest that agriculture growth has a strongly positive effect
on employment growth, while growth in trade and commerce and growth in mining have

- 14 -
significantly negative impacts on employment growth (table 7). 1 percentage point of additional
growth in agriculture is associated with 0.35 percentage points of additional employment growth
(point estimate significant at the 5 percent level), while 1 percentage point of growth from
additional growth in services is associated with a 0.38 percentage point reduction in employment
growth (point estimate marginally significant at the 10 percent level). Consistent with the cross-
country results on a type of ―resource curse‖, 1 additional percentage point of growth from
mining is associated with both a 0.05 percentage point reduction in employment growth
(significant at the 5 percent level) and a 0.12 percentage point reduction in log wage growth
(marginally significant at the 10 percent level). In contrast, manufacturing growth is associated
with large increases in wage growth, as the implied effect of a 1 percentage point increase in
growth due to manufacturing is a 2.5 percent point increase in wages (significant at the 1 percent
level). We can reject equality of effects on employment growth (test p-value = 0.004) and of
effects on wage growth (test p-value = 0.011). Effects of 1-digit sector growth on labor
productivity growth also vary, with the largest and most significant effects coming from growth
in agriculture, trade and commerce, and construction.18
Within Mexico, growth in manufacturing and in finance is associated with significantly faster
employment growth (estimates statistically significant at the 5 percent and 1 percent levels,
respectively, Table 8). The magnitudes of the effects are fairly large, with a 1 percentage point
increase in growth from manufacturing associated with a 0.24 percentage point increase in
employment growth, and a 1 percentage point increase in growth from the financial sector
associated with a 0.39 percentage point increase in employment growth. Only mining growth
and growth in finance are significantly associated with a reduction in the growth of the share of
the population out of the labor force, with a point estimate of 0.239 (significant at the 5 percent
level) for mining and a point estimate of 0.333 (marginally significant at the 10 percent level) for
finance. Faster growth due to growth in government and public administration and from growth
in the financial sector is associated with much faster wage growth in Mexico. Faster productivity
growth appears to follow from growth in agriculture, construction, and manufacturing in Mexico.
Differences among coefficients are significant for only unemployment, wage growth, and
productivity growth.
Overall we find little evidence that agriculture is a leading candidate to improve employment
outcomes and raise wage growth, although in our analysis here we are netting out initial
employment shares in order to test for compositional effects of growth. We do find evidence for
effects of manufacturing growth on wage growth and employment growth in the cross-country
analysis, and in each of the within-country analyses. We also find evidence for a ―resource curse‖
reflected in employment outcomes in both the cross-country data and in Indonesia, although we
find no evidence for such in Brazil or Mexico.
18
In specifications including province-specific trends, growth in all sectors is similarly unemployment-reducing and
has few other statistically significant effects on these outcomes, although as noted earlier, mining growth is
associated with significantly slower wage growth.

- 15 -
Labor market mobility and long run growth effects
The previous sections have described notable differences in sectoral growth patterns and
employment outcomes, particularly with respect to differences between high and low
productivity sectors, as well as growth in manufacturing and natural resources. Motivated by
these findings, we next examine whether the effects of the sectoral composition of growth on
employment outcomes vary with measured labor mobility, or appear to be different over a much
longer time horizon.
Table 10 shows the results of regressions where high and low productivity growth, again
weighted by shares, are interacted with state or province level measures of average annual labor
mobility. The measures of labor mobility are rough, and reflect the share of workers who report
changing industries within one year.
In Brazil, Indonesia and Mexico, differences between the effects of high and low productivity
sector growth on changes in employment outcomes appear to be largest in low-mobility states
and provinces. These differences are greatly mitigated by increases in labor mobility. In
particular, the point estimates on the interactions between sectoral growth and labor mobility
imply that in all three countries, the effects of high and low productivity growth on changes in
employment outcomes are roughly equal that in the most mobile states or provinces. These
effects are most precisely estimated for employment growth and in Mexico. In Brazil, despite
the fact that we are constrained by the coverage of the survey containing individual-level panel
data on employment to only six states, we see similar qualitative patterns.
Although past studies come to conflicting conclusions on the role of regulations in restricting job
mobility, a consensus has emerged that ―employment protection regulations and related laws
reduce gross labor mobility‖ (Freeman, 2010). We therefore examine cross-country data on
labor regulation to see if policy-induced variation in labor mobility also mitigates the differential
effects of sectoral growth. The results, presented in Table 11, give no indication that
improvement in a country’s Doing Business rank attenuates the effect of different sectoral
growth patterns. We attribute this to the limited ability of the Doing Business measures to
capture much of the underlying empirical variation in labor market mobility and flexibility.
Finally, we turn to the census data to estimate the long-run effects of growth composition on
employment outcomes, after labor has an opportunity to adjust across sectors. The data from
Brazil and Indonesia span four decades, from 1960 to 2000 and 1971 to 2010 respectively, while
the Mexican data covers the 20 years from 1990 and 2010, with employment and output data at
approximately 10 year intervals. The magnitudes of the point estimates on growth from
agriculture, services, and industry are strikingly similar over longer horizons in Brazil, Indonesia
and Mexico (Table 12). In the long run, it appears to make little difference whether state or
provincial growth was led by agriculture, industry, or services. We therefore conclude that
differences in the effects of growth in different sectors are largely mitigated by labor mobility.

- 16 -
Conclusion
Broad discussions on how policy can create more and better jobs in developing countries often
spark debate on whether policy should aim to prioritize growth in particular economic sectors.
Indeed, short-run patterns of sectoral growth appear to have disparate impacts on employment,
wage and productivity growth around the developing world. In cross-country regressions,
growth in less productive sectors, such as agriculture, construction, and retail and wholesale
trade and other services, tend to lead to faster employment growth than growth in higher
productivity sectors, such as manufacturing, finance and business services, and mining and
utilities, with particularly noticeable effects for middle-income countries.
At the one digit level, the strongest effects are apparent in natural resources and manufacturing.
Natural resource growth in the cross-country analysis, while contributing to reductions in
employment for low-income countries, appears to harm labor markets in middle-income
countries by reducing employment and increasing unemployment. Manufacturing growth
appears to reduce employment for low-income countries, suggesting that these more productive
jobs allow a greater share of workers to voluntarily exit the labor force. Manufacturing growth
in middle-income countries, unlike natural resource growth, leads to large increases in
employment and reductions in unemployment, both when comparing across countries and across
Mexican and Brazilian states. This suggests that as countries develop, the stakes in the global
competition for growth in labor-intensive sectors, particularly in manufacturing, rise.
In contrast to previous literature, we find little other evidence for special effects of growth in
particular sectors, such as agriculture, on employment and wage growth. While growth in the
financial sector is strongly associated with increased employment and wage growth in Mexico,
there is little evidence for a special role for financial services growth in other contexts.
While growth in low productivity sectors may lead to faster employment growth, the evidence
both within and across countries suggests that lower employment growth may be coupled with
faster wage growth. This suggests that labor market rigidities may play a role in determining the
distributional impacts of growth, both overall and in particular sectors. The specific impacts will
depend on structural and institutional features of the industry as well as local labor markets,
which may not be captured by standard measures of regulation. The varying patterns of sectoral
growth on employment outcomes in the three country case studies of Brazil, Indonesia and
Mexico are also consistent with a trade-off between wages and employment. To the extent that
expansions in employment will differentially benefit the poor relative to increases in wages,
holding employment fixed, we consider our main cross-country results consistent with the
literature emphasizing the importance of labor-intensive (the inverse of productive) growth for
poverty reduction around the world.19
We also find that measured labor mobility significantly attenuates differences in the impacts of
growth composition on employment outcomes, as does examining the longer run. Taken
together, our estimates suggest that in the short-run, and to the extent that wealth is accumulated
19
Relatedly, Gutierrez et al (2007) find that the poverty impacts of employment intensity vary by sector, with
productivity improvements necessary for poverty reduction in agriculture.
- 17 -
in savings and assets over any transition path over the longer-run, differences in the sectoral
composition of growth do have distributional implications, as they differentially bring the
unemployed into the workforce, or raise the wages of those already employed. However, these
differences may be dissipated by higher labor mobility and over longer time horizons.
Overall, our results suggest that in middle-income countries, the composition of growth as well
as overall growth has at least a short-run effect on the growth of employment and wages.
Composition effects are much smaller in low income contexts, and appear to dwindle over longer
time horizons. This is consistent with arguments that focusing on overall growth rather than
particular sectors may be an appropriate long-term policy objective (Kraay, 2006). Labor market
mobility tends to attenuate these compositional effects, and promoting mobility between jobs
may therefore be an important mechanism for more broadly distributing the benefits of growth
originating in higher productivity and more capital-intensive sectors.

- 18 -
References
Amiti, Mary and Caroline Freund (2010). ―The Anatomy of China’s Export Growth.‖ In
China’s Growing Role in World Trade. Eds. Robert Feenstra and Shang Jin Wei,
National Bureau of Economic Research, Cambridge, MA.
Alvarez-Cuadrado, Francisco, and Markus Poschke (2011). ―Structural Change Out of
Agriculture: Labor Push versus Labor Pull." American Economic Journal:
Macroeconomics, 3(3): 127-58.
Angrist, Joshua D., and Adriana D. Kugler (2008). ―Rural Windfall or a New Resource Curse?
Coca, Income, and Civil Conict in Colombia." The Review of Economics and Statistics,
90(2): 191{215.
Balassa, Bela (1978). ―Exports and Economic Growth.‖ Journal of Development Economics,
5:181-189.
Berg, Janine, Christopher Ernst and Peter Auer (2006). Meeting the Employment Challenge:
Argentina, Brazil and Mexico in the Global Economy. International Labour Organization.
Caselli, Francesco and Guy Michaels (2009). ―Do Oil Windfalls Improve Living Standards?
Evidence from Brazil." NBER Working Papers 15550.
Chenery, Hollis and Moises Syrquin (1975). ―Patterns of development, 1950-1970‖, Oxford
University Press, London.
Christiaensen, Luc, Lionel Demery, and Jesper Kuhl (2011). ―The (Evolving) Role of
Agriculture in Poverty Reduction—An Empirical Perspective.‖ Journal of Development
Economics, 96(2): 239-254.
Datt, Gaurav and Martin Ravallion (2011). ―Has India’s Economic Growth Become More Pro-
Poor in the Wake of Economic Reforms?‖ World Bank Economic Review, 25(2): 157-
189.
De Janvry, Alain and Elizabeth Sadoulet (2009). ―Agricultural Growth and Poverty Reduction:
Additional Evidence.‖ World Bank Research Observer, 25(1): 1-20.
Dube, Oeindrila and Juan Vargas (2012). ―Commodity Prices and Civil Conflict: Evidence
from Colombia.‖ Forthcoming, Review of Economic Studies.
Ferreira, Francisco, Phillippe Leite, and Martin Ravallion (2010). ―Poverty Reduction Without
Economic Growth? Explaining Brazil’s Poverty Dynamics, 1985-2004.‖ Journal of
Development Economics, 93(1): 20-36.
Foster, Andrew and Mark Rosenzweig (2007). ―Economic Development and the Decline of
Agricultural Employment.‖ In Handbook of Development Economics, Volume 4. Eds.
T Paul Schultz and John Strauss, Elsevier.

- 19 -
Freeman, Richard B. (2010). ―Labor Regulations, Unions, and Social Protection in Developing
Countries: Market Distortions or Efficient Institutions?‖ In Dani Rodrik and Mark
Rosenzweig (Eds.),
Handbook of Development Economics (Vol. Volume 5, pp. 4657-4702), Elsevier: Amsterdam.
Freund, Caroline and Bob Rijkers (2012). ―Employment Miracles.‖ Mimeo, World Bank.
Gollin, Douglas, Stephen L. Parente, and Richard Rogerson (2002). ―The Role of Agriculture in
Development." American Economic Review, 92(2): 160-164.
Gutierrez, Catalina, Carlo Orecchia, Pierella Paci, and Pieter Serneels (2007). ―Does
Employment Generation Really Matter for Poverty Reduction?‖ World Bank Policy
Research Working Paper No. 4432.
Haggblade, S., Hazell, P., Reardon, T. (2002). ―Strategies for Stimulating Poverty-Alleviating
Growth in the Rural Non-farm Economy in Developing Countries.‖ Mimeo, International
Food Policy Research Institute, Washington, DC.
Headey, Derek, Dirk Bezemer and Peter B. Hazell (2010). ―Agricultural Employment Trends in
Asia and Africa: Too Fast or Too Slow?‖ World Bank Research Observer, 25(1): 57-89.
Kraay, Aart (2006). ―When Is Growth Pro-poor? Evidence from a Panel of Countries.‖ Journal
of Development Economics, 80(1): 198-227.
Lanjouw, Jenny and Peter Lanjouw (2001). ―The Rural Non-farm Sector: Issues and Evidence
from Developing Countries.‖ Agricultural Economics, 26 (1): 1–23.
Loayza, Norman and Claudio Raddatz (2010). ―The Composition of Growth Matters for Poverty
Alleviation.‖ Journal of Development Economics, 93: 137-151.
McMillan, Margaret S. and Dani Rodrik (2012). ―Globalization, Structural Change and
Productivity Growth.‖ NBER Working Paper 17143.
Montenegro, Claudio, and Maximillian Hirn (2009). ―A New Disaggregated Set of Labor
Market Indicators Using Standardized Household Surveys from Around the World‖,
World Development Report Background Paper, available at:
http://siteresources.worldbank.org/INTWDR2009/Resources/4231006-
1204741572978/Montenegro-Hirn.pdf.
Ravallion, Martin and Shaohua Chen (2007). ―China’s (Uneven) Progress Against Poverty.‖
Journal of Development Economics, 82(1): 1-42.
Ravallion, Martin and Gaurav Datt (1996). ―How Important to India’s Poor is the Sectoral
Composition of Economic Growth?‖ World Bank Economic Review, 10(1): 1-25.
Robinson, James, Ragnar Torvik, and Thierry Verdier (2006). ―Political Foundations of the
Resource Curse.‖ Journal of Development Economics, 79(2): 447-468.

- 20 -
Sachs, Jeffrey D. and Andrew Warner (1995). ―Natural Resource Abundance and Economic
Growth.‖ Harvard Institute for International Development, Development Discussion
Paper No. 517.
Sachs, Jeffrey D. and Andrew Warner (1999). ―The Big Push, Natural Resource Booms and
Growth.‖ Journal of Development Economics 59, 43– 76.
Suryahadi, Asep, Daniel Suryadama, and Sudarno Sumarto (2009). ―The Effects of Location
and Sectoral Components of Economic Growth on Poverty: Evidence from Indonesia.‖
Journal of Development Economics, 89(1): 109-117.
Thurlow, James and Peter Wobst (2006). ―Not All Growth is Equally Good for the Poor: The
Case of Zambia.‖ Journal of African Economies, 15(4): 603-625.
Topalova, Petia (2008). ―India: Is the Rising Tide Lifting All Boats? Issues 2008-2054.‖ IMF
Working Paper. International Monetary Fund, Washington, D.C.
Van der Ploeg, Frederick (2011). ―Natural Resources: Curse or Blessing‖, Journal of Economic
Literature, 49:2, p. 366-420.
World Bank (2012). World Development Indicators. World Bank, Washington D.C.

- 21 -
Figure 1a: Smoothed Employment to Population ratio by per capita GDP, 2000-2010
Notes: Each dot represents the average employment to population ratio from the mean of employment to population,
locally weighted according to per capita GDP. The data consist of 62 countries for which the latest observed year
for each country for surveys between 2000 and 2010.The bandwidth is 1, with an Epanchnikov kernel.
Figure 1b: Unemployment rate by per capita GDP, 2000-2010
Note: See notes to figure 1a.
50
55
60
65
70
75
Em
plo
ym
ent to
po
pu
latio
n r
atio
100 250 500 1000 2500 5000 10000 20000GDP in 2000
05
10
15
20
25
30
35
Un
em
plo
ym
en
t ra
te
100 250 500 1000 2500 5000 10000 20000GDP in 2000

- 22 -
Figure 2: Estimated impact of high and low productivity sector growth on employment to population ratio,
by country GDP in 2000
Notes: Each dot represents a coefficient estimate on from equation (2), locally weighted according to log per capita
GDP in 2000 using a bandwidth of one and an Epanechnikov kernel. Dashed lines represent 95% confidence
intervals. Sectoral growth is weighted by its share of GDP. The coefficients represent the percentage point change
in the employment to population ratio associated with the amount of additional growth in high or low productive
sectors necessary to raise aggregate growth one percentage point. High-productivity sectors are manufacturing,
transport and communications, finance, electricity and utilities, or mining. Low-productivity sectors are other
services, agriculture, retail and wholesale trade, government and public administration, and construction. Standard
errors are clustered on country.

- 23 -
Figure 3: Estimated impact of high and low productivity sector growth on unemployment growth, by country
GDP in 2000
See notes to Figure 2.

- 24 -
Figure 4: Estimated impact of high and low productivity sector growth on wage growth, by country GDP in
2000
See notes to Figure 2.

- 25 -
Figure 5a: Effects of manufacturing growth on employment growth, by country GDP in 2000
See notes to Figure 2.
Figure 5b: Effects of manufacturing growth on unemployment growth, by country GDP in 2000
See notes to Figure 2.

- 26 -
Figure 5c: Effects of manufacturing growth on wage growth, by country GDP in 2000
See notes to Figure 2.

- 27 -
Figure 6a: Effects of mining growth on employment growth, by country GDP in 2000
See notes to Figure 2.
Figure 6b: Effects of mining growth on unemployment growth, by country GDP in 2000
See notes to Figure 2.

- 28 -
Figure 6c: Effects of mining growth on wages growth, by country GDP in 2000
See notes to Figure 2.

- 29 -
Figure 7a: Effects of agriculture growth on employment growth, by country GDP in 2000
See notes to Figure 2.
Figure 7b: Effects of agriculture growth on unemployment growth, by country GDP in 2000
See notes to Figure 2.

- 30 -
Figure 7c: Effects of agriculture growth on wage growth, by country GDP in 2000
See notes to Figure 2.

- 31 -
Figure 8a: Estimated effects of a 10 percent increase in manufacturing exports on employment to population,
by country GDP in 2000
See notes to Figure 2.
Figure 8b: Estimated effects of a 10 percent increase in manufacturing exports on change in unemployment,
by country per capita GDP in 2000
See notes to Figure 2.
-.5
-.4
-.3
-.2
-.1
0.1
.2.3
.4.5
.6.7
.8.9
1
Estim
ate
d e
ffect o
n e
mplo
ym
ent to
po
pu
latio
n r
atio
(pe
rcen
tage
poin
ts)
100 250 500 1000 2500 5000 10000 20000GDP per capita, 2000
-.5
-.4
-.3
-.2
-.1
0.1
.2.3
.4.5
Estim
ate
d e
ffect o
n u
ne
mplo
ym
ent ra
te
(pe
rcen
tage
poin
ts)
100 250 500 1000 2500 5000 10000 20000GDP per capita, 2000

- 32 -
Figure 8c: Estimated effects of a 10 percent increase on wage growth, by country GDP in 2000
-5-4
-3-2
-10
12
34
5
Estim
ate
d e
ffect o
n w
ag
es
(ela
sticity)
100 250 500 1000 2500 5000 10000 20000GDP per capita, 2000

- 33 -
Table 1: Summary statistics
Variable N Mean Standard Deviation
International
Δ Employed 193 -0.001 0.031
Δ Unemployed 193 -0.004 0.018
Δ Out of the labor force 193 0.005 0.035
Δ Log(wages) 151 -0.026 0.545
Δ Productivity 151 0.067 0.648
High productivity growth 193 0.018 0.017
Low productivity growth 193 0.024 0.016
Brazil, 2003-2009
Δ Employed 825304 0.000 0.299
Δ Unemployed 825304 -0.001 0.283
Δ Out of the labor force 825304 0.001 0.350
Log(wages) 189 0.766 0.299
Productivity 189 7.240 0.492
High productivity growth 825304 0.016 0.022
Low productivity growth 825304 0.021 0.023
Indonesia, 1988-2007
Δ Employed 383493 0.006 0.251
Unemployed
Out of the labor force
Δ Log(wages) 45603 0.109 0.599
Δ Productivity 125851 0.021 0.258
High productivity growth 383493 0.014 0.022
Low productivity growth 383493 0.026 0.027

- 34 -
Mexico, 2005-2009
Δ Employed 331004 0.008 0.415
Δ Unemployed 331004 0.003 0.203
Δ Out of the labor force 331004 -0.010 0.399
Δ Log(wages) 118384 -0.002 0.689
Δ Productivity 174661 -0.002 0.585
High productivity growth 331004 0.009 0.032
Low productivity growth 331004 0.002 0.025

- 35 -
Table 2: Cross-country regressions of annualized changes in employment outcomes on share-weighted annualized high and
low productivity sector growth
(I)
Δ Employed
(II)
Δ Unemployed
(III)
Δ Out of the
labor force
(IV)
Δ Log(wages)
(V)
Δ Productivity
High vs. low productivity sectors
High productivity growth -0.215** 0.067 0.149* 3.818 1.364
(0.090) (0.054) (0.087) (7.428) (2.2566)
Low productivity growth 0.080 -0.162*** 0.082 1.158 -0.404
(0.110) (0.058) (0.092) (5.329) (1.693)
p-value, test: β1=β2 0.075 0.021 0.680 0.822 0.636
R-squared 0.012 0.054 0.055 0.009 0.002
Observations 193 193 193 151 151
Note: High-productivity sectors are manufacturing, transport and communications, finance, electricity and utilities, or mining.
Low-productivity sectors are other services, agriculture, retail and wholesale trade, government and public administration, and
construction. Sectoral growth is weighted by its share of GDP. Standard errors are clustered on country.

- 36 -
Table 3: Brazil, Indonesia and Mexico sector growth, high vs. low productivity sectors, annual changes
(I)
Δ Employed
(II)
Δ Unemployed
(III)
Δ Out of the
labor force
(IV)
Δ Log(wages)
(V)
Δ Productivity
Brazil, 2003-2009
High productivity growth 0.006 -0.031*** 0.029 0.011 0.277***
(0.007) (0.005) (0.016) (0.037) (0.046)
Low productivity growth -0.005 -0.019 0.006 0.029 0.254***
(0.009) (0.013) (0.023) (0.037) (0.040)
p-value, test: β1=β2 0.384 0.274 0.526 0.256 0.250
R-squared 0.000 0.000 0.000 0.991 0.985
Observations 825304 825304 825304 189 189
Indonesia, 1988-2007
High productivity growth -0.235* -0.035** 0.048* 1.790** 0.714**
(0.120) (0.013) (0.026) (0.607) (0.254)
Low productivity growth -0.017 -0.037** 0.047* 0.022 1.339***
(0.074) (0.013) (0.026) (0.250) (0.110)
p-value, test: β1=β2 0.061 0.165 0.775 0.010 0.036
R-squared 0.020 0.046 0.186 0.049 0.057
Observations 383493 2227036 2227036 45603 125851
Mexico, 2005-2009
High productivity growth 0.252*** -0.084** -0.168** 0.002 0.347*
(0.074) (0.031) (0.063) (0.223) (0.190)

- 37 -
Low productivity growth 0.069 -0.013 0.051 0.119 1.040***
(0.063) (0.066) (0.074) (0.192) (0.177)
p-value, test: β1=β2 0.135 0.356 0.267 0.733 0.021
R-squared 0.000 0.001 0.000 0.002 0.006
Observations 331004 331004 331004 118284 174661
Note: Individual level panel regressions in changes include year effects, and for state-year level regressions in columns (IV) and
(V) for Brazil, state and year effects. Standard errors clustered on state or province.

- 38 -
Table 4: Cross-country regressions of annualized changes in employment outcomes on share-weighted 1-digit sector growth
(I)
Δ Employed
(II)
Δ Unemployed
(III)
Δ Out of the
labor force
(IV)
Δ Log(wages)
(V)
Δ Productivity
1-digit sectors
Agriculture growth -0.132 -0.082 0.215 3.819 2.191
(0.192) (0.098) (0.249) (11.415) (9.149)
Construction growth 0.212 -0.040 -0.173 23.054 3.871
(0.331) (0.187) (0.305) (18.181) (11.163)
Retail and wholesale trade -0.152 -0.185 0.337 -10.507 18.324*
growth (0.315) (0.305) (0.234) (9.846) (10.438)
Transport and communications -0.078 -0.421 0.499 -48.80 19.679
growth (0.424) (0.275) (0.390) (34.913) (18.062)
Manufacturing growth 0.047 -0.259 0.223 -4.395 -3.957
(0.278) (0.176) (0.305) (11.829) (11.176)
Mining and utilities growth -0.301*** 0.198*** 0.103 9.391 -0.192
(0.110) (0.070) (0.102) (10.923) (3.840)
Other growth 0.102 0.035 -0.137 17.862** -17.457
(0.255) (0.167) (0.192) (8.779) (10.935)
p-value, test: β1=β2=…=β7 0.317 0.020 0.325 0.071 0.247
R-squared 0.063 0.142 0.075 0.083 0.057
Observations 193 193 193 151 151
Note: Standard errors clustered on country.

- 39 -
Table 5: Share of employees that are paid or non-agricultural, cross-country regressions
(I)
Δ Share Wage
Employee
(II)
Δ Share Wage
Employee or
Employer
(III)
Δ Share Wage
Employee,
Employer, or Self-
Employed
(IV)
Δ Non-agricultural
employment
High vs. low productivity sectors
High productivity growth 0.262 0.368 0.165* 0.150
(0.275) (0.342) (0.088) (0.189)
Low productivity growth -0.271 -0.681** -0.050 0.066
(0.211) (0.298) (0.099) (0.100)
p-value, test: β1=β2 0.170 0.007 0.192 0.758
R-squared 0.010 0.021 0.026 0.016
Observations 187 180 153 172
1-digit sectors
Agriculture growth -1.103 -4.012 0.094 -0.277
(1.045) (2.648) (0.212) (0.612)
Construction growth 1.628 2.507 0.035 0.191
(1.261) (2.493) (0.432) (0.423)
Retail and wholesale trade -1.108 -0.406 0.571** 0.618
growth (1.279) (1.575) (0.281) (0.424)
Transport and communications -3.792 -4.839 -0.027 1.114
growth (1.939) (3.944) (0.501) (1.081)
Manufacturing growth -0.294 -0.473 -0.203 0.442
(0.480) (0.603) (0.226) (0.366)
Mining and utilities growth 0.583 0.601 0.275*** -0.047

- 40 -
(0.396) (0.503) (0.099) (0.321)
Other growth 1.145 0.910 -0.316 -0.634*
(0.739) (1.359) (0.268) (0.379)
p-value, test: β1=β2=…=β7 0.300 0.085 0.357 0.299
R-squared 0.133 0.157 0.082 0.077
Observations 187 180 153 172
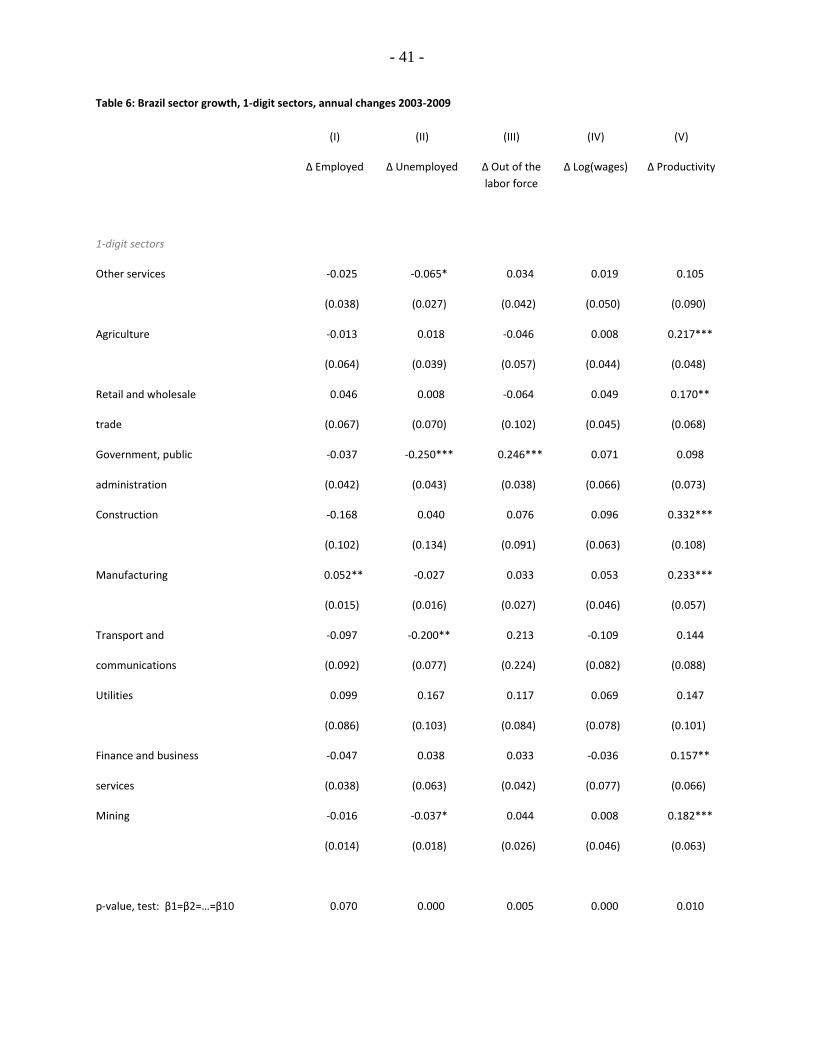
- 41 -
Table 6: Brazil sector growth, 1-digit sectors, annual changes 2003-2009
(I)
Δ Employed
(II)
Δ Unemployed
(III)
Δ Out of the
labor force
(IV)
Δ Log(wages)
(V)
Δ Productivity
1-digit sectors
Other services -0.025 -0.065* 0.034 0.019 0.105
(0.038) (0.027) (0.042) (0.050) (0.090)
Agriculture -0.013 0.018 -0.046 0.008 0.217***
(0.064) (0.039) (0.057) (0.044) (0.048)
Retail and wholesale 0.046 0.008 -0.064 0.049 0.170**
trade (0.067) (0.070) (0.102) (0.045) (0.068)
Government, public -0.037 -0.250*** 0.246*** 0.071 0.098
administration (0.042) (0.043) (0.038) (0.066) (0.073)
Construction -0.168 0.040 0.076 0.096 0.332***
(0.102) (0.134) (0.091) (0.063) (0.108)
Manufacturing 0.052** -0.027 0.033 0.053 0.233***
(0.015) (0.016) (0.027) (0.046) (0.057)
Transport and -0.097 -0.200** 0.213 -0.109 0.144
communications (0.092) (0.077) (0.224) (0.082) (0.088)
Utilities 0.099 0.167 0.117 0.069 0.147
(0.086) (0.103) (0.084) (0.078) (0.101)
Finance and business -0.047 0.038 0.033 -0.036 0.157**
services (0.038) (0.063) (0.042) (0.077) (0.066)
Mining -0.016 -0.037* 0.044 0.008 0.182***
(0.014) (0.018) (0.026) (0.046) (0.063)
p-value, test: β1=β2=…=β10 0.070 0.000 0.005 0.000 0.010

- 42 -
R-squared 0.000 0.000 0.000 0.993 0.987
Observations 825304 825304 825304 189 189
Note: Individual level panel regressions in changes include year effects. Standard errors clustered on state or province.

- 43 -
Table 7: Cross-province regressions of annualized changes in employment outcomes on share-weighted annualized 1-digit
sector growth, Indonesia, 1988-2007
(I)
Δ Employed
(II)
Δ
Unemployed
(III)
Δ Out of the
labor force
(IV)
Δ Log(wages)
(V)
Δ Productivity
1-digit sectors
Other services 0.391 -0.034 0.065** 2.312 0.479
(0.300) (0.023) (0.028) (3.781) (1.281)
Agriculture 0.349** -0.024 0.054* 1.037 1.494**
(0.150) (0.020) (0.030) (0.767) (0.536)
Trade and commerce -0.387* -0.025 0.052* -0.716 1.567***
(0.195) (0.020) (0.027) (0.681) (0.275)
Construction -0.499 -0.033 0.068 -0.363 2.145**
(0.506) (0.025) (0.027) (2.425) (0.932)
Manufacturing -0.120 -0.025 0.053* 2.484*** 0.574*
(0.132) (0.020) (0.029) (0.562) (0.298)
Transport 0.325 -0.036 0.056 1.775 0.021
(0.732) (0.023) (0.036) (3.128) (1.271)
Finance -0.412 -0.025 0.065** -4.093 1.505
(0.418) (0.023) (0.026) (3.153) (0.931)
Electricity -0.862 -0.039 0.137* -5.261 0.016
(1.071) (0.059) (0.068) (6.276) (3.577)
Mining -0.054** -0.026 0.057* -0.122* 0.078**
(0.025) (0.020) (0.028) (0.065) (0.029)
p-value, test: β1=β2=…=β9 0.004 0.021 0.051 0.011 0.000
R-squared 0.020 0.046 0.186 0.051 0.059
Observations 381629 2227036 2227036 44894 125338

- 44 -
Note: Individual level panel regressions in changes include year effects. Standard errors clustered on state or province.

- 45 -
Table 8: Cross-state regressions of annualized changes in employment outcomes on share-weighted annualized high and low
productivity sector growth, Mexico
(I)
Δ Employed
(II)
Δ Unemployed
(III)
Δ Out of the
labor force
(IV)
Δ Log(wages)
(III)
Δ Productivity
1-digit sectors
Other services 1.112 -0.490 -0.739 -3.972 2.283
(1.834) (0.558) (1.982) (7.636) (2.867)
Agriculture 0.058 0.224 -0.287 1.441 2.694***
(0.257) (0.170) (0.306) (0.905) (0.698)
Retail and wholesale -0.165 -0.498*** 0.636 -1.848 0.708
trade (0.462) (0.177) (0.504) (1.654) (0.882)
Government and 0.082 -0.325 0.304 10.446*** 0.100
public administration (1.393) (0.412) (1.252) (2.532) (2.418)
Construction 0.070 0.011 -0.073 0.081 0.957***
(0.085) (0.076) (0.059) (0.218) (0.146)
Manufacturing 0.237** -0.098*** -0.144 -0.074 0.640***
(0.111) (0.033) (0.103) (0.224) (0.200)
Social services 0.171 -0.049 -0.119 -0.700 -0.080
(0.283) (0.091) (0.282) (0.610) (0.487)
Transport and 0.344 -0.055 -0.275 -1.171 0.552
communications (0.229) (0.121) (0.225) (0.854) (0.547)
Finance and business 0.392*** -0.043 -0.333* 2.462*** 0.646
services (0.135) (0.093) (0.172) (0.670) (0.572)
Mining and utilities 0.221 0.025 -0.239** 0.153 -0.021
(0.134) (0.048) (0.116) (0.474) (0.257)
p-value, test: β1=β2=…=β10 0.656 0.002 0.750 0.000 0.001

- 46 -
R-squared 0.000 0.001 0.000 0.002 0.006
Observations 331004 331004
331004 118384 174661
Note: Individual level panel regressions in changes include year effects. Standard errors clustered on state or province.

- 47 -
Table 9: Cross-country regressions of annualized changes in employment outcomes on overall growth and manufacturing-led
export growth
(I)
Δ Employed
(II)
Δ Unemployed
(III)
Δ Out of the
labor force
(IV)
Δ Log(wages)
(V)
Δ Productivity
Log GDP growth, annualized -0.060 -0.064** 0.124*** 4.679* 0.409
(0.054) (0.026) (0.041) (2.633) (0.781)
Log manufacturing exports 0.028** -0.016* -0.011 -2.759** -0.087
growth, annualized (0.013) (0.077) (0.012) (1.281) (0.557)
R-squared 0.033 0.077 0.062 0.075 0.001
Observations 176 176 176 138 143
Note: Standard errors clustered on country.

- 48 -
Table 10: High vs. low productivity growth, interacted with labor mobility, within country
(I)
Δ Employed
Mexico
(II)
Δ Log(wages)
Mexico
(III)
Δ Employed
Indonesia
(IV)
Δ Log(wages)
Indonesia
(V)
Δ Employed
Brazil
(VI)
Δ
Log(wages)
Brazil
High productivity growth 3.738*** -8.381** -2.762** 7.789 -0.058 0.323
(1.006) (3.935) (1.238) (7.407) (0.044) (0.176)
Low productivity growth -2.913* 3.942 1.659*** -4.081 0.069* -0.230
(1.582) (4.966) (0.401) (3.982) (0.031) (0.342)
High productivity growth* -12.185*** 29.348** 45.754** -108.786 0.354 -1.037
labor mobility (3.429) (13.819) (21.385) (139.243) (0.279) (0.841)
Low productivity growth* 10.544* -13.572 -30.848*** 75.011 -0.370 0.585
labor mobility (5.549) (17.612) (8.156) (72.964) (0.222) 0.653
R-squared 0.001 0.002 0.020 0.049 0.000 0.768
Observations 331004 118384 383493 45603 825304 42
Note: Individual level panel regressions in changes include year effects. Standard errors clustered on state or province.

- 49 -
Table 11: High vs. low productivity growth, interacted with measures of labor regulation, cross-country
(I)
Δ Employed
(II)
Δ Employed
(III)
Δ Employed
(IV)
Δ Employed
(V)
Δ Employed
High productivity growth 0.161 -0.752* -0.640** -0.752* -0.693
(0.290) (0.423) (0.283) (0.423) (0.440)
Low productivity growth -0.204 0.338 0.321* 0.338 0.217
(0.269) (0.321) (0.192) (0.321) (0.331)
High productivity growth* -0.006 -0.037
hiring flexibility (0.004) (0.064)
Low productivity growth* 0.005 -0.098
hiring flexibility (0.004) (0.090)
High productivity growth* 0.008 -0.026
employment conditions (0.006) (0.064)
Low productivity growth* -0.004 -0.107
employment conditions (0.005) (0.089)
High productivity growth* 0.011* -0.018
firing flexibility (0.006) (0.060)
Low productivity growth* -0.007 -0.109
firing flexibility (0.005) (0.089)
High productivity growth* 0.008 0.094
employment laws (0.006) (0.191)
Low productivity growth* -0.004 0.309
employment laws (0.005) (0.271)
R-squared 0.047 0.051 0.057 0.051 0.113
Observations 175 175 175 175 175

- 50 -
Note: Standard errors clustered on country.

- 51 -
Table 12: Longer-term growth and employment outcomes, 3 sectors
(I)
Δ Employed
(II)
Δ Unemployed
(III)
Δ Out of the
labor force
(IV)
Δ Log(income)
(V)
Δ Productivity
Brazil, 1960-2000
Agriculture growth 0.004 -0.008 0.004 0.109 0.078
(0.018) (0.006) (0.014) (0.066) (0.050)
Services growth -0.003 -0.011* 0.013 0.100 0.128**
(0.017) (0.006) (0.014) (0.065) (0.055)
Industry growth 0.005 -0.013* 0.007 0.111* 0.128***
(0.017) (0.006) (0.013) (0.062) (0.043)
p-value, test: β1=β2=β3 0.019 0.000 0.014 0.394 0.001
R-squared 0.232 0.052 0.252 0.817 0.498
Observations 4176163 4176163 4176163 2314738 2853088
Indonesia, 1971-2010
Agriculture growth 0.019*** -0.001*** -0.019*** -- 0.651***
(0.000) (0.000) (0.001) (0.184)
Services growth 0.016*** 0.001*** -0.017*** -- 0.730***
(0.001) (0.000) (0.001) (0.172)
Industry growth 0.014*** 0.000 -0.014*** -- 0.692***
(0.001) (0.000) (0.000) (0.181)
p-value, test: β1=β2=β3 0.000 0.000 0.000 0.000
R-squared 0.244 0.004 0.244 0.999
Observations 1538919 1538919 1538919 3421263
Mexico, 1990-2010

- 52 -
Agriculture growth 0.031 0.003** -0.048** -1.466*** 1.009***
(0.019) (0.002) (0.024) (0.494) (0.115)
Services growth 0.022 0.003* -0.040 -1.231*** 0.952***
(0.017) (0.001) (0.023) (0.445) (0.101)
Industry growth 0.021 0.001 -0.038* -1.102*** 0.923***
(0.016) (0.001) (0.020) (0.389) (0.96)
p-value, test: β1=β2=β3 0.065 0.001 0.062 0.028 0.005
R-squared 0.170 0.004 0.182 0.209 0.609
Observations 5467781 5467781 5467781 3153527 1743735
Note: Regressions include state or province and year effects. Standard errors clustered on state or province.

- 53 -
Appendix Table 1: Countries included in cross-country sample
Country Spells
Albania 1996-2002, 2002-2005
Argentina 1994-2001, 2001-2006
Armenia 1999-2003
Austria 2005-2006, 2006-2007, 2007-2008
Azerbaijan 1995-2002
Bangladesh 1991-2000, 2000-2005, 2005-2010
Belarus 1995-2002, 2002-2005
Belgium 2005-2006, 2006-2007, 2007-2008
Bhutan 2003-2007
Bolivia 1993-1996, 1996-2002, 2002-2005
Bosnia and Herzegovina 2001-2004
Brazil 1987-1995, 1995-1999, 1999-2005, 2005-2008
Bulgaria 1995-2001, 2001-2003, 2003-2008
Burkina Faso 1994-2003
Cambodia 1997-2004
Cameroon 1996-2001, 2001-2007
Canada 1981-1991, 1991-2001
Chile 1990-1992, 1992-1994, 1994-1996, 1996-1998, 1998-
2000, 2000-2003, 2003-2006, 2006-2009
Colombia 1995-2000
Costa Rica 1995-2001, 2001-2006
Cyprus 2005-2006, 2006-2007, 2007-2008
Czech Republic 2005-2006, 2006-2007, 2007-2008
Denmark 2005-2006, 2006-2007
Djibouti 1996-2002

- 54 -
Dominican Republic 1997-2004
Ecuador 1995-2004
El Salvador 1995-2002, 2002-2005
Estonia 2004-2005, 2005-2006, 2006-2007, 2007-2008
Ethiopia 1995-2000, 2000-2004
Finland 2005-2006, 2006-2007
France 2005-2006, 2006-2007
Ghana 1991-1998, 1998-2005
Greece 2005-2006, 2006-2007, 2007-2008
Guatemala 1989-2002, 2002-2006
Honduras 1995-2003
Hungary 1998-2002, 2002-2004, 2004-2005, 2005-2006, 2006-
2007
Iceland 2005-2006, 2006-2007
India 1983-1987, 1987-1993, 1993-1999, 1999-2004, 2004-
2007, 2007-2009
Indonesia 1993-1997, 1997-2002
Ireland 2005-2006, 2006-2007, 2007-2008
Italy 2005-2006, 2006-2007, 2007-2008
Jamaica 1996-2002
Kazakhstan 1996-2002, 2002-2003
Kenya 1997-2005
Latvia 2004-2005, 2005-2006, 2006-2007, 2007-2008
Lithuania 2000-2004, 2004-2005, 2005-2006, 2006-2007, 2007-
2008
Luxembourg 2005-2006, 2006-2007, 2007-2008
Madagascar 1993-2001
Malawi 1997-2005
Mali 1994-2003

- 55 -
Mauritius 1999-2003, 2003-2008
Mexico 2000-2002, 2002-2004, 2004-2005, 2005-2006, 2006-
2008
Montenegro 2002-2006
Morocco 1991-1998
Mozambique 1996-2003
Nepal 1995-2003, 2003-2008
Netherlands 2005-2006, 2006-2007
Nicaragua 1993-2001, 2001-2005
Niger 1995-2002
Nigeria 1993-2003
Norway 2005-2006, 2006-2007
Pakistan 1991-1992, 1992-1999, 1999-2001, 2001-2005, 2005-
2007, 2007-2008
Panama 1991-1995, 1995-2003
Paraguay 1995-2001, 2001-2006
Peru 1994-2002
Philippines 1997-1998, 1998-2002, 2002-2006
Poland 1998-2004, 2004-2005, 2005-2006, 2006-2007, 2007-
2008
Portugal 2005-2006, 2006-2007, 2007-2008
Romania 1994-2002, 2002-2006, 2006-2008
Rwanda 1997-2005
Slovenia 2004-2005, 2005-2006, 2006-2007, 2007-2008
Spain 2005-2006, 2006-2007, 2007-2008
Sri Lanka 1995-2000, 2000-2002, 2002-2004, 2004-2006, 2006-
2008
Swaziland 1995-2000
Sweden 2005-2006, 2006-2007, 2007-2008
Thailand 1990-1994, 1994-2000, 2000-2002, 2002-2006, 2006-

- 56 -
2009
Tunisia 1997-2000, 2000-2001
Turkey 2000-2005
Uganda 1992-2002, 2002-2005
Ukraine 1999-2003, 2003-2005
Uruguay 1995-2003, 2003-2006

- 57 -
Appendix Table 2: GDP and differential impacts of high and low productivity growth across countries
(I)
Δ Employed
(II)
Δ Unemployed
(III)
Δ Out of the
labor force
(IV)
Δ Log(wages)
(V)
Δ Productivity
Interacted with Log(GDP in 2000)
High productivity growth -0.521 0.163 0.358 -18.049 16.502**
(0.436) (0.229) (0.465) (19.877) (6.495)
Low productivity growth -0.251 0.075 0.177 19.818 -5.920
(0.305) (0.227) (0.310) (15.144) (7.632)
High productivity growth * 0.044 -0.014 -0.030 3.017 -2.177**
Log(GDP in 2000) (0.059) (0.030) (0.061) (3.111) (0.955)
Low productivity growth * 0.060 -0.041 -0.019 -2.700 0.660
Log(GDP in 2000) (0.041) (0.034) (0.038) (2.325) (1.240)
R-squared 0.088 0.087 0.065 0.015 0.010
Observations 193 193 193 151 151
By income categories
High productivity growth * -0.242* 0.012 0.230 -4.219 4.455***
Low income country (0.129) (0.119) (0.145) (3.845) (1.491)
Low productivity growth * 0.089 -0.167* 0.078 7.644* -3.958***
Low income country (0.119) (0.085) (0.134) (4.212) (1.475)
High productivity growth * -0.400** 0.110** 0.290 15.721 -9.338
Lower middle income country (0.166) (0.054) (0.188) (20.489) (6.732)
Low productivity growth * 0.403*** -0.311*** -0.092 -26.312 5.964
Lower middle income country (0.122) (0.095) (0.188) (17.930) (5.662)
High productivity growth * -0.374* 0.232 0.142 4.428 2.981

- 58 -
Upper middle income country (0.224) (0.245) (0.140) (3.057) (6.333)
Low productivity growth * 0.456** -0.567 0.111 4.890 -9,121
Upper middle income country (0.227) (0.352) (0.261) (5.858) (11.110)
High productivity growth * 0.127 0.140 -0.267 3.253 -7.210
High income country (0.255) (0.113) (0.217) (3.201) (4.896)
Low productivity growth * -0.120 -0.437*** 0.556** 6.984 0.035
High income country (0.285) (0.117) (0.247) (5.264) (3.773)
R-squared 0.067 0.085 0.047 0.149 0.040
Observations 193 193 193 151 151
Note: Standard errors clustered on country.