the role of speculators in the crude oil futures marketswaps/documents/file/plstudy_19... ·...
TRANSCRIPT

Electronic copy available at: http://ssrn.com/abstract=1435042
The Role of Speculators in the Crude Oil Futures Market
Abstract: The coincident rise in crude oil prices and increased numbers of financial participants in
the crude oil futures market from 2000-2008 has led to allegations that ―speculators‖ drive crude oil
prices. As crude oil futures peaked at $147/bbl in July 2008, the role of speculators came under
heated debate. In this paper, we employ unique data from the U.S. Commodity Futures Trading
Commission (CFTC) to test the relation between crude oil prices and the trading positions of various
types of traders in the crude oil futures market. We employ Granger Causality tests to analyze lead
and lag relations between price and position data at daily and multiple day intervals. We find little
evidence that hedge funds and other non-commercial (speculator) position changes Granger-cause
price changes;–the results instead suggest that price changes do precede their position changes.
Keywords: Crude Oil, Futures Markets, Speculators, Granger Causality, Hedge Funds, Commodity
Index Traders
JEL Classification: G12, G14, G23
* Buyuksahin: Economist, Commodity Futures Trading Commission (CFTC), 1155 21st Street NW,
Washington, DC 20485. Email: [email protected]. Harris: Chief Economist, CFTC and
Professor of Finance, Alfred Lerner College of Business and Economics, University of Delaware,
320 Purnell Hall, Newark, DE 19716. Email: [email protected]. Many thanks to Kirsten Anderson,
Celso Brunetti, James Moser, David Reiffen and Michel Robe for helpful comments. This paper
reflects the opinions of its authors only, and not those of the U.S. Commodity Futures Trading
Commission, the Commissioners, or other staff of the Commission. All remaining errors and omissions, if any, are the authors’ sole responsibility.
Bahattin
Büyükşahin
Jeffrey H.
Harris

Electronic copy available at: http://ssrn.com/abstract=1435042
The summer 2008 spike in crude oil prices to $147/bbl jolted the U.S. economy and severely pinched
consumers at the gas pump. In reaction to oil prices, U.S. total oil consumption fell by 6.7 percent
from 20.8 million barrels per day in 2005 to 19.4 million barrels a day in 2008. Given the
predominance of crude oil in the U.S. economy, the price spike also generated substantial attention
from regulators, legislators and market critics who decried the existence of excessive speculation in
the crude oil futures markets. Indeed, the rise in participation by non-commercial traders during the
preceding eight years (Buyuksahin et al. (2009)) provided great fodder for casual connections with
recent price increases. In this paper we apply rigorous econometric techniques to the question as to
whether position changes of any particular group of traders was responsible for crude oil futures
price changes from 2000-2009.
For perspective, we first calculate Working’s (1960) speculative index in the crude oil futures
market from 2000 through 2008. Working’s index is predicated on the fact that long and short
hedgers do not always trade simultaneously or in the same quantity, so that speculators fill the role of
satisfying unmet hedging demand in the marketplace. We find that the speculation index has also
risen steadily from 2001 through mid-2008 (concurrent with the rise in non-commercial
participation), but has been relatively stable in the nearby contract since early 2006.
Utilizing more disaggregated data on daily trader positions, we implement Granger causality
tests to determine lead and lag relations between price changes and net position changes of various
traders in the crude oil futures markets. We execute Granger causality tests in two sub-periods--
from July 2000 through June 2004, a period marked by relatively stable participation and prices, and
from July 2004 through March 2009, the period marked by extreme price movements and increased
participation in the crude oil futures markets. We find that the changing net positions of no specific
trader groups lead to price changes in either sub-period or over the entire sample period. We also
examine net position changes of various combinations of non-commercial and commercial traders
2
and find similar results. No single group, or combination of groups (even those commonly
considered speculators) systematically Granger-cause prices in nearby contracts.
Instead, the causality runs from price changes to position changes, suggesting that various
groups of traders are generally trend followers. Commercial traders (in total), manufacturers,
commercial dealers, producers, swap dealers and managed money traders (hedge funds) are each
shown to be trend followers. Notably, non-commercial traders (in total) and the combined group of
swap dealers and non-commercial traders also exhibit trend following behavior over the full sample
period as well as sub-periods. These results also hold for daily net position changes in futures alone
and in the combined position changes from futures and futures-equivalent options positions. These
results are also robust for two-, three-, four- and five day measurement intervals for net position and
price changes. Although open interest (including non-commercial participation) is greatest in the
nearby contract, we also examine price changes and position changes in the first, second, and third
deferred contracts, finding similar results.
Our analysis updates and enhances similar findings in the Interagency Task Force Interim
Report on Crude Oil (ITF (2008)), which concludes that the sharp increase in crude oil prices through
July 2008 can be explained by the fundamentals of the crude oil market. Notably, our update
includes an analysis of the significant price collapse (from $147/bbl to below $40/bbl) from July
2008 through March 2009. We show that the price collapse has not been accompanied by a
significant drop in the speculation index, casting further doubt on claims that speculator position
changes have systematic effects on futures market prices during this period.
Two of the most important functions of futures markets are the transfer of risk and price
discovery. In a well-functioning futures market, hedgers interested in reducing their exposure to price
risk find counterparties. In a market without speculative interest, long hedgers must find short
hedgers with an equal and opposite hedging need. In fact, many traditional hedgers have dual
liquidity needs, intending to offset their futures positions before physical delivery of crude oil.
3
Speculators enhance liquidity and reduce search costs by taking the opposing positions when long
hedgers do not perfectly match short hedgers. In this regard, speculators provide immediacy and
facilitate the needs of hedgers by mitigating price risk, while adding to overall trading volume, which
contributes to more liquid and well-functioning markets.
Of course, excessive speculation has the potential to disrupt markets as well. Shleifer and
Summers (1990) note that herding can result from investors reacting to common signals or
overreacting to recent news. As de Long et al. (1990) show, rational speculators trading via positive
feedback strategies can increase volatility and destabilize prices. Our results, however, complement
findings by Boyd et al. (2009) and Brunetti and Buyuksahin (2009) who find that herding among
hedge funds is countercyclical and does not destabilize the crude oil futures markets, respectively,
during recent years.
In this paper, we identify groups of traders based on self-reported lines of business collected
and audited by the CFTC. Commercial traders consist of dealers, producers, manufacturers, and
other entities typically involved with crude oil as a commodity. Non-commercial traders include
floor brokers and traders and managed money traders (hedge funds). Although non-commercial
traders are typically considered speculators, commercial swap dealers who use futures markets to
hedge over-the-counter positions are considered speculators by some, since they lack direct exposure
to the underlying crude oil commodity. In fact, swap dealers commonly take positions for
commodity index funds that view commodities as a distinct asset class, raising concerns that these
funds convey the herding mentality from unsophisticated traders into futures markets. Overall, the
growth in hedge fund and swap dealer positions in crude oil futures markets (Buyuksahin et al.
(2009)) has led to claims that these traders destabilize markets and drive prices inexplicably high.
Despite these claims, there is surprisingly limited empirical evidence that this trading activity affects
prices or volatility. Notably, however, the CFTC’s Staff Report on Swap Dealers and Index Traders
4
(CFTC (2008)) shows that total swap dealer positions declined over the first six months of 2008
while crude oil futures prices rose from $100 to $140.
One limitation of our analysis is that the distinction between hedging and speculation in
futures markets is less clear than it may appear. Traditionally, traders with a commercial interest in
or an exposure to a physical commodity have been called hedgers, while those without a physical
position to offset have been called speculators. In practice, however, commercial traders may ―take a
view‖ on the price of a commodity or may not hedge in the futures market despite having an
exposure to the commodity, positions that could be considered speculative.
Traditional speculators can be differentiated based upon the time horizons at which they
operate. Scalpers or market makers, operate at the shortest time horizon – sometimes trading within
a single second. These traders typically do not trade with a view as to where prices are going, but
rather ―make markets‖ by standing ready to buy or sell at a moment’s notice. The goal of a market
maker is to buy contracts at a slightly lower price than the current market price and sell them at a
slightly higher price, perhaps at only a fraction of a cent profit on each contract. Skilled market
makers can profit by trading hundreds or even thousands of contracts a day. Market makers provide
immediacy to the market. Absent a market maker, a market participant would have to wait until the
arrival of a counterparty with an opposite trading interest.
Other types of speculators take longer-term positions based on their view of where prices
may be headed. ―Day traders‖ establish positions based on their views of where prices might be
moving in the next minutes or hours, while ―trend followers‖ take positions based on price
expectations over a period of days, weeks or months. These speculators can also provide liquidity to
hedgers in futures markets. Through their efforts to gather information on underlying commodities,
the activity of these traders serves to bring information to the markets and aid in price discovery.
While hedging and speculating are often considered opposing activities and are generally
identified with commercial and non-commercial traders, in practice both groups can contribute to

5
price discovery in futures markets. Futures prices reflect the opinions of all traders in the market.
Moreover, the actions of those who can but choose not to enter the futures market can also contribute
to price discovery. For example, a commercial trader holding physical inventory, but choosing not to
hedge using futures markets (by taking a short position) not only withholds downward pressure on
the futures price, but may also signal that prices are expected to rise in the future.
Activities that occur in other markets and other instruments can also impact futures markets.
There are three potential activities that might impact futures trading on U.S. exchanges: (i) the
trading of OTC derivatives contracts; (ii) the trading on exempt commercial markets (ECMs); and
(iii) the trading on foreign boards of trade. Futures markets comprise only one venue for hedging
price risk. In the context of risk management, market participants may be involved concurrently in
over-the-counter (OTC) transactions, trades on ECMs, and transactions in foreign markets. Crude oil
traders, for example, can hedge cash market positions using a combination of futures, swaps, bilateral
forward contracts, and cleared broker and ECM transactions.
The traditional speculative stabilizing theory of Friedman (1953), that profitable speculation
must involve buying when the price is low and selling when the price is high, has come under strong
criticism. Some argue that there is a possibility that speculative trading might lead to higher prices if
speculators increase their accumulation of inventories (Pirrong (2008)). However, as suggested by
Hamilton (2009b), crude oil inventories have been significantly lower than historical levels in late
2007 and early 2008 when crude oil price changes were most dramatic.
On the other hand, Davidson (2008) argues that the absence of higher inventories does not
necessarily indicate the absence of excess speculation in the market. Using the Marshallian idea the
―user cost‖, Davidson argues if oil prices are expected to rise in the future more rapidly than current
interest rates, then commercial producers can enhance total profits by leaving more oil underground

6
today for future production.1 If oil producers do take the user costs of foregone profits into account in
their profit maximizing production decisions, then producers may limit current production and above
ground inventories may not rise. In this regard, Davidson (2008) points out that traditional hedgers,
such as oil producers, might be involved in speculation.
Hamilton (2009a, 2009b) and Kilian (2008) suggest that the cause of the 2007-08 oil price
increase is the result of stagnant production and strong demand of crude oil, which lowered the short-
run price elasticity of oil to historically low levels. Hamilton further suggests that both factors--
stagnant production and low short-run price elasticity--are needed for speculation to drive prices too
high, but that financial speculation (by non-commercial entities) would cause inventories to rise. He
concludes that supply and demand fundamentals provide a more plausible explanation for the 2008
price spike.2
Our paper contributes to a rich empirical literature evaluating trader positions and prices in
futures markets. Using aggregated public Commitments of Traders (COT) data disseminated by the
CFTC, Brorsen and Irwin (1987) and Irwin and Yoshimaru (1999) fail to find a link between hedge
fund positions and price volatility and prices, respectively. Brown et al. (2000) find no link between
fund positions and falling currency values around the 1997 Asian financial crisis. Although these
findings are suggestive, researchers generally acknowledge that since public COT data is highly
aggregated, these results should be interpreted with caution. More recent research using
disaggregated data from the CFTC Large Trading Reporting System provides further evidence on the
relations between trader positions and price movements. Irwin and Holt (2004), for example, find a
small but positive relation between hedge fund trading volume and volatility for 13 different futures
1 User cost can be defined as the present value of future net benefit that is lost due to the use of the resource at
present. Of course, user costs relate only to exhaustible resources. 2 The Interagency Task Force Interim Report on Crude Oil (ITF (2008)) makes similar conclusions.

7
markets during 1994.3 Haigh, Hranaiova and Overdahl (2007), using directed graph analysis, show
that hedge funds enhance the price discovery function of the crude oil and natural gas futures
markets.4 Brunetti and Buyuksahin (2009) also find that speculative activity in five different futures
markets (including crude oil) does not cause price movements, but reduces risk by enhancing market
liquidity.
The remainder of the paper proceeds as follows. In section I, we describe our data and
methodology. In section II, we analyze Granger causality tests between trader positions and rate of
return as well as positions and volatility. We conclude in section III.
I. Data and Methodology
We analyze daily position and pricing data for NYMEX light sweet crude oil (West Texas
Intermediate grade, henceforth WTI) futures and options on futures contracts over the time period of
July 5, 2000 through March 18, 2009. Figure 1 portrays open interest and the prices for both the
nearby contract and the average of prices from all contract maturities. Open interest in crude oil
futures peaked in July 2007 and has since declined slightly. However, open interest futures-
equivalent options continued to rise until July 2008. Though visually interesting, this inspection of
open interest and price data provides little evidence on the relation between these two variables.
The position data utilized in this study comes from the CFTC’s Large Trader Reporting
System (LTRS) which is a collection of position-level information on the composition of open
interest across all futures and options-on-futures contracts for each market. It is collected by the
CFTC’s market surveillance staff to help the Commission fulfill its mission of detecting and
deterring futures market manipulation. These data must be filed daily by traders whose positions
3 This study suffers from an aggregation problem since they used total hedge fund positions as a proxy for nearby
positions. 4 Boyd et al. (2009) employ the same data set to analyze the existence of herding among hedge funds. They find that
the degree of herding in futures markets is similar to equity markets and that the moderate level of herding among
hedge funds serves to stabilize prices.

8
meet or exceed the CFTC’s reporting levels. For the WTI oil futures and options market used in this
study, this threshold has been 350 contracts since May 16, 2000 and was 300 contracts prior to that
date. Many similar positions are voluntarily reported which are included in the database. We find
that more than 90% of all WTI futures positions are reported to the CFTC during our sample period
(See Tables 1a and 1b).
The CFTC publishes a weekly Commitment of Traders (COT) report in which traders are
pooled into two broad categories: ―Commercial‖ and ―Non-commercial.‖5 A trading entity is
generally classified as ―Commercial‖ when it files a statement with the CFTC that indicates it is
commercially ―engaged in business activities hedged by the use of the futures or option markets.‖
Additionally, in order to ensure that traders are classified accurately and consistently, CFTC staff can
exercise judgment in re-classifying a trader based on additional information about the trader’s use of
the markets (CFTC (2004)). ―Non-commercials‖ are mostly financial traders, such as hedge funds,
mutual funds, and floor brokers and traders whose positions are reported even though they are not
registered with the CFTC under the Commodity Exchange Act (CEA).
Using the information contained in the publicly-available weekly COT reports for the WTI
crude oil futures market, Tables 1a and 1b clearly reveal the overall growth of this market since
2000. The tables show the average open interest in WTI crude oil futures and sum of futures-
equivalent (delta-adjusted) options positions for the aggregated commercial, non-commercial and
non-reportable trader categories. For each category and year, long and short positions are reported as
fractions of the total open interest. In 2008, on the short (long) side of the 1,279,534 contracts,
52.7% (51.0%) of all positions were held by commercial traders and 14.3% (16.8%) were held by
reporting non-commercial traders, with the remaining split between 26.8% non-commercial spread
positions (i.e., calendar spread positions constructed with long and short futures positions) and 6.2%
5 COT reports also provide data on the positions of non-reporting traders, which include speculators, proprietary
traders and smaller traders. This category comprises the difference between total open interest and the aggregate
positions of reporting traders.
9
(5.4%) in outright short (long) non-commercial futures positions. Table 1a shows that open interest
more than doubled during the entire sample period, from fewer than 500,000 contracts in 2000 to
more than 1.2 million contracts in 2007.6
One significant finding revealed in Table 1a is that the share of non-commercials in crude oil
futures has more than doubled from 15.5% to 41% of the long open interest during our sample
period. However, it is also important to note that increased participation of non-commercials
(traditional speculators) does not imply excessive speculation. As suggested by Working (1960), the
level of speculation is meaningful only in comparison with the level of hedging in the market.
Increased speculative positions naturally arise with increased hedging pressure in the market. In
order to assess the adequacy of speculative activity in the crude oil market relative to hedging
activity, we calculate Working’s (1960) speculative index in the nearby contract and for all maturities
in the crude oil futures market.7
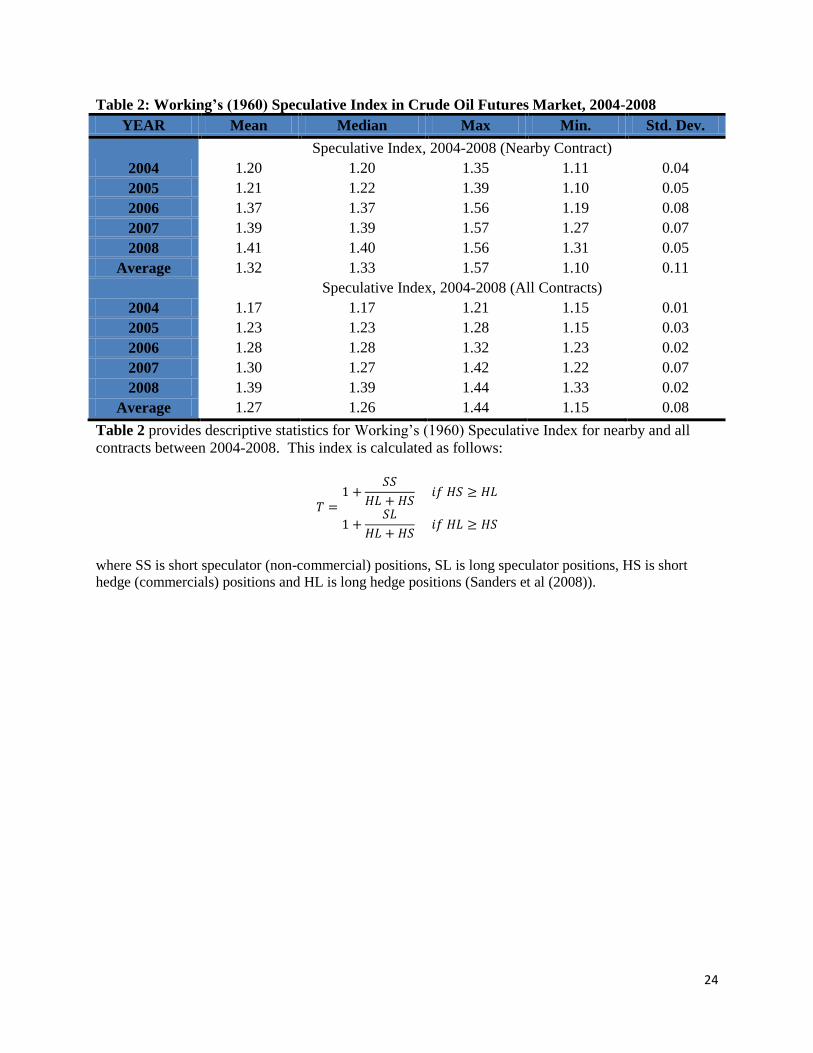
Table 2 presents descriptive statistics on the Working’s speculative index for nearby
contracts and all maturities from 2004 to 2008. In general, the speculative index displays a higher
value in nearby contracts relative to all contracts. For instance, the 1.20 speculative index in the
nearby contract during 2000 indicates 20% speculation in excess of what is minimally necessary to
meet short hedging needs. The speculative index value has risen over time to average 1.41 in 2008,
implying that speculation in excess of minimal short and long hedging needs increased to 41%. This
increase in the speculative index can result from speculators either increasing spread trades or short
6 Using average price of all contracts, the notional value of outstanding contracts was about $12 billion in 2000 and
$75 billion in 2009. At the peak of crude oil prices in 2008 (average price is around $101.5), notional value of
futures-only contract stood at around $130 billion.
7 Working’s speculative index is calculated as follows:
𝑇 =1 +
𝑆𝑆
𝐻𝐿 + 𝐻𝑆 𝑖𝑓 𝐻𝑆 ≥ 𝐻𝐿
1 +𝑆𝐿
𝐻𝐿 + 𝐻𝑆 𝑖𝑓 𝐻𝐿 ≥ 𝐻𝑆
where SS is short speculator (non-commercial) positions, SL is long speculator positions, HS is short hedge
(commercials) positions and HL is long hedge positions (Sanders et al (2008)).
10
hedging demand by commercials, especially merchant/dealers, in the sample period has increased.
Although potentially alarming, a speculative index of 1.41 is rather comparable to historical index
numbers in other markets (see Irwin et al. (2008)). For example, Peck (1981, 1982) reports the
speculative index ranging from 1.15 to 1.68 for agricultural products, depending on time period and
commodity. As Working (1960) also notes, the speculative index measures excess speculation in
technical terms, not in economic terms. Since the speculative index does not necessarily indicate
excessive speculation, we apply additional analyses to speculator positions the crude oil futures
market.
Figure 2a and 2b present the dynamics of Working’s speculative index for nearby and all
contracts over our sample period. Although prices and the speculative index appear to generally rise
and fall together, the correlation between daily price changes and changes in the speculative index is
-0.007 (-0.018) for nearby (all) contracts.8 The figure shows that even though price has declined
from $147 dollar to $35 between July of 2008 and January of 2009, the speculative index has been
relatively constant during the same period.
Whereas the public data only identify ―Commercial‖ vs. ―Non-commercial‖ categories of
crude oil traders, the data provided for this study decompose these two very broad categories into
their respective components. In the crude oil futures market, the main commercial sub-categories are
―dealer/merchants‖, which includes wholesalers, exporter/importers, and crude oil marketers;
―manufacturers‖, which includes refiners and fabricators; ―producers‖; and ―commodity swap
dealers‖, including all reporting swap dealers as well as arbitrageurs/broker dealers (financial swap
dealers and arbitrageurs/broker dealer sub-categories were merged with commodity swap dealers
partway through our sample data).
Traders in the dealer/merchant, manufacturer and producer sub-categories are sometimes
referred to as traditional hedgers. The commodity swap dealer sub-category, whose activity has
8 Both index and price level are non-stationary so we present the correlation between changes in these variables.
11
grown significantly since 2000, incorporates the positions of non-traditional hedgers, including
―entities whose trading predominantly reflects hedging of over-the-counter (OTC) transactions
involving commodity indices—for example, swap dealers holding long futures positions to hedge
short OTC commodity index exposure opposite institutional traders such as pension funds‖ (CFTC,
2006).9
The most active non-commercial sub-categories in crude oil futures market are floor brokers
and traders, a group including all reporting floor brokers and floor traders; and hedge funds, which
comprise all reporting commodity pool operators (CPOs), commodity trading advisors (CTAs),
associated persons controlling customer accounts, as well as other managed money traders.10 Many
hedge fund complexes are either advised or operated by CFTC-registered CPOs and/or CTAs and
associated persons who may also control customer accounts. Through its LTRS, the CFTC therefore
obtains positions of the operators and advisors to hedge funds, even though it is not a requirement
that these entities provide the CFTC with the name of the hedge fund (or another trader) they are
representing.11 It is clear that many of the large CTAs, CPOs, and associated persons are considered
to be hedge funds and hedge fund operators. Accordingly, we conform to the academic literature and
to common financial parlance by referring to the three types of institutions collectively as hedge
funds. In addition, for the purposes of this paper, market surveillance staff at the CFTC identified
other participants who were not registered in any of these three categories but were known to be
9 See Figure 3a.
10 Despite these clear distinctions in groups that comprise hedge funds, a point of terminology is in order. Although
hedge fund activity has been a subject of intense scrutiny in recent years by academic researchers, market
participants, policy makers and the media, there is no broadly accepted definition of a hedge fund. Nor are hedge
funds defined in the statutes governing futures trading. 11
A commodity pool is defined as an investment trust, syndicate or a similar form of enterprise engaged in trading
pooled funds in futures and options on futures contracts. A commodity pool is similar to a mutual fund company,
except that it invests pooled money in the futures and options markets. Like securities counterparts, a commodity
pool operator (CPO) might invest in financial markets or commodity markets. Unlike mutual funds, however,
commodity pools may be either long or short derivative contracts. A CPO’s principle objective is to provide smaller
investors the opportunity to invest in futures and options markets with greater diversification with professional trade
management. The CPO solicits funds from others for investing in futures and options on futures. The commodity-
trading advisor (CTA) manages the accounts and is the equivalent of an advisor in the securities world.
12
managing money – and so we also included these in the hedge fund category (see bottom of Table 2).
Lastly, non-registered participants are traders that have not yet been categorized or do not fit any
other category and who are not registered under the CEA.
Figures 3a and 3b present the growth of commercial and non-commercial traders,
respectively. During the sample period, commodity swap dealers have increased their open interest
more than threefold while dealer merchant increased by twofold. On the non-commercial side, the
biggest increase in open interest was recorded for hedge funds and non-registered participants.
For each group of traders, we use two measures of the group’s daily positions to assess
changes in the market. We use the net position of each group’s daily net position in futures-only and
futures plus adjusted options, which may be net short (-) or long (+). Over time, the net positions of
different trader categories display dynamic change. From Table 3a and 3b, we see that the net
positions (long – short) of commercial and non-commercial traders fluctuate from year to year in
nearby contracts.12 In general, however, we observe that commodity swap dealers have net futures
positions which have steadily increased during the sample period. Non-registered participants also
take net long positions over time. These two groups of traders on average take positions in the
opposite-direction of the other traders. Contrary to common belief, hedge funds as a group were net
short in the nearby contract during the recent run-up of crude oil prices.. In addition, we observe that
most trader subcategories’ net position in terms of magnitude in the nearby contracts has increased
during the sample period, most notably that of commodity swap dealers, which has more than
doubled in the nearby futures and more than tripled in all maturities since 2004.
Looking at the time series properties of the price and net positions data, we find that the price
variable is non-stationary while net positions of different trader categories in nearby contracts are
stationary in both level and first differences (See Table 4). In addition to our different trader types,
12
The roll-over strategy adopted in this paper is to switch to the new contract when the open interest of the nearby contract
(March 2005) is lower than the open interest of the next-to-nearby contract (June 2005). That is to say, when the open
interest in first deferred contract is higher than nearby contract, the first deferred contract becomes our nearby contract.

13
we also construct three aggregate net position variables: Net position of all commercials (COM),
non-commercials (NON) and non-commercial plus commodity swap dealers (ANC). Since
commodity swap dealers also include commodity index traders, these are also analyzed as part of
non-commercial traders. Although CFTC (2008) calculations suggest that in crude oil market not
more than 50 percent of swap dealer can be considered as commodity index trader, we will assume
that all the swap dealer activities are linked to commodity index trading. Since both net position
levels and changes are stationary, we provide our analysis along both dimensions for different trader
types.
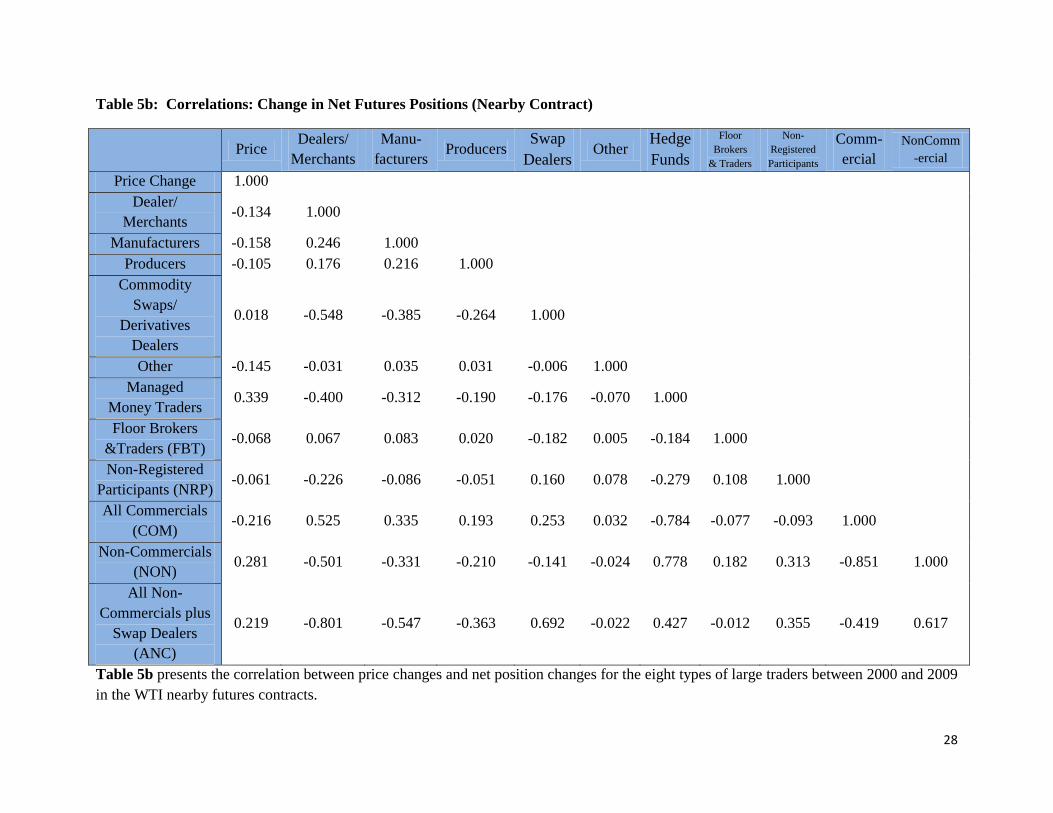
Our preliminary analysis of the relation between price changes and net positions taken by the
different trader types in nearby contracts starts by considering the correlation coefficients. Table 5a
and 5b report correlation coefficients between price changes and the positions of different types of
traders analyzed in this paper. The reported contemporaneous correlation suggests a positive and
significant relation between net positions of managed money traders (hedge funds) and price change
in nearby futures contracts. This positive and statistically significant correlation also holds in the case
of net position change. The relation between hedge funds positions and price changes displays
similar patterns in futures and futures equivalent options contract.
In the case of commodity swap dealers, we do not observe a statistically significant
correlation between prices and net position or net position change in nearby contracts. The
insignificant correlation between the level of net positions of swap dealers and the price change
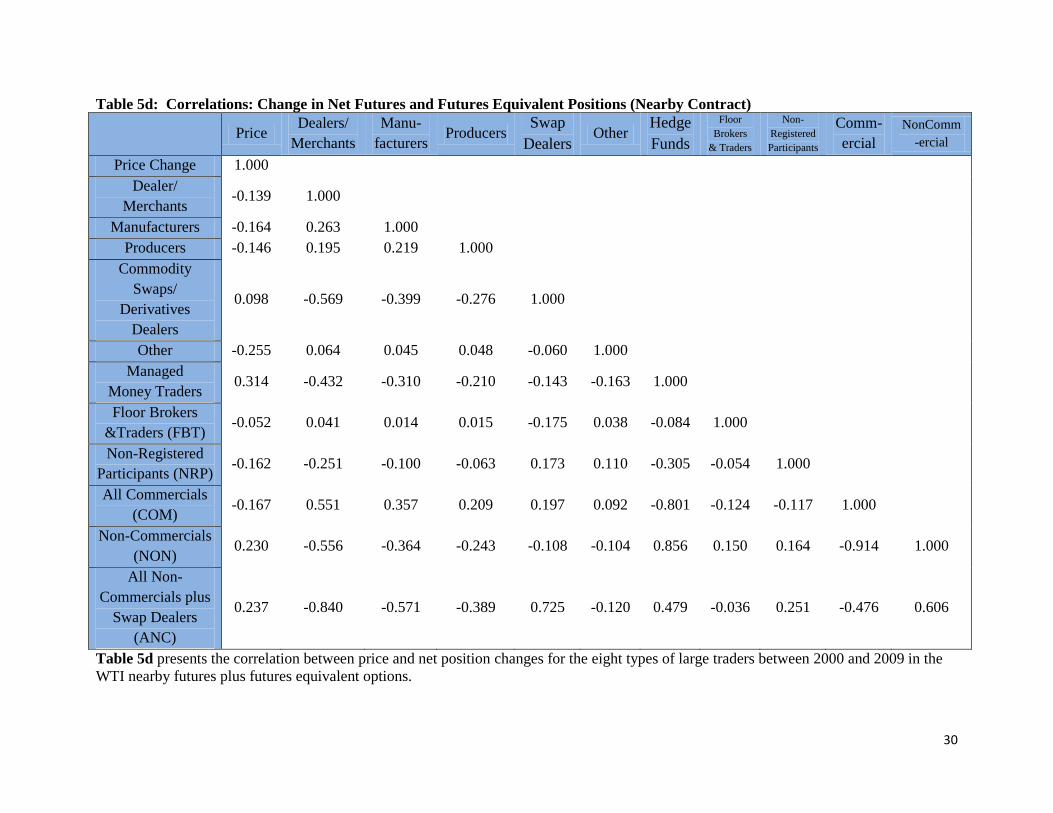
persists when we include futures equivalent options in our analysis. On the other hand, there is a
statistically significant positive correlation between change in net futures plus futures equivalent
options positions of swap dealers and the change in the nearby price.
As expected, the correlation between net positions of traditional hedgers and price changes is
negative and statistically significant. This implies that traditional hedgers move in the opposite
direction of prices. This result holds not only for futures positions but also for combined positions
14
(futures plus delta adjusted options). The simple correlation analysis provides three main results.
First, hedge fund net position is moving in the same direction as market prices. Second, traditional
commercial hedger net positions are negatively correlated with price changes. Finally, correlation
between commodity swap dealer net positions in nearby contracts and price changes is zero as
expected, since these traders generally do not change their long positions in nearby contracts.
However, correlations between price changes and net position changes of various groups of
market participants do not, and cannot, indicate causation from the position changes of one group of
traders to market price changes. A more formal way to analyze the interaction between daily price
changes and position changes is to directly examine whether various groups of traders change
positions in advance of price changes.
Intuitively, in order to realize gains from price changes, positions must be established prior to
those price changes. Prices then may respond to those positions, or more precisely, the signal
conveyed on establishing those positions. If specific trader categories were systematically
establishing positions in advance of profitable price movements, then a pattern of position changes
preceding price changes would emerge. Conversely, evidence of price changes leading position
changes would suggest that some market participants adjust their positions to reflect new
information. Price changes that systematically precede position changes indicate a trend following
behavior by a particular trading group.
A formal way to statistically test for whether one variable leads another are generally known
as Granger causality tests. However, Granger causality tests do not prove a causal relation between
variables, only a statistical probability of one variable leading another. Nonetheless, Granger
causality provides useful information as to whether a trader activity prompts, in a forecasting sense,
price movements and/or vice versa. In the next subsection, we provide brief description of
implementation of Granger causality test in our paper.
15
Testing Causality
The Granger causality test is based on a bivariate VAR representation of two weakly stationary and
ergodic time series {Xt} and {Yt}:
𝑋𝑡 = 𝐴 𝐿 𝑋𝑡 + 𝐵 𝐿 𝑌𝑡 + 𝜀𝑋,𝑡
𝑌𝑡 = 𝐶 𝐿 𝑋𝑡 + 𝐷 𝐿 𝑌𝑡 + 𝜀𝑌,𝑡
where A(L), B(L), C(L), D(L) are one sided lag polynomials of order a, b, c, and d, in the lag operator
L. The regression errors, {εX,t } and {εY,t}, are assumed to be independent and normally distributed
with mean zero and constant variance. Testing the non--causality from Y to X hypothesis; i.e. the
null hypothesis of “Y does not Granger-cause X” , requires testing whether the past values of Y are
useful in the prediction of the current value of X, after controlling for the contribution of past values
of X. The null hypothesis of non-causality from Y to X will be rejected if the coefficients on the past
values of Y (elements in B(L)) are jointly significantly different from zero. However, this implies
unidirectional causality from Y to X. Bidirectional causality requires Granger causality in both
directions; in which case, the coefficients on elements in both B(L) and C(L) are jointly different
from zero.
Since the test results are sensitive to the lag selection, it is important to choose the
appropriate lag length to ensure that the residuals have no serial correlation, no conditional
heteroskedasticity and do not deviate too much from Gaussian white noise. To find the optimal lag
used in the estimation, we employ the Schwarz criterion, which suggests one lag in each case.
II. Estimation Results
The impact of commodity index traders and hedge funds in the recent oil price run-up
between 2006 and 2008 followed by the late 2008 sharp decline can be studied with price and
position data. Our sample period covers both rise and drop in the price of crude oil. In our Granger

16
causality analysis, we analyze the daily price change and position changes by various trader groups
and combination of trader groups between July 2000 and March 2009. In addition to daily change,
we consider two-, three-, four- and five day price and position changes to see whether the relation
displays differences in the dynamics of price.
In the first part of the study, we analyze the relation between the price and net position
changes as well as net position changes of different trader types for our full sample. Analyzing price
and net position for eleven trader types (eight trader types plus three aggregate types (COM, NON,
ANC)) implies (10!*2*2) one-way relations for futures and futures plus futures-equivalent options
positions. However, our interest is in the relation between prices and positions rather than relations
among positions of various traders. Therefore, we present 44 one-way relations for net position
changes and price changes for futures and futures plus delta-adjusted options positions.
Table 6a, 6b and 6c present our results for causality between price changes and net positions
as well as net position changes for the nearby futures and futures plus options during our sample
period between July 5, 2000 and March 18, 2009. We estimate causality results for individual trader
groups as well as for aggregate non-commercial traders, commercial traders, and the combined
positions of non-commercial and swap dealer groups (to some, these represent aggregate speculative
positions in the crude oil futures market). As shown in Table 6, there are unidirectional causalities
from price changes to net position changes as well as to the net positions of most trader types.
Results from the nearby contract show no unidirectional or bi-directional causality running from
positions or position changes to price changes for any trader type, or any measurement interval (from
one to five days).
Specifically, Granger causality results in Table 6a suggest that we reject the null hypothesis
of Granger non-causality from price changes to net position changes and price changes to net
positions for aggregate trader groups as well. However, the reverse non-causality test cannot be
rejected. This result holds for futures as well as futures plus futures-equivalent options contracts.
17
Except for the positions of non-commercial traders combined with swap dealers, we observe that
unidirectional causality from price changes to position is weakening as we increase the number of
days in the measurement interval.
A similar pattern of causality is observed for individual trader group in the nearby futures
contracts. The non-causality from price changes to net positions and price changes to positions is
rejected at least in the daily price change for futures-only and futures plus delta adjusted options
position for the biggest two categories of non-commercials: managed money traders (hedge funds)
and floor brokers and traders. However, we fail to reject non-causality from position change to price
changes for these groups at 5 percent level of significance in both futures and futures plus options
contracts. There is a very weak evidence of causality from the level of net futures plus options
positions of floor brokers and traders to in price changes at the 5 percent level of significance, but the
rejection of non-causality only holds at the margin, that is to say when we increase the significance
level to 1 percent, we fail to reject the null of non-causality (See Table 6b).
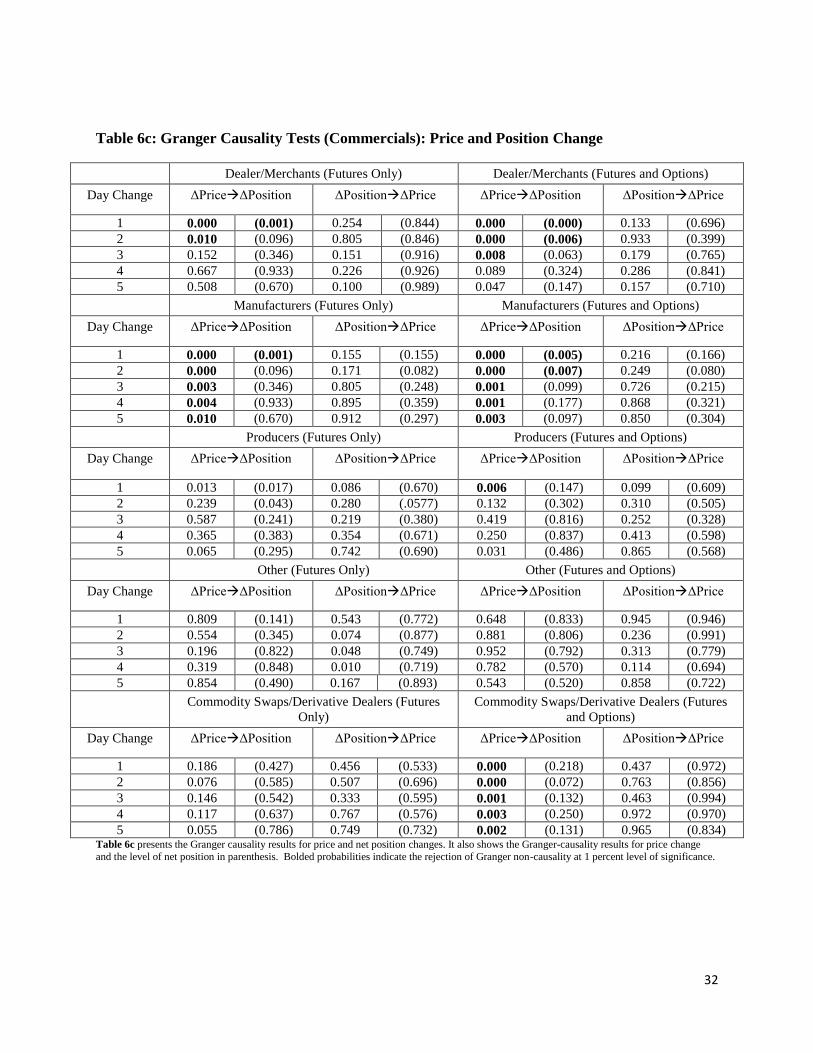
For commercials, on the other hand, price changes leads net position changes (and level of
net positions) of dealer/ merchant (AD), manufacturers (AM) and producers (AP) in nearby futures
contracts. When we extend our analysis to include futures equivalent options positions, swap dealer
position changes is also preceded by price changes. We do not observe any causality from net
position change (or level of net position) of commercial traders to price changes in any of our
specification.
In summary, we observe uni-directional causality from the level and net position changes of
some types of traders to change price. However, the reverse causality is rejected for all different
types of traders.13 This result holds for non-commercial traders in total, for managed money traders
and swap dealers individually, and for the positions of non-commercial traders combined with swap
13
We also analyze the relation between price and positions of different types of trader in the first, second and third
deferred futures as well as futures plus futures equivalent options positions. Our results for these contracts are in line with
the nearby contracts. The results are available from authors upon request.
18
dealers. Notably, we find no statistical evidence over the past eight and a half years that position
changes by any group of traders systematically precedes price changes. This result holds both for all
net position changes of all net commercial participants and for net positions held by traders in
commercial sub-categories: commercial manufacturers, commercial dealers, commercial producers,
and other commercial entities.
In fact, many trader groups are shown to be trend followers over the full sample period,
including commercial traders in total and manufacturers, commercial dealers, producers, swap
dealers and managed money traders individually. Notably, swap dealers and managed money traders
as well as the positions of non-commercial traders combined with swap dealers also exhibit trend
following behavior over the full sample period.
In the second part of the study, we divided our sample into two sub-periods. The first sub-
period is spans the beginning of July 2000 to June 2004; the second sub-period covers the period
from July 2004 to March 2009.14 The first sub-period can be characterized as a relatively stable
period in terms of crude oil prices; the crude oil prices fluctuated between 20 and 40 dollars per
barrel. The second sub-period is, on the other hand, represented by the continuous rise in the price of
oil until July 2008 and a rather rapid decline afterwards. It also coincides with the increased
participation of commodity swap dealers in crude oil futures markets.
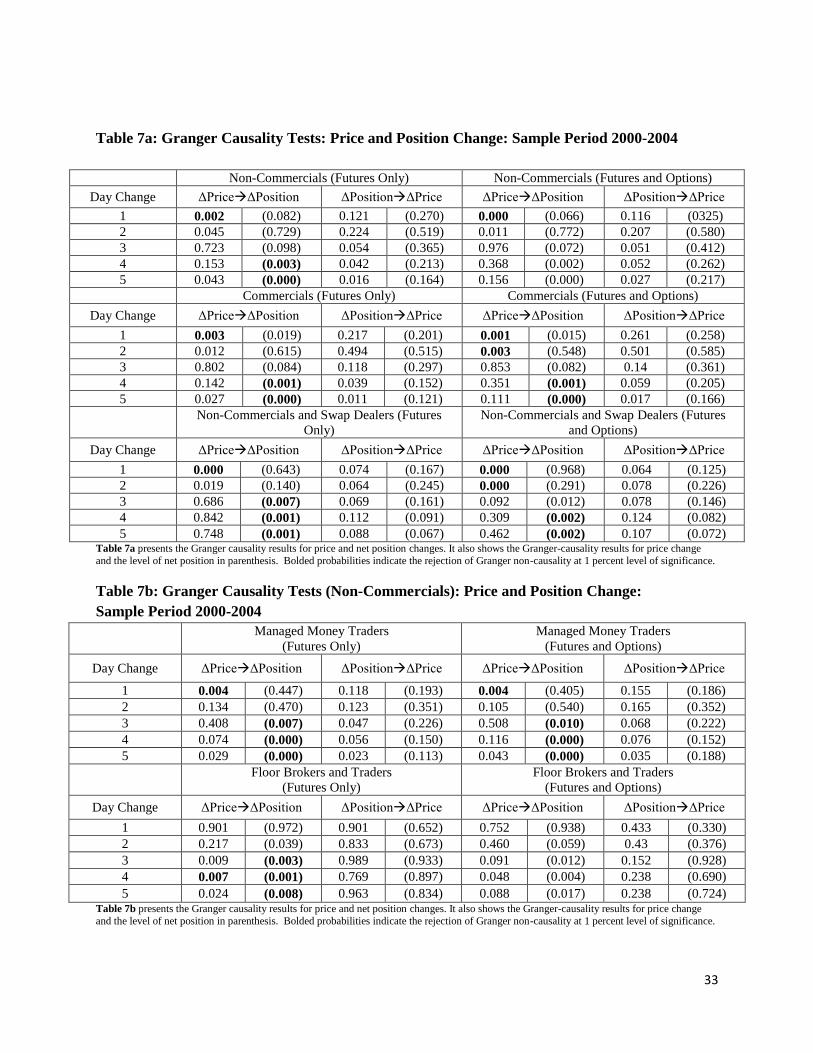
Tables 7a, 7b and 7c show our Granger- causality results for the first sub- period for
aggregate, non-commercial and commercial traders, respectively. The results are in line with those
reported for the full sample. The findings suggest a uni-directional causality from position change to
price changes for all our aggregate categories, especially in the futures and options combined
positions. Individual traders’ category results also confirm our full sample results. In this period, the
14
Our analysis of the period from July 2004 to July 2008 also provided similar results. The significance of this
period is the fact that crude oil prices have risen continuously and have reached their peak in July 2008.

19
net position changes of managed money traders and commodity swap dealers is Granger caused by
the price change.
Tables 8a, 8b and 8c provide our causality results for the second sub-period. There is strong
evidence of uni-directional causality from price change to net position changes of different trader
types. However, we again fail to observe bidirectional causality between price change and net
position change of different trader groups. Specifically, the net position changes of non-commercials,
commercials as well as non-commercials combined with swap dealers is preceded by price change.
Although we observe some weak evidence of causality from the level of net positions of non-
commercials combined with swap dealers, we fail to see this causality in the individual groups of this
aggregate group.
III. Conclusions
The increased participation of traditional speculators as well as commodity index traders in crude oil
futures market raise the question of whether these traders have an impact on market prices. The
recent increase and eventually fast decline in crude oil prices has been linked to speculators. Based
on our linear Granger causality tests, we fail to find the causality from these traders position to
prices. Our results suggest that price changes leads the net position and net position changes of
speculators and commodity swap dealers, with little or no feedback in the reverse direction. This uni-
directional causality suggests that traditional speculators as well as commodity swap dealers are
generally trend followers. However, Granger- causality results should not be interpreted as ―cause‖
and ―effect‖ relation but should be interpreted as lead and lag relation between variables. Therefore,
our results should not also be interpreted as price changes causing position changes. It might be
possible that both variables could be reacting to the same common factors.
20
References
Boyd, Naomi, Bahattin Buyuksahin, Michael S. Haigh, and Jeffrey H. Harris, 2009, The impact
herding in futures markets, CFTC Working Paper.
Brorsen, B.W. and Irwin, S.H., 1987. Futures funds and price volatility. The Review of Futures
Markets 6, 118–135.
Brown, Stephen J., Goetzmann, William N. and Park, James M. 2000, Hedge funds and the Asian
currency crisis of 1997, Journal of Portfolio Management 26, 95-101.
Brunetti, Celso and Bahattin Buyuksahin, 2009, Is speculation destabilizing?, CFTC Working Paper.
Buyuksahin, Bahattin, Michael S. Haigh, Jeffrey H. Harris, James A. Overdahl and Michel A. Robe,
2009, Fundamentals, trader activity and derivative pricing, CFTC Working Paper.
CFTC, 2008, Staff Report on Swap Dealers and Index Traders.
Davidson, Paul, 2008 Crude oil prices: market fundamentals or speculation?, Challenge 51, 1110-
118.
De Long, J. Bradford, Andrei Shleifer, Lawrence H. Summers and Robert J. Waldmann, 1990,
Positive feedback investment strategies and destabilizing rational speculation, Journal of
Finance 45, 379-395.
Friedman, Milton, 1953, The case for flexible exchange rates, in Essays in Positive Economics,
University of Chicago Press, Chicago, 157-203.
Fung, William, and David A. Hsieh, 2000, Measuring the market impact of hedge funds, Journal of
Empirical Finance 7, 1-36.

21
Haigh, Michael S., Jana Hranaiova, and James A. Overdahl, 2007, Price volatility, liquidity
provision, and the role of hedge funds in energy futures markets, Journal of Alternative
Investments, 4, 10-38.
Hamilton, James D., 2005, Oil and the macroeconomy, The New Palgrave Dictionary of Economics,
Second Edition. Steven N. Durlauf and Lawrence E. Blume, Eds. Palgrave Macmillan, 2008.
Hamilton, James D., 2009, Understanding crude oil prices, Energy Journal, 30, 179-206.
Hamilton, James D., 2009b, Causes and consequences of the oil shock of 2007-08, University of
California—San Diego Working Paper.
Irwin, Scott H., and Bryce R. Holt, 2004, The effect of large hedge fund and CTA trading on futures
market volatility, Commodity Trading Advisors: Risk, Performance, Analysis and Selection,
Gregoriou, G.N., Karavas, V.N., L'Habitant, F-S. and Rouah, F. eds., John Wiley and Sons.
Irwin Scott H., Merrin, Robert P. and Dwight R. Sanders, 2008, The Adequacy of Speculation in
Agricultural Futures Markets: Too Much of a Good Thing? Marketing and Outlook Research
Reports #2, University of Illinois at Urbana-Champaign.
Irwin, Scott H., and S. Yoshimaru, 1999, Managed futures, positive feedback trading, and futures
price volatility, The Journal of Futures Markets 19, 759-776.
Kilian, Lutz, 2008a, The economic effects of energy price shocks, Journal of Economic Literature,
forthcoming.
Kilian, Lutz. 2008b, Not all oil price shocks are alike: disentangling demand and supply shocks in the
crude oil market, American Economic Review, forthcoming.

22
Kilian, Lutz and Cheolbeom Park, 2007, The impact of oil price shocks on the U.S. stock market,
CEPR Working Paper 6166, March. Revised, June 2008.
Nofsinger, John R. and Richard W. Sias, 1999, Herding and Feedback Trading by Institutional and
Individual Investors, Journal of Finance 54, 2263-2295.
Peck, A.E., 1981, The adequacy of speculation on the wheat, corn, and soybean futures markets,
Research in Domestic and International Agribusiness Management, 17-29.
Peck, A.E., 1982, Estimation of hedging and speculative positions in futures markets revisited, Food
Reseach Institute Studies 18, 181-195.
Pirrong, Craig, 2008, Stochastic fundamental Volatility, Speculation, and Commodity Storage,
University of Houston Working Paper.
Shleifer, Andrei and Lawrence H. Summers, 1990, The noise trader approach to finance, The Journal
of Economic Perspectives 4, 19-33.
US Interagency Task Force on Markets, 2008, Interim Report on Crude Oil.
Working, Holbrook, 1960, Speculation on hedging markets, Stanford University Food Research
Institute Studies 1, 185-220.

23
Table 1a: Open Interest in Crude Oil Futures, 2000-2009
Non-commercials (%) Commercials (%) Non-Reportables
YEAR Long Short Spread Long Short Long Short Total Open
Interest
2000 8.9 7.9 6.6 75.0 76.1 9.4 9.3 448754
2001 4.9 11.5 7.7 78.8 70.5 8.6 10.3 438955
2002 10.5 8.2 13.7 64.7 68.9 11.1 9.2 486083
2003 13.3 12.8 9.3 68.0 67.7 9.4 10.2 542454
2004 17.5 12.0 9.6 64.2 69.3 8.8 9.1 689326
2005 14.5 13.2 15.4 62.7 62.2 7.3 9.1 817174
2006 15.6 13.1 19.6 58.9 60.5 6.0 6.8 1063986
2007 14.9 11.6 21.7 58.2 61.0 5.3 5.7 1393664
2008 16.8 14.3 26.8 51.0 52.7 5.4 6.2 1279534
2009 17.5 15.7 23.4 52.9 54.7 6.2 6.2 1200124
Table 1b: Open Interest in Crude Oil Futures and Futures-Equivalent Options, 2000-2009
Non-commercials (%) Commercials (%) Non-Reportables
YEAR Long Short Spread Long Short Long Short Total Open
Interest
2000 6.5 3.1 14.1 71.6 74.6 7.8 8.2 618590
2001 3.8 4.8 15.1 74.1 72.1 7.0 8.0 626904
2002 6.4 2.9 21.3 64.3 69.2 8.0 6.6 779618
2003 8.9 4.1 20.5 63.4 67.6 7.2 7.8 830327
2004 12.5 4.2 21.4 59.3 67.4 6.8 7.0 1033835
2005 9.4 5.1 27.2 58.2 61.3 5.2 6.3 1344618
2006 10.1 6.3 30.3 55.4 58.7 4.2 4.6 1740532
2007 9.3 5.3 30.8 56.4 60.1 3.5 3.7 2409755
2008 8.2 4.7 41.4 47.6 50.8 2.8 3.1 2887494
2009 7.6 4.1 36.9 52.6 56.1 2.9 2.9 2888548
Notes: Table 1a and 1b provides average open interest in futures and futures plus futures equivalent
options, respectively, since 2000. Open interest data are from the weekly Commitment of Traders
Reports from July 5, 2000 through April 28, 2009. We report open interest figures for the total
positions (i.e., futures and the sum of futures and futures-equivalent options positions, respectively)
of commercial and non-commercial traders. When the CFTC publishes its weekly Commitment of
Traders Report, reporting traders are categorized into two broad groups: ―Commercials‖ (right
panel), who have declared an underlying hedging purpose, and ―Non-commercials‖ (left panel), who
have not. For each category, the long and short positions are reported as fractions of the overall open
interest. For example, on the short [long] side of the 1,279,534 open interest in 2008, 52.7% [51.0%]
of all positions were held by commercial traders and 14.3% [16.8%] were held by reporting non-
commercial traders, with the rest split between 26.8% in spread positions (i.e., calendar spread
positions constructed with long and short futures positions) held by reporting non-commercial traders
and 6.2% [5.4%] in outright short [long] futures positions held by non-reporting traders.
Table 1c: Working’s Speculations Index, 2004-2008
24
Table 2: Working’s (1960) Speculative Index in Crude Oil Futures Market, 2004-2008
YEAR Mean Median Max Min. Std. Dev.
Speculative Index, 2004-2008 (Nearby Contract)
2004 1.20 1.20 1.35 1.11 0.04
2005 1.21 1.22 1.39 1.10 0.05
2006 1.37 1.37 1.56 1.19 0.08
2007 1.39 1.39 1.57 1.27 0.07
2008 1.41 1.40 1.56 1.31 0.05
Average 1.32 1.33 1.57 1.10 0.11
Speculative Index, 2004-2008 (All Contracts)
2004 1.17 1.17 1.21 1.15 0.01
2005 1.23 1.23 1.28 1.15 0.03
2006 1.28 1.28 1.32 1.23 0.02
2007 1.30 1.27 1.42 1.22 0.07
2008 1.39 1.39 1.44 1.33 0.02
Average 1.27 1.26 1.44 1.15 0.08
Table 2 provides descriptive statistics for Working’s (1960) Speculative Index for nearby and all
contracts between 2004-2008. This index is calculated as follows:
𝑇 =1 +
𝑆𝑆
𝐻𝐿 + 𝐻𝑆 𝑖𝑓 𝐻𝑆 ≥ 𝐻𝐿
1 +𝑆𝐿
𝐻𝐿 + 𝐻𝑆 𝑖𝑓 𝐻𝐿 ≥ 𝐻𝑆
where SS is short speculator (non-commercial) positions, SL is long speculator positions, HS is short
hedge (commercials) positions and HL is long hedge positions (Sanders et al (2008)).

Table 3a: Average Daily Net Futures Positions of the Major WTI Traders (Nearby Contract)
Dealers/
Merchants Manufacturers Producers Swap Dealers Other Hedge Funds
Floor Brokers
& Traders
Non-Registered
Participants Price
2000 -12103.4 -11065.2 193.5 44574.2 485.4 13282.4 -2849.7 -7263.8 31.4
2001 -242.0 -8023.9 -56.6 36617.0 -21.6 -8572.2 -5621.6 -3094.6 25.9
2002 -25157.3 -17017.6 -5065.7 42677.9 343.3 15317.3 -5340.4 1224.5 26.1
2003 -27127.7 -23783.3 -6468.4 39030.0 390.6 29331.6 -11990.6 1784.7 30.8
2004 -47185.0 -29237.9 -10743.9 53885.8 290.3 44992.9 -9660.6 1259.6 41.4
2005 -59738.0 -30733.3 -9663.2 85620.3 281.1 25491.0 -7285.3 3357.7 57.0
2006 -55527.7 -25246.4 -9550.7 90792.0 -269.3 1645.5 -9455.5 12728.4 66.8
2007 -66087.7 -27365.2 -8073.3 117983.2 -1209.3 -18643.1 -4633.2 19320.7 72.5
2008 -55788.9 -16530.7 -4955.6 100288.8 -638.6 -11052.5 -6791.5 5350.2 99.8
2009 -107037.5 -18750.0 -9221.4 96796.2 3827.6 16804.8 -9918.9 34299.3 43.4
Table 3b: Average Daily Net Futures plus Futures Equivalent Options Positions of the Major WTI Traders (Nearby Contract)
Dealers/
Merchants Manufacturers Producers Swap Dealers Other Hedge Funds
Floor Brokers
& Traders
Non-Registered
Participants Price
2000 -14800.1 -13516.8 411.4 47243.0 31.6 12987.3 -209.5 -4995.2 31.4
2001 -1370.5 -10210.9 -79.4 32901.5 199.7 -8424.9 -266.1 -458.9 25.9
2002 -27997.5 -17971.0 322.5 40356.6 -4814.4 14721.8 -802.6 2940.9 26.1
2003 -33038.4 -26372.3 332.8 34121.2 -7110.4 30542.7 -1104.1 4284.5 30.8
2004 -51427.4 -31373.2 -41.7 49384.9 -11116.7 45123.8 -67.3 3955.4 41.4
2005 -60036.7 -30286.9 -736.2 81930.1 -10036.7 23014.8 -1793.9 5991.6 57.0
2006 -57039.8 -26691.2 -1825.8 89927.4 -10049.6 1865.0 -5685.6 15020.4 66.8
2007 -67627.1 -26511.1 -1379.5 122404.5 -8662.4 -20401.7 -2859.9 15367.0 72.5
2008 -54854.1 -16093.7 -937.5 93219.6 -5043.0 -11758.4 -2729.8 7805.0 99.8
2009 -108569.4 -18174.8 3776.6 88249.5 -9226.0 19963.6 -6241.2 38260.3 43.4
Table 2a and 2b present the annual average net position of eight types of large traders between 2000 and 2009 in the WTI nearby
futures and futures plus futures equivalent options, respectively. Prior to August 2003, the ―NC‖ category sums the positions of
presently inactive commercial traders. However we ignore NC category in our discussions.

26
Table 4: Augmented Dickey Fuller Test for Prices and Positions Data in Futures-Only and Futures plus Futures Equivalent
Options in Crude Oil Market (2000-2009)
Futures-Only Futures and Futures Equivalent Options
Nearby Contract Nearby Contract
Level First Difference Level First Difference.
Price -0.98 -23.36 -0.98 -23.37
Dealers/
Merchants -9.36 -11.75 -9.57 -9.16
Manufacturers -12.46 -4.89 -13.14 -5.48
Producers -8.20 -7.73 -7.99 -7.64
Commodity Swaps/
Derivative Traders -9.21 -7.22 -9.85 -9.38
Other -1.71 -3.73 -2.53 -3.40
Managed Money Traders -5.51 -5.95 -5.64 -7.42
Floor Brokers
and Traders -4.65 -4.54 -7.15 -6.84
Non-Registered
Participants -5.03 -5.11 -5.77 -7.75
All Commercials -6.13 -5.55 -6.81 -8.76
Non-Commercials -6.41 -4.59 -7.21 -8.20
All Non-Commercials -9.72 -12.25 -9.81 -10.35
Table 4 presents the unit root tests on the price and net positions for the eight types of large traders between 2000 and 2009 in the WTI
futures and futures plus futures equivalent options, respectively. The critical value for ADF test statistics are -3.43, -2.86 and -2.56 for 1,
5 and 10 percent level of significance. If the calculated value is lower than critical value, then the series is said to be stationary at the
relevant level of significance.

27
Table 5a: Correlations: Net Futures Positions (Nearby Contract)
Price
Dealers/
Merchants
Manu-
facturers Producers
Swap
Dealers Other
Hedge
Funds
Floor
Brokers
& Traders
Non-
Registered
Participants
Comm-
ercial
NonComm
-ercial
Price Change 1.000
Dealer/
Merchants -0.021 1.000
Manufacturers -0.063 0.420 1.000
Producers -0.029 0.422 0.480 1.000
Commodity
Swaps/
Derivatives
Dealers
-0.010 -0.680 -0.378 -0.317 1.000
Other -0.030 -0.175 0.062 -0.035 -0.039 1.000
Managed
Money Traders 0.095 -0.182 -0.362 -0.305 -0.410 0.231 1.000
Floor Brokers
&Traders (FBT) 0.004 0.127 0.094 0.094 -0.184 -0.346 -0.164 1.000
Non-Registered
Participants (NRP) -0.018 -0.456 -0.176 -0.205 0.269 -0.089 -0.230 0.229 1.000
All Commericals
(COM) -0.065 0.277 0.356 0.309 0.425 -0.176 -0.880 -0.109 -0.153 1.000
Non-Commercials
(NON) 0.088 -0.342 -0.409 -0.366 -0.338 0.102 0.850 0.191 0.257 -0.965 1.000
All Non-
Commericals plus
Swap Dealers
(ANC)
0.054 -0.911 -0.667 -0.575 0.726 0.037 0.222 -0.040 0.449 -0.291 0.401
Table 5a presents the correlation between price and net position changes for the eight types of large traders between 2000 and 2009 in the
WTI nearby futures contracts.
28
Table 5b: Correlations: Change in Net Futures Positions (Nearby Contract)
Price
Dealers/
Merchants
Manu-
facturers Producers
Swap
Dealers Other
Hedge
Funds
Floor
Brokers
& Traders
Non-
Registered
Participants
Comm-
ercial
NonComm
-ercial
Price Change 1.000
Dealer/
Merchants -0.134 1.000
Manufacturers -0.158 0.246 1.000
Producers -0.105 0.176 0.216 1.000
Commodity
Swaps/
Derivatives
Dealers
0.018 -0.548 -0.385 -0.264 1.000
Other -0.145 -0.031 0.035 0.031 -0.006 1.000
Managed
Money Traders 0.339 -0.400 -0.312 -0.190 -0.176 -0.070 1.000
Floor Brokers
&Traders (FBT) -0.068 0.067 0.083 0.020 -0.182 0.005 -0.184 1.000
Non-Registered
Participants (NRP) -0.061 -0.226 -0.086 -0.051 0.160 0.078 -0.279 0.108 1.000
All Commercials
(COM) -0.216 0.525 0.335 0.193 0.253 0.032 -0.784 -0.077 -0.093 1.000
Non-Commercials
(NON) 0.281 -0.501 -0.331 -0.210 -0.141 -0.024 0.778 0.182 0.313 -0.851 1.000
All Non-
Commercials plus
Swap Dealers
(ANC)
0.219 -0.801 -0.547 -0.363 0.692 -0.022 0.427 -0.012 0.355 -0.419 0.617
Table 5b presents the correlation between price changes and net position changes for the eight types of large traders between 2000 and 2009
in the WTI nearby futures contracts.

29
Table 5c: Correlations: Net Futures and Futures Equivalent Positions (Nearby Contract)
Price
Dealers/
Merchants
Manu-
facturers Producers
Swap
Dealers Other
Hedge
Funds
Floor
Brokers
& Traders
Non-
Registered
Participants
Comm-
ercial
NonComm
-ercial
Price Change 1.000
Dealer/
Merchants -0.033 1.000
Manufacturers -0.066 0.412 1.000
Producers -0.039 0.454 0.487 1.000
Commodity
Swaps/
Derivatives
Dealers
0.015 -0.662 -0.358 -0.347 1.000
Other -0.051 -0.020 0.108 0.134 -0.211 1.000
Managed
Money Traders 0.089 -0.235 -0.387 -0.305 -0.414 0.116 1.000
Floor Brokers
&Traders (FBT) 0.024 0.307 0.069 0.077 -0.320 0.078 0.102 1.000
Non-Registered
Participants (NRP) -0.071 -0.454 -0.124 -0.235 0.356 0.024 -0.247 -0.401 1.000
All Commercials
(COM) -0.050 0.320 0.379 0.316 0.405 -0.189 -0.932 -0.091 -0.023 1.000
Non-Commercials
(NON) 0.067 -0.377 -0.435 -0.393 -0.326 0.137 0.939 0.073 0.083 -0.972 1.000
All Non-
Commercials plus
Swap Dealers
(ANC)
0.063 -0.912 -0.659 -0.618 0.734 -0.106 0.273 -0.258 0.404 -0.306 0.403
Table 5c presents the correlation between price and net position changes for the eight types of large traders between 2000 and 2009 in the
WTI nearby futures plus futures equivalent options.
30
Table 5d: Correlations: Change in Net Futures and Futures Equivalent Positions (Nearby Contract)
Price
Dealers/
Merchants
Manu-
facturers Producers
Swap
Dealers Other
Hedge
Funds
Floor
Brokers
& Traders
Non-
Registered
Participants
Comm-
ercial
NonComm
-ercial
Price Change 1.000
Dealer/
Merchants -0.139 1.000
Manufacturers -0.164 0.263 1.000
Producers -0.146 0.195 0.219 1.000
Commodity
Swaps/
Derivatives
Dealers
0.098 -0.569 -0.399 -0.276 1.000
Other -0.255 0.064 0.045 0.048 -0.060 1.000
Managed
Money Traders 0.314 -0.432 -0.310 -0.210 -0.143 -0.163 1.000
Floor Brokers
&Traders (FBT) -0.052 0.041 0.014 0.015 -0.175 0.038 -0.084 1.000
Non-Registered
Participants (NRP) -0.162 -0.251 -0.100 -0.063 0.173 0.110 -0.305 -0.054 1.000
All Commercials
(COM) -0.167 0.551 0.357 0.209 0.197 0.092 -0.801 -0.124 -0.117 1.000
Non-Commercials
(NON) 0.230 -0.556 -0.364 -0.243 -0.108 -0.104 0.856 0.150 0.164 -0.914 1.000
All Non-
Commercials plus
Swap Dealers
(ANC)
0.237 -0.840 -0.571 -0.389 0.725 -0.120 0.479 -0.036 0.251 -0.476 0.606
Table 5d presents the correlation between price and net position changes for the eight types of large traders between 2000 and 2009 in the
WTI nearby futures plus futures equivalent options.

Table 6a: Granger Causality Tests: Price and Position Change (Nearby)
Non-Commercials (Futures Only) Non-Commercials (Futures and Options)
Day Change ΔPriceΔPosition ΔPositionΔPrice ΔPriceΔPosition ΔPositionΔPrice
1 0.000 (0.001) 0.466 (0.227) 0.000 (0.000) 0.805 (0.376)
2 0.083 (0.670) 0.363 (0.185) 0.001 (0.046) 0.645 (0.246)
3 0.693 (0.952) 0.593 (0.172) 0.062 (0.208) 0.163 (0.372)
4 0.164 (0.080) 0.342 (0.187) 0.858 (0.941) 0.101 (0.394)
5 0.270 (0.137) 0.139 (0.254) 0.527 (0.615) 0.040 (0.496)
Commercials (Futures Only) Commercials (Futures and Options)
Day Change ΔPriceΔPosition ΔPositionΔPrice ΔPriceΔPosition ΔPositionΔPrice
1 0.000 (0.002) 0.873 (0.358) 0.000 (0.000) 0.643 (0.452)
2 0.077 (0.927) 0.398 (0.259) 0.001 (0.022) 0.645 (0.287)
3 0.785 (0.552) 0.429 (0.360) 0.104 (0.315) 0.342 (0.476)
4 0.161 (0.027) 0.097 (0.406) 0.642 (0.953) 0.057 (0.598)
5 0.140 (0.067) 0.043 (0.481) 0.659 (0.723) 0.027 (0.649)
Non-Commercials and Swap Dealers (Futures
Only)
Non-Commercials and Swap Dealers (Futures and
Options)
Day Change ΔPriceΔPosition ΔPositionΔPrice ΔPriceΔPosition ΔPositionΔPrice
1 0.000 (0.019) 0.983 (0.552) 0.000 (0.000) 0.313 (0.376)
2 0.000 (0.054) 0.946 (0.348) 0.000 (0.005) 0.973 (0.171)
3 0.002 (0.263) 0.209 (0.425) 0.000 (0.053) 0.153 (0.378)
4 0.031 (0.837) 0.417 (0.497) 0.000 (0.341) 0.376 (0.432)
5 0.008 (0.530) 0.293 (0.440) 0.000 (0.109) 0.305 (0.377) Table 6a presents the Granger causality results for price and net position changes. It also shows the Granger-causality results for price change
and the level of net position in parenthesis. Bolded probabilities indicate the rejection of Granger non-causality at 1 percent level of significance.
Table 6b: Granger Causality Tests (Non-Commercials): Price and Position Change
Managed Money Traders
(Futures Only)
Managed Money Traders
(Futures and Options)
Day Change ΔPriceΔPosition ΔPositionΔPrice ΔPriceΔPosition ΔPositionΔPrice
1 0.000 (0.000) 0.991 (0.234) 0.000 (0.000) 0.813 (0.229)
2 0.001 (0.116) 0.245 (0.113) 0.000 (0.051) 0.170 (0.113)
3 0.039 (0.348) 0.956 (0.235) 0.012 (0.153) 0.990 (0.242)
4 0.867 (0.284) 0.656 (0.288) 0.388 (0.793) 0.624 (0.298)
5 0.717 (0.731) 0.223 (0.405) 0.299 (0.670) 0.215 (0.396)
Floor Brokers and Traders
(Futures Only)
Floor Brokers and Traders
(Futures and Options)
Day Change ΔPriceΔPosition ΔPositionΔPrice ΔPriceΔPosition ΔPositionΔPrice
1 0.004 (0.002) 0.007 (0.317) 0.435 (0.168) 0.439 (0.044)
2 0.199 (0.138) 0.198 (0.690) 0.615 (0.725) 0.990 (0.088)
3 0.477 (0.519) 0.075 (0.234) 0.228 (0.309) 0.643 (0.046)
4 0.388 (0.218) 0.154 (0.239) 0.461 (0.819) 0.447 (0.062)
5 0.348 (0.189) 0.372 (0.357) 0.382 (0.875) 0.725 (0.113)
Table 6b presents the Granger causality results for price and net position changes. It also shows the Granger-causality results for price change and the level of net position in parenthesis. Bolded probabilities indicate the rejection of Granger non-causality at 1 percent level of significance.
32
Table 6c: Granger Causality Tests (Commercials): Price and Position Change
Dealer/Merchants (Futures Only) Dealer/Merchants (Futures and Options)
Day Change ΔPriceΔPosition ΔPositionΔPrice ΔPriceΔPosition ΔPositionΔPrice
1 0.000 (0.001) 0.254 (0.844) 0.000 (0.000) 0.133 (0.696)
2 0.010 (0.096) 0.805 (0.846) 0.000 (0.006) 0.933 (0.399)
3 0.152 (0.346) 0.151 (0.916) 0.008 (0.063) 0.179 (0.765)
4 0.667 (0.933) 0.226 (0.926) 0.089 (0.324) 0.286 (0.841)
5 0.508 (0.670) 0.100 (0.989) 0.047 (0.147) 0.157 (0.710)
Manufacturers (Futures Only) Manufacturers (Futures and Options)
Day Change ΔPriceΔPosition ΔPositionΔPrice ΔPriceΔPosition ΔPositionΔPrice
1 0.000 (0.001) 0.155 (0.155) 0.000 (0.005) 0.216 (0.166)
2 0.000 (0.096) 0.171 (0.082) 0.000 (0.007) 0.249 (0.080)
3 0.003 (0.346) 0.805 (0.248) 0.001 (0.099) 0.726 (0.215)
4 0.004 (0.933) 0.895 (0.359) 0.001 (0.177) 0.868 (0.321)
5 0.010 (0.670) 0.912 (0.297) 0.003 (0.097) 0.850 (0.304)
Producers (Futures Only) Producers (Futures and Options)
Day Change ΔPriceΔPosition ΔPositionΔPrice ΔPriceΔPosition ΔPositionΔPrice
1 0.013 (0.017) 0.086 (0.670) 0.006 (0.147) 0.099 (0.609)
2 0.239 (0.043) 0.280 (.0577) 0.132 (0.302) 0.310 (0.505)
3 0.587 (0.241) 0.219 (0.380) 0.419 (0.816) 0.252 (0.328)
4 0.365 (0.383) 0.354 (0.671) 0.250 (0.837) 0.413 (0.598)
5 0.065 (0.295) 0.742 (0.690) 0.031 (0.486) 0.865 (0.568)
Other (Futures Only) Other (Futures and Options)
Day Change ΔPriceΔPosition ΔPositionΔPrice ΔPriceΔPosition ΔPositionΔPrice
1 0.809 (0.141) 0.543 (0.772) 0.648 (0.833) 0.945 (0.946)
2 0.554 (0.345) 0.074 (0.877) 0.881 (0.806) 0.236 (0.991)
3 0.196 (0.822) 0.048 (0.749) 0.952 (0.792) 0.313 (0.779)
4 0.319 (0.848) 0.010 (0.719) 0.782 (0.570) 0.114 (0.694)
5 0.854 (0.490) 0.167 (0.893) 0.543 (0.520) 0.858 (0.722)
Commodity Swaps/Derivative Dealers (Futures
Only)
Commodity Swaps/Derivative Dealers (Futures
and Options)
Day Change ΔPriceΔPosition ΔPositionΔPrice ΔPriceΔPosition ΔPositionΔPrice
1 0.186 (0.427) 0.456 (0.533) 0.000 (0.218) 0.437 (0.972)
2 0.076 (0.585) 0.507 (0.696) 0.000 (0.072) 0.763 (0.856)
3 0.146 (0.542) 0.333 (0.595) 0.001 (0.132) 0.463 (0.994)
4 0.117 (0.637) 0.767 (0.576) 0.003 (0.250) 0.972 (0.970)
5 0.055 (0.786) 0.749 (0.732) 0.002 (0.131) 0.965 (0.834) Table 6c presents the Granger causality results for price and net position changes. It also shows the Granger-causality results for price change
and the level of net position in parenthesis. Bolded probabilities indicate the rejection of Granger non-causality at 1 percent level of significance.
33
Table 7a: Granger Causality Tests: Price and Position Change: Sample Period 2000-2004
Non-Commercials (Futures Only) Non-Commercials (Futures and Options)
Day Change ΔPriceΔPosition ΔPositionΔPrice ΔPriceΔPosition ΔPositionΔPrice
1 0.002 (0.082) 0.121 (0.270) 0.000 (0.066) 0.116 (0325)
2 0.045 (0.729) 0.224 (0.519) 0.011 (0.772) 0.207 (0.580)
3 0.723 (0.098) 0.054 (0.365) 0.976 (0.072) 0.051 (0.412)
4 0.153 (0.003) 0.042 (0.213) 0.368 (0.002) 0.052 (0.262)
5 0.043 (0.000) 0.016 (0.164) 0.156 (0.000) 0.027 (0.217)
Commercials (Futures Only) Commercials (Futures and Options)
Day Change ΔPriceΔPosition ΔPositionΔPrice ΔPriceΔPosition ΔPositionΔPrice
1 0.003 (0.019) 0.217 (0.201) 0.001 (0.015) 0.261 (0.258)
2 0.012 (0.615) 0.494 (0.515) 0.003 (0.548) 0.501 (0.585)
3 0.802 (0.084) 0.118 (0.297) 0.853 (0.082) 0.14 (0.361)
4 0.142 (0.001) 0.039 (0.152) 0.351 (0.001) 0.059 (0.205)
5 0.027 (0.000) 0.011 (0.121) 0.111 (0.000) 0.017 (0.166)
Non-Commercials and Swap Dealers (Futures
Only)
Non-Commercials and Swap Dealers (Futures
and Options)
Day Change ΔPriceΔPosition ΔPositionΔPrice ΔPriceΔPosition ΔPositionΔPrice
1 0.000 (0.643) 0.074 (0.167) 0.000 (0.968) 0.064 (0.125)
2 0.019 (0.140) 0.064 (0.245) 0.000 (0.291) 0.078 (0.226)
3 0.686 (0.007) 0.069 (0.161) 0.092 (0.012) 0.078 (0.146)
4 0.842 (0.001) 0.112 (0.091) 0.309 (0.002) 0.124 (0.082)
5 0.748 (0.001) 0.088 (0.067) 0.462 (0.002) 0.107 (0.072) Table 7a presents the Granger causality results for price and net position changes. It also shows the Granger-causality results for price change
and the level of net position in parenthesis. Bolded probabilities indicate the rejection of Granger non-causality at 1 percent level of significance.
Table 7b: Granger Causality Tests (Non-Commercials): Price and Position Change:
Sample Period 2000-2004
Managed Money Traders
(Futures Only)
Managed Money Traders
(Futures and Options)
Day Change ΔPriceΔPosition ΔPositionΔPrice ΔPriceΔPosition ΔPositionΔPrice
1 0.004 (0.447) 0.118 (0.193) 0.004 (0.405) 0.155 (0.186)
2 0.134 (0.470) 0.123 (0.351) 0.105 (0.540) 0.165 (0.352)
3 0.408 (0.007) 0.047 (0.226) 0.508 (0.010) 0.068 (0.222)
4 0.074 (0.000) 0.056 (0.150) 0.116 (0.000) 0.076 (0.152)
5 0.029 (0.000) 0.023 (0.113) 0.043 (0.000) 0.035 (0.188)
Floor Brokers and Traders
(Futures Only)
Floor Brokers and Traders
(Futures and Options)
Day Change ΔPriceΔPosition ΔPositionΔPrice ΔPriceΔPosition ΔPositionΔPrice
1 0.901 (0.972) 0.901 (0.652) 0.752 (0.938) 0.433 (0.330)
2 0.217 (0.039) 0.833 (0.673) 0.460 (0.059) 0.43 (0.376)
3 0.009 (0.003) 0.989 (0.933) 0.091 (0.012) 0.152 (0.928)
4 0.007 (0.001) 0.769 (0.897) 0.048 (0.004) 0.238 (0.690)
5 0.024 (0.008) 0.963 (0.834) 0.088 (0.017) 0.238 (0.724) Table 7b presents the Granger causality results for price and net position changes. It also shows the Granger-causality results for price change
and the level of net position in parenthesis. Bolded probabilities indicate the rejection of Granger non-causality at 1 percent level of significance.

34
Table 7c: Granger Causality Tests (Commercials): Price Change and Position Change: Sample
Period 2000-2004
Dealer/Merchants (Futures Only) Dealer/Merchants (Futures and Options)
Day Change ΔPriceΔPosition ΔPositionΔPrice ΔPriceΔPosition ΔPositionΔPrice
1 0.000 (0.130) 0.520 (0.398) 0.000 (0.601) 0.479 (0.481)
2 0.001 (0.912) 0.564 (0.709) 0.000 (0.649) 0.579 (0.831)
3 0.190 (0.142) 0.417 (0.444) 0.048 (0.189) 0.450 (0.547)
4 0.695 (0.001) 0.314 (0.265) 0.318 (0.008) .0321 (0.334)
5 0.920 (0.005) 0.089 (0.188) 0.667 (0.009) 0.100 (0.252)
Manufacturers (Futures Only) Manufacturers (Futures and Options)
Day Change ΔPriceΔPosition ΔPositionΔPrice ΔPriceΔPosition ΔPositionΔPrice
1 0.005 (0.586) 0.267 (0.192) 0.000 (0.752) 0.210 (0.120)
2 0.872 (0.106) 0.170 (0.197) 0.368 (0.198) 0.140 (0.147)
3 0.172 (0.033) 0.080 (0.098) 0.561 (0.061) 0.070 (0.080)
4 0.134 (0.025) 0.065 (0.081) 0.463 (0.044) 0.063 (0.067)
5 0.046 (0.009) 0.135 (0.077) 0.236 (0.021) 0.120 (0.070)
Producers (Futures Only) Producers (Futures and Options)
Day Change ΔPriceΔPosition ΔPositionΔPrice ΔPriceΔPosition ΔPositionΔPrice
1 0.928 (0.762) 0.183 (0.806) 0.667 (0.364) 0.355 (0.885)
2 0.967 (0.875) 0.209 (0.873) 0.698 (0.600) 0.263 (0.962)
3 0.610 (0.469) 0.104 (0.874) 0.416 (0.290) 0.162 (0.959)
4 0.666 (0.517) 0.268 (0.963) 0.560 (0.374) 0.445 (0.965)
5 0.503 (0.856) 0.476 (0.910) 0.490 (0.967) 0.715 (0.940)
Other (Futures Only) Other (Futures and Options)
Day Change ΔPriceΔPosition ΔPositionΔPrice ΔPriceΔPosition ΔPositionΔPrice
1 0.655 (0.999) 0.085 (0.125) 0.192 (0.498) 0.063 (0.057)
2 0.440 (0.196) 0.145 (0.148) 0.244 (0.133) 0.200 (0.102)
3 0.163 (0.048) 0.164 (0.320) 0.098 (0.035) 0.189 (0.245)
4 0.309 (0.069) 0.206 (0.502) 0.261 (0.109) 0.275 (0.418)
5 0.118 (0.006) 0.084 (0.612) 0.084 (0.007) 0.159 (0.508)
Commodity Swaps/Derivative Dealers (Futures
Only)
Commodity Swaps/Derivative Dealers (Futures
and Options)
Day Change ΔPriceΔPosition ΔPositionΔPrice ΔPriceΔPosition ΔPositionΔPrice
1 0.000 (0.053) 0.279 (0.393) 0.011 (0.074) 0.211 (0.162)
2 0.000 (0.085) 0.128 (0.228) 0.052 (0.157) 0.135 (0.121)
3 0.002 (0.156) 0.288 (0.228) 0.257 (0.196) 0.296 (0.136)
4 0.031 (0.215) 0.449 (0.247) 0.615 (0.258) 0.435 (0.137)
5 0.211 (0.377) 0.440 (0.265) 0.966 (0.469) 0.437 (0.188) Table 7c presents the Granger causality results for price and net position changes. It also shows the Granger-causality results for price change and the level of net position in parenthesis. Bolded probabilities indicate the rejection of Granger non-causality at 1 percent level of significance.

35
Table 8a: Granger Causality Tests: Price and Position Change: Sample Period: 2004-2009
Non-Commercials (Futures Only) Non-Commercials (Futures and Options)
Day Change ΔPriceΔPosition ΔPositionΔPrice ΔPriceΔPosition ΔPositionΔPrice
1 0.025 (0.115) 0.371 (0.148) 0.000 (0.001) 0.884 (0.275)
2 0.180 (0.738) 0.252 (0.139) 0.004 (0.051) 0.496 (0.193)
3 0.625 (0.759) 0.806 (0.121) 0.037 (0.065) 0.275 (0.292)
4 0.293 (0.278) 0.696 (0.111) 0.536 (0.400) 0.263 (0.255)
5 03538 (0.456) 0.408 (0.161) 0.223 (0.123) 0.131 (0.346)
Commercials (Futures Only) Commercials (Futures and Options)
Day Change ΔPriceΔPosition ΔPositionΔPrice ΔPriceΔPosition ΔPositionΔPrice
1 0.001 (0.014) 0.975 (0.250) 0.000 (0.000) 0.661 (0.349)
2 0.258 (0.940) 0.313 (0.210) 0.007 (0.024) 0.571 (0.244)
3 0.688 (0.920) 0.590 (0.276) 0.066 (0.095) 0.426 (0.401)
4 0.334 (0.192) .0277 (0.252) 0.349 (0.227) 0.160 (0.418)
5 0.402 (0.402) 0.169 (0.321) 0.251 (0.106) 0.101 (0.473)
Non-Commercials and Swap Dealers (Futures
Only)
Non-Commercials and Swap Dealers (Futures and
Options)
Day Change ΔPriceΔPosition ΔPositionΔPrice ΔPriceΔPosition ΔPositionΔPrice
1 0.000 (0.025) 0.686 (0.087) 0.000 (0.000) 0.525 (0.045)
2 0.000 (0.042) 0.603 (0.044) 0.000 (0.001) 0.627 (0.016)
3 0.002 (0.158) 0.428 (0.061) 0.000 (0.009) 0.302 (0.061)
4 0.019 (0.512) 0.760 (0.066) 0.000 (0.076) 0.685 (0.056)
5 0.003 (0.277) 0.598 (0.066) 0.000 (0.015) 0.584 (0.060) Table 8a presents the Granger causality results for price and position changes. It also shows the Granger-causality results for price change and the level of net position in parenthesis. Bolded probabilities indicate the rejection of Granger non-causality at 1 percent level of significance.
Table 8b: Granger Causality Tests (Non-Commercials): Price and Position Change:
Sample Period 2004-2009
Managed Money Traders (Futures Only) Managed Money Traders
(Futures and Options)
Day Change ΔPriceΔPosition ΔPositionΔPrice ΔPriceΔPosition ΔPositionΔPrice
1 0.000 (0.000) 0.921 (0.134) 0.000 (0.000) 0.767 (0.128)
2 0.002 (0.063) 0.148 (0.061) 0.000 (0.024) 0.099 (0.060)
3 0.023 (0.089) 0.798 (0.142) 0.005 (0.026) 0.780 (0.143)
4 0.538 (0.990) 0.964 (0.149) 0.180 (0.381) 0.981 (0.150)
5 0.379 (0.395) 0.500 (0.235) 0.111 (0.095) 0.459 (0.223)
Floor Brokers and Traders (Futures Only) Floor Brokers and Traders
(Futures and Options)
Day Change ΔPriceΔPosition ΔPositionΔPrice ΔPriceΔPosition ΔPositionΔPrice
1 0.002 (0.001) 0.004 (0.229) 0.449 (0.203) 0.324 (0.037)
2 0.109 (0.049) 0.181 (0.575) 0.743 (0.917) 0.873 (0.081)
3 0.200 (0.186) 0.0524 (0.188) 0.387 (0.446) 0.440 (0.049)
4 0.153 (0.052) 0.115 (0.205) 0.726 (0.961) 0.299 (0.063)
5 0.184 (0.056) 0.305 (0.292) 0.540 (0.945) 0.569 (0.117) Table 8b presents the Granger causality results for price and position changes. It also shows the Granger-causality results for price change and
the level of net position in parenthesis. Bolded probabilities indicate the rejection of Granger non-causality at 1 percent level of significance.

36
Table 8c: Granger Causality Tests (Commercials): Price and Position Change:
Sample Period 2004-2009
Dealer/Merchants (Futures Only) Dealer/Merchants (Futures and Options)
Day Change ΔPriceΔPosition ΔPositionΔPrice ΔPriceΔPosition ΔPositionΔPrice
1 0.000 (0.003) 0.273 (0.523) 0.000 (0.000) 0.127 (0.217)
2 0.077 (0.109) 0.957 (0.354) 0.004 (0.006) 0.997 (0.116)
3 0.267 (0.237) 0.180 (0.553) 0.028 (0.025) 0.185 (0.324)
4 0.782 (0.668) 0.337 (0.486) 0.156 (0.094) 0.401 (0.321)
5 0.496 (0.328) 0.219 (0.421) 0.054 (0.030) 0.303 (0.251)
Manufacturers (Futures Only) Manufacturers (Futures and Options)
Day Change ΔPriceΔPosition ΔPositionΔPrice ΔPriceΔPosition ΔPositionΔPrice
1 0.000 (0.008) 0.068 (0.049) 0.000 (0.002) 0.097 (0.051)
2 0.000 (0.008) 0.061 (0.024) 0.000 (0.001) 0.091 (0.023)
3 0.001 (0.046) 0.428 (0.086) 0.000 (0.015) 0.364 (0.074)
4 0.001 (0.072) 0.608 (0.124) 0.000 (0.024) 0.622 (0.107)
5 0.001 (0.033) 0.380 (0.111) 0.000 (0.007) 0.726 (0.117)
Producers (Futures Only) Producers (Futures and Options)
Day Change ΔPriceΔPosition ΔPositionΔPrice ΔPriceΔPosition ΔPositionΔPrice
1 0.008 (0.154) 0.164 (0.198) 0.002 (0.111) 0.143 (0.425)
2 0.205 (0.433) 0.476 (0.422) 0.074 (0.317) 0.489 (0.341)
3 0.458 (0.860) 0.443 (0.287) 0.241 (0.781) 0.447 (0.233)
4 0.275 (0.952) 0.603 (0.511) 0.159 (0.909) 0.603 (0.426)
5 0.082 (0.764) 0.971 (0.565) 0.041 (0.756) 0.996 (0.453)
Other (Futures Only) Other (Futures and Options)
Day Change ΔPriceΔPosition ΔPositionΔPrice ΔPriceΔPosition ΔPositionΔPrice
1 0.742 (0.412) 0.797 (0.428) 0.792 (0.716) 0.840 (0.469)
2 0.458 (0.412) 0.149 (0.544) 0.974 (0.917) 0.353 (0.555)
3 0.112 (0.287) 0.102 (0.489) 0.735 (0.843) 0.446 (0.438)
4 0.223 (0.379) 0.025 (0.521) 0.936 (0858) 0.165 (0.429)
5 0.672 (0.808) 0.377 (0.703) 0.692 (0.901) 0.924 (0.479)
Commodity Swaps/Derivative Dealers (Futures
Only)
Commodity Swaps/Derivative Dealers (Futures
and Options)
Day Change ΔPriceΔPosition ΔPositionΔPrice ΔPriceΔPosition ΔPositionΔPrice
1 0.004 (0.123) 0.632 (0.934) 0.000 (0.150) 0.620 (0.284)
2 0.006 (0.015) 0.741 (0.707) 0.000 (0.057) 0.985 (0.204)
3 0.040 (0.073) 0.485 (0.922) 0.000 (0.151) 0.637 (0.360)
4 0.043 (0.070) 0.930 (0.982) 0.002 (0.256) 0.848 (0.437)
5 0.024 (0.035) 0.914 (0.810) 0.002 (0.153) 0.857 (0.295) Table 8c presents the Granger causality results for price and net position changes. It also shows the Granger-causality results for price change and the level of net position in parenthesis. Bolded probabilities indicate the rejection of Granger non-causality at 1 percent level of significance.
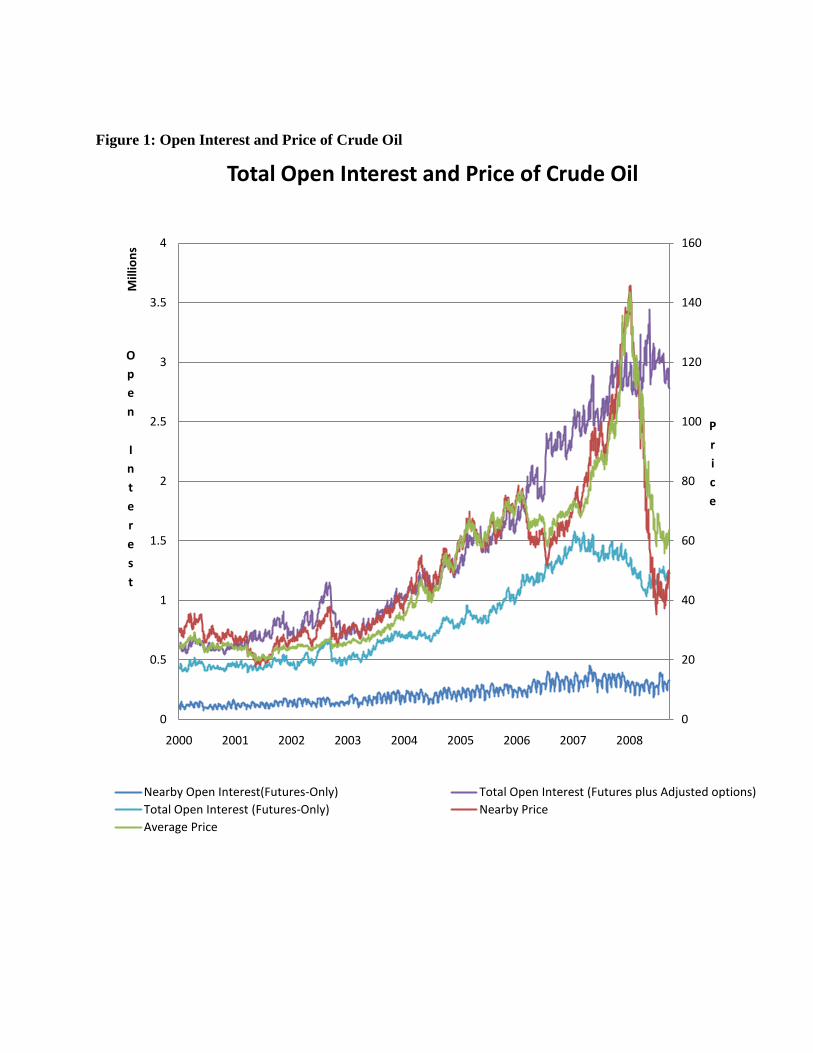
Figure 1: Open Interest and Price of Crude Oil
0
20
40
60
80
100
120
140
160
0
0.5
1
1.5
2
2.5
3
3.5
4
2000 2001 2002 2003 2004 2005 2006 2007 2008
P
r
i
c
e
O
p
e
n
I
n
t
e
r
e
s
t
Mill
ion
s
Total Open Interest and Price of Crude Oil
Nearby Open Interest(Futures-Only) Total Open Interest (Futures plus Adjusted options)
Total Open Interest (Futures-Only) Nearby Price
Average Price
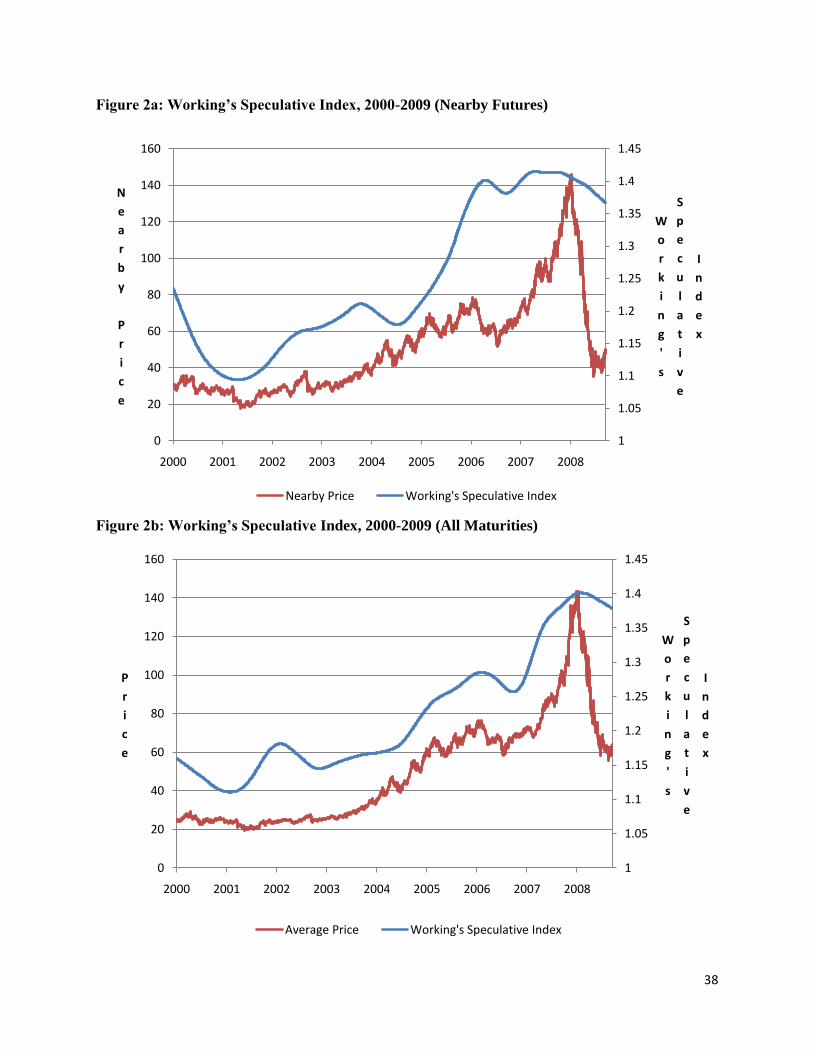
38
Figure 2a: Working’s Speculative Index, 2000-2009 (Nearby Futures)
Figure 2b: Working’s Speculative Index, 2000-2009 (All Maturities)
1
1.05
1.1
1.15
1.2
1.25
1.3
1.35
1.4
1.45
0
20
40
60
80
100
120
140
160
2000 2001 2002 2003 2004 2005 2006 2007 2008
W
o
r
k
i
n
g
'
s
S
p
e
c
u
l
a
t
i
v
e
I
n
d
e
x
N
e
a
r
b
y
P
r
i
c
e
Nearby Price Working's Speculative Index
1
1.05
1.1
1.15
1.2
1.25
1.3
1.35
1.4
1.45
0
20
40
60
80
100
120
140
160
2000 2001 2002 2003 2004 2005 2006 2007 2008
W
o
r
k
i
n
g
'
s
S
p
e
c
u
l
a
t
i
v
e
I
n
d
e
x
P
r
i
c
e
Average Price Working's Speculative Index

39
Figure 3a: Growth of Commercial Traders Open Interest
Figure 3b: Growth of Non-Commercial Traders Open Interest
AO
AP
AM
AD
AS
0
100000
200000
300000
400000
500000
2000 2001 2002 2003 2004 2005 2006 2007 2008 2009
AO
AP
AM
AD
AS
FBT
MMT0
50000
100000
150000
200000
250000
300000
350000
2000 2001 2002 2003 2004 2005 2006 2007 2008 2009
FBT
NRP
MMT