the role of taxes and education funding in charting michigan’s economic future: richard g. sims...
TRANSCRIPT

The Role of Taxes and Education Funding in Charting Michigan’s
Economic Future:
Richard G. SimsSierra Institute on Applied Economics
Carson City, NevadaNovember 2006

A quick look at Michigan state and local tax effort, by taxpayer income catagory
Richard G. SimsSierra Institute on Applied Economics

Source: Who Pays?: A Distributional Analysis of the Tax Systems of All 50 States, Second Edition, Institute on Taxation and Economic Policy, 2003.
Richard G. SimsSierra Institute on Applied Economics
Michigan Taxes

Source: Who Pays?: A Distributional Analysis of the Tax Systems of All 50 States, Second Edition, Institute on Taxation and Economic Policy, 2003.
Richard G. SimsSierra Institute on Applied Economics
…and how they have changed.

Shares of Michigan Tax Colletions
Personal Income Tax29%
Sales & Use Taxes33%
Other Consumption
Taxes6%
Business Taxes11%
Transportation Taxes8%
Other Taxes13%
FY 2004-2005
Source: Michigan Department of Management & Budget, Comprehensive Annual Financial Report, and Senate Fiscal Agency, Updated March 2006.

What Public Policies Influence State Economic Growth?
Richard G. SimsSierra Institute on Applied Economics

Do low business taxes lead to economic growth?
Richard G. SimsSierra Institute on Applied Economics

10 FASTEST
GROWING STATES
PER CAPITA PERSONAL
INCOME GROWTH
1995-2003
U.S. RANK
(High to Low)
TOP CORPORATE
TAX RATE
U.S. RANK
(Low to High)
Wyoming 5.4% 1 No tax Tied 1st
District of Columbia
5.2% 2 9.975% 48
North Dakota 5.0% 3 10.50% 50
Vermont 4.8% 4 9.75% 46
Massachusetts 4.7% 5 9.50% 45
South Dakota 4.7% 6 No tax Tied 1st
Minnesota 4.6% 7 9.80% 47
Colorado 4.6% 8 4.63% 8
Maine 4.5% 9 8.93% 40
Nebraska 4.5% 10 7.81% 31
AVERAGE: 7.1%
NOTE: States in italic are "no income tax" states; Rates are in percent and are those in place 1/1/2004.SOURCE: Income data from U.S. Department of Commerce, Bureau of Economic Analysis; tax rates from Federation of Tax Administrators, www.taxadmin.org.
Chart A: The 10 Fastest Growing States’ Corporate Income Tax Rates: Average
7.1%
Richard G. SimsSierra Institute on Applied Economics
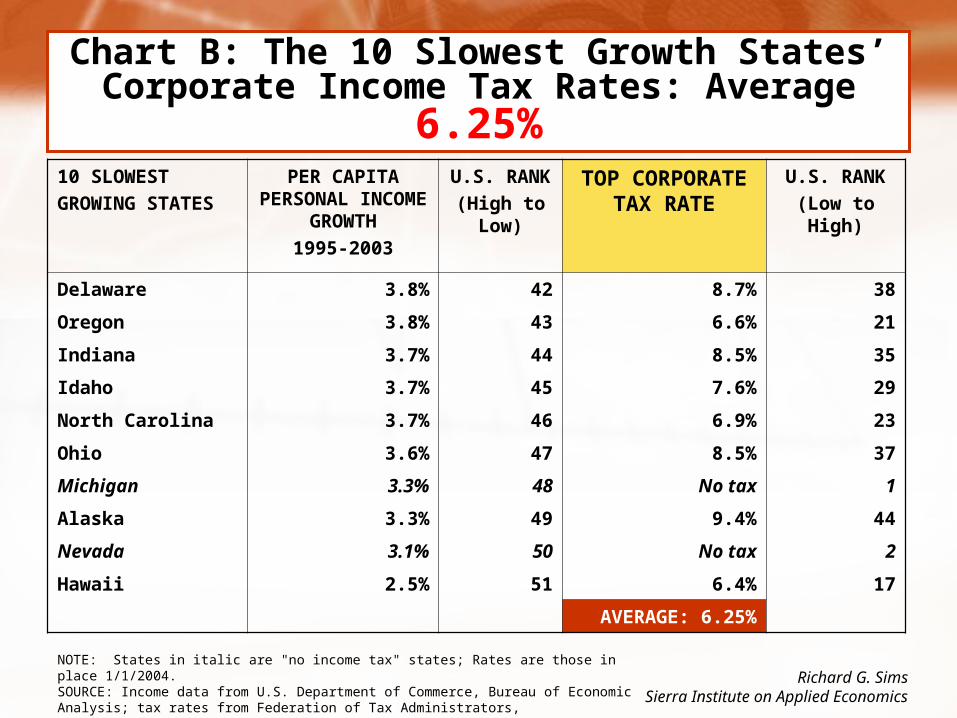
10 SLOWEST
GROWING STATES
PER CAPITA PERSONAL
INCOME GROWTH
1995-2003
U.S. RANK
(High to Low)
TOP CORPORATE TAX
RATE
U.S. RANK
(Low to High)
Delaware 3.8% 42 8.7% 38
Oregon 3.8% 43 6.6% 21
Indiana 3.7% 44 8.5% 35
Idaho 3.7% 45 7.6% 29
North Carolina 3.7% 46 6.9% 23
Ohio 3.6% 47 8.5% 37
Michigan 3.3% 48 No tax 1
Alaska 3.3% 49 9.4% 44
Nevada 3.1% 50 No tax 2
Hawaii 2.5% 51 6.4% 17
AVERAGE: 6.25%
NOTE: States in italic are "no income tax" states; Rates are those in place 1/1/2004.SOURCE: Income data from U.S. Department of Commerce, Bureau of Economic Analysis; tax rates from Federation of Tax Administrators, www.taxadmin.org.
Chart B: The 10 Slowest Growth States’ Corporate Income Tax Rates: Average
6.25%
Richard G. SimsSierra Institute on Applied Economics

In fact, over the last decade…High growth states actually had comparatively high average corporate income tax rates.
Slow growth states had corporate tax rates below the U.S. average.
Richard G. SimsSierra Institute on Applied Economics

But doesn’t being “Business Tax Friendly” or being seen as having a favorable Business Climate encourage a states economic growth?
Let’s see--Richard G. Sims
Sierra Institute on Applied Economics

Chart A: States ranked MOST ‘Business Tax Friendly’
SOURCE: Tax Foundation, Inc.,State Business Tax Climate Index
10 MOST ‘TAX FRIENDLY’ STATES
U.S. RANK
‘TAX FRIENDLY’
PERSONAL INCOME INCREASE
1994-2003
U.S. RANK
South Dakota 1 4.7% 6
Florida 2 3.9% 38
Alaska 3 3.3% 49
Texas 4 4.3% 14
New Hampshire 5 4.4% 11
Nevada 6 3.1% 50
Wyoming 7 5.4% 1
Colorado 8 4.6% 8
Washington 9 4.3% 17
Oregon 10 3.8% 43
TOP 10 AVERAGE: 4.2%
Richard G. SimsSierra Institute on Applied Economics
Tax Foundation Rankings

Chart B: States ranked LEAST ‘Business Tax Friendly
SOURCE: Tax Foundation, Inc.,State Business Tax Climate Index
10 LEAST ‘TAX FRIENDLY’ STATES
U.S. RANK
‘TAX FRIENDLY’
PERSONAL INCOME INCREASE
1994-2003
U.S. RANK
Maine 42 4.5% 9
Arkansas 43 3.8% 40
Kentucky 44 4.2% 24
Vermont 45 4.8% 4
Rhode Island 46 4.2% 22
West Virginia 47 4.0% 34
Minnesota 48 4.6% 7
New York 49 4.0% 32
Hawaii 50 2.5% 51
District of Columbia 51 5.2% 2
BOTTOM 10 AVERAGE: 4.2%
Richard G. SimsSierra Institute on Applied Economics
In addition, the Actual Effective Rates that Corporations pay on their Profits has Declined Substantially Over the Last Several Years…
Richard G. SimsSierra Institute on Applied Economics

Effective Rates of State Income Taxes
0%
1%
2%
3%
4%
5%
6%
7%
8%
1982
1984
1986
1988
1990
1992
1994
1996
1998
2000
Individualtaxes paid tostates as % ofU.S. individualincome
Corporatetaxes paid tostates as % of"pre-tax"corporateprofits
Corporate Taxes
Individual Taxes
7.5%
3.2%
1.8% 2.1%
Source: Data from Federation of Tax Administrators and the U.S. Department of Commerce. Richard G. Sims
Sierra Institute on Applied Economics

How about the effect of the overall “Business Climate”…
Richard G. SimsSierra Institute on Applied Economics

Site Selection Magazine, November, 2006

Climate Rank
25 Top Ranked States
1 North Carolina 392 Texas 12 top half3 Ohio 47 bottom ten4 Georgia 43 bottom ten6 Indiana 46 bottom ten6 Tennessee 377 Kentucky 318 Alabama 19 top half9 Michigan 48 bottom ten
10 South Carolina 3411 Florida 24 top half12 Illinois 42 bottom ten12 Virginia 13 top half14 New York 2915 Mississippi 3616 Pennsylvania 3017 Iowa 2717 Louisiana 51 bottom ten18 California 16 top half19 Nevada 44 bottom ten20 Arkansas 3522 Kansas 2623 Minnesota 9 top half24 Oklahoma 8 top half25 Arizona 25
2006 Top State Business Climate RankingsRank in Pers Inc growth
1994-04
Only 7 of the Top Ranked 25 states grew as fast a the US average-
Only 2 of the Top Ranked states were in the top 10 growth states-
7 of the Top Ranked states were among the 10 slowest growing states.
Site Selection magazine, Nov. 2006; Bureau of Labor Statistics website; calculations by the author.
One Reason Corporate Income Taxes Don’t Have Much Influence on State’s Comparative Growth-
Rates Don’t Vary Greatly from State-to-State--
Richard G. SimsSierra Institute on Applied Economics

State Corporate Income Tax Rates
0
2
4
6
8
10
12
14
KS CO MS SC UT FL GAOK VAMO HI AL AR TN OR MT NC AZ MD IL CT NY ID NMNE WI LA KY IN NHOH DE CA ME NJ RI WV AKMA VT MNDC PA ND IA
WISCONSIN
ILLINOIS
MINNESOTA
IOWA
¾ of states have rates between 6%-9%
The 45 States with a Corporate Income Tax
Max
imu
m C
orp
orat
e T
ax R
ate
Richard G. SimsSierra Institute on Applied Economics
Mid-Point 7.5%

From the previous chart
Lowest rate– Kansas, 4%: growth rank 26th
Highest rate—Iowa, 12%: growth rank 27th
Richard G. SimsSierra Institute on Applied Economics

Another Reason Corporate Income Taxes Don’t Determine a State Economic Growth…
Richard G. SimsSierra Institute on Applied Economics

Source: U.S. Department of Commerce, National Income and Product Accounts, 2003.
Direct Labor 48.0%
State Corporate
Income Taxes 0.27%
0%
10%
20%
30%
40%
50%
60%
Shares of Total Business Costs
Richard G. SimsSierra Institute on Applied Economics

What Firms Say Are Their Major Cost Considerations
When Relocating
Source: Robert M. Ady, “The Effects of State and Local Public Services on Economic Development,” New England Economic Review, March/April, 1997.
Richard G. SimsSierra Institute on Applied Economics

Similarly, taxes on individuals don’t appear to determine states’ growth…
Richard G. SimsSierra Institute on Applied Economics

* Average annual growth in per capita personal income data from Bureau of Economic Analysis.
** Tax Rates and Tax Burdens: In the District of Columbia - A Nationwide Comparsion 2002, Government of the District of Columbia, August 2003.
Richard G. Sims
Of the 15 FASTEST Growing States:--8 above average taxes--7 below average taxes--4 in lowest 10 taxing states--3 in highest 10 taxing states--4 are no income tax states
Of the 15 SLOWEST Growing States:--4 above US average taxes--11 below US average taxes--5 in 10 lowest taxing states--1 in highest 10 taxing states--4 are no income tax states
In general, states with high economic growth had relatively higher taxes.
Richard G. SimsSierra Institute on Applied Economics

A note on international comparisons--

TOP 10 STATES IN EDUCATION SPENDING
U.S. RANK
K-12 SPENDING
PER CAPITA
PERSONAL INCOME
GROWTH PER CAPITA
1995-2003
BOTTOM 10 STATES IN
EDUCATION SPENDING
U.S. RANK
K-12 SPENDING
PER CAPITA
PERSONAL INCOME
GROWTH PER CAPITA
1995-2003
Alaska 1 3.3% Idaho 42 3.7%
New Jersey 2 4.4% Utah 43 4.0%
New York 3 4.0% Florida 44 3.9%
DC 4 5.2% Louisiana 45 4.0%
Connecticut 5 4.3% Mississippi 46 4.1%
Wyoming 6 5.4% Arizona 47 3.8%
Michigan 7 3.3% Tennessee 48 3.9%
Minnesota 8 4.6% Kentucky 49 4.2%
Wisconsin 9 4.2% Arkansas 50 3.8%
Vermont 10 4.8% Hawaii 51 2.5%
TOP 10 AVERAGE
INCOME GROWTH4.3% BOTTOM 10 AVERAGE
INCOME GROWTH 3.8%
Elementary & Secondary Spending
Average growth for the 50 states and DC: 4.1%SOURCE: Education spending data from National Center for Education Statistics, http://nces.ed.gov; income data from U.S. Bureau of the Census, Bureau of Economic Analysis.

ELASTICITIE$
How revenues grow over time determines states’ ability to
fund future services-Personal Income Tax 1.04Corporate Income Tax 0.95Sales Taxes 0.97Property Taxes 0.96Cigarettes (avg. all states) 0.48Lottery (avg. all states) 0.52
Typical Long-Term 50 State Averages
These all grow slower than the economy
Richard G. SimsSierra Institute on Applied Economics

Heavy reliance on sales and excise taxes and lotteries constrain state’s ability to fund future services, many of which are crucial to economic growth and development.

A look at economic interaction between taxes, spending and state economic growth.

What if Illinois raised personal income taxes by $2 billion*...and spent all of the new revenues for k-12 education?
2006 2007 2008 2009 2010Employment (Thous) 26 26 26 26 27Gross State Product (Billions) 1.3 1.4 1.4 1.5 1.6Pers Inc (Billions) 1.1 1.2 1.3 1.5 1.6
* Assumes funding from a 5% flat rate with $12,000 personal exemption and $5,000 dependent exemption.
Results based on a computable general equilbrium analysis, assuming new revenues are spent in proportions similar to current spending.
A Dynamic General Equilibrium Analysis of a Balanced Budget Tax
and Spending Increase
Richard G. SimsSierra Institute on Applied Economics

A Dynamic General Equilibrium, Balanced Budget Analysis of Proposal 5
2007 2009 2011 2013 2015 2017 2019 2021Employment (Thous) 14.7 15.2 15.8 16.1 16.5 16.6 17.0 17.4Pers Income (Millions) $363 $498 $615 $723 $833 $941 $1,059 $1,180
*Includes the effects of both prop. 5 education spending and the associated taxes.
Proposal 5 enacted in 2006:*
Net Changes in the Michigan Economy-
Source: Richard Sims, using the REMI economic model for Michigan.

1990 1991 1992 1993 1994 1995 1996 1997 1998 1999 2000 2001 2002 2003 2004 2005
ACTUAL (mil $) $12,137 $12,831 $13,427 $14,081 $16,388 $18,896 $19,751 $20,603 $21,669 $22,974 $23,917 $23,455 $23,497 $24,127 $24,618 $25,583Actual % growth rate 5.7% 4.6% 4.9% 16.4% 15.3% 4.5% 4.3% 5.2% 6.0% 4.1% -1.9% 0.2% 2.7% 2.0% 3.9%
TABOR allowed growth % 5.2% 3.9% 3.6% 3.2% 3.6% 3.8% 2.8% 2.0% 2.7% 4.0% 3.3% 2.0% 2.6% 3.0% 3.5%(popn %chg + cpi-u % chg):
State popn. chg. annual 1.0% 0.8% 0.6% 0.6% 0.8% 0.9% 0.5% 0.4% 0.5% 0.6% 0.5% 0.4% 0.3% 0.3% 0.1%
CPI-U change, annual 4.2% 3.0% 3.0% 2.6% 2.8% 2.9% 2.3% 1.6% 2.2% 3.4% 2.8% 1.6% 2.3% 2.7% 3.4%
GF TABOR allowed growth (mil $) $12,137 $12,768 $13,260 $13,736 $14,178 $14,693 $15,249 $15,682 $15,989 $16,419 $17,070 $17,639 $17,996 $18,460 $19,012 $19,672Was TABOR cap reached? yes yes yes yes yes yes yes yes yes yes yes yes
Difference GF with 1990 TABOR versus Actual History (mil $) -$63 -$167 -$344 -$2,210 -$4,203 -$4,502 -$4,921 -$5,680 -$6,555 -$6,847 -$5,816 -$5,501 -$5,668 -$5,606 -$5,911
TABOR Allowed Spending as % of Actual Spending 99.5% 98.8% 97.6% 86.5% 77.8% 77.2% 76.1% 73.8% 71.5% 71.4% 75.2% 76.6% 76.5% 77.2% 76.9%
ACTUAL is the Michigan state tax revenues. Sources: Population, U.S. Census Bureau, historical data plus annual estimates for July 1, each year, 2001 to 2004 and official projection for 2005; CPI-U, U.S. Department of Labor, Bureau of Labor Statistics; Budget data from the Michigan Department of Management and Budget, Comprehensive Annual Financial Report, various issues, and Senate Fiscal Agency.
CHART A
Michigan State Government Funding History:Actual History and Alternative History with a TABOR Enacted in 1990
The TABOR cap is the lesser of actual growth or the TABOR cap. The cap calculated as if it were enacted in 1990 and the first year of effect being 1991. The allowed GF growth under the TABOR cap is assumed to be the percentage growth in population plus the percentage growth in inflation as measured by the cpi-u.
Source: The Long-Term Effects of TABOR on the Michigan Economy, Sierra Institute on Applied Economics, September, 2006..

TABOR Spending Reduction 1991 1992 1993 1994 1995 1996 1997 1998 1999 2000 2001 2002 2003 2004 2005
Reduction* (nominal millions) -$63 -$167 -$344 -$2,210 -$4,203 -$4,502 -$4,921 -$5,680 -$6,555 -$6,847 -$5,816 -$5,501 -$5,668 -$5,606 -$5,911
General Fund TABOR Related Tax Cuts:
Employment change (000) 0.4 1.0 2.0 14 24 24 24 27 29 28 22 20 19 18 18Pers Inc (nominal millions) $15 $41 $85 $584 $1,124 $1,230 $1,373 $1,598 $1,843 $1,929 $1,731 $1,682 $1,730 $1,721 $1,792
Required Off-Setting State Government General Spending:**
Employment change (000) -1.9 -4.8 -10 -61 -114 -119 -128 -144 -163 -166 -136 -126 -128 -125 -130Pers Inc (nominal millions) -51 -140 -299 -1908 -3755 -4231 -4802 -5682 -6703 -7216 -6466 -6343 -6669 -6789 -7306
Net TABOR Impacts:Employment change (000) -1.5 -3.8 -7.7 -48 -90 -95 -103 -117 -134 -138 -114 -107 -109 -107 -112Pers Inc (nominal millions) $36 -$100 -$214 -$1,324 -$2,631 -$3,001 -$3,430 -$4,084 -$4,860 -$5,287 -$4,735 -$4,661 -$4,939 -$5,068 -$5,514
**Assumes an across-the-board cut in state government general fund spending.
The Economic Impacts are developed using the Michigan version of the REMI economic model.
CHART B
The Impact of TABOR's Tax and Spending Limitations on the Michigan Economy
Economic Impacts Associated with-
*The TABOR growth limit is defined here as the sum of the percentage growth in population plus the percentage growth in inflation, measured as the cpi-u and is assumed to apply only to the state general fund. The tax/ spending reduction is the difference between the actual General Fund growth and the growth that would have been allowed under the TABOR. Calculations shown on accompaning chart.
Source: The Long-Term Effects of TABOR on the Michigan Economy, Sierra Institute on Applied Economics, September, 2006..
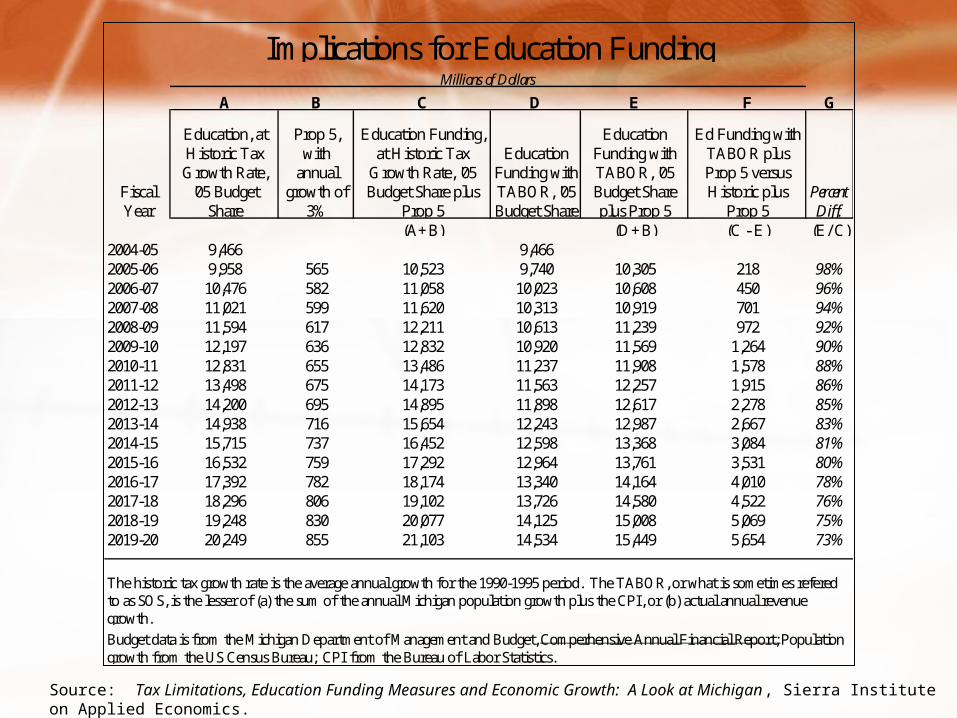
A B C D E F G
(A+B) (D+B) (C - E) (E/ C)2004-05 9,466 9,4662005-06 9,958 565 10,523 9,740 10,305 218 98%2006-07 10,476 582 11,058 10,023 10,608 450 96%2007-08 11,021 599 11,620 10,313 10,919 701 94%2008-09 11,594 617 12,211 10,613 11,239 972 92%2009-10 12,197 636 12,832 10,920 11,569 1,264 90%2010-11 12,831 655 13,486 11,237 11,908 1,578 88%2011-12 13,498 675 14,173 11,563 12,257 1,915 86%2012-13 14,200 695 14,895 11,898 12,617 2,278 85%2013-14 14,938 716 15,654 12,243 12,987 2,667 83%2014-15 15,715 737 16,452 12,598 13,368 3,084 81%2015-16 16,532 759 17,292 12,964 13,761 3,531 80%2016-17 17,392 782 18,174 13,340 14,164 4,010 78%2017-18 18,296 806 19,102 13,726 14,580 4,522 76%2018-19 19,248 830 20,077 14,125 15,008 5,069 75%2019-20 20,249 855 21,103 14,534 15,449 5,654 73%
The historic tax growth rate is the average annual growth for the 1990-1995 period. The TABOR, or what is sometimes refered to as SOS, is the lesser of (a) the sum of the annual Michigan population growth plus the CPI, or (b) actual annual revenue growth.Budget data is from the Michigan Department of Management and Budget, Comperhensive Annual Financial Report; Population growth from the US Census Bureau; CPI from the Bureau of Labor Statistics.
Ed Funding with TABOR plus Prop 5 versus Historic plus
Prop 5
Millions of Dollars
Fiscal Year
Implications for Education Funding
Education Funding with TABOR, '05 Budget Share plus Prop 5
Percent Diff.
Education, at Historic Tax Growth Rate, '05 Budget
Share
Prop 5, with
annual growth of
3%
Education Funding, at Historic Tax
Growth Rate, '05 Budget Share plus
Prop 5
Education Funding with TABOR, '05 Budget Share
Source: Tax Limitations, Education Funding Measures and Economic Growth: A Look at Michigan, Sierra Institute on Applied Economics.

Sources of Public Benefits from Improved Education
State tax10%
Federal income tax20%
FICA21%
Criminal justice21%
Other social programs2%
Social Security3%
Health care7%
Income transfers16%
Source: The Economic Impact of the Georgia Lottery, Carl Vinson Institute of Government, University of Georgia.

“I know of no valid economic theory that suggests that tax cuts provide more economic stimulation than would a similar amount of government spending.”
Former Congressional Budget Office Director, Robert Reischauer
Richard G. SimsSierra Institute on Applied Economics

Long-Term:-Amenity value-Source of productivity-Source of competitiveness
So, why does education spending have such a large
impact on job creation?Near-Term:-Labor intensity-Local purchase intensity-Larger share of total business costs
Richard G. SimsSierra Institute on Applied Economics

A Concern for Michigan’s Future
Over the decade of the 1900’s, Illinois lost
121,000 college graduates to other states.
Richard G. SimsSierra Institute on Applied Economics

CONCLUSIONSLow taxes are not the key to
creating jobs and income in a state.
Low taxes are associated with low levels of public services.
Spending on K-12 education can be a significant contributor to economic growth.
Richard G. SimsSierra Institute on Applied Economics