the role of temperature, nutrient availability and organo ... · decomposition while organo-mineral...
TRANSCRIPT

The Role of Temperature, Nutrient Availability and Organo-
Mineral Interactions in Altering Soil Organic Matter
Composition
by
Olivia Oi Ying Lun
A thesis submitted in conformity with the requirements
for the degree of Master of Science
Graduate Department of Chemistry
University of Toronto
© Copyright by Olivia Oi Ying Lun 2016

ii
The Role of Temperature, Nutrient Availability and Organo-Mineral
Interactions in Altering Soil Organic Matter Composition
Olivia Oi Ying Lun
Master of Science
Graduate Department of Chemistry
University of Toronto
2016
Abstract
Increases in temperature and nutrient availability may accelerate soil organic matter (SOM)
decomposition while organo-mineral interactions may potentially stabilize SOM components.
After 32 years of warming, nitrogen and phosphorus (N+P) fertilization, and the combined
treatment, SOM degradation was not significantly enhanced in Arctic soils. Considerable
variability in the biomarker data may be attributable to spatial heterogeneity among the blocks.
In the second project, biomarker investigations indicated that mineral interactions likely protect
lignin from extraction. Suberin and cutin protection of lignin was not observed until after clay
mineral dissolution by hydrofluoric acid (HF). This suggests that clay mineral interactions may
play a more dominant role in the protection of lignin than interactions with suberin and cutin.
Overall, this thesis demonstrates that biomarker methods can show how the distribution of SOM
may be reflective of topographical patterns and can provide further evidence that mineral
protection mechanisms help stabilize SOM components.
iii
Acknowledgments
Firstly, I would like to express my deepest gratitude to Prof. Myrna Simpson for her
guidance and support, particularly during the compilation process of this thesis. Her
encouragement along with her patience and understanding are greatly appreciated. Prof. André
Simpson and Prof. Jennifer Murphy are thanked for agreeing to serve on my supervisory
committee. Dr. Megan Machmuller and Dr. Eldor Paul, our collaborators from Colorado State
University, are thanked for collecting samples from Toolik Lake, Alaska.
I would also like to thank all the past and present members of the M. Simpson and A.
Simpson Research Groups. In particular, I would like to thank Dr. Oliva Pisani and Perry
Mitchell for helpful discussions on organic geochemistry. Thank you for guiding me through the
extraction methods and data analysis procedures. Thank you to Kalyani Sabanayagam for always
keeping a smile. More importantly, thank you for updating the blackboard outside our lab with
your inspirational quotes and creative drawings. They never fail to make my day. Thank you to
Lisa Lin for your mentorship. Thank you to Lori vandenEnden for all your laughs and smiles.
Thank you to Justin Wang and Duke (Zhangliu) Du for the interesting lunchtime discussions.
Thank you to Vera Kovacevic for teaching me how to speak Serbian and Croatian. Thank you to
Paris Ning for your help with NFSS, and offering lots of food for thought in general. Thank you
to Vivek Dani for giving me your stapled booklet(s) of victory chits from Seven Wonders. They
will serve as a source of motivation for me to work towards my own victory chits. Thank you to
Hussain Masoom for inviting me to join GAPS. I definitely learned many transferrable skills
during my involvement. Roji Seevachandran, thank you for making undergrad life so memorable
#DSL #FEPmentorship.
iv
Thank you to Edward Nagato for coming out to our girls’ nights out. They wouldn’t
have been possible without you! Don’t ever lose that sassiness. Thank you for experiencing the
Bismack Biyombo and Jose Bautista eras with me #WeTheNorth #BautistaBatFlip #TDot. Let’s
hope there will be many more to come. Yes, we will make it to Tokyu hands and many other
places! And may the force of Miku always be with you.
Rebecca, Eunice, Joyce and Chun: From the very beginning, you girls have accompanied
me every step of the way, through sunny and rainy days. I am truly blessed to have wonderful
people like you.
Words cannot merely describe the gratitude I feel towards my family. To my mother and
my late father, your unconditional love and support have shaped me into the individual I am
today. Never have you doubted my ambitions, and this has allowed me to dream of achieving
what I wish to achieve in life. Thank you for believing in me and for all the sacrifices you have
made. To my brother, thank you for putting up with me and for all the scrumptious comfort food
you have made for me during my times of stress. Lastly, I would like to extend my deepest
appreciation to my aunts, uncles and cousins, for providing their support in times of need.
v
Table of Contents
Acknowledgments.......................................................................................................................... iii
Table of Contents .............................................................................................................................v
List of Tables ............................................................................................................................... viii
List of Figures ................................................................................................................................ ix
List of Appendices ......................................................................................................................... xi
Chapter 1: Introduction ....................................................................................................................1
1.1 The Arctic: from a net sink to a net source of atmospheric carbon ......................................1
1.2 Soil Organic Matter (SOM) ..................................................................................................5
1.3 Factors controlling SOM decomposition ..............................................................................6
1.3.1 Temperature ................................................................................................................6
1.3.2 Nitrogen and phosphorus amendments .......................................................................7
1.4 Major recalcitrant biomolecules in SOM: cutin, suberin and lignin ...................................10
1.5 Organo-mineral interactions................................................................................................13
1.6 Biomarker analysis of SOM ................................................................................................14
1.7 Characterization of SOM by nuclear magnetic resonance (NMR) spectroscopy ...............17
1.7.1 Solid-state 13
C cross polarization magic angle spinning (CPMAS) NMR ...............17
1.8 Research objectives .............................................................................................................18
1.9 References ...........................................................................................................................21
Chapter 2: Molecular-level characterization of Arctic soils after 32 years of in situ warming
and nitrogen + phosphorus fertilization ....................................................................................31
2.1 Abstract ...............................................................................................................................31
2.2 Introduction .........................................................................................................................32
2.3 Materials and methods ........................................................................................................35
2.3.1 Site description..........................................................................................................35
vi
2.3.2 Experimental design and sample collection ..............................................................35
2.3.3 Carbon (C) and nitrogen (N) analysis .......................................................................36
2.3.4 Biomarker extractions and gas chromatography-mass spectrometry (GC-MS)
analysis ...................................................................................................................36
2.3.5 Solid-state 13
C cross polarization magic angle spinning (CPMAS) NMR ...............38
2.3.6 Statistical analyses ....................................................................................................39
2.4 Results .................................................................................................................................40
2.4.1 Total carbon (C) and nitrogen (N) content ...............................................................40
2.4.2 Sources of biomarkers in Arctic soils .......................................................................42
2.4.3 SOM composition of warmed soils...........................................................................47
2.4.4 SOM composition of N+P fertilized soils .................................................................54
2.4.5 SOM composition of warmed + N+P fertilized soils ...............................................56
2.4.6 Solid-state 13
C NMR of Arctic soils .........................................................................58
2.5 Discussion ...........................................................................................................................61
2.5.1 Spatial heterogeneity and vertical mixing.................................................................61
2.5.2 Labile SOM components ..........................................................................................64
2.5.3 Recalcitrant SOM components .................................................................................66
2.5.4 Lignin-derived components ......................................................................................68
2.5.5 Implications on warming and N+P fertilizer addition on SOM degradation ............71
2.6 Conclusions .........................................................................................................................73
2.7 References ...........................................................................................................................75
Chapter 3: Evaluation of clay mineral and suberin and cutin protection of lignin in temperate
soils from surface horizons .......................................................................................................82
3.1 Abstract ...............................................................................................................................82
3.2 Introduction .........................................................................................................................83
3.3 Materials and methods ........................................................................................................85

vii
3.3.1 Description of soil samples and sampling sites ........................................................85
3.3.2 Determination of carbon (C) content ........................................................................88
3.3.3 Biomarker extractions and HF demineralization ......................................................88
3.3.4 Derivatization and gas chromatography-mass spectrometry (GC-MS) ....................91
3.3.5 Lignin-derived phenol analysis and calculation of % mineral-protected lignin
and % suberin- and cutin- protected lignin ............................................................91
3.4 Results and discussion ........................................................................................................93
3.4.1 Carbon (C) content ....................................................................................................93
3.4.2 Extraction yields of lignin-derived phenols and mineral protection of lignin ..........93
3.4.3 Suberin- and cutin-protected lignin ..........................................................................99
3.4.4 Implications for multilayer arrangement of organo-mineral interactions ...............102
3.5 Conclusions .......................................................................................................................104
3.6 References .........................................................................................................................106
Chapter 4: Conclusions and Future Directions ............................................................................112
4.1 Summary ...........................................................................................................................112
4.1.1 Molecular-level characterization of Arctic soils (Chapter 2) .................................112
4.1.2 Clay mineral, suberin and cutin protection of lignin (Chapter 3) ...........................114
4.2 Limitations and future work ..............................................................................................115
4.3 Research implications .......................................................................................................118
4.4 References .........................................................................................................................120
Appendices ...................................................................................................................................122
viii
List of Tables
Table 2-1: Total carbon and nitrogen content (%) and carbon: nitrogen ratios of the upper and
lower horizon soils of the control, warming, N+P fertilization and warming + N+P fertilization
treatments from all four blocks. .....................................................................................................41
Table 2-2: Solid-state 13
C CPMAS-NMR integration results with relative contribution (%) of the
four main carbon structures and calculated alkyl/O-alkyl ratios for the Control, Warming, N+P
Fertilization and Warming + N+P Fertilization treatments of the upper and lower horizon soils of
Block 1. ..........................................................................................................................................59
Table 3-1: Selected properties of four soils used in this study. ....................................................86
Table 3-2: Concentrations in μg/g soil of eight main lignin-derived phenols released after CuO
oxidation by comparing residues 1 (pre-HF) and 3 (post-HF). Values were determined from
triplicate samples (n = 3), unless otherwise indicated, followed by standard error. ......................94
Table 3-3: Percentages (%) of mineral protection of eight main lignin-derived phenols released
after CuO oxidationb, calculated by comparing the average yield of triplicate samples (n = 3), in
mg/g soil from residues 1 (pre-HF) and 3 (post-HF), followed by standard error. .......................97

ix
List of Figures
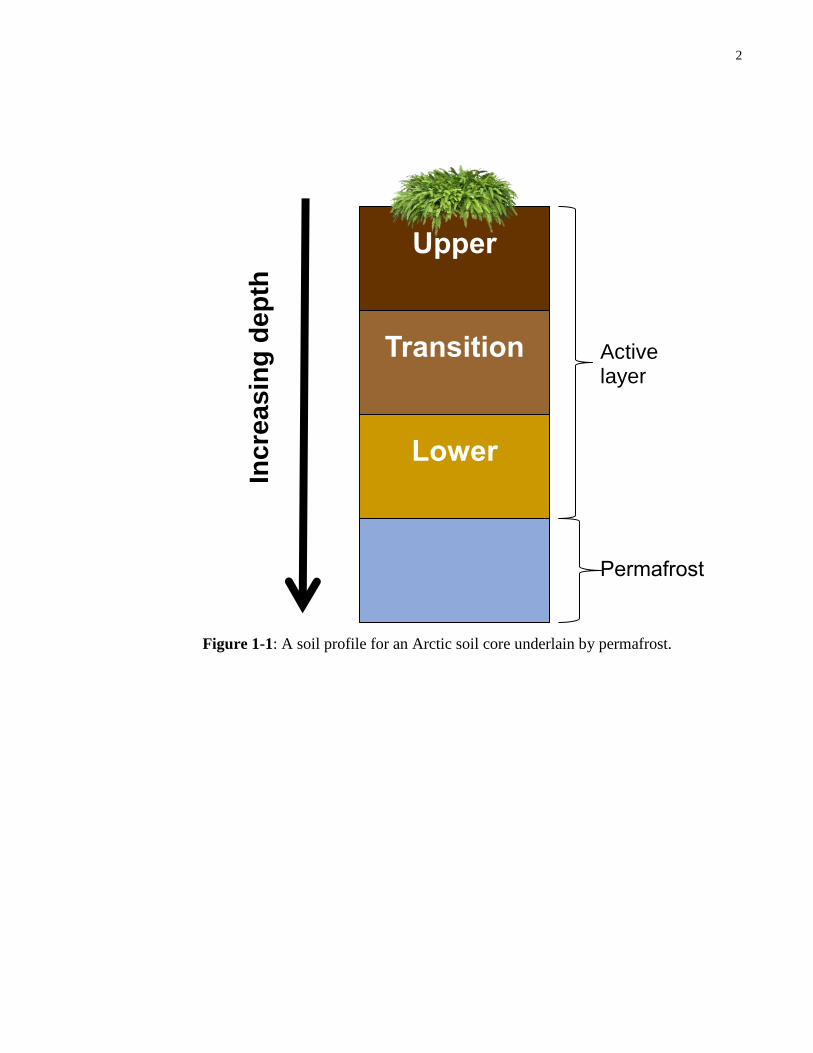
Figure 1-1: A soil profile for an Arctic soil core underlain by permafrost. ....................................2
Figure 1-2: Rising temperatures will result in permafrost thawing, which will cause carbon that
was previously frozen within permafrost to become susceptible to decomposition. The
accelerated degradation of carbon will increase carbon dioxide emissions into the atmosphere
and result in the permafrost carbon feedback. (Schaefer et al., 2014, reproduced with permission
from IOP Publishing Limited). ........................................................................................................4
Figure 1-3: Structures of the cutin (A) and suberin (B) biopolymers (Kögel-Knabner, 2002,
reproduced with permission from Elsevier). ..................................................................................11
Figure 1-4: Structural model of spruce lignin (Kögel-Knabner, 2002, reproduced with
permission from Elsevier). .............................................................................................................12
Figure 2-1: Concentrations (μg g-1
soil) of major SOM components from the upper horizon soil
samples after 32 years of warming, N+P fertilization and combined treatments. SOM
components include aliphatic and cyclic lipids, simple carbohydrates (galactose, glucose,
mannose), cutin- and suberin-derived lipids and lignin-derived phenols. All values are reported
as mean ± standard error (n = 2). Asterisks denote statistical significance from the control
treatment (P < 0.05). ......................................................................................................................43
Figure 2-2: Concentrations (μg g-1
soil) of major SOM components from the lower horizon soil
samples after 32 years of warming, N+P fertilization and combined treatments. SOM
components include aliphatic and cyclic lipids, simple carbohydrates (galactose, glucose,
mannose), cutin- and suberin-derived lipids and lignin-derived phenols. All values are reported
as mean ± standard error (n = 2). Asterisks denote statistical significance from the control
treatment (P < 0.05). ......................................................................................................................44
Figure 2-3: Concentrations (μg g-1
soil) of lignin-derived phenols (vanillyl, syringyl and
cinnamyl monomers) released from CuO oxidation of the upper horizon soil samples after 32
years of warming, N+P fertilization and combined treatments. All values are reported as mean ±
standard error (n = 2). Asterisks denote statistical significance from the control treatment (P <
0.05). ..............................................................................................................................................46
Figure 2-4: Concentrations (μg g-1
soil) of lignin-derived phenols (vanillyl, syringyl and
cinnamyl monomers) released from CuO oxidation of the lower horizon soil samples after 32
years of warming, N+P fertilization and combined treatments. All values are reported as mean ±
standard error (n = 2). Asterisks denote statistical significance from the control treatment (P <
0.05). ..............................................................................................................................................47
Figure 2-5: Plots of the acid to aldehyde ratios for syringyl (Ad/Al)s and vanillyl (Ad/Al)v
monomers of the upper horizon soils in each block. (Ad/Al)s = syringic acid/syringaldehyde;
(Ad/Al)v = vanillic acid/vanillin. Asterisks denote statistical significance from the control
treatment (P < 0.05). ......................................................................................................................50

x
Figure 2-6: Plots of the acid to aldehyde ratios for syringyl (Ad/Al)s and vanillyl (Ad/Al)v
monomers of the lower horizon soils in each block. (Ad/Al)s = syringic acid/syringaldehyde;
(Ad/Al)v = vanillic acid/vanillin. ...................................................................................................51
Figure 2-7: Plots of the syringyl/vanillyl monomers (S/V) and cinnamyl/vanillyl monomers
(C/V) ratios of the upper horizon soils in each block. Asterisks denote statistical significance
from the control treatment (P < 0.05). ...........................................................................................52
Figure 2-8: Plots of the syringyl/vanillyl monomers (S/V) and cinnamyl/vanillyl monomers
(C/V) ratios of the lower horizon soils in each block. Asterisks denote statistical significance
from the control treatment (P < 0.05). ...........................................................................................53
Figure 2-9: Solid-state 13
C CPMAS-NMR spectra of the Block 1 upper (a) and lower (b) horizon
soils of the Control, Warming, N+P Fertilization and Warming + N+P Fertilization treatments
with the four major spectral regions: alkyl (0-50 ppm), O-alkyl (50-110 ppm), aromatic and
phenolic (110-165 ppm) and carboxylic and carbonyl carbon (165- 215 ppm). ...........................60
Figure 3-1: Flowchart of the extraction sequence used to isolate the extracts and residues. Whole
soils were subject to solvent extraction to remove free lipids. Extract 1 was isolated from solvent
extraction and CuO oxidation. Extract 3 was isolated from solvent extraction, HF
demineralization and CuO oxidation. Extracts 2 and 4 were isolated in a similar fashion as
extracts 1 and 3 respectively, except with the addition of the base hydrolysis (BH) procedure. ..89
Figure 3-2: Percentage (%) of mineral protected-lignin in each VSC class from triplicate
samples (n = 3) of all four soils after HF treatment (comparison of extracts 2 and 4). NG,
Northern grassland soil; SG, Southern grassland soil; AGR, Agricultural soil; FOR, Forest soil.
Total vanillyls = vanillin, acetovanillone, vanillic acid; total syringyls = syringaldehyde,
acetosyringone, syringic acid; total cinnamyls = p-coumaric acid and ferulic acid. Error bars
indicate standard error....................................................................................................................95
Figure 3-3: Changes in average concentrations of lignin monomers from triplicate samples (n =
3) in the four soils: (a) Northern grassland; (b) Southern grassland; (c) Agricultural; (d) Forest,
suggesting suberin and cutin protection of lignin with mineral interference (comparison of
extracts 1 and 2) and without mineral interference (comparison of extracts 3 and 4). Error bars
indicate standard error..................................................................................................................101
xi
List of Appendices
Table A1: Concentrations (μg g-1
soil) of n-alkanes identified from the total solvent extracts of
the upper and lower horizon soils of the control, warming, N+P fertilization and warming +N+P
fertilization treatments. All values are reported as mean ± standard error (n = 2). .....................122
Table A2: Concentrations (μg g-1
soil) of n-alkanols identified from the total solvent extracts of
the upper and lower horizon soils of the control, warming, N+P fertilization and warming +N+P
fertilization treatments. All values are reported as mean ± standard error (n = 2). .....................124
Table A3: Concentrations (μg g-1
soil) of n-alkanoic acids and total aliphatic compounds
identified from the total solvent extracts of the upper and lower horizon soils of the control,
warming, N+P fertilization and warming +N+P fertilization treatments. All values are reported
as mean ± standard error (n = 2). .................................................................................................126
Table A4: Concentrations (μg g-1
soil) of major compound classes identified in the total solvent
extracts (excluding aliphatic compounds) of the upper and lower horizon soils of the control,
warming, N+P fertilization and warming +N+P fertilization treatments. All values are reported
as mean ± standard error (n = 2). Numbers in bold denote statistical significance from the control
treatment (P < 0.05). ....................................................................................................................129
Table A5: Concentrations (μg g-1
soil) of major SOM components released from the base
hydrolysis of the upper and lower horizon soils of the control, warming, N+P fertilization and
warming +N+P fertilization treatments. All values are reported as mean ± standard error (n = 2).
Numbers in bold denote statistical significance from the control treatment (P < 0.05). .............132
Table A6: Solid-state 13
C CPMAS-NMR integration results with relative contribution (%) of the
four main carbon structures and calculated alkyl/O-alkyl ratios for the Control treatments of the
upper horizon soils of each block. These soils were not treated with hydrofluoric acid. ............137
Figure A1: Solid-state 13
C CPMAS-NMR spectra of the upper horizon soils of the Control
treatments of each block with the four major spectral regions: alkyl (0-50 ppm), O-alkyl (50-110
ppm), aromatic and phenolic (110-165 ppm) and carboxylic and carbonyl carbon (165- 215
ppm). These soils were not treated by hydrofluoric acid. ............................................................138
1
Chapter 1: Introduction
1.1 The Arctic: from a net sink to a net source of atmospheric carbon
Permafrost is defined as soil which maintains sub-zero temperatures for at least two
consecutive years (Davidson et al., 2000; Schaefer et al., 2011). The Arctic has long been
regarded as a net sink of atmospheric carbon (C), storing approximately 1672 gigatons of C,
most of which is contained within permafrost (Tarnocai et al., 2009; Schaefer et al., 2011).
Permafrost can extend to several hundred meters below ground, but nearly 50% of
permafrost-derived C is situated in the upper 3 meters of the soil (Tarnocai et al., 2009;
Schaefer et al., 2011). Considerable amounts of frozen organic matter (OM) are contained in
permafrost (Tarnocai, 1997; Ping et al., 2008; Schaefer et al., 2011), which is believed to
have been buried by sedimentation processes since the last ice age (Schuur et al., 2008;
Schaefer et al., 2011). Vertical mixing between soil horizons caused by freezing and thawing
cycles, otherwise known as cryoturbation, may also have facilitated the burying of OM in
deep soil layers (Bockheim and Tarnocai, 1998; Davidson and Janssens, 2006). This may
explain why permafrost soils contain large stocks of global C (Davidson and Janssens, 2006).
A soil profile of an Arctic soil core is shown in Figure 1-1, which demonstrates that
permafrost soils are buried deep underneath the surface ground layer. The soil layer that
thaws annually during summer and re-freezes in winter is referred to as the active layer
(Schuur et al., 2008). Rising temperatures are expected to trigger active layer thickening as
the depth of permafrost layers becomes reduced by thawing. As a result, it is likely that
greater amounts of soil will be exposed to above-freezing seasonal temperatures (Schuur et
al., 2008).
2
Inc
rea
sin
g d
ep
th
Upper
Transition
Lower
Active layer
Permafrost
Figure 1-1: A soil profile for an Arctic soil core underlain by permafrost.

3
Greenhouse gases absorb solar radiation and re-emit it back to the Earth’s surface,
which prevents heat from escaping the atmosphere (IPCC, 2013). Elevated concentrations of
greenhouse gases are expected to increase the absorption and re-emission of radiation, which
will promote the trapping of heat within the Earth’s atmosphere (IPCC, 2013). Increasing
carbon dioxide (CO2) emissions from anthropogenic activities such as fossil fuel burning and
deforestation are projected to elevate Arctic temperatures by 7- 8°C by the end of the 21st
century (Schuur et al., 2013). Models also predict that during the same time period, the
current areal extent of near-surface (top 2- 3 m) permafrost will be reduced by 53%- 66% as
a result of rising temperatures (Schuur et al., 2013). As such, there is accruing evidence that
the Arctic is becoming a net source of atmospheric C (Qian et al., 2010; Hayes et al., 2011).
Warming-induced permafrost thawing will cause C that was previously frozen within the
permafrost to become susceptible to microbial decomposition (Osterkamp and Romanovsky,
1999; Serreze et al., 2000; Davidson and Janssens, 2006). The microbial breakdown of
permafrost-derived C will facilitate the release of CO2 (Schuur et al., 2013), which will in
turn exacerbate atmospheric warming and subsequently expedite permafrost thawing (Schuur
et al., 2008). The further release of CO2 from the decomposition of permafrost-derived C will
ultimately contribute to a positive climate feedback as outlined in Figure 1-2 (Hobbie et al.,
2002; Schaefer et al., 2011).

4
Figure 1-2: Rising temperatures will result in permafrost thawing, which will cause carbon
that was previously frozen within permafrost to become susceptible to decomposition. The
accelerated degradation of carbon will increase carbon dioxide emissions into the atmosphere
and result in the permafrost carbon feedback (Schaefer et al., 2014, reproduced with
permission from IOP Publishing Limited).
5
1.2 Soil Organic Matter (SOM)
Soil organic matter (SOM) is a heterogeneous mixture of organic materials derived
from plant, microbial and animal residues, at varying stages of decomposition (Feng and
Simpson, 2011). SOM retains essential nutrients and water in the soil, which are necessary
for supporting living organisms (Davidson and Janssens, 2006; Simpson and Simpson, 2012).
SOM also plays an important role in the C cycle (Sulzman et al., 2005), particularly in the
sequestration of soil C (Schlesinger, 1991; Batjes, 1996; Trumbore and Czimczik, 2008).
SOM consists of nearly two-thirds of the terrestrial C in the world (Schlesinger, 1991; Batjes,
1996), which is more C than in global vegetation and the atmosphere combined (Lehmann
and Kleber, 2015). It is therefore crucial to establish the fundamental factors that govern the
fate of SOM, such as chemical recalcitrance, physical aggregation and mineral protection
mechanisms (Amelung et al., 2009; Kögel-Knabner and Amelung, 2014). This will largely
benefit our understanding on how to maximize C sequestration in soils and to inhibit the
release of elevated C emissions from SOM decomposition (Lehmann and Kleber, 2015).
Information about molecular constituents in SOM will aid in understanding the fate of SOM
(Simpson and Simpson, 2012). Molecular-level data can be used to draw linkages to
macroscopic- and ecosystem-level responses, which will greatly facilitate the predictions of
potential ecosystem shifts (Simpson and Simpson, 2012). More specifically, this type of
research will provide information on the role of temperature and nutrient availability in SOM
decomposition processes and microbial community structures in Arctic tundra ecosystems.
This will be pertinent for elucidating the widespread shifts in terrestrial ecosystem functions
and biogeochemical cycles in response to rapidly rising temperatures (von Lützow and
Kögel-Knabner, 2009). Altogether, this knowledge will be instrumental in the development
of mitigation strategies for adaptation to a changing climate.

6
1.3 Factors controlling SOM decomposition
1.3.1 Temperature
The mean annual temperatures of mid- to high-latitude regions are projected to rise
by 3-5°C, with the greatest temperature increases expected in the high-latitude and Arctic
regions (Christensen et al., 2007). Understanding the temperature dependence of SOM
decomposition will ultimately help to determine the strength of the climate change feedback
loop as a function of atmospheric CO2 concentration (Ågren and Wetterstedt, 2007). Using a
simple model, Ågren and Wetterstedt (2007) verified the temperature dependence on the
breakdown of SOM, which ultimately contributes to the rate of C release. Enzyme activity
and interactions between OM and mineral complexes, which contribute to SOM degradation
processes, are governed by temperature (Ågren and Wetterstedt, 2007). With the onset of
global climate change, it is still unclear how shifts in the microbial community composition
will contribute to SOM decomposition patterns (Biasi et al., 2005; Frey et al., 2008; Feng and
Simpson, 2011). Rising temperatures may stimulate microbial activity which will expedite
SOM decomposition (Davidson and Janssens, 2006; Lehmann and Kleber, 2015).
The temperature sensitivity of decomposition varies between the labile and
recalcitrant SOM pools, where the decomposition of the labile SOM pool has been believed
to be more susceptible to temperature changes than the recalcitrant SOM pool (Schlesinger
and Andrews, 2000; Pautler et al., 2010). More specifically, labile OM compounds such as
carbohydrates and proteins are thought to be more sensitive to degradation at elevated
temperatures than recalcitrant OM compounds such as cutin-, suberin- and lignin-derived
compounds. Hence, the breakdown of these labile OM compounds may be a major source for
elevated CO2 emissions to the atmosphere (Schlesinger and Andrews, 2000; Pautler et al.,

7
2010). However, recent evidence suggests that SOM pools with slower turnover rates are
more sensitive to changes in temperature than those with faster turnover rates (Davidson and
Janssens, 2006; Conant et al., 2008; Craine et al., 2010; Lehmann and Kleber, 2015). For
example, results from a long-term field warming experiment of forest soils revealed that once
labile substrates have been depleted, microbes begin to decompose more recalcitrant
substrates, which leads to an enhancement in the overall decay of more stable SOM
compounds over long-term temperature changes (Frey et al., 2013). Short-term field warming
experiments (< 10 years) may produce bias towards temperature responses of labile SOM
pools compared to those from recalcitrant SOM pools (Davidson et al., 2000; Ågren and
Bosatta, 2002; Leifeld and Fuhrer, 2005; von Lützow and Kögel-Knabner, 2009).
Consequently, long-term ecosystem-level warming experiments are necessary to facilitate a
more mechanistic understanding of how recalcitrant and labile SOM pools respond to
climate-induced changes over broader time scales (Van Wijk et al., 2004).
1.3.2 Nitrogen and phosphorus amendments
The response of SOM decomposition to changes in nutrient availability is important
for determining net ecosystem C balance in a changing climate (Mack et al., 2004). Previous
modelling studies have suggested that elevated temperatures may stimulate SOM
decomposition and increase nutrient availability in soils (Shaver, 1992; Hobbie et al., 2002;
Mack et al., 2004). Nitrogen (N) and phosphorus (P) are essential nutrients for plant growth
(Vitousek et al., 2002; Shaver et al., 2014; Pisani et al., 2015). The cycling of N and P in
soils is strongly correlated to the C cycle (Kögel-Knabner and Amelung, 2014), but their
interactions with the C cycle have yet to be established (Shaver et al., 2006). N and P are of
current interest particularly in high latitude ecosystems because the availability of these
nutrients is believed to strongly constrain ecosystem gain of C (Hobbie et al., 2002). The
8
thawing of permafrost in tundra ecosystems is expected to expedite the release of N and P in
soils, which will likely enhance plant productivity (Hobbie et al., 2002). However, it is still
unclear how SOM biogeochemistry in Arctic ecosystems will be altered in response to
increased N and P availability in soils.
In the Arctic, the main sources of N inputs are bacterial fixation and rainfall and snow
deposition while the main losses of N are by leaching and denitrification (Shaver et al.,
2014). The mean residence time of N in soils is about 50 years (Schlesinger, 1991; Kögel-
Knabner and Amelung, 2014), which indicates that N is mostly conserved in soils. Numerous
experiments on N fertilization of soils have been conducted (Vitousek, 1982; Berg and
Matzner, 1997; Hobbie et al., 2000; Neff et al., 2002; Mack et al., 2004), where positive
(Waldrop et al., 2004; Bradford et al., 2008) and negative (Mack et al., 2004; Waldrop et al.,
2004; Bradford et al., 2008) correlations between N fertilization and SOM decomposition
have been observed. This may be due to the differences in responses between low- and high-
latitude ecosystems (Mack et al., 2004) and in soils from various environments (Bradford et
al., 2008). For example, N fertilization in agricultural soils was found to inhibit SOM
decomposition (Gregorich et al., 1996; McLauchlan, 2006; Bradford et al., 2008) but this was
not observed in grassland soils (Bradford et al., 2008). In boreal forests of Sweden and
Finland, long-term N fertilization resulted in the accumulation of soil C due to a decline in
SOM decomposition from a reduction in heterotrophic respiration (Hyvönen et al., 2008).
After 20 years of N fertilization in temperate forest soils, SOM decomposition was observed
to be suppressed by inhibited microbial activity (Frey et al., 2014). However, in a different
northern temperate forest, N fertilization caused a loss of soil C, which was likely attributable
to enhanced microbial activity (Waldrop et al., 2004). The contrasting responses to N
addition may also be ascribed to variations in the decomposition of various SOM pools

9
(Lavoie et al., 2011). N fertilization has been observed to stimulate the decomposition of
labile C but may suppress the decomposition of recalcitrant compounds (Berg and Matzner,
1997; Lavoie et al., 2011). Previous N addition experiments conducted in the Arctic tundra
have demonstrated that plant productivity and biomass accumulation in this ecosystem are
strongly limited by N availability (Shaver et al., 2001). However, it is still unclear how SOM
biogeochemistry in Arctic ecosystems will change in response to greater N availability.
Previous field experiments conducted in Arctic ecosystems have also observed that in
addition to N limitation, the plant productivity of tussock tundra vegetation may also be
limited by P availability (Shaver and Chapin, 1980; Shaver et al., 2001). The mean residence
time of organic P in soils is estimated to be between 350 to 2000 years (Paul and Clark,
1996; Kögel-Knabner and Amelung, 2014). From a 400-day long incubation study of
Alaskan tundra soils, Shaver et al. (2006) found that although P content was higher in
fertilized soils, C losses were predominantly due to N fertilization and not P fertilization.
This suggests that N may play a more vital role in SOM degradation processes and C cycling
than P in high-latitude environments (Shaver et al., 2006).
Mack et al. (2004) reported that N and P fertilization caused a net ecosystem loss of C
despite a twofold increase in litter over 20 years in an Arctic ecosystem. However, when the
same soils were analyzed in an incubation study, the net loss of C was considerably less
(Schimel and Weintraub, 2003; Shaver et al., 2006). The presence of live vegetation and
inputs of fresh litter may have played an important role in microbial growth and uptake,
which may have increased C mineralization rates in the field experiment (Shaver et al.,
2006). Although a general consensus has yet to be reached regarding the general roles of N
and P in SOM degradation processes and C cycling, it is important to acknowledge that these

10
roles may differ among ecosystems. N and P fertilization may expedite SOM decomposition
processes especially in nutrient-limited environments (Shaver et al., 2014).
1.4 Major recalcitrant biomolecules in SOM: cutin, suberin and lignin
With rising global temperatures (Schaefer et al., 2011), much research has been
dedicated towards examining how elevated amounts of C released into the atmosphere from
SOM degradation processes will contribute to global warming (Mack et al., 2004). As a
result, there is also a pressing need to better understand how SOM can be stabilized to
maximize C sequestration in soils (Christensen, 2001; Six et al., 2002; Clemente and
Simpson, 2013). The stability of OM may be governed by a resistance to degradation due to
the structural properties of the OM compounds, which is also known as inherent chemical
recalcitrance (Six et al., 2002; Lorenz et al., 2007; Clemente et al., 2011). For example,
suberin and cutin, components of SOM, experience long residence times in soil, possibly due
to the nature of their molecular structures such as alkyl C chains in lipids and aromatic
structures which are more difficult to break down (Mikutta et al., 2006; Lorenz et al., 2007;
Clemente et al., 2011). Cutin forms the macromolecular framework of the plant cuticle,
which protects plant surfaces against aridity (Kögel-Knabner, 2002). Cutin is produced in the
epidermis of leaves of vascular plants (Holloway, 1982; Otto and Simpson, 2006b). The cutin
polymer (Figure 1-3a) is believed to be composed of di- and tri-hydroxy and epoxy fatty
acids with C16 and C18 chain lengths (Kögel-Knabner, 2002), which are linked by ester bonds
(Kolattukudy, 1981; Kögel-Knabner, 2002). Suberin is a cell wall component of cork cells
which forms the periderm layer of subterranean parts of woody plants (Kögel-Knabner,
2002). Suberin is found in the periderm of roots and barks of vascular plants and consists of
long-chain (C20-C32) aliphatic lipids, diacids and ω-hydroxy acids and some phenolic

11
moieties (Kolattukudy and Espelie, 1989; Bernards, 2002; Otto and Simpson, 2006b). The
structure of the suberin polymer is shown in Figure 1-3b.
Figure 1-3: Structures of the cutin (A) and suberin (B) biopolymers (Kögel-Knabner, 2002,
reproduced with permission from Elsevier).
Lignin is the second most abundant biomolecule in vascular plants after
polysaccharides (Derenne and Largeau, 2001), and provides strength and rigidity to plant
structures (Brown, 1961; Kirk and Farrell, 1987; Argyropoulos and Menachem, 1997;
Higuchi, 2006). Lignin is a biopolymer composed of three types of phenylpropanoid units:
vanillyl, syringyl and cinnamyl (Adler, 1977; Derenne and Largeau, 2001). The structure of
lignin is illustrated in Figure 1-4. In soils, the concentration of compounds from each of these
classes is not only characteristic of its vegetation source, but is also indicative of the degree
of degradation in organic and mineral horizons (Hedges and Mann, 1979). Lignin was
previously thought to be biochemically recalcitrant (Berg and Staaf, 1980; Lehmann and
Kleber, 2015) due to its aromaticity (Feng and Simpson, 2011). In comparison to
macromolecules such as cellulose and hemicellulose, lignin has been thought to be more
resistant to microbial degradation because only white-rot and brown-rot fungi are able to

12
completely decompose lignin to CO2 (Kögel-Knabner, 2002). However, recent evidence
suggests that as long as lignin is easily accessible to microbial attack, lignin can be degraded
(Klotzbücher et al., 2011; Lehmann and Kleber, 2015). In comparison to suberin and cutin,
lignin is believed to be less resistant to degradation (Mikutta et al., 2006; Lorenz et al., 2007;
Clemente et al., 2011).
Figure 1-4: Structural model of spruce lignin (Kögel-Knabner, 2002, reproduced with
permission from Elsevier).
13
1.5 Organo-mineral interactions
In addition to chemical recalcitrance, SOM can also be stabilized through association
with clay mineral surfaces, which likely protects SOM from microbial degradation (Baldock
and Skjemstad, 2000; Eusterhues et al., 2003; Kaiser and Guggenberger, 2003; Mikutta et al.,
2006). Sorptive interactions between OM and clay mineral surfaces are governed by clay
mineralogy and the composition of the OM sorbate (Asselman and Garnier, 2000; Chi and
Amy, 2004; Feng et al., 2005; Mikutta et al., 2007; Ghosh et al., 2009; Clemente and
Simpson, 2013). From previous sorption studies, polymethylene structures have been
observed to preferentially sorb to kaolinite and montmorillonite (Feng et al., 2005; Simpson
et al., 2006; Ghosh et al., 2009; Clemente et al., 2011), which suggests that aliphatic
compounds may be selectively preserved through sorption (Clemente et al., 2011). In
addition, proteins have also been observed to sorb onto montmorillonite (Feng et al., 2005;
Ghosh et al., 2009; Clemente et al., 2011) while carboxyl groups from OM have been
observed to sorb to goethite (Ghosh et al., 2009; Clemente et al., 2011). In addition, the
ability of minerals to preserve OM is regulated by the number of sites on the mineral surface
which are available for sorption (Kaiser and Guggenberger, 2003). Based on the findings
from previous studies, recalcitrant biomacromolecules in soil such as cutin, suberin and
lignin, are likely to be associated with clay mineral surfaces by sorptive interactions (Bahri et
al., 2006; Mikutta et al., 2006; Rumpel et al., 2006; Heim and Schmidt, 2007; Hernes et al.,
2013; Lin and Simpson, 2016). Lignin is of particular interest because they may represent an
important part of stabilized OM when associated with clay minerals (Thevenot et al., 2010;
Clemente and Simpson, 2013).
Various chemical extraction methods involving desorbing, hydrolyzing and oxidizing
reagents have been employed to extract OM bound to clays and Fe and Al oxides (von
14
Lützow et al., 2007). Some methods include acid hydrolysis with hydrochloric acid,
oxidative degradation with sodium hypochlorite or disodium peroxodisulfate (von Lützow et
al., 2007). In particular, mineral dissolution with hydrofluoric (HF) acid has been commonly
used to release mineral-bound OM (Schmidt et al., 1997; Eusterhues et al., 2003; Mikutta et
al., 2006; Rumpel et al., 2006). HF reacts with silicates and oxides to form soluble silicate
minerals but OM is presumed to remain intact (Eusterhues et al., 2007). The dissolution of
minerals is achieved based on the breakdown of Si-O bonds (Rumpel et al., 2006). HF
treatment has also been used extensively for the removal of paramagnetic substances in SOM
before conducting solid-state 13
C nuclear magnetic resonance (NMR) spectroscopy
(Zegouagh et al., 2004; Rumpel et al., 2006).
1.6 Biomarker analysis of SOM
Biomarkers are defined as tracers of biosynthesized organic molecules and are
analogous to OM fingerprints (Simpson and Simpson, 2012). Their unique C skeleton
information remains intact during abiotic or biotic degradation and can be traced to a specific
plant or microbial source (Amelung et al., 2009; Simpson and Simpson, 2012) and a marine
or terrestrial environment (Hedges et al., 2000; Kögel-Knabner, 2002; Amelung et al., 2009;
Feng and Simpson, 2011). Biomarker analyses can provide information on the degree of
SOM degradation which can be used to understand how SOM may be altered in response to
global environmental changes such as elevated temperatures (Feng and Simpson, 2011).
Sequential biomarker extractions can be used to isolate SOM components which are
indicative of SOM sources (gymnosperm and angiosperm plants) and their degradation stage
in soil (Otto and Simpson, 2007; Feng and Simpson, 2011). Extraction with organic solvents
can remove unbound lipids including n-alkanes, n-alkanols, n-alkanoic acids, steroids and
15
terpenoids, along with carbohydrates (Otto and Simpson, 2007). Short-chain n-alkanes, n-
alkanols and n-alkanoic acids (< C20) typically originate from fungi and bacteria (Dinel et al.,
1990; Collister et al., 1994; Bourbonniere et al., 1997; Amelung et al., 2009) while their
long-chain counterparts (> C20) originate from the cuticle waxes of terrestrial plants (Collister
et al., 1994; Amelung et al., 2009). Subsequent to solvent extraction, base hydrolysis can be
used to release ester-bound monomers that originate from suberin and cutin biopolymers
(Otto and Simpson, 2006b). The proportion of bound lipids in soil that are derived from
leaves vs. roots can be estimated using a ratio based on the amount of extractable cutin and
suberin monomers (Kögel-Knabner et al., 1989; Otto and Simpson, 2006b). Following base
hydrolysis, copper (II) oxide (CuO) oxidation is used to cleave ether bonds which releases
lignin-derived phenols that can be divided into three structural classes: vanillyl, syringyl and
cinnamyl phenols (Otto and Simpson, 2006a). Specific types of plants are known to produce
certain types of lignin-derived phenols (Hedges and Mann, 1979). For example,
gymnosperms produce vanillyl phenols, angiosperms produce both vanillyl and syringyl
phenols while nonwoody vascular plants produce cinnamyl phenols (Hedges and Mann,
1979). Based on the yields of each lignin-derived phenol class from the CuO oxidation
extracts, the ratios of syringyl/vanillyl phenols (S/V) and cinnamyl/vanillyl phenols (C/V)
can be used to differentiate lignin inputs from gymnosperm vs. angiosperms sources and
from woody vs. nonwoody vascular plants (Hedges and Mann, 1979; Hedges and Ertel,
1982; Otto and Simpson, 2006a). Acid to aldehyde (Ad/Al) ratios of vanillyl and syringyl
phenols, which reflect the level of oxidation of lignin side chains (Derenne and Largeau,
2001), increase with progressive lignin oxidation (Ertel and Hedges, 1985; Hedges et al.,
1988; Opsahl and Benner, 1995; Otto and Simpson, 2006a).
16
Gas chromatography-mass spectrometry (GC-MS) is commonly used for biomarker
analyses (Simoneit, 2005). The gas chromatograph (GC) is the compound-separation
instrument while the mass spectrometer (MS) analyzes compounds based on their mass-to-
charge ratios (Simoneit, 2005). After the sample is volatilized in the GC, analytes in the
sample are partitioned between a gaseous mobile phase and a column stationary phase such
as poly(dimethylsiloxane). Helium is often used as a carrier gas to transport analytes through
the column. Separation is achieved based on the analyte’s affinity for the mobile and
stationary phases. Analytes that interact more strongly with the mobile phase will travel
faster through the column (Skoog et al., 2007). Extracts are derivatized to convert polar
functional groups into species that are amenable for GC-MS analysis (Horning et al., 1969).
A common derivatization method is the conversion of reactive hydrogen atoms to their
trimethylsilyl derivatives using N,O-bis-(trimethylsilyl) trifluoroacetamide (BSTFA) and
pyridine (Horning et al., 1969; Otto et al., 2005). After separation in the chromatography
column, molecules are ionized before they are introduced into the MS detector. The most
common ionization method for biomarkers is by electron impact ionization, where vaporized
molecular compounds are ionized by the bombardment of energetic electrons (Skoog et al.,
2007). Ionized molecules are then detected by quadrupole mass analyzers (Skoog et al.,
2007). Quadrupole mass analyzers consist of a set of four electrodes and resolve ions based
on their mass-to-charge ratios. Only ions within a specific mass region (i.e. 50 – 650 Da)
pass through the mass analyzer (Miller and Denton, 1986). Based on unique fragmentation
patterns of each compound, the mass spectra can be used for compound identification.
17
1.7 Characterization of SOM by nuclear magnetic resonance (NMR)
spectroscopy
NMR spectroscopy is a nondestructive spectroscopic technique which can provide a
compositional overview of complex samples such as SOM (Simpson et al., 2011). NMR can
yield information about the abundance of functional groups (Otto and Simpson, 2007).
Biomarker methods only analyze the extractable portion of SOM, whereas NMR techniques
can offer a structural overview of SOM composition. Therefore, biomarkers and NMR serve
as complementary methods to present an overall picture of SOM biogeochemistry (Feng and
Simpson, 2011).
1.7.1 Solid-state 13
C cross polarization magic angle spinning (CPMAS) NMR
Solid-state 13
C NMR is the most commonly used NMR technique in soil analyses
because it requires minimal amounts of sample and provides general information regarding
the distribution of C structures in the sample (Kögel-Knabner, 2000; Feng et al., 2010; Feng
and Simpson, 2011). Pre-treatment of soils with HF removes paramagnetic materials and
dissolves minerals to concentrate SOM (Simpson et al., 2011). Since 13
C only represents
1.13% of total C found in nature, 13
C NMR may not detect subtle changes in SOM
composition (Feng and Simpson, 2011). Spinning at the magic angle (54.74° with respect to
the applied magnetic field) along with the suppression of 1H-
13C dipolar interactions by high
power decoupling collectively reduces chemical shift anisotropy and line broadening
(Andrew et al., 1958; Simpson et al., 2011). Cross polarization magic angle spinning
(CPMAS) is considered a semi-quantitative technique because it relies on the magnetization
transfer between protons and the C that are directly attached. Hence, C which are remote
from protons may not be detected as well by CPMAS (Conte et al., 2004). A 13
C NMR
18
spectrum of SOM can be divided into four major spectral regions: aliphatic, 0 -50 ppm; O-
alkyl, 50-110 ppm; aromatic and phenolic, 110-165 ppm and carboxyl and carbonyl C, 165-
220 ppm (Baldock et al., 1992; Simpson et al., 2008). Based on the abundances of the alkyl
and O-alkyl C from the 13
C CPMAS NMR spectrum, the alkyl/O-alkyl ratio has been
observed to increase with progressive SOM degradation (Baldock and Preston, 1995;
Sjögersten et al., 2003; Simpson et al., 2008).
1.8 Research objectives
With the onset of global environmental change, there is a growing concern over the
extent of CO2 emissions released from the thawing of permafrost soils (Schaefer et al., 2011).
The amount of C stored in soils is governed by the stabilization mechanisms which are
controlled by the chemical, physical and biological interactions within the soil matrix
(Kögel-Knabner et al., 2008). Therefore, it is important to establish the mechanisms which
stabilize and destabilize SOM, and to recognize their roles in C sequestration in soils. SOM
could be stabilized by interactions with mineral surfaces (Baldock and Skjemstad, 2000) but
could be degraded with environmental changes such as elevated temperatures (Feng et al.,
2008) and increased nutrient availability (Mack et al., 2004). Since the chemical composition
of SOM is a useful predictor of C turnover (Ågren and Bosatta, 1996; Shaver et al., 2006), a
molecular-level investigation will deepen our understanding of how SOM biogeochemical
shifts can be used to predict changes in C cycling in response to global environmental
change. The objectives of this research were to characterize SOM:
1. In whole soils from an Arctic ecosystem which were subjected to 32 years of
manipulated soil warming and N and P fertilization. It is hypothesized that N and P
fertilization will be a stronger contributing factor to SOM decomposition than soil
19
warming. However, it is predicted that the combined treatments of soil warming and
N and P fertilization will expedite SOM decomposition processes the most.
2. In grassland, agricultural and forest soils from temperate ecosystems which are rich in
clay minerals and Fe and Al oxides. This will verify the role of mineral protection and
identify possible OM-OM interactions between major recalcitrant biopolymers (i.e.
suberin and cutin protection of lignin). We hypothesize that mineral protection will
play a more major role in stabilizing SOM, compared to OM-OM interactions.
To determine the source and degradation state of SOM in whole soils from an Arctic
ecosystem after 32 years of soil warming and nutrient addition, sequential biomarker
extractions were employed followed by GC-MS analysis. Samples were also investigated by
solid-state 13
C NMR to present an overall picture of the SOM biogeochemistry in these
Arctic soils. SOM in the organic and mineral horizon soils from Toolik Lake, Alaska were
extracted by solvent extraction, base hydrolysis and CuO oxidation. Biomarkers were
identified and quantified by GC-MS. Solid-state 13
C NMR was employed to characterize the
structural components of SOM in these samples. Results are presented in Chapter 2.
SOM in grassland, agricultural and forest soils from Alberta, Ontario and British
Columbia, Canada, respectively were characterized using similar molecular-level techniques.
These soils were subjected to HF demineralization to investigate organo-mineral interactions.
Biomarkers were identified and quantified after base hydrolysis and CuO oxidation
extraction procedures, followed by GC-MS analysis. Results are presented in Chapter 3.
Overall, the aim of this thesis is to determine the possible factors which govern SOM
stabilization and degradation mechanisms and how they contribute to ecosystem storage of
soil C. In Arctic tundra soils, rising temperatures and nutrient addition may accelerate SOM

20
degradation processes, triggering elevated levels of CO2 emissions to the atmosphere and
potentially contributing to the positive feedback of global warming. In temperate soils, clay
mineral interactions may be able to protect SOM from degradation, thus contributing to the
overall stabilization of SOM. Our goal is to employ biomarkers and NMR methods to predict
possible SOM biogeochemical shifts with global warming and how SOM stabilization
mechanisms could potentially contribute to our understanding of C sequestration in soils.
21
1.9 References
Adler, E., 1977. Lignin chemistry-past, present and future. Wood Science and Technology
11, 169-218.
Ågren, G., Bosatta, E., 1996. Theoretical Ecosystem Ecology: Understanding Element
Cycles. Cambridge University Press, Cambridge, UK.
Ågren, G.I., Bosatta, E., 2002. Reconciling differences in predictions of temperature
response of soil organic matter. Soil Biology and Biochemistry 34, 129-132.
Ågren, G.I., Wetterstedt, J.Å.M., 2007. What determines the temperature response of soil
organic matter decomposition? Soil Biology and Biochemistry 39, 1794-1798.
Amelung, W., Brodowski, S., Sandhage-Hofmann, A., Bol, R., 2009. Combining biomarker
with stable isotope analyses for assessing the transformation and turnover of soil organic
matter. Advances in Agronomy 100, 155-250.
Andrew, E.R., Bradbury, A., Eades, R.G., 1958. Nuclear magnetic resonance spectra from a
crystal rotated at high speed. Nature 182, 1659.
Argyropoulos, D.S., Menachem, S.B., 1997. Lignin. In: Eriksson, K.E.L. (Ed.), Advances in
Biochemical Engineering/ Biotechnology. Springer, Berlin, Germany, pp. 127-158.
Asselman, T., Garnier, G., 2000. Adsorption of model wood polymers and colloids on
bentonites. Colloids and Surfaces A: Physicochemical and Engineering Aspects 168, 175-
182.
Bahri, H., Dignac, M.F., Rumpel, C., Rasse, D.P., Chenu, C., Mariotti, A., 2006. Lignin
turnover kinetics in an agricultural soil is monomer specific. Soil Biology and Biochemistry
38, 1977-1988.
Baldock, J.A., Oades, J.M., Waters, A.G., Peng, X., Vassallo, A.M., Wilson, M.A., 1992.
Aspects of the chemical structure of soil organic materials as revealed by solid-state 13
C
NMR spectroscopy. Biogeochemistry 16, 1-42.
Baldock, J.A., Preston, C.M., 1995. Chemistry of carbon decomposition processes in forests
as revealed by solid-state carbon-13 nuclear magnetic resonance. In: McFee, W.W., Kelly,
J.M. (Eds.), Carbon Forms and Functions in Forest Soils. Soil Science Society of America
Inc., Madison, USA, pp. 89-117.
Baldock, J.A., Skjemstad, J.O., 2000. Role of the soil matrix and minerals in protecting
natural organic materials against biological attack. Organic Geochemistry 31, 697-710.
Batjes, N.H., 1996. Total carbon and nitrogen in the soils of the world. European Journal of
Soil Science 47, 151-163.
Berg, B., Staaf, H., 1980. Decomposition rate and chemical changes of scots pine needle
litter. II. Influence of chemical composition. Ecological Bulletin 32, 373-390.
22
Berg, B., Matzner, E., 1997. Effect of N deposition on decomposition of plant litter and soil
organic matter in forest systems. Environmental Reviews 5, 1-25.
Bernards, M.A., 2002. Demystifying suberin. Canadian Journal of Botany 80, 227-240.
Biasi, C., Rusalimova, O., Meyer, H., Kaiser, C., Wanek, W., Barsukov, P., Junger, H.,
Richter, A., 2005. Temperature-dependent shift from labile to recalcitrant carbon sources of
Arctic heterotrophs. Rapid Communications in Mass Spectrometry 19, 1401-1408.
Bockheim, J.G., Tarnocai, C., 1998. Recognition of cryoturbation for classifying permafrost-
affected soils. Geoderma 81, 281-293.
Bourbonniere, R.A., Telford, S.L., Ziolkowski, L.A., Lee, J., Evans, M.S., Meyers, P.A.,
1997. Biogeochemical marker profiles in cores of dated sediments from large North
American lakes. ACS Symposium Series 671, 133-150.
Bradford, M.A., Fierer, N., Reynolds, J.F., 2008. Soil carbon stocks in experimental
mesocosms are dependent on the rate of labile carbon, nitrogen and phosphorus inputs to
soils. Functional Ecology 22, 964-974.
Brown, S.A., 1961. Chemistry of lignification. Science 134, 305-313.
Chi, F.H., Amy, G.L., 2004. Kinetic study on the sorption of dissolved natural organic matter
onto different aquifer materials: The effects of hydrophobicity and functional groups. Journal
of Colloid and Interface Science 274, 380-391.
Christensen, J.H., Hewitson, B., Busuioc, A., 2007. Regional Climate Projections. In:
Solomon, S., Qin, D., Manning, M., Chen, Z., Marquis, M., Averyt, K.B., Tignor, M., Miller,
H.L. (Eds.), Climate Change 2007: The Physical Science Basis. Contributions of Working
Group I to the Fourth Assessment Report of the Intergovernmental Panel on Climate Change.
Cambridge University Press, Cambridge, UK and New York, NY, USA, pp. 847-940.
Christensen, B.T., 2001. Physical fractionation of soil and structural and functional
complexity in organic matter turnover. European Journal of Soil Science 52, 345-353.
Clemente, J.S., Simpson, A.J., Simpson, M.J., 2011. Association of specific organic matter
compounds in size fractions of soils under different environmental controls. Organic
Geochemistry 42, 1169-1180.
Clemente, J.S., Simpson, M.J., 2013. Physical protection of lignin by organic matter and clay
minerals from chemical oxidation. Organic Geochemistry 58, 1-12.
Collister, J.W., Rieley, G., Stern, B., Eglinton, G., Fry, B., 1994. Compound-specific δ 13
C
analyses of leaf lipids from plants with differing carbon dioxide metabolisms. Organic
Geochemistry 21, 619-627.
Conant, R.T., Drijber, R.A., Haddix, M.L., Parton, W.J., Paul, E.A., Plante, A.F., Six, J.,
Steinweg, M.J., 2008. Sensitivity of organic matter decomposition to warming varies with its
quality. Global Change Biology 14, 868-877.
23
Conte, P., Spaccini, R., Piccolo, A., 2004. State of the art of CPMAS 13
C-NMR spectroscopy
applied to natural organic matter. Progress in Nuclear Magnetic Resonance Spectroscopy 44,
215-223.
Craine, J.M., Fierer, N., McLauchlan, K.K., 2010. Widespread coupling between the rate and
temperature sensitivity of organic matter decay. Nature Geoscience 3, 854-857.
Davidson, E.A., Janssens, I.A., 2006. Temperature sensitivity of soil carbon decomposition
and feedbacks to climate change. Nature 440, 165-173.
Davidson, E.A., Trumbore, S.E., Amundson, R., 2000. Soil warming and organic carbon
content. Nature 408, 789-790.
Derenne, S., Largeau, C., 2001. A review of some important families of refractory
macromolecules: Composition, origin, and fate in soils and sediments. Soil Science 166, 833-
847.
Dinel, H., Schnitzer, M., Mehuys, G.R., 1990. Soil Lipids: Origin, Nature, Content,
Decomposition, and Effect on Soil Physical Properties. In: Bollag, J.M., Stotzky, G. (Eds.),
Soil Biochemistry. Marcel Dekker, New York, USA, pp. 397-427.
Ertel, J.R., Hedges, J.I., 1985. Sources of sedimentary humic substances: Vascular plant
debris. Geochimica et Cosmochimica Acta 49, 2097-2107.
Eusterhues, K., Rumpel, C., Kleber, M., Kögel-Knabner, I., 2003. Stabilisation of soil
organic matter by interactions with minerals as revealed by mineral dissolution and oxidative
degradation. Organic Geochemistry 34, 1591-1600.
Eusterhues, K., Rumpel, C., Kögel-Knabner, I., 2007. Composition and radiocarbon age of
HF-resistant soil organic matter in a Podzol and a Cambisol. Organic Geochemistry 38,
1356-1372.
Feng, X., Simpson, A.J., Simpson, M.J., 2005. Chemical and mineralogical controls on
humic acid sorption to clay mineral surfaces. Organic Geochemistry 36, 1553-1566.
Feng, X., Simpson, A.J., Wilson, K.P., Dudley Williams, D., Simpson, M.J., 2008. Increased
cuticular carbon sequestration and lignin oxidation in response to soil warming. Nature
Geoscience 1, 836-839.
Feng, X., Simpson, M.J., 2011. Molecular-level methods for monitoring soil organic matter
responses to global climate change. Journal of Environmental Monitoring 13, 1246-1254.
Feng, X., Xu, Y., Jaffé, R., Schlesinger, W.H., Simpson, M.J., 2010. Turnover rates of
hydrolysable aliphatic lipids in Duke Forest soils determined by compound specific 13
C
isotopic analysis. Organic Geochemistry 41, 573-579.
Frey, S.D., Drijber, R., Smith, H., Melillo, J., 2008. Microbial biomass, functional capacity,
and community structure after 12 years of soil warming. Soil Biology and Biochemistry 40,
2904-2907.

24
Frey, S.D., Lee, J., Melillo, J.M., Six, J., 2013. The temperature response of soil microbial
efficiency and its feedback to climate. Nature Climate Change 3, 395-398.
Frey, S.D., Ollinger, S., Nadelhoffer, K., Bowden, R., Brzostek, E., Burton, A., Caldwell,
B.A., Crow, S., Goodale, C.L., Grandy, A.S., Finzi, A., Kramer, M.G., Lajtha, K., LeMoine,
J., Martin, M., McDowell, W.H., Minocha, R., Sadowsky, J.J., Templer, P.H., Wickings, K.,
2014. Chronic nitrogen additions suppress decomposition and sequester soil carbon in
temperate forests. Biogeochemistry 121, 305-316.
Ghosh, S., Wang, Z.Y., Kang, S., Bhowmik, P.C., Xing, B.S., 2009. Sorption and
fractionation of a peat derived humic acid by kaolinite, montmorillonite, and goethite.
Pedosphere 19, 21-30.
Gregorich, E.G., Ellert, B.H., Drury, C.F., Liang, B.C., 1996. Fertilization effects on soil
organic matter turnover and corn residue C storage. Soil Science Society of America Journal
60, 472-476.
Hayes, D., McGuire, A.D., Kicklighter, D.W., Gurney, K.R., Burnside, T., Melillo, J.M.,
2011. Is the northern high-latitude land-based CO2 sink weakening? Global Biogeochemical
Cycles 25, GB3018.
Hedges, J.I., Blanchette, R.A., Weliky, K., Devol, A.H., 1988. Effects of fungal degradation
on the CuO oxidation products of lignin: A controlled laboratory study. Geochimica et
Cosmochimica Acta 52, 2717-2726.
Hedges, J.I., Eglinton, G., Hatcher, P.G., Kirchman, D.L., Arnosti, C., Derenne, S., Evershed,
R.P., Kögel-Knabner, I., De Leeuw, J.W., Littke, R., Michaelis, W., Rullkötter, J., 2000. The
molecularly-uncharacterized component of nonliving organic matter in natural environments.
Organic Geochemistry 31, 945-958.
Hedges, J.I., Ertel, J.R., 1982. Characterization of lignin by gas capillary chromatography of
cupric oxide oxidation products. Analytical Chemistry 54, 174-178.
Hedges, J.I., Mann, D.C., 1979. The characterization of plant tissues by their lignin oxidation
products. Geochimica et Cosmochimica Acta 43, 1803-1807.
Heim, A., Schmidt, M.W.I., 2007. Lignin is preserved in the fine silt fraction of an arable
Luvisol. Organic Geochemistry 38, 2001-2011.
Hernes, P.J., Kaiser, K., Dyda, R.Y., Cerli, C., 2013. Molecular trickery in soil organic
matter: Hidden lignin. Environmental Science and Technology 47, 9077-9085.
Higuchi, T., 2006. Look back over the studies of lignin biochemistry. Journal of Wood
Science 52, 2-8.
Hobbie, S.E., Nadelhoffer, K.J., Högberg, P., 2002. A synthesis: The role of nutrients as
constraints on carbon balances in Boreal and Arctic regions. Plant and Soil 242, 163-170.
Hobbie, S.E., Schimel, J.P., Trumbore, S.E., Randerson, J.R., 2000. Controls over carbon
storage and turnover in high-latitude soils. Global Change Biology 6, 196-210.

25
Holloway, P.J., 1982. The Chemical Composition of Plant Cutins. In: Cutler, D.F., Alvin,
K.L., Price, C.E. (Eds.), The Plant Cuticle. Linnean Society Symposium Series 10. Academic
Press, London, UK, pp. 45-85.
Horning, M.G., Casparrini, G., Horning, E.C., 1969. The use of gas phase analytical methods
for the analysis of phospholipids. Journal of Chromatographic Science 7, 267-275.
Hyvönen, R., Persson, T., Andersson, S., Olsson, B., Ågren, G.I., Linder, S., 2008. Impact of
long-term nitrogen addition on carbon stocks in trees and soils in Northern Europe.
Biogeochemistry 89, 121-137.
IPCC, 2013. Summary for Policymakers. In: Stocker, T.F., Qin, D., Plattner, G.K., Tignor,
M., Allen, S.K., Boschung, J., Nauels, A., Xia, Y., Bex, V., Midgley, P.M. (Eds.), Climate
Change 2013: The Physical Science Basis. Contribution of Working Group I to the Fifth
Assessment Report of the Intergovernmental Panel on Climate Change. Cambridge
University Press, Cambridge, UK and New York, NY, USA.
Kaiser, K., Guggenberger, G., 2003. Mineral surfaces and soil organic matter. European
Journal of Soil Science 54, 219-236.
Kirk, T.K., Farrell, R.L., 1987. Enzymatic "combustion": The microbial degradation of
lignin. Annual Review of Microbiology 41, 465-505.
Klotzbücher, T., Kaiser, K., Guggenberger, G., Gatzek, C., Kalbitz, K., 2011. A new
conceptual model for the fate of lignin in decomposing plant litter. Ecology 92, 1052-1062.
Kögel-Knabner, I., Ziegler, F., Riederer, M., Zech, W., 1989. Distribution and decomposition
pattern of cutin and suberin in forest soils. Zeitschrift für Pflanzenernährung und
Bodenkunde 152, 409-413.
Kögel-Knabner, I., 2002. The macromolecular organic composition of plant and microbial
residues as inputs to soil organic matter. Soil Biology and Biochemistry 34, 139-162.
Kögel-Knabner, I., 2000. Analytical approaches for characterizing soil organic matter.
Organic Geochemistry 31, 609-625.
Kögel-Knabner, I., Amelung, W., 2014. Dynamics, Chemistry, and Preservation of Organic
Matter in Soils. In: Turekian, H.D.H.K. (Ed.), Treatise on Geochemistry (Second Edition).
Elsevier, Oxford, UK, pp. 157-215.
Kögel-Knabner, I., Guggenberger, G., Kleber, M., Kandeler, E., Kalbitz, K., Scheu, S.,
Eusterhues, K., Leinweber, P., 2008. Organo-mineral associations in temperate soils:
Integrating biology, mineralogy, and organic matter chemistry. Journal of Plant Nutrition and
Soil Science 171, 61-82.
Kolattukudy, P.E., 1981. Structure, biosynthesis and biodegradation of cutin and suberin.
Annual Review of Plant Physiology 32, 539-567.
26
Kolattukudy, P.E., Espelie, K.E., 1989. Chemistry, Biochemistry, and Function of Suberin
and Associated Waxes. In: Rowe, J.W. (Ed.), Natural Products of Woody Plants I. Springer,
Berlin, Germany, pp. 304-367.
Lavoie, M., Mack, M.C., Schuur, E.A.G., 2011. Effects of elevated nitrogen and temperature
on carbon and nitrogen dynamics in Alaskan Arctic and Boreal soils. Journal of Geophysical
Research: Biogeosciences 116, G03013.
Lehmann, J., Kleber, M., 2015. The contentious nature of soil organic matter. Nature 528,
60-68.
Leifeld, J., Fuhrer, J., 2005. The temperature response of CO2 production from bulk soils and
soil fractions is related to soil organic matter quality. Biogeochemistry 75, 433-453.
Lin, L.H., Simpson, M.J., 2016. Enhanced extractability of cutin- and suberin-derived
organic matter with demineralization implies physical protection over chemical recalcitrance
in soil. Organic Geochemistry 97, 111-121.
Lorenz, K., Lal, R., Preston, C.M., Nierop, K.G.J., 2007. Strengthening the soil organic
carbon pool by increasing contributions from recalcitrant aliphatic bio(macro)molecules.
Geoderma 142, 1-10.
Mack, M.C., Schuur, E.A.G., Bret-Harte, M.S., Shaver, G.R., Chapin, F.S., 2004. Ecosystem
carbon storage in Arctic tundra reduced by long-term nutrient fertilization. Nature 431, 440-
443.
McLauchlan, K., 2006. The nature and longevity of agricultural impacts on soil carbon and
nutrients: A review. Ecosystems 9, 1364-1382.
Mikutta, R., Kleber, M., Torn, M.S., Jahn, R., 2006. Stabilization of soil organic matter:
Association with minerals or chemical recalcitrance? Biogeochemistry 77, 25-56.
Mikutta, R., Mikutta, C., Kalbitz, K., Scheel, T., Kaiser, K., Jahn, R., 2007. Biodegradation
of forest floor organic matter bound to minerals via different binding mechanisms.
Geochimica et Cosmochimica Acta 71, 2569-2590.
Miller, P.E., Denton, M.B., 1986. The quadrupole mass filter: Basic operating concepts.
Journal of Chemical Education 63, 617-622.
Neff, J.C., Townsend, A.R., Gleixner, G., Lehman, S.J., Turnbull, J., Bowman, W.D., 2002.
Variable effects of nitrogen additions on the stability and turnover of soil carbon. Nature 419,
915-917.
Opsahl, S., Benner, R., 1995. Early diagenesis of vascular plant tissues: Lignin and cutin
decomposition and biogeochemical implications. Geochimica et Cosmochimica Acta 59,
4889-4904.
Osterkamp, T.E., Romanovsky, V.E., 1999. Evidence for warming and thawing of
discontinuous permafrost in Alaska. Permafrost and Periglacial Processes 10, 17-37.
27
Otto, A., Shunthirasingham, C., Simpson, M.J., 2005. A comparison of plant and microbial
biomarkers in grassland soils from the Prairie Ecozone of Canada. Organic Geochemistry 36,
425-448.
Otto, A., Simpson, M.J., 2007. Analysis of soil organic matter biomarkers by sequential
chemical degradation and gas chromatography - mass spectrometry. Journal of Separation
Science 30, 272-282.
Otto, A., Simpson, M.J., 2006a. Evaluation of CuO oxidation parameters for determining the
source and stage of lignin degradation in soil. Biogeochemistry 80, 121-142.
Otto, A., Simpson, M.J., 2006b. Sources and composition of hydrolysable aliphatic lipids and
phenols in soils from Western Canada. Organic Geochemistry 37, 385-407.
Paul, E.A., Clark, F.E., 1996. Soil Microbiology and Biochemistry. Academic Press, San
Diego, CA, USA, 340 pp.
Pautler, B.G., Austin, J., Otto, A., Stewart, K., Lamoureux, S.F., Simpson, M.J., 2010.
Biomarker assessment of organic matter sources and degradation in Canadian High Arctic
littoral sediments. Biogeochemistry 100, 75-87.
Ping, C.L., Michaelson, G.J., Jorgenson, M.T., Kimble, J.M., Epstein, H., Romanovsky,
V.E., Walker, D.A., 2008. High stocks of soil organic carbon in the North American Arctic
region. Nature Geoscience 1, 615-619.
Pisani, O., Frey, S.D., Simpson, A.J., Simpson, M.J., 2015. Soil warming and nitrogen
deposition alter soil organic matter composition at the molecular-level. Biogeochemistry 123,
391.
Qian, H., Joseph, R., Zeng, N., 2010. Enhanced terrestrial carbon uptake in the northern high
latitudes in the 21st century from the coupled carbon cycle climate model intercomparison
project model projections. Global Change Biology 16, 641-656.
Rumpel, C., Rabia, N., Derenne, S., Quenea, K., Eusterhues, K., Kögel-Knabner, I., Mariotti,
A., 2006. Alteration of soil organic matter following treatment with hydrofluoric acid (HF).
Organic Geochemistry 37, 1437-1451.
Schaefer, K., Lantuit, H., Romanovsky, V.E., Schuur, E.A.G., Witt, R., 2014. The impact of
the permafrost carbon feedback on global climate. Environmental Research Letters 9,
085003.
Schaefer, K., Zhang, T., Bruhwiler, L., Barrett, A.P., 2011. Amount and timing of permafrost
carbon release in response to climate warming. Tellus, Series B: Chemical and Physical
Meteorology 63, 165-180.
Schimel, J.P., Weintraub, M.N., 2003. The implications of exoenzyme activity on microbial
carbon and nitrogen limitation in soil: A theoretical model. Soil Biology and Biochemistry
35, 549-563.

28
Schlesinger, W.H., 1991. An Analysis of Global Change. Academic Press, San Diego, CA,
USA.
Schlesinger, W.H., Andrews, J.A., 2000. Soil respiration and the global carbon cycle.
Biogeochemistry 48, 7-20.
Schmidt, M.W.I., Knicker, H., Hatcher, P.G., Kögel-Knabner, I., 1997. Improvement
of 13
C and 15
N CPMAS NMR spectra of bulk soils, particle size fractions
and organic material by treatment with 10% hydrofluoric acid. European Journal of Soil
Science 48, 319-328.
Schuur, E.A.G., Abbott, B.W., Bowden, W.B., Brovkin, V., Camill, P., Canadell, J.G.,
Chanton, J.P., Chapin, F.S., Christensen, T.R., Ciais, P., Crosby, B.T., Czimczik, C.I.,
Grosse, G., Harden, J., Hayes, D.J., Hugelius, G., Jastrow, J.D., Jones, J.B., Kleinen, T.,
Koven, C.D., Krinner, G., Kuhry, P., Lawrence, D.M., McGuire, A.D., Natali, S.M.,
O'Donnell, J.A., Ping, C.L., Riley, W.J., Rinke, A., Romanovsky, V.E., Sannel, A.B.K.,
Schädel, C., Schaefer, K., Sky, J., Subin, Z.M., Tarnocai, C., Turetsky, M.R., Waldrop, M.P.,
Walter Anthony, K.M., Wickland, K.P., Wilson, C.J., Zimov, S.A., 2013. Expert assessment
of vulnerability of permafrost carbon to climate change. Climatic Change 119, 359-374.
Schuur, E.A.G., Bockheim, J., Canadell, J.G., Euskirchen, E., Field, C.B., Goryachkin, S.V.,
Hagemann, S., Kuhry, P., Lafleur, P.M., Lee, H., Mazhitova, G., Nelson, F.E., Rinke, A.,
Romanovsky, V.E., Shiklomanov, N., Tarnocai, C., Venevsky, S., Vogel, J.G., Zimov, S.A.,
2008. Vulnerability of permafrost carbon to climate change: Implications for the global
carbon cycle. Bioscience 58, 701-714.
Serreze, M.C., Walsh, J.E., Chapin, F.S., Osterkamp, T., Dyurgerov, M., Romanovsky, V.,
Oechel, W.C., Morison, J., Zhang, T., Barry, R.G., 2000. Observational evidence of recent
change in the northern high-latitude environment. Climatic Change 46, 159-207.
Shaver, G.R., 1992. Global change and the carbon balance of the ecosystem. Bioscience 42,
433-442.
Shaver, G.R., Chapin, F.S., 1980. Response to fertilization by various plant growth forms in
an Alaskan tundra: Nutrient accumulation and growth. Ecology 61, 662-675.
Shaver, G.R., Giblin, A.E., Nadelhoffer, K.J., Thieler, K.K., Downs, M.R., Laundre, J.A.,
Rastetter, E.B., 2006. Carbon turnover in Alaskan tundra soils: Effects of organic matter
quality, temperature, moisture and fertilizer. Journal of Ecology 94, 740-753.
Shaver, G.R., Laundre, J.A., Syndonia Bret-Harte, M., Chapin, F.S., Mercado-Díaz, J.A.,
Giblin, A.E., Gough, L., Gould, W.A., Hobbie, S.E., Kling, G.W., Mack, M.C., Moore, J.C.,
Nadelhoffer, K.J., Rastetter, E.B., Schimel, J.P., 2014. Terrestrial Ecosystems at Toolik
Lake, Alaska. In: Hobbie, J.E., Kling, G.W. (Eds.), Alaska's Changing Arctic: Ecological
Consequences for Tundra, Streams, and Lakes. Oxford University Press, New York, USA,
pp. 90-142.
Shaver, G.R., Syndonia Bret-Harte, M., Jones, M.H., Johnstone, J., Gough, L., Laundre, J.,
Chapin, F.S., 2001. Species composition interacts with fertilizer to control long-term change
in tundra productivity. Ecology 82, 3163-3181.

29
Simoneit, B.R.T., 2005. A review of current applications of mass spectrometry for
biomarker/molecular tracer elucidations. Mass Spectrometry Reviews 24, 719-765.
Simpson, A.J., McNally, D.J., Simpson, M.J., 2011. NMR spectroscopy in environmental
research: From molecular interactions to global processes. Progress in Nuclear Magnetic
Resonance Spectroscopy 58, 97-175.
Simpson, A.J., Simpson, M.J., Kingery, W.L., Lefebvre, B.A., Moser, A., Williams, A.J.,
Kvasha, M., Kelleher, B.P., 2006. The application of 1H high-resolution magic-angle
spinning NMR for the study of clay-organic associations in natural and synthetic complexes.
Langmuir 22, 4498-4503.
Simpson, M.J., Otto, A., Feng, X., 2008. Comparison of solid-state carbon-13 nuclear
magnetic resonance and organic matter biomarkers for assessing soil organic matter
degradation. Soil Science Society of America Journal 72, 268-276.
Simpson, M.J., Simpson, A.J., 2012. The chemical ecology of soil organic matter molecular
constituents. Journal of Chemical Ecology 38, 768-784.
Six, J., Conant, R.T., Paul, E.A., Paustian, K., 2002. Stabilization mechanisms of soil organic
matter: Implications for C-saturation of soils. Plant and Soil 241, 155-176.
Sjögersten, S., Turner, B.L., Mahieu, N., Condron, L.M., Wookey, P.A., 2003. Soil organic
matter biochemistry and potential susceptibility to climatic change across the forest-tundra
ecotone in the Fennoscandian Mountains. Global Change Biology 9, 759-772.
Skoog, D.A., Holler, F.J., Crouch, S.R., 2007. Principles of Instrumental Analysis. Thomson
Brooks/Cole, Belmont, CA, USA.
Sulzman, E.W., Brant, J.B., Bowden, R.D., Lajtha, K., 2005. Contribution of aboveground
litter, belowground litter, and rhizosphere respiration to total soil CO2 efflux in an old growth
coniferous forest. Biogeochemistry 73, 231-256.
Tarnocai, C., 1997. The Amount of Organic Carbon in various Soil Orders and Ecological
Provinces in Canada. In: Lal, R., Kimble, J.M., Follett, R.L.F., Stewart, B.A. (Eds.),
Advances in Soil Science: Soil Processes and the Carbon Cycle. CRC Press, New York,
USA, pp. 81-92.
Tarnocai, C., Canadell, J.G., Schuur, E.A.G., Kuhry, P., Mazhitova, G., Zimov, S., 2009. Soil
organic carbon pools in the northern circumpolar permafrost region. Global Biogeochemical
Cycles 23, GB2023.
Thevenot, M., Dignac, M.F., Rumpel, C., 2010. Fate of lignins in soils: A review. Soil
Biology and Biochemistry 42, 1200-1211.
Trumbore, S.E., Czimczik, C.I., 2008. Geology: An uncertain future for soil carbon. Science
321, 1455-1456.
Van Wijk, M.T., Clemmensen, K.E., Shaver, G.R., Williams, M., Callaghan, T.V., Chapin,
F.S., Cornelissen, J.H.C., Gough, L., Hobbie, S.E., Jonasson, S., Lee, J.A., Michelsen, A.,

30
Press, M.C., Richardson, S.J., Rueth, H., 2004. Long-term ecosystem level experiments at
Toolik Lake, Alaska, and at Abisko, Northern Sweden: Generalizations and differences in
ecosystem and plant type responses to global change. Global Change Biology 10, 105-123.
Vitousek, P., 1982. Nutrient cycling and nutrient use efficiency. American Naturalist 119,
553-572.
Vitousek, P.M., Hättenschwiler, S., Olander, L., Allison, S., 2002. Nitrogen and nature.
Ambio 31, 97-101.
von Lützow, M., Kögel-Knabner, I., 2009. Temperature sensitivity of soil organic matter
decomposition-what do we know? Biology and Fertility of Soils 46, 1-15.
von Lützow, M., Kögel-Knabner, I., Ekschmitt, K., Flessa, H., Guggenberger, G., Matzner,
E., Marschner, B., 2007. SOM fractionation methods: Relevance to functional pools and to
stabilization mechanisms. Soil Biology and Biochemistry 39, 2183-2207.
Waldrop, M.P., Zak, D.R., Sinsabaugh, R.L., Gallo, M., Lauber, C., 2004. Nitrogen
deposition modifies soil carbon storage through changes in microbial enzymatic activity.
Ecological Applications 14, 1172-1177.
Zegouagh, Y., Derenne, S., Dignac, M.F., Baruiso, E., Mariotti, A., Largeau, C., 2004.
Demineralisation of a crop soil by mild hydrofluoric acid treatment: Influence on organic
matter composition and pyrolysis. Journal of Analytical and Applied Pyrolysis 71, 119-135.
31
Chapter 2: Molecular-level characterization of Arctic soils
after 32 years of in situ warming and nitrogen + phosphorus
fertilization
2.1 Abstract
Recent studies have revealed that rising global temperatures will cause permafrost to
thaw. This is expected to accelerate the decomposition of soil organic matter (SOM) that was
once frozen within the permafrost and will cause elevated amounts of carbon dioxide (CO2)
to be released into the atmosphere. Nutrients such as nitrogen (N) and phosphorus (P) may
also be released from the thawing of permafrost soils. However, it is unclear how elevated
global temperatures and the subsequent release of N and P from thawed permafrost will alter
SOM biogeochemistry in Arctic ecosystems. In this study, we employed biomarker and
nuclear magnetic resonance (NMR) techniques to investigate the degradation of SOM in the
upper and lower horizons of soils from a Long-Term Ecological Research site located in
Toolik Lake, Alaska, USA, after 32 years of warming, nitrogen + phosphorus (N+P)
fertilization and warming + N+P fertilization. Biomarker analyses revealed variable
responses among the replicate blocks of each treatment, which suggests there was
considerable landscape heterogeneity. Warming, N+P fertilization and their combined
treatment facilitated the accumulation of cyclic lipids in the upper horizon soils. Cutin-
derived biomarkers in the upper horizon slightly increased with each treatment but NMR
analysis did not reveal any enrichment in alkyl C compounds. The degradation of cutin was
not enhanced in these Arctic soils, likely due to its chemical recalcitrance. The abundances of
suberin-derived components decreased in the lower horizon in response to elevated
temperatures and N+P fertilization, but these were not statistically significant changes.
32
Particularly in the lower horizons of all the treatments, low abundances of simple sugars
(glucose, galactose and mannose) coupled with high intensities of the O-alkyl C signals from
the solid-state 13
C NMR spectra suggest ample amounts of cellulose inputs. Lignin oxidation
was not promoted by any of the treatments except in the upper horizon of block 4, where
lignin was most oxidized in the N+P fertilization treatment and least oxidized in the warming
+N+P fertilization treatment. Overall, our results demonstrate that after 32 years of warming
and increased nutrient availability at Toolik Lake, Alaska, SOM composition was altered in
some plots but not all. This study shows the importance of landscape properties which
control plant-soil interactions and their subsequent responses to climate change.
2.2 Introduction
The Arctic has long been regarded as a net sink of atmospheric carbon dioxide (CO2),
storing approximately 1672 gigatons of carbon (C; Tarnocai et al., 2009; Schaefer et al.,
2011). However, recent studies have revealed that the Arctic is transitioning from a net sink
to a net source of atmospheric C (Qian et al., 2010; Hayes et al., 2011). Projected rising
temperatures are expected to accelerate permafrost thawing and active layer deepening
(Schaefer et al., 2011). Higher temperatures may further stimulate microbial activity
(Schaefer et al., 2011) causing labile C that was once frozen within permafrost to become
more susceptible to decomposition (Osterkamp and Romanovsky, 1999; Serreze et al., 2000;
Davidson and Janssens, 2006). As a result, elevated fluxes of CO2 from Arctic soils will be
released into the atmosphere (Mack et al., 2004; Koven et al., 2011; MacDougall et al.,
2012). Elevated CO2 emissions will absorb more infrared radiation (Hobbie, 1996) and
amplify atmospheric warming and permafrost degradation, which will ultimately result in a
positive climate feedback (Schlesinger and Andrews, 2000; Davidson and Janssens, 2006). In
addition, permafrost soils of northern ecosystems contain large amounts of organic nitrogen

33
(N) and phosphorus (P) that are currently unavailable to plants (Shaver et al., 2006). The
thawing of permafrost and stimulation of microbial activity with warming may promote net
mineralization of N and P in soils (Chapin, 1983; Nadelhoffer et al., 1992; Aerts, 2006;
Deslippe et al., 2011). These augmented rates of conversion from organic to inorganic forms
of N and P, which are more readily usable by plants, could enhance plant productivity
(Shaver et al., 2006). This may alter N and P cycling in Arctic ecosystems and induce shifts
in plant community composition such that the growth of woody shrubs will be enhanced
(Hobbie et al., 2002). However, it is still unclear how global environmental changes such as
rising temperatures and enhanced nutrient availability may alter soil organic matter (SOM)
composition in Arctic ecosystems.
Toolik Lake, Alaska is located in the northern foothills of the Brooks Range and has
been studied intensively as part of the Long-Term Ecological Research Network (Hobbie,
1995; Shaver, 1996; Van Wijk et al., 2004). Various long-term ecosystem-scale experiments
have been conducted at Toolik Lake, mostly to examine the responses in aboveground plant
biomass to experimental manipulations such as warming, shading and nitrogen + phosphorus
(N+P) fertilization (Shaver and Jonasson, 1999; Van Wijk et al., 2004; Shaver et al., 2006;
Deslippe et al., 2011). Aboveground plant biomass has been observed to be more responsive
to N+P fertilization than to soil warming, suggesting that the Arctic ecosystem at Toolik
Lake is limited by N+P availability (Shaver et al., 2014). For example, 15 years of N+P
addition stimulated an accumulation of aboveground biomass of Arctic vegetation. Soil
warming for the same duration also promoted increases in aboveground biomass, but to a
lesser extent than N+P fertilization (Shaver and Jonasson, 1999). Hobbie et al. (1996)
conducted a field warming study at Toolik Lake and found that a soil temperature elevation
of 5°C enhanced soil C loss. Results from a 20-year N+P fertilization experiment also

34
conducted at Toolik Lake showed a net ecosystem loss of C, despite enhanced plant
productivity (Mack et al., 2004). These findings suggest that elevated temperatures and
fertilization may enhance SOM decomposition.
The primary objective of this study was to investigate the extent of SOM degradation
in soils from Toolik Lake after long-term warming and nutrient addition. Based on earlier
studies (Hobbie, 1996; Mack et al., 2004), elevated temperatures and N+P fertilization were
hypothesized to enhance SOM decomposition. However, due to the N and P-limited
conditions at Toolik Lake (Shaver et al., 2014), N+P fertilization was hypothesized to
expedite SOM decomposition to a greater extent than soil warming alone. Since elevated
temperatures and increased nutrient availability both enhance SOM decomposition processes
according to previous observations (Hobbie, 1996; Mack et al., 2004), it was hypothesized
that SOM from the warming and N+P fertilization treatment would be the most degraded. To
test this hypothesis, soil samples were collected from the Toolik Lake Long-Term Ecological
Research site in Alaska, USA after 32 years of warming, N+P fertilization and warming
+N+P fertilization. We employed three biomarker extraction techniques (solvent extraction,
base hydrolysis and CuO oxidation) followed by gas chromatography-mass spectrometry
(GC-MS) analysis to isolate and quantify SOM biomarkers, which provide insight into the
sources and stage of SOM decomposition (Otto and Simpson, 2005; 2006a; 2006b). These
extraction techniques yield free compounds, cutin- and suberin-derived compounds and
lignin-derived phenols, respectively (Otto and Simpson, 2007). GC-MS was used to identify
and quantify biomarkers, while solid-state 13
C nuclear magnetic resonance (NMR)
spectroscopy was used to examine changes in overall SOM composition (Simpson and
Simpson, 2012) in response to soil warming and N+P fertilization. The complementary
35
information obtained from biomarker and NMR methods can offer insight into SOM
responses to global climate change (Feng and Simpson, 2011).
2.3 Materials and methods
2.3.1 Site description
Samples were collected from the Long-Term Ecological Research site near Toolik
Lake, Alaska, USA (68°38’N, 149°34’W, elevation 780 m), in the northern foothills of the
Brooks Range. This moist acidic tundra site is situated on a gentle north-facing slope
(Clemmensen et al., 2006). The dominant vegetative species are the moist acidic tussock-
forming sedge Eriophorum vaginatum and the deciduous dwarf shrub Betula nana, which
make up approximately 20% of the aboveground vascular plant biomass (Clemmensen et al.,
2006). These tundra soils are classified as histic pergelic cryaquepts (Mack et al., 2004),
which are characterized by a thick upper horizon 10-20 cm in depth, with a pH of 3.7 (Shaver
et al., 2014). The lower horizon, around 20 cm in depth, has a silty texture (Mack et al.,
2004) with a pH of 4.6 and is underlain by continuous permafrost 200 m in depth (Shaver et
al., 2014). The mean air temperature during the June-August growing season is 9.3°C (Mack
et al., 2004) and the mean annual precipitation is approximately 350 mm (Clemmensen et al.,
2006). Soil surface temperatures range from 10 to 20°C in the summer, but the bottom of the
thawed active layer is consistently at 0°C.
2.3.2 Experimental design and sample collection
Established in 1982, the experiment is composed of four replicate blocks that have
been randomly assigned one of four treatments: control, warming, N+P fertilization and
warming + N+P fertilization. Each block contained four 5 m x 20 m plots and five 20 cm x
20 cm quadrats were harvested from each plot. Fertilizer treatments, which consist of 10 g

36
m-2
additions of N as NH4NO3 and 5 g m-2
additions of P as P2O5, were applied as pellets
after snowmelt annually. Warming was accomplished in greenhouses by elevating the
average air temperature by 2°C and average soil temperature was increased by 1°C (up to 40
cm in depth).
Soil samples were collected in September 2014. Fresh litter was removed and organic
monoliths (8 x 8 cm) were collected and separated into upper horizon (0-5 cm), upper-lower
transition horizon (5 cm to top of the lower horizon) and lower horizon soils (sampled to the
permafrost). The transition horizon soils were not analyzed in this study because not all the
treatment plots within each block consisted of a transition layer between the upper and lower
horizons (Table 2-1). Also, the lower horizon soil of the warming +N+P fertilization
treatment of block 3 was not analyzed because this sample was unavailable. All samples
were frozen immediately after sampling to prevent any degradation and were transported to
the laboratory to be freeze-dried. Prior to analysis, the soil samples were passed through a 2
mm sieve and were then ground using a mortar and pestle.
2.3.3 Carbon (C) and nitrogen (N) analysis
C and N analysis of the samples was performed at the Natural Resource Ecology
Laboratory at Colorado State University in Fort Collins, Colorado, USA. Soil samples were
dried at 60°C and then ground to a fine powder using a mortar and pestle under liquid N2.
Total C and total N were measured using the Carlo Erba NA 1500 elemental analyzer.
2.3.4 Biomarker extractions and gas chromatography-mass spectrometry (GC-
MS) analysis
Sequential biomarker extractions (solvent extraction, base hydrolysis and CuO
oxidation) were performed in duplicate on the soil samples to isolate free lipids, cutin- and
37
suberin-derived ester-bound lipids and lignin-derived phenols respectively (Hedges and Ertel,
1982; Otto and Simpson, 2005; 2006a; 2006b). 0.5 g of upper horizon soils and 1.0 g of
lower horizon soils were weighed out and sonicated in DCM, DCM: MeOH (1:1 v/v) and
MeOH sequentially using 180 ml of each solvent. Solutions were filtered through glass fibre
filters (Whatman GF/A and GF/F), concentrated by rotary evaporation and dried under N2.
Air-dried residues (0.1 – 0.4 g) were heated at 100°C for 3 h in Teflon-lined bombs with 20
ml of 1M methanolic KOH. After acidification to pH 1 with 6M HCl, hydrolysable lipids
were recovered by liquid-liquid extraction with diethyl ether. The extracts were dried with
anhydrous Na2SO4 to remove remaining water, concentrated by rotary evaporation and dried
under N2. Air-dried residues from base hydrolysis were added to 1 g of copper (II) oxide
(CuO), 100 mg of ammonium (II) iron sulfate hexahydrate [Fe(NH4)2(SO4)•6H2O] and 15 ml
of 2 M NaOH and heated at 170°C for 2.5 h. Acidification to pH 1 was accomplished with 6
M HCl and extracts were then stored for 1 h at room temperature in the dark to prevent
reactions of cinnamic acids. After centrifugation, solid phase extraction (Oasis HLB
Cartridges 60 mg, 3 ml capacity; Waters, Milford, MA) was used was used to isolate lignin-
derived phenols from extracts (Kaiser and Benner, 2012). The cartridges were pre-
conditioned twice with 2 ml of methanol and 2ml of deionized water under gravity flow
before extracts were loaded through the cartridges at a flow rate of 1 ml/min under vacuum
(Supelco Preppy™
12-port vacuum manifold, St. Louis, MO). Cartridges were rinsed three
times with 0.5 ml of water/ MeOH 70/30 v/v%. The cartridges were then dried under vacuum
for 10 min before elution with three rinses of 0.5 ml of dichloromethane/methyl
acetate/pyridine 70/25/5 v/v/v% followed by two rinses of 0.5 ml of methanol. The eluates
were then combined, put through Pasteur pipet columns packed with anhydrous Na2SO4 to
remove any remaining water and then dried under N2. The solvent and CuO extracts were
converted to trimethylsilyl (TMS) derivatives by reaction with 100 μl of N,O-
38
Bis(trimethylsilyl) trifluoroacetamide (BSTFA) and 10 μl of pyridine at 70°C for 1.5 h. The
extracts from base hydrolysis were first derivatized with N,N-dimethylformamide dimethyl
acetal and then with BSTFA and pyridine. After cooling, hexane was added to dilute the
extracts prior to GC-MS analysis. Samples were analyzed using an Agilent model 6890 N
gas chromatograph (GC) coupled to an Agilent model 5973 quadrupole mass selective
detector with an Agilent model 7683 autosampler. The GC was fitted with a HP5-MS fused
silica capillary column (30 m x 0.25 mm i.d., 0.25 µm film thickness). The GC oven
temperature was held at 65°C for 2 min, increased to 300°C at a rate of 6°C per min and held
at 300°C for 20 min. The injector temperature was set at 280°C. Helium was used as the
carrier gas. The mass spectrometer was operated in electron impact ionization mode with
ionization energy of 70 eV and scanned from 50 to 650 Da. Identification of individual
compounds was achieved by comparison of mass spectra to those of authentic standards
along with NIST and Wiley 275 MS library data. Quantification was performed with the
following external standards: tetracosane, behenyl alcohol (TMS ester), methyl tricosanoate
and ergosterol (TMS ester) for the solvent-extractable lipids; methyl tricosanoate for the
hydrolysable lipids; syringic acid and syringaldehyde (TMS esters) for the lignin-derived
phenols.
2.3.5 Solid-state 13
C cross polarization magic angle spinning (CPMAS) NMR
Preliminary NMR experiments were conducted on the control soils of each block. For
analysis by solid-state 13
C cross polarization magic angle spinning (CPMAS) NMR, 100 mg
of each soil were packed into 4 mm zirconium rotors with Kel-F caps. The spectra were
acquired on a 500 MHz Bruker BioSpin Avance III spectrometer (Bruker BioSpin,
Rheinstetten, Germany) equipped with a 4 mm H-X MAS probe, using a ramp-CP pulse
program (Conte et al., 2004; Pisani et al., 2015) with a spinning rate of 11 KHz and a ramp-

39
CP contact time of 1 ms. Preliminary data were first collected using a recycle delay of 1 s,
but the spectra exhibited low signal-to-noise ratios so a recycle delay of 3 s was used. Since
the signal-to-noise ratios of the spectra from the preliminary experiment did not substantially
improve even with a longer recycle delay, soils were treated with 10% hydrofluoric (HF)
acid as discussed below before NMR analyses. Since the preliminary experiments showed
that the spectra of the control treatments of each block were dissimilar, NMR analyses were
performed only on the soil samples from block 1. Whole soil samples from each treatment in
block 1 (20 g of upper horizon soils and 40 g of lower horizon soils) were repeatedly treated
with HF to concentrate the organic matter and to remove paramagnetic minerals before NMR
analysis (Rumpel et al., 2006; Simpson et al., 2012; Pisani et al., 2015). After HF treatment,
samples were rinsed with deionized water to remove excess salts and then freeze-dried. NMR
spectra were acquired for these treated soils with a 1 s recycle delay. All spectra were
processed using a zero filling factor of 2 and line broadening of 50 Hz. The following
spectral regions were integrated: alkyl (0-50 ppm), O-alkyl (50-110 ppm), aromatic and
phenolic (110-165 ppm), and carboxyl and carbonyl C (165-215 ppm). Chemical shift
assignments were normalized to 100% for relative comparisons of each type of C. Alkyl/O-
alkyl ratios were determined by dividing the areas of the alkyl and O-alkyl regions of the
spectra (Baldock et al., 1992; Simpson et al., 2008).
2.3.6 Statistical analyses
A one way analysis of variance (ANOVA) using the Tukey Honestly Significant
Difference (HSD) test was employed to compare the concentration of SOM components
between the control and the treatment plots (warming, N+P fertilization and warming + N+P
fertilization) of the upper and lower horizons in each of the four replicate blocks (duplicate

40
biomarker analysis). A difference was considered significant at the level of P < 0.05.
Statistical analyses were performed using OriginPro (v8.0932).
2.4 Results
2.4.1 Total carbon (C) and nitrogen (N) content
In the upper horizon soils, the total C content in the control treatments varied from
13.7% to 48.9% while in the warming treatments, it varied from 36.9% to 44.9% (Table 2-1).
In the N+P fertilization and the warming +N+P fertilization treatments, the total C content of
the upper horizon soils ranged from 35.8% to 54.9% and from 11.7% to 52.3%, respectively.
In the lower horizon soils, the total C content in the control treatments ranged from 2.5% to
14.2% while in the warming treatments, it differed from 2.7% to 25.7% (Table 2-1). In the
N+P fertilization treatments, the total C content ranged from 2.6% to 16.9% and in the
warming +N+P fertilization treatments it ranged from 4.0% to 6.1%. In the upper horizon,
the total N content varied from 0.5% to 4.9% among the treatments, while in the lower
horizon, the total N content varied from 0.1% to 1.5% (Table 2-1). The total N content
increased as a result of warming and N+P fertilization in the upper horizon, except in block 1
where N+P fertilization decreased the total N content (Table 2-1). The lower horizon soils
elevated the total N content in response to warming but did not exhibit any overall
differences in the total N content with N+P fertilization. The total N content did not differ
overall with warming +N+P fertilization in either horizon (Table 2-1).

41
Table 2-1: Total carbon and nitrogen content (%) and carbon: nitrogen ratios of the upper
and lower horizon soils of the control, warming, N+P fertilization and warming + N+P
fertilization treatments from all four blocks.
NA = not analyzed (the lower horizon soil sample for the warming +N+P fertilization treatment of block 3 was
unavailable)
Block Treatment Depth (cm) % C % N C:N
1 Control
0-5 34.7 3.1 11.3
5-20 6.3 0.3 20.3
Warming 0-12 44.9 4.0 11.3
12-27 25.7 2.7 11.3
N+P
Fertilization
0-10 48.2 1.8 26.5
18-25 16.9 1.5 11.4
Warming +
N+P
Fertilization
0-12 48.2 2.0 24.0
12-27 6.1 0.5 11.4
2 Control 0-5 33.0 1.0 32.9
12-27 2.5 0.1 20.5
Warming 0-5 37.5 1.1 33.9
5-20 7.0 0.3 22.6
N+P
Fertilization
0-5 54.9 4.9 11.3
15-22 2.6 0.1 19.0
Warming +
N+P
Fertilization
0-5 31.4 1.4 23.3
16-18 4.0 0.4 11.5
3 Control
0-6 13.7 0.6 22.5
6-12 4.9 0.2 25.9
Warming 0-15 41.1 1.9 22.0
15-25 2.7 0.1 20.7
N+P
Fertilization
0-8 47.7 1.6 29.9
15-20 3.4 0.2 22.1
Warming +
N+P
Fertilization
0-10 52.3 2.4 21.6
NA NA NA NA
4 Control 0-12 48.9 0.9 54.3
12-25 14.2 0.4 32.7
Warming 0-10 36.9 1.1 34.2
10-27 25.6 1.3 20.2
N+P
Fertilization
0-10 35.8 1.9 19.2
10-24 2.7 0.1 19.8
Warming +
N+P
Fertilization
0-10 11.7 0.5 22.7
10-20 4.1 0.4 11.5
42
2.4.2 Sources of biomarkers in Arctic soils
The distribution of the solvent extract compound classes (normalized to g of soil) in
the four replicate blocks is shown in Figures 2-1 (upper horizon) and 2-2 (lower horizon).
The majority of compounds identified from solvent extraction included: aliphatic lipids (n-
alkanes, n-alkanols, and n-alkanoic acids), cyclic lipids (steroids and triterpenoids) and
simple carbohydrates (glucose, galactose and mannose). In both horizons of each treatment,
the n-alkanes ranged from C21 to C33, with an odd preference, the n-alkanols ranged from C16
to C32 with an even preference and the n-alkanoic acids ranged from C14 to C32 with an even
preference (Tables A1 to A3). In both horizons, long-chain homologues (≥ C20) of n-alkanols
and n-alkanoic acids were considerably more abundant than their short-chain counterparts
(Tables A2 to A3). Long-chain aliphatic lipids likely originate from epicuticular waxes of
higher plants (Simoneit, 2005; Pisani et al., 2015) while short-chain compounds may
originate from soil microbes including fungi and bacteria (Lichtfouse et al., 1995; Otto and
Simpson, 2005; Pisani et al., 2015). Simple carbohydrates which are likely to originate from
animals, plants and microbes (Simoneit et al., 2004; Pisani et al., 2015), were found to
decrease from the upper horizon to the lower horizon in all treatments (Figures 2-1 and 2-2;
Table A4). Steroids including β-sitosterol, stigmasterol and campesterol were detected (Table
A4) and are commonly found in higher plants (Baker, 1982; Harwood and Russel, 1984;
Bianchi, 1995; Simpson et al., 2008; Pautler et al., 2010). Sitosterone and stigmasta-3,5-dien-
7one, degradation products of β-sitosterol and stigmasterol respectively (Mackenzie et al.,
1982; Simpson et al., 2008; Pautler et al., 2010), were also observed (Table A4). Ergosterol,
a fungal biomarker, was not detected in either horizon of these Arctic soils (Table A4).
Cholesterol was found in both horizons of all treatments (Table A4) but is not a source-
specific biomarker because it can originate from animals, fungi or plants (Simpson et al.,

43
2008). Triterpenoids such as oleanolic acid and ursolic acid, which are characteristic
biomarkers for angiosperms (Tulloch, 1976; Baker, 1982; Bianchi, 1995; Otto and Simpson,
2005; Simpson et al., 2008), were detected as well (Table A4).
Figure 2-1: Concentrations (μg g-1
soil) of major SOM components from the upper horizon
soil samples after 32 years of warming, N+P fertilization and combined treatments. SOM
components include aliphatic and cyclic lipids, simple carbohydrates (galactose, glucose,
mannose), cutin- and suberin-derived lipids and lignin-derived phenols. All values are
reported as mean ± standard error (n = 2). Asterisks denote statistical significance from the
control treatment (P < 0.05).
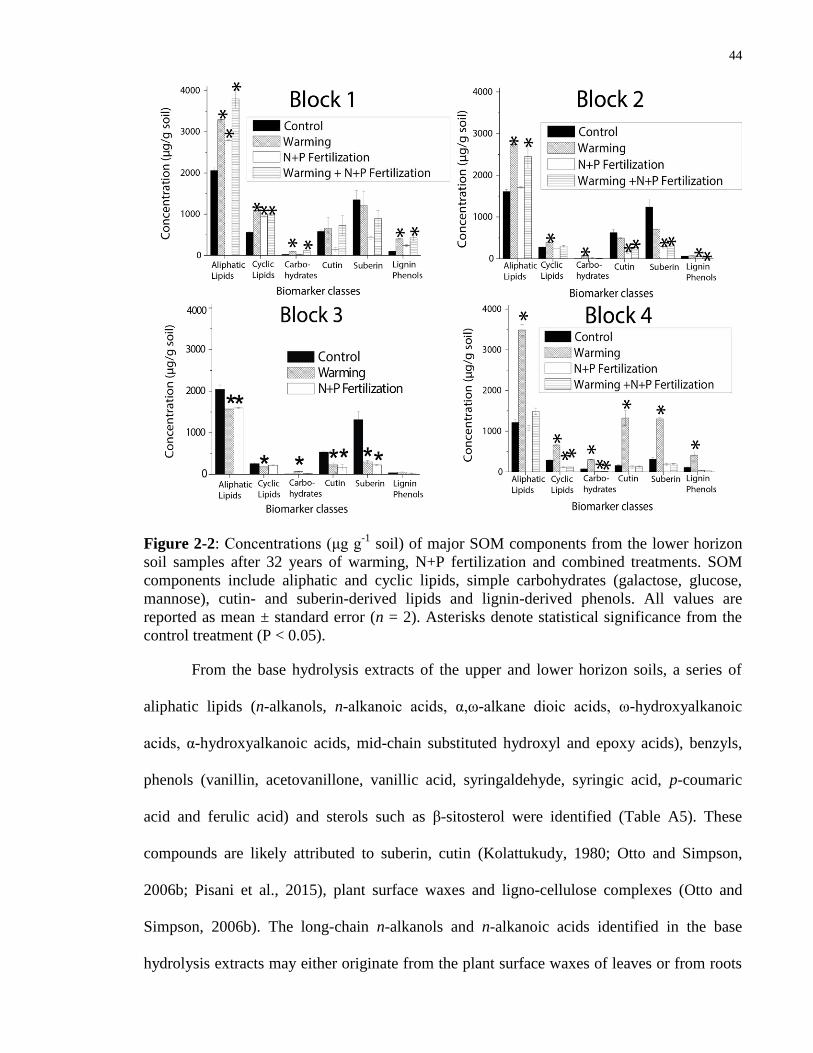
44
Figure 2-2: Concentrations (μg g-1
soil) of major SOM components from the lower horizon
soil samples after 32 years of warming, N+P fertilization and combined treatments. SOM
components include aliphatic and cyclic lipids, simple carbohydrates (galactose, glucose,
mannose), cutin- and suberin-derived lipids and lignin-derived phenols. All values are
reported as mean ± standard error (n = 2). Asterisks denote statistical significance from the
control treatment (P < 0.05).
From the base hydrolysis extracts of the upper and lower horizon soils, a series of
aliphatic lipids (n-alkanols, n-alkanoic acids, α,ω-alkane dioic acids, ω-hydroxyalkanoic
acids, α-hydroxyalkanoic acids, mid-chain substituted hydroxyl and epoxy acids), benzyls,
phenols (vanillin, acetovanillone, vanillic acid, syringaldehyde, syringic acid, p-coumaric
acid and ferulic acid) and sterols such as β-sitosterol were identified (Table A5). These
compounds are likely attributed to suberin, cutin (Kolattukudy, 1980; Otto and Simpson,
2006b; Pisani et al., 2015), plant surface waxes and ligno-cellulose complexes (Otto and
Simpson, 2006b). The long-chain n-alkanols and n-alkanoic acids identified in the base
hydrolysis extracts may either originate from the plant surface waxes of leaves or from roots

45
(Kolattukudy and Espelie, 1989; Bernards, 2002; Otto and Simpson, 2006b). The C16-C22
α,ω-alkane dioic acids and ω-hydroxyalkanoic acids (Table A5) likely originate from suberin
(Kolattukudy and Espelie, 1989; Bernards, 2002; Otto and Simpson, 2005; 2006b). The mid-
chain-substituted hydroxyl C15 acids and the C16 mono- and dihydroxy acids and diacids may
be derived from cutin (Holloway, 1982; Kolattukudy and Espelie, 1989; Bernards, 2002;
Otto and Simpson, 2006b). β-sitosterol, identified in the upper and lower horizon soils (Table
A5) is likely derived from leaf waxes (Otto and Simpson, 2006b). The benzenes are
nonspecific biomarkers because they are degradation products of proteins and tannins (Goñi
et al., 2000; Otto and Simpson, 2006b). The α-hydroxyalkanoic acids are also nonspecific
biomarkers because they can be found in membranes of animals, fungi and leaf waxes (Otto
and Simpson, 2006b).
CuO oxidation cleaves the aryl ether bonds of the lignin macromolecule and releases
eight major lignin-derived phenols of the vanillyl (vanillin, acetovanillone, vanillic acid),
syringyl (syringaldehyde, acetosyringone, syringic acid) and cinnamyl (p-coumaric acid,
ferulic acid) monomers (Hedges and Mann, 1979; Otto and Simpson, 2006a). In both
horizons, the composition of lignin-derived phenols is dominated by vanillyl and syringyl
monomers (Figures 2-3 and 2-4).

46
Figure 2-3: Concentrations (μg g-1
soil) of lignin-derived phenols (vanillyl, syringyl and
cinnamyl monomers) released from CuO oxidation of the upper horizon soil samples after 32
years of warming, N+P fertilization and combined treatments. All values are reported as
mean ± standard error (n = 2). Asterisks denote statistical significance from the control
treatment (P < 0.05).

47
Figure 2-4: Concentrations (μg g-1
soil) of lignin-derived phenols (vanillyl, syringyl and
cinnamyl monomers) released from CuO oxidation of the lower horizon soil samples after 32
years of warming, N+P fertilization and combined treatments. All values are reported as
mean ± standard error (n = 2). Asterisks denote statistical significance from the control
treatment (P < 0.05).
2.4.3 SOM composition of warmed soils
In the upper horizon, the concentration of total aliphatic lipids did not vary overall
with soil warming (Figure 2-1; Table A4). The total cyclic lipids concentration increased
with soil warming in the upper horizon but only significantly in blocks 2 and 3 (P < 0.05).
Aliphatic compounds have been found to preferentially degrade compared to cyclic
compounds (Otto and Simpson, 2005). As a result, the aliphatic to cyclic compound
(aliphatic/cyclic) ratio can be used to assess the degradation stage of SOM, where the ratio
decreases with enhanced SOM degradation (Otto and Simpson, 2005; Pisani et al., 2013).
48
Warming decreased the aliphatic/cyclic ratios (P < 0.05) but did not change the
concentrations of simple carbohydrates in the upper horizon soils (Figure 2-1; Table A4). In
the upper horizon of block 4, total aliphatic lipids and total cyclic lipids, along with simple
carbohydrates, all decreased in abundance with warming (Figure 2-1; Table A4; P < 0.05). In
the lower horizon, both total aliphatic lipids and total cyclic lipids were found to accumulate
with warming except in block 3 where the concentrations of both aliphatic and cyclic lipids
decreased (Figure 2-2; Table A4; P < 0.05). Warming did not alter the aliphatic/cyclic ratios
but caused enrichment of simple carbohydrates in the lower horizon soils (Figure 2-2; Table
A4; P < 0.05).
While the concentrations of suberin-derived compounds (∑S) did not change with
warming in the upper horizon, higher concentrations of cutin-derived compounds (∑C) were
observed, but only significantly in block 3 (Figure 2-1; Table A5; P < 0.05). The
suberin/cutin ratio was calculated to determine SOM inputs from roots and leaves (Otto and
Simpson, 2006b). The suberin/cutin ratio was lowered by warming in the upper horizon of
block 3 ( P < 0.05) but did not vary in the upper horizons of the other blocks (Table A5).
Biomarkers derived from suberin or cutin (∑SvC) include C16 and C18 ω-hydroxy acids, α,ω-
alkanedioic, di- and tri-hydroxy C18 acids and the 9,10-epoxy-ω-OH C18 acid (Otto and
Simpson, 2006b). ∑SvC was increased by warming in the upper horizon, but only
significantly in block 3 (Table A5; P < 0.05). The ratio of mid-chain-substituted acids to the
total suberin and cutin acids (∑Mid/∑SC) can be used to evaluate the extent of cutin and
suberin degradation, where decreasing values indicate enhanced degradation (Otto and
Simpson, 2006b). In the upper horizon, the ∑Mid/∑SC ratios did not differ overall with
warming (Table A5). The degradation of cutin-derived compounds can be estimated by
determining the changes in the relative abundances of the ω-C16 and ω-C18 hydroxyalkanoic
49
acids. Expressed as ω-C16 /∑C16 and ω-C18 /∑C18 respectively, these ratios have been shown
to increase with progressive cutin degradation in soil (Otto and Simpson, 2006b). Warming
did not vary the ω-C16/∑C16 and ω-C18/∑C18 cutin degradation ratios in the upper horizon
(Table A5). In the lower horizon, ∑S declined with warming but only significantly in block 3
(P < 0.05), while warming did not elicit any changes in ∑C (Figure 2-2; Table A5). ∑SvC
decreased with warming in the lower horizon, but only significantly in blocks 2 and 3 (P <
0.05). In the lower horizon of block 4, warming elevated both ∑S and ∑SvC (Figure 2-2;
Table A5; P < 0.05). The lower horizons of all the blocks exhibited lowered ω-C16/∑C16
ratios as a result of warming, although only the decrease in block 4 was statistically
significant (Table A5; P < 0.05). No major differences were observed in the ω-C18/∑C18 and
the ∑Mid/∑SC ratios with warming in the lower horizon (Table A5). The suberin/cutin ratios
decreased in all the blocks as a result of warming in the lower horizon although not
significantly (Table A5).
In the upper horizons, total extractable lignin phenol concentrations decreased with
warming but only significantly in block 4 (Figure 2-1; P < 0.05). In the upper horizon of
block 2, these concentrations were elevated by warming (Figure 2-1). Vanillyl monomers
decreased with warming in block 4 (P < 0.05) but did not vary in the other blocks (Figure 2-
3). Decreases in syringyl and cinnamyl monomers due to warming were observed, which
were more pronounced in blocks 3 and 4 (P < 0.05). In the upper horizon of block 2,
warming promoted enrichment of syringyl and cinnamyl monomers but only the cinnamyl
monomers increased significantly (Figure 2-3; P < 0.05). Ratios of lignin-derived phenolic
acids and their corresponding aldehydes (Ad/Al) for both syringyl and vanillyl monomers
can provide information on lignin degradation where increasing Ad/Al ratios suggest
progressive lignin oxidation (Hedges et al., 1988; Otto and Simpson, 2006a). The plots of

50
Ad/Al ratios of the upper and lower horizons soils of each treatment are shown in Figures 2-5
and 2-6 respectively. The Ad/Al ratios did not vary with warming in the upper horizons
except in block 4 where higher Ad/Al ratios were observed (Figure 2-5).
Figure 2-5: Plots of the acid to aldehyde ratios for syringyl (Ad/Al)s and vanillyl (Ad/Al)v
monomers of the upper horizon soils in each block. (Ad/Al)s = syringic acid/syringaldehyde;
(Ad/Al)v = vanillic acid/vanillin. Asterisks denote statistical significance from the control
treatment (P < 0.05).

51
Figure 2-6: Plots of the acid to aldehyde ratios for syringyl (Ad/Al)s and vanillyl (Ad/Al)v
monomers of the lower horizon soils in each block. (Ad/Al)s = syringic acid/syringaldehyde;
(Ad/Al)v = vanillic acid/vanillin.

52
The syringyl/vanillyl (S/V) and cinnamyl/vanillyl (C/V) ratios are used to determine
the specific botanical sources of lignin (Ertel and Hedges, 1984; Prahl et al., 1994; Goñi et
al., 2000; Otto and Simpson, 2006a). The plots of the S/V and C/V ratios of the upper and
lower horizon soils are illustrated in Figures 2-7 and 2-8 respectively.
Figure 2-7: Plots of the syringyl/vanillyl monomers (S/V) and cinnamyl/vanillyl monomers
(C/V) ratios of the upper horizon soils in each block. Asterisks denote statistical significance
from the control treatment (P < 0.05).
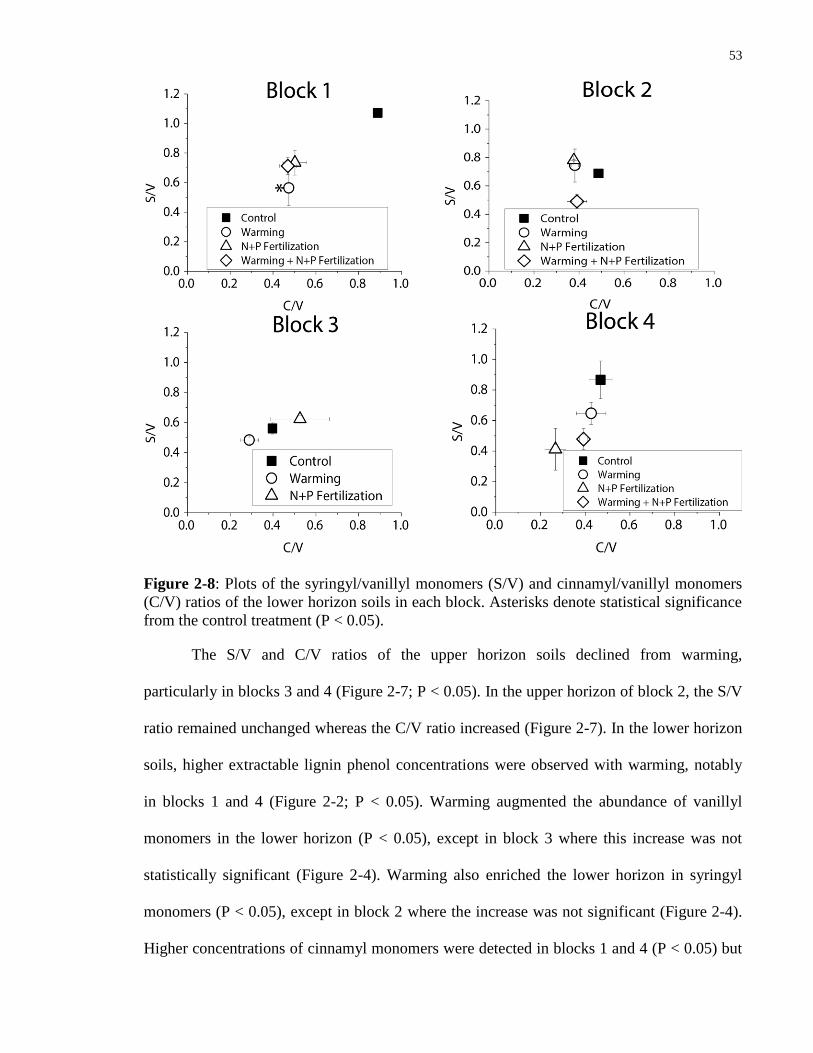
53
Figure 2-8: Plots of the syringyl/vanillyl monomers (S/V) and cinnamyl/vanillyl monomers
(C/V) ratios of the lower horizon soils in each block. Asterisks denote statistical significance
from the control treatment (P < 0.05).
The S/V and C/V ratios of the upper horizon soils declined from warming,
particularly in blocks 3 and 4 (Figure 2-7; P < 0.05). In the upper horizon of block 2, the S/V
ratio remained unchanged whereas the C/V ratio increased (Figure 2-7). In the lower horizon
soils, higher extractable lignin phenol concentrations were observed with warming, notably
in blocks 1 and 4 (Figure 2-2; P < 0.05). Warming augmented the abundance of vanillyl
monomers in the lower horizon (P < 0.05), except in block 3 where this increase was not
statistically significant (Figure 2-4). Warming also enriched the lower horizon in syringyl
monomers (P < 0.05), except in block 2 where the increase was not significant (Figure 2-4).
Higher concentrations of cinnamyl monomers were detected in blocks 1 and 4 (P < 0.05) but
54
no changes were observed in blocks 2 and 3 with warming in the lower horizon (Figure 2-4).
The Ad/Al ratios of the lower horizon of each block did not show a uniform response under
warmed conditions (Figure 2-6) which did not present any evidence of accelerated lignin
oxidation. The S/V and C/V ratios of the lower horizon of the warming treatment also
decreased particularly in block 1 (Figure 2-8; P < 0.05). In the lower horizon of block 2, the
S/V ratio was elevated by warming (Figure 2-8).
2.4.4 SOM composition of N+P fertilized soils
With N+P fertilization, the concentration of total aliphatic lipids did not vary in the
upper horizons while the concentration of total cyclic lipids increased in blocks 1 and 2 (P <
0.05) but not significantly in block 3 (Figure 2-1; Table A4). In the upper horizon of block 4,
the abundance of total aliphatic lipids did not change but a pronounced decline in total cyclic
lipids was observed (Figure 2-1; Table A4; P < 0.05). N+P fertilization decreased the
aliphatic/cyclic ratios of the upper horizon soils (P < 0.05) but did not trigger any overall
differences in the concentration of simple carbohydrates (Figure 2-1; Table A4). In the lower
horizon, the abundances of total aliphatic lipids and total cyclic lipids were not altered by
N+P fertilization, which did not lead to any differences in the aliphatic/cyclic ratios (Figure
2-2; Table A4). The concentrations of simple carbohydrates also did not alter with N+P
fertilization in the lower horizon (Figure 2-2; Table A4).
N+P fertilization did not elicit any changes in ∑S and ∑SvC in the upper horizon
soils (Figure 2-1; Table A5). ∑C increased with N+P fertilization in the upper horizon,
notably in block 1 (P < 0.05) but decreased in the upper horizon of block 4 (Figure 2-1; Table
A5). N+P fertilization did not trigger any overall variation in the suberin/cutin ratios of the
upper horizons of the remaining blocks (Table A5). In the lower horizon, N+P fertilization

55
reduced ∑S, ∑C and ∑SvC but these decreases were only statistically significant in blocks 2
and 3 (Figure 2-2; Table A5; P < 0.05). The suberin/cutin ratios were not altered by N+P
fertilization in the lower horizon (Table A5). No overall differences were observed in the ω-
C16/∑C16 and ω-C18/∑C18 cutin degradation ratios and the ∑Mid/∑SC ratios in the upper and
lower horizons of the remaining blocks with N+P fertilization (Table A5).
The total extractable lignin phenol concentrations in the upper horizon did not vary
with N+P fertilization, except for the decrease observed in block 4 (Figure 2-1; P < 0.05).
N+P fertilization augmented the abundance of vanillyl monomers, while the abundance of
syringyl monomers did not vary in the upper horizon (Figure 2-3). Cinnamyl monomers
increased with N+P fertilization in the upper horizon, although only significantly in blocks 2
and 3 (Figure 2-3; P < 0.05). In the upper horizon of block 4, all the lignin monomers were
reduced by N+P fertilization (Figure 2-3; P < 0.05). The Ad/Al ratios did not vary, except in
block 4 where these ratios increased (Figure 2-5). In response to N+P fertilization, the S/V
ratios of the upper horizon soils decreased, except in block 4 where no changes were
observed. The C/V ratios decreased in blocks 1 and 4 but were elevated in blocks 2 and 3 of
the upper horizon (Figure 2-7). In the lower horizon of block 1, the total extractable lignin
phenol concentrations were augmented by N+P fertilization, caused by higher abundances of
vanillyl, syringyl and cinnamyl monomers (Figures 2-2 and 2-4). In the lower horizons of the
other blocks, total extractable lignin declined in response to N+P fertilization, although only
the decreases in blocks 2 and 4 were significant (Figure 2-2; P < 0.05). All lignin monomer
concentrations were reduced in the lower horizon, but only the decreases in vanillyl and
cinnamyl monomers of block 2 were statistically significant (Figure 2-4; P < 0.05). Similar to
our observations in the upper horizon, the Ad/Al ratios did not differ in response to N+P
fertilization in the lower horizon (Figure 2-6). N+P fertilization triggered decreases in the

56
S/V and C/V ratios of the lower horizons of blocks 1 and 4 (Figure 2-8). Higher S/V ratios
were exhibited in blocks 2 and 3 while the C/V ratios decreased in block 2 and increased in
block 3 with N+P fertilization in the lower horizon (Figure 2-8).
2.4.5 SOM composition of warmed + N+P fertilized soils
In the upper horizons, warming +N+P fertilization elevated the concentrations of total
aliphatic lipids significantly in blocks 1 and 3 (P < 0.05) but not significantly in block 2
(Figure 2-1; Table A4). Enrichment in total cyclic lipids was also detected (Figure 2-1; Table
A4; P < 0.05). Although the concentrations of aliphatic and cyclic lipids both increased, the
aliphatic/cyclic ratios decreased with warming +N+P fertilization in the upper horizon (Table
A4; P < 0.05). In the upper horizon of block 4, total aliphatic lipids and total cyclic lipids
were lowered by warming +N+P fertilization (P < 0.05), causing no variation in the
aliphatic/cyclic ratio (Figure 2-1; Table A4). No major differences were detected in the
concentration of simple carbohydrates from the upper horizon of the warming +N+P
fertilization treatment (Figure 2-1; Table A4). In the lower horizon, warming +N+P
fertilization led to enrichment in total aliphatic lipids which was significant in blocks 1 and 2
but not in block 4 (Figure 2-2; Table A4; P < 0.05). Warming +N+P fertilization did not alter
the abundances of total cyclic lipids and simple carbohydrates in the lower horizons (Figure
2-2; Table A4). The aliphatic/cyclic ratios notably increased in the lower horizons of blocks
2 and 4 (P < 0.05) but not significantly in the lower horizon of block 1 in response to
warming +N+P fertilization (Table A4).
∑S decreased as a result of warming +N+P fertilization in the upper horizons,
particularly in block 4 (P < 0.05) but increased in block 3 (Figure 2-1; Table A5). Warming
+N+P fertilization caused enrichment in ∑C in the upper horizon, except in block 4 where
57
∑C decreased (Figure 2-1; Table A5). ∑SvC in the upper horizon soils did not vary across all
the blocks (Table A5). Warming +N+P fertilization augmented the ω-C18/∑C18 and the
∑Mid/∑SC ratios of the upper horizon soils but only significantly in block 2 (Table A5; P <
0.05). In the upper horizon of block 1, these ratios did not change (Table A5). No major
differences were observed with the ω-C16/∑C16 ratios of the upper horizon (Table A5). In the
lower horizon, both ∑S and ∑SvC were reduced by warming +N+P fertilization notably in
block 2 (Figure 2-2; Table A5; P < 0.05). ∑C decreased in block 2 (P < 0.05) but did not alter
in the lower horizons of the other blocks (Figure 2-2; Table A5). The ω-C16/∑C16, ω-
C18/∑C18 and ∑Mid/∑SC ratios did not differ with warming +N+P fertilization in the lower
horizon (Table A5). The suberin/cutin ratios of both horizons declined as a result of warming
+N+P fertilization (Table A5).
Warming +N+P fertilization reduced the abundances of total extractable lignin
phenols in the upper horizon but only the decrease in block 4 was significant (Figure 2-1; P <
0.05). Vanillyl monomers did not vary overall while syringyl and cinnamyl monomers in the
upper horizon declined in response to warming +N+P fertilization (Figure 2-3). The upper
horizon of block 2 elicited higher concentrations of total extractable lignin phenols (Figure 2-
1; P < 0.05), caused by enrichment in syringyl and cinnamyl monomers but only the increase
in syringyl monomers was significant (Figure 2-3; P < 0.05). In the upper horizon, warming
+N+P fertilization did not vary the Ad/Al ratios of blocks 1 and 3 (Figure 2-5) but lowered
that of block 2 (Figure 2-5; P < 0.05). On the contrary, warming +N+P fertilization enhanced
lignin oxidation in the upper horizon of block 4, as demonstrated by the elevated Ad/Al ratios
(Figure 2-5). The decline in S/V and C/V ratios with warming +N+P fertilization in the upper
horizon soils were only significant in block 3 (Figure 2-7; P < 0.05). The upper horizon of
block 4 showed higher S/V and C/V ratios in response to warming +N+P fertilization (Figure

58
2-7). In the lower horizon soils, warming +N+P fertilization did not promote any overall
differences in the total extractable lignin phenol concentrations (Figure 2-2) or in the
abundances of each lignin monomer (Figure 2-4). The Ad/Al ratios did not vary (Figure 2-6)
but the S/V and C/V ratios declined in response to warming +N+P fertilization in the lower
horizon (Figure 2-8).
2.4.6 Solid-state 13
C NMR of Arctic soils
Solid-state 13
C NMR can provide basic structural information of SOM components
(Simpson et al., 2008; Simpson and Simpson, 2012). The results of the solid-state 13
C NMR
analysis of the block 1 upper and lower horizons of the four treatments are summarized in
Table 2-2 and their corresponding NMR spectra are illustrated in Figure 2-9. The four main
spectral regions identified and their corresponding chemical shifts are as follows: alkyl C (0-
50 ppm); O-alkyl C (50-110 ppm); aromatic and phenolic C (110-165 ppm) and carboxylic
and carbonyl C (165-215 ppm; Baldock et al., 1992; Simpson et al., 2008). The solid-state
13C NMR spectra revealed that both the upper and lower horizon soils are dominated by alkyl
and O-alkyl C (Figure 2-9; Table 2-2). Alkyl C originates from cutin, suberin, aliphatic side-
chains and lipids whereas O-alkyl C originates from the substituted aliphatic constituents of
carbohydrates, peptides and methoxyl C found in lignin (Baldock et al., 1992; Simpson et al.,
2008). Aromatic and phenolic C along with carboxylic and carbonyl C exhibited relatively
less intense signals compared to the alkyl and O-alkyl C regions in the 13
C NMR spectra of
both horizons (Figure 2-9; Table 2-2). Aromatic and phenolic signals arise from lignin and
aromatic amino acids while carboxylic and carbonyl signals are from fatty acids and peptides
(Baldock et al., 1992; Simpson et al., 2008).
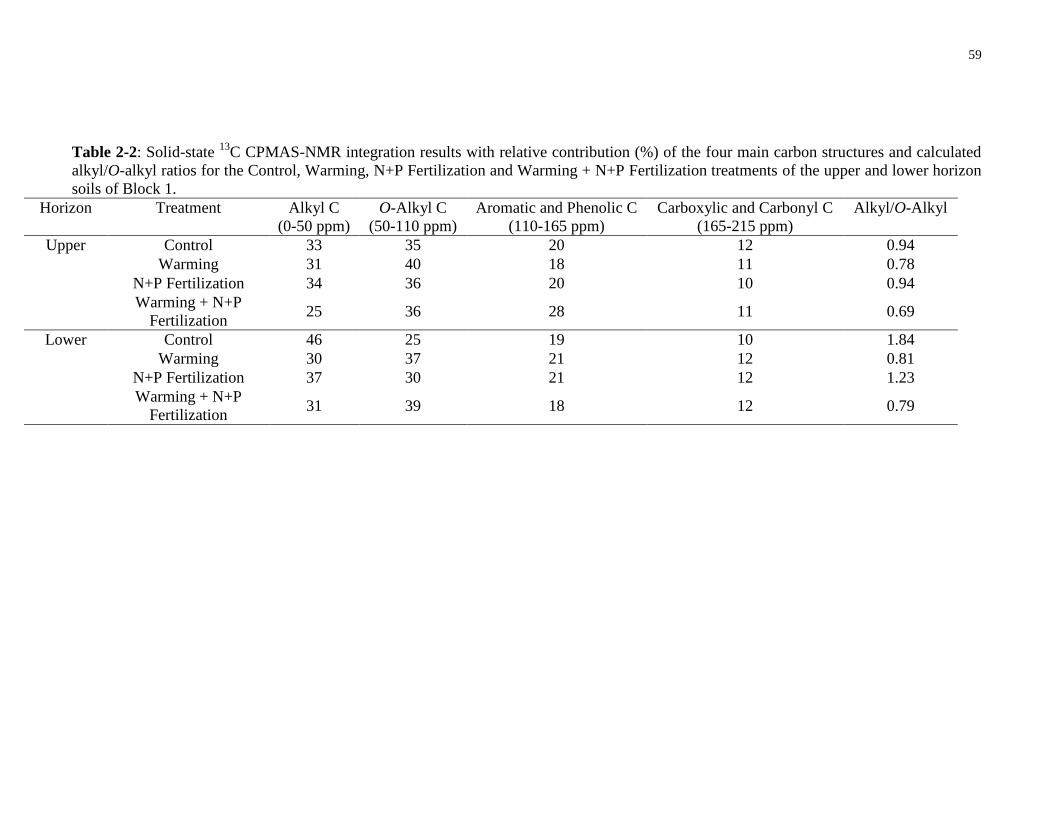
59
Table 2-2: Solid-state 13
C CPMAS-NMR integration results with relative contribution (%) of the four main carbon structures and calculated
alkyl/O-alkyl ratios for the Control, Warming, N+P Fertilization and Warming + N+P Fertilization treatments of the upper and lower horizon
soils of Block 1.
Horizon Treatment Alkyl C
(0-50 ppm)
O-Alkyl C
(50-110 ppm)
Aromatic and Phenolic C
(110-165 ppm)
Carboxylic and Carbonyl C
(165-215 ppm)
Alkyl/O-Alkyl
Upper Control 33 35 20 12 0.94
Warming 31 40 18 11 0.78
N+P Fertilization 34 36 20 10 0.94
Warming + N+P
Fertilization 25 36 28 11 0.69
Lower Control 46 25 19 10 1.84
Warming 30 37 21 12 0.81
N+P Fertilization 37 30 21 12 1.23
Warming + N+P
Fertilization 31 39 18 12 0.79
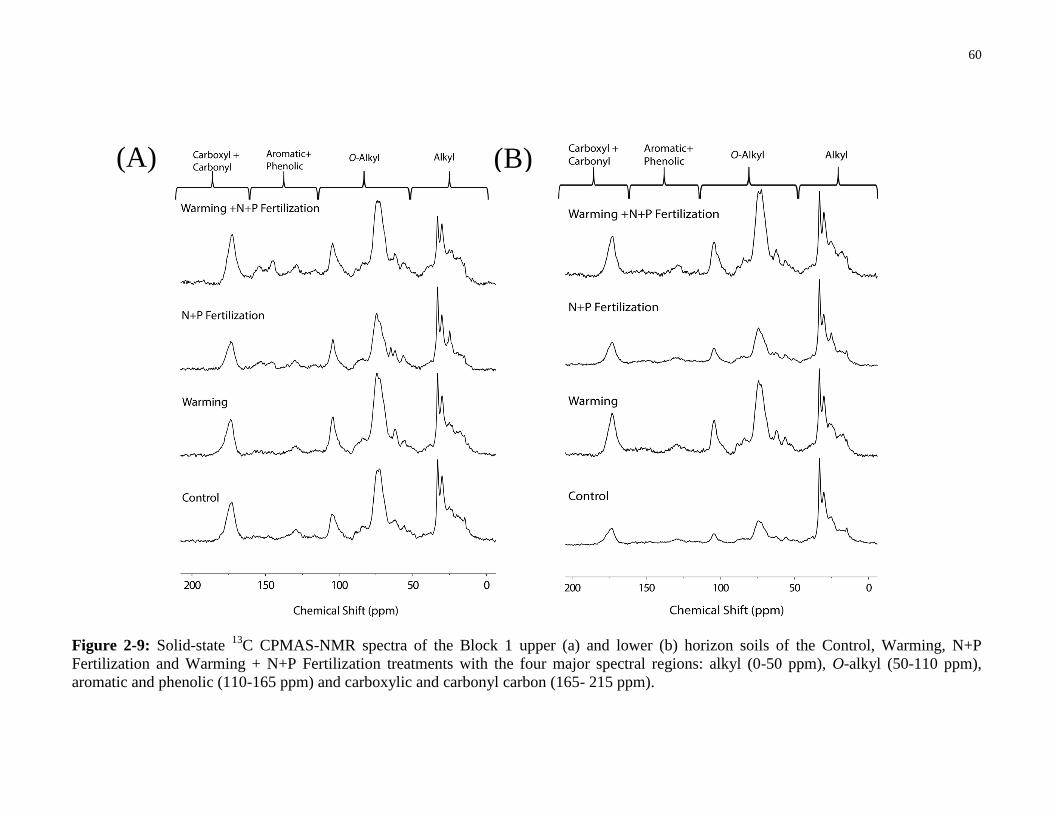
60
Figure 2-9: Solid-state 13
C CPMAS-NMR spectra of the Block 1 upper (a) and lower (b) horizon soils of the Control, Warming, N+P
Fertilization and Warming + N+P Fertilization treatments with the four major spectral regions: alkyl (0-50 ppm), O-alkyl (50-110 ppm),
aromatic and phenolic (110-165 ppm) and carboxylic and carbonyl carbon (165- 215 ppm).
(A) (B)

61
The alkyl C signal was neither altered by warming nor by N+P fertilization, but was
lowered by warming +N+P fertilization in the upper horizon soils (Figure 2-9; Table 2-2).
Warming elevated the O-alkyl C signal, but no other changes were observed with the other
treatments in the upper horizon. In the lower horizon, warming, N+P fertilization and their
combined treatment facilitated reductions in the alkyl C signals and enhancements in the O-
alkyl C signals relative to the control (Figure 2-9b; Table 2-2). In the upper horizon, the
aromatic and phenolic C signal was slightly reduced by warming, elevated by warming
+N+P fertilization, but remained unchanged with N+P fertilization (Figure 2-9a; Table 2-2).
In the lower horizon, the aromatic and phenolic C signal slightly increased in response to
warming and N+P fertilization, but did not alter as a result of the combined treatment (Figure
2-9b; Table 2-2). The relative percent changes of the carboxylic and carbonyl C regions in
the solid-state 13
C NMR spectra of both horizons did not differ with each treatment (Figure
2-9; Table 2-2). Since O-alkyl compounds are more easily degraded than alkyl compounds,
the ratio of alkyl/O-alkyl C offers information on the relative stage of SOM degradation. This
ratio increases with progressive degradation (Baldock et al., 1992; Simpson et al., 2008). In
both horizons, the alkyl/O-alkyl ratios were lowered by warming and warming + N+P
fertilization but did not alter in response to N+P fertilization (Table 2-2).
2.5 Discussion
2.5.1 Spatial heterogeneity and vertical mixing
The variation in total C content may be due to the differences in depths of the upper
and lower horizons of each replicate block within each treatment (Table 2-1). Although the
collection of distinct layers was attempted, the total C content still differed among the blocks
in both horizons. Hence, samples from the replicate blocks belonging to the same treatment
62
were not composited and were analyzed separately. The biomarker data showed less
variability in response to each treatment, more so when it was normalized to the mass of soil
(Figures 2-1 to 2-4; Tables A1 to A5) than when it was normalized to the C content. The
differences in total C content among the upper and lower horizons of the replicate blocks
within each treatment (Table 2-1) may be attributable to spatial heterogeneity across the
landscape (Burke et al., 1999; Hook and Burke, 2000; Schöning et al., 2006; Spielvogel et
al., 2016). The results from our preliminary solid-state 13
C NMR experiment showed notable
differences in the NMR resonance intensities of SOM components between the control
samples from each block (Table A6; Figure A1), which offer further evidence that each block
may have responded differently to each treatment due to spatial variability. Landscape
heterogeneity will alter soil moisture content, nutrient availability, soil development and
plant growth (Burke et al., 1999; Schöning et al., 2006; Mishra and Riley, 2015). These
factors will be discussed more in depth in section 2.5.5. A recent study employed biomarker
methods and NMR spectroscopy along with multivariate geostatistical approaches to
examine the variation in the distribution of SOM compounds in an ecosystem setting
(Spielvogel et al., 2016). Geostatistical analyses of biomarker and solid-state 13
C NMR
spectroscopy data showed small scale heterogeneity was correlated to topography, where the
distribution of SOM was associated with the topographical pattern of the site. For example,
higher amounts of O-alkyl C components including simple sugars such as glucose, galactose
and mannose were found in the central depression of the field site compared to locations with
steeper terrain (Spielvogel et al., 2016). The authors also observed that the distribution of
lignin and aromatic C in the soil corresponded to the location of specific vegetative inputs
surrounding the sampling sites. Although these observations could be ecosystem-specific,
Spielvogel et al. (2016) demonstrated that the distribution of SOM components likely reflects

63
the spatial heterogeneity of the field site and biomarker and NMR analyses are sensitive
enough to detect localized differences within the landscape.
In addition to spatial heterogeneity among the blocks, the organic and mineral
horizon soils in some blocks from Toolik Lake could be not distinguished based on C content
(Table 2-1). For example, the total C contents of the lower horizons of the warming
treatments in blocks 1 and 4 were greater than 17% (Table 2-1) and therefore cannot be
considered true mineral horizons (Gregorich et al., 2001). In the upper horizon of the
warming +N+P fertilization treatment of block 4, the total C content was less than 17%
(Table 2-1) and therefore cannot be considered a true organic horizon (Gregorich et al.,
2001). The lack of true distinction between the organic and mineral horizons may likely be
caused by cryoturbation, where vertical mixing occurs between surface organic matter and
mineral soils (Bockheim and Tarnocai, 1998). Surface organic matter is churned and moves
downward to the permafrost table surface (Tarnocai and Smith, 1992; Ping et al., 1998;
2008) causing soils in deeper horizons to become exposed at the surface (Bockheim and
Tarnocai, 1998). This vertical mixing likely redistributed C between the soil horizons
(Michaelson et al., 1996) which may explain why the C content was as low as 11.7% in the
upper horizon soils and as high as 25.7% in the lower horizon soils (Table 2-1).
Cryoturbation is triggered by soil freeze-thaw cycles and soil hydrothermal gradients that
result in differential frost heaving (Peterson, 2003; Ping et al., 2008). Frost heaving occurs
when a growing ice layer within the soil horizon thrusts soil upward and fractures overlying
rock (Williams and Smith, 1989; Bockheim and Tarnocai, 1998). The variation in C content
among the blocks from each treatment (Table 2-1) may also be caused by differences in thaw
depths among the blocks. The thaw depth of the active layer may differ depending on the
location and year, where maximum thaw depths range from 0.3 m to more than 1.0 m (Sturm
64
et al., 2005). The thaw depth of the active layer plays an important role in determining the
total amount of C that cycles within the soil. Differences in thaw depths is a reflection of
complex interactions among topography, soil moisture and thermal properties of the upper
and lower horizon soils (Shaver et al., 2014).
2.5.2 Labile SOM components
A greater abundance of long-chain aliphatic lipids over short-chain aliphatic lipids
was observed in these Arctic soils (Tables A1 to A3), which suggests that microbial inputs
are less prevalent than those from vascular plants (Otto and Simpson, 2005). The preferential
accumulation of cyclic compounds in the upper horizon of the warming treatment (Table A4)
is consistent with previous observations where cyclic lipids have been found to preferentially
accumulate over aliphatic lipids, likely because cyclic lipids possess more complex structures
which are less prone to degradation (Otto and Simpson, 2005). Warming did not alter the
abundance of simple carbohydrates in the upper horizon but elicited enrichment in the lower
horizon (Table A4; Figures 2-1 and 2-2). The elevated concentrations of simple
carbohydrates in the lower horizon may have been caused by the breakdown of cellulose
(Amelung et al., 2009), the most abundant plant biopolymer (Kögel-Knabner, 2002). The
enhancement in the O-alkyl C signal in the solid-state 13
C NMR spectrum of the lower
horizon with warming (Figure 2-9b; Table 2-2) is most likely to arise from cellulose (Hatcher
et al., 1983; Salloum et al., 2002). In the upper horizon, the greater intensity of the O-alkyl C
signal with warming (Figure 2-9a; Table 2-2) coupled with no changes in the concentration
of simple carbohydrates (Figure 2-2; Table A4) further indicate that abundant amounts of
cellulose are present in these Arctic soils.

65
Similar to our observations from the warming treatment, N+P fertilization promoted
the preferential accumulation of cyclic compounds in the upper horizon (Table A4), which
may be attributed to the complex structures of cyclic compounds that cause them to be less
susceptible to degradation (Otto and Simpson, 2005). The abundance of simple
carbohydrates was not altered by N+P fertilization in either horizon (Figures 2-1 and 2-2;
Table A4), which corresponded to no observed difference in the O-alkyl C signal from the
solid-state 13
C NMR spectrum of the upper horizon (Figure 2-9a; Table 2-2). However, in the
lower horizon, N+P fertilization did not alter the concentration of simple carbohydrates, yet
the O-alkyl C signal increased in intensity (Figure 2-9b; Table 2-2), which suggests these
soils were enriched in cellulose (Hatcher et al., 1983; Salloum et al., 2002).
Warming +N+P fertilization promoted the preferential accumulation of cyclic
compounds in the upper horizon and the preferential accumulation of aliphatic lipids in the
lower horizon (Figures 2-1 and 2-2; Table A4). The mixing between the upper and lower
horizon soils caused by cryoturbation (Ping et al., 2008) may have facilitated the exchange of
aliphatic and cyclic lipids between the horizons. Aliphatic lipids may also have accumulated
in the lower horizon by the translocation of dissolved organic C from the upper horizon
(Currie et al., 1996; Pisani et al., 2015). The concentration of simple carbohydrates was not
found to change in the upper horizon from warming +N+P fertilization (Figure 2-2), which
corresponds to no observed change in the O-alkyl C signal intensity in the solid-state 13
C
NMR spectrum (Figure 2-9a; Table 2-2). In the lower horizon, warming +N+P fertilization
enhanced the O-alkyl C signal (Figure 2-9b; Table 2-2) but did not change the concentration
of simple carbohydrates, which suggests large amounts of cellulose are contained in these
Arctic soils (Hatcher et al., 1983; Salloum et al., 2002).
66
2.5.3 Recalcitrant SOM components
Warming elevated the concentrations of cutin-derived components in the upper
horizon but not significantly (Figure 2-1; Table A5). However, the abundance of long-chain
n-alkanes (Table A1) derived from epicuticular waxes of plants (Simoneit, 2005; Pisani et al.,
2015) did not vary, which indicates there was a slight accumulation of aboveground inputs in
the upper horizon under elevated temperatures. The abundance of suberin-derived
compounds did not change in response to warming in the upper horizon (Figure 2-1; Table
A5). In the lower horizon, warming enhanced the abundance of long-chain n-alkanes derived
from epicuticular waxes (Table A1) but did not alter the amount of cutin-derived compounds
(Figure 2-2; Table A5). The decreases in suberin-derived compounds in the lower horizon
with warming were not statistically significant (Figure 2-2; Table A5), which signifies
elevated temperatures may not have triggered substantial reductions in belowground inputs.
These observations collectively indicate that warming may not have markedly altered the
amount of cutin- and suberin-derived inputs in the upper and lower horizons.
N+P fertilization enriched the upper horizon in cutin-derived compounds (Figure 2-1;
Table A5) but lowered the abundance of long-chain n-alkanes derived from epicuticular
waxes (Table A1), which suggests increased nutrient availability may not have promoted the
accumulation of aboveground inputs in the upper horizon. The amount of suberin-derived
compounds did not alter in response to N+P fertilization (Figure 2-1; Table A5). The lack of
changes in aboveground and belowground inputs in the upper horizon correspond to no
differences in the alkyl C signals of the solid-state 13
C NMR spectrum of the upper horizon
(Figure 2-9a; Table 2-2). In the lower horizon, N+P fertilization reduced the abundance of
suberin- and cutin-derived biomarkers (Figure 2-2; Table A5), which may have collectively
contributed to the decreased signal of the alkyl C region (Figure 2-9b; Table 2-2). However,

67
N+P fertilization did not alter the abundance of long-chain n-alkanes from epicuticular waxes
(Table A1). This suggests that despite the slight reductions in suberin- and cutin-derived
compounds, the amount of aboveground and belowground inputs may not have been altered
by N+P fertilization in the lower horizon.
Warming +N+P fertilization increased the amount of cutin-derived compounds in the
upper horizon (Figure 2-1; Table A5) yet the abundance of long-chain n-alkanes from
epicuticular waxes did not change (Table A1), which indicates there was a minor
accumulation of aboveground inputs in the upper horizon. Suberin-derived inputs decreased
with warming +N+P fertilization in the upper horizon, but not significantly (Figure 2-1;
Table A5). In the lower horizon, higher abundances of long-chain n-alkanes were observed
(Table A1) but the concentration of the cutin-derived components did not change (Figure 2-
2; Table A5). This suggests elevated temperatures and nutrient availability did not promote
enrichment of aboveground inputs in the lower horizon. Suberin-derived components were
decreased by warming +N+P fertilization in the lower horizon (Figure 2-2; Table A5), but
this was not statistically significant. This indicates belowground inputs in the lower horizon
may not have been substantially altered by warming +N+P fertilization.
The cutin degradation ratios did not present any evidence of enhanced cutin
degradation in either horizon with warming, N+P fertilization or warming +N+P fertilization
(Table A5). The suppression of cutin degradation may be due to the chemical recalcitrance of
this alkyl structure (Riederer et al., 1993; Lorenz et al., 2007). Furthermore, the lack of
microbial inputs, as indicated by the low abundances of short-chain aliphatic lipids (Tables
A2 and A3), suggests low microbial activity. This may also explain why cutin-derived
components did not degrade in response to these treatments (Table A5).

68
2.5.4 Lignin-derived components
The extractability of lignin-derived phenols was considerably lower compared to the
extractability of labile and recalcitrant SOM components observed from the biomarker data
(Figures 2-1 to 2-4). The relatively lower concentrations of extractable lignin are further
supported by the solid-state 13
C NMR spectra of the upper and lower horizons of all the
treatments (Figure 2-9; Table 2-2). The aromatic and phenolic C signals, derived from lignin
as well as the aromatic components of suberin and amino acids (Baldock et al., 1992;
Simpson et al., 2008), were less intense compared to the O-alkyl and alkyl C signals, which
arise from labile and recalcitrant SOM components respectively (Baldock et al., 1992;
Simpson et al., 2008).
Although the warming treatment exhibited decreased lignin phenol concentrations in
the upper horizon and increased concentrations in the lower horizon, these were not
statistically significant changes (Figures 2-1 and 2-2). This is reflected by a reduction and an
enhancement in the aromatic and phenolic C signals in the solid-state 13
C NMR spectra of the
upper and lower horizons respectively in response to warming (Figure 2-9; Table 2-2).
Lignin was likely introduced into the lower horizon via the transport of dissolved organic C
down the soil profile (Currie et al., 1996; Pisani et al., 2015). N+P fertilization did not cause
any changes in the abundance of lignin phenols in the upper horizon (Figure 2-1), which is
consistent with no alteration in the aromatic and phenolic C signal of the solid-state 13
C
NMR spectra in the upper horizon (Figure 2-9a; Table 2-2). Despite decreased lignin phenol
concentrations in the lower horizon as a result of N+P fertilization (Figure 2-2), the solid-
state 13
C NMR spectrum illustrated a slight enhancement in the aromatic and phenolic C
signal of the lower horizon (Figure 2-9b; Table 2-2). A similar observation was made for the
upper horizon of the warming +N+P fertilization treatment where lignin-derived phenols
69
declined (Figure 2-2) but the aromatic and phenolic C signal intensified (Figure 2-9a; Table
2-2). The elevated intensity in the aromatic and phenolic C signal likely did not arise from
suberin because the abundance of suberin-derived components decreased with N+P
fertilization in the lower horizon and with warming +N+P fertilization in the upper horizon
(Figure 2-2; Table A5). The alkyl C signals of their corresponding solid-state 13
C NMR
spectra also decreased (Figure 2-9b; Table 2-2). Warming +N+P fertilization did not alter
lignin phenol concentrations in the lower horizon (Figure 2-2) which corresponds to the lack
of difference in the aromatic and phenolic C signal in the solid-state 13
C NMR spectrum
(Figure 2-9b; Table 2-2).
The Ad/Al ratios also showed no evidence of accelerated lignin oxidation with any of
the treatments, except in the upper horizon of block 4 (Figures 2-5 and 2-6). This will be
discussed in detail below. Fungi are the primary decomposers involved in lignin
depolymerisation and degradation (Hedges et al., 1988). The absence of ergosterol, a fungal
biomarker, from the solvent extracts of all the treatments from both horizons (Table A4),
which indicates low fungal activity (Otto and Simpson, 2005), may support our observation
of suppressed lignin oxidation. Low fungal activity may be attributed to low temperatures in
Arctic environments (Requejo et al., 1991; Pautler et al., 2010). In the upper horizon of block
4, the Ad/Al ratios progressively increased with each treatment (Figure 2-5), which signifies
lignin in the N+P fertilization treatment was the most oxidized while lignin in the warming
+N+P fertilization treatment was the least oxidized. Block 4 behaved differently than the
other blocks, which is evidenced by the distinct decrease in C content with warming only
observed in block 4 (Table 2-1). This enhancement in lignin oxidation in block 4 is not likely
due to fungal activity because ergosterol was not detected in the solvent extracts of the upper
horizon of block 4 (Table A4). Abiotic mechanisms such as photooxidation from the
70
exposure of sunlight may have facilitated lignin oxidation in block 4 (Opsahl and Benner,
1998; Bertilsson et al., 1999; Pautler et al., 2010) but it is unclear why block 4 showed more
lignin oxidation than the other blocks. Localized environmental controls, such as moisture
content, may have also played a role in lignin oxidation.
The CuO oxidation extracts of these Arctic soils were mostly dominated by vanillyl
and syringyl monomers (Figures 2-3 and 2-4), which suggests that the SOM likely originated
from angiosperm sources (Hedges and Mann, 1979). These angiosperm sources are likely to
be the overlying vegetation predominantly comprised of woody shrubs such as B. nana and
tussock-forming sedges such as E. vaginatum (Ping et al., 1998). The S/V and C/V ratios
declined in the upper and lower horizons with all the treatments (Figures 2-7 and 2-8), which
indicates that the lignin may have been derived from woody angiosperms (Hedges and Mann,
1979). Warming, N+P fertilization and their combined treatment may have promoted the
growth of woody angiosperms such as B. nana (Michaelson et al., 1996), and the
decomposed litter from these woody angiosperms may have contributed lignin inputs into the
soil. The S/V and C/V ratios of both horizons of the warming treatment from block 2
(Figures 2-7 and 2-8) signified that lignin may have been derived from nonwoody
angiosperms such as E. vaginatum (Hedges and Mann, 1979). These nonwoody angiosperms
were likely more abundant before warming conditions were established (Hobbie, 1996). The
extent of vertical mixing between horizons (Ping et al., 1998) likely varied across the
landscape. In block 2, vertical mixing may have been more pronounced, causing newer lignin
from woody angiosperms to be embedded in lower horizons and older lignin from nonwoody
angiosperms to be exposed in the upper horizons.

71
2.5.5 Implications on warming and N+P fertilizer addition on SOM degradation
It is important to acknowledge that spatial heterogeneity among the blocks was likely
an important factor behind the variable responses from each treatment. Spatial heterogeneity
in SOM can be ascribed to the topography of the site (Burke et al., 1999; Hook and Burke,
2000; Schöning et al., 2006; Spielvogel et al., 2016). SOM composition may be largely
reflective of topographical controls such as water distribution in soils, vegetative inputs and
soil horizon development (Hook and Burke, 2000). For example, the topography of the
landscape may alter soil moisture content, such that areas at lower elevation tend to promote
the accumulation of water caused by poor drainage (Mishra and Riley, 2015). Areas at higher
elevation will have drier conditions from better drainage (Mishra and Riley, 2015). Plant
inputs into the soil may also contribute to spatial variation in SOM composition since
different types of vegetation produce litter of varying quality (Kristensen et al., 2015). Since
water distribution and plant inputs may regulate soil horizon development (Mishra and Riley,
2015), these factors may have altered the amount of C stocks among the blocks, thus
contributing to the spatial heterogeneity of the site. Furthermore, cryoturbation caused by
repeated freezing and thawing processes mixes soil material, which results in broken and
discontinuous horizons (Ping et al., 1998). Cryoturbation may have promoted vertical mixing
in some blocks more than others, particularly in the warming treatments of blocks 1 and 4
and the warming +N+P fertilization treatment in block 4 (Table 2-1). These cryogenic
processes can also lead to the formation of patterned ground features such as ice wedge
polygons along with sorted and non-sorted polygons (Washburn, 1980; French, 1996; Ping et
al., 1998). As a result, these periglacial features in the landscape can ultimately vary
vegetation growth (Billings et al., 1982), drainage and the depth of the active layer, leading
to distinct differences in soil characteristics within small areas (Tarnocai, 1994; Ping et al.,
72
1998). The biomarker methods and solid-state 13
C NMR techniques employed in this study
were sensitive enough to detect differences in the alteration patterns of SOM composition
among the blocks.
After 32 years of warming, N+P fertilization and warming +N+P fertilization,
although cutin-derived compounds in the upper horizon soils slightly increased (Figure 2-1;
Table A5), the abundance of long-chain n-alkanes derived from epicuticular waxes
(Simoneit, 2005) did not vary (Table A1), which did not indicate a major enrichment of
aboveground inputs in the upper horizon. In the lower horizon soils, we detected a slight
reduction in suberin-derived compounds with each treatment (Figure 2-1; Table A5). Since
this was not a statistically significant change, this observation suggests belowground inputs
in the lower horizon were not altered by each treatment.
The cutin degradation ratios revealed that warming, N+P fertilization and warming
+N+P fertilization did not enhance cutin degradation in these Arctic soils. This is consistent
with literature findings where cuticle-derived compounds are believed to be chemically
recalcitrant structures (Riederer et al., 1993; Lorenz et al., 2007). Low temperatures and
seasonal ice cover in Arctic environments (Requejo et al., 1991; Pautler et al., 2010) may
have further contributed to the accumulation of these recalcitrant compounds. In the upper
horizon, the alkyl C signal from the solid-state 13
C NMR spectra (Figure 2-9a; Table 2-2) did
not vary as a result of warming and N+P fertilization, which further supports our hypothesis
that cutin degradation was not likely promoted. Despite the decrease in the alkyl C signal in
the solid-state 13
C NMR spectrum of the upper horizon of the warming +N+P fertilization
treatment (Figure 2-9a; Table 2-2), the cutin degradation ratios (Table A5) along with an
increase in cutin-derived compounds (Figure 2-1; Table A5) did not offer evidence for
enhanced cutin degradation. The decline in the alkyl C signals of the solid-state 13
C NMR

73
spectra of the lower horizon soils exhibited by warming and warming +N+P fertilization
(Figure 2-9b; Table 2-2) likely did not arise from accelerated cutin degradation because no
differences were detected in the cutin degradation ratios (Table A5) and cutin-derived inputs
(Figure 2-2; Table A5) under these treatments. N+P fertilization elicited decreases in cutin-
and suberin-derived compounds in the lower horizon (Figure 2-2; Table A5) which
corresponded to a reduction in the alkyl C signal of the solid-state 13
C NMR spectrum
(Figure 2-9b; Table 2-2), although the cutin degradation ratios did not indicate any
enhancement in cutin degradation. In addition, the Ad/Al ratios did not vary overall in
response to warming, N+P fertilization and warming +N+P fertilization (Figures 2-5 and 2-6)
which did not suggest any acceleration in lignin oxidation with each treatment, may be
attributable to low fungal activity. This is further supported by the lack of enhancement in the
aromatic and phenolic C signal of the solid-state 13
C NMR spectra with each treatment
(Figure 2-9; Table 2-2). The relatively low abundances of lignin-derived phenols from the
CuO oxidation extracts (Figures 2-1 to 2-4) were consistent with the less intense aromatic
and phenolic C signals from the solid-state 13
C NMR spectra (Figure 2-9; Table 2-2), which
collectively provide little evidence of lignin cycling in these Arctic soils.
2.6 Conclusions
Molecular-level techniques including biomarker analyses and solid-state 13
C NMR
spectroscopy were employed to investigate the extent of SOM degradation in Arctic soils
after 32 years of warming, N+P fertilization and warming +N+P fertilization. The blocks
showed variable responses to each treatment, likely caused by spatial heterogeneity. These
results suggest that in a complex landscape impacted by cryoturbation, alterations in SOM
composition may vary because of differences in water distribution, plant inputs and soil
horizon development. Due to the spatial variability at this site in Toolik Lake, Alaska,

74
additional long-term field warming and fertilization studies should be conducted at multiple
locations within this region to confirm whether our observations are unique to this site.

75
2.7 References
Aerts, R., 2006. The freezer defrosting: global warming and litter decomposition rates in cold
biomes. Journal of Ecology 94, 712-724.
Amelung, W., Brodowski, S., Sandhage-Hofmann, A., Bol, R., 2009. Combining biomarker
with stable isotope analyses for assessing the transformation and turnover of soil organic
matter. Advances in Agronomy 100, 155-250.
Baker, E.A., 1982. The Plant Cuticle. Linnean Society Symposium Series 10. In: Cutler,
D.F., Alvin, K.L., Price, C.E. (Eds.), Chemistry and Morphology of Plant Epicuticular
Waxes. Academic Press, London, UK.
Baldock, J.A., Oades, J.M., Waters, A.G., Peng, X., Vassallo, A.M., Wilson, M.A., 1992.
Aspects of the chemical structure of soil organic materials as revealed by solid-state 13
C
NMR spectroscopy. Biogeochemistry 16, 1-42.
Bernards, M.A., 2002. Demystifying suberin. Canadian Journal of Botany 80, 227-240.
Bertilsson, S., Stepanauskas, R., Cuadros-Hansson, R., Granéli, W., Wikner, J., Tranvik, L.,
1999. Photochemically induced changes in bioavailable carbon and nitrogen pools in a
Boreal watershed. Aquatic Microbial Ecology 19, 47-56.
Bianchi, G., 1995. Plant Waxes. In: Hamilton, R.J. (Ed.), Waxes: Chemistry, Molecular
Biology and Functions. The Oily Press, Dundee, UK.
Billings, W.D., Luken, J.O., Mortensen, D.A., Peterson, K.M., 1982. Arctic tundra: A source
or sink for atmospheric carbon dioxide in a changing environment? Oecologia 53, 7-11.
Bockheim, J.G., Tarnocai, C., 1998. Recognition of cryoturbation for classifying permafrost-
affected soils. Geoderma 81, 281-293.
Burke, I.C., Lauenroth, W.K., Riggle, R., Brannen, P., Madigan, B., Beard, S., 1999. Spatial
variability of soil properties in the shortgrass steppe: The relative importance of topography,
grazing, microsite, and plant species in controlling spatial patterns. Ecosystems 2, 422-438.
Chapin, F.S., 1983. Direct and indirect effects of temperature on Arctic plants. Polar Biology
2, 47-52.
Clemmensen, K.E., Michelsen, A., Jonasson, S., Shaver, G.R., 2006. Increased
ectomycorrhizal fungal abundance after long-term fertilization and warming of two Arctic
tundra ecosystems. New Phytologist 171, 391-404.
Conte, P., Spaccini, R., Piccolo, A., 2004. State of the art of CPMAS 13
C-NMR spectroscopy
applied to natural organic matter. Progress in Nuclear Magnetic Resonance Spectroscopy 44,
215-223.
Currie, W.S., Aber, J.D., Mcdowell, W.H., Boone, R.D., Magill, A.H., 1996. Vertical
transport of dissolved organic C and N under long-term N amendments in pine and hardwood
forests. Biogeochemistry 35, 471-505.
76
Davidson, E.A., Janssens, I.A., 2006. Temperature sensitivity of soil carbon decomposition
and feedbacks to climate change. Nature 440, 165-173.
Deslippe, J.R., Hartmann, M., Mohn, W.W., Simard, S.W., 2011. Long-term experimental
manipulation of climate alters the ectomycorrhizal community of Betula nana in Arctic
tundra. Global Change Biology 17, 1625-1636.
Ertel, J.R., Hedges, J.I., 1984. The lignin component of humic substances: Distribution
among soil and sedimentary humic, fulvic, and base-insoluble fractions. Geochimica et
Cosmochimica Acta 48, 2065-2074.
Feng, X., Simpson, M.J., 2011. Molecular-level methods for monitoring soil organic matter
responses to global climate change. Journal of Environmental Monitoring 13, 1246-1254.
French, H.M., 1996. The Periglacial Environment 2nd
Ed. Longman, White Plains, NY, USA.
Goñi, M.A., Yunker, M.B., MacDonald, R.W., Eglinton, T.I., 2000. Distribution and sources
of organic biomarkers in Arctic sediments from the Mackenzie River and Beaufort Shelf.
Marine Chemistry 71, 23-51.
Gregorich, E.G., Turchenek, L.W., Carter, M.R., Angers, D.A. (Eds.), 2001. Soil and
Environmental Science Dictionary. CRC Press, Boca Raton, FL, USA, 577 pp.
Harwood, J.L., Russel, N.J., 1984. Lipids in Plants and Microbes. George Allen and Unwin,
London, UK.
Hatcher, P.G., Breger, I.A., Dennis, L.W., Maciel, G.E., 1983. Aquatic and Terrestrial Humic
Materials. In: Christman, R.F., Gjessing, E.T. (Eds.), Ann Arbor Science Publishers, MI,
USA, pp. 37-81.
Hayes, D., McGuire, A.D., Kicklighter, D.W., Gurney, K.R., Burnside, T., Melillo, J.M.,
2011. Is the northern high-latitude land-based CO2 sink weakening? Global Biogeochemical
Cycles 25, GB3018.
Hedges, J.I., Blanchette, R.A., Weliky, K., Devol, A.H., 1988. Effects of fungal degradation
on the CuO oxidation products of lignin: A controlled laboratory study. Geochimica et
Cosmochimica Acta 52, 2717-2726.
Hedges, J.I., Ertel, J.R., 1982. Characterization of lignin by gas capillary chromatography of
cupric oxide oxidation products. Analytical Chemistry 54, 174-178.
Hedges, J.I., Mann, D.C., 1979. The characterization of plant tissues by their lignin oxidation
products. Geochimica et Cosmochimica Acta 43, 1803-1807.
Hobbie, J.E., 1995. Long term measurements at the Arctic LTER site. Ecological time series
394-409.
Hobbie, S.E., 1996. Temperature and plant species control over litter decomposition in
Alaskan tundra. Ecological Monographs 66, 503-522.

77
Hobbie, S.E., Nadelhoffer, K.J., Högberg, P., 2002. A synthesis: The role of nutrients as
constraints on carbon balances in Boreal and Arctic regions. Plant and Soil 242, 163-170.
Holloway, P.J., 1982. The Chemical Composition of Plant Cutins. In: Cutler, D.F., Alvin,
K.L., Price, C.E. (Eds.), The Plant Cuticle. Linnean Society Symposium Series 10. Academic
Press, London, UK, pp. 45-85.
Hook, P.B., Burke, I.C., 2000. Biogeochemistry in a shortgrass landscape: Control by
topography, soil texture, and microclimate. Ecology 81, 2686-2703.
Kaiser, K., Benner, R., 2012. Characterization of lignin by gas chromatography and mass
spectrometry using a simplified CuO oxidation method. Analytical Chemistry 84, 459-464.
Kögel-Knabner, I., 2002. The macromolecular organic composition of plant and microbial
residues as inputs to soil organic matter. Soil Biology and Biochemistry 34, 139-162.
Kolattukudy, P.E., Espelie, K.E., 1989. Chemistry, Biochemistry, and Function of Suberin
and Associated Waxes. In: Rowe, J.W. (Ed.), Natural Products of Woody Plants I. Springer,
Berlin, Germany, pp. 304-367.
Kolattukudy, P.E., 1980. Biopolyester membranes of plants: Cutin and suberin. Science 208,
990-1000.
Koven, C.D., Ringeval, B., Friedlingstein, P., Ciais, P., Cadule, P., Khvorostyanov, D.,
Krinner, G., Tarnocai, C., 2011. Permafrost carbon-climate feedbacks accelerate global
warming. Proceedings of the National Academy of Sciences of the United States of America
108, 14769-14774.
Kristensen, T., Ohlson, M., Bolstad, P., Nagy, Z., 2015. Spatial variability of organic layer
thickness and carbon stocks in mature Boreal forest stands—implications and suggestions for
sampling designs. Environmental Monitoring and Assessment 187, 521.
Lichtfouse, É., Berthier, G., Houot, S., Barriuso, E., Bergheaud, V., Vallaeys, T., 1995.
Stable carbon isotope evidence for the microbial origin of C14-C18 n-alkanoic acids in soils.
Organic Geochemistry 23, 849-852.
Lorenz, K., Lal, R., Preston, C.M., Nierop, K.G.J., 2007. Strengthening the soil organic
carbon pool by increasing contributions from recalcitrant aliphatic bio(macro)molecules.
Geoderma 142, 1-10.
MacDougall, A.H., Avis, C.A., Weaver, A.J., 2012. Significant contribution to climate
warming from the permafrost carbon feedback. Nature Geoscience 5, 719-721.
Mack, M.C., Schuur, E.A.G., Bret-Harte, M.S., Shaver, G.R., Chapin, F.S., 2004. Ecosystem
carbon storage in Arctic tundra reduced by long-term nutrient fertilization. Nature 431, 440-
443.
Mackenzie, A.S., Brassell, S.C., Eglinton, G., Maxwell, J.R., 1982. Chemical fossils: The
geological fate of steroids. Science 217, 491-504.

78
Michaelson, G.J., Ping, C.L., Kimble, J.M., 1996. Carbon storage and distribution in tundra
soils of Arctic Alaska, USA. Arctic and Alpine Research 28, 414-424.
Mishra, U., Riley, W.J., 2015. Scaling impacts on environmental controls and spatial
heterogeneity of soil organic carbon stocks. Biogeosciences 12, 3993-4004.
Nadelhoffer, K.J., Giblin, A.E., Shaver, G.R., Linkins, A.E., 1992. Arctic Ecosystems in a
Changing Climate: An Ecophysiological Perspective. In: Chapin, F.S., Jefferies, R.L.,
Reynolds, J.F., Shaver, G.R., Svoboda, J. (Eds.), Microbial Processes and Plant Nutrient
Availability in Arctic Soils. Academic Press, San Diego, USA, pp. 281-300.
Opsahl, S., Benner, R., 1998. Photochemical reactivity of dissolved lignin in river and ocean
waters. Limnology and Oceanography 43, 1297-1304.
Osterkamp, T.E., Romanovsky, V.E., 1999. Evidence for warming and thawing of
discontinuous permafrost in Alaska. Permafrost and Periglacial Processes 10, 17-37.
Otto, A., Simpson, M.J., 2007. Analysis of soil organic matter biomarkers by sequential
chemical degradation and gas chromatography - mass spectrometry. Journal of Separation
Science 30, 272-282.
Otto, A., Simpson, M.J., 2006a. Evaluation of CuO oxidation parameters for determining the
source and stage of lignin degradation in soil. Biogeochemistry 80, 121-142.
Otto, A., Simpson, M.J., 2006b. Sources and composition of hydrolysable aliphatic lipids and
phenols in soils from Western Canada. Organic Geochemistry 37, 385-407.
Otto, A., Simpson, M.J., 2005. Degradation and preservation of vascular plant-derived
biomarkers in grassland and forest soils from Western Canada. Biogeochemistry 74, 377-
409.
Pautler, B.G., Austin, J., Otto, A., Stewart, K., Lamoureux, S.F., Simpson, M.J., 2010.
Biomarker assessment of organic matter sources and degradation in Canadian High Arctic
littoral sediments. Biogeochemistry 100, 75-87.
Peterson, R.A., 2003. Permafrost: Proceedings of the Eighth International Conference on
Permafrost. In: Phillips, M., Springman, S.M., Arenson, L.U. (Eds.), A. A. Balkema
Publishers, Lisse, Netherlands, pp. 885-890.
Ping, C.L., Bockheim, J.G., Kimble, J.M., Michaelson, G.J., Walker, D.A., 1998.
Characteristics of cryogenic soils along a latitudinal transect in Arctic Alaska. Journal of
Geophysical Research Atmospheres 103, 28917-28928.
Ping, C.L., Michaelson, G.J., Jorgenson, M.T., Kimble, J.M., Epstein, H., Romanovsky,
V.E., Walker, D.A., 2008. High stocks of soil organic carbon in the North American Arctic
region. Nature Geoscience 1, 615-619.
Pisani, O., Frey, S.D., Simpson, A.J., Simpson, M.J., 2015. Soil warming and nitrogen
deposition alter soil organic matter composition at the molecular-level. Biogeochemistry 123,
391.

79
Pisani, O., Hills, K.M., Courtier-Murias, D., Simpson, A.J., Mellor, N.J., Paul, E.A., Morris,
S.J., Simpson, M.J., 2013. Molecular level analysis of long term vegetative shifts and
relationships to soil organic matter composition. Organic Geochemistry 62, 7-16.
Prahl, F.G., Ertel, J.R., Goni, M.A., Sparrow, M.A., Eversmeyer, B., 1994. Terrestrial
organic carbon contributions to sediments on the Washington Margin. Geochimica et
Cosmochimica Acta 58, 3035-3048.
Qian, H., Joseph, R., Zeng, N., 2010. Enhanced terrestrial carbon uptake in the northern high
latitudes in the 21st century from the coupled carbon cycle climate model intercomparison
project model projections. Global Change Biology 16, 641-656.
Requejo, A.G., Brown, J.S., Boehm, P.D., Sauer, T.C., 1991. Lignin geochemistry of North
American coastal and continental shelf sediments. Organic Geochemistry 17, 649-662.
Riederer, M., Matzke, K., Ziegler, F., Kögel-Knabner, I., 1993. Occurrence, distribution and
fate of the lipid plant biopolymers cutin and suberin in temperate forest soils. Organic
Geochemistry 20, 1063-1076.
Rumpel, C., Rabia, N., Derenne, S., Quenea, K., Eusterhues, K., Kögel-Knabner, I., Mariotti,
A., 2006. Alteration of soil organic matter following treatment with hydrofluoric acid (HF).
Organic Geochemistry 37, 1437-1451.
Salloum, M.J., Chefetz, B., Hatcher, P.G., 2002. Phenanthrene sorption by aliphatic-rich
natural organic matter. Environmental Science and Technology 36, 1953-1958.
Schaefer, K., Zhang, T., Bruhwiler, L., Barrett, A.P., 2011. Amount and timing of permafrost
carbon release in response to climate warming. Tellus, Series B: Chemical and Physical
Meteorology 63, 165-180.
Schlesinger, W.H., Andrews, J.A., 2000. Soil respiration and the global carbon cycle.
Biogeochemistry 48, 7-20.
Schöning, I., Totsche, K.U., Kögel-Knabner, I., 2006. Small scale spatial variability of
organic carbon stocks in litter and solum of a forested Luvisol. Geoderma 136, 631-642.
Serreze, M.C., Walsh, J.E., Chapin, F.S., Osterkamp, T., Dyurgerov, M., Romanovsky, V.,
Oechel, W.C., Morison, J., Zhang, T., Barry, R.G., 2000. Observational evidence of recent
change in the northern high-latitude environment. Climatic Change 46, 159-207.
Shaver, G.R., 1996. Integrated Ecosystem Research in Northern Alaska, 1947–1994. In:
Reynolds, J., Tenhunen, J.D. (Eds.), Landscape Function and Disturbance in Arctic Tundra.
Springer-Verlag Ecological Studies Series. Springer-Verlag, Heidelberg, Germany, pp. 19-
34.
Shaver, G.R., Giblin, A.E., Nadelhoffer, K.J., Thieler, K.K., Downs, M.R., Laundre, J.A.,
Rastetter, E.B., 2006. Carbon turnover in Alaskan tundra soils: Effects of organic matter
quality, temperature, moisture and fertilizer. Journal of Ecology 94, 740-753.

80
Shaver, G.R., Jonasson, S., 1999. Response of Arctic ecosystems to climate change: Results
of long-term field experiments in Sweden and Alaska. Polar Research 18, 245-252.
Shaver, G.R., Laundre, J.A., Syndonia Bret-Harte, M., Chapin, F.S., Mercado-Díaz, J.A.,
Giblin, A.E., Gough, L., Gould, W.A., Hobbie, S.E., Kling, G.W., Mack, M.C., Moore, J.C.,
Nadelhoffer, K.J., Rastetter, E.B., Schimel, J.P., 2014. Terrestrial Ecosystems at Toolik
Lake, Alaska. In: Hobbie, J.E., Kling, G.W. (Eds.), Alaska's Changing Arctic: Ecological
Consequences for Tundra, Streams, and Lakes. Oxford University Press, New York, USA,
pp. 90-142.
Simoneit, B.R.T., 2005. A review of current applications of mass spectrometry for
biomarker/molecular tracer elucidations. Mass Spectrometry Reviews 24, 719-765.
Simoneit, B.R.T., Elias, V.O., Kobayashi, M., Kawamura, K., Rushdi, A.I., Medeiros, P.M.,
Rogge, W.F., Didyk, B.M., 2004. Sugars - dominant water-soluble organic compounds in
soils and characterization as tracers in atmospheric participate matter. Environmental Science
and Technology 38, 5939-5949.
Simpson, A.J., Simpson, M.J., Soong, R., 2012. Nuclear magnetic resonance spectroscopy
and its key role in environmental research. Environmental Science and Technology 46,
11488-11496.
Simpson, M.J., Otto, A., Feng, X., 2008. Comparison of solid-state carbon-13 nuclear
magnetic resonance and organic matter biomarkers for assessing soil organic matter
degradation. Soil Science Society of America Journal 72, 268-276.
Simpson, M.J., Simpson, A.J., 2012. The chemical ecology of soil organic matter molecular
constituents. Journal of Chemical Ecology 38, 768-784.
Spielvogel, S., Prietzel, J., Kögel-Knabner, I., 2016. Stand scale variability of topsoil organic
matter composition in a high-elevation Norway Spruce forest ecosystem. Geoderma 267,
112-122.
Sturm, M., Schimel, J., Michaelson, G., Welker, J.M., Oberbauer, S.F., Liston, G.E.,
Fahnestock, J., Romanovsky, V.E., 2005. Winter biological processes could help convert
Arctic tundra to shrubland. Bioscience 55, 17-26.
Tarnocai, C., 1994. Genesis of Permafrost-Affected Soils. In: Kimble, J.M., Ahrens, R.J.
(Eds.), Proceedings of the Meetings of the Classification, Correlation and Management of
Permafrost-Affected Soils. USDA Soil Conservation Service National Soil Survey Centre,
Lincoln, Nebraska, USA, pp. 143-154.
Tarnocai, C., Smith, C.A.S., 1992. Proceedings of the first international conference on
cryopedology. Russian Academic of Sciences, Pushchino, Russia, pp. 21-42.
Tarnocai, C., Canadell, J.G., Schuur, E.A.G., Kuhry, P., Mazhitova, G., Zimov, S., 2009. Soil
organic carbon pools in the northern circumpolar permafrost region. Global Biogeochemical
Cycles 23, GB2023.
81
Tulloch, A.P., 1976. Epicuticular wax of Agropyron smithii leaves. Phytochemistry 15, 1153-
1156.
Van Wijk, M.T., Clemmensen, K.E., Shaver, G.R., Williams, M., Callaghan, T.V., Chapin,
F.S., Cornelissen, J.H.C., Gough, L., Hobbie, S.E., Jonasson, S., Lee, J.A., Michelsen, A.,
Press, M.C., Richardson, S.J., Rueth, H., 2004. Long-term ecosystem level experiments at
Toolik Lake, Alaska, and at Abisko, Northern Sweden: Generalizations and differences in
ecosystem and plant type responses to global change. Global Change Biology 10, 105-123.
Washburn, A.L., 1980. Geocryology: A Survey of Periglacial Processes and Environments.
John Wiley, New York, USA.
Williams, P.J., Smith, M.W., 1989. The Frozen Earth: Fundamentals of Geocryology.
Cambridge University Press, New York, USA, 306 pp.
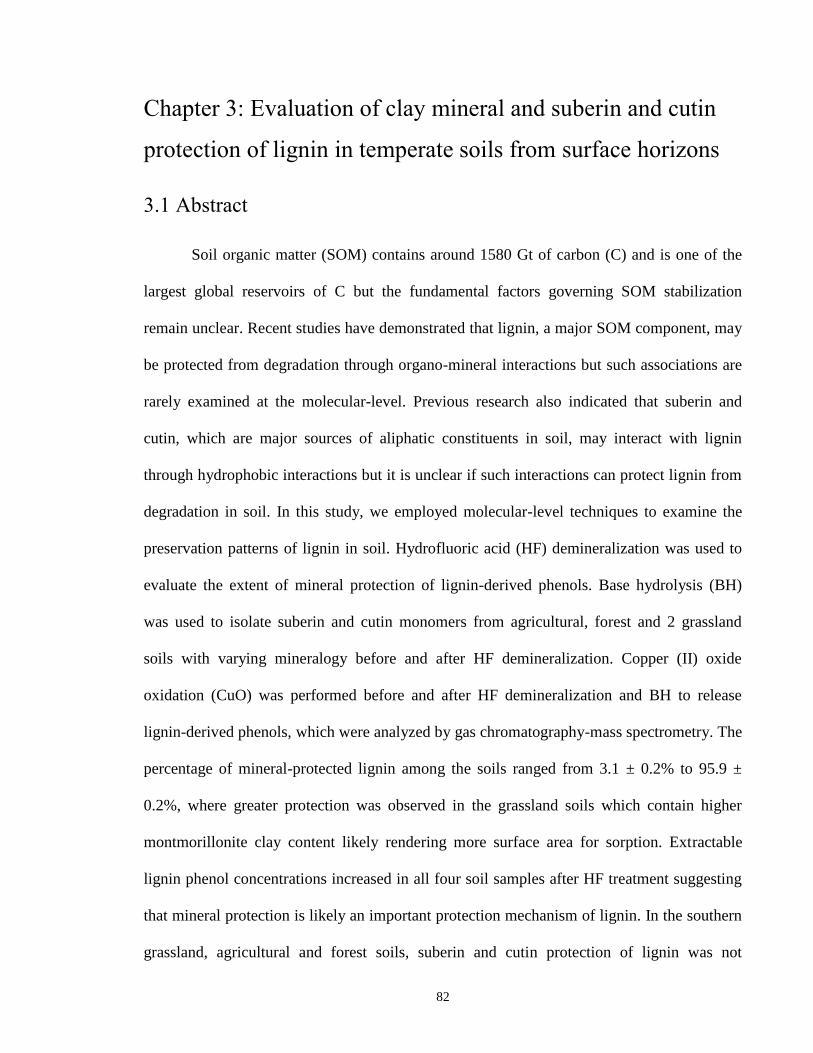
82
Chapter 3: Evaluation of clay mineral and suberin and cutin
protection of lignin in temperate soils from surface horizons
3.1 Abstract
Soil organic matter (SOM) contains around 1580 Gt of carbon (C) and is one of the
largest global reservoirs of C but the fundamental factors governing SOM stabilization
remain unclear. Recent studies have demonstrated that lignin, a major SOM component, may
be protected from degradation through organo-mineral interactions but such associations are
rarely examined at the molecular-level. Previous research also indicated that suberin and
cutin, which are major sources of aliphatic constituents in soil, may interact with lignin
through hydrophobic interactions but it is unclear if such interactions can protect lignin from
degradation in soil. In this study, we employed molecular-level techniques to examine the
preservation patterns of lignin in soil. Hydrofluoric acid (HF) demineralization was used to
evaluate the extent of mineral protection of lignin-derived phenols. Base hydrolysis (BH)
was used to isolate suberin and cutin monomers from agricultural, forest and 2 grassland
soils with varying mineralogy before and after HF demineralization. Copper (II) oxide
oxidation (CuO) was performed before and after HF demineralization and BH to release
lignin-derived phenols, which were analyzed by gas chromatography-mass spectrometry. The
percentage of mineral-protected lignin among the soils ranged from 3.1 ± 0.2% to 95.9 ±
0.2%, where greater protection was observed in the grassland soils which contain higher
montmorillonite clay content likely rendering more surface area for sorption. Extractable
lignin phenol concentrations increased in all four soil samples after HF treatment suggesting
that mineral protection is likely an important protection mechanism of lignin. In the southern
grassland, agricultural and forest soils, suberin and cutin protection of lignin was not
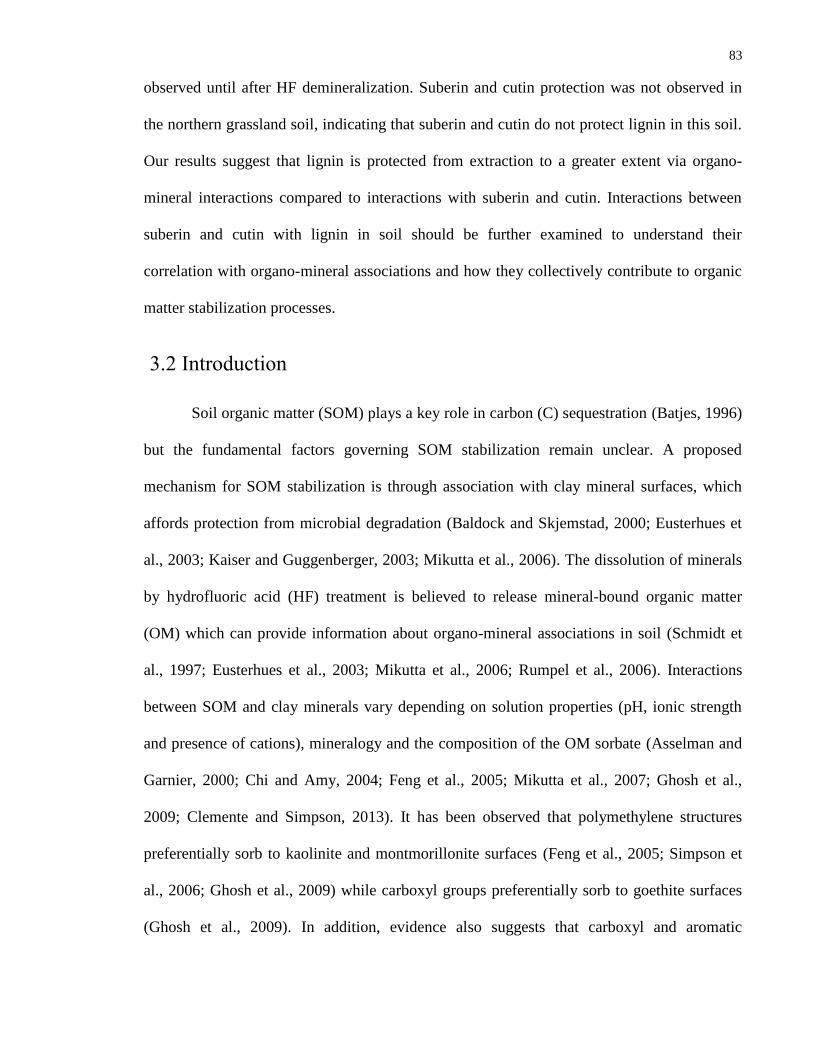
83
observed until after HF demineralization. Suberin and cutin protection was not observed in
the northern grassland soil, indicating that suberin and cutin do not protect lignin in this soil.
Our results suggest that lignin is protected from extraction to a greater extent via organo-
mineral interactions compared to interactions with suberin and cutin. Interactions between
suberin and cutin with lignin in soil should be further examined to understand their
correlation with organo-mineral associations and how they collectively contribute to organic
matter stabilization processes.
3.2 Introduction
Soil organic matter (SOM) plays a key role in carbon (C) sequestration (Batjes, 1996)
but the fundamental factors governing SOM stabilization remain unclear. A proposed
mechanism for SOM stabilization is through association with clay mineral surfaces, which
affords protection from microbial degradation (Baldock and Skjemstad, 2000; Eusterhues et
al., 2003; Kaiser and Guggenberger, 2003; Mikutta et al., 2006). The dissolution of minerals
by hydrofluoric acid (HF) treatment is believed to release mineral-bound organic matter
(OM) which can provide information about organo-mineral associations in soil (Schmidt et
al., 1997; Eusterhues et al., 2003; Mikutta et al., 2006; Rumpel et al., 2006). Interactions
between SOM and clay minerals vary depending on solution properties (pH, ionic strength
and presence of cations), mineralogy and the composition of the OM sorbate (Asselman and
Garnier, 2000; Chi and Amy, 2004; Feng et al., 2005; Mikutta et al., 2007; Ghosh et al.,
2009; Clemente and Simpson, 2013). It has been observed that polymethylene structures
preferentially sorb to kaolinite and montmorillonite surfaces (Feng et al., 2005; Simpson et
al., 2006; Ghosh et al., 2009) while carboxyl groups preferentially sorb to goethite surfaces
(Ghosh et al., 2009). In addition, evidence also suggests that carboxyl and aromatic
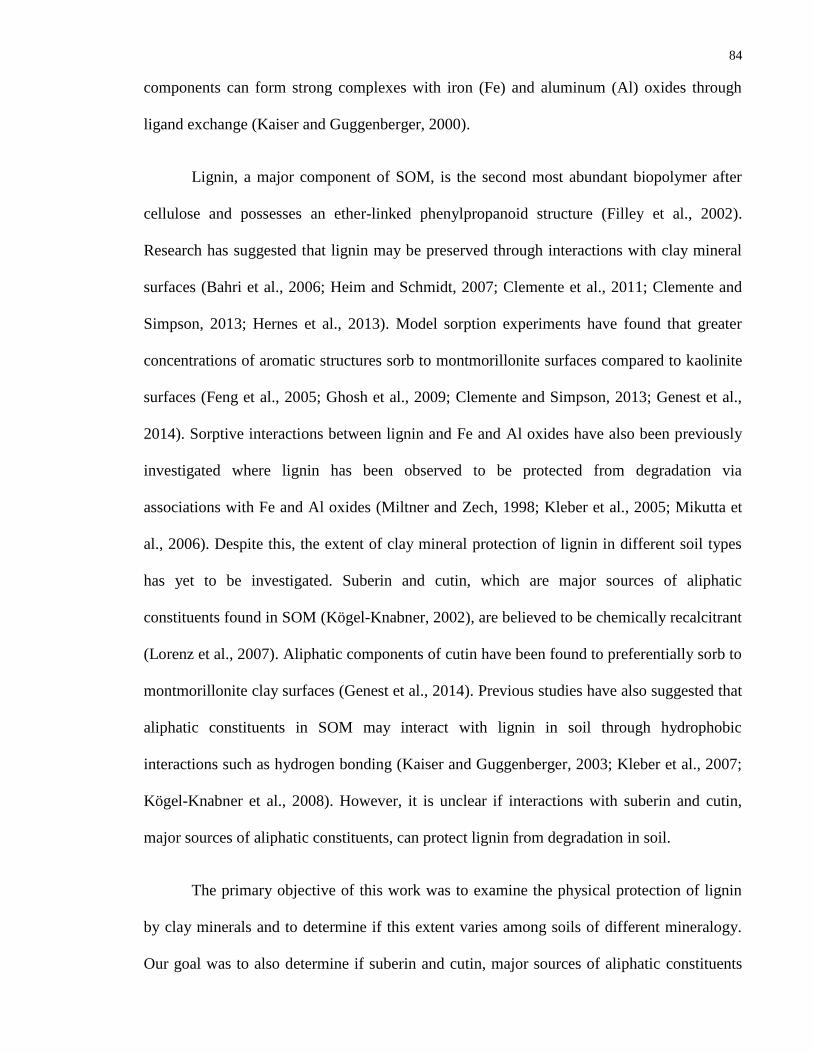
84
components can form strong complexes with iron (Fe) and aluminum (Al) oxides through
ligand exchange (Kaiser and Guggenberger, 2000).
Lignin, a major component of SOM, is the second most abundant biopolymer after
cellulose and possesses an ether-linked phenylpropanoid structure (Filley et al., 2002).
Research has suggested that lignin may be preserved through interactions with clay mineral
surfaces (Bahri et al., 2006; Heim and Schmidt, 2007; Clemente et al., 2011; Clemente and
Simpson, 2013; Hernes et al., 2013). Model sorption experiments have found that greater
concentrations of aromatic structures sorb to montmorillonite surfaces compared to kaolinite
surfaces (Feng et al., 2005; Ghosh et al., 2009; Clemente and Simpson, 2013; Genest et al.,
2014). Sorptive interactions between lignin and Fe and Al oxides have also been previously
investigated where lignin has been observed to be protected from degradation via
associations with Fe and Al oxides (Miltner and Zech, 1998; Kleber et al., 2005; Mikutta et
al., 2006). Despite this, the extent of clay mineral protection of lignin in different soil types
has yet to be investigated. Suberin and cutin, which are major sources of aliphatic
constituents found in SOM (Kögel-Knabner, 2002), are believed to be chemically recalcitrant
(Lorenz et al., 2007). Aliphatic components of cutin have been found to preferentially sorb to
montmorillonite clay surfaces (Genest et al., 2014). Previous studies have also suggested that
aliphatic constituents in SOM may interact with lignin in soil through hydrophobic
interactions such as hydrogen bonding (Kaiser and Guggenberger, 2003; Kleber et al., 2007;
Kögel-Knabner et al., 2008). However, it is unclear if interactions with suberin and cutin,
major sources of aliphatic constituents, can protect lignin from degradation in soil.
The primary objective of this work was to examine the physical protection of lignin
by clay minerals and to determine if this extent varies among soils of different mineralogy.
Our goal was to also determine if suberin and cutin, major sources of aliphatic constituents

85
found in SOM, can protect lignin from degradation in soil. An additional aim was to assess
the correlation between the clay mineral and the suberin and cutin protection mechanisms of
lignin by establishing if one protection mechanism plays a more dominant role than the other.
To achieve these objectives, we applied a molecular-level approach to investigate grassland,
agricultural and forest soils. HF demineralization was performed to examine the extent of
clay mineral protection of lignin. Biomarkers were extracted from non-HF-treated and HF-
treated soil residues by base hydrolysis (BH) and copper (II) oxide (CuO) oxidation to yield
hydrolysable aliphatic lipids and lignin-derived phenols respectively (Otto and Simpson,
2007), which were quantified using gas chromatography-mass spectrometry. Lignin
monomer concentrations from BH and CuO oxidation extracts were used to assess the extent
of suberin and cutin protection of lignin. We hypothesized that lignin monomer
concentrations would increase after HF treatment once mineral-bound lignin was released,
signifying strong sorptive interactions between clay minerals and lignin. We also
hypothesized lignin monomer concentrations would be greater in CuO oxidation extracts that
have been base hydrolyzed. Performing BH prior to CuO oxidation is expected to release
lignin that was previously non-extractable due to OM protection (Otto and Simpson, 2007).
Lastly, we predicted that clay mineral associations with lignin are substantially stronger than
OM-OM interactions between suberin and cutin with lignin.
3.3 Materials and methods
3.3.1 Description of soil samples and sampling sites
Four soils were collected from various soil environments: grassland, agricultural and
forest. Sample details are listed in Table 3-1.
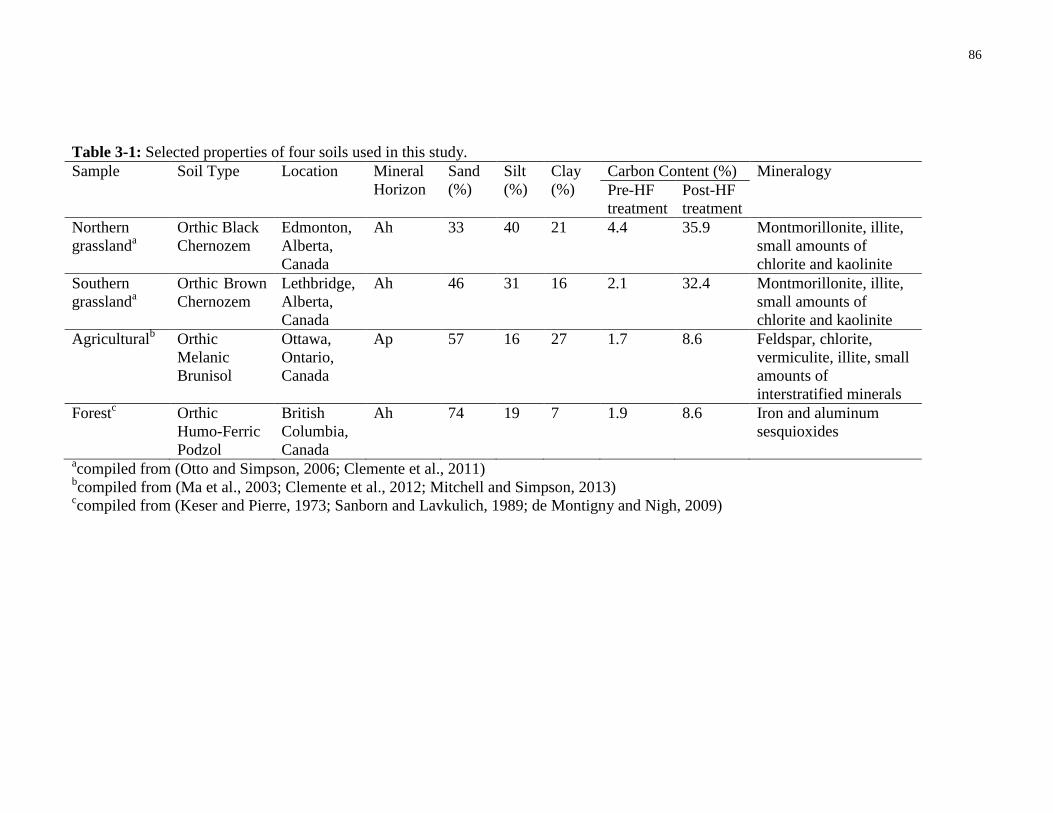
86
Table 3-1: Selected properties of four soils used in this study.
Sample Soil Type Location Mineral
Horizon
Sand
(%)
Silt
(%)
Clay
(%)
Carbon Content (%) Mineralogy
Pre-HF
treatment
Post-HF
treatment
Northern
grasslanda
Orthic Black
Chernozem
Edmonton,
Alberta,
Canada
Ah 33 40 21 4.4 35.9 Montmorillonite, illite,
small amounts of
chlorite and kaolinite
Southern
grasslanda
Orthic Brown
Chernozem
Lethbridge,
Alberta,
Canada
Ah 46 31 16 2.1 32.4 Montmorillonite, illite,
small amounts of
chlorite and kaolinite
Agriculturalb Orthic
Melanic
Brunisol
Ottawa,
Ontario,
Canada
Ap 57 16 27 1.7 8.6 Feldspar, chlorite,
vermiculite, illite, small
amounts of
interstratified minerals
Forestc
Orthic
Humo-Ferric
Podzol
British
Columbia,
Canada
Ah 74 19 7 1.9 8.6 Iron and aluminum
sesquioxides
acompiled from (Otto and Simpson, 2006; Clemente et al., 2011)
bcompiled from (Ma et al., 2003; Clemente et al., 2012; Mitchell and Simpson, 2013)
ccompiled from (Keser and Pierre, 1973; Sanborn and Lavkulich, 1989; de Montigny and Nigh, 2009)
87
The northern grassland soil (Orthic Black Chernozem) was collected from the University of
Alberta Ellerslie Research Station in Edmonton, Alberta, Canada (Clemente et al., 2012)
while the southern grassland soil (Orthic Brown Chernozem) was collected from Lethbridge,
Alberta, Canada (Clemente and Simpson, 2013). These grassland soils both developed in an
arid to semi-arid climate and had a pH range of 6.0-6.9. Both soils possess a loam to clay
loam texture and contain montmorillonite and illite as well as chlorite and kaolinite to a
lesser extent (Otto and Simpson, 2006; Clemente and Simpson, 2013). Western Wheatgrass
(Agropyron smithii) was the dominant vegetation overlying both grassland soils (Otto and
Simpson, 2006). Although both soils originated from the Ah mineral horizons of their
respective sites, the C content of the northern grassland soil is slightly higher compared to
that of the southern grassland soil. The mean annual temperature for the grassland soil sites
ranges from 1.7°C to 3.3°C, while the mean annual precipitation for the northern and
southern grassland soil sites are reported to be 452 mm and 413 mm respectively (Janzen et
al., 1998; Otto and Simpson, 2006). The agricultural soil (Orthic Melanic Brunisol) was
sampled in 2007 from Agriculture and Agri-Food Canada’s Central Experimental Farm
located in Ottawa, Ontario, Canada, which had been under maize (Zea Mays L.) monoculture
for 14 years (Clemente et al., 2012). This sample is classified as a sandy clay loam and
contains feldspar, chlorite, vermiculite and illite and other interstratified minerals (MacLean
and Brydon, 1963; Clemente et al., 2012). The agricultural soil site had a mean annual
temperature of 5.8°C and a mean annual precipitation of 880 mm. The forest soil (Orthic
Humo-Ferric Podzol) was sampled in August 2013 from the Silviculture Treatments for
Ecosystem Management in the Sayward (STEMS) long term research installation set up by
the British Columbia Ministry of Forests and Range, near Gray Lake on Vancouver Island,
British Columbia, Canada (de Montigny and Nigh, 2009). Douglas fir (Pseudotsuga
88
menziesii) and western hemlock (Tsuga heterophyllsa) were the overlying vegetation in this
second-growth forest (Churchland et al., 2013), where the mean annual precipitation was
1503 mm and the mean annual temperature was 8.8°C. The forest soil sample possesses a
loamy to sandy-loam texture and contains mostly Fe and Al sesquioxides (Sanborn and
Lavkulich, 1989; de Montigny and Nigh, 2009). All four soil samples were sampled from the
0-15 cm depth. After collection, these soils were air-dried, passed through a 2 mm mesh
sieve, freeze-dried, finely ground using a mortar and pestle and stored at room temperature.
3.3.2 Determination of carbon (C) content
Soil C content was analyzed using a Thermo Flash 2000 elemental analyzer. Samples
were combusted at 950°C and the evolved gases were measured using a thermal conductivity
detector. Inorganic C was measured and was not detected in any of the soil samples.
Therefore, elemental C values represent total organic C (Otto and Simpson, 2006; Pautler et
al., 2010; Clemente and Simpson, 2013). The C content of soil samples were measured
before and after HF demineralization and are reported in Table 3-1.
3.3.3 Biomarker extractions and HF demineralization
Sequential chemical extractions were performed on the whole soil samples to remove
unbound biomarkers by solvent extraction, hydrolysable lipids by BH and finally, lignin-
derived phenols by CuO oxidation (Otto and Simpson, 2007). For solvent extraction, a 15 g
sample of each whole soil sample was sonicated three times for 15 min in 30 ml of DCM,
DCM: MeOH (1:1 v/v) and MeOH respectively. Extraction was repeated 4 times for each
sample to produce 60 g of solvent-extracted soil. The solvent extracts were discarded and the
combined residues were air-dried prior to demineralization and BH (Figure 3-1).
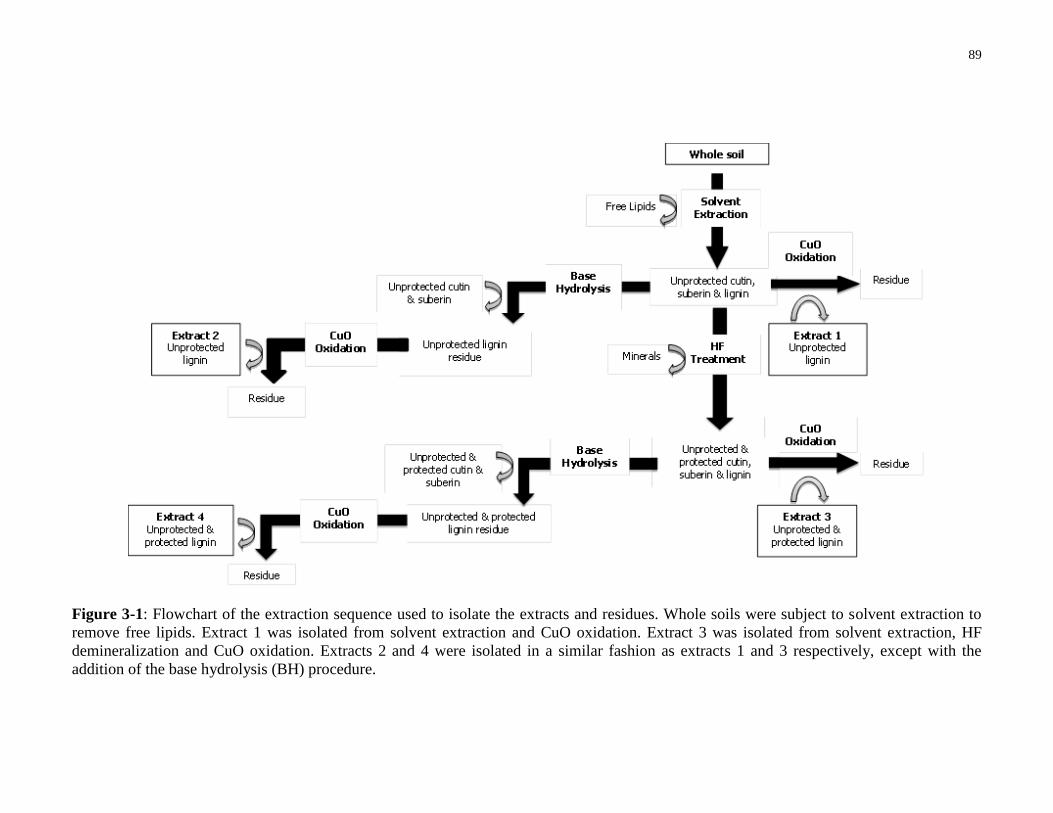
89
Figure 3-1: Flowchart of the extraction sequence used to isolate the extracts and residues. Whole soils were subject to solvent extraction to
remove free lipids. Extract 1 was isolated from solvent extraction and CuO oxidation. Extract 3 was isolated from solvent extraction, HF
demineralization and CuO oxidation. Extracts 2 and 4 were isolated in a similar fashion as extracts 1 and 3 respectively, except with the
addition of the base hydrolysis (BH) procedure.
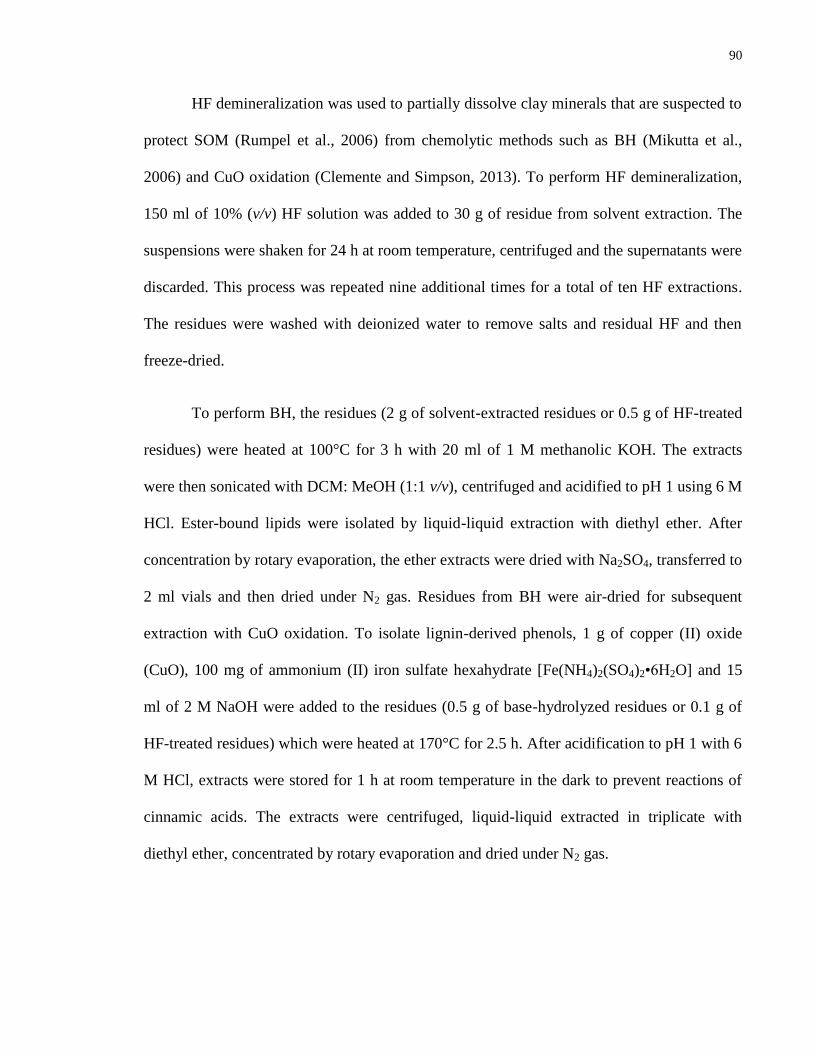
90
HF demineralization was used to partially dissolve clay minerals that are suspected to
protect SOM (Rumpel et al., 2006) from chemolytic methods such as BH (Mikutta et al.,
2006) and CuO oxidation (Clemente and Simpson, 2013). To perform HF demineralization,
150 ml of 10% (v/v) HF solution was added to 30 g of residue from solvent extraction. The
suspensions were shaken for 24 h at room temperature, centrifuged and the supernatants were
discarded. This process was repeated nine additional times for a total of ten HF extractions.
The residues were washed with deionized water to remove salts and residual HF and then
freeze-dried.
To perform BH, the residues (2 g of solvent-extracted residues or 0.5 g of HF-treated
residues) were heated at 100°C for 3 h with 20 ml of 1 M methanolic KOH. The extracts
were then sonicated with DCM: MeOH (1:1 v/v), centrifuged and acidified to pH 1 using 6 M
HCl. Ester-bound lipids were isolated by liquid-liquid extraction with diethyl ether. After
concentration by rotary evaporation, the ether extracts were dried with Na2SO4, transferred to
2 ml vials and then dried under N2 gas. Residues from BH were air-dried for subsequent
extraction with CuO oxidation. To isolate lignin-derived phenols, 1 g of copper (II) oxide
(CuO), 100 mg of ammonium (II) iron sulfate hexahydrate [Fe(NH4)2(SO4)2•6H2O] and 15
ml of 2 M NaOH were added to the residues (0.5 g of base-hydrolyzed residues or 0.1 g of
HF-treated residues) which were heated at 170°C for 2.5 h. After acidification to pH 1 with 6
M HCl, extracts were stored for 1 h at room temperature in the dark to prevent reactions of
cinnamic acids. The extracts were centrifuged, liquid-liquid extracted in triplicate with
diethyl ether, concentrated by rotary evaporation and dried under N2 gas.
91
3.3.4 Derivatization and gas chromatography-mass spectrometry (GC-MS)
Extracts from solvent extraction, BH and CuO oxidation were derivatized with 0.1 ml
of N,O-bis-(trimethylsilyl) trifluoroacetamide (BSTFA) and pyridine at 70°C for 1.5 h. Prior
to this step, 0.5 ml of N,N-Dimethylformamide dimethyl acetal was used to derivatize BH
extracts at 60°C for 30 min. Derivatized extracts were dried under N2 gas, and diluted with
hexane before gas chromatography-mass spectrometry analysis on an Agilent model 6890N
gas chromatograph coupled to an Agilent model 5973 quadrupole mass selective detector
with an Agilent model 7683 autosampler. Gas chromatography separation was achieved on a
HP-5MS fused silica capillary column (30 m x 0.25 mm inner diameter x 0.25 μm film
thickness). The gas chromatograph operating conditions were as follows: initial temperature
held at 65°C for 2 min, temperature increase from 65°C to 300°C at a rate of 6°C/min with a
final temperature of 300°C held for 20 min. Helium was used as a carrier gas with a flow rate
of 1.2 ml/min. Sample injection was achieved with a 2:1 split ratio with the injector
temperature at 280°C. The mass spectrometer was operated in electron impact ionization
mode at 70 eV ionization energy and scanned from m/z 50 to 650. Individual compounds
were assigned by comparison of mass spectra with analytical standards, NIST08 and W9N08
MS libraries and published data. The external quantification standard for ester-bound lipid
extracts was methyl tricosanoate while for lignin-derived phenol extracts, the trimethylsilyl
derivatives of vanillin and vanillic acid were used.
3.3.5 Lignin-derived phenol analysis and calculation of % mineral-protected
lignin and % suberin- and cutin- protected lignin
Eight main lignin-derived phenol monomers were identified and quantified (Hedges
and Ertel, 1982; Otto and Simpson, 2006; Clemente and Simpson, 2013): vanillyls (V;
vanillin, acetovanillone and vanillic acid), syringyls (S; syringaldehyde, acetosyringone and
92
syringic acid) and cinnamyls (C; p-coumaric acid and ferulic acid). VSC is defined as the
total extractable concentrations of the vanillyl, syringyl and cinnamyl monomers.
The percentage of mineral-protected lignin was calculated by determining the
difference between the concentrations of lignin monomers in the non-HF-treated and HF-
treated residues, as denoted in Eqn. 1 as [pre-HF] and [post-HF] respectively (Figure 3-1).
% 𝑚𝑖𝑛𝑒𝑟𝑎𝑙 − 𝑝𝑟𝑜𝑡𝑒𝑐𝑡𝑒𝑑 𝑙𝑖𝑔𝑛𝑖𝑛 = ([𝑝𝑜𝑠𝑡 − 𝐻𝐹] − [𝑝𝑟𝑒 − 𝐻𝐹]
[𝑝𝑜𝑠𝑡 − 𝐻𝐹]) × 100%
= (𝑝𝑟𝑜𝑡𝑒𝑐𝑡𝑒𝑑 𝑙𝑖𝑔𝑛𝑖𝑛
𝑝𝑟𝑜𝑡𝑒𝑐𝑡𝑒𝑑 𝑎𝑛𝑑 𝑢𝑛𝑝𝑟𝑜𝑡𝑒𝑐𝑡𝑒𝑑 𝑙𝑖𝑔𝑛𝑖𝑛) × 100% [𝐸𝑞𝑛. 1]
The post-HF extracts included mineral-protected and unprotected lignin while the pre-HF
extracts only included unprotected lignin. For each lignin-derived phenol, the post-HF
concentration was calculated using the concentration from extract 3 while the pre-HF
concentration was calculated using the concentration from extract 1. This calculation was
repeated to compare the concentrations between extracts 2 [pre-HF] and 4 [post-HF].
The percentage of suberin- and cutin-protected lignin was calculated by determining
the difference between the concentrations of lignin monomers in the non-base-hydrolyzed
and base-hydrolyzed extracts, as indicated in Eqn. 2 as [pre-BH] and [post-BH] respectively
(Figure 3-1).
% 𝑆𝑢𝑏𝑒𝑟𝑖𝑛 𝑎𝑛𝑑 𝑐𝑢𝑡𝑖𝑛 − 𝑝𝑟𝑜𝑡𝑒𝑐𝑡𝑒𝑑 𝑙𝑖𝑔𝑛𝑖𝑛 = ([𝑝𝑜𝑠𝑡 − 𝐵𝐻] − [𝑝𝑟𝑒 − 𝐵𝐻]
[𝑝𝑜𝑠𝑡 − 𝐵𝐻]) × 100%
= (𝑝𝑟𝑜𝑡𝑒𝑐𝑡𝑒𝑑 𝑙𝑖𝑔𝑛𝑖𝑛
𝑝𝑟𝑜𝑡𝑒𝑐𝑡𝑒𝑑 𝑎𝑛𝑑 𝑢𝑛𝑝𝑟𝑜𝑡𝑒𝑐𝑡𝑒𝑑 𝑙𝑖𝑔𝑛𝑖𝑛) × 100% [𝐸𝑞𝑛. 2]
The post-BH extracts included suberin- and cutin-protected and unprotected lignin while the
pre-BH extracts only included unprotected lignin. For each lignin-derived phenol, the post-

93
BH concentration was calculated using the concentration from extract 2 while the pre-BH
concentration was calculated using the concentration from extract 1. This calculation was
repeated to compare the concentrations between extracts 3 [pre-BH] and 4 [post-BH].
3.4 Results and discussion
3.4.1 Carbon (C) content
The C content increased in all soils after HF treatment (Table 3-1) due to enrichment
of SOM by partial demineralization, which is consistent with results from earlier studies
(Eusterhues et al., 2003; Mikutta et al., 2006; Rumpel et al., 2006). After HF treatment, the C
content in the northern grassland soil increased by about 8 times. HF treatment of the
southern grassland soil resulted in a 16 times increase in C content, which was the greatest
increase out of all four soils, indicating that HF demineralization of this soil was most
efficient. The C content of the agricultural and the forest soils increased approximately 4
times, exhibiting the lowest HF demineralization efficiencies out of all four soils (Table 3-1).
3.4.2 Extraction yields of lignin-derived phenols and mineral protection of
lignin
CuO oxidation yielded consistently high concentrations of vanillic acid in all soils
(Table 3-2) with pre-HF concentrations ranging from 20.6 ± 4.9 μg/g soil in the southern
grassland soil to 100.5 ± 5.3 μg/g soil in the forest soil. The post-HF concentrations ranged
from 218.7 ± 24.3 μg/g soil in the agricultural soil to 421.1 ± 27.5 μg/g soil in the forest soil.
Acetovanillone in the southern grassland soil experienced the greatest increase in
concentration after HF treatment: the post-HF concentration of 81.9 ± 11.8 μg/g soil was
almost 27 times greater than the pre-HF concentration of 3.3 ± 1.7 μg/g soil (Table 3-2). Out
of all lignin monomers from each soil, ferulic acid from the southern grassland soil yielded

94
Table 3-2: Concentrations in μg/g soil of eight main lignin-derived phenols released after CuO oxidationa by comparing residues 1 (pre-HF)
and 3 (post-HF). Values were determined from triplicate samples (n = 3), unless otherwise indicated, followed by standard error. Compounds Concentration (μg lignin-derived phenol/g soil)
Northern grassland Southern grassland Agricultural Forest
Pre-HF Post-HF Pre-HF Post-HFb Pre-HF Post-HF Pre-HF Post-HF
Vanillin 10.0 ± 2.9 73.8 ± 23.3 6.3 ± 3.1 118.9 ± 12.9 7.3 ± 5.7 6.2 ± 1.5 21.1 ± 2.6 7.0 ± 0.1
Acetovanillone 6.2 ± 0.9 58.5 ± 6.8 3.3 ± 1.7 81.9 ± 11.8 2.3± 0.7 6.1 ± 2.2 15.5 ± 1.6 16.0 ± 2.4
Vanillic Acid 31.8 ± 2.1 296.9 ± 11.5 20.6 ± 4.9 391.5 ± 51.0 40.7 ± 3.2 218.7 ± 24.3 100.5 ± 5.3 421.1 ± 27.5
Sum of vanillyls 48.0 ± 3.7 429.2 ± 26.9 30.2 ± 6.0 592.3 ± 53.9 50.3 ± 6.6 231.0 ± 24.4 137.1 ± 6.1 444.1 ± 27.6
Syringaldehyde 20.5 ± 2.8 95.6 ± 24.8 16.2 ± 5.3 163.2 ± 5.1 28.2 ± 4.0 58.1 ± 24.8 4.5 ± 0.4 10.3 ± 0.1
Acetosyringone 9.8 ± 1.1 63.9 ± 11.1 6.4 ± 1.7 89.3 ± 3.6 18.4 ± 2.4 51.1 ± 19.8 2.2 ± 0.3 5.5 ± 0.7
Syringic Acid 22.7 ± 2.9 195.6 ± 15.2 14.3 ± 2.5 232.0 ± 28.3 37.8 ± 3.3 205.7 ± 19.9 7.9 ± 0.8 23.1 ± 1.6
Sum of syringyls 53.0 ± 4.2 355.1 ± 31.1 36.9 ± 6.1 484.5 ± 29.0 84.4 ± 5.7 314.9 ± 37.5 14.6 ± 0.9 38.9 ± 1.7
p-Coumaric Acid 23.1 ± 1.3 168.5 ± 6.7 17.3 ± 2.1 319.4 ± 5.8 73.1 ± 7.7 297.6 ± 10.3 34.2 ± 1.6 155.0 ± 5.7
Ferulic Acid 29.1 ± 1.1 239.5 ± 8.5 35.4 ± 4.1 623.0 ± 45.5 26.1 ± 2.0 113.9 ± 9.6 23.8 ± 2.0 91.5 ± 1.6
Sum of cinnamyls 52.2 ± 1.7 408.0 ± 10.8 52.7 ± 4.6 942.4 ± 45.9 99.2 ± 8.0 411.5 ± 14.1 58.0 ± 2.6 246.5 ± 5.9
Sum of VSC 153.2 ± 5.8 1192.3 ± 42.5 119.8 ± 9.7 2019.2 ± 76.5 233.9 ± 11.8 957.4 ± 46.9 209.7 ± 6.7 729.5 ± 28.2 a(Hedges and Ertel ,1982)
bPost-HF concentrations for the southern grassland soil were averaged from duplicate samples (n = 2)

95
the highest post-HF concentration: 623.0 ± 45.5 µg/g soil. Out of all four soils, the southern
grassland soil exhibited a 17 % increase in total VSC concentration after HF treatment. In
contrast, the forest soil only experienced a 3% increase (Table 3-2). By comparing residues 2
and 4 (Figure 3-1), the percent concentration increase after HF treatment was most evident
for vanillyl monomers in all four soils, except for the forest soil. In this soil, the cinnamyl
monomers exhibited the greatest increase in concentration, out of the three VSC classes
(Figure 3-2). The percent concentration increases after HF treatment among the VSC classes
of each soil are comparable between residues 1 and 3 (Table 3-2) and residues 2 and 4
(Figure 3-2).
NG SG AGR FOR0
20
40
60
80
100
% m
inera
l p
rote
cte
d-lig
nin
Soil sample
Vanillyls (V)
Syringyls (S)
Cinnamyls (C)
Figure 3-2: Percentage (%) of mineral protected-lignin in each VSC class from triplicate
samples (n = 3) of all four soils after HF treatment (comparison of extracts 2 and 4). NG,
Northern grassland soil; SG, Southern grassland soil; AGR, Agricultural soil; FOR, Forest
soil. Total vanillyls = vanillin, acetovanillone, vanillic acid; total syringyls = syringaldehyde,
acetosyringone, syringic acid; total cinnamyls = p-coumaric acid and ferulic acid. Error bars
indicate standard error.
96
After HF treatment, the total VSC concentrations of lignin monomers in all four soils
increased (Table 3-2 and Figure 3-2). HF demineralization likely facilitated the release of
lignin monomers that were previously bound to minerals. After HF demineralization, a
greater amount of lignin was extracted via CuO oxidation, leading to increased VSC
concentrations. This corroborates the claims of strong sorptive interactions between clay
minerals and lignin monomers reported previously (Miltner and Zech, 1998; Dai and
Johnson, 1999; Baldock and Skjemstad, 2000; Kaiser et al., 2002; Eusterhues et al., 2003;
Gonçalves et al., 2003; Mikutta et al., 2006; Rumpel et al., 2006; Clemente and Simpson,
2013). The percentage of mineral-protected lignin was calculated for each monomer of each
soil on the basis of total extract yield using Eqn.1, by comparing residues 1 and 3. They
ranged from 3.1 ± 0.2% in the forest soil to 95.9 ± 0.2% in the southern grassland soil (Table
3-3). This calculation also yielded negative percentages of mineral-protected lignin for
vanillin in the agricultural and forest soils (Table 3-3), signifying its post-HF concentration
was lower than its pre-HF concentration. This may have been due to C loss after HF
demineralization (Dai and Johnson, 1999; Rumpel et al., 2006; Eusterhues et al., 2007). For
example, Rumpel et al. (2006) reported C losses of 12-23% from the Ah horizon of a beech
forest soil after HF treatment while Eusterhues et al. (2007) observed C losses of 21-32%
from the A horizon of beech and oak forest soils after HF treatment. Dai and Johnson (1999)
observed a C loss of 51% from a B horizon forest soil, likely from the preferential removal of
O-alkyl and carboxyl C groups after HF treatment. However, their solid-state 13
C nuclear
magnetic resonance spectrum of the HF-treated B horizon soil also revealed a 4% decrease in
the aromatic C region (110-160 ppm), indicating that aromatic moieties may have been lost
during HF treatment as well.

97
Table 3-3: Percentages (%) of mineral protectiona of eight main lignin-derived phenols released after CuO oxidation
b, calculated by
comparing the average yield of triplicate samples (n = 3), in mg/g soil from residues 1 (pre-HF) and 3 (post-HF), followed by standard error.
Northern grassland Southern grasslandc Agricultural Forest
Vanillyls
Vanillin 86.4 ± 0.4 94.7 ± 0.2 -18.5d ± 1.0 -200.6
d ± 0.4
Acetovanillone 89.3 ± 0.2 95.9 ± 0.2 62.5 ± 0.4 3.1 ± 0.2
Vanillic Acid 89.3 ± 0.1 94.7 ± 0.2 81.4 ± 0.1 76.1 ± 0.1
Syringyls
Syringaldehyde 78.6 ± 0.3 90.1 ± 0.1 51.5 ± 0.5 55.9 ± 0.1
Acetosyringone 84.6 ± 0.2 92.8 ± 0.1 64.0 ± 0.5 60.2 ± 0.2
Syringic Acid 88.4 ± 0.1 93.8 ± 0.2 81.6 ± 0.1 65.9 ± 0.1
Cinnamyls
p-Coumaric Acid 86.3 ± 0.1 94.6 ± 0.1 75.4 ± 0.1 77.9 ± 0.1
Ferulic Acid 87.8 ± 0.1 94.3 ± 0.1 77.1 ± 0.1 74.0 ± 0.1 a(([Post-HF]-[Pre-HF])/[Post-HF]) x 100%
bHedges and Ertel (1982)
cPost-HF concentrations for the southern grassland soil were averaged from duplicate samples (n = 2)
dThese negative values may have been due to carbon loss after HF demineralization (Dai and Johnson, 1999; Rumpel et al., 2006; Eusterhues
et al., 2007).
98
The preferential degradation of lignin monomers has been well-documented in the
literature, where several studies have reported that vanillyl monomers are less susceptible to
degradation than other VSC classes (Ertel and Hedges, 1984; Hedges et al., 1988; Dignac et
al., 2005; Bahri et al., 2006; Hernes et al., 2013). In our study, vanillyl monomers were
observed to have the highest percentage of mineral protection out of all VSC classes. This is
likely because vanillyl monomers have more accessible bonding sites for clay mineral
interactions due to less methoxy groups (Bahri et al., 2006; Heim and Schmidt, 2007).
Consequently, vanillyl monomers are more likely to be protected from degradation by a
reduced accessibility to decomposers (Miltner and Zech, 1998; Heim and Schmidt, 2007).
This may explain why vanillyl monomers have been found to be more environmentally
persistent than syringyl and cinnamyl monomers (Ertel and Hedges, 1984; Dignac et al.,
2005; Kleber et al., 2005; Bahri et al., 2006; Heim and Schmidt, 2007).
Another consideration is that direct binding sites on clay minerals are finite (Burford
et al., 1964; Feller et al., 1992; Pennell et al., 1995; Kaiser and Guggenberger, 2000). The
capacity for minerals to adsorb OM is governed by mineral-specific properties such as
surface area, porosity and charge characteristics (Krull et al., 2003; Kleber et al., 2005). In
this study, the grassland soils exhibited higher amounts of mineral protection, as
demonstrated by increases in lignin monomer concentrations after HF treatment (Figure 3-2).
These soils contain higher montmorillonite clay content, which indicates there is higher
specific surface area available for sorption (Miltner and Zech, 1998; Heim and Schmidt,
2007; Clemente et al., 2012; Hernes et al., 2013). The southern grassland soil had slightly
higher amounts of mineral-protected lignin compared to the northern grassland soil even
though both soils have the same mineralogy (Table 3-1). In contrast, the agricultural and
forest soils exhibited lower amounts of mineral protection than the grassland soils. The

99
agricultural soil contained large amounts of feldspar and chlorite while the forest soil is
dominated by Al and Fe sesquioxide clays, which indicates that there is less mineral surface
area available for sorption (Clemente et al., 2012). The proportion of mineral-protected lignin
was lower in the forest soil than the agricultural soil which is in agreement with earlier
studies (Eusterhues et al., 2005; John et al., 2005; Kögel-Knabner et al., 2008). Previous
research suggests that SOM may be protected from microbial degradation through strong
associations between Fe and Al sesquioxides because they form strong bonds by ligand
exchange and provide the largest surface area in acidic soils (Kaiser and Guggenberger,
2003; Kleber et al., 2005). The aromatic carboxyl and phenolic group-rich fractions sorb
strongly onto Fe and Al sesquioxides (Kaiser and Guggenberger, 2000; Filley et al., 2002).
However, we found that the forest soil in this study, mostly dominated by Fe and Al
sesquioxides, contains less mineral-protected lignin, compared to the grassland soils which
are mostly dominated by montmorillonite clays (Table 3-1). This could signify that organo-
mineral associations between lignin and montmorillonite clays are stronger than those with
Fe and Al sesquioxides. Despite this, previous research has indicated that highly crystalline
Fe oxides have lower sorption capacities than poorly crystalline Fe oxides (Kleber et al.,
2005; von Lützow et al., 2007). The forest soil may have contained highly crystalline Fe
oxides leading to a considerably lower sorption capacity compared to the grassland soils,
which are dominated by montmorillonite clays.
3.4.3 Suberin- and cutin-protected lignin
In addition to mineral protection mechanisms, lignin in soil could be stabilized by
interactions with other SOM constituents such as cutin and suberin through OM-OM
interactions (Kögel-Knabner et al., 1994; Almendros et al., 1996; Thevenot et al., 2013).
Similar to organo-mineral associations, a number of factors may control the interactions

100
between nonpolar aliphatic SOM constituents and aromatic components in soil, including:
the type of cations present, pH conditions, cation bridging and hydrogen bonding
mechanisms. In addition, the physical conformation and varying hydrophobicity of aliphatic
moieties are also contributing factors (Almendros et al., 1996; Kaiser and Guggenberger,
2003; Wang and Xing, 2005; Kleber et al., 2007; Thevenot et al., 2013).
The percentage of suberin- and cutin- protected lignin was determined for lignin
monomers in each soil according to Eqn. 2 and the results are illustrated in Figure 3-3. The
pre-HF concentrations of lignin monomers released after BH and CuO oxidation from
extracts 1 and 2 were used to calculate suberin and cutin protection of lignin in the presence
of clay minerals. These were compared with post-HF concentrations of lignin monomers
released after BH and CuO oxidation from extracts 3 and 4 to determine suberin and cutin
protection in the absence of clay minerals.
Lignin monomer yields in the non-HF-treated residues (1 and 2) of all four soils
decreased after BH, resulting in negative percent changes (Figure 3-3). On the contrary,
lignin monomer yields in the HF-treated residues (3 and 4) increased after BH, particularly in
the southern grassland (Figure 3-3b) and agricultural (Figure 3-3c) soils, resulting in positive
percent changes. In the forest soil (Figure 3-3d), the concentrations of vanillin and
acetovanillone in the non-HF-treated residues increased after BH and these concentrations
further increased after HF treatment. The positive percent changes in lignin monomer
concentrations in the HF-treated residues may signify suberin and cutin protection of lignin.
In the southern grassland, agricultural and forest soils, suberin and cutin protection of lignin
was not detected until after the dissolution of clay minerals. In the agricultural soil, suberin
and cutin protection was mostly observed with the vanillyl monomers. This supports the prior
suggestion that bonding sites are more accessible in vanillyl monomers (Bahri et al., 2006).

101
Figure 3-3: Changes in average concentrations of lignin monomers from triplicate samples
(n = 3) in the four soils: (a) Northern grassland; (b) Southern grassland; (c) Agricultural; (d)
Forest, suggesting suberin and cutin protection of lignin with mineral interference
(comparison of extracts 1 and 2) and without mineral interference (comparison of extracts 3
and 4). Error bars indicate standard error.
The percent changes in concentration of the cinnamyl monomers (p-coumaric acid
and ferulic acid) in all the soils except for the agricultural soil decreased further after HF
treatment. In the northern grassland soil, lignin monomer concentrations from base-
hydrolyzed extracts were lower in the HF-treated residues than in the non-HF-treated
residues (Figure 3-3a). Unlike the observations made from the three other soils, suberin and
cutin protection of lignin was not observed in the northern grassland soil, even in the absence
of clay minerals. Based on these observations, it is unlikely that suberin and cutin protect
lignin in the northern grassland soil because the amount of extractable lignin did not increase

102
even after suberin and cutin monomers were extracted by BH. However, we do not have
direct evidence from this study to propose which other types of interactions, in addition to
organo-mineral interactions, may protect lignin from degradation in the northern grassland
soil.
Despite this, we still observed suberin and cutin protection of lignin in the southern
grassland, agricultural and forest soils. Our hypothesis related to suberin and cutin protection
of lignin complements findings from recent research which provides further evidence to
explain how lignin interacts with other macromolecules in soil via OM-OM interactions
(Thevenot et al., 2013). An isolation procedure was employed to extract a milled wall
enzymatic lignin fraction from an agricultural loamy soil. Combining evidence from earlier
research with their observations, Thevenot et al. (2013) indicated the possibility of strong
covalent bonding between lignin and lipid moieties which could originate from suberin and
cutin (Marseille et al., 1999; Quénéa et al., 2005; Dignac and Rumpel, 2006; Mendez-Millan
et al., 2012) and proposed that lignin-aliphatic interactions in soil could be responsible for
protecting lignin against biodegradation.
3.4.4 Implications for multilayer arrangement of organo-mineral interactions
Our data provide further evidence of interactions between clay minerals and lignin in
soil which is consistent with other studies (Miltner and Zech, 1998; Eusterhues et al., 2003;
Mikutta et al., 2006; Rumpel et al., 2006; Clemente and Simpson, 2013). Genest et al. (2014)
examined organo-clay complexes using 1H high resolution-magic angle spinning nuclear
magnetic resonance spectroscopy and demonstrated that aromatic moieties are tightly bound
to montmorillonite surfaces, which is in agreement with our findings. Genest et al. (2014)
also indicated that aromatic moieties in soil may not be accessible at the solid-liquid interface
103
because they are likely to be protected within hydrophobic regions. This is also consistent
with our observations which suggest that macromolecules with hydrophobic domains such as
suberin and cutin may protect aromatic moieties such as lignin from degradation. Results
from our study suggest that organo-mineral interactions between lignin and clay minerals are
comparatively stronger than OM-OM interactions between lignin and macromolecules such
as suberin and cutin. Previous research has proposed a layered architecture of the sorption of
OM onto mineral surfaces, such that sorption occurs over multiple layers and not all the
adsorbed molecules are in contact with the mineral surface (Kaiser and Guggenberger, 2003;
Eusterhues et al., 2005; Wang and Xing, 2005; Kleber et al., 2007). Kaiser and Guggenberger
(2003) postulated that increased surface loading does not necessarily imply increased
sorption onto the mineral surface because sorbing molecules could form multiple layers
through hydrophobic interactions or cation bridging (von Lützow et al., 2006; Kleber et al.,
2007). Wang and Xing (2005) and Eusterhues et al. (2005) both observed constant mineral
surface coverage under different OM loading levels in separate investigations and
hypothesized that this is most likely due to OM-OM interactions, resulting in a multilayer
arrangement. Kleber et al. (2007) compiled observations from earlier work (Wershaw, 1993;
Chien et al., 1997; Engebretson and von Wandruszka, 1997; Engebretson and von
Wandruszka, 1998; von Wandruszka et al., 1998; Ferreira et al., 2001; Martin-Neto et al.,
2001; Kleber et al., 2007) to propose a conceptual model of organo-mineral interactions in
soils: SOM sorbs onto mineral surfaces in a zonal sequence, which consists of a contact zone,
a hydrophobic zone and a kinetic zone (observations from our work do not pertain to the
kinetic zone so it will not be further discussed). In the contact zone, the polar functional
groups of organic compounds form strong associations with the mineral surface and are
consequently protected from microbial degradation. The properties of this association depend
on the density and reactivity of the functional groups present on the mineral surface. In the

104
hydrophobic zone, organic compounds are weakly bound to one another via OM-OM
interactions. These molecules do not directly interact with the mineral surface and are more
readily desorbed and decomposed. These compounds possess alkyl or aromatic functional
groups which may originate from macromolecules like cutin (Kleber et al., 2007). The
conceptual model proposed by Kleber et al. (2007) can be used to explain the findings from
our study. After HF demineralization, higher concentrations of lignin monomers were
extracted which suggests that lignin, a macromolecule with polar functional groups, is likely
to be protected from degradation through association with the mineral surface in the contact
zone. The positive changes in concentrations of lignin monomers after HF demineralization
and BH observed in our study provide further evidence of weak interactions among organic
compounds in the hydrophobic zone (Kleber et al., 2007). This premise is further supported
by the isolation of milled wall enzymatic lignin performed by Thevenot et al. (2013), as
mentioned earlier. Our indirect observations of suberin and cutin protection of select lignin
monomers in certain types of soils support the postulation by Thevenot et al. (2013) of
lignin-aliphatic complexes in soil but additional analyses are needed to confirm this
hypothesis.
3.5 Conclusions
The mineral protection mechanism of lignin was demonstrated by the increases in all
lignin monomer concentrations in all four soils after HF treatment. The grassland soils,
notably the southern grassland soil, exhibited the highest amount of mineral protection
because it possesses the highest montmorillonite clay content, rendering more surface area
available for sorption. In contrast, lignin in the forest soil was the least protected because it
was dominated by Fe and Al sesquioxides, with less available surface area for sorption. Out
of all VSC classes, vanillyl monomers (vanillin, acetovanillone and vanillic acid) were the
105
most stabilized through organo-mineral associations, which concurs with literature findings.
Suberin and cutin protection of lignin, only evident after HF demineralization, was mostly
observed in the southern grassland and agricultural soils and in certain monomers from the
forest soil. These collective observations support the conceptual model of a multilayer
arrangement of organic compounds sorbed onto mineral surfaces. Aromatic components in
SOM such as lignin are strongly bound to mineral layers and are consequently protected from
degradation. However, lignin that interacts with suberin and cutin through weak hydrophobic
interactions may be more prone to degradation because it is not directly adsorbed to the
mineral surface. Our study demonstrates that organo-mineral interactions between clay
mineral surfaces and lignin are likely to be stronger than hydrophobic interactions between
suberin and cutin with lignin. These findings suggest that organo-mineral associations play a
more dominant role in OM preservation compared to OM-OM interactions. Further
investigation on OM-OM interactions, such as those between lignin and suberin and cutin, is
warranted to establish the mechanisms behind these interactions and how they ultimately
contribute to OM stabilization processes.

106
3.6 References
Almendros, G., Guadalix, M.E., González-Vila, F.J., Martin, F., 1996. Preservation of
aliphatic macromolecules in soil humins. Organic Geochemistry 24, 651-659.
Asselman, T., Garnier, G., 2000. Adsorption of model wood polymers and colloids on
bentonites. Colloids and Surfaces A: Physicochemical and Engineering Aspects 168, 175-
182.
Bahri, H., Dignac, M.F., Rumpel, C., Rasse, D.P., Chenu, C., Mariotti, A., 2006. Lignin
turnover kinetics in an agricultural soil is monomer specific. Soil Biology and Biochemistry
38, 1977-1988.
Baldock, J.A., Skjemstad, J.O., 2000. Role of the soil matrix and minerals in protecting
natural organic materials against biological attack. Organic Geochemistry 31, 697-710.
Batjes, N.H., 1996. Total carbon and nitrogen in the soils of the world. European Journal of
Soil Science 47, 151-163.
Burford, J.R., Deshpande, T.L., Greenland, D.J., Quirk, J.P., 1964. Influence of organic
materials on the determination of the specific surface areas of soils. Journal of Soil Science
15, 192-201.
Chi, F.H., Amy, G.L., 2004. Kinetic study on the sorption of dissolved natural organic matter
onto different aquifer materials: The effects of hydrophobicity and functional groups. Journal
of Colloid and Interface Science 274, 380-391.
Chien, Y.Y., Kim, E.G., Bleam, W.F., 1997. Paramagnetic relaxation of atrazine solubilized
by humic micellar solutions. Environmental Science and Technology 31, 3204-3208.
Churchland, C., Grayston, S.J., Bengtson, P., 2013. Spatial variability of soil fungal and
bacterial abundance: Consequences for carbon turnover along a transition from a forested to
clear-cut site. Soil Biology and Biochemistry 63, 5-13.
Clemente, J.S., Gregorich, E.G., Simpson, A.J., Kumar, R., Courtier-Murias, D., Simpson,
M.J., 2012. Comparison of nuclear magnetic resonance methods for the analysis of organic
matter composition from soil density and particle fractions. Environmental Chemistry 9, 97-
107.
Clemente, J.S., Simpson, A.J., Simpson, M.J., 2011. Association of specific organic matter
compounds in size fractions of soils under different environmental controls. Organic
Geochemistry 42, 1169-1180.
Clemente, J.S., Simpson, M.J., 2013. Physical protection of lignin by organic matter and clay
minerals from chemical oxidation. Organic Geochemistry 58, 1-12.
Dai, K.H., Johnson, C.E., 1999. Applicability of solid-state 13
C CP/MAS NMR analysis in
Spodosols: Chemical removal of magnetic materials. Geoderma 93, 289-310.

107
de Montigny, L.E., Nigh, G.C., 2009. Silviculture Treatments for Ecosystem Management in
the Sayward (STEMS) Establishment Report for STEMS 2, Elk Bay. British Columbia
Ministry of Forests and Range, Research Branch, Victoria, British Columbia 049.
Dignac, M.F., Bahri, H., Rumpel, C., Rasse, D.P., Bardoux, G., Balesdent, J., Girardin, C.,
Chenu, C., Mariotti, A., 2005. Carbon-13 natural abundance as a tool to study the dynamics
of lignin monomers in soil: An appraisal at the Closeaux Experimental Field (France).
Geoderma 128, 3-17.
Dignac, M.F., Rumpel, C., 2006. Relative distributions of phenol dimers and hydroxy acids
in a cultivated soil and above ground maize tissue. Organic Geochemistry 37, 1634-1638.
Engebretson, R.R., von Wandruszka, R., 1998. Kinetic aspects of cation-enhanced
aggregation in aqueous humic acids. Environmental Science and Technology 32, 488-493.
Engebretson, R.R., von Wandruszka, R., 1997. The effect of molecular size on humic acid
associations. Organic Geochemistry 26, 759-767.
Ertel, J.R., Hedges, J.I., 1984. The lignin component of humic substances: Distribution
among soil and sedimentary humic, fulvic, and base-insoluble fractions. Geochimica et
Cosmochimica Acta 48, 2065-2074.
Eusterhues, K., Rumpel, C., Kleber, M., Kögel-Knabner, I., 2003. Stabilisation of soil
organic matter by interactions with minerals as revealed by mineral dissolution and oxidative
degradation. Organic Geochemistry 34, 1591-1600.
Eusterhues, K., Rumpel, C., Kögel-Knabner, I., 2007. Composition and radiocarbon age of
HF-resistant soil organic matter in a Podzol and a Cambisol. Organic Geochemistry 38,
1356-1372.
Eusterhues, K., Rumpel, C., Kögel-Knabner, I., 2005. Organo-mineral associations in sandy
acid forest soils: Importance of specific surface area, iron oxides and micropores. European
Journal of Soil Science 56, 753-763.
Feller, C., Schouller, E., Thomas, F., Rouiller, J., Herbillon, A.J., 1992. N2-BET specific
surface areas of some low activity clay soils and their relationships with secondary
constituents and organic matter contents. Soil Science 153, 293-299.
Feng, X., Simpson, A.J., Simpson, M.J., 2005. Chemical and mineralogical controls on
humic acid sorption to clay mineral surfaces. Organic Geochemistry 36, 1553-1566.
Ferreira, J.A., Nascimento, O.R., Martin-Neto, L., 2001. Hydrophobic interactions between
spin-label 5-SASL and humic acid as revealed by ESR spectroscopy. Environmental Science
and Technology 35, 761-765.
Filley, T.R., Cody, G.D., Goodell, B., Jellison, J., Noser, C., Ostrofsky, A., 2002. Lignin
demethylation and polysaccharide decomposition in spruce sapwood degraded by brown rot
fungi. Organic Geochemistry 33, 111-124.
108
Genest, S.C., Simpson, M.J., Simpson, A.J., Soong, R., McNally, D.J., 2014. Analysis of soil
organic matter at the solid-water interface by nuclear magnetic resonance spectroscopy.
Environmental Chemistry 11, 472-482.
Ghosh, S., Wang, Z.Y., Kang, S., Bhowmik, P.C., Xing, B.S., 2009. Sorption and
fractionation of a peat derived humic acid by kaolinite, montmorillonite, and goethite.
Pedosphere 19, 21-30.
Gonçalves, C.N., Dalmolin, R.S.D., Dick, D.P., Knicker, H., Klamt, E., Kögel-Knabner, I.,
2003. The effect of 10% HF treatment on the resolution of CPMAS 13
C NMR spectra and on
the quality of organic matter in Ferralsols. Geoderma 116, 373-392.
Hedges, J.I., Blanchette, R.A., Weliky, K., Devol, A.H., 1988. Effects of fungal degradation
on the CuO oxidation products of lignin: A controlled laboratory study. Geochimica et
Cosmochimica Acta 52, 2717-2726.
Hedges, J.I., Ertel, J.R., 1982. Characterization of lignin by gas capillary chromatography of
cupric oxide oxidation products. Analytical Chemistry 54, 174-178.
Heim, A., Schmidt, M.W.I., 2007. Lignin is preserved in the fine silt fraction of an arable
Luvisol. Organic Geochemistry 38, 2001-2011.
Hernes, P.J., Kaiser, K., Dyda, R.Y., Cerli, C., 2013. Molecular trickery in soil organic
matter: Hidden lignin. Environmental Science and Technology 47, 9077-9085.
Janzen, H.H., Campbell, C.A., Izaurralde, R.C., Ellert, B.H., Juma, N., McGill, W.B.,
Zentner, R.P., 1998. Management effects on soil C storage on the Canadian prairies. Soil and
Tillage Research 47, 181-195.
John, B., Yamashita, T., Ludwig, B., Flessa, H., 2005. Storage of organic carbon in aggregate
and density fractions of silty soils under different types of land use. Geoderma 128, 63-79.
Kaiser, K., Eusterhues, K., Rumpel, C., Guggenberger, G., Kögel-Knabner, I., 2002.
Stabilization of organic matter by soil minerals - investigations of density and particle-size
fractions from two acid forest soils. Journal of Plant Nutrition and Soil Science 165, 451-459.
Kaiser, K., Guggenberger, G., 2003. Mineral surfaces and soil organic matter. European
Journal of Soil Science 54, 219-236.
Kaiser, K., Guggenberger, G., 2000. The role of DOM sorption to mineral surfaces in the
preservation of organic matter in soils. Organic Geochemistry 31, 711-725.
Keser, N., Pierre, D.S., 1973. Soils of Vancouver Island: A compendium. British Columbia
Forest Service, Research Division, Victoria, British Columbia.
Kleber, M., Mikutta, R., Torn, M.S., Jahn, R., 2005. Poorly crystalline mineral phases protect
organic matter in acid subsoil horizons. European Journal of Soil Science 56, 717-725.
Kleber, M., Sollins, P., Sutton, R., 2007. A conceptual model of organo-mineral interactions
in soils: Self-assembly of organic molecular fragments into zonal structures on mineral
surfaces. Biogeochemistry 85, 9-24.
109
Kögel-Knabner, I., 2002. The macromolecular organic composition of plant and microbial
residues as inputs to soil organic matter. Soil Biology and Biochemistry 34, 139-162.
Kögel-Knabner, I., de Leeuw, J.W., Tegelaar, E.W., Hatcher, P.G., Kerp, H., 1994. A lignin-
like polymer in the cuticle of spruce needles: Implications for the humification of spruce
litter. Organic Geochemistry 21, 1219-1228.
Kögel-Knabner, I., Guggenberger, G., Kleber, M., Kandeler, E., Kalbitz, K., Scheu, S.,
Eusterhues, K., Leinweber, P., 2008. Organo-mineral associations in temperate soils:
Integrating biology, mineralogy, and organic matter chemistry. Journal of Plant Nutrition and
Soil Science 171, 61-82.
Krull, E.S., Baldock, J.A., Skjemstad, J.O., 2003. Importance of mechanisms and processes
of the stabilisation of soil organic matter for modelling carbon turnover. Functional Plant
Biology 30, 207-222.
Lorenz, K., Lal, R., Preston, C.M., Nierop, K.G.J., 2007. Strengthening the soil organic
carbon pool by increasing contributions from recalcitrant aliphatic bio(macro)molecules.
Geoderma 142, 1-10.
Ma, B.L., Ying, J., Dwyer, L.M., Gregorich, E.G., Morrison, M.J., 2003. Crop rotation and
soil N amendment effects on maize production in Eastern Canada. Canadian Journal of Soil
Science 83, 483-495.
MacLean, A.J., Brydon, J.E., 1963. Release and fixation of potassium in different size
fractions of some Canadian soils as related to their mineralogy. Canadian Journal of Soil
Science 43, 123-134.
Marseille, F., Disnar, J.R., Guillet, B., Noack, Y., 1999. n-alkanes and free fatty acids in
humus and A1 horizons of soils under Beech, Spruce and grass in the Massif-Central (Mont-
Lozère), France. European Journal of Soil Science 50, 433-441.
Martin-Neto, L., Traghetta, D.G., Vaz, C.M.P., Crestana, S., Sposito, G., 2001. On the
interaction mechanisms of atrazine and hydroxyatrazine with humic substances. Journal of
Environmental Quality 30, 520-525.
Mendez-Millan, M., Dignac, M.F., Rumpel, C., Rasse, D.P., Bardoux, G., Derenne, S., 2012.
Contribution of maize root derived C to soil organic carbon throughout an agricultural soil
profile assessed by compound specific 13
C analysis. Organic Geochemistry 42, 1502-1511.
Mikutta, R., Kleber, M., Torn, M.S., Jahn, R., 2006. Stabilization of soil organic matter:
Association with minerals or chemical recalcitrance? Biogeochemistry 77, 25-56.
Mikutta, R., Mikutta, C., Kalbitz, K., Scheel, T., Kaiser, K., Jahn, R., 2007. Biodegradation
of forest floor organic matter bound to minerals via different binding mechanisms.
Geochimica et Cosmochimica Acta 71, 2569-2590.
Miltner, A., Zech, W., 1998. Beech leaf litter lignin degradation and transformation as
influenced by mineral phases. Organic Geochemistry 28, 457-463.

110
Mitchell, P.J., Simpson, M.J., 2013. High affinity sorption domains in soil are blocked by
polar soil organic matter components. Environmental Science and Technology 47, 412-419.
Otto, A., Simpson, M.J., 2007. Analysis of soil organic matter biomarkers by sequential
chemical degradation and gas chromatography - mass spectrometry. Journal of Separation
Science 30, 272-282.
Otto, A., Simpson, M.J., 2006. Evaluation of CuO oxidation parameters for determining the
source and stage of lignin degradation in soil. Biogeochemistry 80, 121-142.
Pautler, B.G., Austin, J., Otto, A., Stewart, K., Lamoureux, S.F., Simpson, M.J., 2010.
Biomarker assessment of organic matter sources and degradation in Canadian High Arctic
littoral sediments. Biogeochemistry 100, 75-87.
Pennell, K.D., Boyd, S.A., Abriola, L.M., 1995. Surface area of soil organic matter
reexamined. Soil Science Society of America Journal 59, 1012-1018.
Quénéa, K., Derenne, S., Largeau, C., Rumpel, C., Mariotti, A., 2005. Spectroscopic and
pyrolytic features and abundance of the macromolecular refractory fraction in a sandy acid
forest soil (Landes de Gascogne, France). Organic Geochemistry 36, 349-362.
Rumpel, C., Rabia, N., Derenne, S., Quénéa, K., Eusterhues, K., Kögel-Knabner, I., Mariotti,
A., 2006. Alteration of soil organic matter following treatment with hydrofluoric acid (HF).
Organic Geochemistry 37, 1437-1451.
Sanborn, P., Lavkulich, L.M., 1989. Ferro-Humic Podzols of coastal British Columbia: I.
morphology, selected properties, and classification. Soil Science Society of America Journal
53, 511-517.
Schmidt, M.W.I., Knicker, H., Hatcher, P.G., Kögel-Knabner, I., 1997. Improvement
of 13
C and 15
N CPMAS NMR spectra of bulk soils, particle size fractions
and organic material by treatment with 10% hydrofluoric acid. European Journal of Soil
Science 48, 319-328.
Simpson, A.J., Simpson, M.J., Kingery, W.L., Lefebvre, B.A., Moser, A., Williams, A.J.,
Kvasha, M., Kelleher, B.P., 2006. The application of 1H high-resolution magic-angle
spinning NMR for the study of clay-organic associations in natural and synthetic complexes.
Langmuir 22, 4498-4503.
Thevenot, M., Dignac, M.F., Mendez-Millan, M., Bahri, H., Hatté, C., Bardoux, G., Rumpel,
C., 2013. Ligno-aliphatic complexes in soils revealed by an isolation procedure: Implication
for lignin fate. Biology and Fertility of Soils 49, 517-526.
von Lützow, M., Kögel-Knabner, I., Ekschmitt, K., Flessa, H., Guggenberger, G., Matzner,
E., Marschner, B., 2007. SOM fractionation methods: Relevance to functional pools and to
stabilization mechanisms. Soil Biology and Biochemistry 39, 2183-2207.
von Lützow, M., Kögel-Knabner, I., Ekschmitt, K., Matzner, E., Guggenberger, G.,
Marschner, B., Flessa, H., 2006. Stabilization of organic matter in temperate soils:
111
Mechanisms and their relevance under different soil conditions - A review. European Journal
of Soil Science 57, 426-445.
von Wandruszka, R., Haakenson, T.J., Toerne, K.A., 1998. Evaluation of humic acid
fractions by fluorimetry and 13
C NMR spectroscopy. Spectrochimica Acta - Part A:
Molecular and Biomolecular Spectroscopy 54, 671-675.
Wang, K., Xing, B., 2005. Structural and sorption characteristics of adsorbed humic acid on
clay minerals. Journal of Environmental Quality 34, 342-349.
Wershaw, R.L., 1993. Model for humus in soils and sediments. Environmental Science and
Technology 27, 814-816.
112
Chapter 4: Conclusions and Future Directions
4.1 Summary
In Chapter 2, soil organic matter (SOM) was characterized in whole soils from Toolik
Lake, Alaska, USA, after 32 years of soil warming and nitrogen+ phosphorus (N+P)
fertilization. Biomarker methods and solid-state 13
C nuclear magnetic resonance (NMR)
techniques were used to analyze SOM composition as described in sections 2.3.4 and 2.3.5
respectively. With warming, N+P fertilization and warming +N+P fertilization, cutin-derived
compounds from leaves increased in the upper soil horizon while suberin-derived compounds
from roots decreased in the lower soil horizon, but these changes were not statistically
significant. In addition, SOM degradation was not enhanced by warming, N+P fertilization or
the combined treatment.
In Chapter 3, four soils of differing clay mineralogy from three Canadian provinces
were subjected to hydrofluoric (HF) acid demineralization and were characterized using
biomarker methods (section 3.3.3). Lignin was found to be mainly protected from extraction
via clay mineral interactions in all four soils. Suberin and cutin protection of lignin was also
observed, but not until after the dissolution of clay minerals via HF demineralization. Of the
three lignin phenol classes, vanillyl monomers were found to be the most stabilized by
interactions with clay minerals and associations with suberin and cutin.
4.1.1 Molecular-level characterization of Arctic soils (Chapter 2)
Upper and lower horizon soils were collected from Toolik Lake, Alaska, USA, after
32 years of warming and N+P fertilization. Biomarker methods were used to determine the
degree of SOM degradation, while solid-state 13
C NMR spectroscopy was employed to offer
113
an overview of SOM alteration in response to warming, N+P fertilization and warming +N+P
fertilization. In the solvent extracts of all these Arctic soils, long-chain n-alkanols and n-
alkanoic acids were comparatively more abundant than short-chain components, which
indicates there was more plant-derived than microbial-derived inputs (Lichtfouse et al., 1995;
Otto and Simpson, 2005; Simoneit, 2005). Low concentrations of simple sugars (glucose,
galactose and mannose) along with high O-alkyl carbon (C) signals in the solid-state 13
C
NMR spectra signified large amounts of cellulose inputs in these Arctic soils (Hatcher et al.,
1983; Salloum et al., 2002). Cutin-derived compounds in the upper horizon soils increased
but not significantly with warming, N+P fertilization and warming +N+P fertilization while
long-chain n-alkanes derived from epicuticular waxes did not vary. Coupled with NMR
analysis results which did not reveal any enrichment in alkyl compounds, this suggests there
was only a slight accumulation of cutin-derived inputs in the upper horizon under elevated
temperatures and increased nutrient availability. Cutin degradation was not promoted by any
of the treatments, which may be due to the chemical recalcitrance of cutin. Suberin-derived
inputs in the lower horizon slightly decreased with warming, N+P fertilization and the
combined treatment. The solid-state 13
C NMR spectra of the lower horizon soils showed
reductions in the alkyl C signals but not in the aromatic and phenolic C signals. The low
intensities of the aromatic and phenolic C signals from the solid-state 13
C NMR spectra
corresponded to the low concentrations of lignin-derived phenols from the copper (II) oxide
(CuO) oxidation extracts. Lignin oxidation was found to be suppressed in these Arctic soils,
likely due to low fungal activity as evidenced by the absence of ergosterol, a fungal
biomarker, from the solvent extracts. However, in the upper horizon of block 4, lignin
oxidation was observed to be most enhanced by N+P fertilization and least enhanced by
warming +N+P fertilization. The biomarker data demonstrated that there was considerable
spatial heterogeneity among the four replicate blocks, which may be attributable to the
114
topographical characteristics surrounding the site. The spatially complex landscape, reflected
through topographical controls such as water distribution, plant growth and soil horizon
development (Burke et al., 1999; Spielvogel et al., 2016), likely contributed to the different
alteration patterns of SOM composition among the blocks.
4.1.2 Clay mineral, suberin and cutin protection of lignin (Chapter 3)
The northern grassland soil was collected from the University of Alberta Ellerslie
Research Station in Edmonton, Alberta, while the southern grassland soil was collected from
Lethbridge, Alberta. The agricultural soil was sampled from Agricultural and Agri-Food
Canada’s Central Experimental Farm in Ottawa, Ontario, while the forest soil was sampled
from the Silviculture Treatments for Ecosystem Management in the Sayward (STEMS) long-
term research installation on Vancouver Island, British Columbia. HF demineralization was
performed to assess the extent of clay mineral protection of lignin-derived phenols. Base
hydrolysis was used to isolate suberin and cutin monomers. CuO oxidation was performed
before and after base hydrolysis and HF demineralization to determine the extent of suberin
and cutin protection of lignin. HF treatment enhanced the extractability of lignin-derived
phenols via CuO oxidation in all the soils, which supports previous observations of strong
sorptive interactions between clay minerals and lignin (Mikutta et al., 2006; Rumpel et al.,
2006). The highest percentage of mineral-protected lignin was observed in the grassland
soils, likely due to their higher montmorillonite clay content which provided greater surface
area for sorption (Miltner and Zech, 1998). The forest soil exhibited the lowest percentage of
mineral-protected lignin likely because the iron (Fe) and aluminum (Al) oxides contained
within this soil had a lower sorption affinity for lignin. The extractability of vanillyl
monomers increased the most in the grassland and agricultural soils after HF
demineralization, which suggests that the vanillyl monomers were the most stabilized
115
through organo-mineral interactions of the three lignin monomer classes. This concurs with
literature findings where vanillyl monomers have been reported to be more persistent in soil
compared to syringyl and cinnamyl monomers (Bahri et al., 2006). In the northern grassland
soil, the amount of extractable lignin did not increase after base hydrolysis, which indicates
that it is unlikely that suberin and cutin protect lignin from degradation in this soil. The
extractability of lignin-derived phenols from the base-hydrolyzed extracts of the southern
grassland, agricultural and forest soils did not increase until after the dissolution of clay
minerals by HF treatment. This suggests that organo-mineral interactions may play a more
dominant role in the protection of lignin compared to interactions with suberin and cutin.
4.2 Limitations and future work
The research presented in this thesis demonstrates that molecular-level techniques
showed alterations in SOM composition in response to environmental changes such as
elevated temperature and increased nutrient availability. This work also offered insight into
how SOM can be stabilized by associations with clay minerals and by interactions between
SOM components. Despite this, it is important to acknowledge the following limitations of
this research and to consider these recommendations for future work:
1. In the Arctic soils from Toolik Lake, Alaska (Chapter 2), the variability in the
biomarker data of the four replicate blocks in response to each treatment
demonstrated substantial spatial heterogeneity among the blocks. In this experiment,
only one soil sample was collected from the upper and lower soil horizons of each
treatment in each block. In the future, multiple samples from each block of each
treatment should be collected to gain a more representative picture of how each block
may respond to warming, N+P fertilization and warming +N+P fertilization. A

116
greater number of sampling points within each block is expected to minimize the
variability in the responses of each treatment (Schöning et al., 2006).
2. Based on the soils gathered from the treatments of the four replicate blocks, SOM
degradation in the Arctic soils from Toolik Lake, Alaska, was not enhanced after 32
years of warming and N+P fertilization (Chapter 2). However, it is unclear whether
this observation was unique, based on the topography of where these treatment blocks
were situated. The presence of underlying permafrost in Arctic soils may have led to
the impermeability of water infiltration (Sturm et al., 2005). As a result, water-
saturated conditions in the active layer may have inhibited SOM degradation
processes (Ping et al., 1998; Sistla et al., 2013). For example, in tundra ecosystems,
the greatest accumulation of soil C stocks has been reported to occur in low-lying
poorly-drained areas, while less soil C stocks tend to accumulate in upland areas with
more efficient drainage (Giblin et al., 1991; Michaelson et al., 1996; Hobbie et al.,
2000). The establishment of additional replicate blocks for the warming, N+P
fertilization and the warming +N+P fertilization treatments in upland and lowland
areas with contrasting drainage conditions at Toolik Lake may clarify whether the
suppression of SOM decomposition observed in this study was specific to the
topographic position of the treatment plots.
3. In the mineral protection experiment (Chapter 3), after HF demineralization, the
extractability of lignin monomers was highest in the grassland soils which contained
montmorillonite clays and lowest in the forest soil which contained mainly Fe and Al
oxides. This finding may indicate that montmorillonite clays, compared to Fe and Al
oxides, likely contain higher amounts of mineral-protected lignin. However, further
investigations on various types of Fe and Al oxides should be conducted until it can
be ascertained that montmorillonite clays have greater sorption affinity for lignin than

117
Fe and Al oxides. Previous reports have shown that highly crystalline Fe and Al
oxides have lower specific surface area and hence lower sorption capacities compared
to poorly crystalline Fe and Al oxides (Kleber et al., 2005; von Lützow et al., 2007).
For example, in an experiment conducted by Mikutta et al. (2006), a greater amount
of mineral protected-SOM was extracted from poorly crystalline Fe oxides than from
highly crystalline Fe oxides. Therefore, additional soils with differing crystalline
phases of Fe and Al oxides should be analyzed together with montmorillonite clays
according to the extraction procedure outlined in Chapter 3. This will allow for an
improved understanding of how the sorption affinity of montmorillonite for lignin
compares with various crystalline phases of Fe and Al oxides.
4. Of the three lignin monomer classes, the extractability of vanillyl monomers
increased the most after HF demineralization in the grassland and agricultural soils,
which signifies the vanillyl monomers exhibited the greatest amount of mineral
protection. Vanillyl monomers have been reported to be more environmentally
persistent than syringyl and cinnamyl monomers (Bahri et al., 2006). However, the
chemical mechanism behind why vanillyl monomers are more persistent is unclear
and would benefit from a mechanistic study. Batch equilibration experiments could
be conducted to examine the sorption affinity of the eight main lignin-derived phenol
monomers (vanillin, acetovanillone, vanillic acid, syringaldehyde, acetosyringone,
syringic acid, p-coumaric acid and ferulic acid) to clay minerals with different
mineralogical properties such as specific surface area and crystal structures (Xing et
al., 1996; Xing, 1997; Kaiser and Guggenberger, 2003; Cecchi et al., 2004). To
determine the degree of sorption of each lignin monomer, quantified data from high
performance liquid chromatography can be used to construct sorption isotherms and
to determine partition coefficients (Cecchi et al., 2004). The results of such

118
experiment would allow for a better understanding of the roles that vanillyl, syringyl
and cinnamyl monomers within the lignin macromolecule may play in sorption to
clay mineral surfaces.
The proposed work will provide more concrete evidence about whether or not our
observations of the alteration of SOM composition were reflective of landscape
characteristics. Further exploration into various types of crystallinity phases of Fe and Al
oxides along with sorption experiments between lignin monomers and clay minerals would
offer more detailed insights into how the extent of mineral protection may differ among
mineral surfaces and specific SOM components.
4.3 Research implications
With the onset of climate change, previous research has shown that warming and
increases in nutrient availability in soil may enhance SOM degradation in Arctic ecosystems.
The work presented in this thesis indicates that changes in temperature and nutrient
availability altered SOM composition but did not enhance SOM degradation overall.
However, such an observation may be ecosystem-specific. Our molecular-level data further
revealed that in an Arctic ecosystem where the landscape is spatially complex, SOM
composition may be altered differently in response to long-term warming and fertilization.
This suggests that the importance of landscape patterns should not be understated because
they can potentially contribute to the changes in SOM biogeochemistry that are expected to
occur in a warmer and more nutrient-rich environment. This information will serve as a
platform for developing more comprehensive climate change mitigation strategies in Arctic
ecosystems.

119
Moreover, this thesis offers further evidence that the associations between SOM
components and mineral surfaces play critical roles in the preservation of SOM. Our
observations suggest that clay mineral interactions may play a dominant part in the protection
of SOM. These findings also highlight the potential role that interactions between SOM
components may play in SOM protection mechanisms. This research demonstrates that clay
mineral associations, along with interactions between SOM components, collectively
contribute to SOM stabilization processes. This knowledge will provide a more mechanistic
understanding of how SOM stabilization can maximize C sequestration in soils, which may
potentially reduce C emissions into the atmosphere and alleviate contributions to the positive
climate feedback.

120
4.4 References
Bahri, H., Dignac, M.F., Rumpel, C., Rasse, D.P., Chenu, C., Mariotti, A., 2006. Lignin
turnover kinetics in an agricultural soil is monomer specific. Soil Biology and Biochemistry
38, 1977-1988.
Burke, I.C., Lauenroth, W.K., Riggle, R., Brannen, P., Madigan, B., Beard, S., 1999. Spatial
variability of soil properties in the shortgrass steppe: The relative importance of topography,
grazing, microsite, and plant species in controlling spatial patterns. Ecosystems 2, 422-438.
Cecchi, A.M., Koskinen, W.C., Cheng, H.H., Haider, K., 2004. Sorption-desorption of
phenolic acids as affected by soil properties. Biology and Fertility of Soils 39, 235-242.
Giblin, E., Nadelhoffer, K.J., Shaver, G.R., Laundre, J.A., McKerrow, A.J., 1991.
Biogeochemical diversity along a riverside toposequence in Arctic Alaska. Ecological
Monographs 61, 415-435.
Hatcher, P.G., Breger, I.A., Dennis, L.W., Maciel, G.E., 1983. Aquatic and Terrestrial Humic
Materials. In: Christman, R.F., Gjessing, E.T. (Eds.), Ann Arbor Science Publishers, MI,
USA, pp. 37-81.
Hobbie, S.E., Schimel, J.P., Trumbore, S.E., Randerson, J.R., 2000. Controls over carbon
storage and turnover in high-latitude soils. Global Change Biology 6, 196-210.
Kaiser, K., Guggenberger, G., 2003. Mineral surfaces and soil organic matter. European
Journal of Soil Science 54, 219-236.
Kleber, M., Mikutta, R., Torn, M.S., Jahn, R., 2005. Poorly crystalline mineral phases protect
organic matter in acid subsoil horizons. European Journal of Soil Science 56, 717-725.
Lichtfouse, É., Berthier, G., Houot, S., Barriuso, E., Bergheaud, V., Vallaeys, T., 1995.
Stable carbon isotope evidence for the microbial origin of C14-C18 n-alkanoic acids in soils.
Organic Geochemistry 23, 849-852.
Michaelson, G.J., Ping, C.L., Kimble, J.M., 1996. Carbon storage and distribution in tundra
soils of Arctic Alaska, U.S.A. Arctic and Alpine Research 28, 414-424.
Mikutta, R., Kleber, M., Torn, M.S., Jahn, R., 2006. Stabilization of soil organic matter:
Association with minerals or chemical recalcitrance? Biogeochemistry 77, 25-56.
Miltner, A., Zech, W., 1998. Beech leaf litter lignin degradation and transformation as
influenced by mineral phases. Organic Geochemistry 28, 457-463.
Otto, A., Simpson, M.J., 2005. Degradation and preservation of vascular plant-derived
biomarkers in grassland and forest soils from Western Canada. Biogeochemistry 74, 377-
409.
Ping, C.L., Bockheim, J.G., Kimble, J.M., Michaelson, G.J., Walker, D.A., 1998.
Characteristics of cryogenic soils along a latitudinal transect in Arctic Alaska. Journal of
Geophysical Research Atmospheres 103, 28917-28928.

121
Rumpel, C., Rabia, N., Derenne, S., Quenea, K., Eusterhues, K., Kögel-Knabner, I., Mariotti,
A., 2006. Alteration of soil organic matter following treatment with hydrofluoric acid (HF).
Organic Geochemistry 37, 1437-1451.
Salloum, M.J., Chefetz, B., Hatcher, P.G., 2002. Phenanthrene sorption by aliphatic-rich
natural organic matter. Environmental Science and Technology 36, 1953-1958.
Schöning, I., Totsche, K.U., Kögel-Knabner, I., 2006. Small scale spatial variability of
organic carbon stocks in litter and solum of a forested Luvisol. Geoderma 136, 631-642.
Simoneit, B.R.T., 2005. A review of current applications of mass spectrometry for
biomarker/molecular tracer elucidations. Mass Spectrometry Reviews 24, 719-765.
Sistla, S.A., Moore, J.C., Simpson, R.T., Gough, L., Shaver, G.R., Schimel, J.P., 2013. Long-
term warming restructures Arctic tundra without changing net soil carbon storage. Nature
497, 615-617.
Spielvogel, S., Prietzel, J., Kögel-Knabner, I., 2016. Stand scale variability of topsoil organic
matter composition in a high-elevation Norway Spruce forest ecosystem. Geoderma 267,
112-122.
Sturm, M., Schimel, J., Michaelson, G., Welker, J.M., Oberbauer, S.F., Liston, G.E.,
Fahnestock, J., Romanovsky, V.E., 2005. Winter biological processes could help convert
Arctic tundra to shrubland. Bioscience 55, 17-26.
von Lützow, M., Kögel-Knabner, I., Ekschmitt, K., Flessa, H., Guggenberger, G., Matzner,
E., Marschner, B., 2007. SOM fractionation methods: Relevance to functional pools and to
stabilization mechanisms. Soil Biology and Biochemistry 39, 2183-2207.
Xing, B., 1997. The effect of the quality of soil organic matter on sorption of naphthalene.
Chemosphere 35, 633-642.
Xing, B., Pignatello, J.J., Gigliotti, B., 1996. Competitive sorption between atrazine and
other organic compounds in soils and model sorbents. Environmental Science and
Technology 30, 2432-2440.
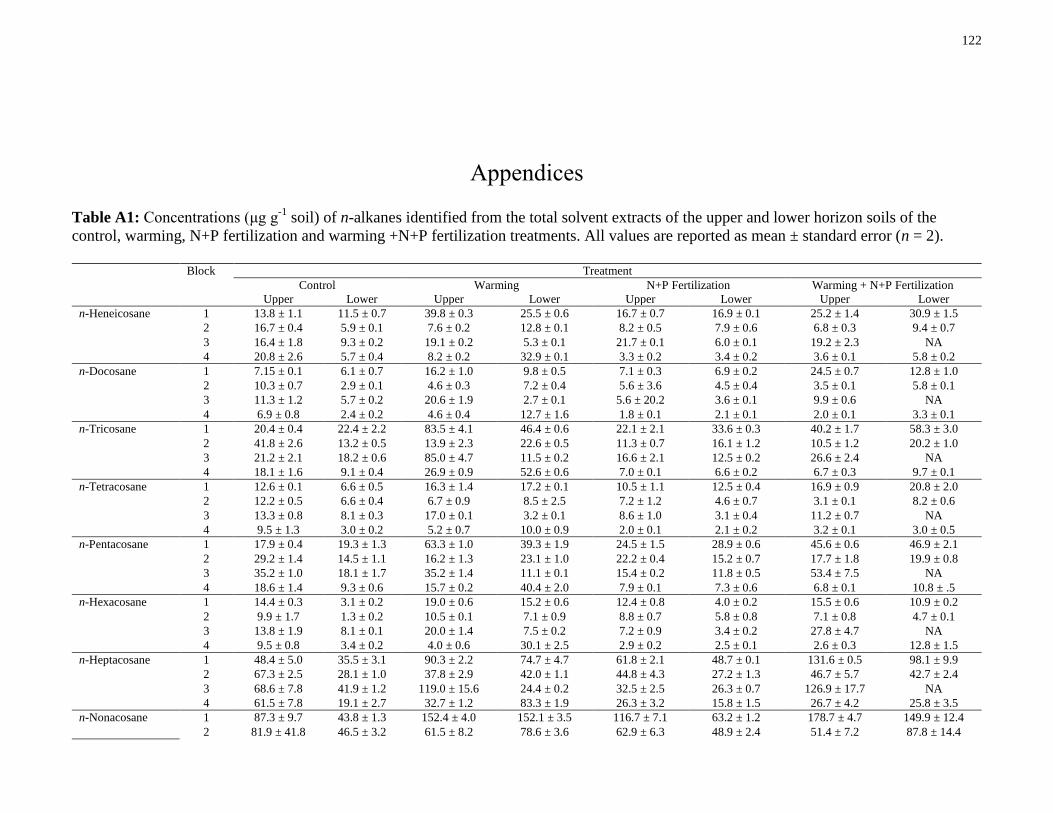
122
Appendices
Table A1: Concentrations (μg g-1
soil) of n-alkanes identified from the total solvent extracts of the upper and lower horizon soils of the
control, warming, N+P fertilization and warming +N+P fertilization treatments. All values are reported as mean ± standard error (n = 2).
Block Treatment
Control Warming N+P Fertilization Warming + N+P Fertilization
Upper Lower Upper Lower Upper Lower Upper Lower
n-Heneicosane 1 13.8 ± 1.1 11.5 ± 0.7 39.8 ± 0.3 25.5 ± 0.6 16.7 ± 0.7 16.9 ± 0.1 25.2 ± 1.4 30.9 ± 1.5
2 16.7 ± 0.4 5.9 ± 0.1 7.6 ± 0.2 12.8 ± 0.1 8.2 ± 0.5 7.9 ± 0.6 6.8 ± 0.3 9.4 ± 0.7
3 16.4 ± 1.8 9.3 ± 0.2 19.1 ± 0.2 5.3 ± 0.1 21.7 ± 0.1 6.0 ± 0.1 19.2 ± 2.3 NA
4 20.8 ± 2.6 5.7 ± 0.4 8.2 ± 0.2 32.9 ± 0.1 3.3 ± 0.2 3.4 ± 0.2 3.6 ± 0.1 5.8 ± 0.2
n-Docosane 1 7.15 ± 0.1 6.1 ± 0.7 16.2 ± 1.0 9.8 ± 0.5 7.1 ± 0.3 6.9 ± 0.2 24.5 ± 0.7 12.8 ± 1.0
2 10.3 ± 0.7 2.9 ± 0.1 4.6 ± 0.3 7.2 ± 0.4 5.6 ± 3.6 4.5 ± 0.4 3.5 ± 0.1 5.8 ± 0.1
3 11.3 ± 1.2 5.7 ± 0.2 20.6 ± 1.9 2.7 ± 0.1 5.6 ± 20.2 3.6 ± 0.1 9.9 ± 0.6 NA
4 6.9 ± 0.8 2.4 ± 0.2 4.6 ± 0.4 12.7 ± 1.6 1.8 ± 0.1 2.1 ± 0.1 2.0 ± 0.1 3.3 ± 0.1
n-Tricosane 1 20.4 ± 0.4 22.4 ± 2.2 83.5 ± 4.1 46.4 ± 0.6 22.1 ± 2.1 33.6 ± 0.3 40.2 ± 1.7 58.3 ± 3.0
2 41.8 ± 2.6 13.2 ± 0.5 13.9 ± 2.3 22.6 ± 0.5 11.3 ± 0.7 16.1 ± 1.2 10.5 ± 1.2 20.2 ± 1.0
3 21.2 ± 2.1 18.2 ± 0.6 85.0 ± 4.7 11.5 ± 0.2 16.6 ± 2.1 12.5 ± 0.2 26.6 ± 2.4 NA
4 18.1 ± 1.6 9.1 ± 0.4 26.9 ± 0.9 52.6 ± 0.6 7.0 ± 0.1 6.6 ± 0.2 6.7 ± 0.3 9.7 ± 0.1
n-Tetracosane 1 12.6 ± 0.1 6.6 ± 0.5 16.3 ± 1.4 17.2 ± 0.1 10.5 ± 1.1 12.5 ± 0.4 16.9 ± 0.9 20.8 ± 2.0
2 12.2 ± 0.5 6.6 ± 0.4 6.7 ± 0.9 8.5 ± 2.5 7.2 ± 1.2 4.6 ± 0.7 3.1 ± 0.1 8.2 ± 0.6
3 13.3 ± 0.8 8.1 ± 0.3 17.0 ± 0.1 3.2 ± 0.1 8.6 ± 1.0 3.1 ± 0.4 11.2 ± 0.7 NA
4 9.5 ± 1.3 3.0 ± 0.2 5.2 ± 0.7 10.0 ± 0.9 2.0 ± 0.1 2.1 ± 0.2 3.2 ± 0.1 3.0 ± 0.5
n-Pentacosane 1 17.9 ± 0.4 19.3 ± 1.3 63.3 ± 1.0 39.3 ± 1.9 24.5 ± 1.5 28.9 ± 0.6 45.6 ± 0.6 46.9 ± 2.1
2 29.2 ± 1.4 14.5 ± 1.1 16.2 ± 1.3 23.1 ± 1.0 22.2 ± 0.4 15.2 ± 0.7 17.7 ± 1.8 19.9 ± 0.8
3 35.2 ± 1.0 18.1 ± 1.7 35.2 ± 1.4 11.1 ± 0.1 15.4 ± 0.2 11.8 ± 0.5 53.4 ± 7.5 NA
4 18.6 ± 1.4 9.3 ± 0.6 15.7 ± 0.2 40.4 ± 2.0 7.9 ± 0.1 7.3 ± 0.6 6.8 ± 0.1 10.8 ± .5
n-Hexacosane 1 14.4 ± 0.3 3.1 ± 0.2 19.0 ± 0.6 15.2 ± 0.6 12.4 ± 0.8 4.0 ± 0.2 15.5 ± 0.6 10.9 ± 0.2
2 9.9 ± 1.7 1.3 ± 0.2 10.5 ± 0.1 7.1 ± 0.9 8.8 ± 0.7 5.8 ± 0.8 7.1 ± 0.8 4.7 ± 0.1
3 13.8 ± 1.9 8.1 ± 0.1 20.0 ± 1.4 7.5 ± 0.2 7.2 ± 0.9 3.4 ± 0.2 27.8 ± 4.7 NA
4 9.5 ± 0.8 3.4 ± 0.2 4.0 ± 0.6 30.1 ± 2.5 2.9 ± 0.2 2.5 ± 0.1 2.6 ± 0.3 12.8 ± 1.5
n-Heptacosane 1 48.4 ± 5.0 35.5 ± 3.1 90.3 ± 2.2 74.7 ± 4.7 61.8 ± 2.1 48.7 ± 0.1 131.6 ± 0.5 98.1 ± 9.9
2 67.3 ± 2.5 28.1 ± 1.0 37.8 ± 2.9 42.0 ± 1.1 44.8 ± 4.3 27.2 ± 1.3 46.7 ± 5.7 42.7 ± 2.4
3 68.6 ± 7.8 41.9 ± 1.2 119.0 ± 15.6 24.4 ± 0.2 32.5 ± 2.5 26.3 ± 0.7 126.9 ± 17.7 NA
4 61.5 ± 7.8 19.1 ± 2.7 32.7 ± 1.2 83.3 ± 1.9 26.3 ± 3.2 15.8 ± 1.5 26.7 ± 4.2 25.8 ± 3.5
n-Nonacosane 1 87.3 ± 9.7 43.8 ± 1.3 152.4 ± 4.0 152.1 ± 3.5 116.7 ± 7.1 63.2 ± 1.2 178.7 ± 4.7 149.9 ± 12.4
2 81.9 ± 41.8 46.5 ± 3.2 61.5 ± 8.2 78.6 ± 3.6 62.9 ± 6.3 48.9 ± 2.4 51.4 ± 7.2 87.8 ± 14.4

123
3 114.3 ± 21.8 65.7 ± 6.2 144.0 ± 33.1 69.6 ± 0.1 30.0 ± 1.0 37.4 ± 0.5 132.5 ± 4.5 NA
4 71.2 ± 4.7 34.1 ± 2.2 51.8 ± 4.0 175.9 ± 19.1 48.5 ± 6.8 27.2 ± 0.1 30.0 ± 2.0 37.2 ± 1.1
n-Hentriacontane 1 169.0 ± 5.6 38.2 ± 4.8 154.4 ± 11.0 200.8 ± 1.8 163.6 ± 16.9 81.0 ± 10.4 265.6 ± 16.1 183.2 ± 19.8
2 136.2 ± 5.1 54.5 ± 3.8 64.5 ± 4.5 129.5 ± 5.9 97.7 ± 8.3 89.9 ± 8.3 88.0 ± 13.7 163.7 ± 49.1
3 181.6 ± 32.8 83.3 ± 6.3 168.7 ± 33.3 54.8 ± 4.8 91.4 ± 8.0 50.3 ± 4.0 244.8 ± 12.4 NA
4 202.7 ± 10.3 44.1 ± 5.0 72.4 ± 2.2 163.6 ± 17.0 76.8 ± 11.5 41.3 ± 1.9 46.5 ± 4.1 63.0 ± 11.4
n-Tritriacontane 1 53.3 ± 2.8 79.6 ± 1.7 90.9 ± 8.7 83.1 ± 3.3 114.6 ± 7.2 76.8 ± 0.4 195.6 ± 2.2 86.3 ± 2.7
2 66.5 ± 10.4 25.9 ± 0.5 37.5 ± 0.3 39.8 ± 1.9 47.4 ± 1.0 35.0 ± 2.6 68.2 ± 6.8 24.5 ± 12.3
3 74.1 ± 8.3 54.2 ± 3.0 77.1 ± 0.8 37.7 ± 2.3 68.7 ± 4.5 53.7 ± 0.1 311.9 ± 39.5 NA
4 112.6 ± 7.5 25.2 ± 0.6 29.5 ± 1.1 84.5 ± 0.8 39.6 ± 2.0 17.3 ± 1.9 30.5 ± 1.0 23.3 ± 5.1
Total n-alkanes
1 444.3 ± 12.7 266.0 ± 6.7 726.1 ± 15.4 664.1 ± 7.3 550.0 ± 20.1 372.4 ± 33.7 939.4 ± 17.1 698.1 ± 25.9
2 472.1 ± 43.6 199.5 ± 5.3 260.7 ± 10.2 371.3 ± 7.8 316.0 ± 12.0 255.1 ± 9.3 302.3 ± 18.0 386.8 ± 52.7
3 549.7 ± 41.2 312.5 ± 9.6 705.7 ± 49.8 227.7 ± 5.3 297.8 ± 9.9 208.2 ± 4.1 964.2 ± 46.3 NA
4 531.4 ± 16.1 155.4 ± 6.1 251.0 ± 5.1 685.8 ± 25.9 216.1 ± 13.9 125.8 ± 3.2 158.6 ± 6.3 194.7 ± 13.1
NA = not analyzed (the lower horizon soil sample for the warming +N+P fertilization treatment of block 3 was unavailable)
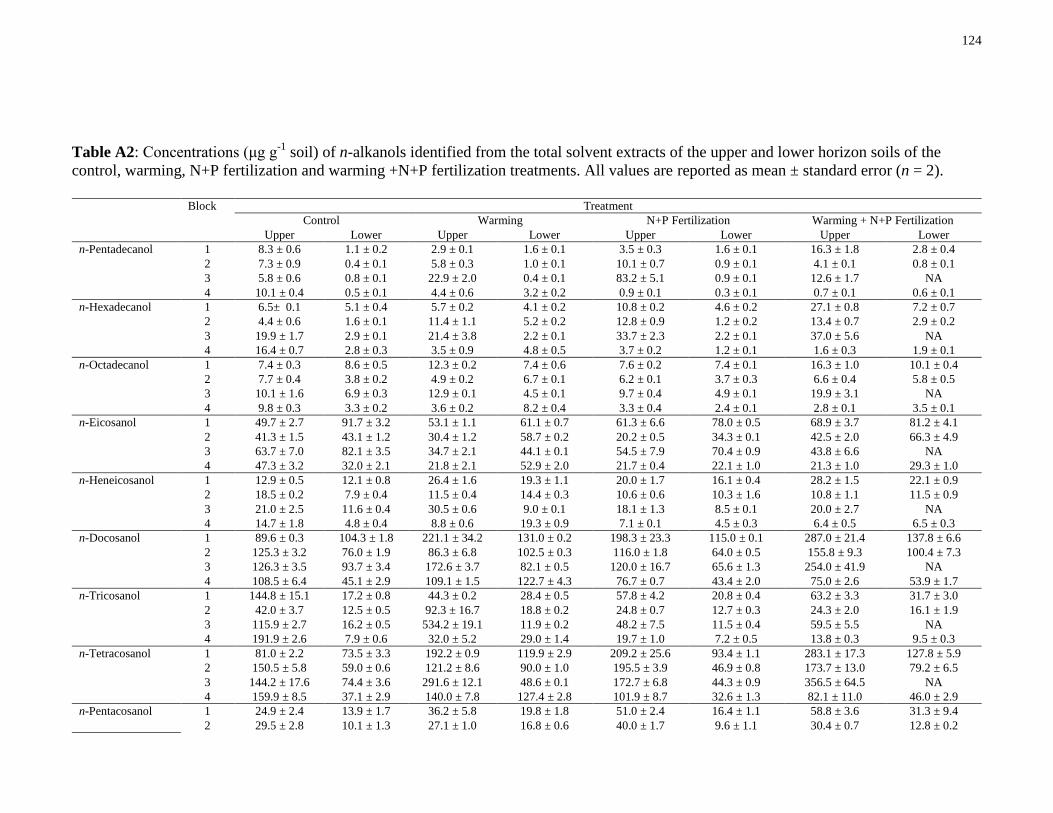
124
Table A2: Concentrations (μg g-1
soil) of n-alkanols identified from the total solvent extracts of the upper and lower horizon soils of the
control, warming, N+P fertilization and warming +N+P fertilization treatments. All values are reported as mean ± standard error (n = 2).
Block Treatment
Control Warming N+P Fertilization Warming + N+P Fertilization
Upper Lower Upper Lower Upper Lower Upper Lower
n-Pentadecanol 1 8.3 ± 0.6 1.1 ± 0.2 2.9 ± 0.1 1.6 ± 0.1 3.5 ± 0.3 1.6 ± 0.1 16.3 ± 1.8 2.8 ± 0.4
2 7.3 ± 0.9 0.4 ± 0.1 5.8 ± 0.3 1.0 ± 0.1 10.1 ± 0.7 0.9 ± 0.1 4.1 ± 0.1 0.8 ± 0.1
3 5.8 ± 0.6 0.8 ± 0.1 22.9 ± 2.0 0.4 ± 0.1 83.2 ± 5.1 0.9 ± 0.1 12.6 ± 1.7 NA
4 10.1 ± 0.4 0.5 ± 0.1 4.4 ± 0.6 3.2 ± 0.2 0.9 ± 0.1 0.3 ± 0.1 0.7 ± 0.1 0.6 ± 0.1
n-Hexadecanol 1 6.5± 0.1 5.1 ± 0.4 5.7 ± 0.2 4.1 ± 0.2 10.8 ± 0.2 4.6 ± 0.2 27.1 ± 0.8 7.2 ± 0.7
2 4.4 ± 0.6 1.6 ± 0.1 11.4 ± 1.1 5.2 ± 0.2 12.8 ± 0.9 1.2 ± 0.2 13.4 ± 0.7 2.9 ± 0.2
3 19.9 ± 1.7 2.9 ± 0.1 21.4 ± 3.8 2.2 ± 0.1 33.7 ± 2.3 2.2 ± 0.1 37.0 ± 5.6 NA
4 16.4 ± 0.7 2.8 ± 0.3 3.5 ± 0.9 4.8 ± 0.5 3.7 ± 0.2 1.2 ± 0.1 1.6 ± 0.3 1.9 ± 0.1
n-Octadecanol 1 7.4 ± 0.3 8.6 ± 0.5 12.3 ± 0.2 7.4 ± 0.6 7.6 ± 0.2 7.4 ± 0.1 16.3 ± 1.0 10.1 ± 0.4
2 7.7 ± 0.4 3.8 ± 0.2 4.9 ± 0.2 6.7 ± 0.1 6.2 ± 0.1 3.7 ± 0.3 6.6 ± 0.4 5.8 ± 0.5
3 10.1 ± 1.6 6.9 ± 0.3 12.9 ± 0.1 4.5 ± 0.1 9.7 ± 0.4 4.9 ± 0.1 19.9 ± 3.1 NA
4 9.8 ± 0.3 3.3 ± 0.2 3.6 ± 0.2 8.2 ± 0.4 3.3 ± 0.4 2.4 ± 0.1 2.8 ± 0.1 3.5 ± 0.1
n-Eicosanol 1 49.7 ± 2.7 91.7 ± 3.2 53.1 ± 1.1 61.1 ± 0.7 61.3 ± 6.6 78.0 ± 0.5 68.9 ± 3.7 81.2 ± 4.1
2 41.3 ± 1.5 43.1 ± 1.2 30.4 ± 1.2 58.7 ± 0.2 20.2 ± 0.5 34.3 ± 0.1 42.5 ± 2.0 66.3 ± 4.9
3 63.7 ± 7.0 82.1 ± 3.5 34.7 ± 2.1 44.1 ± 0.1 54.5 ± 7.9 70.4 ± 0.9 43.8 ± 6.6 NA
4 47.3 ± 3.2 32.0 ± 2.1 21.8 ± 2.1 52.9 ± 2.0 21.7 ± 0.4 22.1 ± 1.0 21.3 ± 1.0 29.3 ± 1.0
n-Heneicosanol 1 12.9 ± 0.5 12.1 ± 0.8 26.4 ± 1.6 19.3 ± 1.1 20.0 ± 1.7 16.1 ± 0.4 28.2 ± 1.5 22.1 ± 0.9
2 18.5 ± 0.2 7.9 ± 0.4 11.5 ± 0.4 14.4 ± 0.3 10.6 ± 0.6 10.3 ± 1.6 10.8 ± 1.1 11.5 ± 0.9
3 21.0 ± 2.5 11.6 ± 0.4 30.5 ± 0.6 9.0 ± 0.1 18.1 ± 1.3 8.5 ± 0.1 20.0 ± 2.7 NA
4 14.7 ± 1.8 4.8 ± 0.4 8.8 ± 0.6 19.3 ± 0.9 7.1 ± 0.1 4.5 ± 0.3 6.4 ± 0.5 6.5 ± 0.3
n-Docosanol 1 89.6 ± 0.3 104.3 ± 1.8 221.1 ± 34.2 131.0 ± 0.2 198.3 ± 23.3 115.0 ± 0.1 287.0 ± 21.4 137.8 ± 6.6
2 125.3 ± 3.2 76.0 ± 1.9 86.3 ± 6.8 102.5 ± 0.3 116.0 ± 1.8 64.0 ± 0.5 155.8 ± 9.3 100.4 ± 7.3
3 126.3 ± 3.5 93.7 ± 3.4 172.6 ± 3.7 82.1 ± 0.5 120.0 ± 16.7 65.6 ± 1.3 254.0 ± 41.9 NA
4 108.5 ± 6.4 45.1 ± 2.9 109.1 ± 1.5 122.7 ± 4.3 76.7 ± 0.7 43.4 ± 2.0 75.0 ± 2.6 53.9 ± 1.7
n-Tricosanol 1 144.8 ± 15.1 17.2 ± 0.8 44.3 ± 0.2 28.4 ± 0.5 57.8 ± 4.2 20.8 ± 0.4 63.2 ± 3.3 31.7 ± 3.0
2 42.0 ± 3.7 12.5 ± 0.5 92.3 ± 16.7 18.8 ± 0.2 24.8 ± 0.7 12.7 ± 0.3 24.3 ± 2.0 16.1 ± 1.9
3 115.9 ± 2.7 16.2 ± 0.5 534.2 ± 19.1 11.9 ± 0.2 48.2 ± 7.5 11.5 ± 0.4 59.5 ± 5.5 NA
4 191.9 ± 2.6 7.9 ± 0.6 32.0 ± 5.2 29.0 ± 1.4 19.7 ± 1.0 7.2 ± 0.5 13.8 ± 0.3 9.5 ± 0.3
n-Tetracosanol 1 81.0 ± 2.2 73.5 ± 3.3 192.2 ± 0.9 119.9 ± 2.9 209.2 ± 25.6 93.4 ± 1.1 283.1 ± 17.3 127.8 ± 5.9
2 150.5 ± 5.8 59.0 ± 0.6 121.2 ± 8.6 90.0 ± 1.0 195.5 ± 3.9 46.9 ± 0.8 173.7 ± 13.0 79.2 ± 6.5
3 144.2 ± 17.6 74.4 ± 3.6 291.6 ± 12.1 48.6 ± 0.1 172.7 ± 6.8 44.3 ± 0.9 356.5 ± 64.5 NA
4 159.9 ± 8.5 37.1 ± 2.9 140.0 ± 7.8 127.4 ± 2.8 101.9 ± 8.7 32.6 ± 1.3 82.1 ± 11.0 46.0 ± 2.9
n-Pentacosanol 1 24.9 ± 2.4 13.9 ± 1.7 36.2 ± 5.8 19.8 ± 1.8 51.0 ± 2.4 16.4 ± 1.1 58.8 ± 3.6 31.3 ± 9.4
2 29.5 ± 2.8 10.1 ± 1.3 27.1 ± 1.0 16.8 ± 0.6 40.0 ± 1.7 9.6 ± 1.1 30.4 ± 0.7 12.8 ± 0.2

125
NA = not analyzed (the lower horizon soil sample for the warming +N+P fertilization treatment of block 3 was unavailable)
3 46.0 ± 6.7 14.9 ± 0.8 56.2 ± 4.3 8.9 ± 1.7 41.6 ± 4.6 8.0 ± 1.6 94.4 ± 15.8 NA
4 45.0 ± 3.1 6.5 ± 0.3 19.9 ± 1.6 26.2 ± 1.0 13.8 ± 0.1 7.6 ± 0.3 16.8 ± 0.3 8.4 ± 0.1
n-Hexacosanol 1 63.3 ± 2.1 52.5 ± 6.4 151.8 ± 0.6 87.3 ± 0.4 157.4 ± 8.5 64.4 ± 1.3 392.4 ± 25.1 107.2 ± 7.9
2 114.3 ± 2.1 41.4 ± 0.1 107.2 ± 14.6 68.3 ± 0.4 418.8 ± 38.5 38.5 ± 0.2 174.3 ± 22.3 59.1 ± 4.4
3 106.4 ± 12.5 57.1 ± 4.7 414.2 ± 17.5 39.0 ± 1.1 183.9 ± 22.1 33.0 ± 0.4 402.4 ± 73.0 NA
4 155.1 ± 12.3 26.2 ± 1.5 109.8 ± 2.7 114.3 ± 9.4 68.8 ± 0.1 26.8 ± 0.9 67.1 ± 0.3 41.7 ± 0.8
n-Heptacosanol 1 18.6 ± 0.1 9.5 ± 1.2 31.2 ± 0.3 15.4 ± 2.5 50.9 ± 3.2 10.6 ± 0.2 78.1 ± 12.3 25.4 ± 4.1
2 40.1 ± 4.3 7.8 ± 1.3 23.4 ± 0.8 14.9 ± 0.7 52.4 ± 2.9 7.8 ± 0.1 37.7 ± 5.0 9.0 ± 1.4
3 34.6 ± 2.1 11.4 ± 1.0 67.0 ± 5.2 7.5 ± 0.2 32.2 ± 4.7 8.3 ± 1.2 95.7 ± 16.3 NA
4 37.7 ± 2.8 4.1 ± 0.5 20.0 ± 0.6 42.7 ± 2.1 17.1 ± 0.2 6.1 ± 0.5 13.8 ± 1.6 8.1 ± 0.3
n-Octacosanol 1 86.3 ± 11.8 53.6 ± 5.3 151.3 ± 1.2 112.3 ± 2.6 194.4 ± 19.3 71.7 ± 13.8 622.2 ± 39.5 146.8 ± 7.6
2 143.1 ± 8.2 50.3 ± 2.1 97.3 ± 19.7 88.7 ± 2.4 408.2 ± 47.3 50.0 ± 0.1 257.8 ± 37.4 69.9 ± 6.8
3 130.3 ± 2.8 64.3 ± 0.6 381.8 ± 47.4 53.3 ± 1.5 95.5 ± 4.8 42.4 ± 2.1 758.2 ± 128.1 NA
4 118.2 ± 19.1 30.2 ± 2.1 127.2 ± 0.4 115.4 ± 9.2 116.5 ± 6.2 35.8 ± 1.8 73.2 ± 2.6 48.6 ± 1.5
n-Nonacosan-10-ol 1 21.5 ± 0.3 9.6 ± 0.1 35.4 ± 1.9 25.0 ± 3.6 93.3 ± 3.4 12.3 ± 0.9 123.0 ± 2.8 14.7 ± 0.7
2 21.2 ± 0.5 11.6 ± 0.2 42.4 ± 1.0 9.8 ± 0.6 80.9 ± 0.9 8.8 ± 0.6 57.8 ± 0.9 9.0 ± 0.4
3 44.9 ± 3.8 13.1 ± 0.4 72.9 ± 1.0 6.3 ± 0.1 38.7 ± 3.6 8.9 ± 0.8 158.7 ± 13.4 NA
4 46.8 ± 1.5 8.5 ± 1.0 85.7 ± 2.4 27.5 ± 0.2 18.9 ± 1.8 8.3 ± 0.8 18.5 ± 2.7 6.2 ± 1.2
n-Triacontanol 1 54.2 ± 4.3 28.2 ± 1.4 107.2 ± 3.2 66.2 ± 3.3 131.4 ± 5.5 56.6 ± 0.3 279.8 ± 14.2 67.7 ± 0.1
2 69.4 ± 5.5 18.8 ± 0.3 72.7 ± 10.9 29.5 ± 1.8 126.9 ± 9.4 22.2 ± 0.7 93.7 ± 11.3 29.5 ± 2.5
3 78.0 ± 8.9 32.0 ± 2.8 199.6 ± 6.5 21.9 ± 0.4 113.1 ± 11.4 32.7 ± 1.5 307.1 ± 36.1 NA
4 132.3 ± 17.2 20.2 ± 1.6 55.8 ± 3.2 81.0 ± 0.8 46.3 ± 1.3 15.0 ± 1.2 34.3 ± 1.9 23.2 ± 1.5
n-Dotriacontanol 1 23.0 ± 3.5 7.3 ± 1.3 71.1 ± 3.3 29.5 ± 1.4 71.4 ± 0.1 19.8 ± 2.2 119.0 ± 0.9 17.2 ± 7.5
2 53.8 ± 2.9 5.4 ± 0.4 34.7 ± 2.0 14.7 ± 1.3 70.1 ± 2.7 10.2 ± 0.1 45.1 ± 6.0 12.8 ± 0.3
3 51.6 ± 0.2 15.5 ± 2.5 102.6 ± 15.0 12.6 ± 1.8 79.6 ± 10.4 11.0 ± 0.4 179.8 ± 27.0 NA
4 64.8 ± 7.6 11.1 ± 1.3 21.7 ± 2.9 43.3 ± 0.5 13.9 ± 0.6 10.4 ± 0.2 16.8 ± 0.3 10.2 ± 1.7
Short-chain vs. long-chain n-alkanols
Short-chain C15-C19 1 22.1 ± 0.7 14.7 ± 0.7 20.9 ± 0.3 13.1 ± 0.6 21.9 ± 0.4 13.6 ± 0.1 60.0 ± 2.2 23.9 ± 0.9
Long-chain C20-C32 669.9 ± 20.5 473.5 ± 10.2 1121.3 ± 35.1 715.2 ± 7.3 1296.4 ± 42.1 575.2 ± 51.4 2403.6 ± 57.9 810.9 ± 19.7
Short-chain C15-C19 2 19.5 ± 1.1 5.8 ± 0.2 22.0 ± 1.2 12.9 ± 0.3 29.0 ± 1.2 5.8 ± 0.3 24.1 ± 0.8 11.3 ± 0.5
Long-chain C20-C32 849.0 ± 14.0 344.0 ± 6.2 746.5 ± 33.5 527.1 ± 3.7 1564.5 ± 62.0 315.5 ± 2.3 1104.0 ± 48.5 475.7 ± 14.1
Short-chain C15-C19 3 35.7 ± 2.4 10.5 ± 0.3 57.1 ± 4.3 7.1 ± 0.1 126.7 ± 5.7 8.0 ± 0.1 69.5 ± 6.6 NA
Long-chain C20-C32 962.8 ± 29.3 486.4 ± 8.7 2358.0 ± 58.2 345.3 ± 3.5 998.0 ± 35.4 344.6 ± 3.9 2730.1 ± 174.5 NA
Short-chain C15-C19 4 36.3 ± 0.8 6.6 ± 0.4 11.5 ± 1.1 16.2 ± 0.7 7.9 ± 0.5 3.8 ± 0.1 5.1 ± 0.3 7.3 ± 0.1
Long-chain C20-C32 1122.19 ± 34.2 233.6 ± 5.9 751.8 ± 11.4 801.7 ± 14.6 522.4 ± 11.0 220.0 ± 3.7 439.1 ± 12.2 291.8 ± 4.7
Total n-alkanols
1 692.0 ± 20.5 488.2 ± 10.2 1142.2 ± 35.1 728.3 ± 7.3 1318.3 ± 42.1 588.8 ± 51.4 2463.3 ± 57.9 834.7 ± 19.7
2 868.5 ± 14.1 349.8 ± 3.8 768.6 ± 33.5 540.0 ± 3.7 1593.5 ± 62.0 321.3 ± 2.4 1128.1 ± 48.5 487.0 ± 14.1
3 998.6 ± 29.4 497.0 ± 8.7 2415.1 ± 58.4 352.4 ± 3.2 1124.7 ± 35.8 352.6 ± 3.9 2800.0 ± 174.7 NA
4 1158.5 ± 34.2 240.2 ± 5.9 763.4 ± 11.4 817.9 ± 14.6 530.3 ± 11.0 223.8 ± 3.7 444.2 ± 12.2 299.1 ± 4.7

126
Table A3: Concentrations (μg g-1
soil) of n-alkanoic acids and total aliphatic compounds identified from the total solvent extracts of the upper
and lower horizon soils of the control, warming, N+P fertilization and warming +N+P fertilization treatments. All values are reported as mean
± standard error (n = 2).
Block Treatment
Control Warming N+P Fertilization Warming + N+P Fertilization
Upper Lower Upper Lower Upper Lower Upper Lower
n-Tetradecanoic acid 1 51.1 ± 1.8 6.8 ± 0.6 30.2 ± 0.2 14.2 ± 0.1 32.4 ± 5.4 9.7 ± 0.1 93.0 ± 4.7 18.4 ± 1.0
2 26.4 ± 1.7 3.9 ± 0.2 35.4 ± 0.3 8.9 ± 0.3 26.4 ± 0.8 4.7 ± 0.3 24.2 ± 1.5 5.5 ± 0.5
3 32.8 ± 3.8 5.3 ± 0.3 124.6 ± 12.8 3.9 ± 0.2 357.6 ± 1.7 3.6 ± 0.1 42.9 ± 3.9 NA
4 122.9 ± 1.9 4.2 ± 0.4 22.5 ± 1.7 19.2 ± 0.4 9.6 ± 1.5 2.0 ± 0.1 5.8 ± 0.6 3.5 ± 0.2
n-Pentadecanoic acid 1 8.4 ± 0.6 4.7 ± 0.5 13.7 ± 0.1 7.2 ± 0.5 10.9 ± 1.0 5.6 ± 0.1 27.1 ± 1.5 8.1 ± 0.1
2 12.2 ± 1.1 1.6 ± 0.1 8.2 ± 0.3 5.0 ± 0.3 12.5 ± 0.1 2.0 ± 0.1 6.2 ± 0.4 2.9 ± 0.2
3 11.4 ± 1.0 4.0 ± 0.1 24.7 ± 1.3 2.3 ± 0.1 16.0 ± 1.6 2.9 ± 0.1 16.5 ± 1.9 NA
4 38.3 ± 2.4 2.7 ± 0.1 5.6 ± 0.5 9.8 ± 0.1 3.7 ± 0.2 1.1 ± 0.1 1.9 ± 0.1 1.8 ± 0.1
n-Hexadecenoic acid (C16:1) 1 16.9 ± 0.4 1.8 ± 0.2 19.3 ± 1.5 4.3 ± 0.2 13.6 ± 1.9 2.6 ± 0.1 22.9 ± 3.2 6.0 ± 0.1
2 10.5 ± 0.5 0.7 ± 0.1 9.1 ± 0.6 4.6 ± 0.1 13.0 ± 0.1 1.1 ± 0.1 5.4 ± 0.2 ND
3 16.2 ± 1.9 1.4 ± 0.1 51.5 ± 1.2 1.0 ± 0.1 27.8 ± 0.1 1.0 ± 0.1 25.4 ± 2.8 NA
4 17.6 ± 2.3 1.5 ± 0.1 10.7 ± 0.7 10.0 ± 0.1 3.2 ± 0.1 0.3 ± 0.1 1.6 ± 0.1 0.7 ± 0.1
n-Hexadecanoic Acid 1 116.5 ± 1.3 39.0 ± 0.9 120.2 ± 2.0 65.1 ± 0.7 135.8 ± 22.2 41.7 ± 0.6 232.9 ± 14.4 75.8 ± 4.2
2 86.2 ± 4.1 22.1 ± 0.6 107.7 ± 11.9 49.9 ± 0.9 177.1 ± 0.7 20.1 ± 0.5 110.6 ± 2.2 29.0 ± 2.7
3 148.8 ± 14.8 24.9 ± 1.0 361.1 ± 3.5 17.5 ± 0.4 147.7 ± 19.0 15.9 ± 0.3 249.4 ± 34.3 NA
4 137.4 ± 9.3 22.7 ± 0.5 80.8 ± 3.2 65.9 ± 2.7 52.4 ± 2.8 10.9 ± 1.5 34.3 ± 1.5 17.2 ± 0.3
n-Heptadecanoic Acid 1 10.6 ± 0.1 5.7 ± 0.1 9.3 ± 0.4 6.3 ± 1.0 8.4 ± 1.3 4.7 ± 0.1 13.6 ± 2.4 9.3 ± 0.6
2 7.2 ± 0.1 2.2 ± 0.1 6.6 ± 0.9 7.9 ± 0.2 10.5 ± 0.4 3.1 ± 0.1 5.8 ± 0.1 4.3 ± 0.3
3 13.8 ± 1.9 4.5 ± 0.2 15.7 ± 1.7 1.9 ± 0.1 12.3 ± 0.4 2.9 ± 0.1 19.2 ± 3.0 NA
4 10.6 ± 2.0 2.5 ± 0.1 4.4 ± 0.8 10.9 ± 0.7 3.4 ± 0.1 1.4 ± 0.1 2.3 ± 0.1 2.7 ± 0.1
n-Octadecadienoic acid (C18:2) 1 10.6 ± 0.5 2.6 ± 0.4 26.8 ± 1.1 6.8 ± 0.6 49.8 ± 10.0 3.8 ± 0.3 82.8 ± 6.3 8.4 ± 0.5
2 19.1 ± 0.8 0.8 ± 0.1 25.4 ± 3.7 7.6 ± 0.3 45.3 ± 1.5 1.8 ± 0.1 21.0 ± 1.3 1.7 ± 0.1
3 24.8 ± 3.5 1.3 ± 0.1 177.2 ± 3.5 1.9 ± 0.1 62.3 ± 6.9 1.5 ± 0.1 65.9 ± 6.6 NA
4 71.6 ± 7.4 3.3 ± 0.1 24.3 ± 1.4 20.8 ± 0.3 9.6 ± 0.8 0.8 ± 0.1 7.9 ± 0.5 2.0 ± 0.2
n-Octadecenoic acid (C18:1) 1 39.7 ± 1.0 5.2 ± 0.1 64.9 ± 1.1 15.8 ± 0.5 78.6 ± 13.1 11.9 ± 2.1 143.3 ± 12.3 19.7 ± 1.6
2 45.6 ± 2.1 1.8 ± 0.1 73.1 ± 8.9 19.3 ± 0.1 83.2 ± 1.3 7.1 ± 0.9 41.6 ± 2.0 5.3 ± 0.1
3 63.4 ± 6.4 4.1 ± 0.2 341.6 ± 9.5 3.8 ± 0.2 120.0 ± 15.8 2.5 ± 0.1 114.5 ± 17.8 NA
4 149.9 ± 18.3 8.8 ± 0.4 91.2 ± 0.9 44.3 ± 3.1 28.2 ± 1.4 2.1 ± 0.2 15.4 ± 0.6 4.9 ± 0.3
n-Octadecenoic acid (C18:1) 1 17.0 ± 1.1 5.3 ± 0.9 26.8 ± 0.3 10.0 ± 0.4 23.1 ± 3.6 5.3 ± 0.3 37.6 ± 4.2 10.6 ± 0.8
2 17.4 ± 2.1 1.7 ± 0.1 14.9 ± 1.8 8.1 ± 0.3 24.2 ± 0.3 1.9 ± 0.1 9.5 ± 0.8 2.8 ± 0.1
3 23.3 ± 2.1 4.2 ± 0.1 173.9 ± 12.7 2.4 ± 0.1 40.7 ± 3.8 2.3 ± 0.1 30.0 ± 3.6 NA
4 23.8 ± 2.0 2.3 ± 0.1 20.7 ± 1.0 15.3 ± 0.8 4.1 ± 0.4 0.9 ± 0.1 3.0 ± 0.4 1.8 ± 0.1
n-Octadecanoic acid 1 83.6 ± 2.8 37.3 ± 0.1 75.5 ± 0.8 45.9 ± 0.3 102.5 ± 15.4 32.8 ± 0.5 146.4 ± 5.5 58.7 ± 3.7

127
2 53.3 ± 2.6 22.7 ± 0.4 71.4 ± 11.3 44.9 ± 0.5 105.9 ± 2.6 19.6 ± 0.2 61.9 ± 0.1 26.9 ± 2.6
3 121.7 ± 12.0 23.6 ± 0.9 138.5 ± 0.6 15.4 ± 0.5 75.9 ± 8.4 15.8 ± 0.1 128.6 ± 16.5 NA
4 103.0 ± 5.3 24.4 ± 0.2 32.1 ± 0.5 39.5 ± 1.7 27.9 ± 0.1 13.1 ± 2.3 25.4 ± 2.5 19.4 ± 0.4
n-Nonadecanoic acid 1 48.3 ± 2.5 32.0 ± 2.1 21.6 ± 0.3 28.5 ± 1.0 19.3 ± 2.3 24.5 ± 0.6 31.5 ± 1.7 48.1 ± 3.4
2 23.5 ± 1.1 20.0 ± 0.5 19.1 ± 1.7 48.0 ± 0.1 10.9 ± 0.5 20.2 ± 0.6 20.0 ± 0.3 25.5 ± 2.5
3 41.8 ± 4.2 25.6 ± 1.2 30.5 ± 0.1 12.8 ± 0.1 16.7 ± 0.3 17.8 ± 0.2 27.9 ± 3.8 NA
4 11.6 ± 2.5 17.3 ± 1.1 8.2 ± 0.3 19.6 ± 0.9 9.1 ± 0.1 10.6 ± 0.6 11.3 ± 0.6 21.2 ± 0.7
n-Eicosanoic acid 1 156.3 ± 9.2 164.0 ± 6.7 110.4 ± 1.5 138.4 ± 1.4 98.7 ± 14.6 156.1 ± 0.7 188.2 ± 10.6 200.1 ± 8.8
2 101.4 ± 2.5 102.9 ± 4.1 91.5 ± 6.8 160.8 ± 1.1 107.1 ± 3.1 99.8 ± 0.1 143.9 ± 6.0 148.1 ± 13.1
3 199.3 ± 25.5 124.6 ± 5.6 137.8 ± 1.4 86.2 ± 1.0 96.0 ± 15.0 107.1 ± 0.1 198.8 ± 29.1 NA
4 89.9 ± 5.7 78.6 ± 4.2 43.5 ± 2.9 88.9 ± 2.7 62.5 ± 0.3 54.1 ± 2.9 70.2 ± 1.8 83.1 ± 2.4
n-Heneicosanoic acid 1 75.4 ± 2.0 74.5 ± 2.5 75.2 ± 0.2 90.8 ± 1.2 79.5 ± 12.8 82.9 ± 2.6 88.9 ± 4.9 125.0 ± 4.9
2 64.4 ± 3.2 51.9 ± 1.9 50.2 ± 0.8 96.7 ± 0.1 37.2 ± 1.2 50.6 ± 0.2 56.6 ± 2.5 71.4 ± 7.0
3 104.9 ± 13.5 62.9 ± 2.0 67.6 ± 0.6 37.9 ± 0.8 65.3 ± 11.1 52.0 ± 0.4 68.9 ± 6.4 NA
4 84.7 ± 5.6 38.5 ± 2.3 28.2 ± 0.5 73.0 ± 2.2 29.6 ± 0.5 28.7 ± 1.7 33.6 ± 0.9 46.8 ± 1.7
n-Docosanoic acid 1 303.3 ± 16.8 270.0 ± 4.4 240.8 ± 2.0 274.9 ± 3.4 399.5 ± 69.0 310.0 ± 0.2 483.0 ± 24.9 355.4 ± 9.6
2 210.4 ± 5.9 191.3 ± 7.0 211.3 ± 10.9 267.3 ± 0.5 270.1 ± 4.3 186.0 ± 0.1 360.6 ± 17.4 278.3 ± 21.5
3 416.7 ± 53.2 220.7 ± 6.6 338.6 ± 0.8 206.3 ± 1.3 359.3 ± 46.2 191.9 ± 1.7 524.4 ± 84.2 NA
4 555.9 ± 21.9 144.1 ± 8.8 152.7 ± 1.8 231.0 ± 11.6 159.7 ± 0.7 118.6 ± 6.6 179.2 ± 4.8 159.8 ± 5.6
n-Tricosanoic acid 1 97.8 ± 2.3 107.5 ± 5.3 155.2 ± 1.5 151.8 ± 1.6 220.6 ± 29.3 146.0 ± 1.0 176.3 ± 4.7 194.1 ± 9.8
2 125.6 ± 7.0 84.9 ± 3.1 97.2 ± 2.1 148.7 ± 1.2 84.0 ± 3.6 80.4 ± 2.7 94.3 ± 6.1 118.2 ± 12.6
3 185.8 ± 26.2 94.9 ± 4.4 124.1 ± 1.0 66.1 ± 0.8 186.8 ± 24.0 70.5 ± 0.2 259.9 ± 31.2 NA
4 229.4 ± 12.3 58.2 ± 4.5 78.3 ± 5.8 168.7 ± 7.6 96.9 ± 15.8 50.3 ± 3.3 79.1 ± 13.7 72.8 ± 4.5
n-Tetracosanoic acid 1 304.3 ± 15.9 249.0 ± 1.2 339.7 ± 1.2 297.7 ± 6.8 526.1 ± 85.2 323.0 ± 13.8 571.9 ± 25.7 380.2 ± 32.8
2 247.6 ± 7.3 202.3 ± 7.3 271.1 ± 16.7 295.6 ± 2.9 215.4 ± 4.8 206.6 ± 4.7 374.5 ± 28.5 304.7 ± 37.1
3 464.7 ± 59.9 234.7 ± 6.6 385.0 ± 33.4 192.7 ± 6.7 662.0 ± 83.6 212.4 ± 1.9 544.4 ± 78.1 NA
4 993.7 ± 47.9 162.4 ± 13.5 205.6 ± 3.5 297.1 ± 6.6 184.2 ± 2.3 146.0 ± 7.0 192.5 ± 2.2 189.8 ± 11.4
n-Pentacosanoic acid 1 48.5 ± 1.1 69.0 ± 3.9 137.5 ± 0.7 118.0 ± 1.5 143.5 ± 24.8 116.4 ± 0.2 125.6 ± 7.8 149.2 ± 11.2
2 103.5 ± 2.4 59.5 ± 1.1 57.1 ± 1.9 109.6 ± 1.2 58.8 ± 2.8 63.5 ± 2.5 64.0 ± 3.9 87.7 ± 7.0
3 106.3 ± 18.9 65.1 ± 2.8 84.5 ± 0.6 54.2 ± 0.1 106.4 ± 12.4 48.3 ± 0.8 103.3 ± 8.2 NA
4 148.5 ± 15.9 39.4 ± 3.6 47.2 ± 2.4 154.1 ± 13.6 47.8 ± 3.1 40.4 ± 3.3 38.8 ± 1.2 56.0 ± 3.0
n-Hexacosanoic acid 1 106.8 ± 6.4 135.5 ± 7.9 254.1 ± 1.1 202.9 ± 2.4 413.2 ± 62.9 211.4 ± 0.4 515.8 ± 21.8 250.5 ± 10.5
2 199.0 ± 5.8 112.9 ± 7.0 159.4 ± 13.5 186.9 ± 5.1 238.1 ± 2.0 136.4 ±6.0 258.1 ± 28.0 184.6 ±21.6
3 263.5 ± 41.2 127.1 ± 2.7 308.8 ± 18.3 110.3 ± 0.3 321.9 ± 26.2 112.0 ± 4.1 637.7 ± 95.1 NA
4 500.8 ± 47.1 88.3 ± 9.1 165.9 ± 3.5 215.5 ± 18.9 114.9 ± 1.1 98.1 ± 6.9 106.6 ± 2.6 122.7 ± 4.3
n-Heptacosanoic acid 1 19.8 ± 0.9 31.7 ± 2.9 107.9 ± 1.6 77.3 ± 1.7 85.0 ± 9.5 82.3 ± 16.7 130.6 ± 6.9 92.3 ± 13.7
2 67.0 ± 1.5 31.1 ± 0.2 37.5 ± 6.0 70.8 ± 10.3 51.9 ± 4.5 39.6 ± 0.8 43.8 ± 5.6 52.8 ± 3.2
3 54.4 ± 8.7 40.4 ± 4.0 74.7 ± 9.3 32.0 ± 3.1 43.5 ± 4.5 33.2 ± 2.4 91.9 ± 8.1 NA
4 56.8 ± 5.7 18.3 ± 1.6 32.8 ± 2.8 84.6 ± 5.2 28.4 ± 0.7 25.9 ± 2.6 27.7 ± 0.1 32.7 ± 2.9
n-Octacosanoic acid 1 65.6 ± 2.6 66.4 ± 2.7 230.9 ± 3.4 174.0 ± 8.6 279.1 ± 37.9 131.5 ± 1.0 555.8 ± 8.0 198.6 ± 6.5
2 171.6 ± 4.9 80.0 ± 9.5 126.2 ± 19.3 141.6 ± 5.9 269.0 ± 10.6 90.4 ± 2.1 254.0 ± 39.6 124.7 ± 14.7

128
NA = not analyzed (the lower horizon soil sample for the warming +N+P fertilization treatment of block 3 was unavailable) aTotal aliphatic compounds = total n-alkanes + total n-alkanols + total n-alkanoic acids (Otto and Simpson, 2005)
3 140.3 ± 3.0 82.1 ± 8.2 371.3 ± 36.3 71.9 ± 3.4 135.8 ± 1.3 66.1 ± 2.5 817.3 ± 145.5 NA
4 220.2 ± 17.8 42.6 ± 3.1 100.1 ± 9.4 188.6 ± 15.7 84.3 ± 0.4 68.1 ± 5.6 69.9 ± 3.8 79.7 ± 6.5
n-Nonacosanoic acid 1 33.4 ± 1.6 24.9 ± 4.1 103.8 ± 4.1 56.5 ± 1.4 120.2 ± 18.8 52.1 ± 3.5 148.7 ± 11.4 66.1 ± 10.6
2 53.9 ± 3.8 21.3 ± 1.3 43.5 ± 2.9 52.2 ± 1.6 32.2 ± 0.3 27.8 ± 1.9 44.4 ± 3.5 35.9 ± 5.4
3 57.3 ± 11.6 25.9 ± 4.6 70.6 ± 14.0 22.6 ± 0.8 59.0 ± 7.2 22.6 ± 1.3 207.3 ± 33.1 NA
4 78.7 ± 10.2 17.6 ± 2.5 28.4 ± 3.1 81.7 ± 3.0 28.7 ± 0.1 17.0 ± 2.1 23.1 ± 0.3 22.4 ± 1.2
n-Triacontanoic acid 1 51.1 ± 6.1 38.8 ± 2.0 159.9 ± 3.8 80.2 ± 5.3 196.7 ± 8.0 49.6 ± 0.5 342.4 ± 40.7 77.9 ± 8.1
2 146.3 ± 3.0 32.2 ± 5.3 81.1 ± 10.7 75.8 ± 7.1 228.1 ± 0.1 48.4 ± 3.0 164.1 ± 16.9 64.7 ± 7.4
3 102.0 ± 13.7 44.7 ± 6.4 306.4 ± 31.8 35.4 ± 0.9 161.3 ± 20.6 37.0 ± 2.0 1418.1 ± 215.2 NA
4 150.5 ± 18.2 28.6 ± 2.2 76.0 ± 1.8 108.2 ± 3.1 57.6 ± 2.6 31.9 ± 1.0 43.9 ± 2.1 40.6 ± 1.4
n-Hentriacontanoic acid 1 24.6 ± 0.1 11.9 ± 1.5 34.1 ± 2.2 32.7 ± 3.3 52.4 ± 5.6 23.5 ± 2.8 64.3 ± 7.2 44.5 ± 0.1
2 23.3 ± 3.8 13.1 ± 0.3 21.0 ± 0.4 19.6 ± 1.4 40.8 ± 2.5 15.6 ± 1.6 34.5 ± 2.1 20.8 ± 2.0
3 34.2 ± 2.0 13.6 ± 0.9 78.3 ± 8.6 11.1 ± 0.2 28.1 ± 1.2 14.6 ± 0.7 106.0 ± 8.7 NA
4 56.5 ± 0.7 10.3 ± 1.0 26.2 ± 1.4 34.3 ± 1.4 20.2 ± 1.9 7.7 ± 0.3 18.8 ± 2.6 11.7 ± 2.7
Short-chain vs. long-chain n-alkanoic acids
Short-chain C15-C19 1 402.7 ± 4.7 140.4 ± 2.6 408.4 ± 3.1 204.2 ± 1.9 474.5 ± 32.5 142.4 ± 3.1 831.1 ± 22.2 263.1 ± 6.9
Long-chain C20-C32 1286.7 ± 26.8 1243.3 ± 14.7 1949.4 ± 7.9 1695.0 ± 13.8 2614.5 ± 140.7 1684.9 ± 86.0 3391.5 ± 62.6 2134.01 ± 44.8
Short-chain C15-C19 2 301.4 ± 6.2 77.6 ± 0.9 371.0 ± 19.2 204.3 ± 1.2 508.8 ± 3.6 81.6 ± 1.3 306.4 ± 3.7 104.0 ± 4.5
Long-chain C20-C32 1514.06 ± 16.0 983.3 ± 17.4 1247.1 ± 34.1 1625.6 ± 15.3 1632.7 ± 14.7 1045.2 ± 9.6 1892.8 ± 62.4 1491.9 ± 55.2
Short-chain C15-C19 3 498.0 ± 21.5 99.0 ± 1.9 1439.4 ± 21.2 63.0 ± 0.7 877.1 ± 27.3 66.2 ± 0.4 720.3 ± 43.3 NA
Long-chain C20-C32 2129.6 ± 101.9 1012.2 ± 17.4 2347.6 ± 64.3 926.9 ± 8.5 2225.3 ± 106.7 967.8 ± 6.5 4978.05 ± 304.8 NA
Short-chain C15-C19 4 686.7 ± 23.1 90.0 ± 1.4 300.4 ± 4.3 255.3 ± 4.6 151.2 ± 3.6 43.2 ± 2.8 108.9 ± 3.1 75.4 ± 1.0
Long-chain C20-C32 3165.6 ± 79.1 648.2 ± 20.6 984.9 ± 13.7 1725.7 ± 32.9 914.8 ± 16.7 686.7 ± 14.7 883.6 ± 15.9 918.3 ± 16.7
Total n-alkanoic acids
1 1689.4 ± 27.3 1383.7 ± 14.9 2357.8 ± 8.4 1899.2 ± 14.0 3089.0 ± 144.4 1827.3 ± 86.1 4222.6 ± 66.4 2397.1 ± 45.3
2 1815.5 ± 17.2 1060.9 ± 17.4 1618.1 ± 39.1 1829.8 ± 15.4 2141.5 ± 15.1 1126.8 ± 9.6 2199.2 ± 62.5 1595.9 ± 55.4
3 2627.6 ± 104.2 1235.7 ± 17.5 3786.9 ± 67.7 989.8 ± 8.5 2540.9 ± 110.1 1033.9 ± 6.5 5698.3 ± 307.8 NA
4 3976.5 ± 82.4 816.8 ± 20.6 1285.4 ± 14.3 1981.0 ± 33.2 1065.9 ± 17.1 729.9 ± 15.0 992.5 ± 16.2 993.7 ± 16.8
Total aliphatic compoundsa
1 2825.8 ± 36.4 2137.9 ± 19.3 4226.2 ± 39.3 3291.6 ± 17.4 4957.2 ± 151.7 2788.5 ± 105.8 7625.3 ± 89.9 3929.9 ± 55.8
2 3156.0 ± 48.9 1610.2 ± 18.6 2647.3 ± 52.6 2741.1 ± 17.6 4050.9 ± 65.0 1703.2 ± 13.6 3629.6 ± 81.2 2469.7 ± 77.7
3 4175.8 ± 115.8 2045.2 ± 21.7 6907.7 ± 102.4 1569.9 ± 10.5 3963.4 ± 116.3 1594.7 ± 8.6 9462.1 ± 356.9 NA
4 5666.4 ± 90.7 1212.4 ± 22.3 2299.7 ± 19.0 3484.7 ± 44.6 1812.3 ± 24.6 1079.6 ± 15.7 1595.3 ± 21.3 1487.5 ± 21.8

129
Table A4: Concentrations (μg g-1
soil) of major compound classes identified in the total solvent extracts (excluding aliphatic compounds) of
the upper and lower horizon soils of the control, warming, N+P fertilization and warming +N+P fertilization treatments. All values are
reported as mean ± standard error (n = 2). Numbers in bold denote statistical significance from the control treatment (P < 0.05).
Block Treatment
Control Warming N+P Fertilization Warming + N+P Fertilization
Upper Lower Upper Lower Upper Lower Upper Lower
Simple carbohydrates
Glucose 1 132.3 ± 3.3 9.1 ± 0.9 147.8 ± 0.8 40.7 ± 1.4 163.7 ± 42.1 8.4 ± 1.5 607.2 ± 55.6 43.6 ± 1.1
2 193.9 ± 1.7 1.8 ± 0.3 220.1 ± 2.9 29.1 ± 0.5 55.8 ± 0.5 4.2 ± 2.4 187.3 ± 12.3 2.6 ± 0.5
3 292.2 ± 55.4 4.7 ± 0.2 795.8 ± 133.9 29.1 ± 2.1 1350.9 ± 172.0 10.0 ± 0.9 109.8 ± 15.4 NA
4 743.3 ± 14.7 32.2 ± 2.6 ND 127.7 ± 2.2 36.0 ± 8.6 2.8 ± 0.1 28.6 ± 2.1 4.7 ± 0.2
Galactose 1 155.7 ± 1.6 3.3 ± 0.5 64.1 ± 4.1 11.7 ± 0.6 44.5 ± 8.4 5.6 ± 0.2 380.7 ± 5.7 20.1 ± 0.9
2 56.3 ± 2.1 1.0 ± 0.1 109.5 ± 5.7 6.5 ± 0.2 32.3 ± 0.2 3.1 ± 0.8 49.4 ± 0.1 1.7 ± 0.3
3 54.9 ± 0.6 1.6 ± 0.2 216.3 ± 34.0 4.1 ± 0.3 996.3 ± 109.7 3.2 ± 0.1 41.6 ± 4.3 NA
4 236.2 ± 15.3 7.7 ± 1.2 30.0 ± 1.2 27.9 ± 0.3 8.5 ± 1.2 1.2 ± 0.1 4.7 ± 0.2 1.9 ± 0.1
Mannose 1 152.2 ± 6.2 11.0 ± 1.0 160.9 ± 2.3 45.1 ± 1.1 187.4 ± 37.8 9.2 ± 1.8 518.6 ± 29.3 48.0 ± 1.3
2 191.1 ± 1.3 2.1 ± 0.2 164.3 ± 11.5 37.2 ± 0.1 44.8 ± 2.0 8.2 ± 4.4 145.6 ± 26.8 3.7 ± 0.3
3 290.2 ± 75.6 6.3 ± 0.4 628.5 ± 129.9 33.0 ± 3.0 1670.5 ± 282.1 11.4 ± 1.3 120.1 ± 20.0 NA
4 542.7 ± 2.4 34.1 ± 2.5 ND 145.8 ± 3.2 34.8 ± 0.7 4.0 ± 0.4 25.9 ± 1.8 5.3 ± 0.1
Total simple carbohydrates
1 440.3 ± 7.2 23.4 ± 1.4 372.8 ± 4.7 97.4 ± 1.8 395.6 ± 57.1 23.2 ± 3.1 1506.4 ± 63.1 111.5 ± 1.9
2 441.3 ± 2.9 4.9 ± 0.3 493.9 ± 13.1 72.9 ± 0.6 132.9 ± 2.0 18.0 ± 5.1 382.3 ± 29.5 7.9 ± 0.7
3 637.3 ± 93.8 12.6 ± 0.5 1640.6 ± 189.6 66.2 ± 3.7 4017.7 ± 348.2 24.5 ± 1.6 271.5 ± 25.6 NA
4 1522.4 ± 21.4 74.0 ± 3.7 220.1 ± 119.1 301.4 ± 3.9 79.3 ± 8.7 7.9 ± 0.5 59.2 ± 2.8 11.9 ± 0.2
Cyclic compounds
Plant Steroids
Cholesterol 1 28.1 ± 0.8 11.4 ± 1.9 23.4 ± 2.6 8.8 ± 0.8 47.8 ± 5.9 15.6 ± 1.7 67.4 ± 4.5 ND
2 30.0 ± 0.1 6.7 ± 0.2 38.5 ± 0.3 9.9 ± 0.7 60.4 ± 2.7 3.8 ± 0.1 33.2 ± 2.0 ND
3 46.9 ± 1.5 5.5 ± 0.2 81.7 ± 1.1 3.2 ± 0.5 52.3 ± 3.6 2.5 ± 0.4 110.0 ± 10.4 NA
4 53.9 ± 5.5 5.7 ± 0.1 21.7 ± 2.6 19.7 ± 1.6 28.9 ± 0.1 4.2 ± 0.5 20.9 ± 1.9 ND
Campesterol 1 56.6 ± 1.1 47.9 ± 6.7 58.4 ± 3.7 86.1 ± 0.9 154.3 ± 24.3 102.0 ± 0.6 140.6 ± 18.5 46.8 ± 10.6
2 28.0 ± 1.6 10.7 ± 0.1 128.8 ± 22.2 21.1 ± 0.8 102.0 ± 10.6 14.1 ± 0.2 73.8 ± 1.7 20.7 ± 1.0
3 123.0 ± 23.7 23.0 ± 1.9 117.7 ± 0.2 9.4 ± 1.1 213.3 ± 29.2 21.3 ± 1.1 133.8 ± 16.6 NA
4 211.0 ± 81.8 26.7 ± 2.8 47.1 ± 4.2 22.8 ± 0.1 33.4 ± 4.0 7.5 ± 0.5 57.1 ± 0.5 5.0 ± 0.6
Ergosterol 1 ND ND ND ND ND ND ND ND
2 ND ND ND ND ND ND ND ND
3 ND ND ND ND ND ND ND ND
4 ND ND ND ND ND ND ND ND
Stigmasterol 1 51.4 ± 1.4 25.6 ± 1.7 87.1 ± 5.4 59.8 ± 3.4 99.2 ± 14.5 42.9 ± 1.6 144.3 ± 3.4 23.0 ± 4.4
2 48.2 ± 1.9 2.5 ± 0.1 65.8 ± 0.3 11.4 ± 1.4 143.1 ± 7.6 5.6 ± 0.7 76.5 ± 0.1 6.9 ± 1.7

130
3 79.0 ± 8.8 11.7 ± 0.4 157.2 ± 8.6 1.9 ± 0.1 103.1 ± 14.7 3.1 ± 0.2 319.7 ± 22.5 NA
4 101.2 ± 7.8 7.8 ± 0.1 42.7 ± 2.5 18.6 ± 0.8 42.4 ± 2.9 10.9 ± 0.5 32.9 ± 5.1 4.7 ± 0.1
β-Sitosterol 1 241.1 ± 3.9 181.6 ± 9.8 306.8 ± 14.4 300.0 ± 0.3 614.6 ± 97.4 289.6 ± 3.8 1097.9 ± 75.0 261.4 ± 5.3
2 204.1 ± 17.6 55.0 ± 0.1 631.6 ± 32.8 67.4 ± 1.1 1247.2 ± 34.9 54.1 ±0.2 610.2 ± 34.8 92.4 ± 6.2
3 526.7 ± 52.8 71.9 ± 2.8 1133.4 ± 8.0 47.8 ± 0.5 1194.9 ± 141.0 62.1 ± 0.9 1318.7 ± 152.2 NA
4 1778.9 ± 103.2 98.7 ± 2.1 278.2 ± 11.8 137.9 ± 2.1 333.5 ± 9.4 19.8 ± 1.5 192.0 ± 8.7 32.0 ± 0.1
Stigmasta-3,5-dien-7one 1 65.2 ± 1.6 32.7 ± 4.9 89.9 ± 32.0 80.7 ± 1.8 114.9 ± 12.0 63.9 ± 4.6 255.2 ± 22.9 81.2 ± 5.2
2 56.8 ± 14.1 13.9 ± 2.1 83.3 ± 5.1 18.8 ± 0.4 190.3 ± 14.7 9.7 ± 0.5 168.3 ± 22.2 18.7 ± 2.1
3 100.1 ± 8.5 14.1 ± 0.1 304.7 ± 17.2 10.7 ± 1.0 140.7 ± 18.6 12.7 ± 1.2 781.9 ± 101.7 NA
4 141.3 ± 9.7 11.3 ± 0.1 48.9 ± 4.2 51.2 ± 5.2 52.4 ± 3.5 6.1 ± 0.5 55.9 ± 4.6 11.7 ± 0.5
Sitosterone 1 50.7 ± 3.8 30.9 ± 3.0 130.7 ± 1.1 58.8 ± 9.0 148.9 ± 20.7 74.4 ± 3.7 220.3 ± 12.1 ND
2 85.8 ± 2.6 17.2 ± 0.1 89.8 ± 2.9 26.4 ± 0.3 257.7 ± 3.3 19.4 ± 0.2 119.8 ± 5.8 ND
3 73.7 ± 10.1 12.5 ± 0.9 187.8 ± 10.7 13.2 ± 0.8 120.4 ± 8.5 14.5 ± 0.1 502.4 ± 108.7 NA
4 124.1 ± 13.7 16.0 ± 1.4 53.7 ± 9.3 44.4 ± 1.4 57.5 ± 6.5 8.6 ± 1.1 49.2 ± 3.3 ND
Total plant steroids
1 493.0 ± 6.0 330.1 ± 13.4 696.3 ± 35.7 594.3 ± 9.9 1179.7 ± 104.4 588.3 ± 14.5 1925.6 ± 81.7 412.3 ± 13.7
2 453.0 ± 22.8 106.0 ± 2.1 1037.8 ± 40.0 155.1 ± 2.2 2000.7 ± 40.3 106.6 ± 1.0 1081.6 ± 41.7 138.8 ± 6.8
3 949.5 ± 60.1 138.7 ± 3.5 1982.5 ± 23.5 86.2 ± 1.8 1824.7 ± 146.2 116.2 ± 1.9 3166.6 ± 215.0 NA
4 2410.4 ± 133.1 166.3 ± 3.8 492.3 ± 16.6 294.7 ± 6.1 548.2 ± 12.9 57.1 ± 2.1 408.1 ± 11.7 53.3 ± 0.8
Triterpenoids
Oleanolic acid 1 54.4 ± 2.3 51.3 ± 3.6 292.2 ± 7.7 109.4 ± 0.4 226.1 ± 30.1 80.3 ± 2.9 598.3 ± 47.2 130.0 ± 0.7
2 233.8 ± 5.5 31.7 ± 1.4 247.6 ± 17.9 46.4 ± 0.9 319.4 ± 0.7 25.8 ± 2.4 198.8 ± 10.3 32.4 ± 2.0
3 113.9 ± 10.5 28.7 ± 3.6 887.7 ± 11.8 21.9 ± 0.6 166.0 ± 21.3 24.1 ± 1.3 1116.4 ± 185.4 NA
4 111.5 ± 8.7 25.9 ± 0.6 184.0 ± 21.0 76.6 ± 0.1 150.4 ± 1.3 12.4 ± 0.9 76.7 ± 0.2 14.4 ± 0.4
Ursolic acid 1 150.7 ± 2.2 150.6 ± 5.4 804.6 ± 12.5 325.7 ± 0.5 842.5 ± 127.2 233.3 ± 6.2 1950.2 ± 124.2 353.7 ± 2.3
2 597.8 ± 19.7 114.8 ± 4.8 758.1 ± 71.1 154.5 ± 7.0 833.1 ± 12.6 86.5 ± 2.2 616.1 ± 15.8 108.5 ± 3.5
3 343.3 ± 48.8 79.0 ± 6.5 3059.7 ± 35.0 63.2 ± 0.7 579.8 ± 86.0 66.0 ± 0.9 2626.0 ± 379.0 NA
4 349.6 ± 40.5 78.7 ± 3.1 711.4 ± 104.2 238.0 ± 1.0 540.3 ± 4.6 38.9 ± 1.9 224.8 ± 8.3 41.8 ± 1.7
Total triterpenoids
1 205.1± 3.2 202.0 ± 6.5 1096.6 ± 14.6 435.1 ± 0.6 1068.6 ± 130.7 313.7 ± 16.1 2548.5 ± 132.9 483.7 ± 2.4
2 831.7 ± 20.5 146.5 ± 5.0 1005.7 ± 73.3 200.9 ± 7.0 1152.5 ± 177.9 112.2 ± 3.3 814.9 ± 18.8 140.9 ± 4.0
3 457.3 ± 49.9 107.8 ± 7.5 3947.4 ± 37.0 85.1 ± 0.9 745.9 ± 88.6 90.2 ±1.6 3742.5 ± 421.9 NA
4 461.0 ± 41.4 104.7 ± 3.1 895.4 ± 106.3 314.6 ± 1.0 690.6 ± 4.8 51.3 ± 2.1 301.5 ± 8.3 56.2 ± 1.7
Total cyclic compoundsb
1 698.1 ± 6.8 532.0 ± 14.9 1793.0 ± 38.6 1029.4 ± 9.9 2248.2 ± 167.3 902.0 ± 21.7 4474.1 ± 156.0 896.0 ± 13.9
2 1284.7 ± 30.6 252.5 ± 5.5 2043.5.2 ± 83.5 356.0 ± 7.3 3153.3 ± 42.2 218.8 ± 3.4 1896.6 ± 45.8 279.7 ± 7.9
3 1406.7 ± 78.1 246.5 ± 8.3 5929.9 ± 43.8 171.3 ± 2.1 2570.5 ± 171.0 206.3 ± 2.4 6909.0 ± 473.5 NA
4 2871.4 ± 139.4 271.0 ± 4.9 1387.8 ± 107.6 609.3 ± 6.2 1238.9 ± 13.8 108.4 ± 3.0 709.6 ± 14.4 109.5 ± 1.9
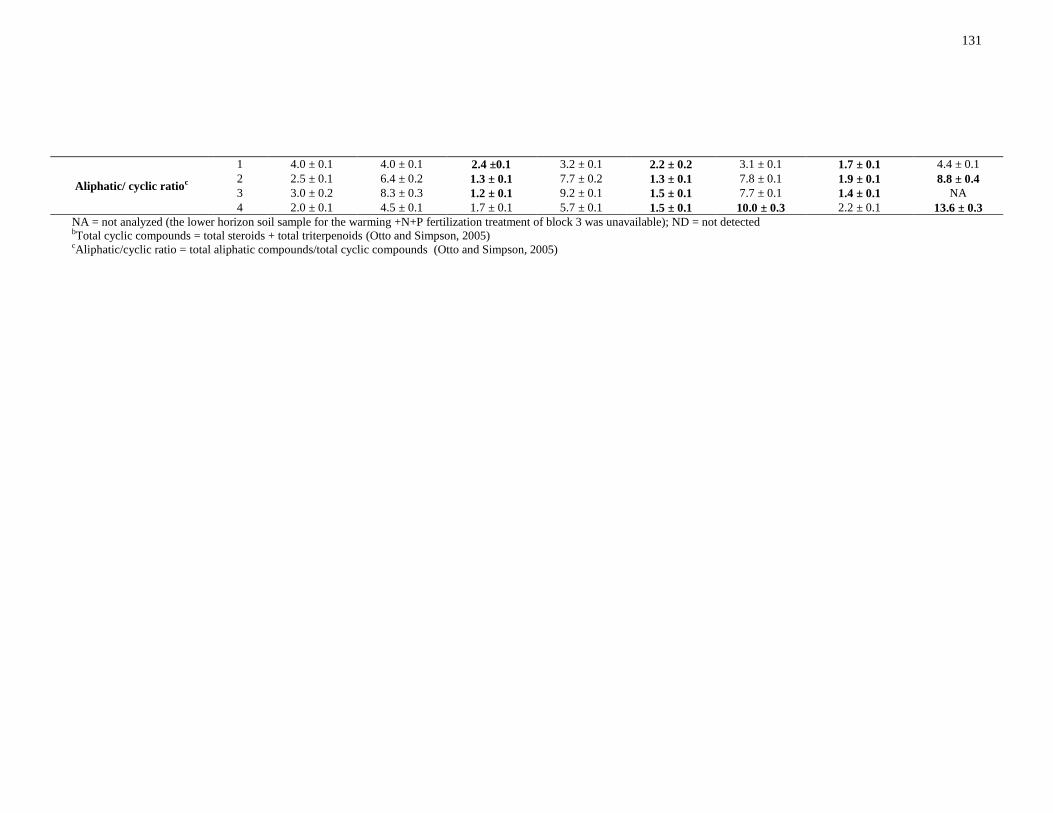
131
NA = not analyzed (the lower horizon soil sample for the warming +N+P fertilization treatment of block 3 was unavailable); ND = not detected bTotal cyclic compounds = total steroids + total triterpenoids (Otto and Simpson, 2005) cAliphatic/cyclic ratio = total aliphatic compounds/total cyclic compounds (Otto and Simpson, 2005)
Aliphatic/ cyclic ratioc
1 4.0 ± 0.1 4.0 ± 0.1 2.4 ±0.1 3.2 ± 0.1 2.2 ± 0.2 3.1 ± 0.1 1.7 ± 0.1 4.4 ± 0.1
2 2.5 ± 0.1 6.4 ± 0.2 1.3 ± 0.1 7.7 ± 0.2 1.3 ± 0.1 7.8 ± 0.1 1.9 ± 0.1 8.8 ± 0.4
3 3.0 ± 0.2 8.3 ± 0.3 1.2 ± 0.1 9.2 ± 0.1 1.5 ± 0.1 7.7 ± 0.1 1.4 ± 0.1 NA
4 2.0 ± 0.1 4.5 ± 0.1 1.7 ± 0.1 5.7 ± 0.1 1.5 ± 0.1 10.0 ± 0.3 2.2 ± 0.1 13.6 ± 0.3
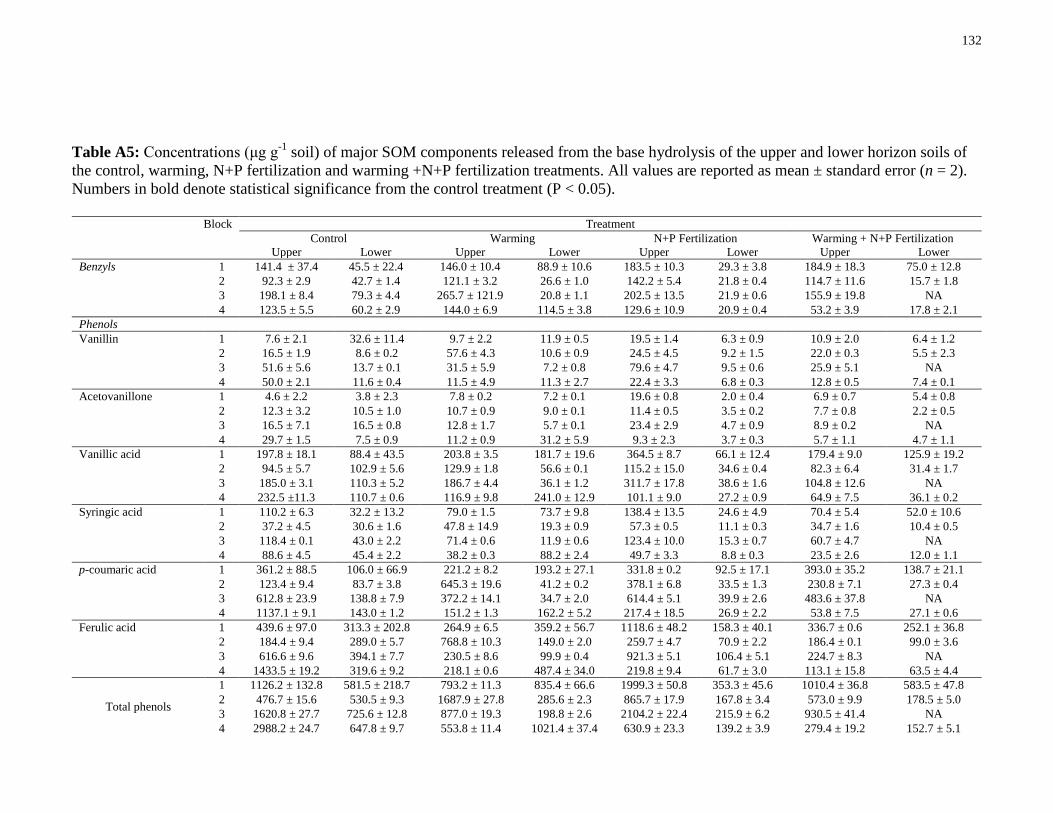
132
Table A5: Concentrations (μg g-1
soil) of major SOM components released from the base hydrolysis of the upper and lower horizon soils of
the control, warming, N+P fertilization and warming +N+P fertilization treatments. All values are reported as mean ± standard error (n = 2).
Numbers in bold denote statistical significance from the control treatment (P < 0.05).
Block Treatment
Control Warming N+P Fertilization Warming + N+P Fertilization
Upper Lower Upper Lower Upper Lower Upper Lower
Benzyls 1 141.4 ± 37.4 45.5 ± 22.4 146.0 ± 10.4 88.9 ± 10.6 183.5 ± 10.3 29.3 ± 3.8 184.9 ± 18.3 75.0 ± 12.8
2 92.3 ± 2.9 42.7 ± 1.4 121.1 ± 3.2 26.6 ± 1.0 142.2 ± 5.4 21.8 ± 0.4 114.7 ± 11.6 15.7 ± 1.8
3 198.1 ± 8.4 79.3 ± 4.4 265.7 ± 121.9 20.8 ± 1.1 202.5 ± 13.5 21.9 ± 0.6 155.9 ± 19.8 NA
4 123.5 ± 5.5 60.2 ± 2.9 144.0 ± 6.9 114.5 ± 3.8 129.6 ± 10.9 20.9 ± 0.4 53.2 ± 3.9 17.8 ± 2.1
Phenols
Vanillin 1 7.6 ± 2.1 32.6 ± 11.4 9.7 ± 2.2 11.9 ± 0.5 19.5 ± 1.4 6.3 ± 0.9 10.9 ± 2.0 6.4 ± 1.2
2 16.5 ± 1.9 8.6 ± 0.2 57.6 ± 4.3 10.6 ± 0.9 24.5 ± 4.5 9.2 ± 1.5 22.0 ± 0.3 5.5 ± 2.3
3 51.6 ± 5.6 13.7 ± 0.1 31.5 ± 5.9 7.2 ± 0.8 79.6 ± 4.7 9.5 ± 0.6 25.9 ± 5.1 NA
4 50.0 ± 2.1 11.6 ± 0.4 11.5 ± 4.9 11.3 ± 2.7 22.4 ± 3.3 6.8 ± 0.3 12.8 ± 0.5 7.4 ± 0.1
Acetovanillone 1 4.6 ± 2.2 3.8 ± 2.3 7.8 ± 0.2 7.2 ± 0.1 19.6 ± 0.8 2.0 ± 0.4 6.9 ± 0.7 5.4 ± 0.8
2 12.3 ± 3.2 10.5 ± 1.0 10.7 ± 0.9 9.0 ± 0.1 11.4 ± 0.5 3.5 ± 0.2 7.7 ± 0.8 2.2 ± 0.5
3 16.5 ± 7.1 16.5 ± 0.8 12.8 ± 1.7 5.7 ± 0.1 23.4 ± 2.9 4.7 ± 0.9 8.9 ± 0.2 NA
4 29.7 ± 1.5 7.5 ± 0.9 11.2 ± 0.9 31.2 ± 5.9 9.3 ± 2.3 3.7 ± 0.3 5.7 ± 1.1 4.7 ± 1.1
Vanillic acid 1 197.8 ± 18.1 88.4 ± 43.5 203.8 ± 3.5 181.7 ± 19.6 364.5 ± 8.7 66.1 ± 12.4 179.4 ± 9.0 125.9 ± 19.2
2 94.5 ± 5.7 102.9 ± 5.6 129.9 ± 1.8 56.6 ± 0.1 115.2 ± 15.0 34.6 ± 0.4 82.3 ± 6.4 31.4 ± 1.7
3 185.0 ± 3.1 110.3 ± 5.2 186.7 ± 4.4 36.1 ± 1.2 311.7 ± 17.8 38.6 ± 1.6 104.8 ± 12.6 NA
4 232.5 ±11.3 110.7 ± 0.6 116.9 ± 9.8 241.0 ± 12.9 101.1 ± 9.0 27.2 ± 0.9 64.9 ± 7.5 36.1 ± 0.2
Syringic acid 1 110.2 ± 6.3 32.2 ± 13.2 79.0 ± 1.5 73.7 ± 9.8 138.4 ± 13.5 24.6 ± 4.9 70.4 ± 5.4 52.0 ± 10.6
2 37.2 ± 4.5 30.6 ± 1.6 47.8 ± 14.9 19.3 ± 0.9 57.3 ± 0.5 11.1 ± 0.3 34.7 ± 1.6 10.4 ± 0.5
3 118.4 ± 0.1 43.0 ± 2.2 71.4 ± 0.6 11.9 ± 0.6 123.4 ± 10.0 15.3 ± 0.7 60.7 ± 4.7 NA
4 88.6 ± 4.5 45.4 ± 2.2 38.2 ± 0.3 88.2 ± 2.4 49.7 ± 3.3 8.8 ± 0.3 23.5 ± 2.6 12.0 ± 1.1
p-coumaric acid 1 361.2 ± 88.5 106.0 ± 66.9 221.2 ± 8.2 193.2 ± 27.1 331.8 ± 0.2 92.5 ± 17.1 393.0 ± 35.2 138.7 ± 21.1
2 123.4 ± 9.4 83.7 ± 3.8 645.3 ± 19.6 41.2 ± 0.2 378.1 ± 6.8 33.5 ± 1.3 230.8 ± 7.1 27.3 ± 0.4
3 612.8 ± 23.9 138.8 ± 7.9 372.2 ± 14.1 34.7 ± 2.0 614.4 ± 5.1 39.9 ± 2.6 483.6 ± 37.8 NA
4 1137.1 ± 9.1 143.0 ± 1.2 151.2 ± 1.3 162.2 ± 5.2 217.4 ± 18.5 26.9 ± 2.2 53.8 ± 7.5 27.1 ± 0.6
Ferulic acid 1 439.6 ± 97.0 313.3 ± 202.8 264.9 ± 6.5 359.2 ± 56.7 1118.6 ± 48.2 158.3 ± 40.1 336.7 ± 0.6 252.1 ± 36.8
2 184.4 ± 9.4 289.0 ± 5.7 768.8 ± 10.3 149.0 ± 2.0 259.7 ± 4.7 70.9 ± 2.2 186.4 ± 0.1 99.0 ± 3.6
3 616.6 ± 9.6 394.1 ± 7.7 230.5 ± 8.6 99.9 ± 0.4 921.3 ± 5.1 106.4 ± 5.1 224.7 ± 8.3 NA
4 1433.5 ± 19.2 319.6 ± 9.2 218.1 ± 0.6 487.4 ± 34.0 219.8 ± 9.4 61.7 ± 3.0 113.1 ± 15.8 63.5 ± 4.4
Total phenols
1 1126.2 ± 132.8 581.5 ± 218.7 793.2 ± 11.3 835.4 ± 66.6 1999.3 ± 50.8 353.3 ± 45.6 1010.4 ± 36.8 583.5 ± 47.8
2 476.7 ± 15.6 530.5 ± 9.3 1687.9 ± 27.8 285.6 ± 2.3 865.7 ± 17.9 167.8 ± 3.4 573.0 ± 9.9 178.5 ± 5.0
3 1620.8 ± 27.7 725.6 ± 12.8 877.0 ± 19.3 198.8 ± 2.6 2104.2 ± 22.4 215.9 ± 6.2 930.5 ± 41.4 NA
4 2988.2 ± 24.7 647.8 ± 9.7 553.8 ± 11.4 1021.4 ± 37.4 630.9 ± 23.3 139.2 ± 3.9 279.4 ± 19.2 152.7 ± 5.1

133
Steroids and terpenoids
β-sitosterol 1 51.0 ± 4.0 41.6 ± 21.0 20.4 ± 5.7 22.6 ± 0.9 91.3 ± 4.8 8.5 ± 2.2 25.9 ± 1.4 19.8 ± 8.4
2 29.4 ± 6.7 33.8 ± 6.3 31.7 ± 2.9 16.8 ± 1.5 65.0 ± 0.5 10.1 ± 1.4 40.3 ± 6.3 15.2 ± 1.2
3 35.4 ± 0.6 43.3 ± 12.8 60.9 ± 4.4 12.7 ± 0.5 81.9 ± 16.0 12.3 ± 0.3 77.2 ± 11.1 NA
4 110.0 ± 1.8 25.0 ± 7.1 27.0 ± 1.4 43.8 ± 5.4 27.6 ± 4.0 7.3 ± 0.3 13.0 ± 1.3 8.2 ± 2.3
Aliphatic lipids
α-Hydroxyalkanoic
acids C16-C28
1 370.2 ± 32.6 911.6 ± 63.4 355.9 ± 86.5 375.1 ± 33.7 1430.6 ± 96.8 99.4 ± 4.4 290.2 ± 5.3 355.2 ± 49.2
2 144.9 ± 5.8 428.5 ± 6.0 219.8 ± 2.9 192.1 ± 11.0 388.5 ± 20.3 107.3 ± 1.7 224.8 ± 4.7 157.8 ± 8.3
3 305.9 ± 21.8 572.0 ± 58.0 288.5 ± 17.1 127.8 ± 6.5 414.6 ± 4.5 140.2 ± 3.1 421.9 ± 35.1 NA
4 259.0 ± 8.6 193.5 ± 24.9 179.0 ± 1.7 430.8 ± 16.4 195.8 ± 12.0 78.7 ± 0.3 130.2 ± 7.5 90.6 ± 3.8
n-Alkanols
Microbial or plant
origin C16-C18
1 47.3 ± 13.8 57.8 ± 14.4 42.2 ± 3.1 28.2 ± 3.8 117.4 ± 13.7 13.7 ± 2.3 38.4 ± 1.3 33.7 ± 11.8
2 38.1 ± 8.2 34.6 ± 4.2 32.2 ± 3.4 28.8 ± 2.4 23.0 ± 0.9 13.8 ± 1.7 43.3 ± 0.7 15.7 ± 0.8
3 37.2 ± 6.1 50.1 ± 3.0 49.1 ± 3.0 20.9 ± 3.8 50.8 ± 15.9 14.9 ± 2.1 52.5 ± 2.1 NA
4 41.5 ± 4.8 15.8 ± 1.8 35.8 ± 4.7 50.6 ± 7.8 34.5 ± 4.6 10.5 ± 1.0 26.5 ± 1.1 12.0 ± 2.1
Suberin or plant waxes
C20-C30
1 464.3 ± 37.7 850.9 ± 54.5 397.5 ± 52.6 462.1 ± 38.3 1182.5 ± 56.6 157.2 ± 16.6 558.9 ± 24.4 357.9 ± 33.4
2 279.9 ± 9.6 399.9 ± 36.4 321.1 ± 28.4 273.6 ± 10.6 369.0 ± 47.3 144.4 ± 10.7 361.9 ± 12.4 178.3 ± 9.0
3 318.4 ± 34.4 534.9 ± 39.5 613.5 ± 19.6 174.0 ± 7.5 688.2 ± 84.2 166.1 ± 5.8 486.8 ± 27.1 NA
4 602.5 ± 94.8 268.8 ± 27.2 428.7 ± 68.7 745.4 ± 68.3 384.1 ± 10.2 113.7 ± 5.2 241.4 ± 27.0 137.9 ± 8.1
Total n-alkanols
1 511.7 ± 40.2 908.7 ± 56.3 439.6 ± 52.7 490.3 ± 38.5 1299.8 ± 58.2 170.8 ± 16.8 597.2 ± 24.5 391.6 ± 35.4
2 318.0 ± 12.6 434.4 ± 36.6 353.3 ± 28.6 302.4 ± 10.9 392.0 ± 47.3 158.2 ±10.8 405.1 ± 12.4 194.0 ± 9.1
3 355.6 ± 34.9 584.9 ± 39.6 662.6 ± 19.8 195.0 ± 8.4 739.0 ± 85.7 181.0 ± 6.2 539.3 ± 27.2 NA
4 644.0 ± 94.9 284.6 ± 27.2 464.5 ± 68.8 796.0 ± 68.7 418.6 ± 11.2 124.2 ± 5.3 267.9 ± 27.0 149.9 ± 8.3
n-Alkanoic acids
Microbial or plant
origin C16-C18
1 338.2 ± 71.4 526.2 ± 60.1 342.3 ± 11.6 460.8 ± 41.1 1149.8 ± 35.4 154.5 ± 11.4 554.9 ± 14.8 381.4 ± 51.0
2 423.0 ± 20.6 386.0 ± 13.2 679.5 ± 55.5 193.1 ± 3.1 739.2 ± 75.6 178.2 ± 10.3 634.5 ± 58.5 148.1 ± 17.4
3 681.0 ± 42.1 536.8 ± 30.3 1140.7 ± 25.2 156.9 ± 6.7 926.4 ± 49.2 184.6 ± 3.0 1169.8 ± 111.7 NA
4 488.8 ± 19.2 354.4 ± 11.0 298.3 ± 15.6 522.4 ± 21.1 425.6 ± 38.8 97.6 ± 8.4 318.5 ± 29.5 171.0 ± 8.5
Suberin, cutin or plant
waxes C20-C30
1 2942.8 ± 82.9 4768.6 ± 235.7 2167.6 ± 267.5 2774.4 ± 171.6 8953.6 ± 219.7 1063.5 ± 205.9 2295.4 ± 28.5 2230.0 ± 140.5
2 1187.7 ± 46.6 3245.5 ± 55.2 1697.0 ± 55.7 1470.1 ± 35.7 1070.5 ± 40.3 894.6 ± 17.9 1279.1 ± 26.0 1213.2 ± 25.7
3 1870.5 ± 89.6 4413.7± 151.8 1715.9 ± 35.2 973.8 ± 25.6 3022.7 ± 107.1 1132.0 ± 31.4 1803.3 ± 78.9 NA
4 2009.4 ± 34.8 1768.5 ± 61.2 1144.9 ± 39.4 3003.6 ± 222.3 1308.2 ± 36.6 652.2 ± 13.3 896.2 ± 29.1 626.7 ± 22.6
Total n-alkanoic acids
1 3280.9 ± 109.4 5294.8 ± 243.2 2509.9 ± 267.7 3235.2 ± 176.4 10103.4 ±
222.6
1218.0 ± 206.2 2850.3 ± 32.1 2611.4 ± 149.5
2 1610.7 ± 50.9 3631.4 ± 56.7 2376.4 ± 78.7 1663.2 ± 35.8 1809.7 ± 85.7 1072.8 ± 20.6 1913.6 ± 64.0 1361.3 ± 31.0
3 2551.5 ± 99.0 4950.5 ± 154.8 2856.6 ± 43.3 1130.7 ± 26.4 3949.1 ± 117.9 1316.6 ± 31.5 2973.1 ± 136.8 NA
4 2498.2 ± 39.7 2122.8 ± 62.2 1443.2 ± 42.3 3526.0 ± 223.3 1733.8 ± 53.3 749.8 ± 15.7 1214.7 ± 41.4 797.6 ± 24.2
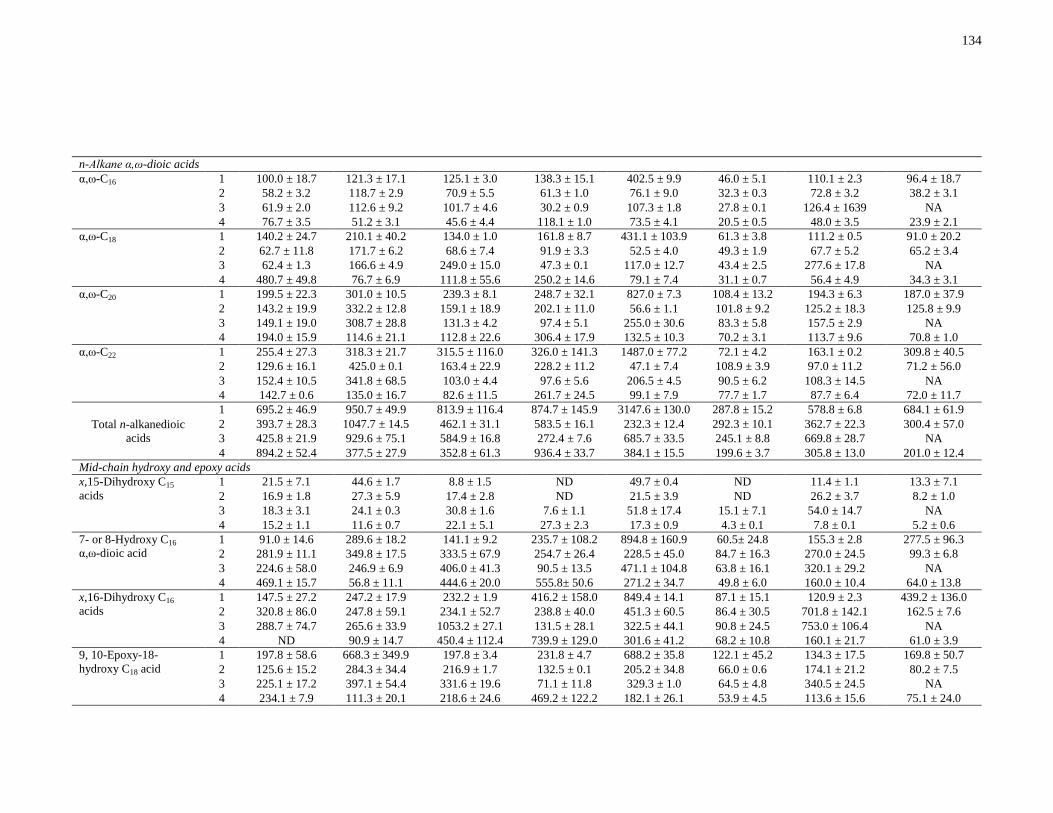
134
n-Alkane α,ω-dioic acids
α,ω-C16 1 100.0 ± 18.7 121.3 ± 17.1 125.1 ± 3.0 138.3 ± 15.1 402.5 ± 9.9 46.0 ± 5.1 110.1 ± 2.3 96.4 ± 18.7
2 58.2 ± 3.2 118.7 ± 2.9 70.9 ± 5.5 61.3 ± 1.0 76.1 ± 9.0 32.3 ± 0.3 72.8 ± 3.2 38.2 ± 3.1
3 61.9 ± 2.0 112.6 ± 9.2 101.7 ± 4.6 30.2 ± 0.9 107.3 ± 1.8 27.8 ± 0.1 126.4 ± 1639 NA
4 76.7 ± 3.5 51.2 ± 3.1 45.6 ± 4.4 118.1 ± 1.0 73.5 ± 4.1 20.5 ± 0.5 48.0 ± 3.5 23.9 ± 2.1
α,ω-C18 1 140.2 ± 24.7 210.1 ± 40.2 134.0 ± 1.0 161.8 ± 8.7 431.1 ± 103.9 61.3 ± 3.8 111.2 ± 0.5 91.0 ± 20.2
2 62.7 ± 11.8 171.7 ± 6.2 68.6 ± 7.4 91.9 ± 3.3 52.5 ± 4.0 49.3 ± 1.9 67.7 ± 5.2 65.2 ± 3.4
3 62.4 ± 1.3 166.6 ± 4.9 249.0 ± 15.0 47.3 ± 0.1 117.0 ± 12.7 43.4 ± 2.5 277.6 ± 17.8 NA
4 480.7 ± 49.8 76.7 ± 6.9 111.8 ± 55.6 250.2 ± 14.6 79.1 ± 7.4 31.1 ± 0.7 56.4 ± 4.9 34.3 ± 3.1
α,ω-C20 1 199.5 ± 22.3 301.0 ± 10.5 239.3 ± 8.1 248.7 ± 32.1 827.0 ± 7.3 108.4 ± 13.2 194.3 ± 6.3 187.0 ± 37.9
2 143.2 ± 19.9 332.2 ± 12.8 159.1 ± 18.9 202.1 ± 11.0 56.6 ± 1.1 101.8 ± 9.2 125.2 ± 18.3 125.8 ± 9.9
3 149.1 ± 19.0 308.7 ± 28.8 131.3 ± 4.2 97.4 ± 5.1 255.0 ± 30.6 83.3 ± 5.8 157.5 ± 2.9 NA
4 194.0 ± 15.9 114.6 ± 21.1 112.8 ± 22.6 306.4 ± 17.9 132.5 ± 10.3 70.2 ± 3.1 113.7 ± 9.6 70.8 ± 1.0
α,ω-C22 1 255.4 ± 27.3 318.3 ± 21.7 315.5 ± 116.0 326.0 ± 141.3 1487.0 ± 77.2 72.1 ± 4.2 163.1 ± 0.2 309.8 ± 40.5
2 129.6 ± 16.1 425.0 ± 0.1 163.4 ± 22.9 228.2 ± 11.2 47.1 ± 7.4 108.9 ± 3.9 97.0 ± 11.2 71.2 ± 56.0
3 152.4 ± 10.5 341.8 ± 68.5 103.0 ± 4.4 97.6 ± 5.6 206.5 ± 4.5 90.5 ± 6.2 108.3 ± 14.5 NA
4 142.7 ± 0.6 135.0 ± 16.7 82.6 ± 11.5 261.7 ± 24.5 99.1 ± 7.9 77.7 ± 1.7 87.7 ± 6.4 72.0 ± 11.7
Total n-alkanedioic
acids
1 695.2 ± 46.9 950.7 ± 49.9 813.9 ± 116.4 874.7 ± 145.9 3147.6 ± 130.0 287.8 ± 15.2 578.8 ± 6.8 684.1 ± 61.9
2 393.7 ± 28.3 1047.7 ± 14.5 462.1 ± 31.1 583.5 ± 16.1 232.3 ± 12.4 292.3 ± 10.1 362.7 ± 22.3 300.4 ± 57.0
3 425.8 ± 21.9 929.6 ± 75.1 584.9 ± 16.8 272.4 ± 7.6 685.7 ± 33.5 245.1 ± 8.8 669.8 ± 28.7 NA
4 894.2 ± 52.4 377.5 ± 27.9 352.8 ± 61.3 936.4 ± 33.7 384.1 ± 15.5 199.6 ± 3.7 305.8 ± 13.0 201.0 ± 12.4
Mid-chain hydroxy and epoxy acids
x,15-Dihydroxy C15
acids
1 21.5 ± 7.1 44.6 ± 1.7 8.8 ± 1.5 ND 49.7 ± 0.4 ND 11.4 ± 1.1 13.3 ± 7.1
2 16.9 ± 1.8 27.3 ± 5.9 17.4 ± 2.8 ND 21.5 ± 3.9 ND 26.2 ± 3.7 8.2 ± 1.0
3 18.3 ± 3.1 24.1 ± 0.3 30.8 ± 1.6 7.6 ± 1.1 51.8 ± 17.4 15.1 ± 7.1 54.0 ± 14.7 NA
4 15.2 ± 1.1 11.6 ± 0.7 22.1 ± 5.1 27.3 ± 2.3 17.3 ± 0.9 4.3 ± 0.1 7.8 ± 0.1 5.2 ± 0.6
7- or 8-Hydroxy C16
α,ω-dioic acid
1 91.0 ± 14.6 289.6 ± 18.2 141.1 ± 9.2 235.7 ± 108.2 894.8 ± 160.9 60.5± 24.8 155.3 ± 2.8 277.5 ± 96.3
2 281.9 ± 11.1 349.8 ± 17.5 333.5 ± 67.9 254.7 ± 26.4 228.5 ± 45.0 84.7 ± 16.3 270.0 ± 24.5 99.3 ± 6.8
3 224.6 ± 58.0 246.9 ± 6.9 406.0 ± 41.3 90.5 ± 13.5 471.1 ± 104.8 63.8 ± 16.1 320.1 ± 29.2 NA
4 469.1 ± 15.7 56.8 ± 11.1 444.6 ± 20.0 555.8± 50.6 271.2 ± 34.7 49.8 ± 6.0 160.0 ± 10.4 64.0 ± 13.8
x,16-Dihydroxy C16
acids
1 147.5 ± 27.2 247.2 ± 17.9 232.2 ± 1.9 416.2 ± 158.0 849.4 ± 14.1 87.1 ± 15.1 120.9 ± 2.3 439.2 ± 136.0
2 320.8 ± 86.0 247.8 ± 59.1 234.1 ± 52.7 238.8 ± 40.0 451.3 ± 60.5 86.4 ± 30.5 701.8 ± 142.1 162.5 ± 7.6
3 288.7 ± 74.7 265.6 ± 33.9 1053.2 ± 27.1 131.5 ± 28.1 322.5 ± 44.1 90.8 ± 24.5 753.0 ± 106.4 NA
4 ND 90.9 ± 14.7 450.4 ± 112.4 739.9 ± 129.0 301.6 ± 41.2 68.2 ± 10.8 160.1 ± 21.7 61.0 ± 3.9
9, 10-Epoxy-18-
hydroxy C18 acid
1 197.8 ± 58.6 668.3 ± 349.9 197.8 ± 3.4 231.8 ± 4.7 688.2 ± 35.8 122.1 ± 45.2 134.3 ± 17.5 169.8 ± 50.7
2 125.6 ± 15.2 284.3 ± 34.4 216.9 ± 1.7 132.5 ± 0.1 205.2 ± 34.8 66.0 ± 0.6 174.1 ± 21.2 80.2 ± 7.5
3 225.1 ± 17.2 397.1 ± 54.4 331.6 ± 19.6 71.1 ± 11.8 329.3 ± 1.0 64.5 ± 4.8 340.5 ± 24.5 NA
4 234.1 ± 7.9 111.3 ± 20.1 218.6 ± 24.6 469.2 ± 122.2 182.1 ± 26.1 53.9 ± 4.5 113.6 ± 15.6 75.1 ± 24.0

135
x,18- Dihydroxy C18
acids
1 52.0 ± 14.5 54.1 ± 19.9 14.8 ± 2.8 27.8 ± 3.0 ND 9.9 ± 2.7 27.9 ± 5.4 16.9 ± 0.2
2 14.2 ± 2.1 34.5 ± 2.4 18.6 ± 0.2 9.0 ± 0.8 29.4 ± 5.2 4.4 ± 0.3 20.6 ± 2.8 10.6 ± 2.6
3 27.9 ± 5.9 55.6 ± 1.7 25.8 ± 0.8 10.3 ± 0.1 33.8 ± 8.6 12.4 ± 2.1 30.9 ± 2.1 NA
4 32.2 ± 2.9 30.5 ± 4.8 22.9 ± 3.3 38.5 ± 2.1 25.9 ± 3.0 8.4 ± 1.7 15.6 ± 2.4 10.6 ± 1.2
9,10,18-Trihydroxy C18
acid
1 67.6 ± 27.1 620.8 ± 411.5 37.1 ± 4.7 145.7 ± 32.2 405.4 ± 71.8 17.7 ± 3.6 45.5 ± 3.5 104.8 ± 27.4
2 30.8 ± 2.0 72.4 ± 9.9 30.3 ± 1.1 50.8 ± 2.5 32.5 ± 1.5 21.8 ± 1.7 35.1 ± 2.9 28.4 ± 1.6
3 44.7 ± 5.1 170.5 ± 28.4 42.9 ± 5.0 39.5 ± 0.9 72.3 ± 10.3 37.1 ± 0.8 37.1 ± 2.9 NA
4 74.4 ± 2.2 74.1 ± 5.9 66.0 ± 5.2 199.6 ± 111.3 53.6 ± 7.7 24.3 ± 0.5 34.5 ± 10.4 28.4 ± 7.5
Total mid-chain-
substituted acids
1 577.3 ± 73.4 1924.6 ±
541.1
631.8 ± 11.5 1057.3 ±
194.3
2921.4 ± 183.5 297.3 ± 53.9 495.2 ± 19.0 1021.7 ± 176.5
2 790.3 ± 88.1 1016.2 ± 71.6 850.8 ± 86.0 685.7 ± 48.0 968.4 ± 83.3 263.4 ± 34.6 1227.7 ± 145.9 389.3 ± 13.1
3 829.3 ± 96.5 1159.9 ± 70.5 1890.3 ± 53.4 350.6 ± 33.4 1280.8 ± 115.8 283.7 ± 30.6 1535.6 ± 114.0 NA
4 1006.5 ± 104.4 375.1 ± 28.4 1224.5 ± 117.0 2030.4 ±
215.7
851.7 ± 60.5 208.9 ± 13.3 491.5 ± 30.7 244.3 ± 29.0
ω-Hydroxyalkanoic acids
ω-C16 1 314.9 ± 57.0 428.4 ± 51.8 600.0 ± 23.8 445.5 ± 52.8 1245.9 ± 26.3 146.4 ± 22.0 437.8 ± 12.0 295.9 ± 103.7
2 246.0 ± 10.9 366.1 ± 2.7 284.0 ± 15.1 217.6 ± 2.1 226.2 ± 28.6 112.2 ± 0.3 299.2 ±10.2 129.0 ± 4.8
3 232.8 ± 23.6 397.4 ± 39.9 469.5 ± 17.4 124.9 ± 12.4 365.7 ± 16.1 105.0 ± 9.5 540.0 ± 16.2 NA
4 299.2 ± 10.9 175.9 ± 18.6 296.1 ± 15.8 554.9 ± 54.2 272.3 ± 21.1 78.7 ± 3.4 159.4 ± 12.3 93.6 ± 1.7
ω-C18:1 1 34.8 ± 6.0 66.1 ± 0.3 12.2 ± 3.9 29.1 ± 11.0 117.7 ± 20.0 6.6 ± 2.1 17.2 ± 4.1 17.6 ± 0.2
2 16.7 ± 2.4 50.0 ± 10.1 18.0 ± 1.8 25.1 ± 1.6 25.0 ± 2.0 6.9 ± 1.1 41.4 ± 2.2 13.8 ± 0.9
3 25.6 ± 6.1 53.4 ± 5.9 43.5 ± 6.3 11.0 ± 2.2 35.1 ± 5.8 7.4 ± 1.5 67.1 ± 11.5 NA
4 30.3 ± 3.6 19.2 ± 0.1 37.2 ± 15.0 33.3 ± 2.8 22.0 ± 4.7 6.8 ± 0.7 12.4 ± 1.2 7.9 ± 1.6
ω-C22 1 109.9 ± 11.2 732.0 ± 191.2 592.9 ± 38.0 635.8 ± 175.1 2376.1 ± 202.2 249.8 ± 19.3 100.1 ± 10.6 397.9 ± 122.3
2 173.8 ± 49.8 481.5 ± 181.6 151.5 ± 39.2 277.2 ± 26.0 76.0 ± 12.9 80.4 ± 23.8 128.5 ± 21.4 132.0 ± 5.9
3 186.0 ± 39.5 667.9 ± 101.6 131.5 ± 0.6 107.1 ± 22.4 1191.1 ± 14.5 53.5 ± 8.5 224.9 ± 39.5 NA
4 378.1 ± 23.7 64.2 ± 0.5 389.5 ± 56.2 736.4 ± 32.1 99.4 ± 15.5 42.3 ± 6.9 105.7 ± 6.4 54.8 ± 22.0
Total ω-
hydroxyalkanoic acids
1 459.6 ± 58.4 1226.6 ±
198.1
1205.1 ± 45.0 1110.4 ±
183.3
3739.7 ± 204.9 402.7 ± 29.3 555.1 ± 16.5 711.5 ± 160.4
2 436.5 ± 51.0 897.6 ± 181.9 453.5 ± 42.0 519.9 ± 26.1 327.1 ± 31.4 199.5 ± 23.8 469.1 ± 23.8 274.8 ± 7.6
3 444.4 ± 46.4 1118.7 ±
109.3
644.5 ± 18.5 243.0 ± 25.7 1591.9 ± 22.4 165.9 ± 12.9 832.0 ± 44.2 NA
4 707.5 ± 26.3 259.2 ± 18.6 722.8 ± 60.3 1324.7 ± 63.1 393.6 ± 26.6 127.8 ± 7.8 277.6 ± 13.9 156.3 ± 22.2
Suberin and cutin monomersa
Suberin ∑S 1 568.8 ± 37.0 1351.2 ± 192.7 1147.7 ± 122.4 1210.4 ± 227.3 4690.1 ± 216.6 430.3 ± 23.7 457.6 ± 12.3 894.7 ± 134.3
2 446.6 ± 56.0 1238.8 ± 182.0 474.1 ± 49.2 707.5 ± 30.3 179.7 ± 14.9 291.0 ± 25.8 350.8 ± 30.3 329.0 ± 57.1
3 487.6 ± 45.1 1318.3 ± 125.9 365.7 ± 6.1 302.1 ± 23.6 1652.5 ± 34.2 227.4 ± 12.0 490.7 ± 42.2 NA
4 714.8 ± 28.5 313.8 ± 26.9 584.9 ± 61.7 1304.6 ± 44.2 330.9 ± 20.2 190.3 ± 7.8 307.1 ± 13.2 197.6 ± 25.0
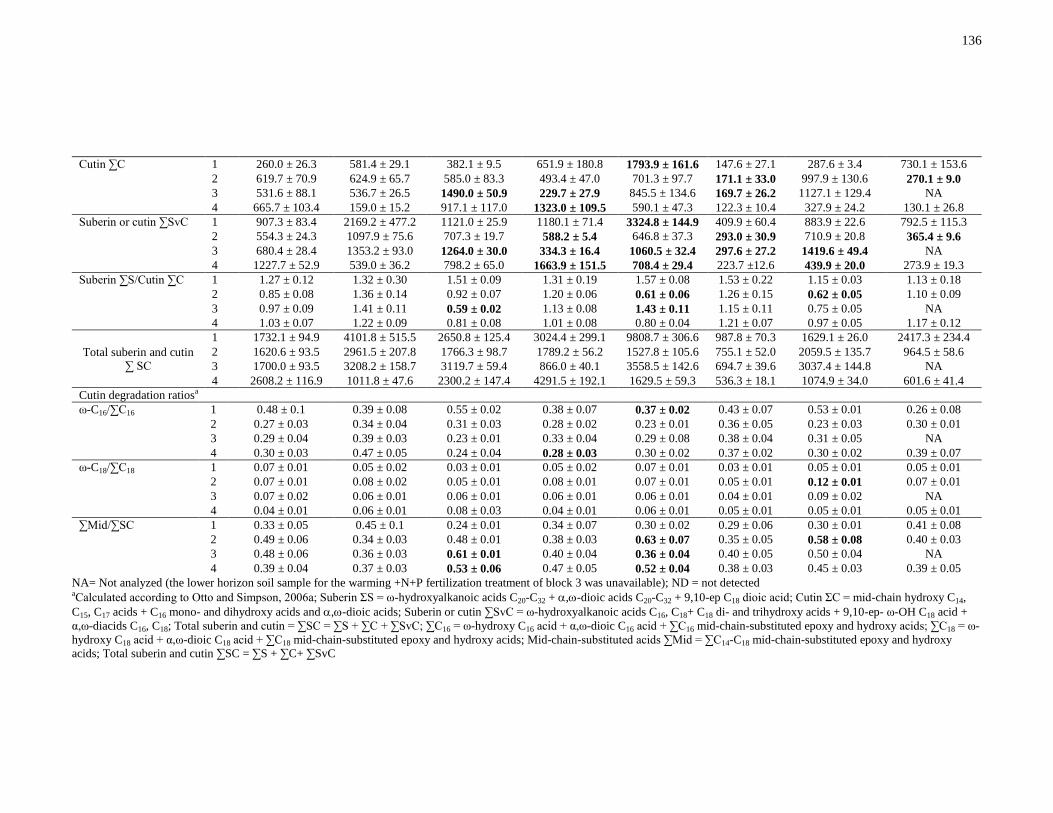
136
NA= Not analyzed (the lower horizon soil sample for the warming +N+P fertilization treatment of block 3 was unavailable); ND = not detected aCalculated according to Otto and Simpson, 2006a; Suberin ΣS = ω-hydroxyalkanoic acids C20-C32 + ,-dioic acids C20-C32 + 9,10-ep C18 dioic acid; Cutin ΣC = mid-chain hydroxy C14,
C15, C17 acids + C16 mono- and dihydroxy acids and ,-dioic acids; Suberin or cutin ∑SvC = ω-hydroxyalkanoic acids C16, C18+ C18 di- and trihydroxy acids + 9,10-ep- ω-OH C18 acid +
α,ω-diacids C16, C18; Total suberin and cutin = ∑SC = ∑S + ∑C + ∑SvC; ∑C16 = ω-hydroxy C16 acid + α,ω-dioic C16 acid + ∑C16 mid-chain-substituted epoxy and hydroxy acids; ∑C18 = ω-
hydroxy C18 acid + α,ω-dioic C18 acid + ∑C18 mid-chain-substituted epoxy and hydroxy acids; Mid-chain-substituted acids ∑Mid = ∑C14-C18 mid-chain-substituted epoxy and hydroxy
acids; Total suberin and cutin ∑SC = ∑S + ∑C+ ∑SvC
Cutin ∑C 1 260.0 ± 26.3 581.4 ± 29.1 382.1 ± 9.5 651.9 ± 180.8 1793.9 ± 161.6 147.6 ± 27.1 287.6 ± 3.4 730.1 ± 153.6
2 619.7 ± 70.9 624.9 ± 65.7 585.0 ± 83.3 493.4 ± 47.0 701.3 ± 97.7 171.1 ± 33.0 997.9 ± 130.6 270.1 ± 9.0
3 531.6 ± 88.1 536.7 ± 26.5 1490.0 ± 50.9 229.7 ± 27.9 845.5 ± 134.6 169.7 ± 26.2 1127.1 ± 129.4 NA
4 665.7 ± 103.4 159.0 ± 15.2 917.1 ± 117.0 1323.0 ± 109.5 590.1 ± 47.3 122.3 ± 10.4 327.9 ± 24.2 130.1 ± 26.8
Suberin or cutin ∑SvC 1 907.3 ± 83.4 2169.2 ± 477.2 1121.0 ± 25.9 1180.1 ± 71.4 3324.8 ± 144.9 409.9 ± 60.4 883.9 ± 22.6 792.5 ± 115.3
2 554.3 ± 24.3 1097.9 ± 75.6 707.3 ± 19.7 588.2 ± 5.4 646.8 ± 37.3 293.0 ± 30.9 710.9 ± 20.8 365.4 ± 9.6
3 680.4 ± 28.4 1353.2 ± 93.0 1264.0 ± 30.0 334.3 ± 16.4 1060.5 ± 32.4 297.6 ± 27.2 1419.6 ± 49.4 NA
4 1227.7 ± 52.9 539.0 ± 36.2 798.2 ± 65.0 1663.9 ± 151.5 708.4 ± 29.4 223.7 ±12.6 439.9 ± 20.0 273.9 ± 19.3
Suberin ∑S/Cutin ∑C 1 1.27 ± 0.12 1.32 ± 0.30 1.51 ± 0.09 1.31 ± 0.19 1.57 ± 0.08 1.53 ± 0.22 1.15 ± 0.03 1.13 ± 0.18
2 0.85 ± 0.08 1.36 ± 0.14 0.92 ± 0.07 1.20 ± 0.06 0.61 ± 0.06 1.26 ± 0.15 0.62 ± 0.05 1.10 ± 0.09
3 0.97 ± 0.09 1.41 ± 0.11 0.59 ± 0.02 1.13 ± 0.08 1.43 ± 0.11 1.15 ± 0.11 0.75 ± 0.05 NA
4 1.03 ± 0.07 1.22 ± 0.09 0.81 ± 0.08 1.01 ± 0.08 0.80 ± 0.04 1.21 ± 0.07 0.97 ± 0.05 1.17 ± 0.12
Total suberin and cutin
∑ SC
1 1732.1 ± 94.9 4101.8 ± 515.5 2650.8 ± 125.4 3024.4 ± 299.1 9808.7 ± 306.6 987.8 ± 70.3 1629.1 ± 26.0 2417.3 ± 234.4
2 1620.6 ± 93.5 2961.5 ± 207.8 1766.3 ± 98.7 1789.2 ± 56.2 1527.8 ± 105.6 755.1 ± 52.0 2059.5 ± 135.7 964.5 ± 58.6
3 1700.0 ± 93.5 3208.2 ± 158.7 3119.7 ± 59.4 866.0 ± 40.1 3558.5 ± 142.6 694.7 ± 39.6 3037.4 ± 144.8 NA
4 2608.2 ± 116.9 1011.8 ± 47.6 2300.2 ± 147.4 4291.5 ± 192.1 1629.5 ± 59.3 536.3 ± 18.1 1074.9 ± 34.0 601.6 ± 41.4
Cutin degradation ratiosa
ω-C16/∑C16 1 0.48 ± 0.1 0.39 ± 0.08 0.55 ± 0.02 0.38 ± 0.07 0.37 ± 0.02 0.43 ± 0.07 0.53 ± 0.01 0.26 ± 0.08
2 0.27 ± 0.03 0.34 ± 0.04 0.31 ± 0.03 0.28 ± 0.02 0.23 ± 0.01 0.36 ± 0.05 0.23 ± 0.03 0.30 ± 0.01
3 0.29 ± 0.04 0.39 ± 0.03 0.23 ± 0.01 0.33 ± 0.04 0.29 ± 0.08 0.38 ± 0.04 0.31 ± 0.05 NA
4 0.30 ± 0.03 0.47 ± 0.05 0.24 ± 0.04 0.28 ± 0.03 0.30 ± 0.02 0.37 ± 0.02 0.30 ± 0.02 0.39 ± 0.07
ω-C18/∑C18 1 0.07 ± 0.01 0.05 ± 0.02 0.03 ± 0.01 0.05 ± 0.02 0.07 ± 0.01 0.03 ± 0.01 0.05 ± 0.01 0.05 ± 0.01
2 0.07 ± 0.01 0.08 ± 0.02 0.05 ± 0.01 0.08 ± 0.01 0.07 ± 0.01 0.05 ± 0.01 0.12 ± 0.01 0.07 ± 0.01
3 0.07 ± 0.02 0.06 ± 0.01 0.06 ± 0.01 0.06 ± 0.01 0.06 ± 0.01 0.04 ± 0.01 0.09 ± 0.02 NA
4 0.04 ± 0.01 0.06 ± 0.01 0.08 ± 0.03 0.04 ± 0.01 0.06 ± 0.01 0.05 ± 0.01 0.05 ± 0.01 0.05 ± 0.01
∑Mid/∑SC 1 0.33 ± 0.05 0.45 ± 0.1 0.24 ± 0.01 0.34 ± 0.07 0.30 ± 0.02 0.29 ± 0.06 0.30 ± 0.01 0.41 ± 0.08
2 0.49 ± 0.06 0.34 ± 0.03 0.48 ± 0.01 0.38 ± 0.03 0.63 ± 0.07 0.35 ± 0.05 0.58 ± 0.08 0.40 ± 0.03
3 0.48 ± 0.06 0.36 ± 0.03 0.61 ± 0.01 0.40 ± 0.04 0.36 ± 0.04 0.40 ± 0.05 0.50 ± 0.04 NA
4 0.39 ± 0.04 0.37 ± 0.03 0.53 ± 0.06 0.47 ± 0.05 0.52 ± 0.04 0.38 ± 0.03 0.45 ± 0.03 0.39 ± 0.05
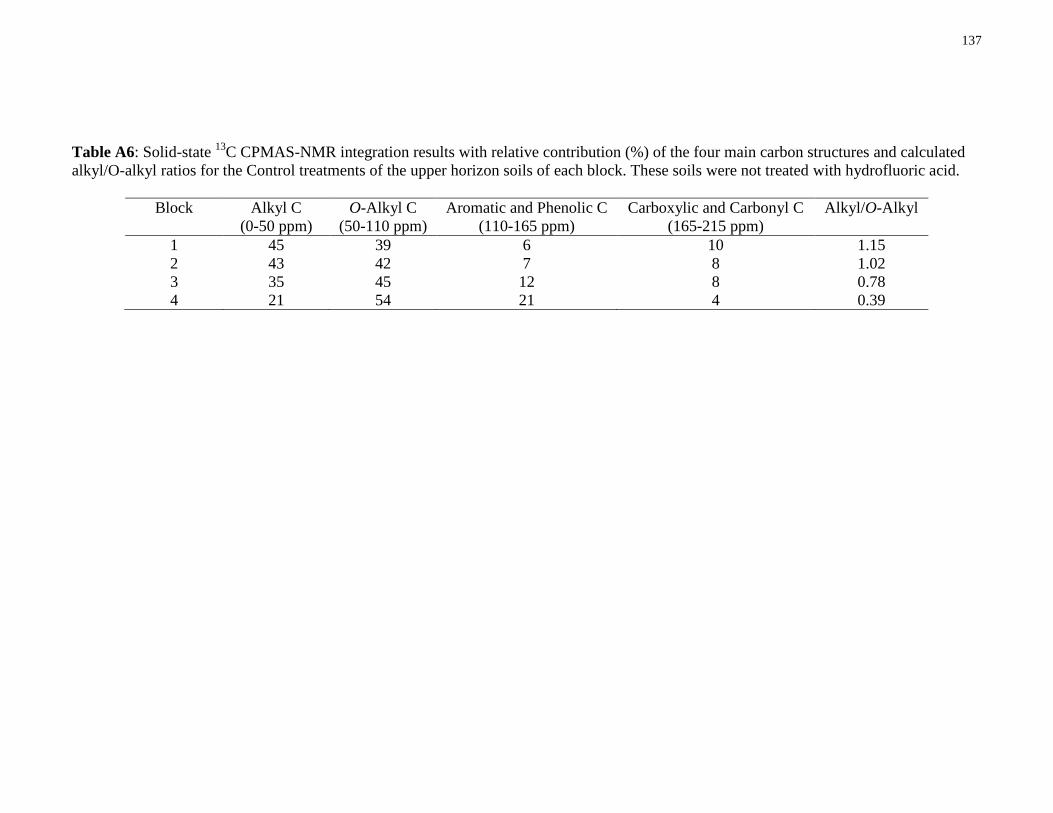
137
Table A6: Solid-state 13
C CPMAS-NMR integration results with relative contribution (%) of the four main carbon structures and calculated
alkyl/O-alkyl ratios for the Control treatments of the upper horizon soils of each block. These soils were not treated with hydrofluoric acid.
Block Alkyl C
(0-50 ppm)
O-Alkyl C
(50-110 ppm)
Aromatic and Phenolic C
(110-165 ppm)
Carboxylic and Carbonyl C
(165-215 ppm)
Alkyl/O-Alkyl
1 45 39 6 10 1.15
2 43 42 7 8 1.02
3 35 45 12 8 0.78
4 21 54 21 4 0.39
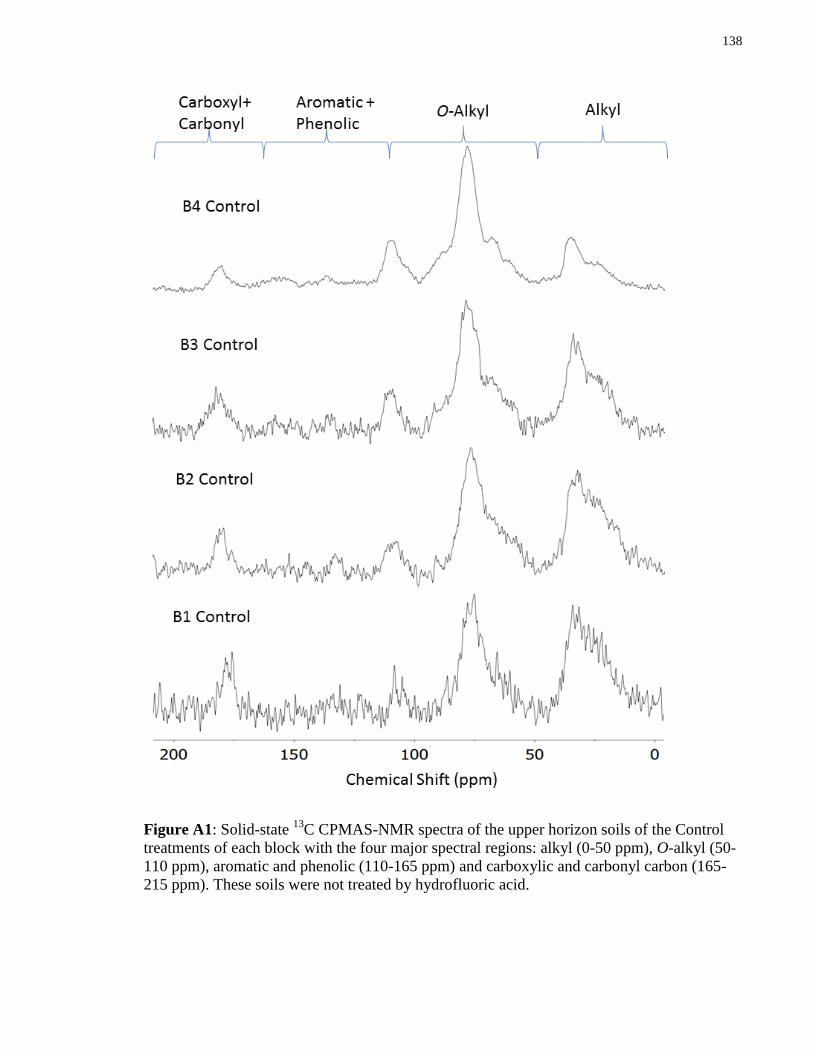
138
Figure A1: Solid-state 13
C CPMAS-NMR spectra of the upper horizon soils of the Control
treatments of each block with the four major spectral regions: alkyl (0-50 ppm), O-alkyl (50-
110 ppm), aromatic and phenolic (110-165 ppm) and carboxylic and carbonyl carbon (165-
215 ppm). These soils were not treated by hydrofluoric acid.