the role of the nurse navigator in quality outcomes...
TRANSCRIPT

The Role of the Nurse Navigator in Quality Outcomes & Measurements
Judy B. Koutlas RN, MS, OCN
Manager, Oncology Navigation
Vidant Medical Center
Greenville, NC

Objectives
• List best practices for using metrics within a navigation program to improve nursing performance and quality of care for cancer patients.
• Define strategies used to measure the intensity of nursing care required by individual patients.
• Describe processes and procedures for actively tracking the use and success of those strategies.

Disclosure
• BTG International, Nursing Advisory panel

WHY Navigation Matters…
I refuseto let cancer…..

Nursing Role in Quality Cancer Care
• Past: Institute of Medicine (IOM) Report: Future of Nursing: Leading Change, Advancing Health
• Present: Commission on Cancer
Standard 3.1 Patient Navigation Process
• Future: CMS introduction of the Oncology Care Model (OCM)

Reviewing the Literature
• Patient Navigation Research Program (2006-2009)– 10,000 individuals with abnormal cancer screenings randomized to navigation vs usual care
– Disparities existed in population served
– Outcome: Diagnostic resolution higher in navigation group vs control
(84 % vs 79 %; p<0.001)
– Added cost $275/patient
• Case (2010)- review of 18 primary nursing research studies specific to validating the nurse navigator role in continuity of care.
– Synergy Model framework- primary outcome is to “provide safe passage” for patients and families through the healthcare system.
– Outcomes data varied – patient satisfaction, timeliness to care, coordination of care

Reviewing the Literature
• Crane-Okada (2013) – summary of 9 systematic review articles with patient navigation outcomes reported with additional 14 studies of Patient Navigation by an Oncology Nurse (PNON)
– Community Needs Assessment- ID Barriers/Needs of population served
– Evaluation Measures “descriptive- processes”
– Outcome Measures “short or long term”

Gaps in Research
• Lack of evidenced based metrics to decrease mortality /long term outcomes
• Lack of proven economic impact
• Specific outcomes measures along the care continuum • Research in screening – limited in other phases
• Research in Lay vs PNON model- Is there a difference?
Prevention Detection Treatment Survivorship End of Life

Navigation Program Outcomes Reported
• Patient Volumes
• Referral Sources to Navigation
• Timeliness to care- Diagnosis and Treatment
• Number of Barriers to Care
• Overall Patient satisfaction/Retention/Outmigration
• Provider Satisfaction-Gaps/Needs identified/engagement Screening/Prevention/Outreach
• Care Coordination/ Transitions of care throughout the continuum
• Education/Advocacy/ Literacy/Learning style
• Referrals to clinical trials, supportive therapies, psychosocial support

Classification of Outcome Metrics
• Patient reported – Experience
– During Transitions
• Clinical Outcomes– Evidenced based practices to Improve outcomes
– Education/Timeliness/Compliance/NCCN Guidelines
• Business/ Return on Investment (ROI)– Downstream Revenue, Cost savings
AONN Standardized Metrics 2017

Decisions to Make
• How do you choose the “right metrics”? • How many?
• How long do you track?
• How easy is it to collect?
• Who collaborates with you?• What are your stakeholders
and administrators asking for?

Our Choices: 2014 Performance Metrics
12
Tracking specific metrics with clear measures of success
Outcome Measure of Success
Time from diagnosis to treatment Multidisciplinary team data collection
Accruals to clinical trials Clinical Trials Officedata
Increase in patient volumes Navigator data collection
Increase in early stage diseaseA - Registry decrease in late stage cancer diagnosis
B -Decrease in cancer mortality
Improved patient access / elimination of barriers Decrease in avoidable ED and hospital admits
Provide culturally competent care Increase in referrals to support programs
Survivorship Increase in referrals to support programs
Patient Satisfaction HCAHPS Scores, Admin surveys 2X per year
Physician Satisfaction Admin surveys 2X per year
Increased patient retention Navigator to track data
Decrease out-migration Marketing surveys
Increase in patient recruitment / direct referrals Navigator to track data
Std. 3.1 - ACOS COC Accreditation Compliant by 2015
Increase in patients screened Cancer Services Outreach tracking
Decrease in psychosocial distress screening scores
(PDS)
A - Navigation vs those without navigation - chart audits
B - Initial PDS vs PDS at D/C
Performance Metrics

Our Choices: 2016 Outcome Measures
• Increase in patient volumes/coordinated care
• Care closer to home
• Patient Satisfaction
• Physician Satisfaction
• Increase in Patient recruitment/retention/direct referrals
• Decrease in ED visits and readmissions

How to Be “Data-Driven”• Develop Metrics
• Perform Some Tests
• Take Action with Your Insights
• Let Management Know
• Continuous Improvement

Defining Data Collection & Tracking
• Moonshot Data- are we ready?
• MS Access database
• Manual forms/ Excel spreadsheet
• Web based Software products
• Tool embedded in Electronic Medical record
• Innovative technology needed
– Patient portals ( My chart)
– Patient Relationship Management(PRM)

Case study- Best Practice for Improvement
• Volumes of data collected
• Streamlined
• GOAL- Benchmark – accurate data easy to report and analyze and align with outcomes

Vidant Cancer Care Acuity Tool
0 Navigation services not needed
1
Low: Up to 10 minutes
• Uncomplicated guidance/education coordination• Brief follow up call• Refill• Appointment assistance• Form or letter completions
2
Moderate: Greater than 11 minutes, less than 45 minutes
• Multimodality treatment coordination and education including arrange/transfer care• Language barrier - but has family member to translate and interpreter available at appointments• Lives alone but has support• Symptom management required over phone• Difficulty coping of patient and/or caregiver• Distress > 6 on scale• Coordination of care issues: Incarcerated – complex appointments• Missed appointments/treatment noncompliance• Second opinion/Transplant eval/Transfer care uncomplicated
3
High: Greater than 46 minutes, MORE complicated coordination of care
• Multimodality treatment coordination & education with complex issues such as lack of insurance, lack of support, low health literacy, language barrier (living alone without family member to translate)
• Lives alone or homeless without support and has poor performance status and/or co morbidities• Symptom management - requiring visits to MD with complex coordination and possible admissions• Maladaptive coping with addiction issues, history of mental health issues• Missed greater than 2 appointments• Second opinion/Transfer care/Transplant evaluation - more complicated

Navigation Intervention Form in EPIC


Navigation Data
Auto-Populated
Name
MRN
Gender
Age
Race
County
Insurance
Navigator
Navigator Selected
Type of Visit
Location of Visit
Referral Source
Diagnosis
Barriers/Needs
Interventions/Referrals
Home Situation
Acuity Scale
Continuum of Care

December 2015
December YTD
% < 7 Days Chelsea Deb Janet Judy Kim Teresa Totals
Chart Reviews 92 1851 17 16 4 3 16 14 70
Brain Breast Dx Pending GI GYN GU Head/Neck Heme Melanoma Other Sarcoma Thoracic TOTAL
9 138 63 138 3 14 28 137 28 9 5 83 655
New Returning
Refer/Advic
e Only Total YTD New
YTD
Returing
YTD
Refer/Adv
ice Only
YTD
Totals MTD YTD
70 444 70 584 743 5874 626 7243 37 443
MTD YTD MTD YTD
1 22 0 10 MTD YTD
0 21 0 11 46 502
0 6
0 9
3 7 MTD YTD
4 14 8 53
7 57
0
0
8
Summary of Encounters - December Assistance Program Referral
VMC Navigation O-E Scorecard
Timely Access to Care (% Patients seen < 7
New by Navigator - December
Disease Site Encounters - December
Prevention of ED Visit - Nov
Patient Recruitment & Retention - December
Care Closer to Home - Nov
Established care due to Nav. Second Opinion - Duke
Transfer/Establish Care
Self Referral Second Opinion - UNC
Second Opinion - Outside Facility
Second Opinion - VMC
Second Opinion
Return from Second Opinion
TOTALS
Transfer Care - Out or at Other VH Site
Transfer Care - Here
Average Vidant ED cost for cancer dx (per visit) $61,670 x
42 “avoided” =$2,590,140 YTD savings
Scorecard Development Observed to Expected (O-E)
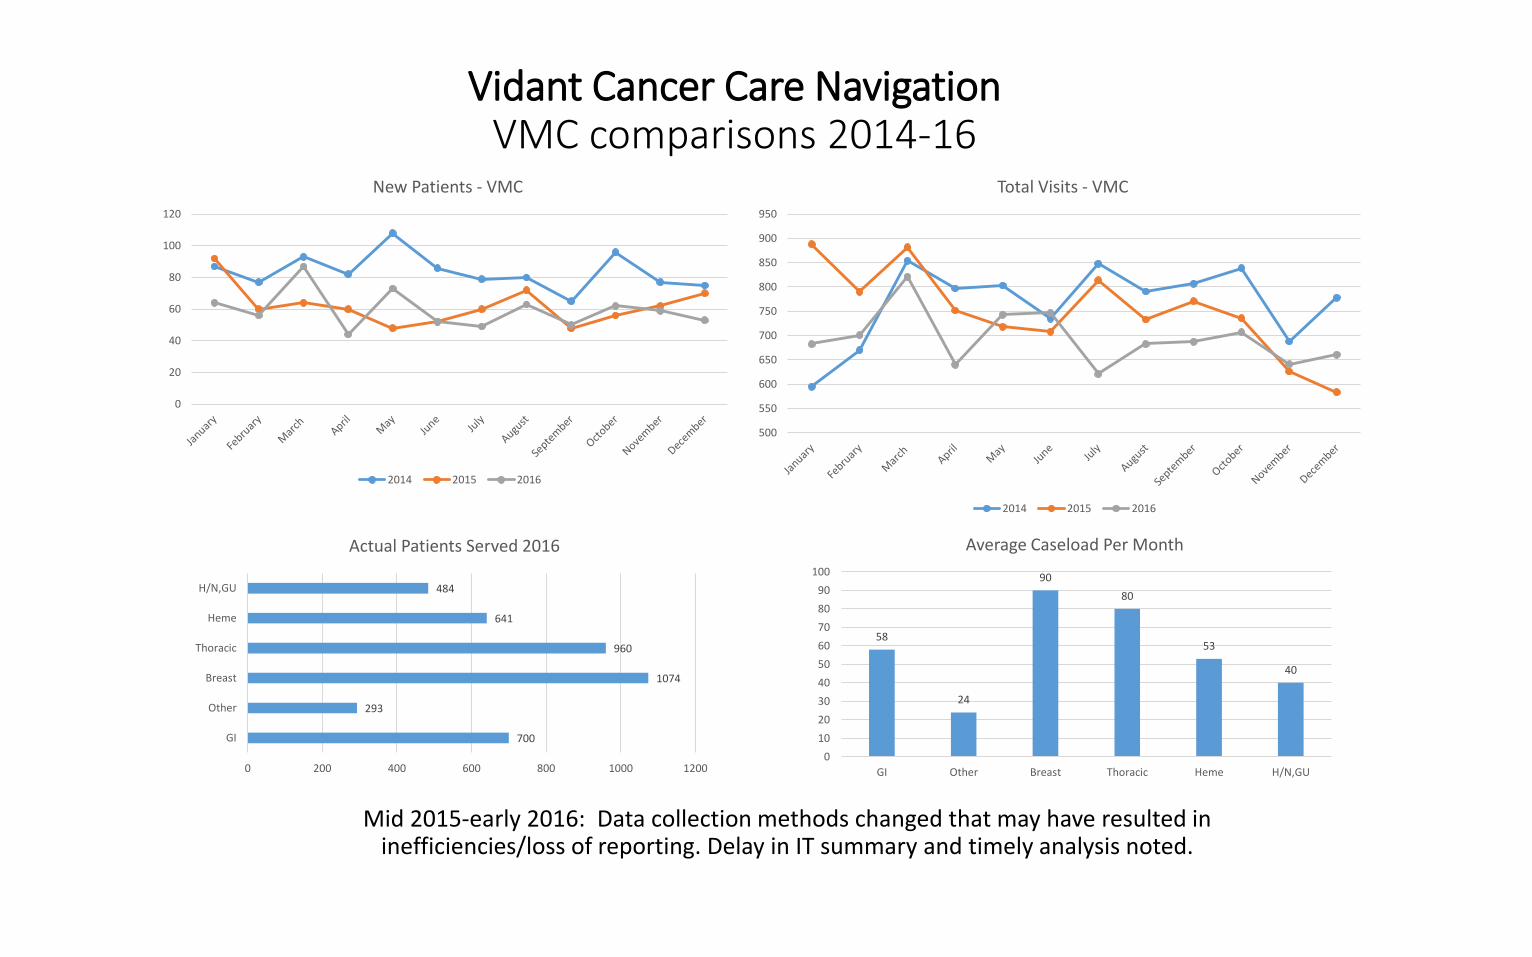
Vidant Cancer Care NavigationVMC comparisons 2014-16
Mid 2015-early 2016: Data collection methods changed that may have resulted in inefficiencies/loss of reporting. Delay in IT summary and timely analysis noted.
0
20
40
60
80
100
120
New Patients - VMC
2014 2015 2016
700
293
1074
960
641
484
0 200 400 600 800 1000 1200
GI
Other
Breast
Thoracic
Heme
H/N,GU
Actual Patients Served 2016
58
24
90
80
53
40
0
10
20
30
40
50
60
70
80
90
100
GI Other Breast Thoracic Heme H/N,GU
Average Caseload Per Month
500
550
600
650
700
750
800
850
900
950
Total Visits - VMC
2014 2015 2016

Moving Forward with Outcomes
• Ability to analyze specific data within multidisciplinary teams across the healthcare system
• Standardization of data collection nationally within any EH
• Research opportunities with a national database
• Utilization of outcome measures to show ROI and for program expansions
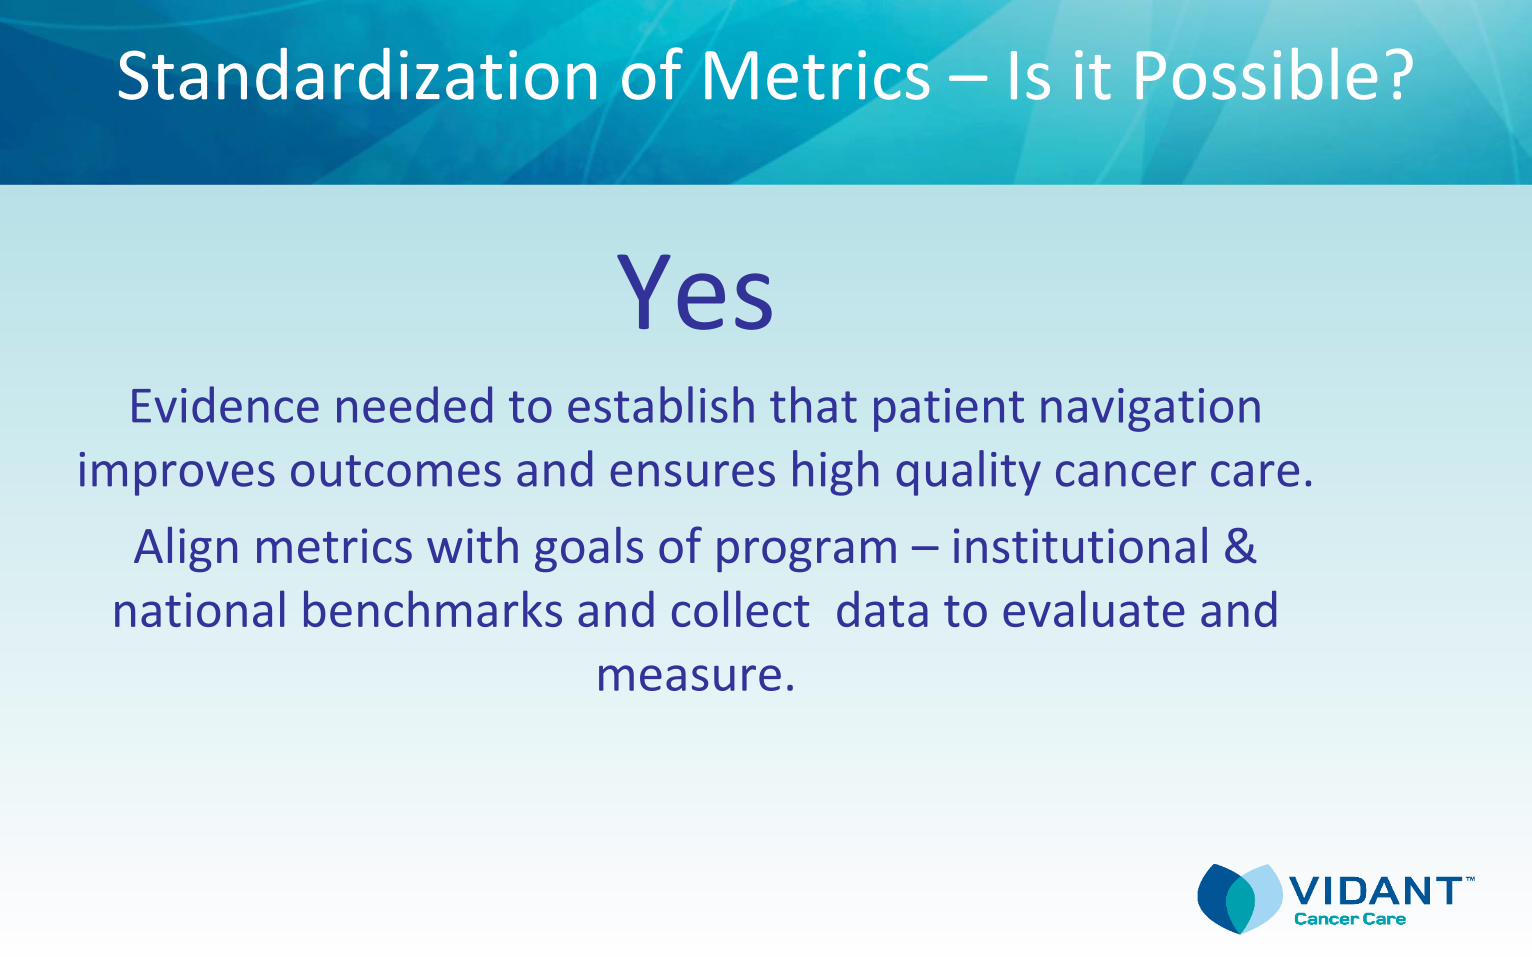
Standardization of Metrics – Is it Possible?
YesEvidence needed to establish that patient navigation
improves outcomes and ensures high quality cancer care.
Align metrics with goals of program – institutional & national benchmarks and collect data to evaluate and
measure.

References
• (2017). AONN+ announces evidence-based navigation metrics. Retrieved from: http://www.jons-online.com/issue-archive/2017-issues/january-2017-vol-8-no-1/
• Bensink, M., Ramsey, S., Battaglia, T., Fiscella, K., Hurd, T., McKoy., …Mandelblatt, S. (2014). Costs and outcomes evaluation of patient navigation after abnormal cancer screening. Cancer, 120, 570-578
• Case, M. (2011). Oncology nurse navigator: Ensuring Safe Passage. Clinical Journal of Oncology Nursing, 15(1), 33-40.
• Crane-Okada, R. (2013). Evaluation and outcome measures in patient navigation. Seminars in Oncology Nursing, 29(2), 128-140.
• Guadagnola, B., Dohan, D., & Raich, P. (2011). Metrics for evaluating patient navigation during cancer diagnosis and treatment. Cancer, 117(15suppl), 3565-3574.
• Koppenheffer, M. (2015). How to be data-driven without a PhD in statistics [PowerPoint slides]. Retrieved from: http://advisory.com
• Pratt-Chapman, M. & Willis, A. (2013). Community cancer center administration and support for navigation services. Seminars in Oncology Nursing, 29(2), 141-148.
• Strusowski, T. & Stapp, J. (2016). Patient navigation metrics:
Measuring the impact of your patient navigation services. Retrieved from: http://www.acc-cancer.org

Vidant Cancer Tower- Opening March 2018Serving 29 counties in Eastern NC

Thank You
“We make a living by what we get, we make a life by what we give.”– Winston Churchill
Thank You