the rovibrational intensities of five absorption …...the rovibrational intensities of five...
TRANSCRIPT

The Rovibrational Intensities of Five Absorption
Bands of 12C1602 between 5218 and 5349 cm -1
Lawrence P. Giver
Atmospheric Physics Branch, N 245-4
NASA Ames Research Center
Moffett Field, CA 94035-1000.
Linda R. Brown
Jet Propulsion Laboratory; California Institute of Technology
480_) Oak Grove Drive; Pasadena, CA 91109.
Charles Chackerian, Jr.
SETI Institute
Mountain View, CA 94043
and
Richard S. Freedman
Space Physics Research Institue
Sunnyvale, CA 94087
Number of pages: 28
Number of figures: 5
Number of tables 9
\
https://ntrs.nasa.gov/search.jsp?R=20020052598 2020-03-13T17:50:36+00:00Z

2
Corresponding Author:
Lawrence P. Giver
Atrnospheric Physics Branch; SGP, N 245-4.
NASA - Ames Research Center
Moffett Field, CA 94035-1000
Phone: (650) 604-5231
E-mail: [email protected]
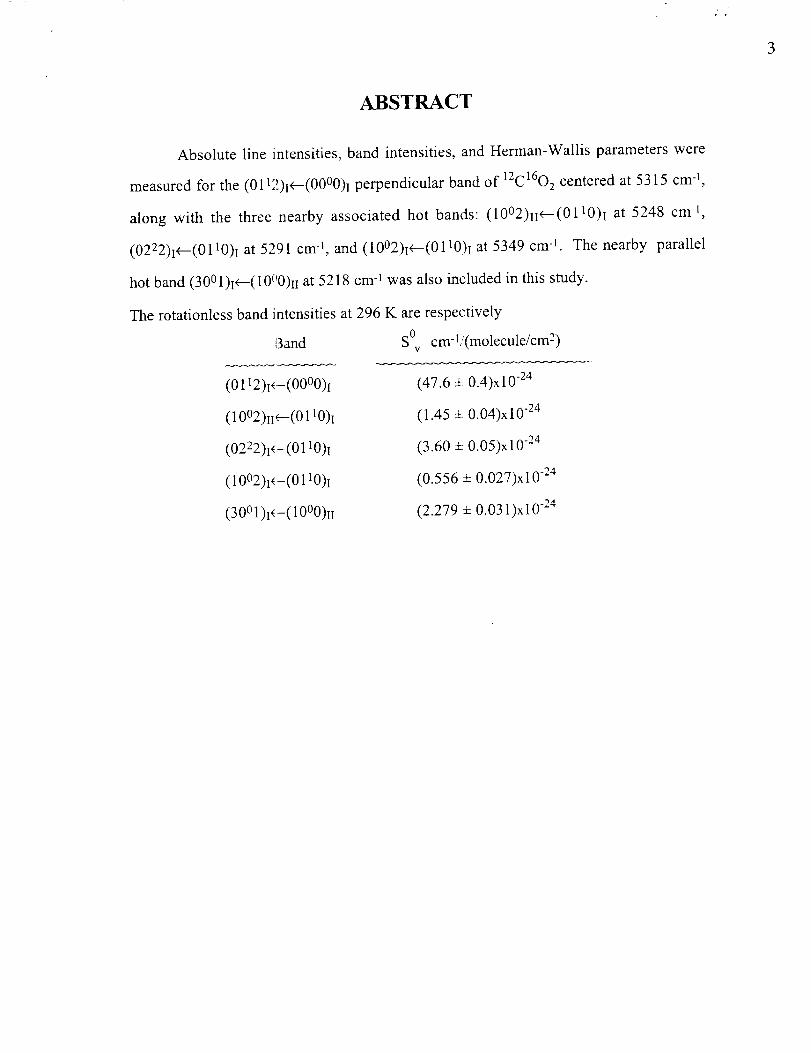
ABSTRACT
Absolute line intensities, band intensities, and Herman-Wallis parameters were
measured for the (0112h+-(00°0)i perpendicular band of 12C1602 centered at 5315 cm -j,
along with the three nearby associated hot bands: (10°2)Ii_---(0110)i at 5248 cm q,
(0222)i6--(0110)i at 5291 cm -I, and (10°2h+--(0110)i at 5349 cm -l. The nearby parallel
hot band (30Ol)I+-(I0('0hi at 5218 cm -I was also included in this study.
The rotationless band intensities at 296 K are respectively
Band S°v cm-1/(molecule/cm 2)
(0112)i_-(00°0)i
(10°2)ii6--(0110)i
(0222)i_-(0110)I
(10°2)i_ -(0110)i
(3 0° 1)i(-(1000)II
(47.6 ± 0.4)xlO -24
(1.45 ± O.04)xlO "24
(3.60 :L:O.05)xlO -24
(0.556 ± 0.027)x10 "24
(2.279 ± 0.031)xlO "24
3
INTRODUCTION
Modeling speclra of the near-infrared emission windows found on the nightside of
Venus was undertaker, by Pollack eta[. [1] in an effort to improve the determination of
the composition and cloud structure of the lower atmosphere of Venus. Since C02 is the
most abundant gas in Venus' dense, hot atmosphere, weak overtone-combination bands
and hot bands of CO2 are ubiquitous throughout Venus' near-infrared spectrum. The
intensities of many of these bands that are significant absorbers in Venus' atmosphere
have not been measured; modeling Venus' spectrum must rely on calculated intensities for
these bands. To impreve this modeling work, Giver and Chackerian [2] made laboratory
measurements of the intensity and Herman-Wallis parameters of the very weak
(3110)iv<----(00°0 ) perpendicular band of CO2 at 4416 cm -1, which is prominent in Venus'
emission window between 4040 and 4550 cm -l. Giver et aL [3] subsequently measured
intensity parameters ;3f two bands of the (40°1)+-(00°0) pentad to help improve
reliability of the modeling of the Venus emission window centered at 7830 cm -1. Before
these measurements, only calculated intensity parameters were available for simulating
these CO2 bands in atmospheric models.
The modeling of Pollack et al. [1] did not obtain a good fit to the 7830 cm -1 Venus
emission window. As mentioned by Giver et aL [3], the very weak and perturbed
(2112)n +-(00o0) perpendicular band at 7901 cm -1 contributes some absorption on one
side of the 7830 cm -l Venus emission window. They measured the intensities of some Q-
and R-branch lines of this band, but because of the perturbation and the lack of
measurable P- branch lines, they did not obtain band intensity parameters. Rothman et al.
[4] revised the intensity parameters of most of the unmeasured CO2 bands for the 1992
HITRAN compilation using the Direct Numerical Diagonalization calculations of Wattson
and Rothman [5], but they did not do that for this band or the other perturbed bands.
Thus, the modeling cMculations depended on the original McClatchey et al. [6] HITRAN
4

intensity estimate for this band, which has not been updated yet by either measurements
or calculations.
The 1992 HlTRAN values for the entire sequence of (n112)+--(00°0)
perpendicular bands and some of their associated hot bands are compared in Table 1 to
the 1986 HITRAN vaues of Rothman [7], which were unchanged from the McClatchey
et al. [6] estimates. There is a striking reduction for the calculated intensity of the
(01L2)I+-(00°0)I band at 5315.7 cm -1 from the 1986 to the 1992 HITRAN tabulation.
However, it was recognized that the DND calculated intensities for this sequence of
perpendicular bands may have substantial uncertainties, since none of the measured band
intensities used by Wattson and Rothman [5] to determine the dipole-moment surface for
CO2 have 2V 3 in the u._per level; therefore, measurement of the intensity is necessary for
some of these bands.
The strongest of these bands, (0112)i+---(0000)i at 5315.7 cm -l, was readily
measureable in two spectra that we obtained at the Kitt Peak solar Fourier Transform
Spectrometer in 1993. Giver et al. [8] reported a preliminary measurement of the
intensity of this band; the 1996 HITRAN [9] value for this band, which is based on this
preliminary measurement, is also presented in Table 1. The most recent version of
HITRAN described by Rothman et al. [10], released in December, 2000, has no changes
for CO2 from the prior 1996 version.
In the future, measured intensities of some of these bands could be included in
DND calculations described by Wattson and Rothman [5] to improve the dipole-moment
surface, and thereby irr prove the calculated values of higher overtone-combination bands,
especially the (21t2)j¢--(00°0)i band at 7901 cm -I and other nearby bands that are
significant in Venus near-infrared emission windows. We therefore decided to obtain
spectra at several more path length and pressure conditions in order to measure the
5

(01 t2)i+---(00°0)i band at 5315.7 cm -I as accurately as possible. This article reports our
final intensity measurements from these spectra for the (0112)i<--(00°0)i band at 5315.7
cm -l and the three rela'ed nearby perpendicular hot bands listed in Table 1.
These four bands are similar to the v 2 fundamental and the 3 nearby hot bands
arising from the v: level. The intensity of these bands, (0ll0)i_---(0000)I,
(0220)i_---(01 t0)b (10°0)I_--(0110)i, and (10°0)ii_-(0110)I have been measured very well
by Johns and Vander Auwera [11]. The four bands in the 5300 cm -t region have similar
vibrational assignmentt;, with 2v3 added to the upper level of each band.
An additional un_related hot band, (30 ° 1)i6---(1000)II appears in this spectral region
at 5217.7 cm -1. This is one of the 8 hot bands arising from the (10°0)i and (10°0)ii levels
associated with the (20)1)<---(00°0) triad parallel bands near 5000 cm -1. Since some of its
lines overlapped the region of the 5248 cm -1 band, we included it in this study.
6
EXPERIMENTAL DETAILS
The first two spectra of CO2 covering the 3800 to 8400 cm -l region were obtained
at Kitt Peak, AZ National Solar Observatory with the McMath FTS equipped with a
quartz beamsplitter and InSb detectors. An additional 5 spectra of CO2 and one empty
cell spectrum were subsequently obtained with the same apparatus; all spectra had
resolution of 0.0102 cm -1. One more spectrum with resolution of 0.0116 cm -1 was
obtained using a CaF2 beamsplitter; this spectrum at the lowest pressure was only used
for line position measurements. All these spectra utilized a 6-meter base path White cell
[12] and research grade CO2, which had a stated minimum purity of 99.995%. The CO2
pressures were measuled with a 100-Torr MKS Baratron manometer with digitized
readout. In addition, a 2.4-m single-pass cell was placed in series with the White cell for
low pressure CO 2-(I band line position calibration and instrument lineshape
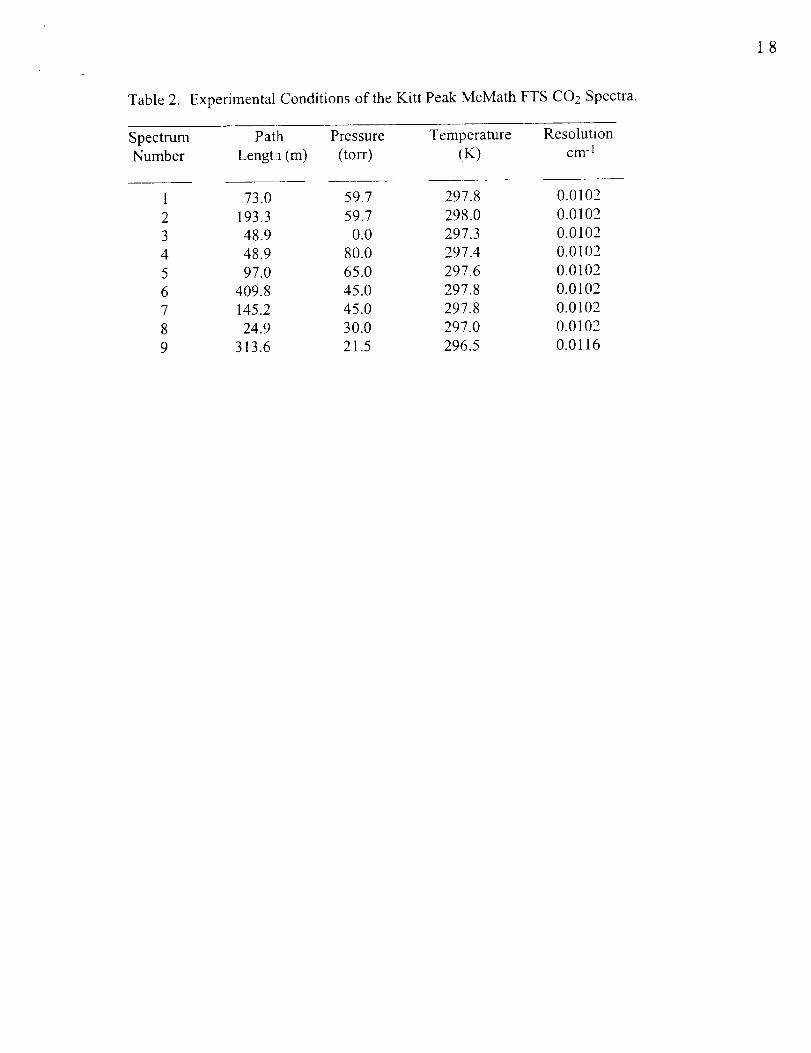
determination. The exp,:rimental conditions of all 9 spectra are given in Table 2. The Kitt
Peakinterferograms,aereobtainedwith 1.3hours integrationtime andtransformedwith
theweak"Brault" apodization(discussedby Spenceret al., [13]).
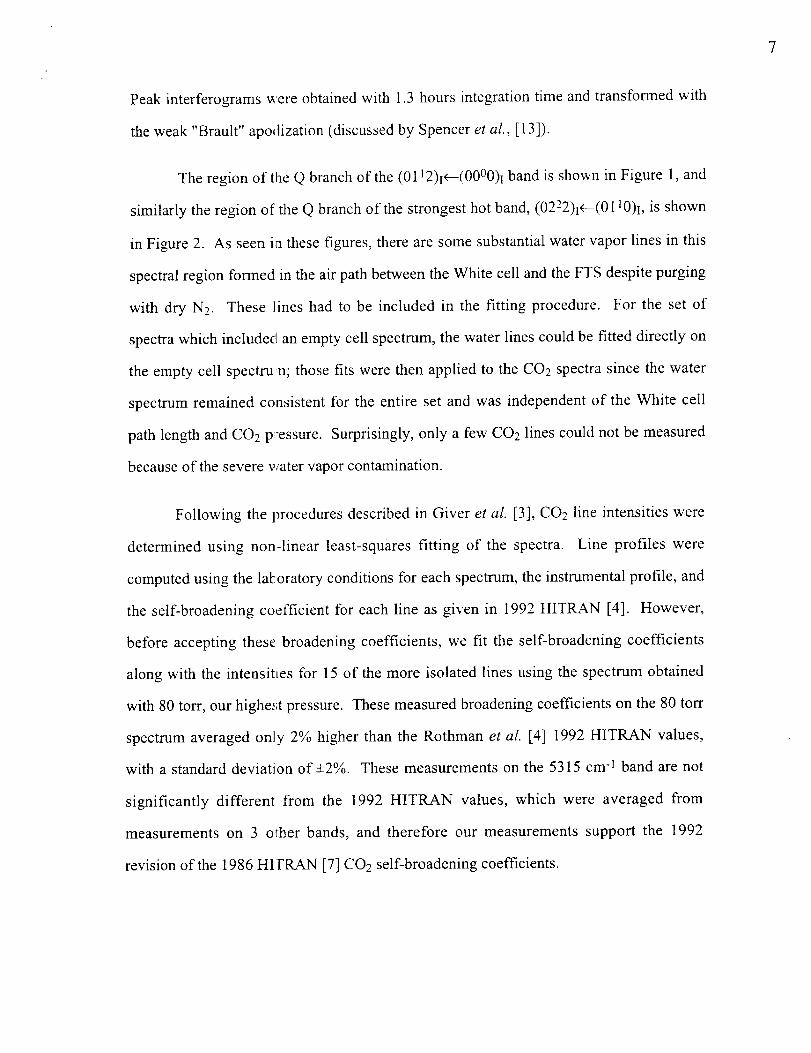
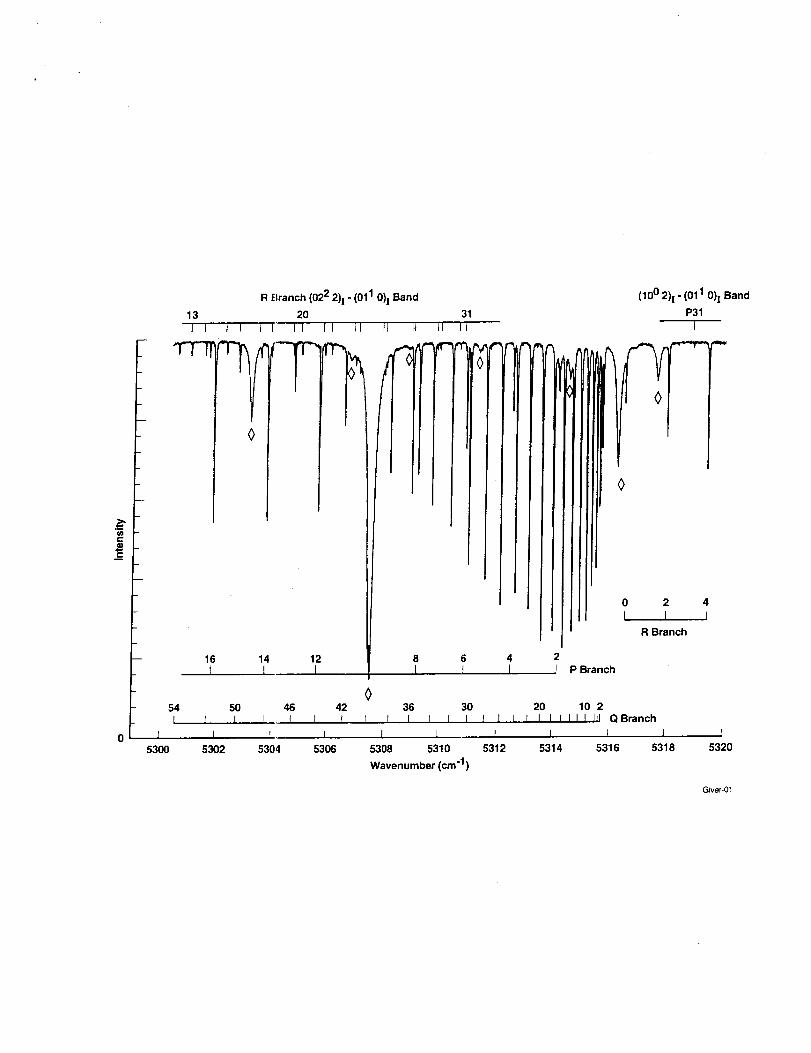
The region of the Q branch of the (0112)i_---(00°0)i band is shown in Figure 1, and
similarly the region of the Q branch of the strongest hot band, (0222)i6--(0110)i, is shown
in Figure 2. As seen in these figures, there are some substantial water vapor lines in this
spectral region formed in the air path between the White cell and the FTS despite purging
with dry N2. These lines had to be included in the fitting procedure. For the set of
spectra which included an empty cell spectrum, the water lines could be fitted directly on
the empty cell spectrun; those fits were then applied to the CO2 spectra since the water
spectrum remained consistent for the entire set and was independent of the White cell
path length and CO2 pessure. Surprisingly, only a few CO2 lines could not be measured
because of the severe water vapor contamination.
Following the procedures described in Giver et al. [3], CO 2 line intensities were
determined using non-linear least-squares fitting of the spectra. Line profiles were
computed using the lalzoratory conditions for each spectrum, the instrumental profile, and
the self-broadening coefficient for each line as given in 1992 HITRAN [4]. However,
before accepting these broadening coefficients, we fit the self-broadening coefficients
along with the intensities for 15 of the more isolated lines using the spectrum obtained
with 80 torr, our highe,;t pressure. These measured broadening coefficients on the 80 torr
spectrum averaged only 2% higher than the Rothman et al. [4] 1992 HITRAN values,
with a standard deviation of 4-2%. These measurements on the 5315 cm -1 band are not
significantly different from the 1992 HITRAN values, which were averaged from
measurements on 3 other bands, and therefore our measurements support the 1992
revision of the 1986 HI FRAN [7] CO2 self-broadening coefficients.
7
The linesof theseCO 2 bands were then fitted individually wherever possible on
all the spectra, holding tlle parameters of all nearby lines fixed at their approximate values.
During the fit of each spectral line, the position and intensity were adjusted for the
calculated spectrum until the sum of the squares of the differences between the observed
and calculated line profiles was minimized. The intensities were measured in units of
cm-1/(molecule/cm 2) at the temperature of each spectrum, using the total measured
pressure without correction for isotopic abundance. These line intensities for each
spectrum were then standardized to T = 296 K so the measurements from different
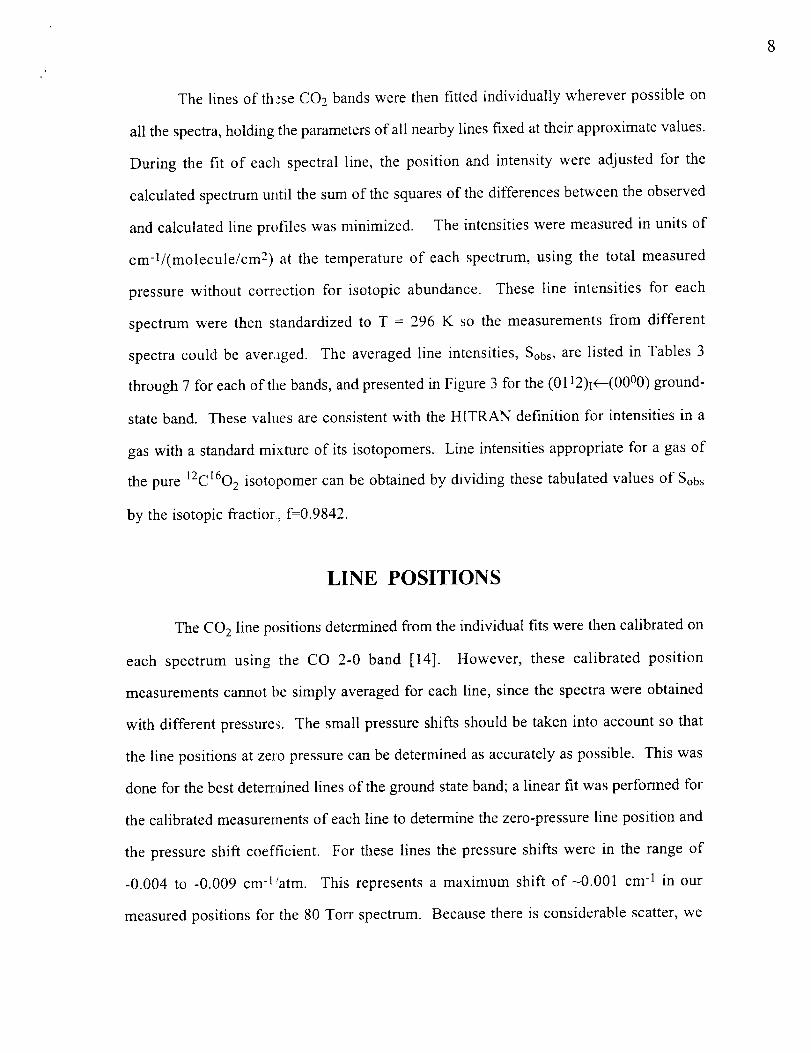
spectra could be aver.iged. The averaged line intensities, Sobs, are listed in Tables 3
through 7 for each of tile bands, and presented in Figure 3 for the (0112)_6-(00°0) ground-
state band. These values are consistent with the HITRAN definition for intensities in a
gas with a standard mixture of its isotopomers. Line intensities appropriate for a gas of
the pure 12C1602 isotopomer can be obtained by dividing these tabulated values of Sobs
by the isotopic fractior, f=0.9842.
LINE POSITIONS
The CO 2 line positions determined from the individual fits were then calibrated on
each spectrum using the CO 2-0 band [14]. However, these calibrated position
measurements cannot be simply averaged for each line, since the spectra were obtained
with different pressures. The small pressure shifts should be taken into account so that
the line positions at zero pressure can be determined as accurately as possible. This was
done for the best deterrained lines of the ground state band; a linear fit was performed for
the calibrated measurements of each line to determine the zero-pressure line position and
the pressure shift coefficient. For these lines the pressure shifts were in the range of
-0.004 to -0.009 cm -11atm. This represents a maximum shift of-0.001 cm -1 in our
measured positions for the 80 Torr spectrum. Because there is considerable scatter, we

haveelectednot to reportthe empiricalshifts. However,we note that themagnitudeof
theseshifts is morethana factorof two largerthanthe shiftsgiven in 1996HITRAN [9]
for the (00°I)I+--(00°C)]fundamentalbandat 2348 cm-1. This is in agreementwith the
expectationthatpressureshift valuesincreaselinearlywith increasingwavenumber.
For the linesof the(0112)i_---(0000)Ibandwith insufficient measurementsfor this
procedure,anestimateJpressureshift, basedon resultsfrom nearbylines,wasappliedto
the calibratedpositionmeasurements.Thezero-pressureline positionsfor this bandare
listed in Table 3 to 0.C0001cm-l; in all casesthesepositionsagreewith 1996HITRAN
[9] positionswithin the 0.001 cm-1HITRAN maximum uncertainty estimatefor these
lines. Theyaresimilarly closeto themeasuredpositionsofArcas et al. [15].
The lines of the hot bands, as seen in Figures 1 and 2, are much weaker and
therefore the position measurements had less precision. For these lines it was necessary
to apply estimated pre_;sure shifts to the average of the calibrated measured positions to
determine the zero-pressure line positions; the correction was at most 0.0007 cm -l.
Because the line position measurements for the hot bands have more uncertainty than the
measurements for the stronger ground-state band, the zero-pressure positions are given in
Tables 4 through 7 to only 0.0001 cm -l. For Tables 4, 5 and 7, the positions agree with
the HITRAN values within the combined HITRAN uncertainties and our tabulated
uncertainties for almosl all lines. The weakest band we measured, (10°2)i<--(0110)i, does
not appear on the 1992 and 1996 HITRAN tabulations [4, 9], because it was presumed to
be too weak for the H[TRAN intensity cutoff, although it was on the 1986 version of
HITRAN [7].
9
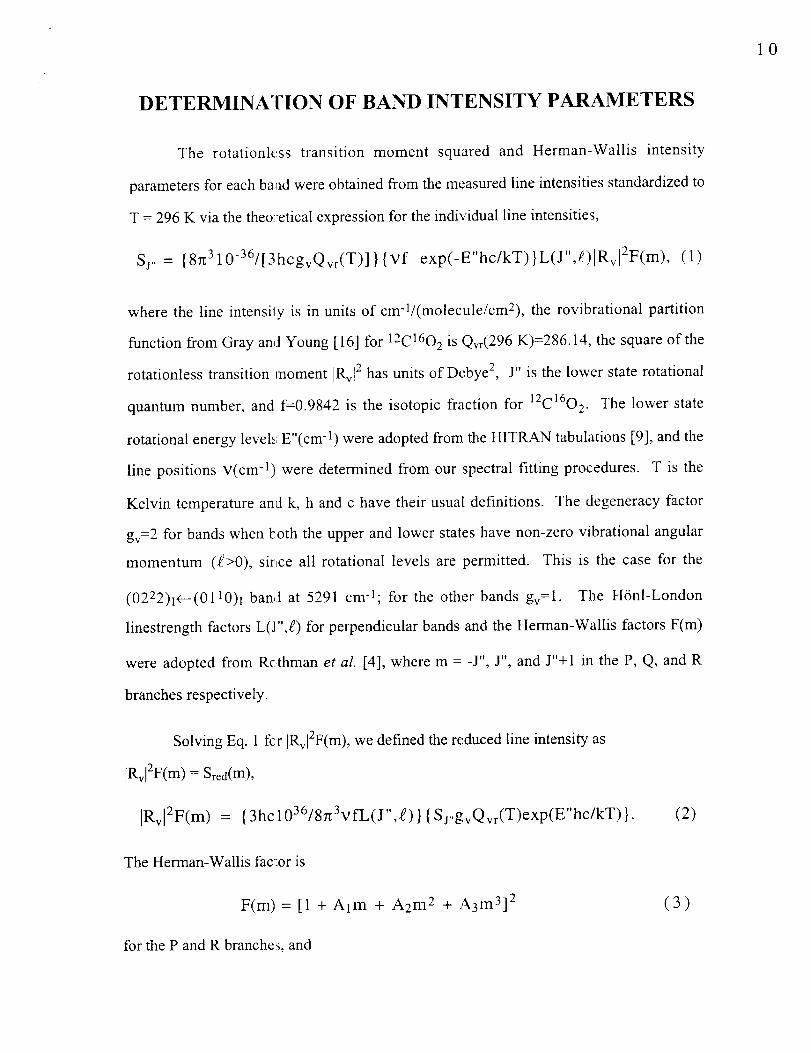
DETERMINATION OF BAND INTENSITY PARAMETERS
The rotationless transition moment squared and Herman-Wallis intensity
parameters for each baad were obtained from the measured line intensities standardized to
T = 296 K via the theo3-etical expression for the individual line intensities,
tt t! 2
Sj,, = {8rc310-36/[3hcgvQvr(T)]}{vf exp(-E hc/kT)}L(J ,e)levl F(m), (1)
where the line intensily is in units of cm-]/(molecule/cm2), the rovibrational partition
function from Gray and Young [16] for 12C1602 is Qvr(296 K)=286.14, the square of the
rotationless transition tnoment [Rvi2 has units of Debye 2, J" is the lower state rotational
quantum number, and f=0.9842 is the isotopic fraction for 12C1602. The lower state
rotational energy levels E"(cm -1) were adopted from the HITRAN tabulations [9], and the
line positions V(cm -1) were determined from our spectral fitting procedures. T is the
Kelvin temperature and k, h and c have their usual definitions. The degeneracy factor
gv=2 for bands when I:oth the upper and lower states have non-zero vibrational angular
momentum (g>0), sirtce all rotational levels are permitted. This is the case for the
(0222)i_-(0110)I band at 5291 cm-1; for the other bands gv=l. The H6nl-London
linestrength factors L(J ",g) for perpendicular bands and the Herman-Wallis factors F(m)
were adopted from Rothman et al. [4], where m = -J", J", and J"+l in the P, Q, and R
branches respectively.
Solving Eq. 1 fcr IRvr2F(m), we defined the reduced line intensity as
[Rvl2F(m) = Sred(m),
]Rv[2F(m) = {3hc 1036/8g3vfL(J",g) } { Sj..gvQvr(T)exp(E"hc/kT) }. (2)
The Herman-Wallis fac-or is
F(m) = [1 + Aim + A2m 2 + A3m3] 2 (3)
10
for the P and R branches, and

F(m) = [1 + B2m2] 2 (4)
11
for the Q branch.To determinethe bandintensity parameters,we performedweighted
nonlinear least-squaresfits for each band to the squareroot of the experimentally
determinedreducedintensities:
[Rvlll + Aim + A2m2+ A3m3] = [Sred(m)] 1/2 (5)
for the P and R branches, and
for the Q branch.
]Rv[ from all the branches of each band. In this work the cubic coefficient A3 could not be
determined for any of the 5 bands.
[Rv[[1 + B2m 2] = [Sred(m)] 1/2 (6)
Eq. 5 and Eq. 6 were fitted simultaneously to obtain a single value of
We followed the suggestion of Devi et al. [17], and assigned a weight for each line
in Tables 3 through 7 equal to the number of spectra on which it was measured unless the
standard deviation of the measurements was unusually high and exceeded a maximum
acceptable value 8 (expressed in percent) chosen for each band. For these lines weights
were calculated as the square of the ratio of 6 divided by the standard deviation of the
mean listed in Tables 3 through 7.
The simultanecus fits of the line intensities for the P and R branches to Eq. 5 and
for the Q branch to Eq. 6 returned values and standard errors for ]Rvl and some of the
Herman-Wallis parameters for each band. Figure 4 shows the result of fitting the square
root of our reduced experimental intensities vs m for the P and R branches of the ground-
state (0112)I4---(0000)i band while the Q branch was fit simultaneously to Eq. 6. This
figure shows a quadra!ic fit, utilizing the A1 and A2 Herman-Wallis fitting parameters.
Since a cubic fit was not an improvement over this quadratic fit, the A3 parameter could
not be determined. Tile error bars are (AS%/100)[Sred(m)] 1/2, where the AS% are
half the values listed in column 6 of Tables 3. Figure 5 shows the result of the

12
simultaneousfit for tl_eQ branchof this band,plotting the squareroot of our reduced
experimentalintensiti,:s vs. j2; the B2 Herman-Wallisparameteris proportional to the
slopeof the linear fit. The parametersIRv],AI, A2, B2,and levi 2 obtained from these fits
for the (0112he--(00°0)_ band are presented in Table 8. The accompanying uncertainties
are 2o" standard deviations of the mean; their determinations have been discussed by
Giver et al. [3]. The lcarameters/'or the 4 hot bands determined in our fits are presented
in Tables 8 and 9. The A2 parameter could only be determined for the (30°1h¢-(10°0)ii
parallel hot band, and the B2 parameters have substantial uncertainties.
O
The rotationless band strengths, S v as used in the 1992 HITRAN [4] tabulation,
were evaluated at 296 1( from these values of the rotationless transition moment:
S°v(T) = {8n:;10-36/[3hcQv(T)]}Vo f {exp(-G"vhc/kT)}[Rv[ 2 (7)
using the value [16] of the vibrational partition function Qv(296 K)=1.0846; Vo is the
band origin, and G" v is the lower vibrational energy level. The S°v(296 K) results are
included in Table 8 and 9.
The total band strengths, SBand , are also reported in Tables 8 and 9; these were
obtained by summing t!le calculated line intensities over each entire band. SBand is nearly
equal to S° for the (0222he--(0110)i band, since its Herman-Wallis parameters are very
small. Negative values of A2 and B2 cause SBand to be slightly smaller than S°v for the
(0112)I+--(0000 ) band.
CONCLUSIONS
The primary goal of this work was to measure the intensity of the
(01L2)i_---(00°0) as accurately as possible. As shown in Table 8, the 2cy uncertainties for
]Rv] 2, S °, and SBand are slightly under 1%. The uncertainty for the Herman-Wallis A1
parameter is only 2%, the A2 parameter about 10%, and the B2 parameter about 15%.
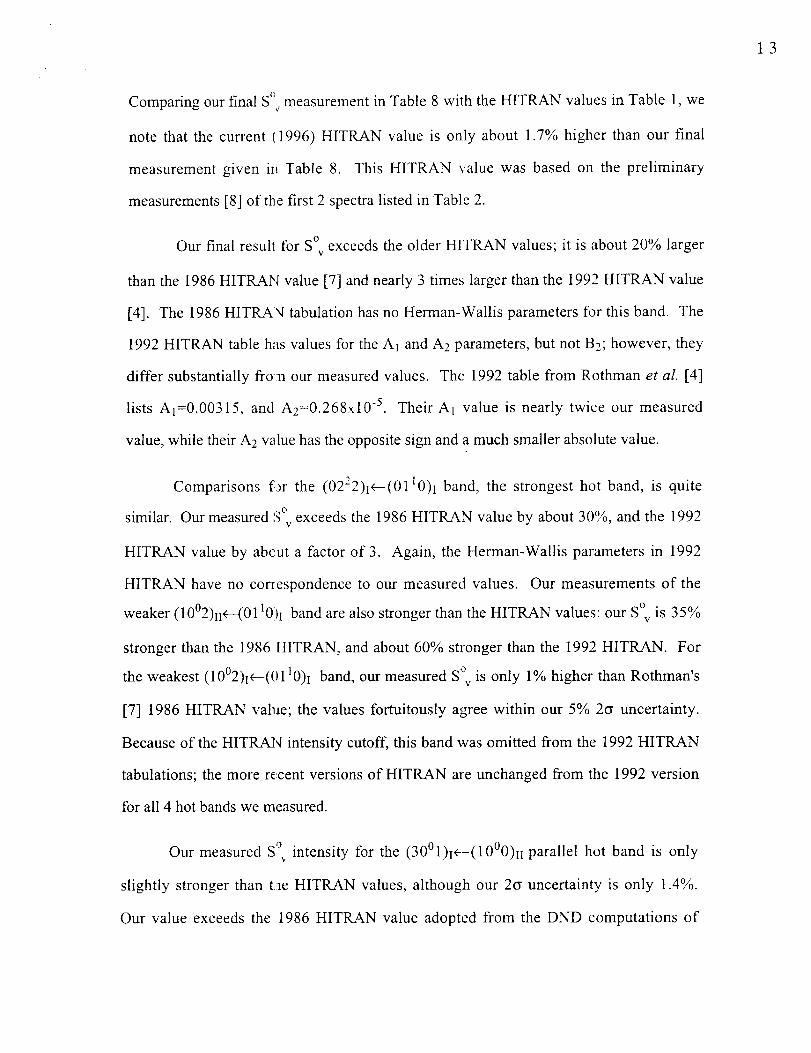
Comparingour final SCmeasurementin Table8 with the HITRAN valuesin Table 1,we
note that the current (1996) HITRAN value is only about 1.7%higher than our final
measurementgiven in Table 8. This HITRAN value was basedon the preliminary
measurements[8] of thefirst 2 spectralisted in Table2.
O
Our final result for S v exceeds the older HITRAN values; it is about 20% larger
than the 1986 HITRAN value [7] and nearly 3 times larger than the 1992 HITRAN value
[4]. The 1986 HITRA'q tabulation has no Herman-Wallis parameters for this band. The
1992 HITRAN table has values for the AI and A2 parameters, but not B2; however, they
differ substantially fro:n our measured values. The 1992 table from Rothman et al. [4]
lists A1=0.00315, and A2=0.268x10 -5. Their AL value is nearly twice our measured
value, while their A2 value has the opposite sign and a much smaller absolute value.
Comparisons f)r the (0222)i6-(0110)i band, the strongest hot band, is quite
similar. Our measured _ v exceeds the 1986 HITRAN value by about 30%, and the 1992
HITRAN value by abcut a factor of 3. Again, the Herman-Wallis parameters in 1992
HITRAN have no conespondence to our measured values. Our measurements of the
O
weaker (10°2)ii+--(0110ti band are also stronger than the HITRAN values: our S v is 35%
stronger than the 1986 HITRAN, and about 60% stronger than the 1992 HITRAN. For
the weakest (10°2)i+--(0110)i band, our measured S'k_ is only 1% higher than Rothman's
[7] 1986 HITRAN value; the values fortuitously agree within our 5% 2o uncertainty.
Because of the HITRAN intensity cutoff, this band was omitted from the 1992 HITRAN
tabulations; the more recent versions of HITRAN are unchanged from the 1992 version
for all 4 hot bands we measured.
Our measured S °, intensity for the (30°l)i_--(10°0)H parallel hot band is only
slightly stronger than ti_e HITRAN values, although our 2o uncertainty is only 1.4%.
Our value exceeds the 1986 HITRAN value adopted from the DND computations of
13

Wattson and Rothman [18] by 3.6%, and the 1992 HITRAN value by nearly 10%.
Again, theolderHITRAN hasno Herman-Wallisparametersto compareto our measured
values. Thesmall A1 parameter in the 1992 HITRAN tabulation has the opposite sign,
although the same absolute value, as our measured value. Their value of A2=-4.1 lxl0 -5
agrees with our measuied value within our 2cy uncertainty.
Johns and Auwera [11] have determined ]Rv[ 2 values for bands in the V 2
fundamental region. The four strongest bands in that region, (0110)ff----(0000)b
(0220)i_---(0110)b (1000)II_---(0IL0)I, and (1000)i_---(0110)b differ from the four
perpendicular bands u'e are reporting here only in that there is no excitation in the v3
vibration. The ratio of the sum of the ]Rv]2 values for the 3 hot bands to the ground state
band IRv]2 value is relatively unchanged in going to the higher vibrational excitation, and
indicates only a small effect of mechanical and electrical anharmonicity on the intensity of
the bands we have measured, Fermi resonance not withstanding. For the V2 fundamental
region the ratio for the sum of the three g = 0, 2 hot bands to the V2 fundamental band is
2.93; for the bands reported here that ratio is equal to 2.96. These ratios are equivalent
within the experimental uncertainties.
ACKNOWLEDGEMENTS
We wish to thank Claude Plymate of KPNO for all his help operating the Kitt
Peak McMath FTS and White Cell, and obtaining some of these spectra. We also
appreciate the collaboration of Richard Wattson; he provided us his DND calculated line
lists, and was always eager to compare results of our measurements with his calculated
values. We regret his passing on Feburary 23, 2000.
Part of the research described in this paper was performed at the Jet Propulsion
Laboratory, California Institute of Technology, under contract with The National
Aeronautics and Space Administration.
14

15
REFERENCES
1. Pollack JB, Dalton JB, Grinspoon D, Wattson RB, Freedman R, Crisp D, Allen DA,
Bezard B, DeBergh C, Giver LP, Ma Q, Tipping R. Near-infrared light from Venus'
nightside: a spectroscopic analysis. Icarus 1993;103:1-42.
2. Giver LP, Chackcrian Jr. C. Rovibrational intensities for the (31 t0hv-(00°0) band of
12C1602 at 4416 cm -1. JMolec Spectrosc 1991;148:80-85.
3. Giver LP, Chackcrian Jr. C, Spencer MN, Brown LR, Wattson RB. The rovibrational
intensities of the (4001)-(0000) pentad absorption bands of 12C1602 between 7284
and 7921 cm -1. JMolec Spectrosc 1996;175:104-111.
4. Rothman LS, Hawkins RL, Wattson RB, Gamache RR. Energy levels, intensities, and
linewidths of atmospheric carbon dioxide bands.
J Quant Spectrosc Radiat Transfer 1992;48:537-566.
5. Wattson RB, Rothman LS. Direct numerical diagonalization: wave of the future.
J Quant Spectr_sc Radiat Transfer 1992;48:763-780.
6. McClatchey EA, Benedict WS, Clough SA, Butch DE, Calfee RF, Fox K, Rothman LS,
Garing JS. "AFCRL atmospheric absorption line parameters compilation,"
AFCRL TR-73-0096 (AFCRL, Bedford, MA, 1973), AD #762904.
7. Rothman LS. Infiared energy levels and intensities of carbon dioxide.
Appl Opt 1986:25:1795-1816.
8. Giver LP, Chackerian Jr. C, Spencer MN, Freedman RS, Brown LR, Wattson RB.
Intensity and self-broadening measurements of the 01121-00°01 CO2 perpendicular
band at 5315 cm -l Seventh International Conference on Laboratory Research
for Planetary Atmospheres, Kona, HI (Oct. 8, 1995).
9. Rothman LS, Rinsland CP, Goldman A, Massie ST, Edwards DP, Flaud J-M, Perrin A,
Camy-Peyret C. Dana V, Mandin J-Y, Schroeder J, McCann A, Gamache RB,
Wattson RB, Yoshino K, Chance KV, Jucks KW, Brown LR, Nemtchinov V,
Varanasi P. The HITRAN molecular spectroscopic database and HAWKS: 1996
edition J Quant Spectrosc Radiat Transfer 1998;60:665-710.
10. Rothman LS, Chance K, Schroeder J, Goldman A. New edition of HITRAN database.
Proceedings of 1:he Eleventh Atmospheric Radiation Measurement (ARM)
Science Team Meeting, Atlanta, GA (March, 2001).
16
11. JohnsJWC, VanderAuweraJ. Absoluteintensitiesin CO2: thev2fundamentalnear15gin. ,IMolecSpectrosc1990;140:71-102.
12. WhiteJU. Longopticalpathsof largeaperture. JOpt Soc Am 1942;32;285-288.
13. Spencer MN, Chackerian Jr. C, Giver LP, Brown LR. The nitric oxide fundamental
band: frequency and shape parameters for rovibrational lines.
J Molec Spectrosc 1994; 165:506-524.
14. Pollock CR, Pete;sen FR, Jennings DA, Wells JS. Absolute frequency measurement of
the 2-0 band of CO at 2.3gm; Calibration standard frequencies from high resolution
color center laser spectroscopy. JMolec Spectrosc 1983;99:357-368.
15. Arcas P, Arie E, C2uisenier M, Maillard JP. The infrared spectrum and molecular
constants of CO2 in the 2 gm region. Can JPhys 1983;61:857-866.
16. Gray LD, Young AT. Relative intensity calculations for carbon dioxide - IV:
Calculations of the partition function for isotopes of CO2.
J Quant Spectrosc Radiat Transfer 1969;9:569-589.
17. Devi VM, Rinsland CP, Benner DC. Absolute intensity measurements of CO2
bands in the 23!)5 - 2680 cm q region. Appl Opt 1984;23:4067-4075.
18. Wattson RB, Rothman LS. Determination of vibrational energy levels and parallel
band intensities of 12C1602 by direct numerical diagonalization.
J Molec Spectresc 1986;119:83-100.
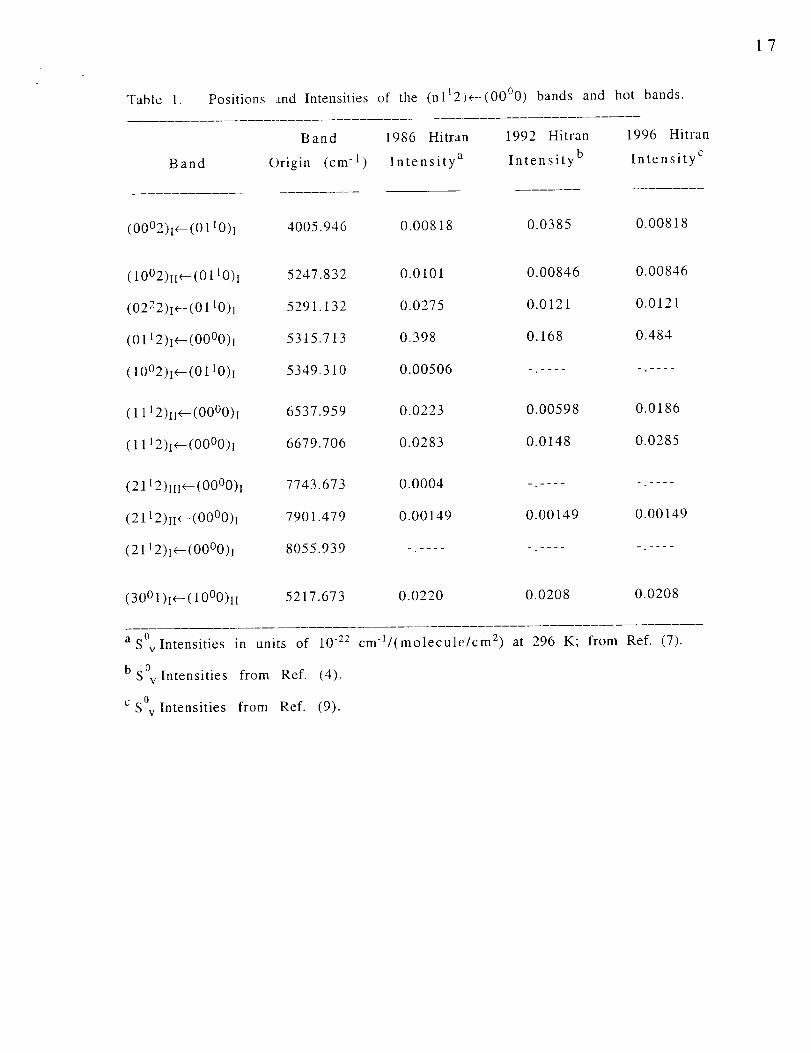
Table 1. Positions :rod Intensities of the (n112)+-(00°0) bands and hot bands.
17
Band
Band 1986 Hitran 1992 Hitran 1996 Hitran
Origin (cm -1) Intensity a Intensity b Intensity c
(00o2)i<--(0110)i 4005.946 0.00818 0.0385 0.00818
( 10°2)ii *- (0110)i 5247.832 0.0101 0.00846 0.00846
(0222)i<--(0110)i 5291.132 0.0275 0.0121 0.0121
(0112)i<--(00°0)1 5315.713 0.398 0.168 0.484
(10o2)i_--(0110)i 5349.310 0.00506 -. ..... . ....
( 1112)11<--(00°0)i 6537.959 0.0223 0.00598 0.0186
( 1112)i_-- (00°0)i 6679.706 0.0283 0.0148 0.0285
(21 t 2)111+--(00°0)1 7743.673 0.0004 -. ..... •....
(2112) ii _-- (00°0)i 7901.479 0.00149 0.00149 0.00149
(2112)i<--(0000)1 8055.939 -. ..... . ..... - ....
(30o 1)i+- ( 10°0)i! 5217.673 0.0220 0.0208 0.0208
asOvintensities in units of 10 -22
b SOv Intensities from Ref. (4).
c SOy Intensities from Ref. (9).
cm-l/(molecule/cm 2) at 296 K; from Ref. (7).
18
Table 2. Experimental Conditions of the Kitt Peak McMath FTS CO2 Spectra.
Spectrum Path Pressure Temperature Resolution
Number Lengt:_ (m) (torr) (K) cm-1
1 73.0 59.7 297.8 0.0102
2 193.3 59.7 298.0 0.0102
3 48.9 0.0 297.3 0.0102
4 48.9 80.0 297.4 0.0102
5 97.0 65.0 297.6 0.0102
6 409.8 45.0 297.8 0.0102
7 145.2 45.0 297.8 0.0102
8 24.9 30.0 297.0 0.0102
9 313.6 21.5 296.5 0.0116

19
Table 3. Line positions and intensities for the (0112)1_(00°0) band of 12C1602.
Line " v(cm-1) a n b wt c Sobs d 2AS%e Scald (Sobs-Scal)/Scal %
P 52 5260.15812(74) 3 0,13 0.190 8.3 0.185 2.9P 50 5262.85795(48) 3 0.15 0.281 7.8 0.267 5.3P 48 5265.51234(57) 2 2.00 0.375 1.0 0.377 -0.2P 46 5268.12161(38) 6 2.04 0.532 2.1 0.525 1.3
P 44 5270.68580(13) 6 1.20 0.732 2.7 0.719 1.8P 42 5273.20626(27) 6 5.62 0.975 1.3 0.967 0.8P 40 5275.68008(23) 6 4.62 1.319 1.4 1.277 3.3P 38 5278.11030(9) 6 6.00 1.652 0.4 1.656 -0.3P 36 5280.49524(12) 6 6.00 2.108 0.9 2.109 -0.03P 34 5282.83527(22) 7 2.98 2.639 1.7 2.635 0.14P 32 5285.12999(19) 7 1.99 3.22 2.1 3.23 -0.3P 30 5287.38000(16) 6 6.00 3.85 0.7 3.88 -0.8P 26 5291.74469(12) 6 6.00 5.15 0.6 5.28 -2.5P 24 5293.85916(10) 7 7.00 5.87 0.9 5.96 -1.4P 22 5295.92883(10) 7 7.00 6.48 0.7 6.57 -1.4P 20 5297.95359(7) 7 7.00 6.99 0.6 7.08 -1.2P 18 5299.93278(11) 6 5.08 7.42 1.3 7.41 0.1P 16 5301.86735(8) 5 5.00 7.51 0.4 7.54 -0.4P 14 5303.75650(9) 6 6.00 7.37 1.0 7.42 -0.7P 12 5305.60031(8) 6 6.00 7.06 0.7 7.03 0.4
P 8 5309.15242(11) 7 7.00 5.34 0.7 5.34 0.0P 6 5310.86059(17) 7 7.00 4.04 0.8 4.07 -0.7
P 4 5312.52372(24) 7 7.00 2.695 0.8 2.56 5.0P 2 5314.14208(30) 2 0.10 0.824 9.5 0.88_ -7.0
Q 60 5297.05420(75) 2 0.03 0.099 19.0 0.098 0.6Q 58 5298.26878(72) 4 0.10 0.169 9.6 0.151 12.2Q 56 5299.44351(28) 4 0.43 0.230 4.8 0.226 1.7Q 54 5300.57645(45) 6 0.30 0.329 5.4 0.334 -1.4Q 52 5301.66843(45) 6 0.70 0.492 3.8 0.483 0.9Q 48 5303.72875(21) 6 0.56 1.015 4.0 0.968 4.8Q 46 5304.69831(14) 6 2.16 1.350 2.0 1.335 1.1Q 44 5305.62646(10) 6 6.00 1.820 0.7 1.811 0.5Q 42 5306.51302(12) 6 6.00 2.435 1.2 2.413 0.9Q 38 5308.16477(10) 6 6.00 4.04 0.8 4.07 -0.7Q 36 5308.92909(13) 7 6.23 5.09 1.2 5.14 -0.9Q 34 5309.65281(9) 7 7.00 6.35 0.8 6.37 -0.3Q 32 5310.33561(11) 6 6.00 7.68 0.5 7.76 -1.1Q 30 5310.97744(10) 6 6.00 9.16 0.6 9.27 -1.2Q 28 5311.57852(9) 6 6.00 10.80 0.7 10.86 -0.6Q 26 5312.13891(11) 6 6.00 12.40 0.6 12.46 -0.5Q 24 5312.65828(9) 6 6.00 13.94 0.4 14.01 -0.5Q 22 5313.13700(8) 5 5.00 15.39 0.7 15.41 -0.1Q 20 5313.57494(8) 5 5.00 16.55 0.6 16.55 0.0Q 18 5313.97206(9) 5 5.00 17.30 0.6 17.35 -0.3Q 16 5314.32847(9) 5 5.00 17.72 0.5 17.69 0.2Q 14 5314.64420(7) 5 5.00 17.51 0.8 17.51 0.0Q 12 5314.91907(8) 5 5.00 16.79 0.7 16.75 0.3Q 10 5315.15341(13) 5 5.00 15.59 0.5 15.36 1.5Q 8 5315.34677(7) 6 6.00 13.48 0.6 13.37 0.8Q 6 5315.49948(6) 6 6.00 10.86 0.6 10.83 0.3Q 4 5315.61132(16) 7 5.72 7.86 1.2 7.82 0.5Q 2 5315.68252(23) 7 7.00 4.42 1.0 4.47 -1.1

2O
R 0 5316.48339(42) 5 1.55 1.900 2.4 1.813 4.8R 2 5317.98654(22) 6 6.00 3.634 0.9 3.612 0,6R 4 5319.44517(19) 7 7.00 5.31 0.7 5.32 -0.1R 6 5320.85864(11) 7 7.00 6.87 0.8 6.84 0.4R 8 5322.22653(12) 6 6.00 8.16 0.7 8.13 0.4R 10 5323.54867(11) 6 6.00 9.28 0.5 9.14 1.6R 12 5324.82565(9) 6 6.00 9.88 0.3 9.83 0.5R 14 5326.05697(8) 5 5.00 10.22 0.6 10.22 0.0R 18 5328.38277(8) 6 6.00 10.07 0.5 10.07 0.0R 20 5329.47716(10) 6 6.00 9.63 0.6 9.60 0.3R 22 5330.52618(9) 6 6.00 8.92 0.5 8.95 -0.4R 24 5331.52933(11) 6 6.00 8.14 0.4 8.17 -0.3R 26 5332.48667(10) 6 6.00 7.21 0.7 7.23 -0.3R 28 5333.39823(11) 7 7.00 6.27 0.7 6.32 -0.8R 30 5334.26408(12) 7 7.00 5.38 0.6 5.40 -0.4R 32 5335.08424(11) 7 6.08 4.544 1.2 4.54l 0.1R 34 5335.85873(16) 6 6.00 3,726 0.6 3.743 -0.4R 36 5336.58654(12) 7 7.00 2.997 0.8 3.028 -1.0R 38 5337.26937(10) 7 3.86 2.388 1.5 2.405 -0.7R 40 5337.90576(11) 7 3.20 1.885 1.7 1.878 0.4R 42 5338.49632(49) 3 1.10 1.535 2.9 1.44l 6.5R 44 5339.04010(91) 5 0.38 1.105 4.8 1.085 1.8R 46 5339.53932(21) 6 1.04 0.788 2.9 0.804 -2.0R 50 5340.39818(59) 5 0.44 0.432 4.5 0.41!) 3.0
R 52 5340,75842(38) 2 0.10 0.302 9.3 0.295 2.3R 54 5341.07229(40) 2 0.17 0.195 7.3 0.204 -4.5R 56 5341.34023(58) 2 0.31 0.147 5.4 0.140 5.2
aMeasured line positions adjusted to zero pressure.
bNumber of measureme nts.
CWeight used in least-squares fit for intensity parameters.
dLine intensity in units ,:)f 10 -25 cm-1/(molecule/cm 2) at 296 K. Intensities appropriate for a gas of
the pure 12C 1602 isotopomer can be obtained by dividing these tabulated values of Sobs by the
isotopic fraction, f=0.9842.
eTwice the standard deviation of the mean of Sobs, as percentage of Sobs.

Table 4. Line positions and intensities for the (10°2)n_(0110)l band of 1:C I602.
21
Line v(cml) a n b wt c Sobs d 2AS% e Scal d
P 23 5226.7723 (22) 2 2.00 0.106 11.6 0.096P 21 5228.8614 (21) 4 1.78 0.130 15.1 O.114P 17 5232.8904 (21) 4 4.00 0.150 4.8 0.147P 15 5234.8306 (10) 5 5.00 0.151 9.0 0.160P 13 5236.7239 (24) 1 0.66 0.159 0.168P 9 5240.3618 (11) 4 2.44 0.152 12.8 0.164P 7 5242.1063 (11) 3 2.02 0.135 14.1 0.150P 3 5245.4509 (36) 1 0.39 0.090 0.092
Q 40 5236.7478 (24) 1 0.38 0.0828 0.0833Q 38 5237.8185 (15) 2 1.34 0.101 17.3 0.108Q 36 5238.8376 (3) 3 2.72 0.144 11.9 0.138Q 34 5239.7993 (5) 5 3.05 o. 168 1 ! .4 o. 172Q 30 5241.5591 (7) 4 4.00 0.253 5.5 0.253Q 28 5242.3567 (11) 5 5.00 0.302 5.1 0.299Q26 5243.1011 (3) 5 5.00 0.333 1.8 0.345Q 20 5245.0039 (5) 6 6.00 0.466 2.5 0.464Q 18 5245.5302 (5) 6 6.00 0.485 4.4 0.488Q 16 5246.0009 (3) 6 6.00 0.528 3.8 0.500Q 14 5246.4191 (3) 6 6.00 0.511 4.9 0.496Q 12 5246.7829 (3) 6 6.00 0.477 3.9 0.475Q 10 5247.0918 (8) 6 6.00 0.443 4.3 0.437Q 4 5247.6980 (3) 2 0.71 0.240 23.8 0.224
R 5 5252.2622 (16) 2 2.00 0.141 0.144R 7 5253.6416 (16) 3 3.00 0.203 5.8 0.203
R 11 5256.2533 (4) 5 5.00 0.306 5.1 0.305R 13 5257.4844 (10) 5 5.00 0.344 3.5 0.344R 15 5258.6659 (26) 1 1.00 0.372 0373R 17 5259.7993 (12) 5 5.00 0.387 3.2 0.391R 19 5260.8830 (5) 5 5.00 0.397 4.0 0.397R 21 5261.9171 (8) 4 4.00 0.372 1.0 0.393R 23 5262.9016 (3) 5 5.00 0.409 2.7 0.379R 27 5264.7206 (5) 5 5.00 0.305 3.5 0.329R 29 5265.5554 (7) 4 1.98 0.263 14.2 0.296R 31 5266.3379 (5) 5 5.00 0.263 2.5 0.262R 33 5267.0727 (5) 5 5.00 0.223 4.0 0.226R 35 5267.7546 (15) 3 3.00 0.190 9.7 0.t92R 37 5268.3877 (10) 3 2.64 0.186 12.3 0.160
(Sobs-Scal)/Scal%
10.313.61.8
-6.0-5.7-7.8
-10.2-2.5
-0.6-6.24.4
-2.3-0.21.2
-3.40.3
-0.75.63.10.21.47.3
-2.00.10.2
-0. i-0.4-1.0
-0.2-5.48.0
-7.4-11.2
0.6-1.4-1.216.6
aAverage measured line positions with twice the standard deviation of the mean uncertainty.
bNumber of measurements.
CWeight used in least-squares fit for intensity parameters.
dLine intensity in units of 10 .25 cm-l/(molecule/cm 2) at 296 K. Intensities appropriate for a gas of
the pure 12C160 2 isotopomer can be obtained by dividing these tabulated values of Sobs by the
isotopic fraction, f=0.9842.
eTwice the standard de,, iation of the mean of Sobs, as percentage of Sobs.

22
"9Table 5. Line positions and intensities for the (02"-)re-(0110)i band of 12C1602.
Line v(cm-1) a n b wt c Sobs d 2As%e Sc ald
P 35 5257.8229 (12) -9.2 2.00 0.096 9.9 0.096P 34 5258.2118 (9) 2 0.96 0,116 14.3 0.106P 33 5260.0572 (10) 3 0.63 0.130 17.6 0.117P 32 5260.5059 (15) 3 0.81 0.132 15.6 0.128P 31 5262.2491 (23) 2 2.00 0.150 9.9 0.140P 30 5262.7573 (12) 3 3.00 0,148 8.1 0.152P 28 5264.9638 (9) 3 1.84 0.210 10.3 0.177P27 5266.5159(9) 3 1.59 0.186 i1.1 0.189P 26 5267.1264 (11) 3 3.00 0.193 7.6 0.201P 25 5268.5892 (21) 3 3.00 0.199 6.9 0.213P 23 5270.6231 (12) 5 5.00 0.220 6.2 0.234P 22 5271.3130 (9) 5 3.33 0.237 7.7 0.242P 21 5272.6168 (3) 5 3.60 0.243 7.4 0.250P 20 5273.3406 (11) 5 5.00 0.261 5.2 0.256P 19 5274,5713 (9) 5 5.00 0.248 4.5 0.261P 18 5275.3225 (4) 5 5.00 0.298 4.5 0.263P 17 5276.4849 (10) 5 5.00 0.247 4.5 0.264P 16 5277.2594 (4) 5 4.77 0.257 6.4 0.262P 15 5278.3587 (7) 5 5.00 0.235 5.4 0.258P 14 5279.1518 (5) 5 4,57 0.254 6.5 0.251P 12 5280.9983 (18) 3 3.00 0.217 6.9 0.229P 11 5281.9845 (11) 3 3.00 0.225 6.9 0.214P 10 5282.8007 (4) 3 3.00 0.197 6.9 0.197P 9 5283.7383 (7) 2 2.00 0.190 8.5 0.177P 7 5285.4521 (13) 2 0.88 0,123 14.9 0.130P 6 5286.2679 (6) 2 2.00 0.105 9.9 0.104
Q 39 5283.2786 (33) 2 1.11 0.138 13.3 0.138Q 38 5282.7641 (6) 2 0,97 0.157 14.2 0.155Q 37 5284.0536 (8) 3 3.00 o. 185 6.9 o. 176Q 36 5283.6114 (19) 2 2.00 0.187 8.5 0.196Q 34 5284.4132 (6) 3 2.57 0.234 8.7 0.243Q 33 5285.4843 (6) 3 3.00 0.281 7.2 0.269Q 32 5285.1686 (2) 3 3.00 0.312 5.8 0.295Q 31 5286.1389 (5) 5 5.00 0.312 4.5 0,324Q 30 5285.8813 (5) 5 5.00 0.352 5.1 0.352Q 29 5286.7532 (2) 3 3.00 0.386 4.6 0.383Q 28 5286.5469 (6) 5 5.00 0.408 3.4 0.412Q 27 5287.3274 (2) 5 5.00 0.432 2.8 0.443Q 26 5287.1681 (5) 5 5,00 0.463 3.4 0.472Q 25 5287.8608 (7) 6 6.00 0.488 4.2 0.503
Q 24 5287.7446 (2) 6 6.00 0.511 2.4 0.530Q 23 5288.3541 (6) 6 6.00 0.577 3.0 0.558Q 22 5288.2748 (2) 5 5.00 0.579 3.8 0.582Q 21 5288.8074 (3) 5 5.00 0.616 2.7 0.605
Q 20 5288.7607 (1) 6 6.00 0.661 3.5 0.624Q 19 5289.2199 (3) 6 6.00 0.646 2.4 0.641Q 18 5289.2011 (5) 6 6.00 0.655 3.7 0.653Q 15 5289.9247 (5) 2 1,85 0.645 10.3 0.663Q 14 5289.9463 (2) 2 2.00 0.662 4.5 0.656Q 11 5290.4685 (12) 2 1.82 0.595 10.4 0.626
Q 10 5290.5110(5) 2 1.10 0.572 13.4 0.592Q 9 5290.6793 (6) 2 2.00 0.544 4.2 0.569
(Sobs-Scal)/Scal%
0.09.3
11.23.07.1
-2.919.2-1.6-3.8-6.4-5.8-2.4-3.1
1.7-5.013.3-6.4-2.0-8.91.4
-5.34.90.37.6
-5.50.4
0.11.45.2
-4.5-3.64.35.8
-3.70.00.8
-0.9-2.5-2.0
-2.9-3.53.5
-0.51.75.90.70.3
-2.71.0
-4.9-3.3-4.5

23
Q 8 5290.7261 (7) 2 2.00 0.499 4.2 0.491 1.7Q 7 5290.8513 (5) 2 2.00 0.423 6.7 0.443 -4.7Q 6 5290.8946 (5) 2 2.00 0.391 5.7 0.390 0.5Q 5 5290.9820 (1) 2 2.00 0.329 5.7 0.331 -0.5Q 4 5291.0200 (19) 2 2.00 0.261 7.1 0.266 -2.0
R 1 5292.6648 (5) 3 1.20 0.201 12.8 0.204 -1.4R 2 5293.4132 (14) 3 0.92 0.210 14.6 0.225 -6.8R 3 5294.1563 (8) 4 2.18 0.277 9.5 0.251 10.3R 4 5294.8760 (6) 5 3.55 0.293 7.4 0.277 5.8R 5 5295.6088 (6) 5 5.00 0.317 4.5 0.303 4.7R 6 5296.2941 (9) 5 5.00 0.330 3.6 0.326 1.2
R 7 5297.0205 (5) 4 4.00 0.349 4.0 0.333 5.0R 8 5297.6667 (8) 5 5.00 0.363 3.6 0.367 -1.1R 9 5298.3913 (5) 6 4.44 0.385 6.6 0.384 0.3R 10 5298.9934 (7) 6 6.00 0.407 4.6 0.397 2.5R 12 5300.2757 (5) 5 3.55 0.414 7.4 0.415 -0.2R 13 5301.0123 (4) 5 5.00 0.466 2.7 0.420 10.9R 14 5301.5127 (3) 6 6.00 0.436 3.4 0.422 3.5R 15 5302.2623 (7) 5 5.00 0.410 3.8 0.421 -2.6R 17 5303.4718 (4) 6 6.00 0.391 2.9 0.411 -4.8R 18 5303.8499 (3) 6 6.00 0.406 2.4 0.402 1.0R 19 5304.6404 (4) 5 5.00 0.408 2.7 0.391 4.2R 20 5304.9508 (10) 6 6.00 0.379 5.7 0.378 0.1
R 21 5305.7689 (7) 6 6.00 0.354 5.6 0.365 -2.8R 22 5306.0057 (5) 5 5.00 0.360 3.6 0.349 3.2R 23 5306.8565 (1) 6 6.00 0.324 3.5 0.332 -2.6
R 24 5307.0160 (8) 5 5.00 0.306 4.1 0.314 -2.7R 25 5307.9040 (4) 4 4.00 0.285 5.0 0.297 -3.9
R 26 5307.9790 (7) 4 4.00 0.269 5.7 0.278 -3.2R 29 5309.8761 (5) 4 4.00 0.207 6.0 0.223 -7.6R 30 5309.7711 (5) 4 4.00 0.202 6.0 0.205 - 1.5R 31 5310.8022 (3) 3 3.00 0.178 7.5 0.188 -5.7R 32 5310.5977 (4) 3 3.00 0.181 7.4 0.171 6.0R 33 5311.6859 (6) 2 2.00 0.145 9.9 0.156 -6.9R 34 5311.3795 (21) 2 0.62 0.143 17.8 0.140 1.8R 37 5313.3335 (14) 2 2.00 0.114 9.9 0.101 13.0
aAverage measured line positions with twice the standard deviation of the mean uncertainty.
bNumber of measurements.
CWeight used in least-squares fit for intensity parameters.
dLine intensity in units :_f 10 -25 cm-l/(molecule/cm 2) at 296 K. Intensities appropriate for a gas of
the pure 12C1602 isotopomer can be obtained by dividing these tabulated values of Sobs by the
isotopic fraction, f=0.9_42.
eTwice the standard de_ iation of the mean of Sobs, as percentage of Sobs.
24
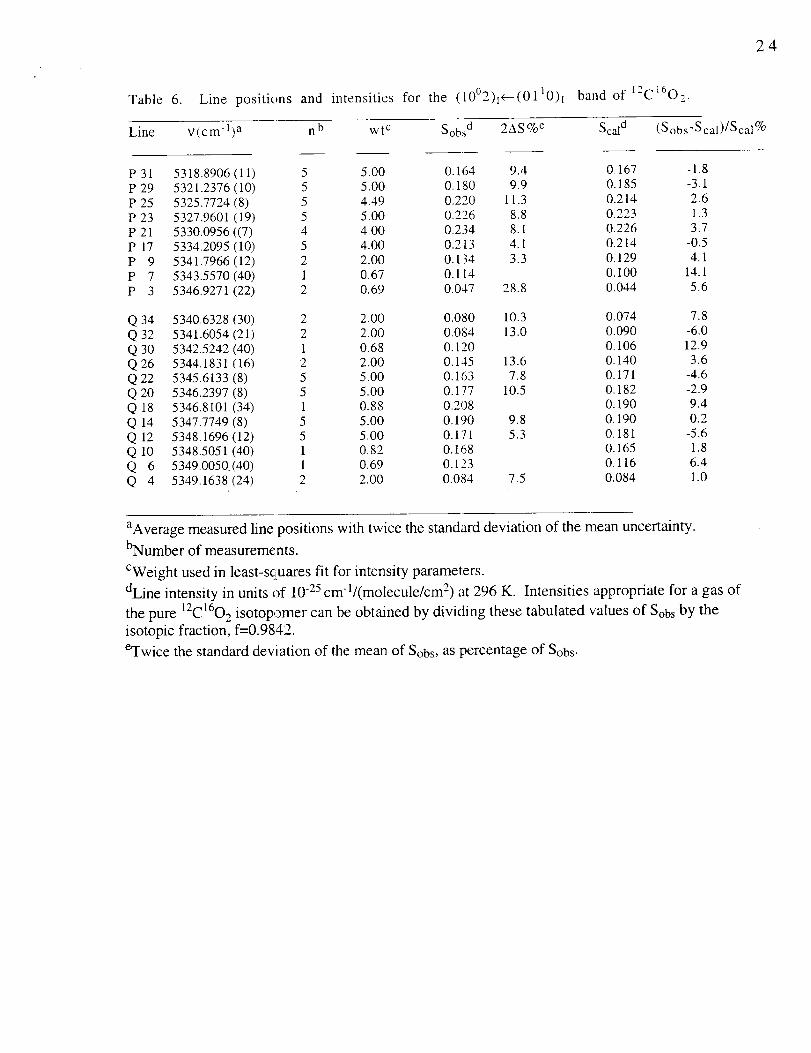
Table 6. Line positions and intensities for the (10°2)I_(0110)i band of 12C1602.
Line v(cm-l) a n b wtC Sobs d 2As%e Scal d (Sobs-Scal)/Scal%
P 31 5318.8906 (11) 5 5.00 0.164 9.4 0.167 -1.8P 29 5321.2376 (10) 5 5.00 0.180 9.9 0.185 -3.tP 25 5325.7724 (8) 5 4.49 0.220 11.3 0.214 2.6P 23 5327.9601 (19) 5 5.00 0.226 8.8 0.223 1.3P 21 5330.0956 ((7) 4 4.00 0.234 8.1 0.226 3.7P 17 5334.2095 (10) 5 4.00 0.2t3 4.1 0.214 -0.5P 9 5341.7966(12) 2 2.00 0.134 3.3 0.129 4.1P 7 5343.5570(40) 1 0.67 0.114 0.100 14.1P 3 5346.9271 (22) 2 0.69 0.047 28.8 0.044 5.6
Q 34 5340.6328 (30) 2 2.00 0.080 10.3 0.074 7.8
Q 32 5341.6054 (21) 2 2.00 0.084 13.0 0.090 -6.0Q 30 5342.5242 (40) 1 0.68 0.120 0.106 12.9Q 26 5344.1831 (16) 2 2.00 0.145 13.6 0.140 3.6
Q 22 5345.6133 (8) 5 5.00 0.163 7.8 0.171 -4.6Q20 5346.2397 (8) 5 5.00 0.177 10.5 0.182 -2.9Q 18 5346.8101 (34) 1 0.88 0.208 0.190 9.4
Q 14 5347.7749 (8) 5 5.00 0.190 9.8 0.190 0.2Q 12 5348.1696 (12) 5 5.00 0.171 5.3 O. 181 -5.6Q 10 5348.5051 (40) 1 0.82 0.168 0.165 1.8Q 6 5349.0050,(40) 1 0.69 0.123 0.116 6.4Q 4 5349.1638 (24) 2 2.00 0.084 7.5 0.084 1.0
aAverage measured line positions with twice the standard deviation of the mean uncertainty.
bNumber of measureme nts.
CWeight used in least-squares fit for intensity paramelers.
dLine intensity in units of 10 -25 cm-l/(molecule/cm2) at 296 K. Intensities appropriate for a gas of
the pure 12C1602 isotopomer can be obtained by dividing these tabulated values of Sobs by the
isotopic fraction, f=0.9842.
eTwice the standard deviation of the mean of Sobs, as percentage of Sobs.

25
Table 7. Line positi, ms and intensities for the (30°l)te-(10°0)H band of 12C1602.
Line v(cml) a n b wt c Sobs d 2AS% e Scal d (Sobs-Scal)/Scal %
P 36 5186.5612 (11) 3 1.87 0.202 7.3 0.208 -2.8P 34 5188.4368 (3) 3 0.93 0.277 10.4 0.262 5.9P 32 5190.2974 (6) 5 2.46 0.335 6.4 0.323 3.7P 30 5192.1424 (6) 6 3.77 0.405 5.2 0.391 3.6P 28 5193.9717 (4) 6 6.00 0.472 3.4 0.463 2.0P 26 5195.7840 (6) 6 6.00 0.518 3.8 0.538 -3.6P 22 5199.3576 (10) 6 3.31 0.661 5.5 0.676 -2.2P 20 5201.1172 (4) 6 6.00 0.737 2.6 0.732 0.7P 18 5202.8588 (4) 6 6.00 0.759 1.8 0.772 -1.6P 16 5204.5825 (6) 6 6.00 0.807 4.0 0.791 2.0P 12 5207.9716 (5) 6 6.00 0.740 1.6 0.751 -1.5P 10 5209.6379 (6) 5 5.00 0.679 1.7 0.688 -1.3P 8 5211.2841 (3) 6 6.00 0.606 2.3 0.594 1.9P 6 5212.9104 (7) 6 6.00 0.487 2.0 0.474 2.7P 4 5214.5174 (5) 5 5.00 0.334 3.4 0.331 0.9
R 2 5219.9856 (18) 4 1.46 0.236 8.4 0.257 -8.2R 4 5221.5013 (4) 6 6.00 0.402 3.3 0.417 -3.5R 6 5222.9987 (5) 6 4.37 0.560 4.8 0.559 0.2R 8 5224.4757 (6) 5 5.00 0.688 3.9 0.678 1.6R 10 5225.9319 (4) 6 6.00 0.780 3.5 0.768 1.5
R 12 5227.3698 (4) 6 6.00 0.824 3.3 0.829 -0.7R 14 5228.7879 (3) 5 5.00 0.849 1.2 0.860 -1.3R 16 5230.1862 (3) 6 6.00 0.874 1.9 0.862 1.4
R 18 5231.5655 (4) 3 2.09 0.867 6.9 0.838 3.4R 20 5232.9260 (3) 6 6.00 0.793 2.4 0.794 -0.1
R 22 5234.2685 (3) 6 6.00 0.733 3.4 0.732 0.1R 24 5235.5927 (5) 6 6.00 0.670 2.2 0.660 1.5R 26 5236.8986 (5) 6 6.00 0.587 3.4 0.582 0.8R 28 5238.1871 (6) 4 4.00 0.493 2.8 0.502 -1.7R 30 5239.4589 (6) 5 4.48 0.416 4.7 0.424 -1.9R 34 5241.9537 (9) 5 1.61 0.296 7.9 0.285 3.9R 36 5243.1763 (7) 5 4.10 0.226 5.0 0.226 -0.1R 40 5245.5806 (13) 3 0.69 0.142 12.0 0.136 4.5R 42 5246.7594 (18) 2 0.26 0.102 19.6 0.102 0.6
aAverage measured line positions with twice the standard deviation of the mean uncertainty.
bNumber of measurements.
CWeight used in least-sq uares fit for intensity parameters.
dLine intensity in units of 10 .25 cm-1/(molecule/cm 2) at 296 K. Intensities appropriate for a gas of
the pure 12C1602 isotopomer can be obtained by dividing these tabulated values of Sobs by the
isotopic fraction, f=0.9842.
eTwice the standard dev ation of the mean of Sobs, as percentage of Sobs.

26
TABLE 8. Intensity F'arameters for the 5315 cm 1 and 5291 cm -1 Bands of 12C1602.
Parameter* (0112h+-(00°0)l (0222)1_--(0110)i
V o
IRvt
A1
A2
B2
JRv[_
S °v
SBand
5315.713 cm -1
(15.40 _+0.07)x10 -5 Debye
+0.001822 + 0.000035
(-1.40 _+0.13)x10 -5
(-0.97 _+0.15)x10 -5
(2.371 +_0.021)x10 8 D 2
(47.6 _+0.4)x10 .24
(47.2 _+0.4)x10 -24
5291.132 cm -I
(21.48 _+0.16)x10 -5 Debye
+0.00050 _+0.00016
(-0.3 +0.7)x10 -5
(4.61 _ 0.07)x10 -s D 2
(3.60 +_0.05)x10 24
(3.61 _+0.05)x10 -24
*]Rvl 2 is the rotati,mless transition moment squared for 12C1602 in units of
Debye 2. The A1 and A 2 Herman-Wallis parameters are dimensionless. The units
of S°v are cm-1/(molecule/cm 2) at 296 K.

27
TABLE 9. Intensity Farameters for the 5349, 5248, and 5218 cm -1 Bands of 12C1602.
Parameter* (10°2)1_-(01 lo)t (10°2)_i_-((11 lO)l (30°1 h+-(lO°O)u
V o 5349310 cm -1 5247.832 cm 1 5217.673 cm -1
IRv[ (8.06 _+0.20)x10 -5 (13.27 + 0.19)x10 -5 (77.35 _+ 0.53)x10 -5
A l (-2.87 __0.09)x10 -2 (+1.45 _+0.04)x10 -2 (+3.6 _+ 1.5)x10 -4
A2 .......................... (-5.4 +__1.3)x10 -5
B 2 (3.2 _+2.4)x10 -5 (-3.2 + 1.5)x10 -5 ...........
[Rvl2 (6.50 _+0.32)xi0 -9 (1.76 _+0.05)x10 -s (5.98 _+0.08)x10 -7 D 2
S° v (0.512 _+0.025)x10 -24 (1.36 + 0.04)x10 -24 (2.279 _+ 0.031)x10 -24
SBand (0.630 _+0,031)x10 -24 (1.42 __0.04)x10 -24 (2.153 ± 0.030)x10 -24
* [Rvl 2 is the rotationless transition moment squared
The A1 A2 and B2 i!terman-Wallis parameters are
and SBand are cm-1/(n_tolecule/cm 2) at 296 K.
for 12C1602 in umts of Debye 2.
dimensionless. The units of S °V

FIGURE CAPTIONS
Fig. 1. Region of the Q Branch of the (0112)ff--(00°0)i band on spectrum #7. In
addition to the P-, Q-, and R-Branch lines of the ground state band, lines from two of its
hot bands, (0222)t+--(01 t0)i and (10°2)i<--(0110)i, are indicated on the spectrum. Water
lines formed in the air-path between the White cell and the FTS are indicated by the 0
symbol. The strongest of these water lines obscures the P10 and Q40 lines of the
(0112)i<---(00°0)t CO2 band.
Fig. 2. Region ofth2 Q Branch of the (0222)i+--(0110)t band on spectrum #6. Water
lines are indicated by 1:he 0 symbol. The strong CO2 lines belong to the P branch of the
(0112)ff--(00°0)1 band The strongest water line obscures the Q12 and Q13 lines, and the
P28 line of the (0112)i+--(00°0)i band obscures the Q16 and Q17 lines of the
(0222)i(---(01 lo)I band. Q35 also cannot be measured.
Fig. 3. Line intensities measured for the (0112)_<--(00°0)I band, shown at their
wavenumber positions. The <)symbol is used for the P and R branches, and the • symbol
is used for the Q branch.
Fig. 4. Weighted quadratic least-squares fit of [Sred] °5 to Eq. 5 for the (0112)i<--(00°0)i
band P and R branches to determine IRvh A1 and A2. ]Rv] was determined simultaneously
with the fit of the Q branch measurements of [Sred] 0"5 to Eq. 6.
Fig. 5. Weighted least-squares fit of [Sred] 0"5 VS j,,2 to Eq. 6 for the (0112)i<--(00°0)i band
Q branch to determine IRvt, and B2, done simultaneously with the fit of the P and R
branch measurements to Eq. 5, as shown in Fig. 4.
28
¢/)C
c
R Etranch (022 2)i - (011 0)] Band
16 14 12t
54 50 46 42I r I J J I I
I I r I
5300 5302 5304 5306
31
II Ii I I
(100 2)] - (011 0)! Band
P31J
2 4
I JR Branch
8 6 4 2I t I J P Branch
36 30 20 10 2r r I I J I I r 1 I I I r I I llJll QBranch
J J I I I I I
5308 5310 5312 5314 5316 5318 5320
Wavenumber(cm "1)
Giver-01

C
Q Branch 14,42 15
I I I I I I I I F I I I II Ii It II It II II I I Ilt)tJIl=l
i
40 26 24I I I I i I I J
P Branch (011 2) I . (0000) Band
I I ! I t I I I I f I5274 5276 52_'8 5280 5282 5284 5286 5288 5290 5292 5294
Wavenumber (cm "1)
Giver-02

20 ""
18
16
14
¢%1
12×
_10
Io_" 8
c6
+
4 - <><>
o2
.io •
o •
0 •0
eO
0
oo
o o
o oo
o ¢
• 0
<> oo
o o° _ o ++0 !>¢01 r I _ I I r
526(: 5270 5280 5290 5300 5310 5320 5330 5340
Wavenumber (cm "1)
Giver-03

18
17
16
T-
×
14
13
-6O
][
I I I I I I I ! I 7
-40 -20 0 20 40
m, P and R Branches
I
6O
GNer-04

17-
16 -_
t-,-
×
14
13
I I I t I I !
500 1000 1500 2000 2500 3000 3500
j2, Q Branch
Giver-G5