the running time advisor a resource signal-based approach to predicting task running time and its...
Post on 22-Dec-2015
214 views
TRANSCRIPT

The Running Time Advisor
A Resource Signal-based Approach to Predicting Task Running Time and Its Applications
Peter A. Dinda
Carnegie Mellon University
http://www.cs.cmu.edu/~pdinda

2
High Level Goals
• Application-level performance predictions– Running time of compute-bound tasks
• Adaptation advice– Host selection to meet soft real-time deadline
• Resource signal approach– Host load signals
Build systems that use statistics to help distributed applications adapt to highly variable resource availability
Focus on information
This Talk

3
Outline• Bird’s eye view
• Adapting to highly variable resource availability
• Dv/QuakeViz
• Real-time scheduling advisor
• Running time advisor
• Confidence intervals
• Performance results (feasible, practical, useful)
• Prototype system
• Host load prediction• Traces, structure, linear models, evaluation
• RPS Toolkit
• Conclusion

4
A Universal Challenge in High Performance Distributed Applications
Highly variable resource availability• Shared resources• No reservations• No globally respected priorities• Competition from other users - “background workload”
Running time can vary drastically
Adaptation

5
A Universal Problem
Task?Which host should the application send the task to so that its running time is appropriate?
Known resource requirements
What will the running time be if I...

6
DV Framework For Distributed Interactive Visualization
• Large datasets (e.g., earthquake simulations)
• Distributed VTK visualization pipelines
• Active frames• Encapsulate data, computation, path through pipeline• Launched from server by user interaction• Annotated with deadline• Dynamically chose on which host each pipeline stage
will execute and what quality settings to use
http://www.cs.cmu.edu/~dv

7
Example DV Pipeline for QuakeViz
Active Frame
n+2?
Active Frame
n+1?
Active Frame
n?
SimulationOutput
interpolationinterpolation isosurfaceextraction
isosurfaceextraction
scenesynthesis
scenesynthesis
interpolationinterpolation morphologyreconstruction
morphologyreconstruction
localdisplay
anduser
renderingrenderingreadingreading
ROI resolution contoursLogical View
interpolationinterpolation isosurfaceextraction
isosurfaceextraction
scenesynthesis
scenesynthesis
Physical View
deadline deadline deadline
8
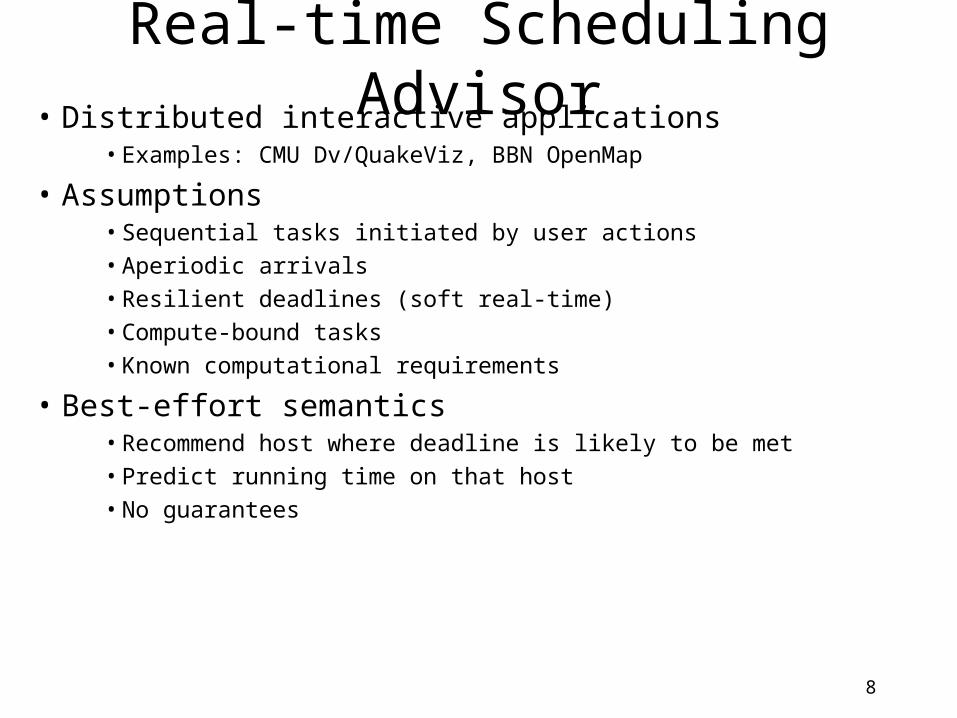
Real-time Scheduling Advisor• Distributed interactive applications
• Examples: CMU Dv/QuakeViz, BBN OpenMap
• Assumptions• Sequential tasks initiated by user actions
• Aperiodic arrivals
• Resilient deadlines (soft real-time)
• Compute-bound tasks
• Known computational requirements
• Best-effort semantics• Recommend host where deadline is likely to be met
• Predict running time on that host
• No guarantees

9
Running Time AdvisorP
redi
cted
Run
ning
Tim
e
Task
?
Application notifies advisor of task’s computational requirements (nominal time)
Advisor predicts running time on each host
Application assigns task to most appropriate host
nominal time

10
Real-time Scheduling AdvisorP
redi
cted
Run
ning
Tim
e
Task
deadlinenominal time
?
deadline
Application notifies advisor of task’s computational requirements (nominal time) and its deadline
Advisor acquires predicted task running times for all hosts
Advisor recommends one of the hosts where the deadline can be met
11
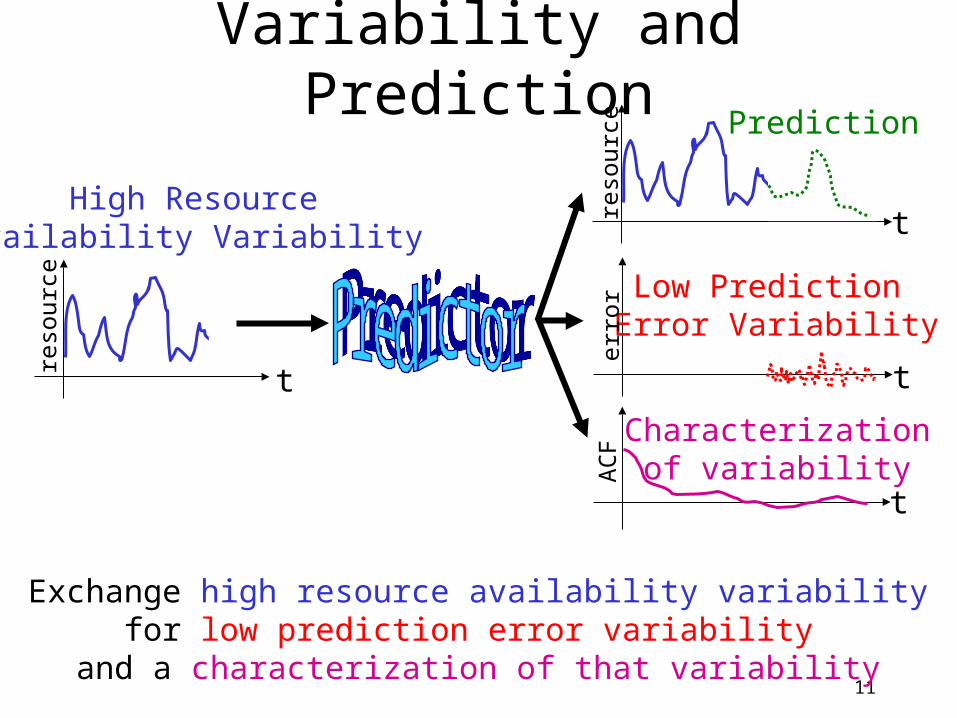
Variability and Prediction
t
High ResourceAvailability Variability
Low Prediction Error Variability
Characterizationof variability
Exchange high resource availability variabilityfor low prediction error variability
and a characterization of that variability
t
reso
urce
reso
urce
t
erro
rA
CF
t
Prediction
12
Task
deadlinenominal time
?
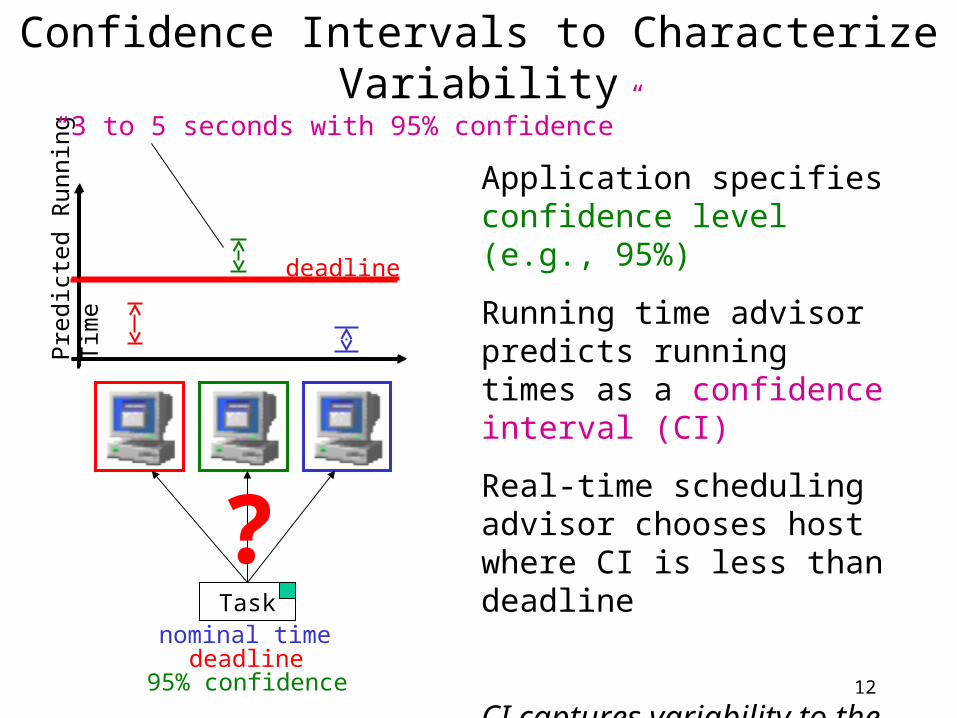
Confidence Intervals to Characterize VariabilityP
redi
cted
Run
ning
Tim
e
deadline
Application specifies confidence level (e.g., 95%)
Running time advisor predicts running times as a confidence interval (CI)
Real-time scheduling advisor chooses host where CI is less than deadline
CI captures variability to the extent the application is interested in it
“3 to 5 seconds with 95% confidence”
95% confidence

13
Confidence Intervals And Predictor Quality
Bad PredictorNo obvious choice
Good PredictorTwo good choices
Pre
dict
ed R
unni
ng T
ime
Good predictors provide smaller CIs
Smaller CIs simplify scheduling decisions
Pre
dict
ed R
unni
ng T
ime
deadline

14
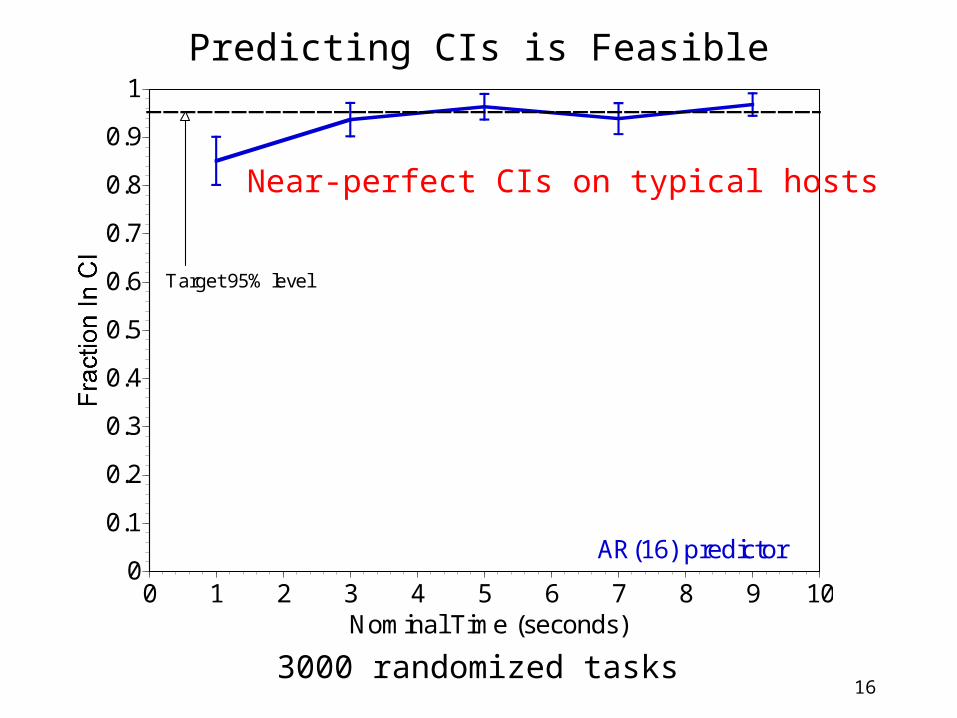
Overview of Research Results• Predicting CIs is feasible
• Host load prediction using AR(16) models• Running time estimation using host load predictions
• Predicting CIs is practical• RPS Toolkit (inc. in CMU Remos, BBN QuO)• Extremely low-overhead online system
• Predicting CIs is useful• Performance of real-time scheduling advisor
Statistically rigorous analysis and evaluation
Measured performance of real system

15
Experimental Setup• Environment
– Alphastation 255s, Digital Unix 4.0– Workload: host load trace playback– Prediction system on each host
• Tasks – Nominal time ~ U(0.1,10) seconds– Interarrival time ~ U(5,15) seconds
• Methodology– Predict CIs / Host recommendations– Run task and measure
16
Predicting CIs is Feasible
3000 randomized tasks
0
0.1
0.2
0.3
0.4
0.5
0.6
0.7
0.8
0.9
1
0 1 2 3 4 5 6 7 8 9 10Nominal Time (seconds)
Target 95% level
AR(16) predictor
Near-perfect CIs on typical hosts
17
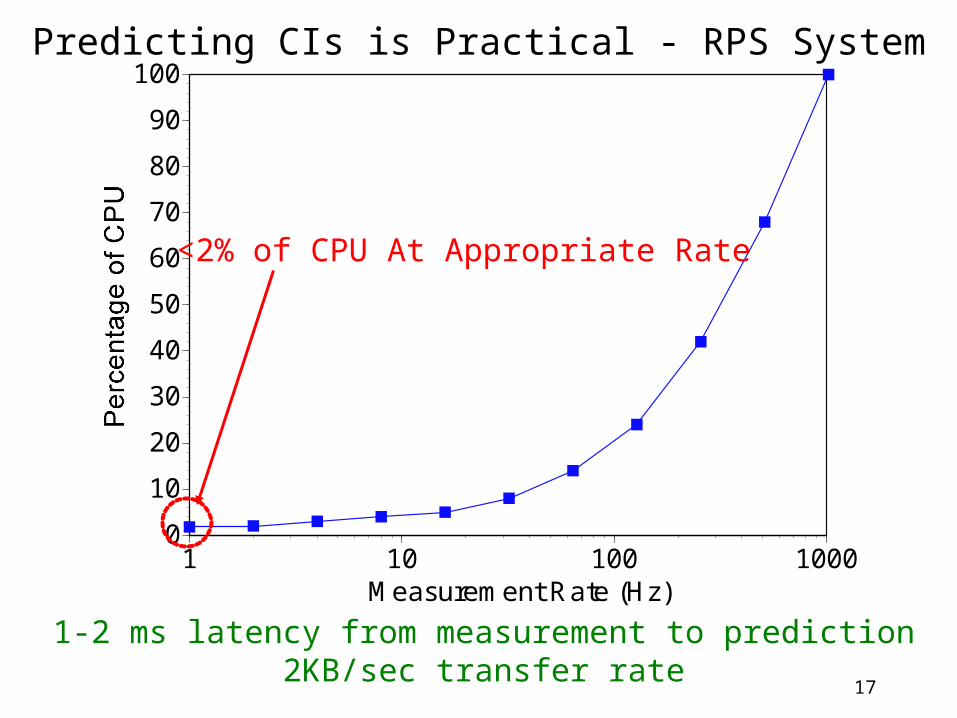
Predicting CIs is Practical - RPS System
1-2 ms latency from measurement to prediction2KB/sec transfer rate
0
10
20
30
40
50
60
70
80
90
100
1 10 100 1000Measurement Rate (Hz)
<2% of CPU At Appropriate Rate

18
0
0.1
0.2
0.3
0.4
0.5
0.6
0.7
0.8
0.9
1
1 1.2 1.4 1.6 1.8 2 2.2 2.4 2.6 2.8 3Deadline / Nominal Time
Target 95% Level
Predicting CIs is Useful - Real-time Scheduling Advisor
16000 tasks
Predicted CI < Deadline
Random Host
Host WithLowest Load

19
Predicting CIs is Useful - Real-time Scheduling Advisor
16000 tasks
0
0.1
0.2
0.3
0.4
0.5
0.6
0.7
0.8
0.9
1
1 1.2 1.4 1.6 1.8 2 2.2 2.4 2.6 2.8 3Deadline / Nominal Time
Target 95% Level
Predicted CI < Deadline
Random HostHost With Lowest Load

20
Outline• Bird’s eye view
• Adapting to highly variable resource availability
• Dv/QuakeViz
• Real-time scheduling advisor
• Running time advisor
• Confidence intervals
• Performance results (feasible, practical, useful)
• Prototype system
• Host load prediction• Traces, structure, linear models, evaluation
• RPS Toolkit
• Conclusion

21
Design Space
Can the gap between the resources and the application can be spanned? yes!
Application-oriented Resource-orientedMeasurement Task executions Resource-specificAdvantages
Close to applicationPeriodic measurementsScales with resourcesEasy sharingEasy exploration
Disadvantages Aperiodic measurementsDifficult to make scaleLimited sharingLimited exploration
Distant from application

22
Resource Signals
• Characteristics• Easily measured, time-varying scalar quantities• Strongly correlated with resource availability • Periodically sampled (discrete-time signal)
• Examples• Host load (Digital Unix 5 second load average)• Network flow bandwidth and latency
Leverage existing statistical signal analysis and prediction techniques
23
RPS Toolkit• Extensible toolkit for implementing resource
signal prediction systems
• Easy “buy-in” for users• C++ and sockets (no threads)• Prebuilt prediction components• Libraries (sensors, time series, communication)
• Users have bought in• Incorporated in CMU Remos, BBN QuO• Research users: Bruce Lowekamp, Nancy Miller,
LeMonte Green
http://www.cs.cmu.edu/~pdinda/RPS.html

24
Prototype System
Host Load Measurement System
Host Load Prediction System
Running Time Advisor
Real-time Scheduling Advisor
Application
Measurement Stream
Load PredictionRequest
Load PredictionResponse
Nominal timeconfidence, host
Running time estimate(confidence interval)
Nominal time, slack,confidence, host list
Host, running timeestimate
Daemon(one per host)
Library
RPS components can be composed in other ways

25
Research Results• Host load on real hosts has exploitable structure
– Strong autocorrelation, self-similarity, epochal behavior – Trace database and host load trace playback
• Host load is predictable using simple linear models– Recommendation: AR(16) models or better for 1-30 sec predictions– RPS Toolkit for low overhead systems (<2% of CPU)
• C++, ported to 5 OSes, incorporated in CMU Remos, BBN QuO
• Running time CIs can be computed from load predictions– Load discounting, error covariances
• Effective real-time scheduling advice can be based on CIs– Know if deadline will be met before running task

26
Outline• Bird’s eye view
• Adapting to Highly variable resource availability
• Dv/QuakeViz
• Real-time scheduling advisor
• Running time advisor
• Confidence intervals
• Performance results (feasible, practical, useful)
• Prototype system
• Host load prediction• Traces, structure, linear models, evaluation
• RPS Toolkit
• Conclusion

27
Questions
• What are the properties of host load?
• Is host load predictable?
• What predictive models are appropriate?
• Are host load predictions useful?

28
Overview of Answers
• Host load exhibits complex behavior• Strong autocorrelation, self-similarity, epochal behavior
• Host load is predictable• 1 to 30 second timeframe
• Simple linear models are sufficient• Recommend AR(16) or better
• Predictions are useful• Can compute effective CIs from them

29
Host Load Traces• DEC Unix 5 second exponential average
• Full bandwidth captured (1 Hz sample rate)• Long durations
Machines Duration
August 1997 13 production cluster8 research cluster2 compute servers
15 desktops
~ one week(over onemillionsamples)
March 1998 13 production cluster8 research cluster2 compute servers
11 desktops
~ one week(over onemillionsamples)

30
If Host Load Was “Random” (White Noise)...
Time domain Autocorrelation
SpectrogramFrequency domain
Title:axp7_7_19_rand_time.epsCreator:MATLAB, The Mathworks, Inc.Preview:This EPS picture was not savedwith a preview included in it.Comment:This EPS picture will print to aPostScript printer, but not toother types of printers.
Title:axp7_7_19_rand_acf.epsCreator:MATLAB, The Mathworks, Inc.Preview:This EPS picture was not savedwith a preview included in it.Comment:This EPS picture will print to aPostScript printer, but not toother types of printers.
Title:axp7_7_19_rand_fft.epsCreator:MATLAB, The Mathworks, Inc.Preview:This EPS picture was not savedwith a preview included in it.Comment:This EPS picture will print to aPostScript printer, but not toother types of printers.
Title:axp7_7_19_rand_spec.epsCreator:MATLAB, The Mathworks, Inc.Preview:This EPS picture was not savedwith a preview included in it.Comment:This EPS picture will print to aPostScript printer, but not toother types of printers.

31
Host Load Has Exploitable StructureTime domain Autocorrelation
SpectrogramFrequency domain
Title:axp7_7_19_norand_time.epsCreator:MATLAB, The Mathworks, Inc.Preview:This EPS picture was not savedwith a preview included in it.Comment:This EPS picture will print to aPostScript printer, but not toother types of printers.
Title:axp7_7_19_norand_fft.epsCreator:MATLAB, The Mathworks, Inc.Preview:This EPS picture was not savedwith a preview included in it.Comment:This EPS picture will print to aPostScript printer, but not toother types of printers.
Title:axp7_7_19_norand_acf.epsCreator:MATLAB, The Mathworks, Inc.Preview:This EPS picture was not savedwith a preview included in it.Comment:This EPS picture will print to aPostScript printer, but not toother types of printers.
Title:axp7_7_19_norand_spec.epsCreator:MATLAB, The Mathworks, Inc.Preview:This EPS picture was not savedwith a preview included in it.Comment:This EPS picture will print to aPostScript printer, but not toother types of printers.

32
Linear Time Series Models
(2000 sample fits, largest models in study, 30 secs ahead)
Model Class Fit time (ms) Step time (ms) NotesMEAN 0.03 0.003 Error is signal varianceLAST 0.75 0.001 Last value is predictionBM(p) 46.26 0.001 Average over best windowAR(p) 4.20 0.149 Deterministic algorithmMA(q) 6501.72 0.015 Function OptimizationARMA(p,q) 77046.22 0.034 Function OptimizationARIMA(p,d,q) 53016.77 0.045 Non-stationarity, FOARFIMA(p,d,q) 3692.63 9.485 Long range dependence, MLE
Pole-zero / state-space models capture autocorrelation parsimoniously

33
Evaluation Methodology
• Ran ~190,000 randomly chosen testcases on the traces– Evaluate models independently of
prediction/evaluation framework• No monitoring
– ~30 testcases per trace, model class, parameter set
• Data-mine results
Offline and online systems implemented using RPS Toolkit

34
Testcases
• Models
– MEAN, LAST/BM(32)
– Randomly chosen model from: AR(1..32), MA(1..8), ARMA(1..8,1..8), ARIMA(1..8,1..2,1..8), ARFIMA(1..8,d,1..8)
Load Trace ~one week
345,000 to >1Msamples at 1Hz
Fit Interval5 min...3 hours
(m=600 to 10800 samples)
Test Interval5 min...3 hours
(n=600 to 10800 samples)
Crossover Point3 hours, trace length - 3 hours
tzmtz 1ntz

35
Evaluating a TestcaseMeasurements in Fit Interval
Model
Modeler
LoadPredictor
Evaluator
Measurements in Test Interval
Prediction Stream
zt+n-1,…, zt+1 , zt
z’ t,t+w
z’ t,t+1
z’ t,t+2
...
z’ t+1,t
+1+w
z’ t+1,t
+2z’ t+
1,t+3..
.
z’ t+2,t
+2+w
z’ t+2,t
+3z’ t+
2,t+4..
.
...
...
...
<zt-m,..., zt-2 , zt-1>
Model Type
Error Metrics
Error Estimates
One-time use
Production
Stream
Characterization of variation
Measurement ofvariation

36
Measured Prediction Variance: Mean Squared Error
…, zt+1 , zt
z’ t,t+w
z’ t,t+1
z’ t,t+2
...
z’ t+1,t
+1+w
z’ t+1,t
+2z’ t+
1,t+3..
.
z’ t+2,t
+2+w
z’ t+2,t
+3z’ t+
2,t+4..
.
...
...
... 1 step ahead predictions
2 step ahead predictions
w step ahead predictions
...
( - zt+i)2 Variance of z
...
(z’t+i,t+i+1 - zt+i+1 )2
(z’t+i,t+i+2 - zt+i+2 )2
(z’t+i,t+i+w - zt+i+w)2
1 step ahead mean squared error
2 step ahead mean squared error
w step ahead mean squared error
...
aw=
a1=
a2=
z =
LoadPredictor
Good Load Predictor :a1,
a2 ,…,aw
z

37
Unpaired Box Plot Comparisons
Good models achieve consistently low error
Mea
n S
quar
ed E
rror
Model A Model B Model C
Inconsistentlow error
Consistent low error
Consistent high error
2.5%
25%
50%
Mean
75%
97.5%

38
Title:all_1_8.epsCreator:MATLAB, The Mathworks, Inc.Preview:This EPS picture was not savedwith a preview included in it.Comment:This EPS picture will print to aPostScript printer, but not toother types of printers.
1 second Predictions, All Hosts
2.5%
25%
50%
Mean
75%
97.5%
Predictive models clearly worthwhile

39
Title:all_30_8.epsCreator:MATLAB, The Mathworks, Inc.Preview:This EPS picture was not savedwith a preview included in it.Comment:This EPS picture will print to aPostScript printer, but not toother types of printers.
30 second Predictions, All Hosts
2.5%
25%
50%
Mean
75%
97.5%
Predictive models clearly beneficialeven at long prediction horizons

40
Title:axp0_30_8.epsCreator:MATLAB, The Mathworks, Inc.Preview:This EPS picture was not savedwith a preview included in it.Comment:This EPS picture will print to aPostScript printer, but not toother types of printers.
30 Second Predictions, High Load, Dynamic Host
2.5%
25%
50%
Mean
75%
97.5%
Predictive models clearly worthwhileBegin to see differentiation between models

41
Outline• Bird’s eye view
• Adapting to highly variable resource availability
• Dv/QuakeViz
• Real-time scheduling advisor
• Running time advisor
• Confidence intervals
• Performance results (feasible, practical, useful)
• Prototype system
• Host load prediction• Traces, structure, linear models, evaluation
• RPS Toolkit
• Conclusion

42
Related Work• Distributed interactive applications
• QuakeViz/ Dv, Aeschlimann [PDPTA’99]
• Quality of service • QuO, Zinky, Bakken, Schantz [TPOS, April 97]• QRAM, Rajkumar, et al [RTSS’97]
• Distributed soft real-time systems• Lawrence, Jensen [assorted]
• Workload studies for load balancing• Mutka, et al [PerfEval ‘91]• Harchol-Balter, et al [SIGMETRICS ‘96]
• Resource signal measurement systems• Remos [HPDC’98]• Network Weather Service [HPDC‘97, HPDC’99]
• Host load prediction• Wolski, et al [HPDC’99] (NWS)• Samadani, et al [PODC’95]• Hailperin [‘93]
• Application-level scheduling• Berman, et al [HPDC’96]• Stochastic Scheduling, Schopf [Supercomputing ‘99]

43
Conclusions• Help applications adapt to
highly variable resource availability• Resource signal prediction• Predict running times as confidence intervals
– Predicting CIs is feasible• Host load prediction using AR(16) models• Running time estimation using host load predictions
– Predicting CIs is practical• RPS Toolkit (inc. in CMU Remos, BBN QuO)• Extremely low-overhead online system
– Predicting CIs is useful• Performance of real-time scheduling advisor

44
Future Work• New resource signals
– Network bandwidth and latency (Remos)
• New prediction approaches– Wavelets, nonlinearity, cointegration
• Resource scheduler models– Better Unix scheduler model– Network models
• Adaptation advisors• Applications and workloads
– DV/QuakeViz, GIMP, Instrumentation

45
Tools/Venues for Future work
• Resource signal methodolgy
• RPS Toolkit
• Remos
• QuakeViz/DV
• Grid Forum

46
Future Work (Long Term)
• Experimental computer science research
• Application-oriented view
• Measurement studies and analysis
• Statistical approach
• Application services
• Systems building
systems X applications X statistics

47
Teaching
• “Signals, systems, and statistics for computer scientists”
• “Performance data analysis”
• “Introduction to computer systems”

48
Response of Typical AR(16)Title:themis_3hours.ar16.epsCreator:MATLAB, The Mathworks, Inc.Preview:This EPS picture was not savedwith a preview included in it.Comment:This EPS picture will print to aPostScript printer, but not toother types of printers.
49
Response of AR(1024)Title:themis_3hours.ar1024.epsCreator:MATLAB, The Mathworks, Inc.Preview:This EPS picture was not savedwith a preview included in it.Comment:This EPS picture will print to aPostScript printer, but not toother types of printers.