the rural health care workforce today and tomorrow
DESCRIPTION
THE RURAL HEALTH CARE WORKFORCE TODAY AND TOMORROW. Mark Doescher, MD, MSPH Director, WWAMI Rural Health Research and UW Center Center for Health Workforce Studies University of Washington School of Medicine Office of Rural Health Policy Grantee Partnership Meeting August 31, 2009 - PowerPoint PPT PresentationTRANSCRIPT

THE RURAL HEALTH CARE WORKFORCE
TODAY AND TOMORROW
Mark Doescher, MD, MSPHDirector, WWAMI Rural Health Research and
UW Center Center for Health Workforce StudiesUniversity of Washington School of Medicine
Office of Rural Health Policy Grantee Partnership Meeting August 31, 2009
Washington, DC

AcknowledgmentsAcknowledgments
This University of Washington WWAMI Rural Health Research Center is funded by the Office of Rural Health Policy, Health Resources and Services Administration, Department of Health and Human Services.

Goals and Objectives
1. Summarize rural workforce trends in four disciplines:
•RNs
•Dentists
•General Surgeons
•Primary Care Providers
2. Examine the primary care pipeline to highlight key workforce supply factors.
3. Engage in discussion with audience on how to ensure a bright future for the rural health care workforce.

Part 1 The Rural Health Care Workforce
1. Registered Nurses
2. Dentists
3. General Surgeons
4. Primary Care Providers

Overarching Rural Workforce Issues
The rural health care workforce is subject to:
• Low overall supply
• Uneven distribution
• Need for generalists in an ever specializing world
Global Rural Workforce Issues
• The rural health care workforce needs professionals:• who are willing to work long hours and
• who are adequately prepared to take care of the needs of aging populations.
• However, new health care professionals work fewer hours than their predecessors and often have a narrower range of skills.

Registered Nurses
QuickTime™ and aTIFF (Uncompressed) decompressor
are needed to see this picture.

Registered Nurses (RNs)
Issue
Overall shortages and regional maldistribution of RNs in rural areas of the US are expected to grow as:– “baby boomer” RNs retire.
– more RNs commute to urban areas for jobs.

Registered Nurses
Evidence
An RN shortage of more than 1 million RN FTEs by 2020 has been projected.
National Center for Health Workforce Analysis. (2004). Projected supply, demand and shortages of registered nurses: 2004-2020.

Registered Nurses
Evidence
• The average age of RNs living in rural and urban areas in 2004 was 45 years.
• Rural RNs’ average age in 2004 was 6 years older than it was in 1980.
• 20% of rural RNS were age 55 or older.
Skillman SM, et al. Changes in the rural registered nurse workforce from 1980 to 2004. Final Report #115. Seattle, WA: WWAMI RHRC; Oct 2007.

Registered Nurses
Skillman SM, et al. Changes in the rural registered nurse workforce from 1980 to 2004. Final Report #115. Seattle, WA: WWAMI RHRC; Oct 2007.

Registered Nurses
Evidence
• Large percentages of RNs living in rural locations now commute to more populated locations.
• Commuting RNs are younger than those who work in the rural locations in which they reside.
Skillman SM, WWAMI Rural Health Research Center, University of Washington. Policy brief: threats to the future supply of rural registered nurses. Seattle, WA: Author; Apr 2009.

Dentists
Dentists
Issue• Rural populations have fewer dentists, lower dental
care utilization and higher rates of dental caries and permanent tooth loss than urban populations.
• Reports from the Surgeon General and the IOM call for more dentists in rural locations.
• Federal and state programs have focused on expanding oral health care provider supply to increase dental access and improve oral health.
•Department of Health and Human Services. 2000. Oral Health in America: A Report of the Surgeon General. Rockville, Md.•Doescher et al. 2009; WWAMI RHRC; report pending.

Dentists
Evidence
• Of the 2,050 rural counties, 1,221 (60%) are designated dental health professional shortage areas (HPSAs).
• In 2008, there were 21 “generalist” (general practice, pediatric) dentists per 100,000 persons in rural areas compared with 30 in urban areas.
Doescher MP, et al. WWAMI Rural Health Research Center, University of Washington. Policy brief: the crisis in rural dentistry. Seattle, WA; Apr 2009.

Dentists
Doescher MP, et al. WWAMI Rural Health Research Center, University of Washington. Policy brief: the crisis in rural dentistry. Seattle, WA: Author; Apr 2009.

Dentists
Evidence
• Rural areas had a higher percentage of generalist dentists aged 56 or older than urban areas (43.8% vs. 38.0%).
• This percentage was greatest in remote rural locations.
Doescher MP, et al. WWAMI Rural Health Research Center, University of Washington. Policy brief: the crisis in rural dentistry. Seattle, WA; Apr 2009.

Dentists
Doescher MP, et al. WWAMI Rural Health Research Center, University of Washington. Policy brief: the crisis in rural dentistry. Seattle, WA; Apr 2009.

Dentists
EVIDENCE• In 2004, dentists working at rural federally-
qualified community health centers were in high demand and short supply.
• Almost half of rural CHCs had vacant dentist positions for over 7 months.
Rosenblatt RA, et al. 2006. Shortages of medical personnel at community health centers: implications for planned expansion. JAMA. Mar 1 2006;295(9):1042-1049.

General Surgeons
QuickTime™ and aTIFF (Uncompressed) decompressor
are needed to see this picture.
General Surgeons
Issues• Rural general surgeons perform emergency
operations, underpin the trauma care system, and back-up primary care providers.
• Without surgical services, small hospitals often fail, which reduces community employment and jeopardizes local healthcare.
• The dramatic decline in the number of rural general surgeons in the US since the early 1980s has precipitated a crisis in rural general surgery.
Lynge DC, et al. 2008. A longitudinal analysis of the general surgery workforce in the United States, 1981-2005. Arch Surg. 143(4):345-50.

General SurgeonsGeneral Surgeons
Evidence
• Between 1981 and 2005, the number of rural general surgeons per 100,000 population declined by 21%.
• In 2005, there were 5.0 general surgeons per 100,000 persons in rural areas compared with 5.9 in urban areas. This number was only 4.3 for small nonadjacent rural counties.
Lynge DC, et al. 2008. A longitudinal analysis of the general surgery workforce in the United States, 1981-2005. Arch Surg. 143(4):345-50.

General SurgeonsGeneral SurgeonsNumber of Rural and Urban General Surgeons Per
100,000 Population, 1981-2005
Lynge DC, et al. 2008. A longitudinal analysis of the general surgery workforce in the United States, 1981-2005. Arch Surg. 143(4):345-50.

General SurgeonsGeneral Surgeons
Evidence• The majority of rural general surgeons are
approaching retirement age: 52.0% were aged between 50 and 62 in 2005.
• Women make up an increasing proportion of the rural general surgery workforce: their proportion rose from 1.0% in 1981 to 8.9% in 2005.
• International medical graduates make up a smaller proportion of the rural surgery workforce: their proportion declined from 25.3% in 1981 to 14.9% in 2005.
• Doescher MP, et al.2009. WWAMI Rural Health Research Center, University of Washington. Policy brief: the crisis in rural general surgery. Seattle, WA; April, 2009.
• Lynge DC, et al. 2008. A longitudinal analysis of the general surgery workforce in the United States, 1981-2005. Arch Surg. 143(4):345-50.

General SurgeonsPercentage of Rural and Urban General Surgeons Nearing
Retirement Age (50-62 Years)
Doescher MP, et al.2009. WWAMI Rural Health Research Center, University of Washington. Policy brief: the crisis in rural general surgery. Seattle, WA; April, 2009.

Primary Care Providers
QuickTime™ and aTIFF (Uncompressed) decompressor
are needed to see this picture.

Primary Care Providers
Issues• Primary care plays a critical role in rural health care delivery.
• Yet the number of U.S. health care students choosing primary care careers has declined precipitously.
• Factors discouraging recruitment and retention:
– Low compensation
– Rising malpractice premiums
– Professional isolation
– Limited time off
– Difficulty finding jobs for spouses
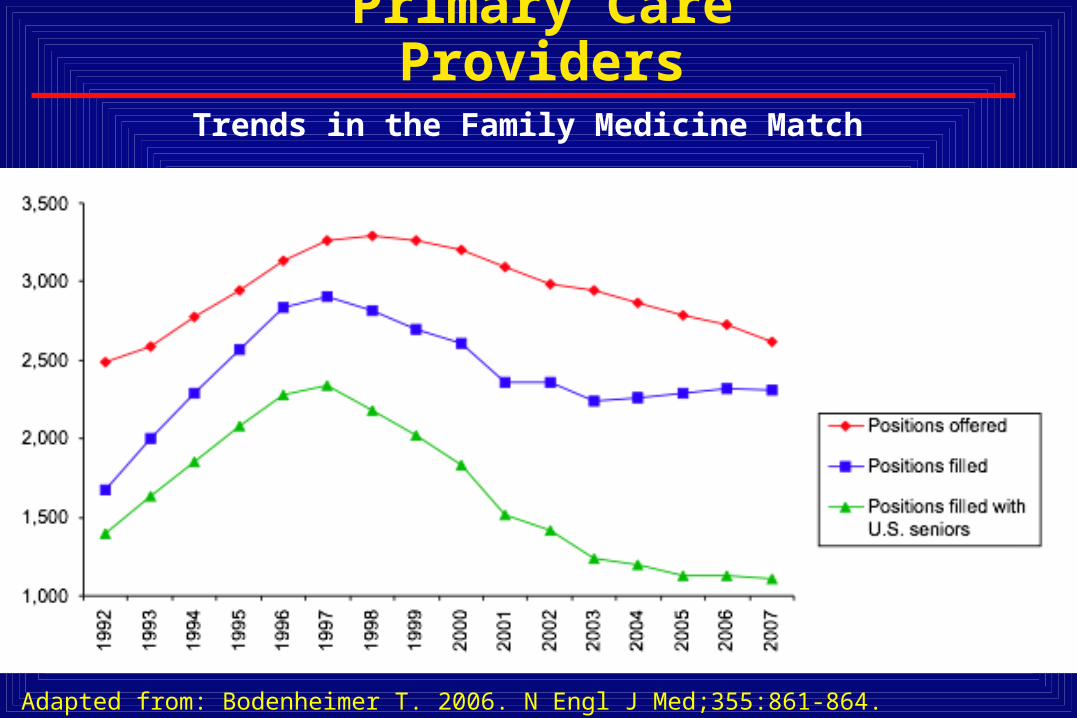
Primary Care ProvidersTrends in the Family Medicine Match
Adapted from: Bodenheimer T. 2006. N Engl J Med;355:861-864.

Primary Care Providers
Issues• Within primary care, family physicians constitute the
largest proportion of the rural primary care physician workforce.
• The availability of family medicine residency training opportunities in rural locations provides a critical mechanism for rural supply.
• Yet training opportunities in rural locations are under threat.
Chen FM, et al. Policy brief: the availability of family medicine residency training in rural locations of the United States. Seattle, WA: WWAMI Rural Health Research Center, University of Washington, June, 2009.

Change in Rural Training FTEs
0
100
200
300
400
500
600
Ruralprograms
Urbanprograms
Total
20002007
Primary Care Providers
Chen FM, et al. Policy brief: the availability of family medicine residency training in rural locations of the United States. Seattle, WA: WWAMI Rural Health Research Center, University of Washington, June, 2009.

Primary Care Providers
Evidence• Over three-quarters of rural counties are
designated as primary care HPSAs.
• 165 rural counties lacked a primary care physician in 2005.
Doescher MP, et al.. Policy brief: the crisis in rural primary care. Seattle, WA: WWAMI Rural Health Research Center, University of Washington; April, 2009.

Primary Care Providers

Primary Care ProvidersEvidence• In 2005, there were 55 primary care physicians
per 100,000 persons in rural areas compared with 72 in urban areas.
• Rural primary care physicians are older than their urban counterparts, particularly in remote locations.
Doescher MP, et al. Policy brief: the aging of the primary care physician workforce: are rural locations vulnerable? Seattle, WA: WWAMI Rural Health Research Center, University of Washington; June, 2009.
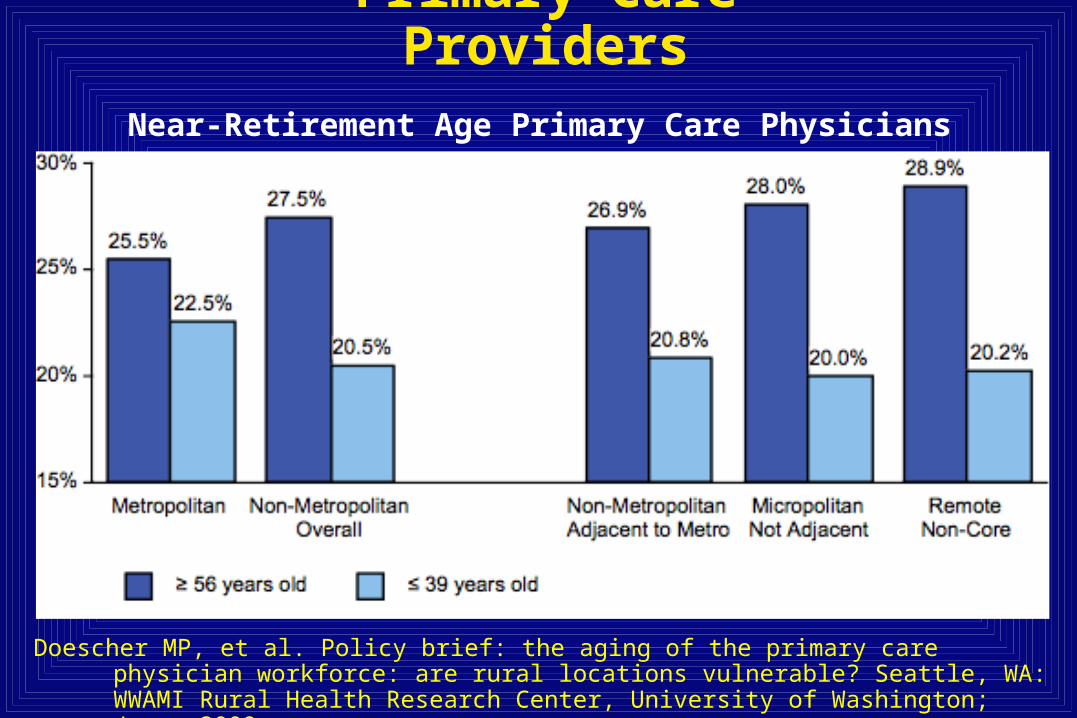
Primary Care ProvidersNear-Retirement Age Primary Care Physicians
Doescher MP, et al. Policy brief: the aging of the primary care physician workforce: are rural locations vulnerable? Seattle, WA: WWAMI Rural Health Research Center, University of Washington; June, 2009.

Primary Care ProvidersPrimary Care Physicians Per 100,000 Population, 2005
Urban LargeRural
SmallRural
IsolatedSmall Rural
0
10
20
30
40
50
60
70
8071
61 59
36

Primary Care Providers
Evidence• Rural areas increasingly rely on PAs and NPs
for primary care. –34% of the primary care workforce in
Wyoming
–46% of the direct clinical care providers at rural CHCs.
Skillman SM, et al. Wyoming primary care gaps and policy options. Final Report #122. Seattle, WA: WWAMI Center for Health Workforce Studies, University of Washington; Dec 2008.

Primary Care Providers
Evidence• In 2004, rural CHCs had significantly higher
proportions of unfilled positions and more difficulty recruiting family physicians than urban CHCs–more than one third of rural CHCs spent over 7
months recruiting a family physician.
Rosenblatt RA,et al. Shortages of medical personnel at community health centers: implications for planned expansion. JAMA. Mar 1 2006;295(9):1042-1049.

Part 2: The Rural Primary Care PipelineAn Illustration of Factors that Influence Supply
• An in-depth presentation of efforts to address rural primary care shortages
• Rationale:–Primary care is a critical ingredient of the rural health
care workforce.
–The primary care workforce is relatively well-studied.
–Many of the factors affecting rural primary care are relevant for other health care disciplines.

The Challenge: Most training is in the city…

…but we need folks who choose to work here.

Primary Care
The benefit of primary care-based health care delivery:
• More preventive care• Better quality of care• More equitable care• Better population health outcomes, including lower
mortality• Lower costs
Starfield, B., L. Shi, and J. Macinko. 2005. “Contribution of Primary Care to Health Systems and Health.” Milbank Quarterly 83(3): 457-502.

Primary care and health care-sensitive outcomes
Starfield B, Simpson L. 1993. Primary care as part of U.S. health services reform.
JAMA; 269:3136-9.

Primary care and health care expenditures
Starfield B, Simpson L. 1993. Primary care as part of U.S. health services reform.
JAMA; 269:3136-9.

The decline of primary care in the U.S.
• Despite the benefits of having a strong system of primary care, new physicians are increasingly choosing specialties over primary care.
• Primary care shortages persist throughout US, particularly in rural and inner city locations.
• Evidence of growing problems of access to primary care.

New physicians entering specialties
Institute of Medicine (IOM). 1994. Changing the Health Care System: Models from Here and Abroad.

Bodenheimer T. N Engl J Med 2006;355:861-864.
Proportions of Third-Year Internal Medical Residents Choosing Careers as Generalists, Subspecialists, and
Hospitalists

Decline of primary care in the U.S.
• Estimates suggest that increased insurance uptake under health care reform would increase the workload of existing primary care physicians by roughly 30% between now and 2025.
• By the same period, the supply of primary care physicians will rise by only 7%.
• This would lead to a shortfall of 35,000 to 44,000 primary care physicians who treat adults.
• Overall population growth and a growing elderly population are driving the projected shortfall.
Source: Spyros Andreopoulos. Doctor shortage imperils Obama's health care reformSan Francisco Chronicle, Sunday, December 21, 2008

US Primary Care Health Professional Shortage Areas By County (2006)
Legend
Data Source: HRSA (08/03/2006) Prepared by The Robert Graham Center
A Partial PC HPSA (n=667, 21.2%)A Full PC HPSA (n=1381, 44.0%)
Not A PC HPSA (n=1093, 34.8%)
>750 vacancies for PCPs at Community Health Centers (2004)

Why primary care is in troubleWhy primary care is in trouble
The number of medical students choosing training in internal medicine, family medicine and geriatrics is down and many physicians now in practice are leaving the field.
The extent to which primary care NPs and PAs will make up this gap is not known.
Factors before medical school matriculation
1. Educational environment: medical school and residency training
2. Practice environment
1. Compensation and debt burden
2. Work/life satisfaction: long working hours; the complexity of dealing with chronically ill patients; paperwork

We do not do a good job of producing our own rural workforce.
Rural physicians are 3x more likely than their urban counterparts to come from a rural background.
But many rural educational systems are inadequate to the task of producing health care professionals.
Factors before medical school matriculation

We need to improve K-12 education. One of the most effective “health care reform” policies might be to systematically improve educational quality in rural communities.
Rural school districts and states must ensure that students in rural locations have adequate preparation to gain admission to and perform well in health professions schools.
Factors before medical school matriculation

Admissions Medical schools can have a major impact on the number of rural and primary care physicians by admitting students who grew up in rural locations.
In other words, medical schools can be effective not only as passive conduits to residency programs, but also as settings which reinforce the aspirations of students who will later become rural doctors.
Factors during medical school and residency

Admissions Rural upbringing
Plan to become primary care physician (earlier the better)
Size and type of undergraduate college
Objective, unbiased admissions process, including interviews
Factors during medical school and residency

Factors during medical school and residency
Curricula Intensive long-term relevant integrated clinical curriculum
• Multiple primary care courses and rotations• Residency program which reinforces primary care values, and
provides relevant skills for inner city settings
• Other Factors• Manageable student debt (<$150,000)• Strong psychosocial support for students• Institutional values and commitment

The Widening Physician Payment Gap
$0
$50,000
$100,000
$150,000
$200,000
$250,000
$300,000
$350,000
$400,000
$450,000
Year
An
nu
al
Inc
om
e
Diagnostic Radiology
Orthopedic Surgery
Primary Care
Family Medicine
Source: Robert Graham Center
Factors affecting the practice environment

Ebell, M. H. JAMA 2008;300:1131-1132.
Percentage of Positions Filled With US Seniors vs. Mean Overall Income By Specialty
Factors affecting the practice environment

Factors affecting the practice environment
LifestyleA primary care physician with a panel of 2500
average patients would spend:
7.4 hours per day to deliver all recommended preventive care.
10.6 hours per day to deliver all recommended chronic care services.
Yarnall et al. Am J Public Health 2003;93:635.Ostbye et al. Annals of Fam Med 2005;3:209.
Policies do affect primary care career choices
• Physician payment
• Training pipeline
• Infrastructure investment and practice redesign

Payment
Fee for service payment
–MedPAC June 2008: “primary care services—which rely heavily on cognitive activities such as patient evaluation and management (E&M)—are undervalued.”
–MedPAC recommendation: 5-10% increase for primary care, budget neutral.
–Many primary care experts, such as the AAFP, recommending: 20+% increase.

Payment: Medicare
Sustainable Growth Rate (SGR)
Congress created the SGR formula to control Medicare spending by setting yearly targets for total Medicare physician expenditures.
Each year, if total physician expenditures exceed a target, the SGR mandates Congress to reduce the conversion factor to bring MCR physician spending back into line.

Payment: Medicare
Sustainable Growth Rate (SGR)
Currently 6 separate groups of expenditure targets lumped into a single CF:
Evaluation and management (E&M) 1. primary care and preventive services 2. other E&M services
-----------------------------------------------Non-evaluation and management (non-E&M)
1. imaging services and diagnostic tests (other than clinical diagnostic laboratory tests)
2. major procedures 3. anesthesia services 4. minor procedures/other physician services
Research indicates that having 2 separate SGR pools, one for E&M and the other for non-E&M services could strengthen financing for primary care and other non-procedural disciplines.

Training Pipeline:Medical Education Program Funding
• Title VII of the Public Health Service Act, Health Resources and Services Administration (HRSA)
– Section 747 funds grants to educational institutions for training of primary care physicians, physician assistants, and dentists (~$50M 2008)
– Nursing (RN, NP) training funded through Title VIII
• Medicare Graduate Medical Education Payments– Pays hospitals for residency training ($8.8B in 2007)
• National Health Service Corps– Scholarship and loan repayment programs in return for
practice obligation in underserved area (~$155M 2007)
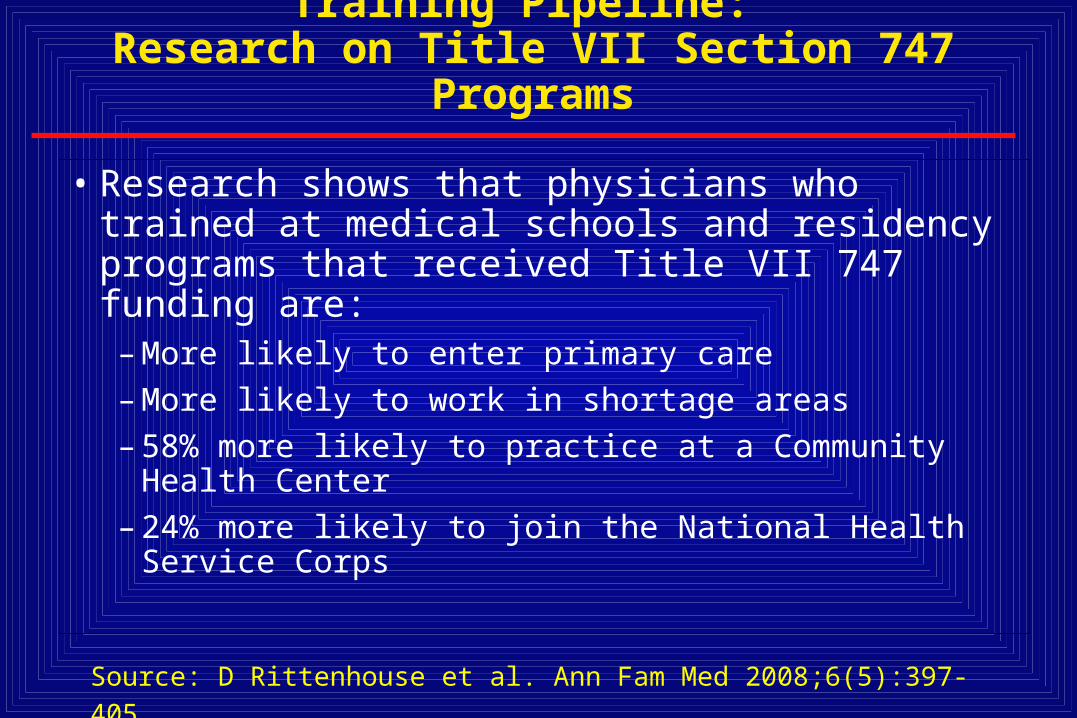
Training Pipeline: Research on Title VII Section 747 Programs
• Research shows that physicians who trained at medical schools and residency programs that received Title VII 747 funding are:
– More likely to enter primary care
– More likely to work in shortage areas
– 58% more likely to practice at a Community Health Center
– 24% more likely to join the National Health Service Corps
Source: D Rittenhouse et al. Ann Fam Med 2008;6(5):397-405.

Training Pipeline: Research on Title VII Section 747 Programs
Percent of Physicians Working in CHCs (2001-2003)
3.0%
1.9%
0.0%
1.0%
2.0%
3.0%
Title VII Graduates Non Title VII Graduates
Source: D Rittenhouse et al, Ann Fam Med, 2008
Percent of US Medical School Graduates Working at a CHCs According to Whether School Was Title VII Grant Funded

Title VII Funding Over Time, Adjusted for Inflation
$0
$20,000,000
$40,000,000
$60,000,000
$80,000,000
$100,000,000
$120,000,000
$140,000,000
$160,000,000
$180,000,000
$200,000,000
Year
Tit
le V
II F
un
din
g,
Ad
juste
d,
in 2
008$
Total Appropriation, Adjusted, in 2008$
Family Medicine Appropriation, Adjusted, in 2008$
Approximate Family Medicine Appropriation by Ratable Reduction, Adjusted, in 2008$ *
Training Pipeline: Title VII Section 747 funding appropriations (in 2008 dollars)
Robert Graham Center for Policy Studies in Family Medicine & Primary Care.
1. Training Pipeline:

Training Pipeline:Title VII Section 747 programs
Recommendations of the HRSA Advisory Committee on Training in Primary Care Medicine and Dentistry 6th Report to Congress, 2006: “the Title VII, section 747 grant program requires reauthorization and an appropriation at a minimum level of $215 million.”
• AAFP recommended an increase in the fiscal year 2008 appropriation bill provide at least $300 million for Title VII, including $92 million for the Section 747, the primary care medicine and dentistry cluster (which would restore the program to its fiscal year 2003 level).
• ARRA: Secretary Sebelius recently announced that $48 million of the $200 million in ARRA funds for Title VII and VIII would be applied to support the the primary care medicine and dentistry cluster.
• $264 million is in the Obama 2010 budget for Title VII of which 56 million is budgeted for the primary care medicine and dentistry cluster.
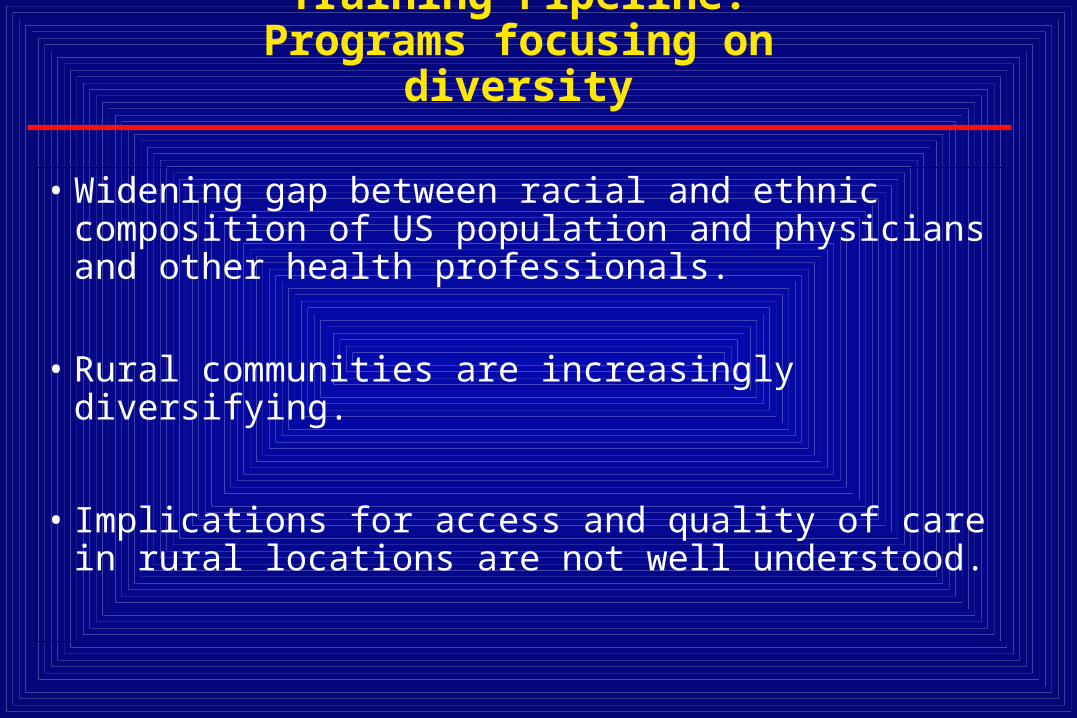
Training Pipeline:Programs focusing on diversity
• Widening gap between racial and ethnic composition of US population and physicians and other health professionals.
• Rural communities are increasingly diversifying.
• Implications for access and quality of care in rural locations are not well understood.
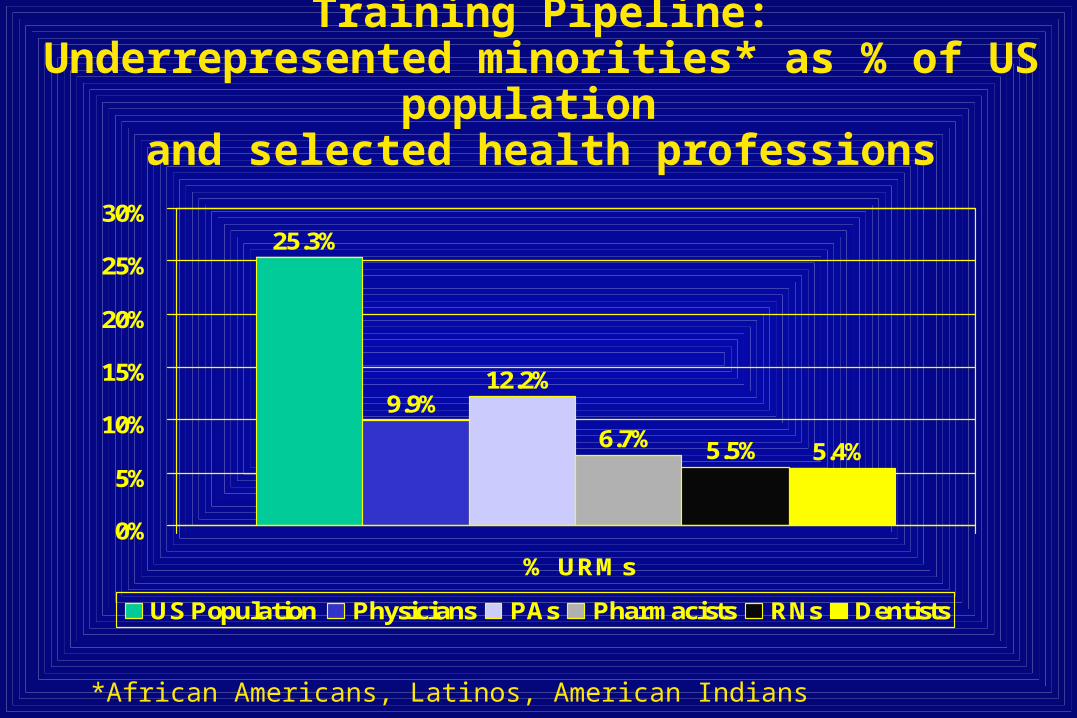
Training Pipeline:Underrepresented minorities* as % of US population
and selected health professions
25.3%
9.9%12.2%
6.7% 5.5% 5.4%
0%
5%
10%
15%
20%
25%
30%
% URMs
US Population Physicians PAs Pharmacists RNs Dentists
*African Americans, Latinos, American Indians
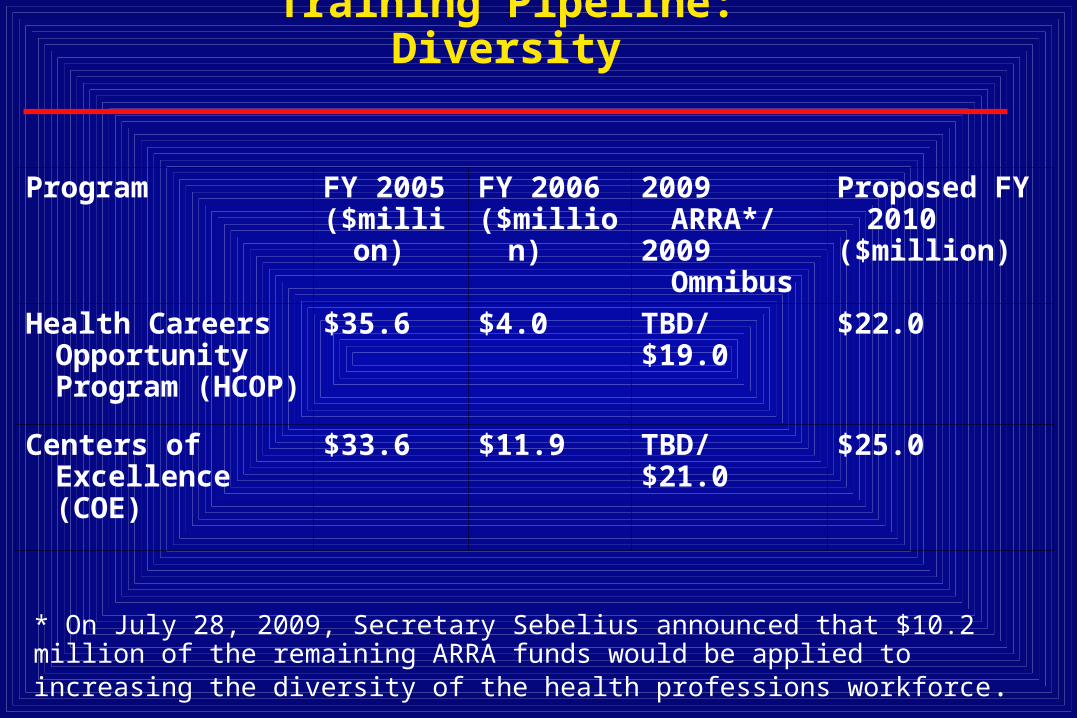
Training Pipeline: Diversity
Program FY 2005 ($million)
FY 2006($million)
2009 ARRA*/
2009 Omnibus
Proposed FY 2010
($million)
Health Careers Opportunity Program (HCOP)
$35.6 $4.0 TBD/$19.0
$22.0
Centers of Excellence (COE)
$33.6 $11.9 TBD/$21.0
$25.0
* On July 28, 2009, Secretary Sebelius announced that $10.2 million of the remaining ARRA funds would be applied to increasing the diversity of the health professions workforce.

Training Pipeline: Residency Education
GME Medicare Payment Advisory Commission Report to Congress, 2008:
• Medicare GME “payments are provided to hospitals without accountability for how they are used or without targeting policy objectives consistent with what Medicare’s goals are”
• “policy makers should also consider ways to use some of the Medicare subsidies for teaching hospitals to promote primary care. Such efforts in medical training and practice may improve our future supply of primary care clinicians and thus increase beneficiary access to them.”
• “medical education subsidies could also be used to help pay student loans for clinicians committed to primary care specialties.”

Training Pipeline:Recommendations of
COGME 19th Report to Congress: Enhancing Flexibility in Graduate Medical
Education (2007)
Align GME with future needs
Broaden the definition of “training venue”
Remove regulatory barriers limiting flexible GME training programs and venues
Make accountability for the public’s health the driving force for GME

Training Pipeline: Initial Practice Location
• 6000 sites seeking NHSC placements in 2008:– 950 applicants for 76 NHSC scholarship awards– 2,713 applicants for 867 NHSC loan repayment awards .
– 2009 ARRA: Initial $300 million; Obama 2010 budget: $169 million.
– On July 28, 2009, Secretary Sebelius announced that of the $200 million remaining in ARRA, $80.2 million would be applied for scholarships, loans, and loan repayment awards to students, health professionals, and faculty. Of those funds, $39 million would be targeted to nurses and nurse faculty, $40 million to disadvantaged students in a wide range of health professions, and $1.2 million to health professions faculty from disadvantaged backgrounds.
Source: Office of NHSC Director.

Post Training: Practice support
Health Information Technology
• Invest in hardware & software in ambulatory care settings and hospitals.
• Support Interoperability
• Make sure new computers with EMRs are actually used.

Post Training: Practice support
Networks/Care Coordination
• Emergency Care
• Specialist Care
• “Lifestyle” support: e.g., after hours call coverage, shared practice arrangements, etc.

Post Training: Practice support
Patient-Centered Medical Home
E.g., Medicare Care Coordination Payment
– MedPAC June 2008: “Medical home initiatives encourage improved care coordination and have the potential to add value to the Medicare program through efficiency and quality gains.”
– MedPAC recommendation: scale up “demonstration” to larger “pilot”program.

Part 3Conclusions and Audience Discussion
• Nursing, oral health care, general surgery, primary care and other professions (lacking data) are central to the rural workforce.
• The example of primary care training was used to illustrate how local, state and federal policies could be crafted to support provider payment, the training pipeline, and the practice environment in rural locations.
• Now, let’s hear from you: how we can ensure a bright future for the rural health care workforce?