the sales kpi report
TRANSCRIPT

THE SALES KPI REPORT
Motivate what matters. leveleleven.com

WWW.LEVELELEVEN.COM P: 248.662.2000 1
Ever wonder if you’re managing your sales team around the behaviors that will ultimately lead to sales? Make sure your salespeople and sales managers are focused on what matters to help you grow revenue faster. We analyzed the use of 1,500+ sales activities that are being used across 109 sales teams, each of which is growing faster with LevelEleven’s Sales Activity Management Platform.
What you’ll find in this report:
1. Most common behaviors across all types of sales roles
2. Most common behaviors by selling role, including: a) Sales Development b) Salespeople c) Account Managers
3. Most common behaviors by industry, including: a) Technology b) Ad/Marketing Tech c) Finance d) Manufacturing e) Media & Publishing f) Telecom g) Professional Services
4. Most common timeframes used when setting activity goals, including by: a) Day b) Week c) Month d) Quarter
About LevelEleven
LevelEleven helps companies increase the capacity of their sales teams by creating real-time visibility into day-to-day performance, predicting when performance is out of line and telling salespeople and sales leaders what to do about it. Founded in October 2012, LevelEleven has secured 200+ customers including Comcast, Dun & Bradstreet, Symantec and Ford.
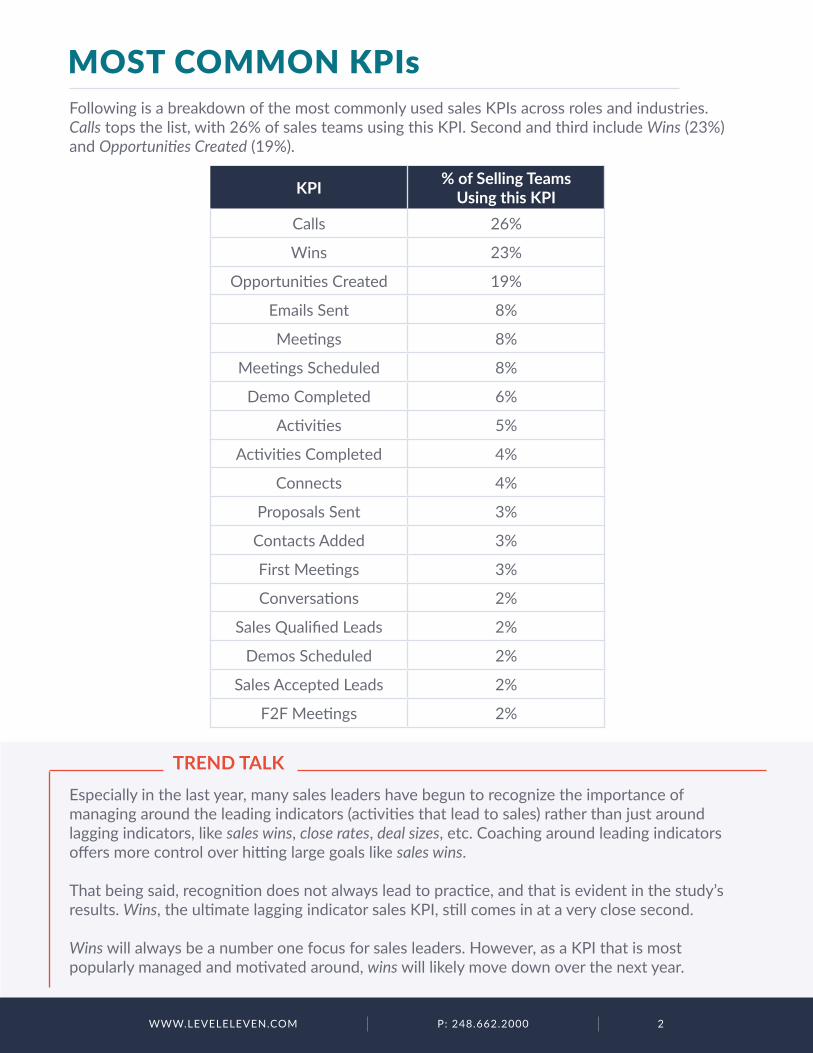
Following is a breakdown of the most commonly used sales KPIs across roles and industries.Calls tops the list, with 26% of sales teams using this KPI. Second and third include Wins (23%) and Opportunities Created (19%).
MOST COMMON KPIs
TREND TALKEspecially in the last year, many sales leaders have begun to recognize the importance of managing around the leading indicators (activities that lead to sales) rather than just around lagging indicators, like sales wins, close rates, deal sizes, etc. Coaching around leading indicators offers more control over hitting large goals like sales wins.
That being said, recognition does not always lead to practice, and that is evident in the study’s results. Wins, the ultimate lagging indicator sales KPI, still comes in at a very close second.
Wins will always be a number one focus for sales leaders. However, as a KPI that is most popularly managed and motivated around, wins will likely move down over the next year.
KPI % of Selling Teams Using this KPI
Calls 26%
Wins 23%
Opportunities Created 19%
Emails Sent 8%
Meetings 8%
Meetings Scheduled 8%
Demo Completed 6%
Activities 5%
Activities Completed 4%
Connects 4%
Proposals Sent 3%
Contacts Added 3%
First Meetings 3%
Conversations 2%
Sales Qualified Leads 2%
Demos Scheduled 2%
Sales Accepted Leads 2%
F2F Meetings 2%
WWW.LEVELELEVEN.COM P: 248.662.2000 2

WWW.LEVELELEVEN.COM P: 248.662.2000 3
In order for a metrics-driven sales team to work, its KPIs must be specific to the sales process they are set to measure. While this may sound obvious, all too often, sales leaders rely on by-the-book KPIs to manage a unique sales process.
Phil Brabbs, Managing Director of Torrent Consulting, says it best: “Books and websites by experts are a great way to gather information and learn about metrics that could be relevant to your business. The problem arises when people start taking these metrics at face value.”
The sales teams that implemented the KPIs below understand this. Although the KPIs do not comprise our list of Most Popular, they earned a mention because of their uniqueness.
OTHER INTERESTING KPIs
New Logo Pipeline in Contract
AdvancingOpportunities
AssessmentCompleted
ClearslidePitch
4+ MinuteConversations
Consultations
Head of SalesConnect
MarketingLeads Created
Pipeline vs.Future Quarter
QuotaPulsecheck

Of course, just as KPIs must fit your sales process, they also must fit the role of the person whose activity is being measured. Following are the most common KPIs by selling role, including those for: Account Management, Sales and Sales Development.
Calls is listed in the top three for each. Then Wins and Opportunities Created fill out the top three spots for Sales; Opportunities Created and Meetings fill out the top three for Account Management; and Meetings Scheduled and Emails Sent fill out the top three for Sales Development.
TREND TALKAnother trend over the past year has been the awareness of vanity metrics. Sales leaders are adding more criteria to the KPIs being motivated, to ensure activity is not just managed for quantity, but quality.
While quality metrics do appear on these KPI lists, they are not as prevalent as overall activity metrics. For example, Calls appears at #1 for Sales Development and #2 for Account Management and Sales; yet Talk Time appears near the bottom of the list for Sales, as a unique mention for Sales Development and nowhere on the list for Account Management.
The same scenario can be seen with conversations occurring for a certain amount of minutes versus just tracking calls, as well as Senior Buyer Connect versus just tracking connections through email, phone, etc. With time, we expect the number of quality, filtered metrics to become more prevalent.
KPIs BY SELLING ROLE
Hubspot’s Director of Global Business Development Justin Hiatt is very cautious of vanity metrics that do not lead to revenue.
These differ by team, of course, but one example for Justin is dials. “…I ultimately feel that picking up the phone and dialing it does not produce a result – the actual act of connecting with someone does,” he said. “Because of that I don’t measure simple calls or dials. I measure connects and interactions with our prospects.”
Using a strong KPI framework that includes this approach and is supported by the LevelEleven platform, Justin has increased overall sales productivity by 26%.
WWW.LEVELELEVEN.COM P: 248.662.2000 4
read more here
Justin Hiatt
Director of Global Business Development

WWW.LEVELELEVEN.COM P: 248.662.2000 5
SALES
KPI % of Sales Teams Using this KPI Other Mentionable KPI’s
Wins 29% 3+ Minute Conversations
Calls 22% Apps Submitted
Opportunities Created 20% Bringing opp to 90%
Meetings 9% Clearslide Pitch
Demo Completed 6% Closing Calls
Activities Completed 5% Forecast vs. Bookings
Proposals Sent 4% Senior Buyer Connect
Meetings Scheduled 4%
Emails Sent 4%
Outbound Activity 3%
First Meetings 2%
Face to Face Meetings 2%
Contacts Added 2%
Talk Time 2%
Events 2%
New Biz Opps 2%
SALES DEVELOPMENT
KPI % of Sales Teams Using this KPI Mentionable KPIs
Calls 29% Demos Scheduled
Meetings Scheduled 13% Talk Time
Emails Sent 12% Upgrade Opps Created
Opportunities Created 9% Assessment Scheduled
Activities 9% 4+ Minute Conversations
Connects 9% Webinars
Wins 7%
Demo Completed 7%
Meetings 5%
SQLs 5%
Contacts Added 4%
Conversations 4%
Dials 4%

Once fast-growing SaaS company Procore got its sales development team more focused on the KPIs that matter, it increased SDR-originated revenue from 5% to 60% of total
company revenue.
ACCOUNT MANAGEMENT
KPI % of Account Management Teams Using this KPI Other Mentionable KPI’s
Opportunities Created 15% Leads Created
Calls 12% Add-Ons
Meetings 9% Scheduled Service Session
Wins 6%
Emails Sent 6%
CSM Leads Generated 3%
Initiatives Completed 3%
New Contacts Added 3%
Milestones Completed 3%
WWW.LEVELELEVEN.COM P: 248.662.2000 6
“When designing KPIs, you really want to make sure you’re gearing them specifically to your vertical
and the function you’re focused on.”Dan Miller-Smith
Director of Sales Development

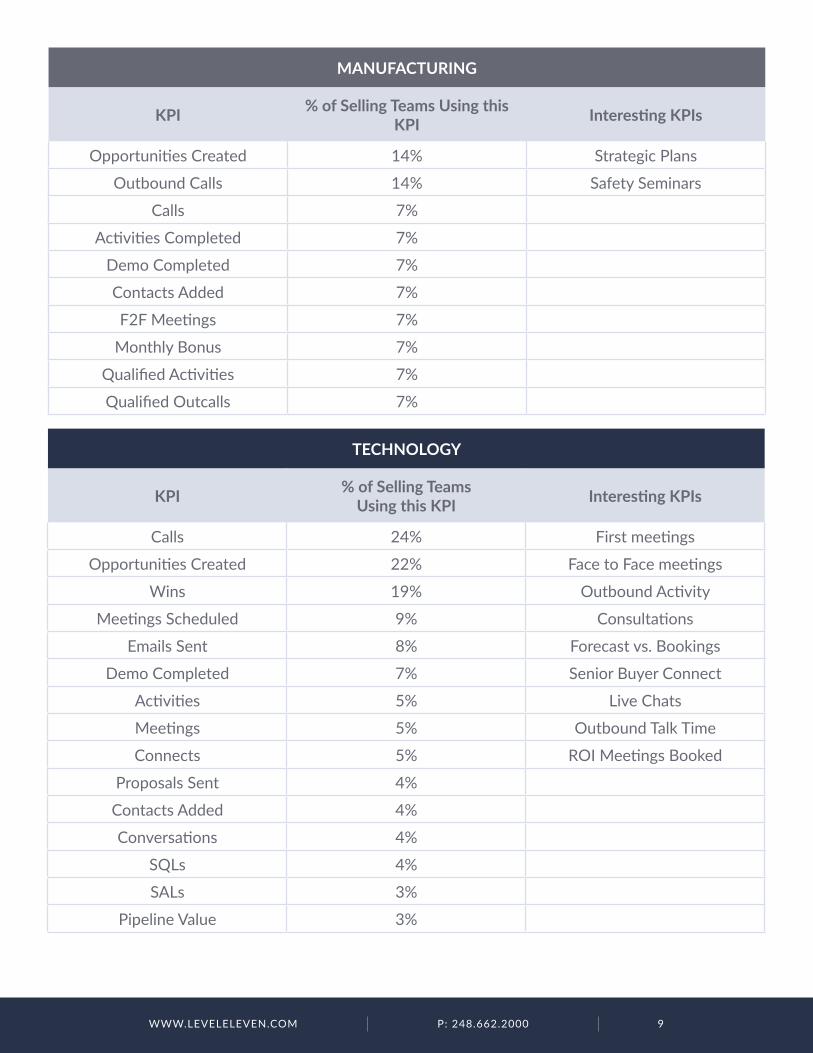
Following are the most common KPIs, as well as Interesting KPIs by industry, including those for:
• Ad/Marketing Tech • Finance• Manufacturing• Media & Publishing
Calls made the top three across all industries, and Wins made the top three for every industry studied except for Manufacturing.
As could be expected, Interesting KPIs get more unique when broken down by industry. For example, in Ad/Marketing we saw metrics around Media Plans Completed and Market Reports and in Finance, Financials Received and Distinct Loans.
KPIs BY INDUSTRY
Safety Events Completed
WWW.LEVELELEVEN.COM P: 248.662.2000 7
265Target
375Stretch Goal
557Actual
Number of Safety Seminar Attendees
9,000Target
12,500Stretch Goal
18,360Actual
• Professional Services• Technology• Telecom
What Happens When You Manage Your Team Around Industry-Specific KPIs?
A unique industry-specific KPI we saw was Safety Seminars for Manufacturing. When Stanley Black and Decker ran a campaign around safety KPIs using LevelEleven, they exceeded every goal.

WWW.LEVELELEVEN.COM P: 248.662.2000 8
AD / MARKETING TECH
KPI % of Selling Teams Using this KPI Interesting KPIs
Wins 29% Face-to-Face Meetings
Calls 12% Talk Time
Opportunities Created 10% Assessment Completed
Emails Sent 10% Bringing Opp to 90%
Meetings 10% Media Plans Completed
Meetings Scheduled 8% Market Reports
Connects 6% RFPs Requested
Activities 4%
Activities Completed 4%
Proposals Sent 4%
Demos Scheduled 4%
Dials 4%
Contract Executed 4%
FINANCE
KPI % of Selling Teams Using this KPI Interesting KPIs
Calls 13% Talk Time
Wins 7% Quotes
Opportunities Created 4% 3+ Minute Convos
Activities Completed 4% Apps Submitted
Meetings 4% Distinct Loans
First Meetings 4% Final Sign-Off
Credit Pull 4% Financials Received
Folders Completed
Transfers
WWW.LEVELELEVEN.COM P: 248.662.2000 9
MANUFACTURING
KPI % of Selling Teams Using this KPI Interesting KPIs
Opportunities Created 14% Strategic Plans
Outbound Calls 14% Safety Seminars
Calls 7%
Activities Completed 7%
Demo Completed 7%
Contacts Added 7%
F2F Meetings 7%
Monthly Bonus 7%
Qualified Activities 7%
Qualified Outcalls 7%
TECHNOLOGY
KPI % of Selling Teams Using this KPI Interesting KPIs
Calls 24% First meetings
Opportunities Created 22% Face to Face meetings
Wins 19% Outbound Activity
Meetings Scheduled 9% Consultations
Emails Sent 8% Forecast vs. Bookings
Demo Completed 7% Senior Buyer Connect
Activities 5% Live Chats
Meetings 5% Outbound Talk Time
Connects 5% ROI Meetings Booked
Proposals Sent 4%
Contacts Added 4%
Conversations 4%
SQLs 4%
SALs 3%
Pipeline Value 3%

WWW.LEVELELEVEN.COM P: 248.662.2000 10
PROFESSIONAL SERVICES
KPI % of Selling Teams Using this KPI Interesting KPIs
Calls 32% C-Level Proposal / Board Mtg
Wins 8% Placements
Opportunities Created 8% Map Discovery Meeting
Activities 8% Milestones Completed
Meetings 8%
Meetings Scheduled 4%
Demo Completed 4%
F2F Meetings 4%
First Meetings 4%
Leads Converted 4%
Leads Created 4%
New Biz Opps 4%
Contract Sent 4%
MEDIA & PUBLISHING
KPI % of Selling Teams Using this KPI Interesting KPIs
Calls 40% ClearSlide Pitch
Wins 13% Live Pitch
Opportunities Created 7% Correct Contact
Meetings Scheduled 7%
Events 7%
Activities 7%
Proposals Sent 7%
Revenue 7%
Discovery, Demo, Proposal 7%
Sales Support Metric 7%
Stage Change 7%

WWW.LEVELELEVEN.COM P: 248.662.2000 11
TELECOM
KPI % of Selling Teams Using this KPI Interesting KPIs
Opportunities Created 24% Talk Time
Wins 24% Engaged Accounts
Calls 10% Pulsecheck
Demo Completed 10% Bundle Sales
Meetings 10%
Activities Completed 10%
Outbound Activity 10%
Emails Sent 5%
First Meetings 5%
Demo Scheduled 5%
Bookings 5%
When Dun & Bradstreet made their key sales metrics visible to their entire team, they increased new business pipeline by 60%.
READ MORE HERE
Want some moreKPI content? GET IT HERE
WWW.LEVELELEVEN.COM P: 248.662.2000 12
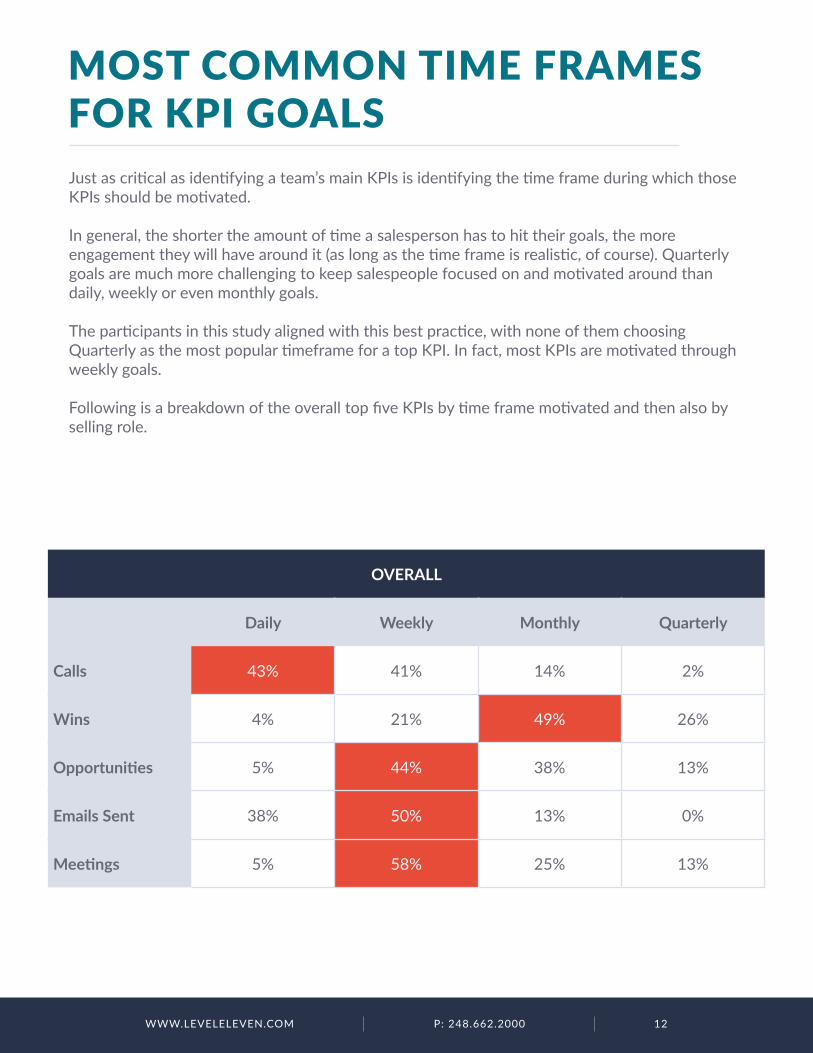
OVERALL
Daily Weekly Monthly Quarterly
Calls 43% 41% 14% 2%
Wins 4% 21% 49% 26%
Opportunities 5% 44% 38% 13%
Emails Sent 38% 50% 13% 0%
Meetings 5% 58% 25% 13%
MOST COMMON TIME FRAMES FOR KPI GOALSJust as critical as identifying a team’s main KPIs is identifying the time frame during which those KPIs should be motivated.
In general, the shorter the amount of time a salesperson has to hit their goals, the more engagement they will have around it (as long as the time frame is realistic, of course). Quarterly goals are much more challenging to keep salespeople focused on and motivated around than daily, weekly or even monthly goals.
The participants in this study aligned with this best practice, with none of them choosing Quarterly as the most popular timeframe for a top KPI. In fact, most KPIs are motivated through weekly goals.
Following is a breakdown of the overall top five KPIs by time frame motivated and then also by selling role.

WWW.LEVELELEVEN.COM P: 248.662.2000 13
ACCOUNT MANAGEMENT
Daily Weekly Monthly Quarterly
Calls 0% 40% 60% 0%
Wins 75% 0% 25% 0%
Opportunities 0% 100% 0% 0%
Emails Sent 0% 0% 100% 0%
Meetings 50% 50% 0% 0%
SALES DEVELOPMENT
Daily Weekly Monthly Quarterly
Wins 55% 41% 5% 0%
Calls 10% 60% 30% 0%
Opportunities Created 56% 44% 0% 0%
Meetings 0% 71% 29% 0%
DemoCompleted 43% 29% 29% 0%
SALES
Daily Weekly Monthly Quarterly
Wins 5% 24% 44% 27%
Calls 30% 47% 20% 3%
Opportunities Created 7% 37% 37% 19%
Meetings 0% 50% 22% 28%
DemoCompleted 13% 63% 25% 0%

WWW.LEVELELEVEN.COM P: 248.662.2000 14
“LevelEleven has helped our sales organization run more efficiently as we continually strive to achieve higher ROI per seller. We’re using LevelEleven: to keep our salespeople focused on engaging with our customers, add more discipline to our sales process and enable our sales managers to coach sellers to success. Every company wants to sell more, but LevelEleven helps our team stay focused on the behaviors and activities that drive results.”
Ready to step up your Sales Activity Strategy? With LevelEleven...
Increased year-over-year new business pipeline by 400%
Saw $5.8 Million in Additional Revenue
in 60 Days
Scheduled 127% More Appointments
Per Day
Got 60% More Deals Closed in 3 Weeks
Special Offer for Readers of this Study
Already know what your team’s critical KPIs are and ready to talk about managing and
motivating them? Request a demo.
Free KPI Discovery CallTalk to one of our sales performance experts for a free 1-hour session on identifying your team’s main KPIs. Just click here, and write
“Free KPI Discovery” in the comments.
Randy Wootton
CEO
Janet Jansen
Director of High Velocity Sales
“If you look at my CRM dashboard, there’s probably 20 different metrics on the dashboard that I use for just one team in particular. I used to look at my dashboard 10 times a day. Now, I just go to my [LevelEleven] homepage and flip through the Scorecard. As a sales leader, it is amazing to me how now I rely on that quick little snapshot of key metrics. With LevelEleven, the ease at which I can get my fingers and eyes on that critical information is just astounding to me. When I look at Scorecard, it allows me to course-correct in real time -- a very quick action that I can’t do when I’m looking at everything on a dashboard. “