the sat and sat subject tests: discrepant scores and incremental
TRANSCRIPT
ReseaRch RepoRt 2012-2
The SAT® and SAT Subject Tests™: Discrepant Scores and Incremental ValidityBy Jennifer L. Kobrin and Brian F. Patterson
VALIDITY
VALIDITYFor more information on College Board research and data, visit www.collegeboard.org/research.
Jennifer L. Kobrin is a research scientist at the College Board.
Brian F. Patterson is an assistant research scientist at the College Board.
AcknowledgmentsThe authors would like to thank Suzanne Lane and Paul Sackett for their helpful suggestions on earlier versions of this report.
Mission StatementThe College Board’s mission is to connect students to college success and opportunity. We are a not-for-profit membership organization committed to excellence and equity in education.
About the College BoardThe College Board is a mission-driven not-for-profit organization that connects students to college success and opportunity. Founded in 1900, the College Board was created to expand access to higher education. Today, the membership association is made up of more than 5,900 of the world’s leading educational institutions and is dedicated to promoting excellence and equity in education. Each year, the College Board helps more than seven million students prepare for a successful transition to college through programs and services in college readiness and college success — including the SAT® and the Advanced Placement Program®. The organization also serves the education community through research and advocacy on behalf of students, educators and schools.
For further information, visit www.collegeboard.org.
© 2012 The College Board. College Board, Advanced Placement Program, AP, SAT and the acorn logo are registered trademarks of the College Board. SAT Reasoning Test and SAT Subject Tests are trademarks owned by the College Board. PSAT/NMSQT is a registered trademark of the College Board and National Merit Scholarship Corporation. All other products and services may be trademarks of their respective owners. Visit the College Board on the Web: www.collegeboard.org.
For more information on College Board research and data, visit www.collegeboard.org/research.
ContentsExecutive Summary ................................................................................................ 1
Introduction ............................................................................................................. 2
Purpose of the Study ............................................................................................... 4
Method ..................................................................................................................... 5
Data Sources .................................................................................................... 5
Analyses ........................................................................................................... 6
Results ...................................................................................................................... 8
Gender Comparisons .................................................................................... 12
Racial/Ethnic and Best Language Group Comparisons ............................ 13
Impact of Length of Time Between Tests and Order of Testing on the SAT®–Subject Test Discrepancies ........................................................ 17
Association of Academic Behaviors with Size of the Discrepancy .......... 18
Prediction of FYGPA for Students with and Without Discrepant Scores .......................................................................................... 21
Discussion .............................................................................................................. 25
Summary and Conclusions ................................................................................... 27
References .............................................................................................................. 29
Appendix A ............................................................................................................ 30
Tables
Table 1. Correlations of SAT and SAT Subject Test Scores for the 2006 College-Bound Seniors Cohort ..................................................................................................................................9
Table 2. Percentages of Students in the Study Taking SAT and Subject Tests Within Gender, Race/Ethnicity, and Best Language Subgroups .......................................................... 10
Table 3. Mean Scores for SAT Subject Tests for the Study Sample and 2006 College-Bound Seniors Cohort ............................................................................................................................... 11
Table 4. Percentages of SAT and Subject Test Discrepancies for the Total Group ................. 12
Table 5. Percentages of SAT and Subject Test Discrepancies by Gender ............................... 13
Table 6a. SAT and Subject Test Discrepancies by Racial/Ethnic Group: Number Taking Both Tests .......................................................................................................................... 14
Table 6b. Percentages of Students by Racial/Ethnic Group with Higher Subject Test (SAT) Scores by at Least 100 Points ............................................................................................ 15
Table 7. Percentages of Students by Best Language with Higher Subject Test (SAT) Scores by at Least 100 Points ............................................................................................ 16
Table 8. SAT and Subject Test Discrepancies by Order of Testing .......................................... 17
Table 9a. Mean Discrepancy Scores by Self-Reported Ability in Writing and Mathematics .... 19
Table 9b. Mean Discrepancy Scores by Self-Reported Average Grades .................................. 20
Table 9c. Mean Mathematics Discrepancy Scores by Self-Reported Course Taking ............. 20
Table 10. Means (Standard Deviations) for SAT Scores, Subject Test Scores, HSGPA, and FYGPA by Discrepancy Groups............................................................................................ 22
Table 11a. Increment in First-Year GPA Model R-Square Accounted for by SAT or Subject Test ................................................................................................................................... 23
Table 11b. Increment in First-Year GPA Model R-Square Accounted for by SAT Average or Subject Test Average ................................................................................................................ 23
Table 12a. Mean (SD) First-Year GPA Model Residuals for SAT and Subject Test Scores by Discrepancy Group .................................................................................................................. 24
Table 12b. Mean (SD) First-Year GPA Model Residuals for SAT Average and Subject Test Average by Discrepancy Group ........................................................................................... 24
Table A1. Estimates of Standard Error of Difference (SED) and Effective Significance Levels (Eff.-α) ................................................................................................................................. 31

1College Board Research Reports
Discrepant SAT/Subject Test Scores
Executive Summary This study examines student performance on the SAT® and SAT Subject Tests™ in order to identify groups of students who score differently on these two tests, and to determine whether certain demographic groups score higher on one test compared to the other. Discrepancy scores were created to capture individuals’ performance differences on the critical reading, mathematics, and writing sections of the SAT and selected Subject Tests that were deemed the most comparable (such as the SAT critical reading section and the Subject Test in Literature; the SAT mathematics section and the Mathematics Level 1 and Mathematics Level 2 Subject Tests). The percentage of students with discrepant scores was compared for each SAT–Subject Test pair, overall and by gender, racial/ethnic, and best spoken language subgroups. Next, the predictive validity of SAT and Subject Test scores for predicting first-year college/university grade point average (FYGPA) was compared for students with and without discrepant scores.
The results demonstrate that the percentage of students with discrepant SAT and Subject Test scores is small, especially for the tests that are most similar in terms of content. The validity of the SAT and SAT Subject Tests for predicting FYGPA varies according to the assessment on which a student scored higher relative to the other, and the pattern of results varies for the different SAT–Subject Test pairs. In all cases, however, SAT and Subject Test scores each have incremental predictive power over the other. This study provides evidence that each test provides distinct information that may be useful in the college admission process. As such, joint consideration of these two test scores in college admission is warranted.
2 College Board Research Reports
Discrepant SAT/Subject Test Scores
IntroductionThe SAT and SAT Subject Tests1 are both important and useful assessments in college admission. The SAT measures the critical reading, mathematics, and writing skills that students have developed over time and that they need to be successful in college. Students take the SAT Subject Tests to demonstrate to colleges their mastery of specific subjects. The College Board’s SAT Program offers 20 Subject Tests in five general subject areas: English, history, mathematics, science, and languages. The content of each Subject Test is not based on any single approach or curriculum but rather evolves to reflect current trends in high school course work.
SAT Subject Tests are taken by a smaller and more select population of students compared to those who take the SAT. Among the high school seniors who graduated in 2008, more than a million and a half students took the SAT, whereas slightly fewer than 300,000 took at least one SAT Subject Test and 275,714 students took the SAT and at least one Subject Test. The mean SAT scores for students taking both tests were 590 in critical reading, 618 in mathematics, and 593 in writing, which are considerably higher than the mean scores for the full SAT cohort (which scored 502, 515, and 494, respectively). Of those taking at least one Subject Test (without necessarily taking the SAT), 8% of students take one Subject Test, 41% take two, another 41% take three, and 11% take four or more Subject Tests. Among the SAT takers who graduated in 2008, the Subject Tests with the highest volume were Mathematics Level 2 (150,352 test-takers), U.S. History (123,475), Literature (119,180), and Mathematics Level 1 (91,225). The volumes for the other Subject Tests among the students graduating in 2008 ranged from 505 (Modern Hebrew) to 62,263 (Chemistry) test-takers (College Board, 2008).
The SAT tests students’ knowledge of reading, writing, and mathematics, as well as their ability to apply that knowledge. It is a broad survey of the critical and quantitative thinking skills students need to be successful in college, regardless of the specific subject areas on which that student may decide to focus. The Subject Tests are high school–level, content-based tests that allow students to showcase achievement and demonstrate interest in specific subject areas, including some that are not assessed on the SAT, such as science, history, and languages.
There are conflicting messages in the media, in the body of existing psychometric research, and among educators regarding the relative merit of the SAT and the Subject Tests. Over the past several years, a host of prominent educators and researchers, including Howard Gardner, Michael Kirst, and former University of California (UC) President Richard Atkinson, have voiced
1. The SAT Subject Tests were formerly called SAT II tests, and before that, SAT Achievement Tests. The SAT was previously referred to as the SAT Reasoning Test™ and prior to that, the SAT I. Despite the changes in the names of the tests, the knowledge and skills assessed did not substantially change (other than the addition of a writing test to the SAT). In this report, when prior research on the SAT and Subject Tests is discussed or cited, the test name is that used at the time the studies were conducted.
There are conflicting
messages in the
media, in the body of
existing psychometric
research, and among
educators regarding
the relative merit
of the SAT and the
Subject Tests.
3College Board Research Reports
Discrepant SAT/Subject Test Scores
their preference for college admission tests to be more closely tied to high school and college preparatory curricula (Zwick, 2002). Some have voiced their belief that the Subject Tests may identify bright students who have not yet mastered the English language (see Tran, 2008). Harvard University’s dean of admissions has said that Subject Tests are “better predictors than either high school grades or the SAT” (Mattimore, 2008).
On the other hand, the University of California recently approved a policy eliminating SAT Subject Tests from admission requirements, although individual colleges and departments still have the option to recommend submission of specific SAT Subject Test scores. In making their argument for eliminating the Subject Test requirement, the university’s Board of Admissions and Relations with Schools (BOARS) cited research showing that after accounting for high school grade point average (HSGPA) and SAT scores, Subject Test scores contributed very little to the accuracy of predictions of initial success at the UC. Their research showed that introducing SAT Subject Tests into a regression model that already included the SAT increased the percent of variance of FYGPA explained by only 0.2% to 0.5%, depending on the other variables included in the model (Agronow & Rashid, 2007). These analyses did not consider the fact that because the SAT and SAT Subject Tests are highly correlated, a regression model that includes both measures introduces multicollinearity into the model. In these situations, multicollinearity can lead to inflated regression parameter standard errors and erratic changes in the signs and magnitudes of the parameters themselves, given different orders of entry of predictors into the model. As a result, studies such as those conducted by UC researchers that compare the regression coefficients of highly correlated predictors may result in incorrect conclusions.
BOARS also claimed that eliminating the Subject Test requirement would broaden the pool and increase the quality of students who are visible to the university’s admissions processes. This research conflicts with earlier findings by UC researchers showing SAT II scores as the single best predictor of FYGPA for students entering the UC from fall 1996 to fall 1999, and showing that SAT I scores added little to the prediction once SAT II scores and HSGPA had already been considered (Geiser & Studley, 2001; 2004).
Shortly after the Geiser and Studley (2001) study was released, Kobrin, Camara, and Milewski (2002) examined the relative utility and predictive validity of the SAT I and SAT II for various subgroups in both California and the nation. Analyzing data from the 2000 College-Bound Seniors cohort, they found that if the SAT II (writing2, either level of Mathematics, and a third test of each student’s choice) was to be used without the SAT I, the impact (i.e., the difference between the mean SAT II score for white students and the mean score for each minority group) would be slightly reduced for African American, Hispanic, and Asian American students in this sample, with the greatest reduction being for Hispanic students. The absolute score differences in composite means between the SAT I and SAT II were quite small for all groups. On average, white and African American students scored slightly higher on the SAT I than on the SAT II (13 and 11 points on a 200- to 800-point scale, respectively), Hispanic students scored higher on average on the three SAT II tests than on the SAT I (26 points), and there was no difference among Asian American students’ SAT I and II scores. Whites, African Americans, and English speakers with differences in test performance were more likely to score higher on the SAT I than on the SAT II tests (writing, mathematics, and any third test), whereas Asian Americans, Hispanics, and non–English speakers with differences in test performance generally scored higher on the SAT II tests.
2. The SAT II Writing Test was the predecessor to the SAT Writing section; it is no longer in existence.
4 College Board Research Reports
Discrepant SAT/Subject Test Scores
Analyzing data from first-time students entering college in 1995 at 23 colleges and universities across the United States, Kobrin, Camara, and Milewski (2002) found that the SAT II tests had marginally greater predictive validity for predicting FYGPA than the SAT I for ethnic groups other than American Indians and African Americans. Similarly, the combination of HSGPA and three SAT II tests had slightly greater predictive validity than the combination of HSGPA and the SAT I for all ethnic groups except American Indians and African Americans, although Bridgeman, Burton, and Cline (2001) pointed out that a result such as this may be attributed to comparing three SAT II tests to two SAT I tests. In other words, more test scores are expected to predict an outcome better than fewer. The SAT I had a positive incremental validity over HSGPA and the SAT II tests for three of the six ethnic groups, and the SAT II tests added to the predictive validity of HSGPA and the SAT I for all ethnic groups. When the SAT II (writing, mathematics, and a third test) was used to predict FYGPA, Hispanic students’ GPAs were overpredicted (i.e., the regression model predicted a higher GPA on average than these students actually obtained) to a greater extent than when the SAT I was used as a predictor. The pattern of prediction remained similar for the other racial/ethnic groups whether the SAT I, the SAT II, or both were used.
In terms of the practical implications of substituting Subject Test scores with SAT scores, or vice versa, Bridgeman, Burton, and Cline (2001) simulated the effects of making college selection decisions using SAT II scores in place of SAT I scores. While success rates in terms of FYGPA were virtually identical whether SAT I or SAT II scores were used, slightly more Hispanic students were selected with the model that used SAT II scores in place of SAT I scores. Scores on the SAT and SAT Subject Tests are moderately to highly correlated, so for most students the same decisions would be made using either test.
Purpose of the StudyGiven the current debate on the relative merits of the SAT and SAT Subject Tests, the purpose of this study is to examine student performance on the SAT and Subject Tests, to identify student groups that score differently on these two tests, and to determine whether the relationships of the two sets of tests with college grades vary for students who score higher on one test over the other. The research questions addressed in this study are as follows:
1. Of the students who take the SAT and a Subject Test of similar content, how many students score substantially higher on one test compared to the other?
2. What type of student (by gender, race/ethnicity, best language, and academic ability) is more likely to score substantially higher on the SAT compared to a Subject Test? On a Subject Test compared to the SAT?
3. Are discrepancies between the SAT and Subject Tests more pronounced when students take the tests farther apart in time?
4. Are there academic behaviors (such as high school course selection) that are associated with the size of the discrepancy?
5. Does the predictive validity of the SAT and Subject Tests for predicting FYGPA vary for students who score substantially higher on one test over the other?
Ramist, Lewis, and McCamley-Jenkins (2001) conducted similar research using data on freshmen entering 39 colleges in 1982 and 1985. They compared the performance of students who took an SAT Achievement Test (the former name for the SAT Subject Tests) with their
5College Board Research Reports
Discrepant SAT/Subject Test Scores
performance on the SAT verbal section (for Achievement Tests in English, history, and languages), the SAT mathematics section (for Achievement Tests in mathematics), or the sum of the verbal and mathematics scores on the SAT (for Achievement Tests in natural science and the average of all of a student’s Achievement Test scores). To maximize the sample size for all comparisons, scores for freshmen enrolling in 1982 and 1985 were combined. Ramist, Lewis, and McCamley-Jenkins compared the standard scores on the SAT and Achievement Tests; the standard scores were computed as the difference between the mean for a student group on the test and the mean for all students on the test, divided by the standard deviation for all students. Students who had indicated that English was not their best language stood out as achieving much higher scores on the Achievement Tests compared to the SAT, with standard score differences of 0.25 or more between the related SAT section(s) and the Spanish, French, European History, Physics, American History, and Chemistry Achievement Tests, as well as the average score on all Achievement Tests.
MethodData Sources
This study included two phases, each based on a different sample. The first phase of the study was descriptive in nature and was based on the 2006 College-Bound Seniors cohort. This group consists of the students who took the SAT and reported plans to graduate from high school in 2006. All analyses in this study were based on the students who took the SAT and at least one of the Subject Tests under study (N = 245,602): Literature, American History, World History, Mathematics Level 1, Mathematics Level 2, Chemistry, Physics, Ecological Biology, and Molecular Biology. The Subject Tests in languages were not included in this study, except in the computation of a mean Subject Test score that will be discussed later. (Approximately 25% of the students in the sample took at least one language Subject Test.) The most recent scores were used for students with multiple testing results. The SAT is composed of three sections: critical reading (SAT-CR), mathematics (SAT-M), and writing (SAT-W). The score scale range for each section is 200 to 800; each Subject Test also has a score scale range of 200 to 800. The scaling of the Subject Tests is performed in such a way as to reflect the ability of the groups taking each test.3 The result is that the scales for each of the different Subject Tests are comparable with each other as well as with each of the three sections on the SAT (for more information on the scaling of the SAT and Subject Tests, see Donlon, 1984 and Angoff, 1971). Students’ self-reported gender, race/ethnicity, best language, HSGPA, average course grades, and course-taking information (e.g., the number of years of natural science taken in high school) were obtained from the SAT Questionnaire completed by students during registration for the SAT.
The second phase of the study compared the predictive validity of SAT and Subject Test scores for predicting FYGPA for students overall and with and without discrepant scores. This research was based on the data collected in the National SAT Validity Study described in Kobrin, Patterson, Shaw, Mattern, and Barbuti (2008). The data included SAT scores, students’
3. Scaling procedures for the Subject Tests were developed to adjust the scales so that they reflect the level and dispersion of ability of those taking the test. These procedures employed multiple regression techniques using SAT scores as predictors, or covariates. (Some of the language Subject Tests also included years of study as a covariate.) Test performance was estimated for a hypothetical reference population whose members never actually took all Subject Tests. This population, the 1990 reference population for recentered SAT I scales, was defined with a mean of 500 and a standard deviation of 110 (the scale used for the recentered SAT scale) on both the SAT verbal and mathematics sections. The Subject Tests were placed on the same scale by linearly transforming the estimated performance of the SAT reference group on each test to a mean of 500 and a standard deviation of 110 (R. Smith, personal communication, January 27, 2003).
6 College Board Research Reports
Discrepant SAT/Subject Test Scores
course work and grades, and FYGPA for the fall 2006 entering cohort of first-time students (N = 195,099) at 110 colleges and universities across the United States. The range of FYGPA across institutions was 0.00 to 4.27, with most institutions’ grades ranging from 0.00 to 4.00.
Analyses
Discrepancy scores were created to capture individuals’ performance differences on the relevant sections of the SAT and certain Subject Tests that were deemed the most comparable by the authors in terms of the subject matter and skills assessed. The SAT–Subject Test comparisons included the following:
•SAT critical reading section versus SAT Subject Tests in U.S. History, World History, and Literature
•SAT writing section versus SAT Subject Tests in U.S. History, World History, and Literature
•SAT mathematics section versus SAT Subject Tests in Mathematics Level 1, Mathematics Level 2, Chemistry, Physics, Ecological Biology, and Molecular Biology
•SAT (average across sections) versus SAT Subject Tests in Chemistry, Physics, Ecological Biology, and Molecular Biology4
•SAT (average across sections) versus Subject Test average (separate analyses, either including or excluding the language Subject Tests)
The SAT average was computed as the average of the SAT-CR, SAT-M, and SAT-W sections from the latest single administration. The SAT average was also compared with two Subject Test averages: The first included all Subject Tests except for the language Subject Tests, and the second included all Subject Tests that were taken. If a student took only one Subject Test, that score was compared with the SAT average. These comparisons were made to provide an overall assessment of discrepancies between students’ performance on the SAT and Subject Tests.
The Subject Tests in the natural sciences (Chemistry, Physics, Ecological Biology, and Molecular Biology) were compared to the SAT mathematics section and to the SAT average. Ramist, Lewis, and McCamley-Jenkins (2001) compared the natural science Achievement Tests to the SAT composite, arguing that the science tests required both verbal and mathematical skills. On the other hand, due to the growing interest in and emphasis on STEM (science, technology, engineering, and mathematics) education, direct comparisons between the SAT mathematics and the Subject Tests in natural sciences were also included. The Subject Tests in History, Literature, and Mathematics were not compared to the SAT average because each of these Subject Tests requires predominantly verbal or mathematical skills, but not both.
4. It is noted that, when comparing the SAT average with any single Subject Test, one may expect a larger number of discrepancies because the standard error of the Subject Test is expected to be larger than the standard error of the SAT average. In other words, because the SAT average is based on an exam approximately three times longer than the Subject Test, the Subject Test scores are likely to contain a greater amount of measurement error.
7College Board Research Reports
Discrepant SAT/Subject Test Scores
Each student’s Subject Test score was subtracted from his or her SAT score.5 The resulting discrepancy scores across all SAT–Subject Test pairs ranged from -600 to 450, and the mean discrepancy scores ranged from -11.1 (for the SAT average compared to the Subject Test average, including language tests) to 40.9 (for the SAT-M compared to the Subject Test in Physics).
The first set of analyses was based on the 2006 College-Bound Seniors cohort and included descriptive statistics on students taking each SAT–Subject Test pair. Students with scores differing by less than 100 points on the pair of tests were classified as nondiscrepant, and students scoring at least 100 points higher on one test were classified as discrepant. Three groups were formed: 1) students with no discrepancy; 2) students scoring higher on the Subject Test; and 3) students scoring higher on the SAT. The percentage of students in each group was compared for each SAT–Subject Test pair, overall, and by gender, racial/ethnic, and best language subgroups. The percentage of students in each group was also compared based on whether the SAT or Subject Test was taken first (i.e., the order of testing).
A discrepancy score of at least 100 points was used to define the discrepancy groups because this is the approximate standard deviation of scores in the College-Bound Seniors cohort for each Subject Test. Since scores on any test are not perfect indicators of students’ ability and contain some error, Appendix A shows how the standard error of the difference (SED) was used to assess to what extent scores on the SAT and Subject Test must differ in order to reflect true differences in ability. In particular, it shows the significance levels for each SAT–Subject Test comparison implicit in the use of 100 points as the criterion for identifying discrepant scores.
The second phase of research involved an investigation of the validity of SAT and Subject Test scores in predicting FYGPA for students in each of the three discrepancy groups. The remainder of this paper describes additional analyses conducted on only the three most similar SAT–Subject Test pairs. Three separate regression equations were computed: one using either the critical reading or mathematics section of the SAT to predict FYGPA, the second using Subject Test scores to predict FYGPA, and the third using both SAT and Subject Test scores to predict FYGPA. The increment in the variance of FYGPA accounted for by each test over the other, and the average residuals (residual = actual FYGPA - predicted FYGPA), were compared for the three discrepancy groups to examine the extent of differential prediction. A positive mean residual value indicates underprediction (i.e., for a particular set of predictors, the regression equation predicted a lower FYGPA than was observed), and a negative mean residual indicates overprediction (i.e., for a particular set of predictors, the regression equation predicted a higher FYGPA than was observed).
5. Previous research on discrepant SAT and Subject Test scores (Ramist, Lewis, & McCamley-Jenkins, 2001) standardized both measures and examined the difference in the standard scores as an index of discrepancy. In this study, SAT and Subject Test scores were not standardized prior to calculating the discrepancy because scores on the tests are reported on the same 200- to 800-point scale, and the pairs of tests examined in this study had similar score variances. The decision was made to use the reported scores to calculate the discrepancy rather than standard scores because the former is more intuitive and easier to interpret.
8 College Board Research Reports
Discrepant SAT/Subject Test Scores
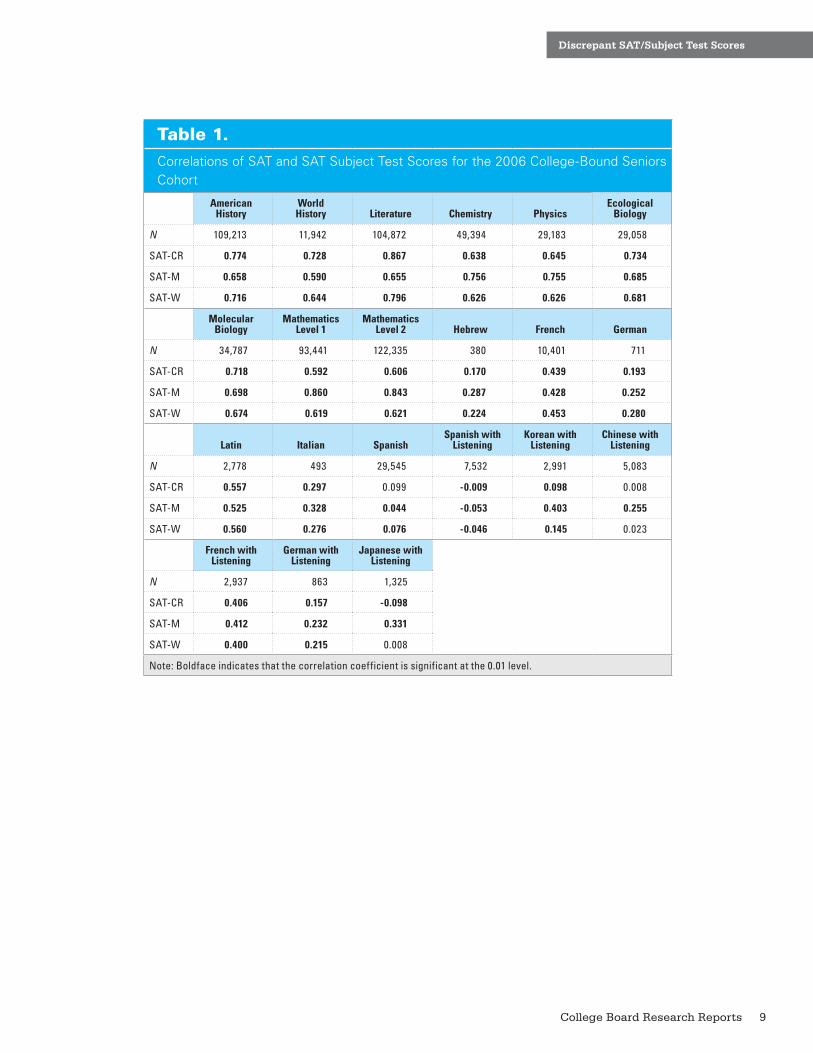
ResultsTable 1 shows the correlations of each section of the SAT with each Subject Test. As expected, scores on the SAT and Subject Tests are, in most cases, highly correlated. The highest correlations are for SAT-CR and Literature (0.87), SAT-W and Literature (0.80),
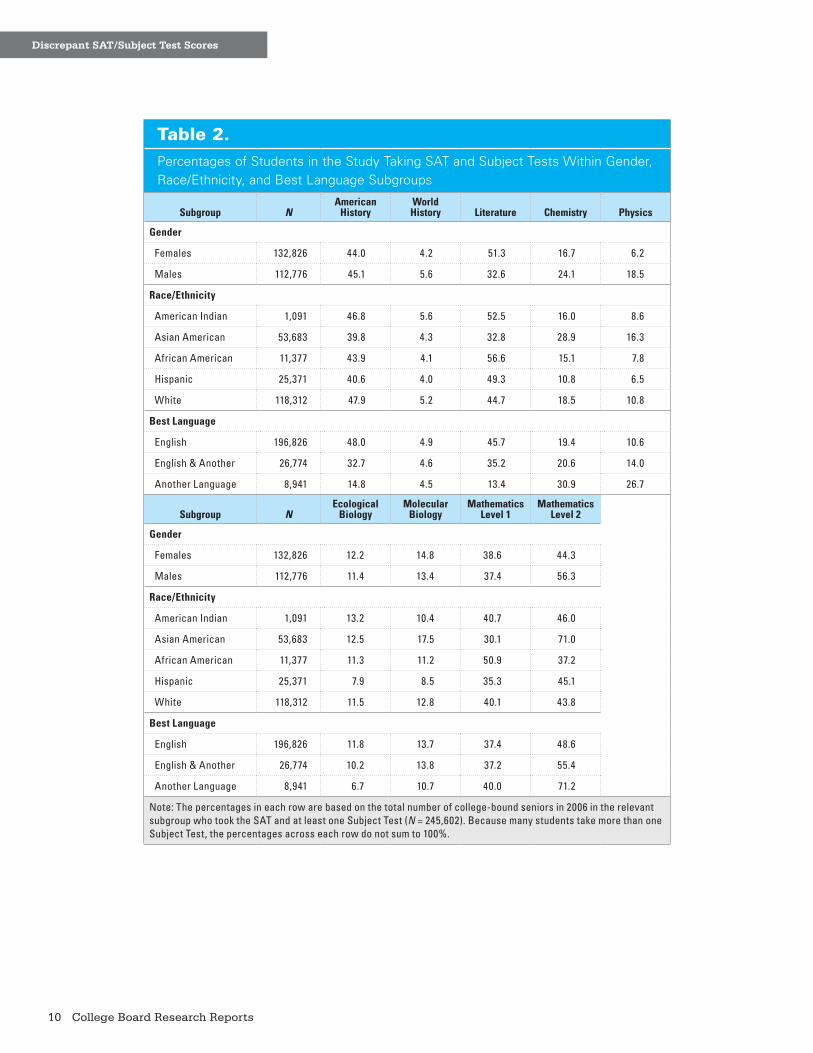
SAT-M and Mathematics Level 2 (0.84), and SAT-M and Mathematics Level 1 (0.86). Based on these correlations, we would expect the majority of students to have SAT and Subject Test scores that are not discrepant. Table 2 shows the percentage of students in this study taking the SAT and each Subject Test by gender, race/ethnicity, and best language. This table shows substantial variation in the composition of the group taking each Subject Test. For example, fewer than a third of the males in this study took the SAT and the Subject Test in Literature, compared to more than half of the females. In addition, more than 70% of Asian American students, and those reporting that their best language was not English, took the SAT and Mathematics Level 2, compared to much lower percentages among the other subgroups. The participation rates by subgroup for the different Subject Tests are important to keep in mind as the results from this study are interpreted.
The participation
rates by subgroup for
the different Subject
Tests are important to
keep in mind as the
results from this study
are interpreted.
9College Board Research Reports
Discrepant SAT/Subject Test Scores
Table 1.Correlations of SAT and SAT Subject Test Scores for the 2006 College-Bound Seniors Cohort
American History
World History Literature Chemistry Physics
Ecological Biology
N 109,213 11,942 104,872 49,394 29,183 29,058
SAT-CR 0.774 0.728 0.867 0.638 0.645 0.734
SAT-M 0.658 0.590 0.655 0.756 0.755 0.685
SAT-W 0.716 0.644 0.796 0.626 0.626 0.681
Molecular Biology
Mathematics Level 1
Mathematics Level 2 Hebrew French German
N 34,787 93,441 122,335 380 10,401 711
SAT-CR 0.718 0.592 0.606 0.170 0.439 0.193
SAT-M 0.698 0.860 0.843 0.287 0.428 0.252
SAT-W 0.674 0.619 0.621 0.224 0.453 0.280
Latin Italian SpanishSpanish with
ListeningKorean with
ListeningChinese with
Listening
N 2,778 493 29,545 7,532 2,991 5,083
SAT-CR 0.557 0.297 0.099 -0.009 0.098 0.008
SAT-M 0.525 0.328 0.044 -0.053 0.403 0.255
SAT-W 0.560 0.276 0.076 -0.046 0.145 0.023
French with Listening
German with Listening
Japanese with Listening
N 2,937 863 1,325
SAT-CR 0.406 0.157 -0.098
SAT-M 0.412 0.232 0.331
SAT-W 0.400 0.215 0.008
Note: Boldface indicates that the correlation coefficient is significant at the 0.01 level.
10 College Board Research Reports
Discrepant SAT/Subject Test Scores
Table 2.Percentages of Students in the Study Taking SAT and Subject Tests Within Gender, Race/Ethnicity, and Best Language Subgroups
Subgroup NAmerican
HistoryWorld History Literature Chemistry Physics
Gender
Females 132,826 44.0 4.2 51.3 16.7 6.2
Males 112,776 45.1 5.6 32.6 24.1 18.5
Race/Ethnicity
American Indian 1,091 46.8 5.6 52.5 16.0 8.6
Asian American 53,683 39.8 4.3 32.8 28.9 16.3
African American 11,377 43.9 4.1 56.6 15.1 7.8
Hispanic 25,371 40.6 4.0 49.3 10.8 6.5
White 118,312 47.9 5.2 44.7 18.5 10.8
Best Language
English 196,826 48.0 4.9 45.7 19.4 10.6
English & Another 26,774 32.7 4.6 35.2 20.6 14.0
Another Language 8,941 14.8 4.5 13.4 30.9 26.7
Subgroup NEcological
BiologyMolecular
BiologyMathematics
Level 1Mathematics
Level 2
Gender
Females 132,826 12.2 14.8 38.6 44.3
Males 112,776 11.4 13.4 37.4 56.3
Race/Ethnicity
American Indian 1,091 13.2 10.4 40.7 46.0
Asian American 53,683 12.5 17.5 30.1 71.0
African American 11,377 11.3 11.2 50.9 37.2
Hispanic 25,371 7.9 8.5 35.3 45.1
White 118,312 11.5 12.8 40.1 43.8
Best Language
English 196,826 11.8 13.7 37.4 48.6
English & Another 26,774 10.2 13.8 37.2 55.4
Another Language 8,941 6.7 10.7 40.0 71.2
Note: The percentages in each row are based on the total number of college-bound seniors in 2006 in the relevant subgroup who took the SAT and at least one Subject Test (N = 245,602). Because many students take more than one Subject Test, the percentages across each row do not sum to 100%.

11College Board Research Reports
Discrepant SAT/Subject Test Scores
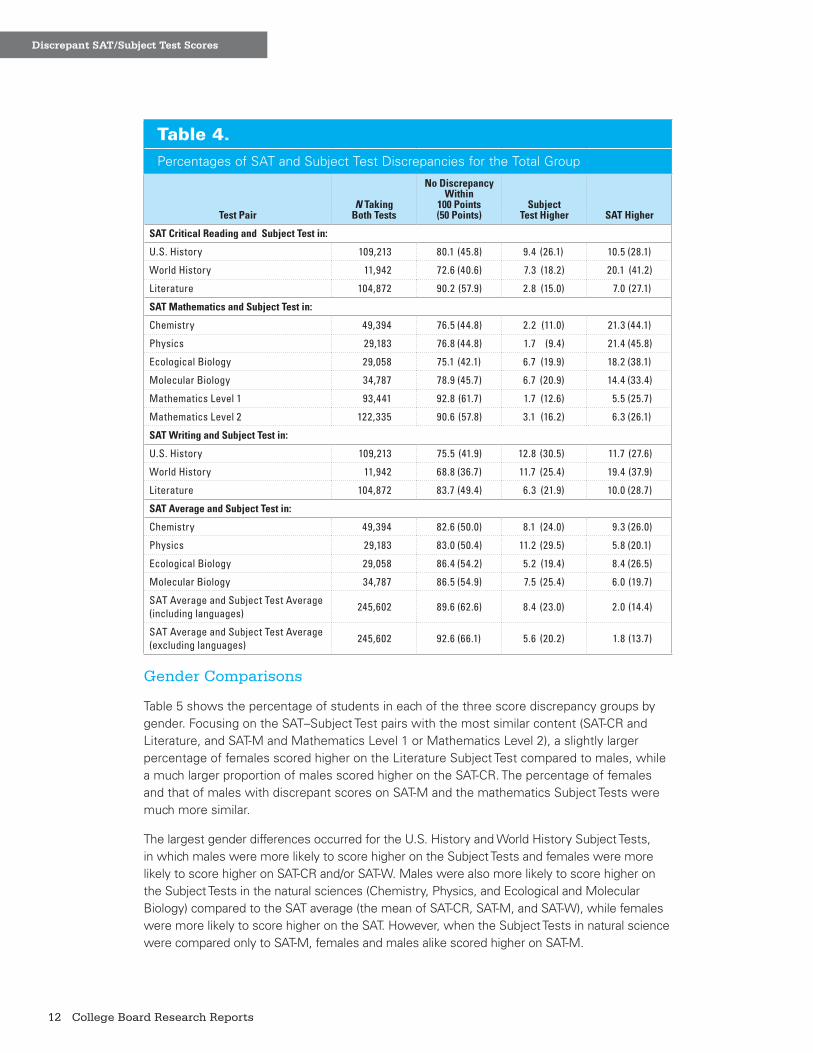
Table 3 presents the means and standard deviations of Subject Test scores for the study sample and for the 2006 College-Bound Seniors cohort. The study sample performed slightly higher on each of the Subject Tests and had slightly smaller standard deviations compared to the total population. Table 4 presents the percentage of students in each of the three score discrepancy groups for each SAT–Subject Test pair examined in this study. The percentage of students scoring within 100 points on the SAT and Subject Test ranged from 69% (for the World History and SAT-W pair) to 93% (for both the Mathematics Level 1 and SAT-M pair and for the comparison of the average SAT with the average Subject Test without language tests). In general, a larger percentage of students with discrepant scores showed higher performance on single sections of the SAT when compared with single Subject Tests, with a few exceptions. The SAT–Subject Test pairs with the smallest percentage of discrepancies were those that are most similar in content: the SAT critical reading and the Subject Test in Literature, the SAT mathematics section and the Mathematics Level 1 Subject Test, and the SAT mathematics section and the Mathematics Level 2 Subject Test. For these pairs, at least 90% of students earned similar (nondiscrepant) scores on the two tests, and for the small percentage of students with discrepancies, more than twice the number of students received higher scores on the SAT as those receiving higher scores on the Subject Test.
Table 3.Mean Scores for SAT Subject Tests for the Study Sample and 2006 College-Bound Seniors Cohort
SAT Subject Test
Study Sample 2006 CB Seniors
Mean SD Mean SD
American History 606 114 601 116
World History 590 113 585 115
Literature 588 109 583 111
Chemistry 632 108 629 110
Physics 646 104 643 107
Ecological Biology 596 101 591 104
Molecular Biology 634 100 630 103
Mathematics Level 1 600 98 593 102
Mathematics Level 2 645 103 644 105
As shown in the last two rows of Table 4, when language tests were included in computing the average Subject Test score, a larger percentage of students had a discrepancy between their average SAT score and their average Subject Test score than when language tests were not included in the Subject Test average. Interestingly, whether or not language tests were included, a larger percentage of students showed higher average Subject Test scores than those showing higher SAT scores. This result is contrary to the results for the individual SAT–Subject Test pairs, in which students with discrepant scores were usually more likely to score higher on the SAT.
12 College Board Research Reports
Discrepant SAT/Subject Test Scores
Table 4.Percentages of SAT and Subject Test Discrepancies for the Total Group
Test PairN Taking
Both Tests
No Discrepancy Within
100 Points (50 Points)
Subject Test Higher SAT Higher
SAT Critical Reading and Subject Test in:
U.S. History 109,213 80.1 (45.8) 9.4 (26.1) 10.5 (28.1)
World History 11,942 72.6 (40.6) 7.3 (18.2) 20.1 (41.2)
Literature 104,872 90.2 (57.9) 2.8 (15.0) 7.0 (27.1)
SAT Mathematics and Subject Test in:
Chemistry 49,394 76.5 (44.8) 2.2 (11.0) 21.3 (44.1)
Physics 29,183 76.8 (44.8) 1.7 (9.4) 21.4 (45.8)
Ecological Biology 29,058 75.1 (42.1) 6.7 (19.9) 18.2 (38.1)
Molecular Biology 34,787 78.9 (45.7) 6.7 (20.9) 14.4 (33.4)
Mathematics Level 1 93,441 92.8 (61.7) 1.7 (12.6) 5.5 (25.7)
Mathematics Level 2 122,335 90.6 (57.8) 3.1 (16.2) 6.3 (26.1)
SAT Writing and Subject Test in:
U.S. History 109,213 75.5 (41.9) 12.8 (30.5) 11.7 (27.6)
World History 11,942 68.8 (36.7) 11.7 (25.4) 19.4 (37.9)
Literature 104,872 83.7 (49.4) 6.3 (21.9) 10.0 (28.7)
SAT Average and Subject Test in:
Chemistry 49,394 82.6 (50.0) 8.1 (24.0) 9.3 (26.0)
Physics 29,183 83.0 (50.4) 11.2 (29.5) 5.8 (20.1)
Ecological Biology 29,058 86.4 (54.2) 5.2 (19.4) 8.4 (26.5)
Molecular Biology 34,787 86.5 (54.9) 7.5 (25.4) 6.0 (19.7)
SAT Average and Subject Test Average (including languages)
245,602 89.6 (62.6) 8.4 (23.0) 2.0 (14.4)
SAT Average and Subject Test Average (excluding languages)
245,602 92.6 (66.1) 5.6 (20.2) 1.8 (13.7)
Gender Comparisons
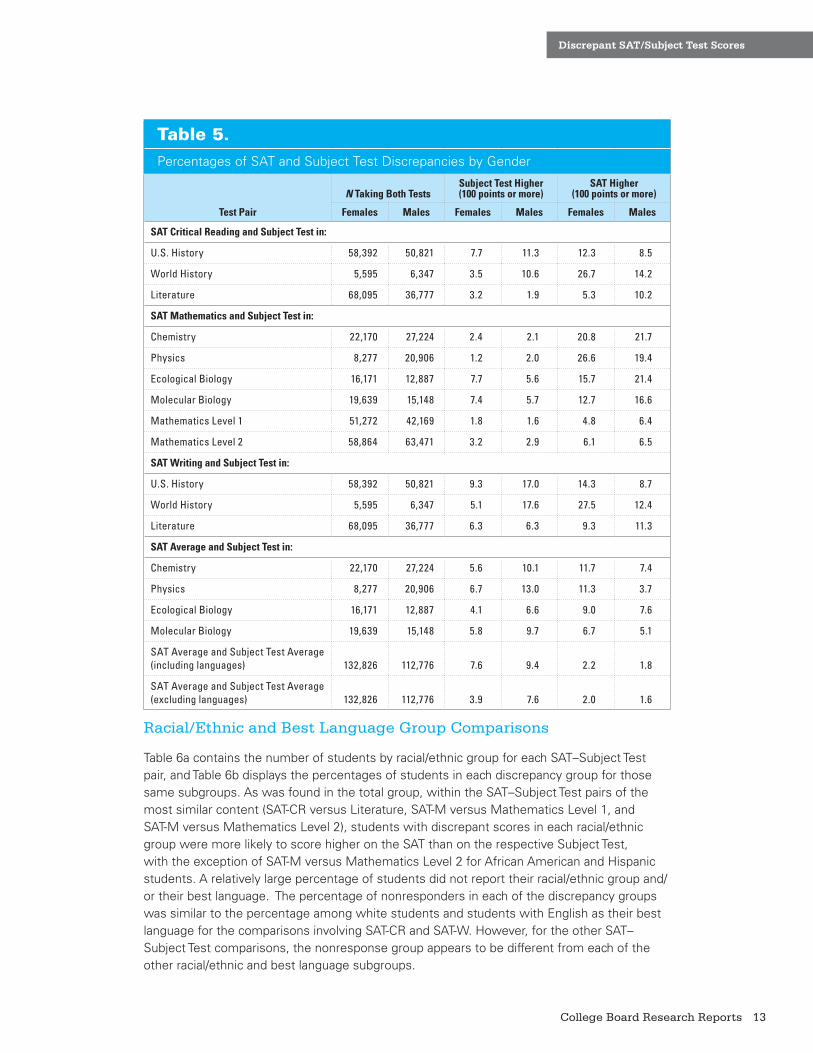
Table 5 shows the percentage of students in each of the three score discrepancy groups by gender. Focusing on the SAT–Subject Test pairs with the most similar content (SAT-CR and Literature, and SAT-M and Mathematics Level 1 or Mathematics Level 2), a slightly larger percentage of females scored higher on the Literature Subject Test compared to males, while a much larger proportion of males scored higher on the SAT-CR. The percentage of females and that of males with discrepant scores on SAT-M and the mathematics Subject Tests were much more similar.
The largest gender differences occurred for the U.S. History and World History Subject Tests, in which males were more likely to score higher on the Subject Tests and females were more likely to score higher on SAT-CR and/or SAT-W. Males were also more likely to score higher on the Subject Tests in the natural sciences (Chemistry, Physics, and Ecological and Molecular Biology) compared to the SAT average (the mean of SAT-CR, SAT-M, and SAT-W), while females were more likely to score higher on the SAT. However, when the Subject Tests in natural science were compared only to SAT-M, females and males alike scored higher on SAT-M.
13College Board Research Reports
Discrepant SAT/Subject Test Scores
Table 5.Percentages of SAT and Subject Test Discrepancies by Gender
Test Pair
N Taking Both TestsSubject Test Higher (100 points or more)
SAT Higher (100 points or more)
Females Males Females Males Females Males
SAT Critical Reading and Subject Test in:
U.S. History 58,392 50,821 7.7 11.3 12.3 8.5
World History 5,595 6,347 3.5 10.6 26.7 14.2
Literature 68,095 36,777 3.2 1.9 5.3 10.2
SAT Mathematics and Subject Test in:
Chemistry 22,170 27,224 2.4 2.1 20.8 21.7
Physics 8,277 20,906 1.2 2.0 26.6 19.4
Ecological Biology 16,171 12,887 7.7 5.6 15.7 21.4
Molecular Biology 19,639 15,148 7.4 5.7 12.7 16.6
Mathematics Level 1 51,272 42,169 1.8 1.6 4.8 6.4
Mathematics Level 2 58,864 63,471 3.2 2.9 6.1 6.5
SAT Writing and Subject Test in:
U.S. History 58,392 50,821 9.3 17.0 14.3 8.7
World History 5,595 6,347 5.1 17.6 27.5 12.4
Literature 68,095 36,777 6.3 6.3 9.3 11.3
SAT Average and Subject Test in:
Chemistry 22,170 27,224 5.6 10.1 11.7 7.4
Physics 8,277 20,906 6.7 13.0 11.3 3.7
Ecological Biology 16,171 12,887 4.1 6.6 9.0 7.6
Molecular Biology 19,639 15,148 5.8 9.7 6.7 5.1
SAT Average and Subject Test Average (including languages) 132,826 112,776 7.6 9.4 2.2 1.8
SAT Average and Subject Test Average (excluding languages) 132,826 112,776 3.9 7.6 2.0 1.6
Racial/Ethnic and Best Language Group Comparisons
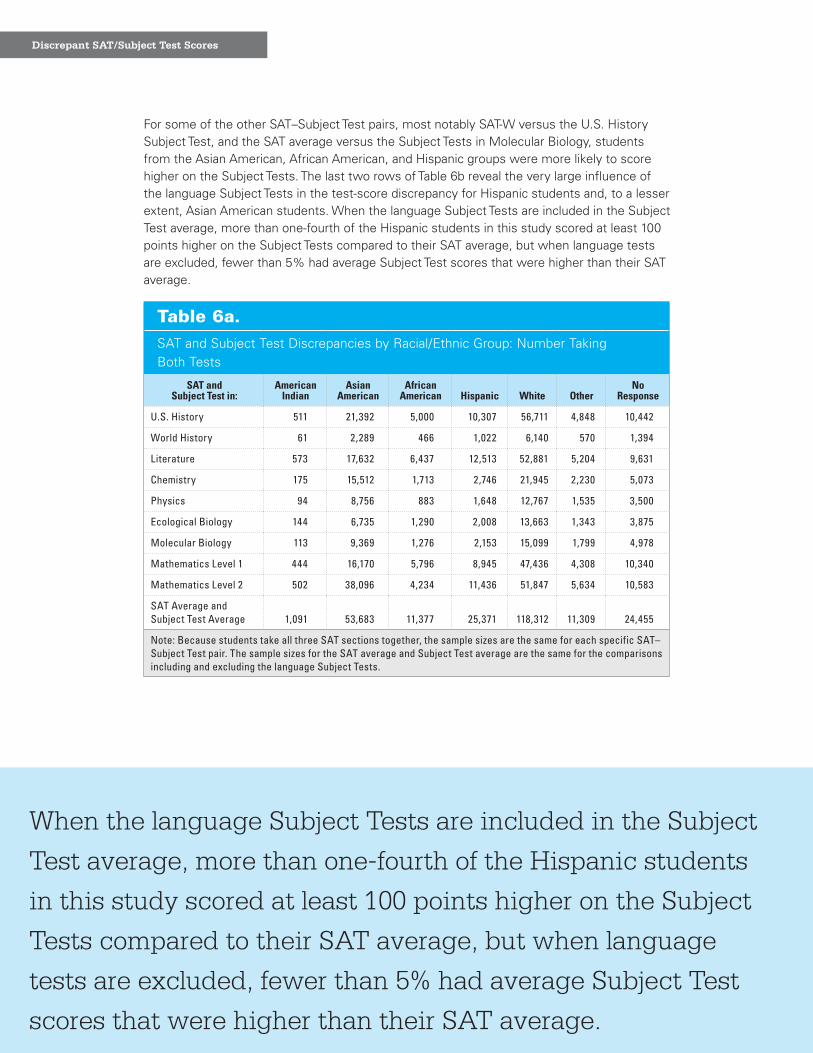
Table 6a contains the number of students by racial/ethnic group for each SAT–Subject Test pair, and Table 6b displays the percentages of students in each discrepancy group for those same subgroups. As was found in the total group, within the SAT–Subject Test pairs of the most similar content (SAT-CR versus Literature, SAT-M versus Mathematics Level 1, and SAT-M versus Mathematics Level 2), students with discrepant scores in each racial/ethnic group were more likely to score higher on the SAT than on the respective Subject Test, with the exception of SAT-M versus Mathematics Level 2 for African American and Hispanic students. A relatively large percentage of students did not report their racial/ethnic group and/or their best language. The percentage of nonresponders in each of the discrepancy groups was similar to the percentage among white students and students with English as their best language for the comparisons involving SAT-CR and SAT-W. However, for the other SAT–Subject Test comparisons, the nonresponse group appears to be different from each of the other racial/ethnic and best language subgroups.
14 College Board Research Reports
Discrepant SAT/Subject Test Scores
When the language Subject Tests are included in the Subject
Test average, more than one-fourth of the Hispanic students
in this study scored at least 100 points higher on the Subject
Tests compared to their SAT average, but when language
tests are excluded, fewer than 5% had average Subject Test
scores that were higher than their SAT average.
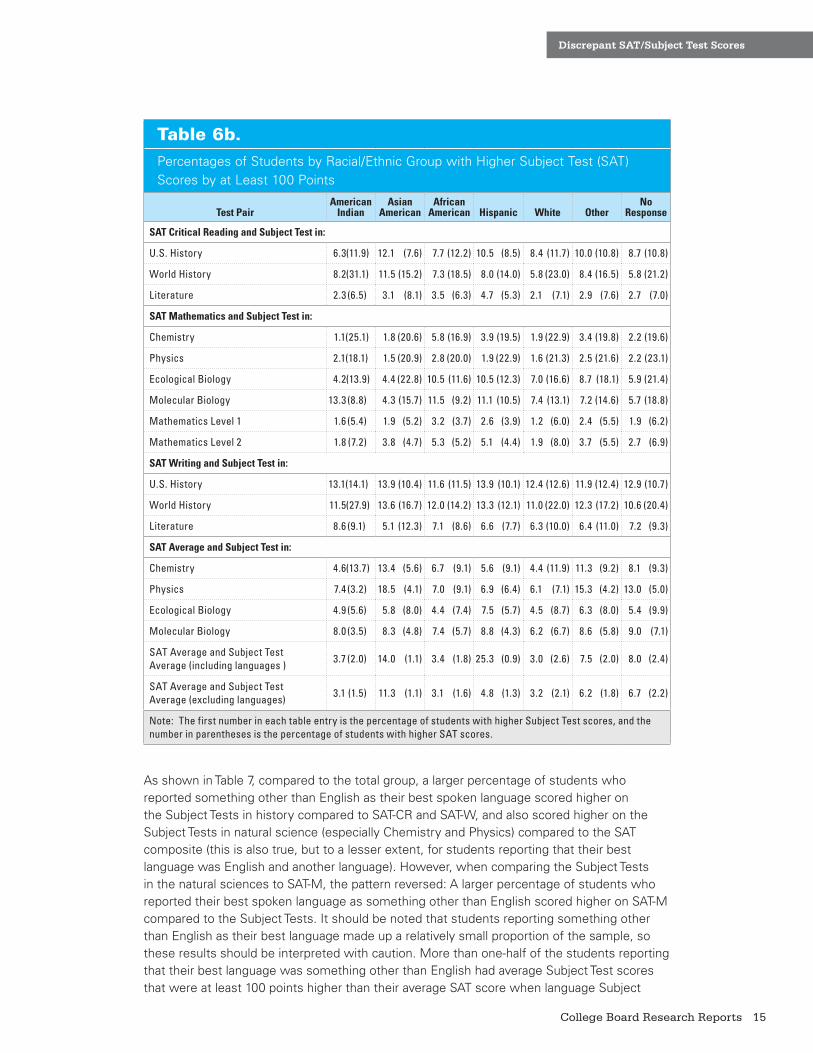
For some of the other SAT–Subject Test pairs, most notably SAT-W versus the U.S. History Subject Test, and the SAT average versus the Subject Tests in Molecular Biology, students from the Asian American, African American, and Hispanic groups were more likely to score higher on the Subject Tests. The last two rows of Table 6b reveal the very large influence of the language Subject Tests in the test-score discrepancy for Hispanic students and, to a lesser extent, Asian American students. When the language Subject Tests are included in the Subject Test average, more than one-fourth of the Hispanic students in this study scored at least 100 points higher on the Subject Tests compared to their SAT average, but when language tests are excluded, fewer than 5% had average Subject Test scores that were higher than their SAT average.
Table 6a.SAT and Subject Test Discrepancies by Racial/Ethnic Group: Number Taking Both Tests
SAT and Subject Test in:
American Indian
Asian American
African American Hispanic White Other
No Response
U.S. History 511 21,392 5,000 10,307 56,711 4,848 10,442
World History 61 2,289 466 1,022 6,140 570 1,394
Literature 573 17,632 6,437 12,513 52,881 5,204 9,631
Chemistry 175 15,512 1,713 2,746 21,945 2,230 5,073
Physics 94 8,756 883 1,648 12,767 1,535 3,500
Ecological Biology 144 6,735 1,290 2,008 13,663 1,343 3,875
Molecular Biology 113 9,369 1,276 2,153 15,099 1,799 4,978
Mathematics Level 1 444 16,170 5,796 8,945 47,436 4,308 10,340
Mathematics Level 2 502 38,096 4,234 11,436 51,847 5,634 10,583
SAT Average and Subject Test Average 1,091 53,683 11,377 25,371 118,312 11,309 24,455
Note: Because students take all three SAT sections together, the sample sizes are the same for each specific SAT–Subject Test pair. The sample sizes for the SAT average and Subject Test average are the same for the comparisons including and excluding the language Subject Tests.
15College Board Research Reports
Discrepant SAT/Subject Test Scores
Table 6b.Percentages of Students by Racial/Ethnic Group with Higher Subject Test (SAT) Scores by at Least 100 Points
Test PairAmerican
IndianAsian
AmericanAfrican
American Hispanic White OtherNo
Response
SAT Critical Reading and Subject Test in:
U.S. History 6.3 (11.9) 12.1 (7.6) 7.7 (12.2) 10.5 (8.5) 8.4 (11.7) 10.0 (10.8) 8.7 (10.8)
World History 8.2 (31.1) 11.5 (15.2) 7.3 (18.5) 8.0 (14.0) 5.8 (23.0) 8.4 (16.5) 5.8 (21.2)
Literature 2.3 (6.5) 3.1 (8.1) 3.5 (6.3) 4.7 (5.3) 2.1 (7.1) 2.9 (7.6) 2.7 (7.0)
SAT Mathematics and Subject Test in:
Chemistry 1.1 (25.1) 1.8 (20.6) 5.8 (16.9) 3.9 (19.5) 1.9 (22.9) 3.4 (19.8) 2.2 (19.6)
Physics 2.1 (18.1) 1.5 (20.9) 2.8 (20.0) 1.9 (22.9) 1.6 (21.3) 2.5 (21.6) 2.2 (23.1)
Ecological Biology 4.2 (13.9) 4.4 (22.8) 10.5 (11.6) 10.5 (12.3) 7.0 (16.6) 8.7 (18.1) 5.9 (21.4)
Molecular Biology 13.3 (8.8) 4.3 (15.7) 11.5 (9.2) 11.1 (10.5) 7.4 (13.1) 7.2 (14.6) 5.7 (18.8)
Mathematics Level 1 1.6 (5.4) 1.9 (5.2) 3.2 (3.7) 2.6 (3.9) 1.2 (6.0) 2.4 (5.5) 1.9 (6.2)
Mathematics Level 2 1.8 (7.2) 3.8 (4.7) 5.3 (5.2) 5.1 (4.4) 1.9 (8.0) 3.7 (5.5) 2.7 (6.9)
SAT Writing and Subject Test in:
U.S. History 13.1 (14.1) 13.9 (10.4) 11.6 (11.5) 13.9 (10.1) 12.4 (12.6) 11.9 (12.4) 12.9 (10.7)
World History 11.5 (27.9) 13.6 (16.7) 12.0 (14.2) 13.3 (12.1) 11.0 (22.0) 12.3 (17.2) 10.6 (20.4)
Literature 8.6 (9.1) 5.1 (12.3) 7.1 (8.6) 6.6 (7.7) 6.3 (10.0) 6.4 (11.0) 7.2 (9.3)
SAT Average and Subject Test in:
Chemistry 4.6 (13.7) 13.4 (5.6) 6.7 (9.1) 5.6 (9.1) 4.4 (11.9) 11.3 (9.2) 8.1 (9.3)
Physics 7.4 (3.2) 18.5 (4.1) 7.0 (9.1) 6.9 (6.4) 6.1 (7.1) 15.3 (4.2) 13.0 (5.0)
Ecological Biology 4.9 (5.6) 5.8 (8.0) 4.4 (7.4) 7.5 (5.7) 4.5 (8.7) 6.3 (8.0) 5.4 (9.9)
Molecular Biology 8.0 (3.5) 8.3 (4.8) 7.4 (5.7) 8.8 (4.3) 6.2 (6.7) 8.6 (5.8) 9.0 (7.1)
SAT Average and Subject Test Average (including languages )
3.7 (2.0) 14.0 (1.1) 3.4 (1.8) 25.3 (0.9) 3.0 (2.6) 7.5 (2.0) 8.0 (2.4)
SAT Average and Subject Test Average (excluding languages)
3.1 (1.5) 11.3 (1.1) 3.1 (1.6) 4.8 (1.3) 3.2 (2.1) 6.2 (1.8) 6.7 (2.2)
Note: The first number in each table entry is the percentage of students with higher Subject Test scores, and the number in parentheses is the percentage of students with higher SAT scores.
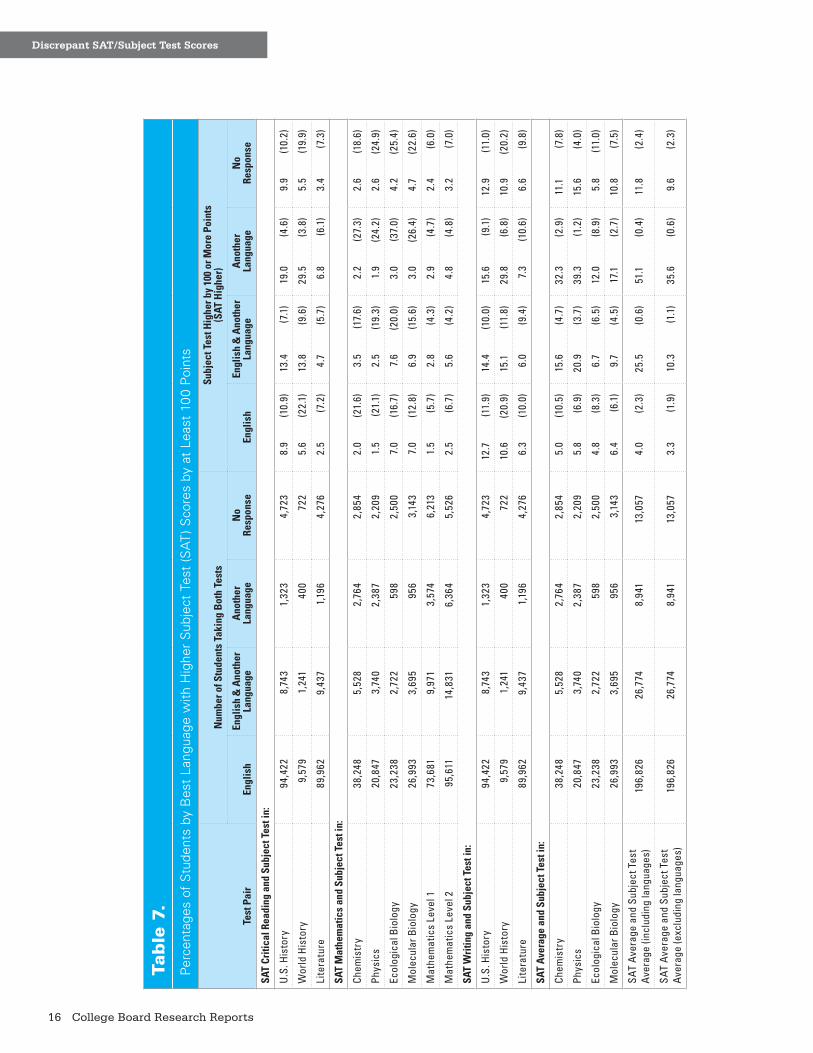
As shown in Table 7, compared to the total group, a larger percentage of students who reported something other than English as their best spoken language scored higher on the Subject Tests in history compared to SAT-CR and SAT-W, and also scored higher on the Subject Tests in natural science (especially Chemistry and Physics) compared to the SAT composite (this is also true, but to a lesser extent, for students reporting that their best language was English and another language). However, when comparing the Subject Tests in the natural sciences to SAT-M, the pattern reversed: A larger percentage of students who reported their best spoken language as something other than English scored higher on SAT-M compared to the Subject Tests. It should be noted that students reporting something other than English as their best language made up a relatively small proportion of the sample, so these results should be interpreted with caution. More than one-half of the students reporting that their best language was something other than English had average Subject Test scores that were at least 100 points higher than their average SAT score when language Subject
16 College Board Research Reports
Discrepant SAT/Subject Test Scores
Tab
le 7
.P
erce
ntag
es o
f S
tude
nts
by B
est
Lang
uage
with
Hig
her
Sub
ject
Tes
t (S
AT)
Sco
res
by a
t Le
ast
100
Poi
nts
Test
Pai
r
Num
ber o
f Stu
dent
s Ta
king
Bot
h Te
sts
Subj
ect T
est H
ighe
r by
100
or M
ore
Poin
ts
(SAT
Hig
her)
Engl
ish
Engl
ish
& A
noth
er
Lang
uage
Ano
ther
La
ngua
geN
o
Resp
onse
Engl
ish
Engl
ish
& A
noth
er
Lang
uage
Ano
ther
La
ngua
geN
o
Resp
onse
SAT
Criti
cal R
eadi
ng a
nd S
ubje
ct T
est i
n:
U.S
. His
tory
94,4
228,
743
1,32
34,
723
8.
9 (1
0.9)
13.
4 (7
.1)
19.
0 (4
.6)
9.
9 (1
0.2)
Wor
ld H
isto
ry9,
579
1,24
140
072
2
5.6
(22.
1) 1
3.8
(9.6
) 2
9.5
(3.8
)
5.5
(19.
9)
Lite
ratu
re89
,962
9,43
71,
196
4,27
6
2.5
(7.2
)
4.7
(5.7
)
6.8
(6.1
)
3.4
(7.3
)
SAT
Mat
hem
atic
s an
d Su
bjec
t Tes
t in:
Chem
istr
y38
,248
5,52
82,
764
2,85
4
2.0
(21.
6)
3.5
(17.
6)
2.2
(27.
3)
2.6
(18.
6)
Phys
ics
20,8
473,
740
2,38
72,
209
1.
5 (2
1.1)
2.
5 (1
9.3)
1.
9 (2
4.2)
2.
6 (2
4.9)
Ecol
ogic
al B
iolo
gy23
,238
2,72
259
82,
500
7.
0 (1
6.7)
7.
6 (2
0.0)
3.
0 (3
7.0)
4.
2 (2
5.4)
Mol
ecul
ar B
iolo
gy26
,993
3,69
595
63,
143
7.
0 (1
2.8)
6.
9 (1
5.6)
3.
0 (2
6.4)
4.
7 (2
2.6)
Mat
hem
atic
s Le
vel 1
73,6
819,
971
3,57
46,
213
1.
5 (5
.7)
2.
8 (4
.3)
2.
9 (4
.7)
2.
4 (6
.0)
Mat
hem
atic
s Le
vel 2
95,6
1114
,831
6,36
45,
526
2.
5 (6
.7)
5.
6 (4
.2)
4.
8 (4
.8)
3.
2 (7
.0)
SAT
Wri
ting
and
Subj
ect T
est i
n:
U.S
. His
tory
94,4
228,
743
1,32
34,
723
12.
7 (1
1.9)
14.
4 (1
0.0)
15.
6 (9
.1)
12.
9 (1
1.0)
Wor
ld H
isto
ry9,
579
1,24
140
072
2 1
0.6
(20.
9) 1
5.1
(11.
8) 2
9.8
(6.8
) 1
0.9
(20.
2)
Lite
ratu
re89
,962
9,43
71,
196
4,27
6
6.3
(10.
0)
6.0
(9.4
)
7.3
(10.
6)
6.6
(9.8
)
SAT
Aver
age
and
Subj
ect T
est i
n:
Chem
istr
y38
,248
5,52
82,
764
2,85
4
5.0
(10.
5) 1
5.6
(4.7
) 3
2.3
(2.9
)
11.1
(7
.8)
Phys
ics
20,8
473,
740
2,38
72,
209
5.
8 (6
.9)
20.
9 (3
.7)
39.
3 (1
.2)
15.
6 (4
.0)
Ecol
ogic
al B
iolo
gy23
,238
2,72
259
82,
500
4.
8 (8
.3)
6.
7 (6
.5)
12.
0 (8
.9)
5.
8 (1
1.0)
Mol
ecul
ar B
iolo
gy26
,993
3,69
595
63,
143
6.
4 (6
.1)
9.
7 (4
.5)
17
.1
(2.7
) 1
0.8
(7.5
)
SAT
Ave
rage
and
Sub
ject
Tes
t A
vera
ge (i
nclu
ding
lang
uage
s)19
6,82
626
,774
8,94
113
,057
4.
0 (2
.3)
25.
5 (0
.6)
51.
1 (0
.4)
11
.8
(2.4
)
SAT
Ave
rage
and
Sub
ject
Tes
t A
vera
ge (e
xclu
ding
lang
uage
s)19
6,82
626
,774
8,94
113
,057
3.
3 (1
.9)
10.
3 (1
.1)
35.
6 (0
.6)
9.
6 (2
.3)

17College Board Research Reports
Discrepant SAT/Subject Test Scores
Tests were included. Yet even when the language Subject Tests were not included, more than one-third of students whose best language was something other than English had a higher Subject Test average compared to their average SAT score.
Impact of Length of Time Between Tests and Order of Testing on the SAT–Subject Test Discrepancies
Because students do not take the SAT and the SAT Subject Tests concurrently, the learning or maturation that takes place in the interval between the two tests may contribute to the discrepancies. Students in the sample took the SAT and the Subject Tests anywhere between 0.08 to 3.17 years apart. The average time span for each SAT–Subject Test pair ranged from 0.26 (SAT and Literature) to 0.80 (SAT and Ecological Biology) years, indicating that most students took the tests within the same year. The correlations of the absolute value of the discrepancy scores with the length of time between the two tests (in number of years) were negligible; all were less than 0.12. These data show that the length of time between the two tests had virtually no relationship with the magnitude of the difference between the two scores; this is most likely due to the fact that most students took the tests within the same year.
Discrepancies between SAT and Subject Test scores may also be affected by the order of testing. A practice effect hypothesis would predict higher scores on the test taken second. Table 8 shows the SAT and Subject Test discrepancies based on the order of testing. Regardless of the order of testing, students with discrepant scores are more likely to score higher on the SAT. The exceptions are SAT-CR and SAT-W versus the Subject Test in U.S. History, and the SAT average compared to the Subject Tests in Physics and Ecological and
Table 8.SAT and Subject Test Discrepancies by Order of Testing
Test Pair
N Taking Both Tests SAT Taken First Subject Test Taken FirstSubject Test
FirstSAT First
Subject Test Higher
SAT Higher
Subject Test Higher
SAT Higher
SAT Critical Reading and Subject Test in:
U.S. History 61,551 47,662 5.3 14.5 12.6 7.4
World History 7,773 4,169 8.2 18.8 6.8 20.8
Literature 36,976 67,896 3.0 6.3 2.3 8.4
SAT Mathematics and Subject Test in:
Chemistry 29,756 19,638 2.5 21.7 2.1 21.1
Physics 12,483 16,700 1.9 21.3 1.5 21.6
Ecological Biology 18,842 10,216 8.7 14.8 5.7 20.1
Molecular Biology 21,976 12,811 7.7 12.0 6.1 15.8
Mathematics Level 1 44,915 48,526 2.0 4.1 1.4 7.1
Mathematics Level 2 48,922 73,413 3.3 6.2 2.8 6.5
SAT Writing and Subject Test in:
U.S. History 61,551 47,662 9.1 14.6 15.7 9.4
World History 7,773 4,169 13.9 15.4 10.6 21.6
Literature 36,976 67,896 6.9 9.0 5.2 11.9
SAT Average and Subject Test in:
Chemistry 29,756 19,638 8.6 9.2 7.7 9.4
Physics 12,483 16,700 11.0 5.7 11.6 6.0
Ecological Biology 18,842 10,216 6.2 5.7 4.7 9.8
Molecular Biology 21,976 12,811 8.6 3.9 6.8 7.2
18 College Board Research Reports
Discrepant SAT/Subject Test Scores
Molecular Biology. For these pairs of tests, the pattern of results is somewhat consistent with a practice effect hypothesis, but because the difference in the percentages of students scoring higher on each test is so small and because the pattern only appears for a few of the Subject Test–SAT pairs, the support for this hypothesis is not very strong.
Association of Academic Behaviors with Size of the Discrepancy
Since the Subject Tests are curriculum based, one may predict that a student with more course work, higher grades, or greater self-efficacy (perceived ability) in the discipline or subject area of the test would be more likely to show discrepant scores in favor of the Subject Test. This hypothesis was assessed by examining the relationship of students’ self-reported academic behaviors with their discrepancy scores. Variables from the SAT Questionnaire used in this analysis included self-reported writing ability, science ability, and mathematics ability (response options included: highest 10%, above average, average, or below average); number of years of high school course work in disciplines such as foreign and classical languages, English, natural science, calculus, precalculus, trigonometry, geometry, and algebra; average grade in foreign and classical language, English, natural science, and mathematics; and cumulative HSGPA.6
Tables 9a through 9c show the mean discrepancy scores by self-reported academic ability in writing and mathematics, average grades in English and mathematics courses, and number of years of course taking in English and mathematics. To be included in the tables discussed below, students must have had nonmissing data on not only all of the previously discussed variables but also on each of the SAT-Q items. In other words, a student included in the main SAT-CR and Literature Subject Test analysis who responded to the writing self-efficacy question but not the average English grade question would be included in Table 9a but not in Table 9c.
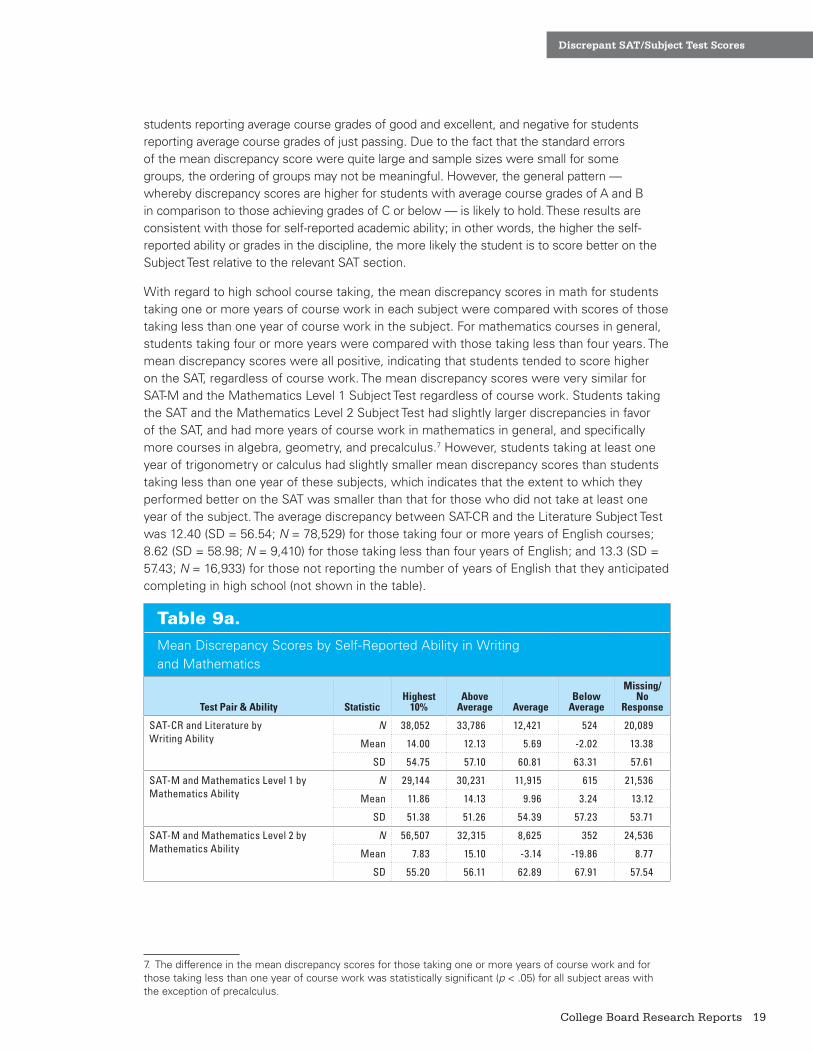
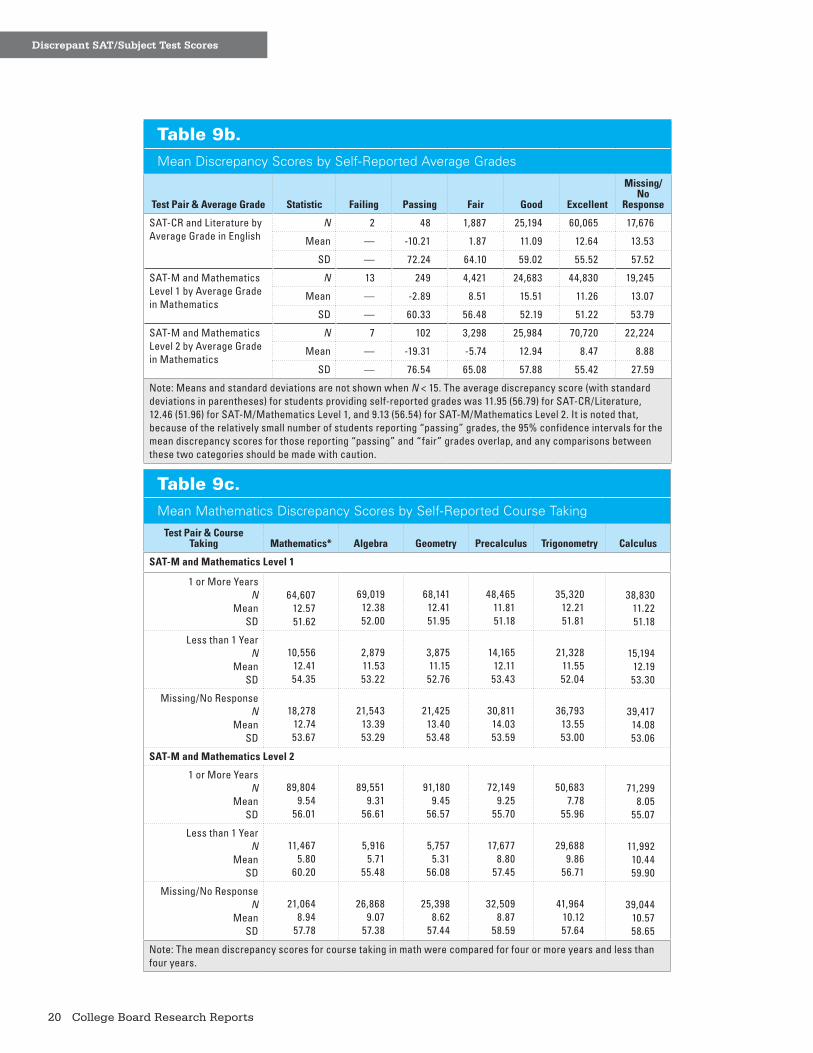
An examination of the mean discrepancy scores by students’ self-reported ability in writing and mathematics shows a trend of increasing discrepancy scores as self-reported ability increases. Students reporting below-average mathematics ability had the largest negative mean discrepancy score for SAT-M and Mathematics Level 2 (-19.9), indicating larger scores on the Subject Test. The mean discrepancy scores by average course grades are shown in Table 9b. The mean discrepancy scores are positive for
6. A series of multiple regression models were estimated to predict the discrepancy scores for SAT-CR versus the Subject Test in Literature, SAT-M versus the Subject Test in Mathematics Level 1, and SAT-M versus the Subject Test in Mathematics Level 2 using the course-taking and academic performance variables from the SAT Questionnaire. Twenty-five percent of the sample for each SAT-section and Subject Test pair was reserved for testing and validation purposes, while the remaining 75% (the training sample) was used to estimate the models of interest. The average squared error (ASE) of the validation data was used as the stopping criterion in forward model selection. Despite the fact that a wide variety of predictors were permitted to enter the model and the fact that two-way interactions were allowed, none of the three final models accounted for more than 4% of the variance of discrepancy scores. Because none of the three models explained a substantial amount of variance in the discrepancy scores none of the results of these analyses are presented.
… the higher the
self-reported ability
or grades in the
discipline, the more
likely the student is
to score better on the
Subject Test relative
to the relevant
SAT section.
19College Board Research Reports
Discrepant SAT/Subject Test Scores
students reporting average course grades of good and excellent, and negative for students reporting average course grades of just passing. Due to the fact that the standard errors of the mean discrepancy score were quite large and sample sizes were small for some groups, the ordering of groups may not be meaningful. However, the general pattern — whereby discrepancy scores are higher for students with average course grades of A and B in comparison to those achieving grades of C or below — is likely to hold. These results are consistent with those for self-reported academic ability; in other words, the higher the self-reported ability or grades in the discipline, the more likely the student is to score better on the Subject Test relative to the relevant SAT section.
With regard to high school course taking, the mean discrepancy scores in math for students taking one or more years of course work in each subject were compared with scores of those taking less than one year of course work in the subject. For mathematics courses in general, students taking four or more years were compared with those taking less than four years. The mean discrepancy scores were all positive, indicating that students tended to score higher on the SAT, regardless of course work. The mean discrepancy scores were very similar for SAT-M and the Mathematics Level 1 Subject Test regardless of course work. Students taking the SAT and the Mathematics Level 2 Subject Test had slightly larger discrepancies in favor of the SAT, and had more years of course work in mathematics in general, and specifically more courses in algebra, geometry, and precalculus.7 However, students taking at least one year of trigonometry or calculus had slightly smaller mean discrepancy scores than students taking less than one year of these subjects, which indicates that the extent to which they performed better on the SAT was smaller than that for those who did not take at least one year of the subject. The average discrepancy between SAT-CR and the Literature Subject Test was 12.40 (SD = 56.54; N = 78,529) for those taking four or more years of English courses; 8.62 (SD = 58.98; N = 9,410) for those taking less than four years of English; and 13.3 (SD = 57.43; N = 16,933) for those not reporting the number of years of English that they anticipated completing in high school (not shown in the table).
Table 9a.Mean Discrepancy Scores by Self-Reported Ability in Writing and Mathematics
Test Pair & Ability StatisticHighest
10%Above
Average AverageBelow
Average
Missing/ No
Response
SAT-CR and Literature by Writing Ability
N 38,052 33,786 12,421 524 20,089
Mean 14.00 12.13 5.69 -2.02 13.38
SD 54.75 57.10 60.81 63.31 57.61
SAT-M and Mathematics Level 1 by Mathematics Ability
N 29,144 30,231 11,915 615 21,536
Mean 11.86 14.13 9.96 3.24 13.12
SD 51.38 51.26 54.39 57.23 53.71
SAT-M and Mathematics Level 2 by Mathematics Ability
N 56,507 32,315 8,625 352 24,536
Mean 7.83 15.10 -3.14 -19.86 8.77
SD 55.20 56.11 62.89 67.91 57.54
7. The difference in the mean discrepancy scores for those taking one or more years of course work and for those taking less than one year of course work was statistically significant (p < .05) for all subject areas with the exception of precalculus.
20 College Board Research Reports
Discrepant SAT/Subject Test Scores
Table 9b.Mean Discrepancy Scores by Self-Reported Average Grades
Test Pair & Average Grade Statistic Failing Passing Fair Good Excellent
Missing/ No
Response
SAT-CR and Literature by Average Grade in English
N 2 48 1,887 25,194 60,065 17,676
Mean — -10.21 1.87 11.09 12.64 13.53
SD — 72.24 64.10 59.02 55.52 57.52
SAT-M and Mathematics Level 1 by Average Grade in Mathematics
N 13 249 4,421 24,683 44,830 19,245
Mean — -2.89 8.51 15.51 11.26 13.07
SD — 60.33 56.48 52.19 51.22 53.79
SAT-M and Mathematics Level 2 by Average Grade in Mathematics
N 7 102 3,298 25,984 70,720 22,224
Mean — -19.31 -5.74 12.94 8.47 8.88
SD — 76.54 65.08 57.88 55.42 27.59
Note: Means and standard deviations are not shown when N < 15. The average discrepancy score (with standard deviations in parentheses) for students providing self-reported grades was 11.95 (56.79) for SAT-CR/Literature, 12.46 (51.96) for SAT-M/Mathematics Level 1, and 9.13 (56.54) for SAT-M/Mathematics Level 2. It is noted that, because of the relatively small number of students reporting “passing” grades, the 95% confidence intervals for the mean discrepancy scores for those reporting “passing” and “fair” grades overlap, and any comparisons between these two categories should be made with caution.
Table 9c.Mean Mathematics Discrepancy Scores by Self-Reported Course Taking
Test Pair & Course Taking Mathematics* Algebra Geometry Precalculus Trigonometry Calculus
SAT-M and Mathematics Level 1
1 or More YearsN
MeanSD
64,60712.5751.62
69,01912.3852.00
68,14112.4151.95
48,46511.8151.18
35,32012.2151.81
38,83011.2251.18
Less than 1 YearN
MeanSD
10,55612.4154.35
2,87911.5353.22
3,87511.1552.76
14,16512.1153.43
21,32811.5552.04
15,19412.1953.30
Missing/No ResponseN
MeanSD
18,27812.7453.67
21,54313.3953.29
21,42513.4053.48
30,81114.0353.59
36,79313.5553.00
39,41714.0853.06
SAT-M and Mathematics Level 2
1 or More YearsN
MeanSD
89,8049.54
56.01
89,5519.31
56.61
91,1809.45
56.57
72,1499.25
55.70
50,6837.78
55.96
71,2998.05
55.07
Less than 1 YearN
MeanSD
11,4675.80
60.20
5,9165.71
55.48
5,7575.31
56.08
17,6778.80
57.45
29,6889.86
56.71
11,99210.4459.90
Missing/No ResponseN
MeanSD
21,0648.94
57.78
26,8689.07
57.38
25,3988.62
57.44
32,5098.87
58.59
41,96410.1257.64
39,04410.5758.65
Note: The mean discrepancy scores for course taking in math were compared for four or more years and less than four years.
21College Board Research Reports
Discrepant SAT/Subject Test Scores
Prediction of FYGPA for Students With and Without Discrepant Scores
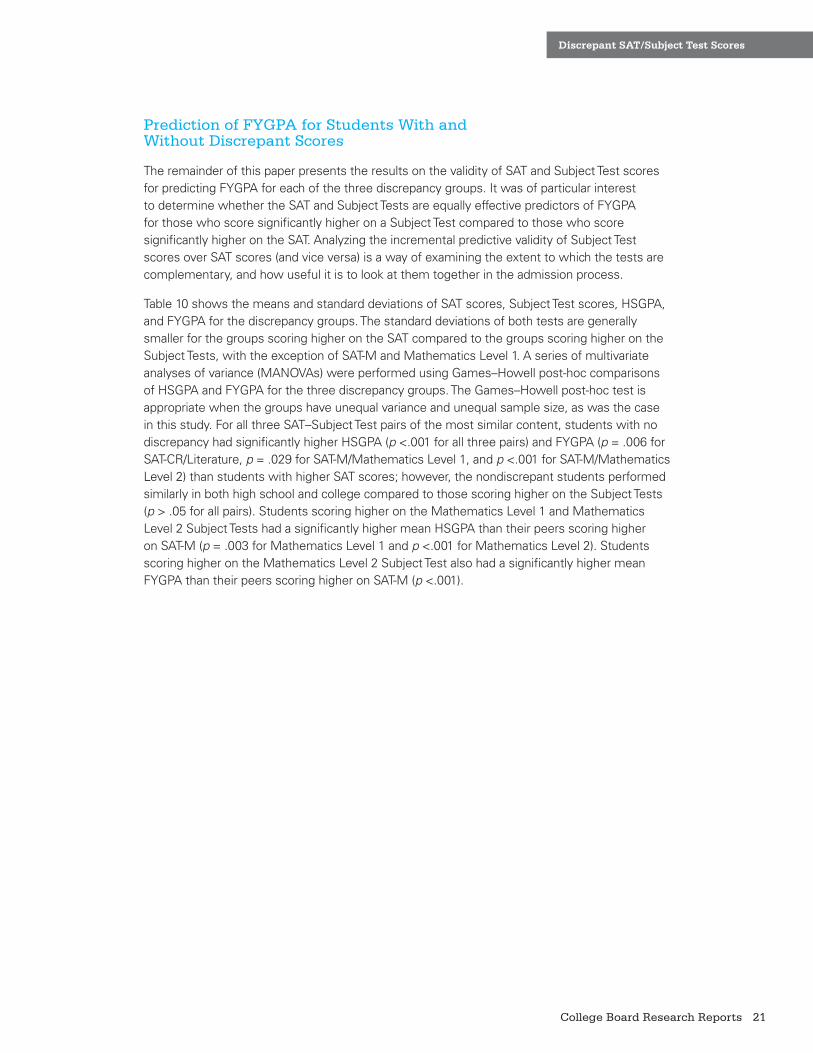
The remainder of this paper presents the results on the validity of SAT and Subject Test scores for predicting FYGPA for each of the three discrepancy groups. It was of particular interest to determine whether the SAT and Subject Tests are equally effective predictors of FYGPA for those who score significantly higher on a Subject Test compared to those who score significantly higher on the SAT. Analyzing the incremental predictive validity of Subject Test scores over SAT scores (and vice versa) is a way of examining the extent to which the tests are complementary, and how useful it is to look at them together in the admission process.
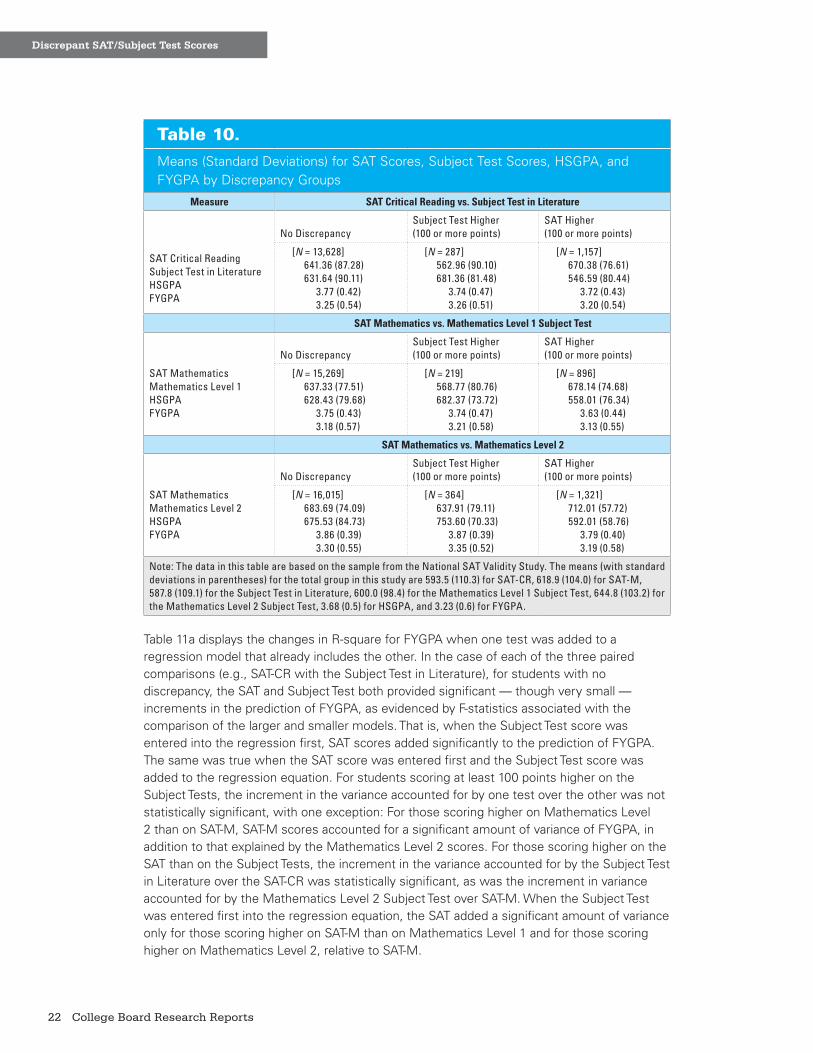
Table 10 shows the means and standard deviations of SAT scores, Subject Test scores, HSGPA, and FYGPA for the discrepancy groups. The standard deviations of both tests are generally smaller for the groups scoring higher on the SAT compared to the groups scoring higher on the Subject Tests, with the exception of SAT-M and Mathematics Level 1. A series of multivariate analyses of variance (MANOVAs) were performed using Games–Howell post-hoc comparisons of HSGPA and FYGPA for the three discrepancy groups. The Games–Howell post-hoc test is appropriate when the groups have unequal variance and unequal sample size, as was the case in this study. For all three SAT–Subject Test pairs of the most similar content, students with no discrepancy had significantly higher HSGPA (p <.001 for all three pairs) and FYGPA (p = .006 for SAT-CR/Literature, p = .029 for SAT-M/Mathematics Level 1, and p <.001 for SAT-M/Mathematics Level 2) than students with higher SAT scores; however, the nondiscrepant students performed similarly in both high school and college compared to those scoring higher on the Subject Tests (p > .05 for all pairs). Students scoring higher on the Mathematics Level 1 and Mathematics Level 2 Subject Tests had a significantly higher mean HSGPA than their peers scoring higher on SAT-M (p = .003 for Mathematics Level 1 and p <.001 for Mathematics Level 2). Students scoring higher on the Mathematics Level 2 Subject Test also had a significantly higher mean FYGPA than their peers scoring higher on SAT-M (p <.001).
22 College Board Research Reports
Discrepant SAT/Subject Test Scores
Table 10.Means (Standard Deviations) for SAT Scores, Subject Test Scores, HSGPA, and FYGPA by Discrepancy Groups
Measure SAT Critical Reading vs. Subject Test in Literature
No DiscrepancySubject Test Higher(100 or more points)
SAT Higher(100 or more points)
SAT Critical ReadingSubject Test in LiteratureHSGPAFYGPA
[N = 13,628]641.36 (87.28)631.64 (90.11)
3.77 (0.42)3.25 (0.54)
[N = 287]562.96 (90.10)681.36 (81.48)
3.74 (0.47)3.26 (0.51)
[N = 1,157]670.38 (76.61)546.59 (80.44)
3.72 (0.43)3.20 (0.54)
SAT Mathematics vs. Mathematics Level 1 Subject Test
No DiscrepancySubject Test Higher(100 or more points)
SAT Higher(100 or more points)
SAT MathematicsMathematics Level 1HSGPAFYGPA
[N = 15,269]637.33 (77.51)628.43 (79.68)
3.75 (0.43)3.18 (0.57)
[N = 219]568.77 (80.76)682.37 (73.72)
3.74 (0.47)3.21 (0.58)
[N = 896]678.14 (74.68)558.01 (76.34)
3.63 (0.44)3.13 (0.55)
SAT Mathematics vs. Mathematics Level 2
No DiscrepancySubject Test Higher(100 or more points)
SAT Higher(100 or more points)
SAT MathematicsMathematics Level 2HSGPAFYGPA
[N = 16,015]683.69 (74.09)675.53 (84.73)
3.86 (0.39)3.30 (0.55)
[N = 364]637.91 (79.11)753.60 (70.33)
3.87 (0.39)3.35 (0.52)
[N = 1,321]712.01 (57.72)592.01 (58.76)
3.79 (0.40)3.19 (0.58)
Note: The data in this table are based on the sample from the National SAT Validity Study. The means (with standard deviations in parentheses) for the total group in this study are 593.5 (110.3) for SAT-CR, 618.9 (104.0) for SAT-M, 587.8 (109.1) for the Subject Test in Literature, 600.0 (98.4) for the Mathematics Level 1 Subject Test, 644.8 (103.2) for the Mathematics Level 2 Subject Test, 3.68 (0.5) for HSGPA, and 3.23 (0.6) for FYGPA.
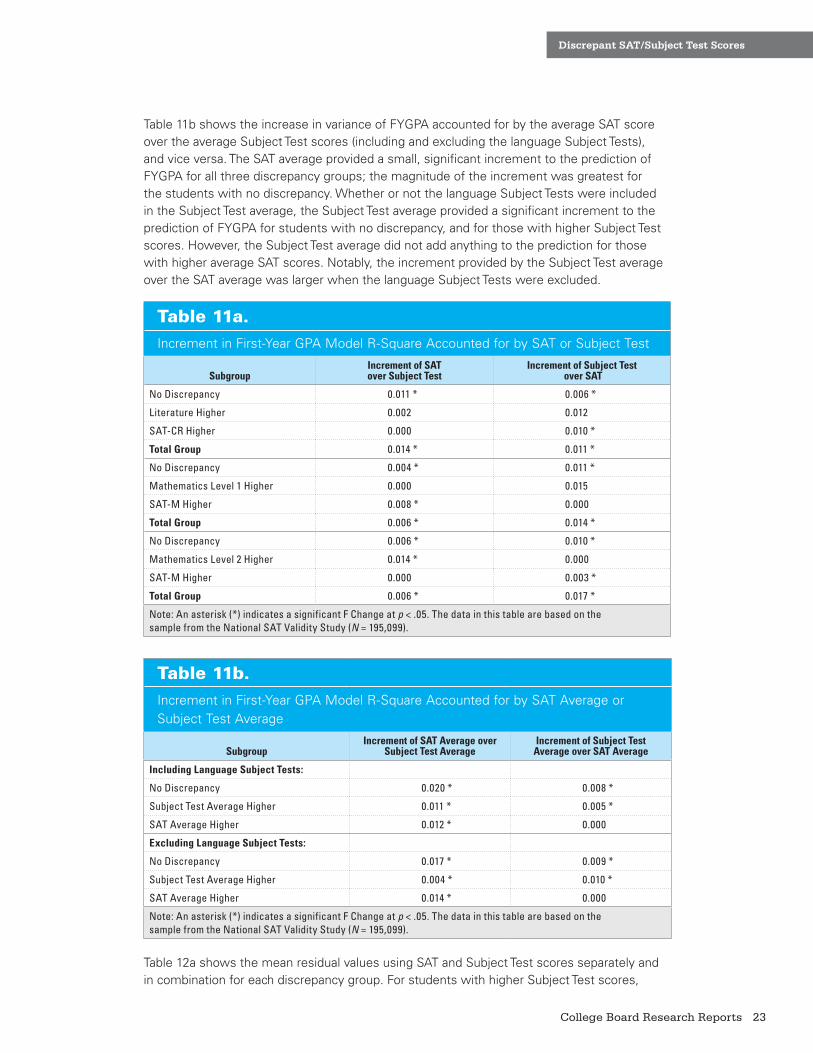
Table 11a displays the changes in R-square for FYGPA when one test was added to a regression model that already includes the other. In the case of each of the three paired comparisons (e.g., SAT-CR with the Subject Test in Literature), for students with no discrepancy, the SAT and Subject Test both provided significant — though very small — increments in the prediction of FYGPA, as evidenced by F-statistics associated with the comparison of the larger and smaller models. That is, when the Subject Test score was entered into the regression first, SAT scores added significantly to the prediction of FYGPA. The same was true when the SAT score was entered first and the Subject Test score was added to the regression equation. For students scoring at least 100 points higher on the Subject Tests, the increment in the variance accounted for by one test over the other was not statistically significant, with one exception: For those scoring higher on Mathematics Level 2 than on SAT-M, SAT-M scores accounted for a significant amount of variance of FYGPA, in addition to that explained by the Mathematics Level 2 scores. For those scoring higher on the SAT than on the Subject Tests, the increment in the variance accounted for by the Subject Test in Literature over the SAT-CR was statistically significant, as was the increment in variance accounted for by the Mathematics Level 2 Subject Test over SAT-M. When the Subject Test was entered first into the regression equation, the SAT added a significant amount of variance only for those scoring higher on SAT-M than on Mathematics Level 1 and for those scoring higher on Mathematics Level 2, relative to SAT-M.
23College Board Research Reports
Discrepant SAT/Subject Test Scores
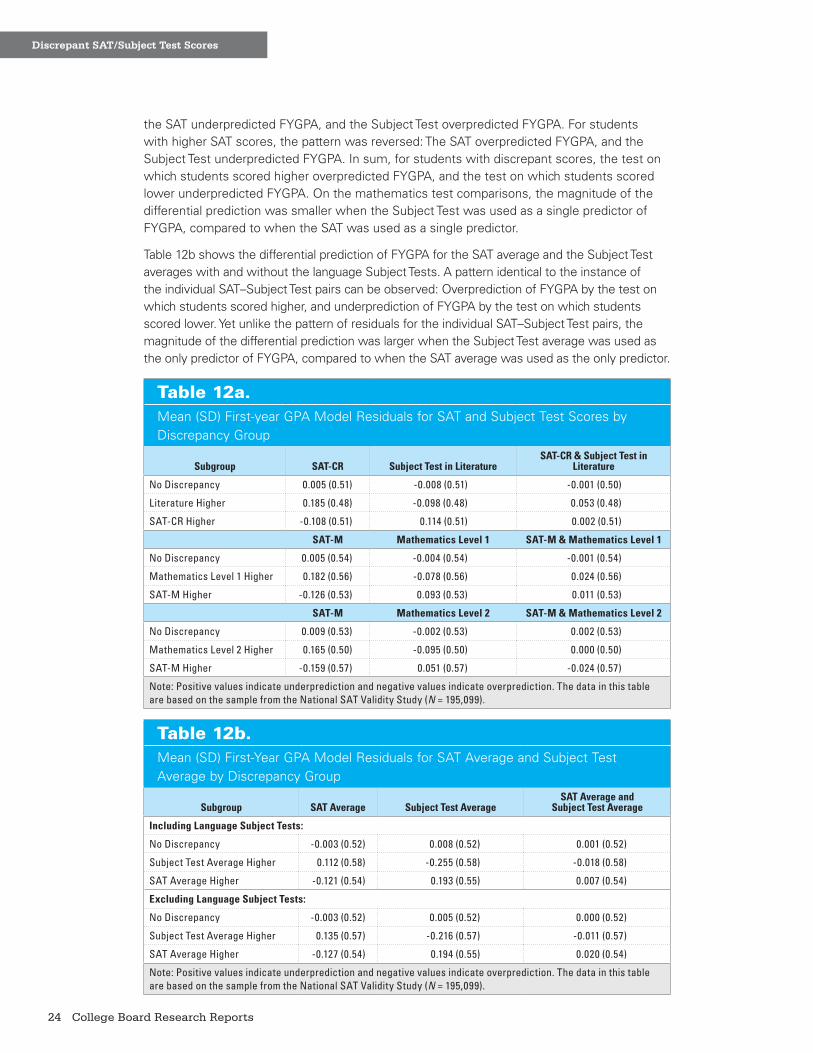
Table 11b shows the increase in variance of FYGPA accounted for by the average SAT score over the average Subject Test scores (including and excluding the language Subject Tests), and vice versa. The SAT average provided a small, significant increment to the prediction of FYGPA for all three discrepancy groups; the magnitude of the increment was greatest for the students with no discrepancy. Whether or not the language Subject Tests were included in the Subject Test average, the Subject Test average provided a significant increment to the prediction of FYGPA for students with no discrepancy, and for those with higher Subject Test scores. However, the Subject Test average did not add anything to the prediction for those with higher average SAT scores. Notably, the increment provided by the Subject Test average over the SAT average was larger when the language Subject Tests were excluded.
Table 11a.Increment in First-Year GPA Model R-Square Accounted for by SAT or Subject Test
SubgroupIncrement of SAT over Subject Test
Increment of Subject Test over SAT
No Discrepancy 0.011 * 0.006 *
Literature Higher 0.002 0.012
SAT-CR Higher 0.000 0.010 *
Total Group 0.014 * 0.011 *
No Discrepancy 0.004 * 0.011 *
Mathematics Level 1 Higher 0.000 0.015
SAT-M Higher 0.008 * 0.000
Total Group 0.006 * 0.014 *
No Discrepancy 0.006 * 0.010 *
Mathematics Level 2 Higher 0.014 * 0.000
SAT-M Higher 0.000 0.003 *
Total Group 0.006 * 0.017 *
Note: An asterisk (*) indicates a significant F Change at p < .05. The data in this table are based on the sample from the National SAT Validity Study (N = 195,099).
Table 11b.Increment in First-Year GPA Model R-Square Accounted for by SAT Average or Subject Test Average
SubgroupIncrement of SAT Average over
Subject Test AverageIncrement of Subject Test
Average over SAT Average
Including Language Subject Tests:
No Discrepancy 0.020 * 0.008 *
Subject Test Average Higher 0.011 * 0.005 *
SAT Average Higher 0.012 * 0.000
Excluding Language Subject Tests:
No Discrepancy 0.017 * 0.009 *
Subject Test Average Higher 0.004 * 0.010 *
SAT Average Higher 0.014 * 0.000
Note: An asterisk (*) indicates a significant F Change at p < .05. The data in this table are based on the sample from the National SAT Validity Study (N = 195,099).
Table 12a shows the mean residual values using SAT and Subject Test scores separately and in combination for each discrepancy group. For students with higher Subject Test scores,
24 College Board Research Reports
Discrepant SAT/Subject Test Scores
the SAT underpredicted FYGPA, and the Subject Test overpredicted FYGPA. For students with higher SAT scores, the pattern was reversed: The SAT overpredicted FYGPA, and the Subject Test underpredicted FYGPA. In sum, for students with discrepant scores, the test on which students scored higher overpredicted FYGPA, and the test on which students scored lower underpredicted FYGPA. On the mathematics test comparisons, the magnitude of the differential prediction was smaller when the Subject Test was used as a single predictor of FYGPA, compared to when the SAT was used as a single predictor.
Table 12b shows the differential prediction of FYGPA for the SAT average and the Subject Test averages with and without the language Subject Tests. A pattern identical to the instance of the individual SAT–Subject Test pairs can be observed: Overprediction of FYGPA by the test on which students scored higher, and underprediction of FYGPA by the test on which students scored lower. Yet unlike the pattern of residuals for the individual SAT–Subject Test pairs, the magnitude of the differential prediction was larger when the Subject Test average was used as the only predictor of FYGPA, compared to when the SAT average was used as the only predictor.
Table 12a.Mean (SD) First-year GPA Model Residuals for SAT and Subject Test Scores by Discrepancy Group
Subgroup SAT-CR Subject Test in LiteratureSAT-CR & Subject Test in
Literature
No Discrepancy 0.005 (0.51) -0.008 (0.51) -0.001 (0.50)
Literature Higher 0.185 (0.48) -0.098 (0.48) 0.053 (0.48)
SAT-CR Higher -0.108 (0.51) 0.114 (0.51) 0.002 (0.51)
SAT-M Mathematics Level 1 SAT-M & Mathematics Level 1
No Discrepancy 0.005 (0.54) -0.004 (0.54) -0.001 (0.54)
Mathematics Level 1 Higher 0.182 (0.56) -0.078 (0.56) 0.024 (0.56)
SAT-M Higher -0.126 (0.53) 0.093 (0.53) 0.011 (0.53)
SAT-M Mathematics Level 2 SAT-M & Mathematics Level 2
No Discrepancy 0.009 (0.53) -0.002 (0.53) 0.002 (0.53)
Mathematics Level 2 Higher 0.165 (0.50) -0.095 (0.50) 0.000 (0.50)
SAT-M Higher -0.159 (0.57) 0.051 (0.57) -0.024 (0.57)
Note: Positive values indicate underprediction and negative values indicate overprediction. The data in this table are based on the sample from the National SAT Validity Study (N = 195,099).
Table 12b.Mean (SD) First-Year GPA Model Residuals for SAT Average and Subject Test Average by Discrepancy Group
Subgroup SAT Average Subject Test AverageSAT Average and
Subject Test Average
Including Language Subject Tests:
No Discrepancy -0.003 (0.52) 0.008 (0.52) 0.001 (0.52)
Subject Test Average Higher 0.112 (0.58) -0.255 (0.58) -0.018 (0.58)
SAT Average Higher -0.121 (0.54) 0.193 (0.55) 0.007 (0.54)
Excluding Language Subject Tests:
No Discrepancy -0.003 (0.52) 0.005 (0.52) 0.000 (0.52)
Subject Test Average Higher 0.135 (0.57) -0.216 (0.57) -0.011 (0.57)
SAT Average Higher -0.127 (0.54) 0.194 (0.55) 0.020 (0.54)
Note: Positive values indicate underprediction and negative values indicate overprediction. The data in this table are based on the sample from the National SAT Validity Study (N = 195,099).
25College Board Research Reports
Discrepant SAT/Subject Test Scores
DiscussionThis study documents that whereas the majority of students taking both the SAT and a Subject Test of similar content obtained similar scores on both tests, a sizable minority of students performed differently. The question that was not answered, and that requires further research, is why students score substantially higher on one test, as well as the variables that might play a role in this discrepancy. The academic performance and course-taking variables examined in this study do not explain much of the variance in the discrepancy scores. Perhaps demographic and/or school-level factors play a role in the discrepancy. Future research can look at the variability in the discrepancy scores by taking high school and/or college factors into account.
One possible explanation for discrepant scores on the SAT-M and the mathematics Subject Tests concerns access to and use of calculators. Both Subject Tests in mathematics include questions that require a scientific or graphing calculator, especially the Level 2 test. While the SAT-M allows students to use a calculator, none of the items require a calculator to obtain a solution. One hypothesis with regard to calculator use is that students with more access and more frequent calculator use would be more likely to score higher on the Subject Tests (R. O’Callaghan, personal communication, December, 2008). The data used for this study included one SAT Questionnaire item on calculator access. This item asked students to indicate whether they had regular access to a calculator. The results proved contrary to this hypothesis: The percentage of students with higher Subject Test scores was slightly larger in the group reporting that they did not have regular access to a calculator. However, it should also be noted that the group reporting no access to calculators made up less than 1% of the sample.
Students reporting a best language other than English are particularly likely to show a discrepancy between their SAT and Subject Test scores. This result was also noted by Ramist, Lewis, and McCamley-Jenkins (2001) in their study based on data from the 1980s. Because students reporting a best language other than English tended to score higher on mathematics tests, the direction of the discrepancy varies depending on what tests are being compared. When Subject Test scores are compared to those of the SAT-CR, SAT-W, or the SAT average, students with score discrepancies tended to score higher on the Subject Tests; however, when Subject Test scores are compared to SAT-M, students whose best language was something other than English were more likely to score higher on the SAT. The discrepancy for students whose best language was something other than English is especially salient when the language Subject Tests are included in the Subject Test average.
In this study, a 100-point difference in scores was used to define a discrepancy between the SAT and a Subject Test. This criterion was chosen because this is the approximate standard deviation of scores in the College-Bound Seniors cohort for each Subject Test, and because it is easy to interpret. However, there are several other possible ways to define a discrepancy, and each would likely produce different results. One alternative method could involve use of the standard error of the difference (SED) as the basis for determining the discrepancy. Appendix A describes the SED and how it was used to justify the use of 100 points to define the discrepancy groups in this study. However, the score difference associated with 1.64 SED for each SAT–Subject Test pair could have also been chosen as the cutoff value for defining the discrepancy. This method would result in different discrepancy criteria for each SAT–Subject Test pair; for instance, a 100-point difference might be used to define a discrepancy
26 College Board Research Reports
Discrepant SAT/Subject Test Scores
for SAT-CR and Literature, while a 90-point difference might be used to define a discrepancy for SAT-M and Mathematics Level 1.8
A more important task than documenting the nature and direction of discrepancies between SAT and Subject Test scores for various subgroups is examining whether there is differential validity for predicting FYGPA for students with discrepant scores. Just as differential validity exists for certain demographic subgroups, this study shows that differential validity also occurs for students scoring substantially higher on one test compared to the other, and the pattern changes for different SAT–Subject Test pairs. Since SAT and Subject Test scores are commonly used in college admission, it is important to understand how to interpret the scores of students who score so differently on the two tests. And perhaps even more important than the small, significant differences in predictive validity across discrepancy groups is the evidence for differential prediction. Ignoring the SAT in college admission would result in a less accurate prediction of college performance, particularly for students who score substantially higher on one test over the other. If the Subject Tests were used without SAT scores, the college performance of those who score better on the Subject Tests would be overpredicted, and the college performance of those who score better on the SAT would be underpredicted. The same would be true if the SAT were used without the Subject
Tests: The college performance of those who score better on the SAT would be overpredicted, and the college performance of those who score better on the Subject Tests would be underpredicted. For the most accurate prediction of college success, both tests used along with other measures such as HSGPA substantially improve predictive accuracy of the other alone.
In this study, the predictive validity of the SAT and Subject Tests for students with discrepant scores was assessed using models that did not include HSGPA. Kobrin, Camara, and Milewski (2004) examined the relative utility and predictive validity of the SAT I and SAT II, taking HSGPA into account. They found that when HSGPA was used in combination with either the SAT I or SAT II to predict FYGPA, the SAT II and HSGPA combination provided a slightly stronger prediction than the SAT I and HSGPA combination for nearly all ethnic groups. Kobrin, Camara, and Milewski concluded that it is better from a purely predictive validity standpoint to consider all three measures when making admission decisions, although in some cases a second test may not have a practical impact on predictive accuracy. Future research should examine whether the differences in the predictive validity of the SAT and Subject Tests for students with and without discrepant scores persists when HSPGA is considered.
8. The authors would like to acknowledge Paul Sackett for suggesting this alternative approach.
Ignoring the SAT in
college admission
would result in a less
accurate prediction of
college performance,
particularly for
students who score
substantially higher
on one test over
the other.
27College Board Research Reports
Discrepant SAT/Subject Test Scores
One difficulty in interpreting the results of this study is that the comparisons of SAT and Subject Test scores are based on different groups of students, depending on what Subject Tests are taken. As shown in Table 2, there are different participation rates for the Subject Tests, as well as different participation by certain subgroups. While all students take the same three sections of the SAT, students select Subject Tests by choosing those on which they feel they have the best chance of scoring well. Thus, any conclusions about students with discrepant scores are bound to the particular group of students who took both tests, and cannot be generalized beyond that group. Nevertheless, this study provides evidence that sufficient numbers of students perform differently on the SAT and the Subject Tests to warrant separate consideration of these two test scores in college admission. Students should have multiple opportunities to demonstrate their knowledge and achievements, and colleges should make use of all of the information provided by students to make the best and most informed admission decisions.
Summary and ConclusionsThis study examined test scores of students who take the SAT and a Subject Test of comparable content to identify students who score substantially higher on one test over the other. Once identified, student demographics, high school course taking and performance, and test-taking behaviors were examined in association with the score discrepancies. Additionally, the predictive validity of SAT and Subject Test scores for predicting FYGPA was compared for students with discrepant scores. The findings with regard to the research questions posed at the beginning of this paper are described below.
1. Of the students who take the SAT and a Subject Test of similar content, how many students score substantially higher on one test compared to the other? What type of student is more likely to score substantially higher on the SAT compared to a Subject Test, and what type of student is more likely to score higher on a Subject Test compared to the SAT?
The percentage of students with discrepant SAT and Subject Test scores is small, especially for the tests that are most similar in content. In the total group, a larger percentage of students with discrepant scores scored higher on the SAT compared to the Subject Test. For the comparison of SAT-CR with the Subject Test in Literature, a slightly larger percentage of females scored higher on the Literature Subject Test compared to males, while a much larger proportion of males scored higher on SAT-CR. The percentage of females and males with discrepant scores on SAT-M and the mathematics Subject Tests were much more similar. Students with discrepant scores in each racial/ethnic group were also more likely to score higher on the SAT rather than on the Subject Test. When the language Subject Tests were included in the Subject Test average, a much larger percentage of Hispanic students, as well as students reporting a best language other than English, scored at least 100 points higher on the Subject Tests compared to their SAT average. When the language tests were excluded from the Subject Test average, more than one-third of students whose best language was something other than English still had a higher Subject Test average compared to their average SAT score.
28 College Board Research Reports
Discrepant SAT/Subject Test Scores
2. Are discrepancies between the SAT and Subject Tests more pronounced when students take the tests further apart?
There is not a strong association between the length of time between the two tests and the discrepancy, and there is no strong evidence of a practice effect (i.e., higher scores on the test that was taken second).
3. Are there academic behaviors that are associated with the size of the discrepancy?
Descriptive analyses of the academic behavior variables carried out in this study (course work, self-efficacy, and grades) show that in general, higher self-efficacy in writing and mathematics and higher self-reported average grades were both associated with larger positive discrepancy scores (i.e., a higher SAT). With regard to course taking, students reporting more mathematics course work tended to have a larger discrepancy in their scores on the SAT-M compared to the Mathematics Level 2 Subject Test, in favor of the SAT-M; the same pattern was found for English course taking and discrepancies between the SAT-CR and the Subject Test in Literature. However, no such trend was found for the SAT-M and the Mathematics Level 1 Subject Test.
4. Does the predictive validity of the SAT and Subject Tests for predicting FYGPA vary for students who score substantially higher on one test over the other?
There is a small amount of variation in the incremental validity (i.e., the additional variation of FYGPA accounted for) by each test over the other, as well as variation in the accuracy of prediction (i.e., residuals in the regression analysis) across the three discrepancy groups. For students with discrepant scores, the test on which students scored higher overpredicts FYGPA, and the test on which students scored lower underpredicts FYGPA.

29College Board Research Reports
Discrepant SAT/Subject Test Scores
ReferencesAgronow, S. & Rashid, M. (2007). Examining the predictive value of the SAT subject exams
in the prediction of first year UC GPA: A report to BOARS. Retrieved from http://www.universityofcalifornia.edu/senate/underreview/sw.rev.eligibility.02.08.pdf
Angoff, W. H. (1971). The College Board admissions testing program: A technical report on research and development activities relating to the Scholastic Aptitude Test and Achievement Tests. New York: The College Board.
Bridgeman, B., Burton, N., & Cline, F. (2001). Substituting SAT II: Subject Tests for SAT I: Reasoning Test: Impact on admitted class composition and quality (College Board Research Report No. 2001-3). New York: The College Board.
College Board. (2008). 2008 college-bound seniors total group profile report. New York: The College Board. Retrieved from http://professionals.collegeboard.com/profdownload/Total_Group_Report.pdf
Donlon, T. F. (1984). The College Board handbook for the Scholastic Aptitude Test and Achievement Tests. New York: The College Board.
Geiser, S., & Studley, R. (2001). Relative contribution of high school grades, SAT I and SAT II scores in predicting success at UC: Preliminary findings. University of California, Retrieved from http://www.ucop.edu/news/sat/research.html
Geiser, S., & Studley, R. (2004). UC and the SAT: Predictive validity and differential impact of the SAT I and SAT II at the University of California. In R. Zwick (Ed.), Rethinking the SAT: The future of standardized testing in university admissions (pp. 125–154). New York: Routledge.
Kobrin, J. L., Camara, W. J., & Milewski, G.B. (2002). The utility of the SAT I and SAT II for admissions decisions in California and the nation (College Board Research Report No. 2002-6). New York: The College Board.
Kobrin, J. L., Camara, W. J., & Milewski, G. B. (2004). The utility of the SAT I and SAT II for admissions decisions in California and the nation. In R. Zwick (Ed.), Rethinking the SAT: The future of standardized testing in university admissions (pp. 251–276). New York: Routledge.
Kobrin, J. L., Patterson, B. F., Shaw, E. J., Mattern, K. D., & Barbuti, S. M. (2008). Validity of the SAT for predicting first-year college grade point average (College Board Research Report No. 2008-5). New York: The College Board.
Mattimore, P. (2008, July 7). Standard to retain: SAT Subject Tests: Relatively sound predictor of performance in college should remain part of UC admissions policy. The Daily Californian. Retrieved from http://archive.dailycal.org/article/102044/standard_to_retain_sat_subject_tests
Ramist, L., Lewis, C., & McCamley-Jenkins, L. (2001). Using Achievement Tests/SAT II: Subject Tests to demonstrate achievement and predict college grades: Sex, language, ethnic, and parental education groups (College Board Research Report No. 2001-5). New York: The College Board.
Tran, V. (2008, March 24). The right exams for UC: For recent immigrants particularly, SAT subject tests can spotlight strengths. Los Angeles Times (March 24, 2008). Retrieved from http://www.latimes.com/news/opinion/la-oe-tran24mar24,0,2383414.story
Zwick, R. (2002). Fair game? The use of standardized admissions tests in higher education. New York: Routledge.

30 College Board Research Reports
Appendix
Appendix AA discrepancy score of at least 100 points was used to define the discrepancy groups because this is the approximate standard deviation of scores in the College-Bound Seniors cohort for each Subject Test. Because scores on any test are not perfect indicators of students’ ability and contain some error, the standard error of the difference (SED) was used to assess to what extent scores on the SAT and Subject Test must differ in order to reflect true differences in ability. The SED is based on the variance of each test (i.e., how spread out each set of scores are for the SAT section and the Subject Test) and the correlation between test scores for the sample of students who took both tests (i.e., how closely related the SAT section scores are to the scores on the Subject Test). If two test scores differ by at least 1.64 times the SED, it is unlikely that the difference between scores on the SAT and Subject Test could occur by chance; in other words, one can be confident that 90% of the time, a score difference of plus or minus 1.64 times the SED indicates a true difference in ability.
Table A1 shows the SED for a subset of the SAT–Subject Test paired comparisons. The column on the far right shows the effective significance level of a 100-point difference in scores, based on the SED. This column can be interpreted as the proportion of students who purely by chance are labeled as discrepant when their true ability on the construct underlying each test does not differ by 100 points. The lower the effective significance level, the more certain one can be that an observed difference of 100 points signals a true difference in the students’ true ability on each test. For the three most similar SAT–Subject Test pairs (SAT critical reading versus the Subject Test in Literature, SAT mathematics versus the Mathematics Level 1 Subject Test, and SAT mathematics versus the Mathematics Level 2 Subject Test), 1.64 times the SED is less than 100. This indicates that the choice of 100 points to define the discrepancy categories is appropriate (and on the conservative side) for a significance level of α = .10 for these three pairs of tests. On the other hand, for the other SAT–Subject Test pairs, 1.64 times the SED is greater than 100, indicating that more than 10% of the students categorized with discrepant scores may not in fact have a true difference in their ability. As shown in Table A1, the proportions of students who may have obtained 100-point differences in scores by chance are all less than .25 (or 25%), aside from the SAT-W versus the Subject Test in World History comparison, where the proportion was .283 (or 28.3%).
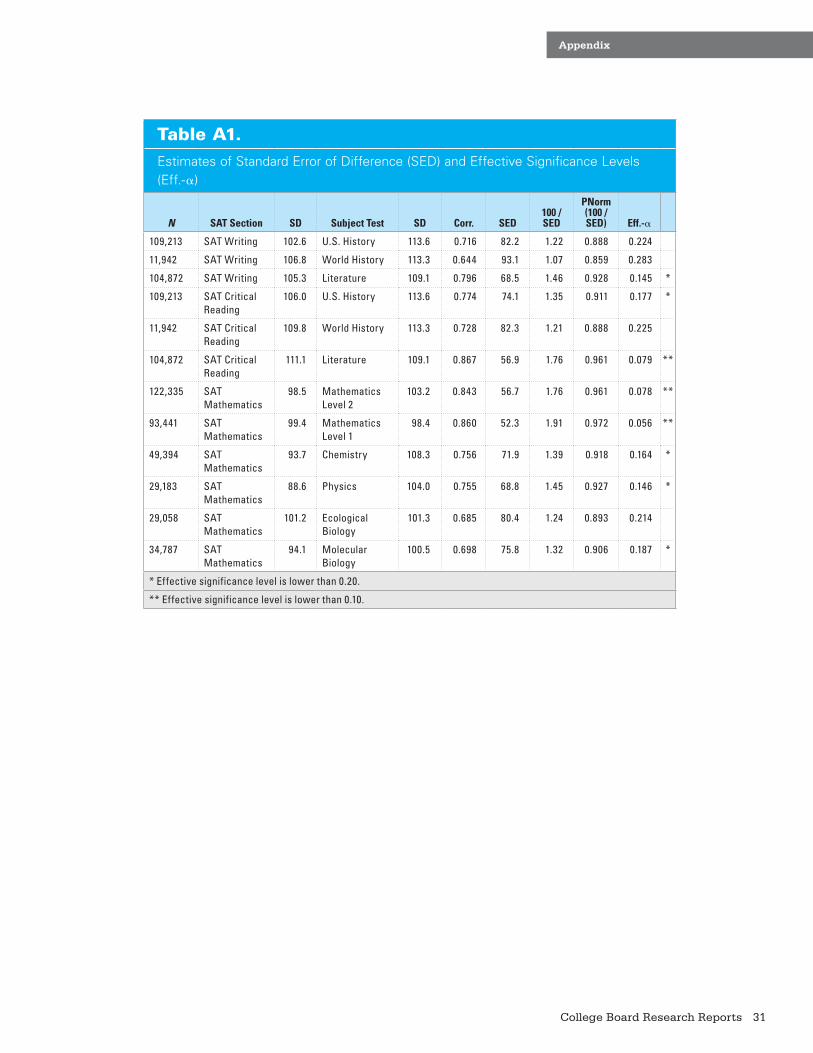
31College Board Research Reports
Appendix
Table A1. Estimates of Standard Error of Difference (SED) and Effective Significance Levels (Eff.-α)
N SAT Section SD Subject Test SD Corr. SED100 / SED
PNorm (100 / SED) Eff.-α
109,213 SAT Writing 102.6 U.S. History 113.6 0.716 82.2 1.22 0.888 0.224
11,942 SAT Writing 106.8 World History 113.3 0.644 93.1 1.07 0.859 0.283
104,872 SAT Writing 105.3 Literature 109.1 0.796 68.5 1.46 0.928 0.145 *
109,213 SAT Critical Reading
106.0 U.S. History 113.6 0.774 74.1 1.35 0.911 0.177 *
11,942 SAT Critical Reading
109.8 World History 113.3 0.728 82.3 1.21 0.888 0.225
104,872 SAT Critical Reading
111.1 Literature 109.1 0.867 56.9 1.76 0.961 0.079 **
122,335 SAT Mathematics
98.5 Mathematics Level 2
103.2 0.843 56.7 1.76 0.961 0.078 **
93,441 SAT Mathematics
99.4 Mathematics Level 1
98.4 0.860 52.3 1.91 0.972 0.056 **
49,394 SAT Mathematics
93.7 Chemistry 108.3 0.756 71.9 1.39 0.918 0.164 *
29,183 SAT Mathematics
88.6 Physics 104.0 0.755 68.8 1.45 0.927 0.146 *
29,058 SAT Mathematics
101.2 Ecological Biology
101.3 0.685 80.4 1.24 0.893 0.214
34,787 SAT Mathematics
94.1 Molecular Biology
100.5 0.698 75.8 1.32 0.906 0.187 *
* Effective significance level is lower than 0.20.
** Effective significance level is lower than 0.10.

VALIDITY
• Providingdata-basedsolutionstoimportanteducationalproblemsandquestions
• Applyingscientificproceduresandresearchtoinformourwork
• Designingandevaluatingimprovementstocurrentassessmentsanddevelopingnewassessmentsaswellaseducationaltoolstoensurethehighesttechnicalstandards
• Analyzingandresolvingcriticalissuesforallprograms,includingAP®,SAT®,PSAT/NMSQT®
• Developingstandardsandconductingcollegeandcareerreadinessalignmentstudies
• Publishingfindingsandpresentingourworkatkeyscientificandeducationconferences
• Generatingnewknowledgeandforward-thinkingideaswithahighlytrainedandcredentialedstaff
Admission
Alignment
Evaluation
Fairness
Measurement
Research
Trends
Validity
Our work focuses on the following areas
Follow us online: collegeboard.org/research
The Research & Development department actively supports the
College Board’s mission by:

11b-4951