the school readiness to learn project in … · the school readiness to learn project in ... –...
TRANSCRIPT
THE SCHOOL READINESS THE SCHOOL READINESS TO LEARN PROJECT in TO LEARN PROJECT in
CANADACANADA
CANADIAN CENTRE FOR STUDIES OF CANADIAN CENTRE FOR STUDIES OF CHILDREN AT RISKCHILDREN AT RISK
McMASTER McMASTER UNIVERSITYUNIVERSITY
D.R. D.R. OffordOffordM.M. JanusJanus
THE IMPORTANCE OF THE IMPORTANCE OF
KEEPING SCOREKEEPING SCORE

Readiness to learn concept
Children are born ready to learn: the neurosystem is pre-programmed to develop
various skills and neuropathways, depending on the experience it receives.
Readiness for schoolSchool readiness (to learn): refers to the child's ability to meet the task
demands of school, such as being cooperative and sitting quietly and listening to the teacher, and to benefit from the educational activities that are provided by the school.
NAMING THE INSTRUMENT
Looking forward:– Readiness to Learn Instrument
Looking backward:– Early Development Instrument
Purposes of the EDI
Report on populations of children in different communitiesMonitor populations of children over timePredict how children will do in elementary school
Characteristics of the EDI
Population LevelFeasible, Acceptable, Reasonably PricedInformant is the TeacherPsychometrically Sound

Steps in developing the EDIConsultations with teachers and educatorsPre-testing for wordingPilot testing: test-retest, external validity (interviews with parents, direct language tests of children)Inter-rater reliabilityCultural validationContinued validity monitoring
Five domains of the readiness to learn
Physical health and well-beingSocial competenceEmotional maturityLanguage and cognitive developmentCommunication skills and general knowledge
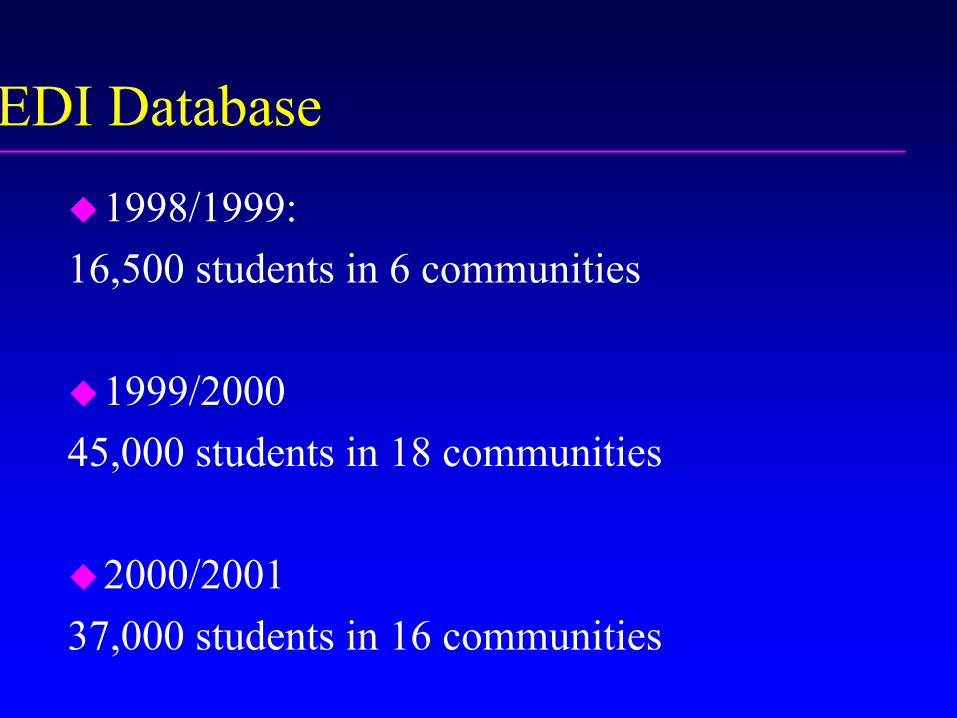
EDI Database1998/1999:
16,500 students in 6 communities
1999/200045,000 students in 18 communities
2000/200137,000 students in 16 communities

Further TasksMonitor the EDI in communitiesDevelop more precise interventions for communities and schools for different patterns of scale scoresUtilize additional data for ensuring the psychometric properties of the measureLearn more about how to make use of the information from the EDI, with other community data, to improve the readiness to learn scores of children in that community
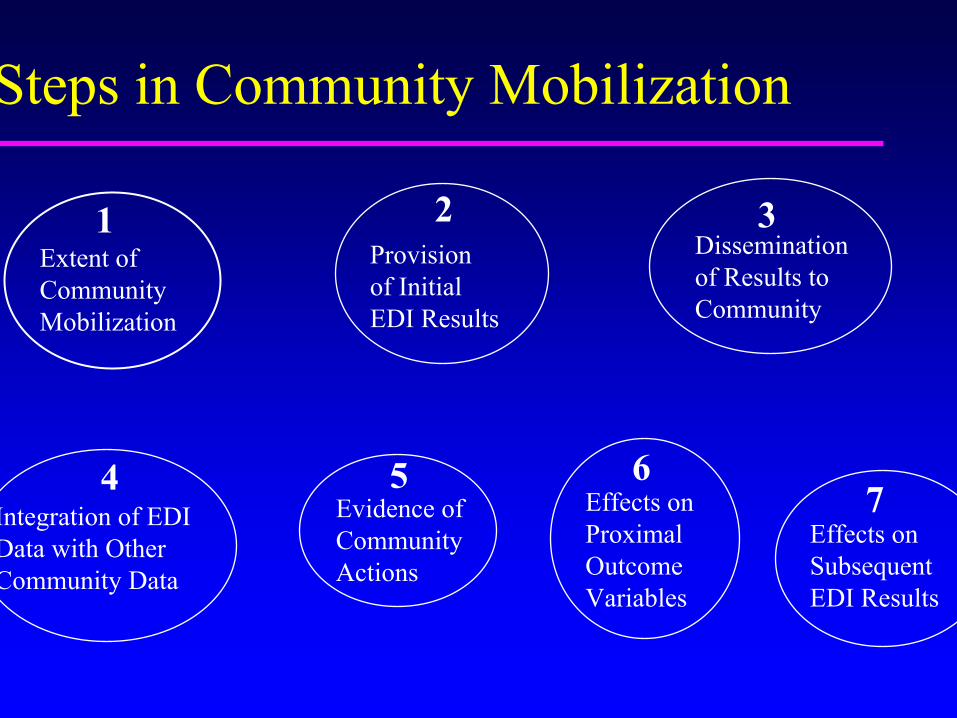
Steps in Community Mobilization
1Extent of CommunityMobilization
Provisionof InitialEDI Results
2Dissemination of Results toCommunity
3
Integration of EDIData with OtherCommunity Data
4 5Evidence ofCommunityActions
Effects onProximal OutcomeVariables
6
Effects onSubsequentEDI Results
7
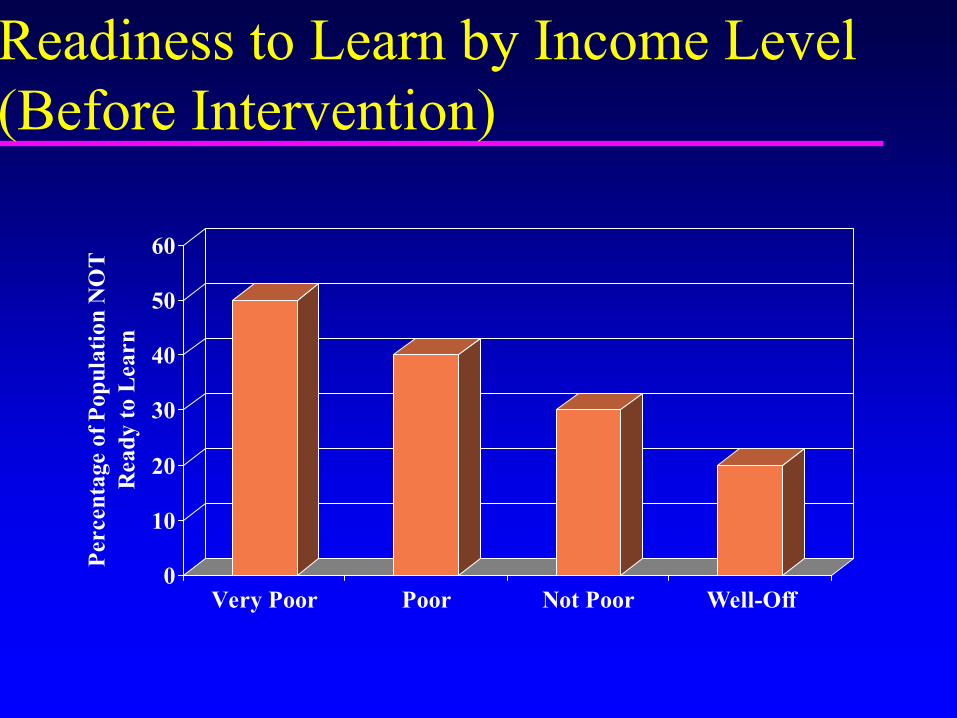
Readiness to Learn by Income Level (Before Intervention)
0
10
20
30
40
50
60
Perc
enta
ge o
f Pop
ulat
ion
NO
T R
eady
to L
earn
Very Poor Poor Not Poor Well-Off

Readiness to Learn by Income Level (After Intervention)
0
10
20
30
40
50
60
Perc
enta
ge o
f Pop
ulat
ion
NO
T R
eady
to L
earn
Very Poor Poor Not Poor Well-Off

Reliability of the EDIInternal reliability of the scales (Cronbach alpha): range 0.84-0.96Test-retest reliability (Pearson r): range 0.63-0.93Inter-rater reliability (Pearson r):
teacher-parent: 0.36-0.66school teacher-child care teacher:0.52-0.80
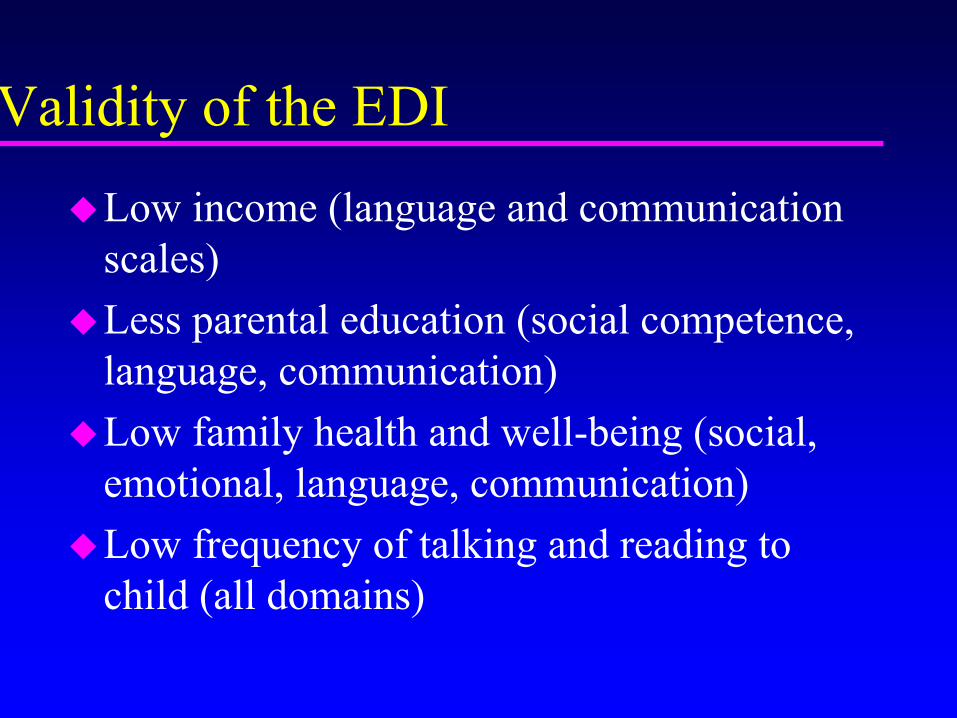
Validity of the EDILow income (language and communication scales)Less parental education (social competence, language, communication)Low family health and well-being (social, emotional, language, communication)Low frequency of talking and reading to child (all domains)
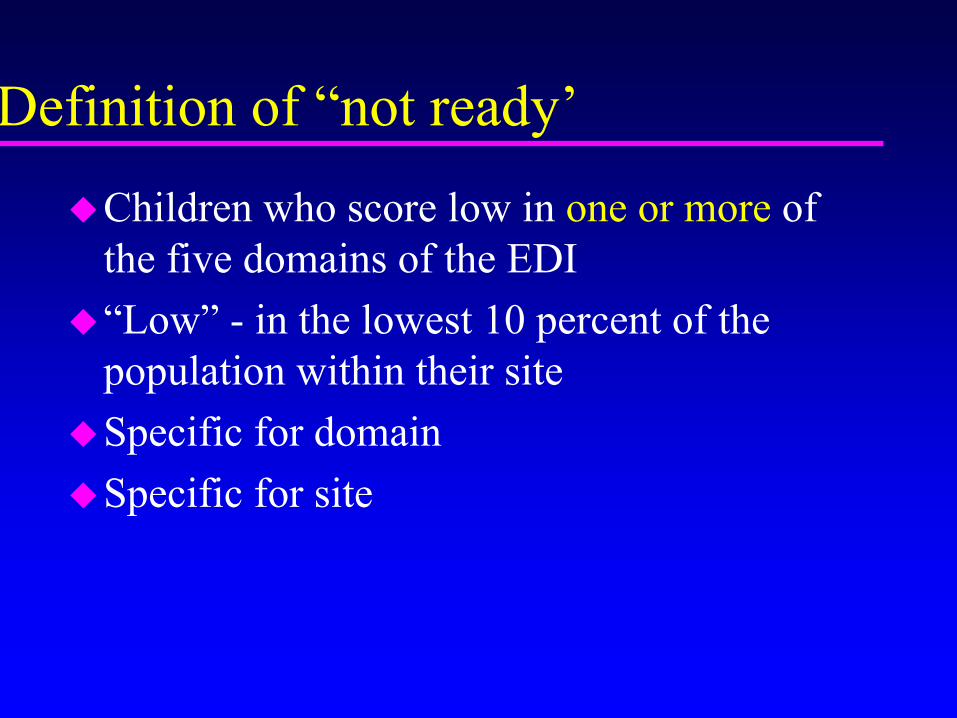
Definition of “not ready’Children who score low in one or more of the five domains of the EDI“Low” - in the lowest 10 percent of the population within their site Specific for domain Specific for site
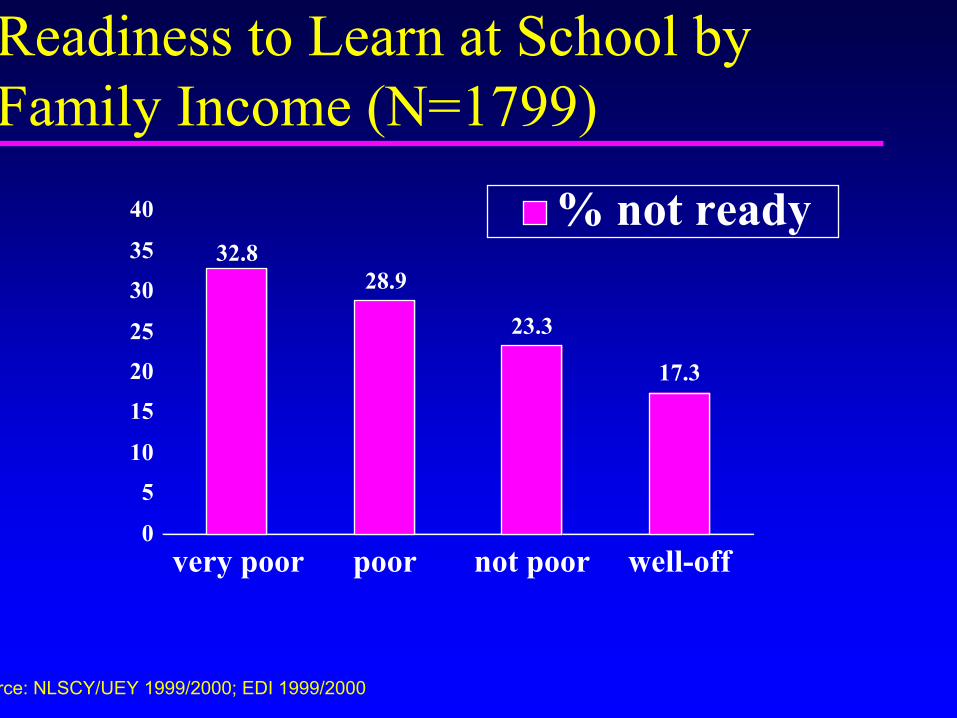
Readiness to Learn at School by Family Income (N=1799)
32.828.9
23.3
17.3
0
5
10
15
20
25
30
35
40
very poor poor not poor well-off
% not ready
Source: NLSCY/UEY 1999/2000; EDI 1999/2000
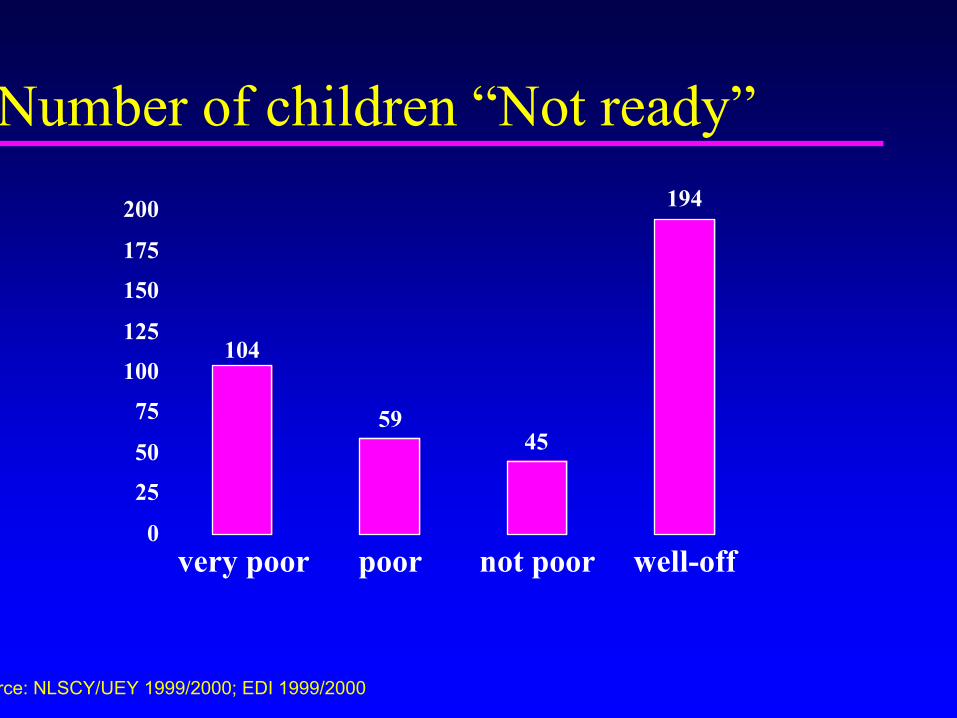
Number of children “Not ready”
104
5945
194
0
25
50
75
100
125
150
175
200
very poor poor not poor well-off
Source: NLSCY/UEY 1999/2000; EDI 1999/2000

Information from the EDI results
Means, ranges, percentiles of the EDI scoresNumbers/percentages of children with increased needsGlobal picture - may not be applicable to all areas
Macro level: Community, City, Province
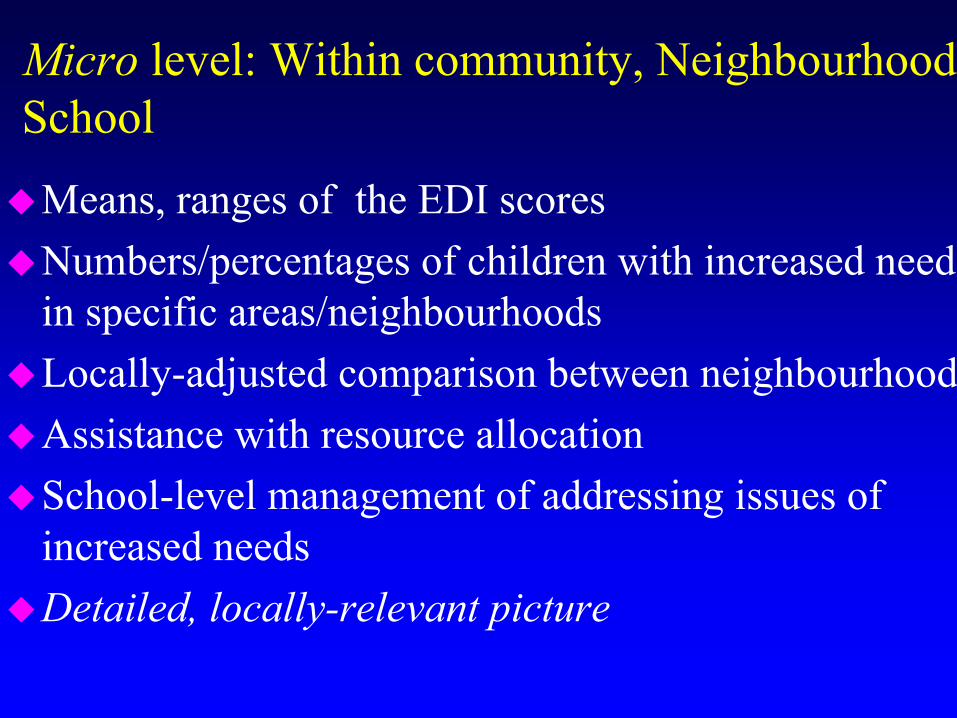
Means, ranges of the EDI scoresNumbers/percentages of children with increased needs in specific areas/neighbourhoodsLocally-adjusted comparison between neighbourhoodsAssistance with resource allocationSchool-level management of addressing issues of increased needsDetailed, locally-relevant picture
Micro level: Within community, Neighbourhood, School
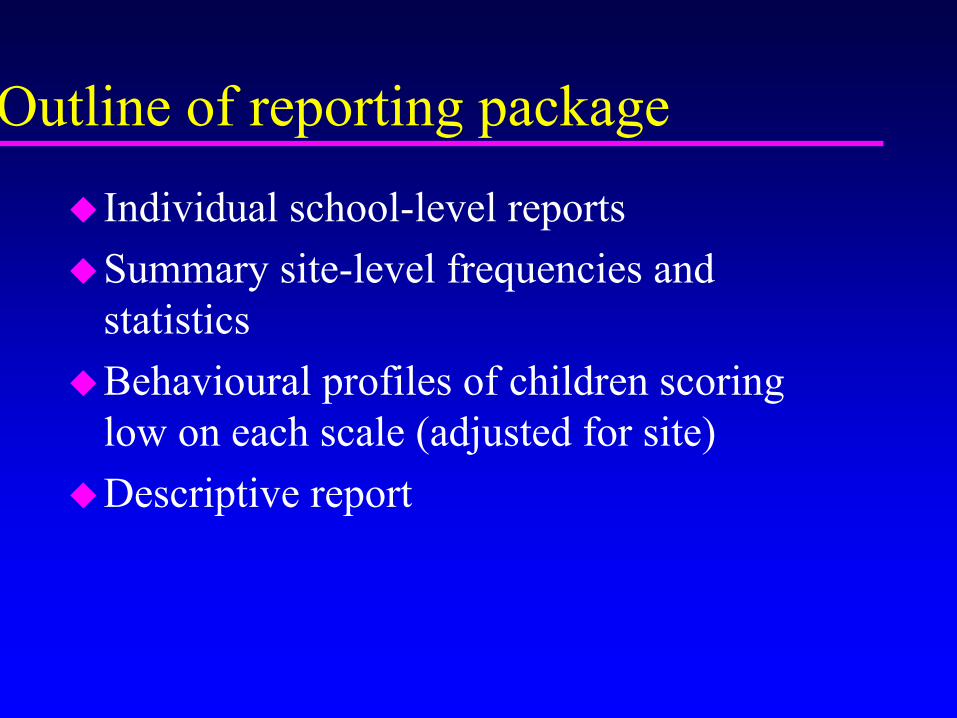
Outline of reporting packageIndividual school-level reportsSummary site-level frequencies and statisticsBehavioural profiles of children scoring low on each scale (adjusted for site)Descriptive report
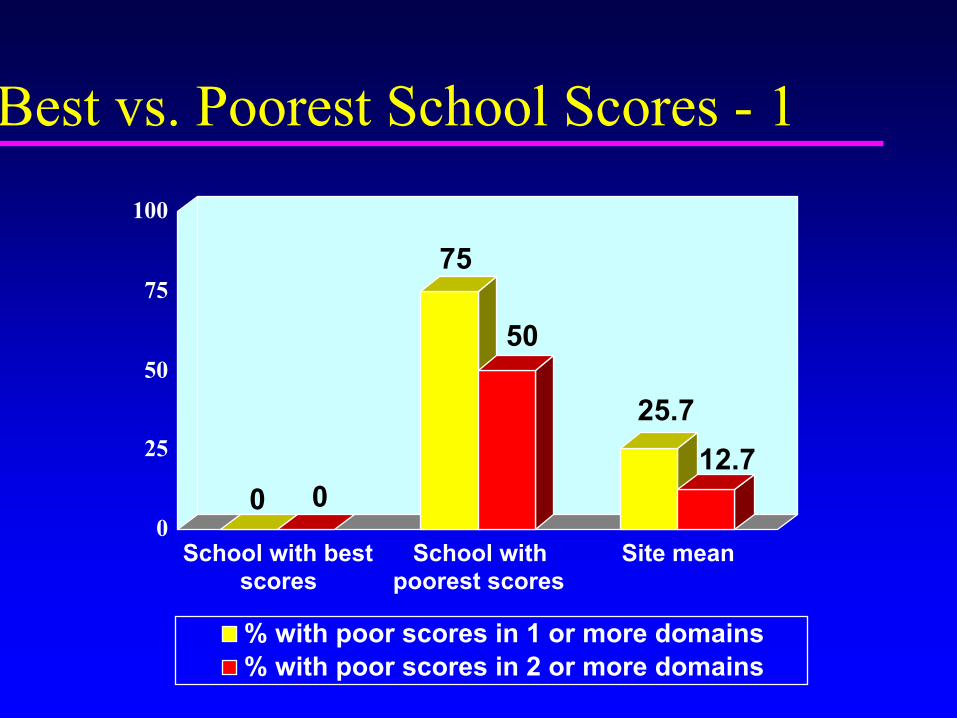
Best vs. Poorest School Scores - 1
0 0
75
50
25.712.7
0
25
50
75
100
School with bestscores
School withpoorest scores
Site mean
% with poor scores in 1 or more domains% with poor scores in 2 or more domains

EDI results and community services
0
50
100
School 1 School 2
1998/99 1999/2000% with low scores in 1 or more domains
Day Care Yes < 1 km Yes between 1 and 2 kmFamily Resources Yes < 1 km NoParenting Classes Yes < 1 km NoLibrary, Literacy Prgm Yes < 1 km Yes < 1 kmToy Library Yes < 1 km Yes between 1 and 2 kmSocial Index 2 5.5(combination of 9 risk factors, higher indicates more risk)Source: CCSCR, HRDC
Neighbourhood-level analysesBased on postal code aggregationsEDI scores are aggregated for a neighbourhood/Census Tract area Neighbourhood may represent 10 to 200+ 5-year-olds’ EDI scores Related to sociodemographic characteristics based on census data for the neighbourhood
Neighbourhoods “at risk” for low readiness to learn at school
EDI neighbourhood means lower than site means on at least three domains
orMore than 20% “Not ready” children
Neighbourhoods “at risk” vs. those not at risk
Lower incomeHigher % of lone-parent families Higher % of low-income familiesHigher % of families who moved within the last year
Site 1
Source: CCSCR/Ontario Children’s Secretariat 1999/2000
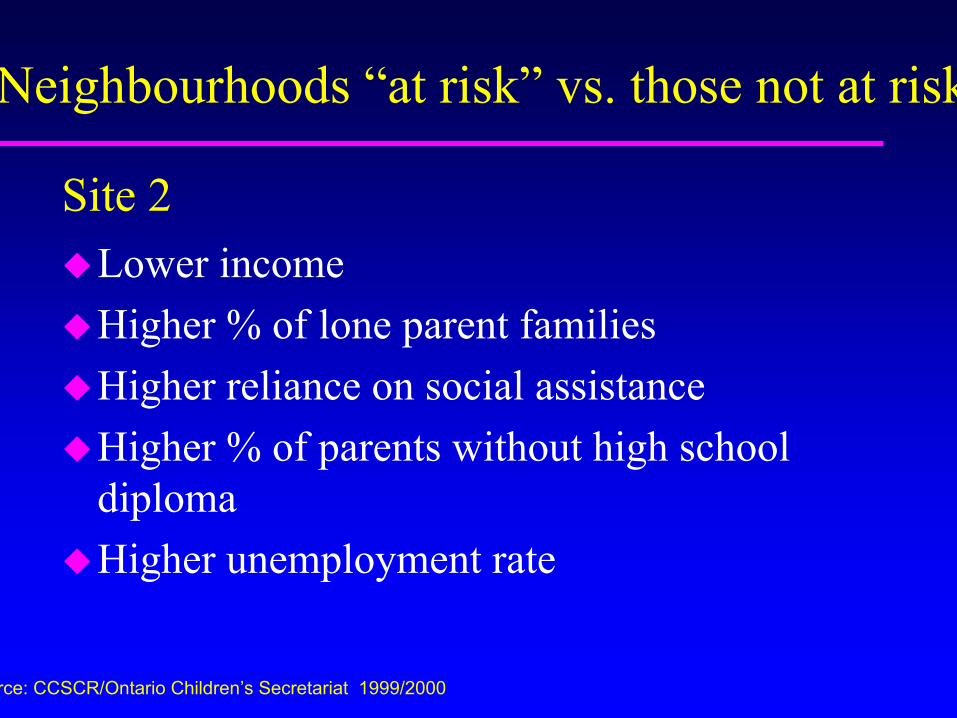
Neighbourhoods “at risk” vs. those not at risk
Lower incomeHigher % of lone parent familiesHigher reliance on social assistanceHigher % of parents without high school diplomaHigher unemployment rate
Site 2
Source: CCSCR/Ontario Children’s Secretariat 1999/2000
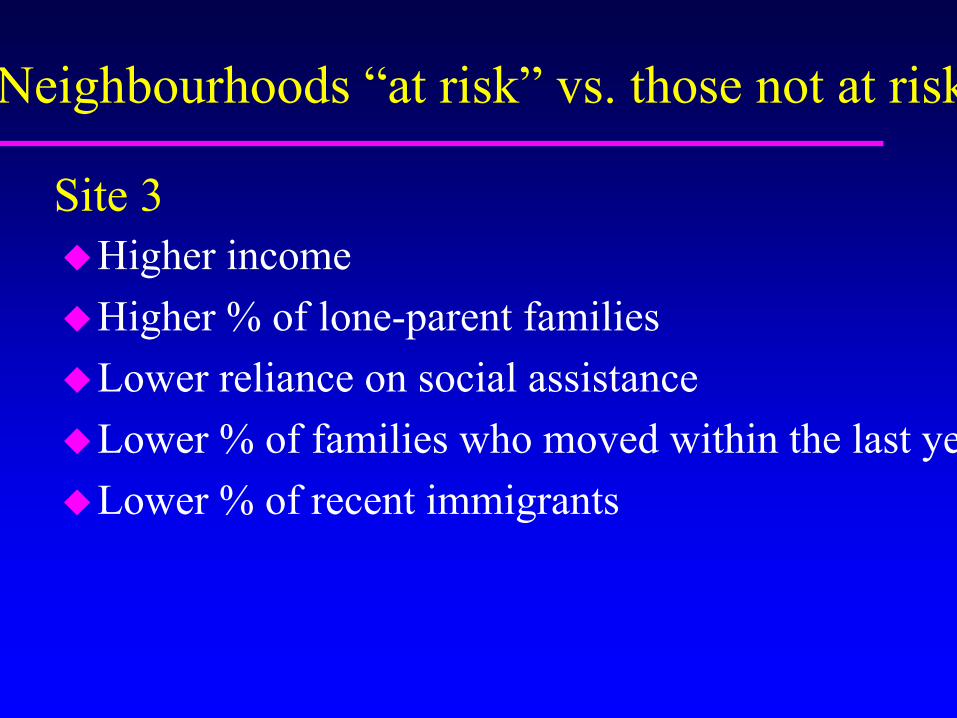
Neighbourhoods “at risk” vs. those not at risk
Higher incomeHigher % of lone-parent familiesLower reliance on social assistanceLower % of families who moved within the last yearLower % of recent immigrants
Site 3