the school report card - montville township school … · the school report card looking back...
TRANSCRIPT


THE SCHOOL REPORT CARD
LOOKING BACK
REVIEWING OUR DATA

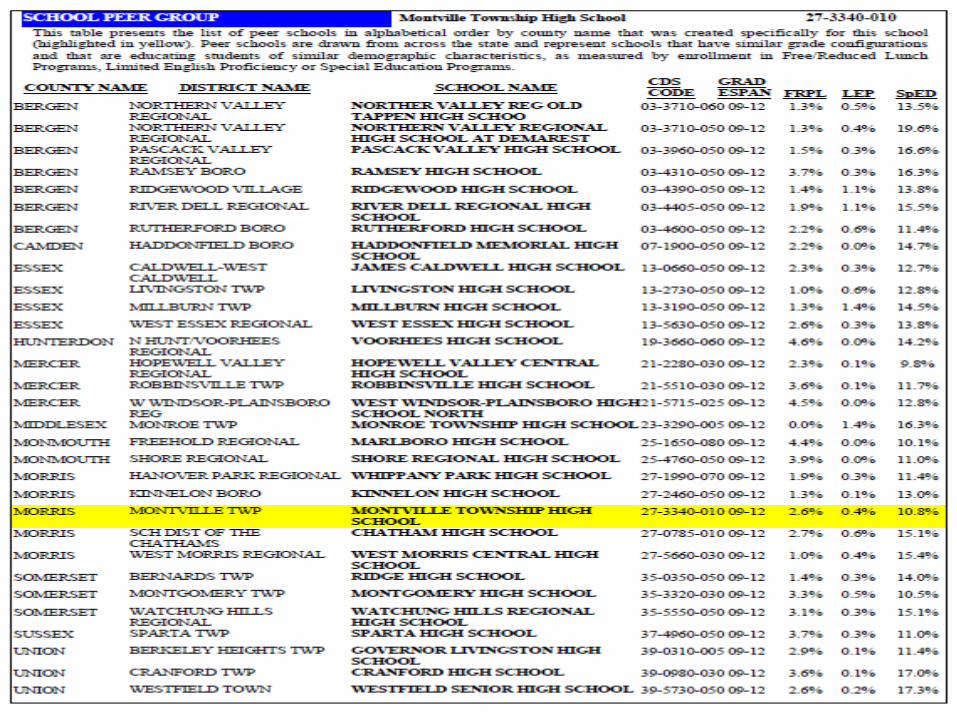
• Compared to District Factor Groups and the State
SCHOOL REPORT CARD DATA
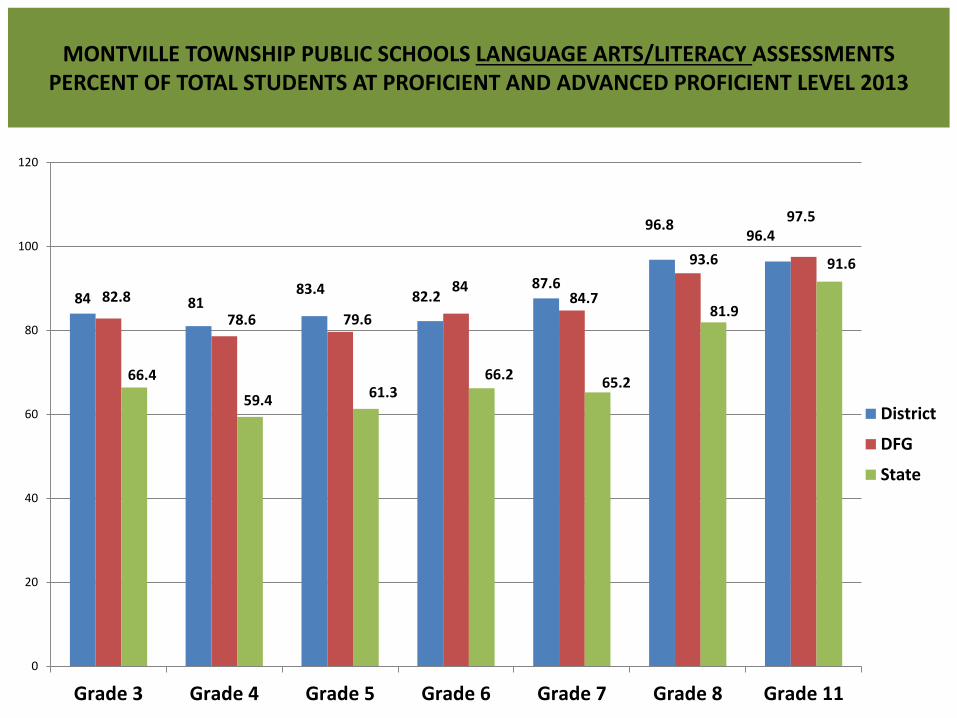
MONTVILLE TOWNSHIP PUBLIC SCHOOLS LANGUAGE ARTS/LITERACY ASSESSMENTS PERCENT OF TOTAL STUDENTS AT PROFICIENT AND ADVANCED PROFICIENT LEVEL 2013
84 8183.4 82.2
87.6
96.896.4
82.8
78.6 79.6
8484.7
93.6
97.5
66.4
59.4 61.366.2
65.2
81.9
91.6
0
20
40
60
80
100
120
Grade 3 Grade 4 Grade 5 Grade 6 Grade 7 Grade 8 Grade 11
District
DFG
State

MONTVILLE TOWNSHIP PUBLIC SCHOOLS MATHEMATICS ASSESSMENTS PERCENT OF TOTAL STUDENTS AT PROFICIENT AND ADVANCED PROFICIENT LEVEL
2013
91.1
95.3 93.8
86.982.2
88.891.4
90.7 91 91.790.3
81.2
84.991.4
77.7 78.379.9 78.9
63.5
7879.7
0
20
40
60
80
100
120
Grade 3 Grade 4 Grade 5 Grade 6 Grade 7 Grade 8 Grade 11
District
DFG
State

MONTVILLE TOWNSHIP SAT REASONING TEST
MONTVILLE TOWNSHIP STATE NATION
CRITICAL READING 538 499 496
MATHEMATICS 570 522 514
WRITING 546 500 488
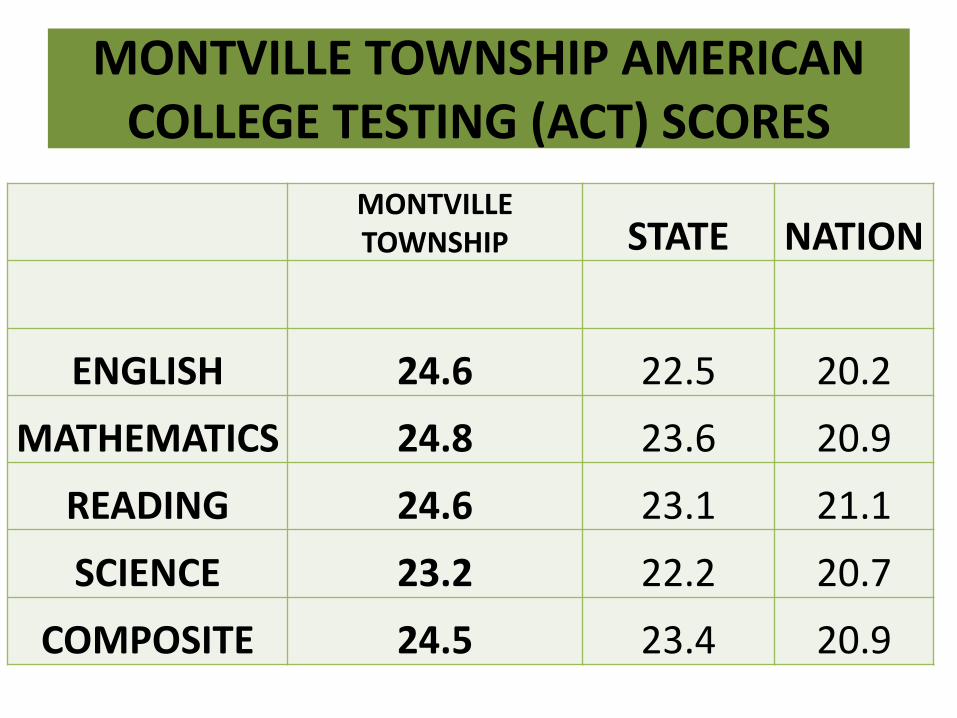
MONTVILLE TOWNSHIP AMERICAN COLLEGE TESTING (ACT) SCORES
MONTVILLE TOWNSHIP STATE NATION
ENGLISH 24.6 22.5 20.2
MATHEMATICS 24.8 23.6 20.9
READING 24.6 23.1 21.1
SCIENCE 23.2 22.2 20.7
COMPOSITE 24.5 23.4 20.9
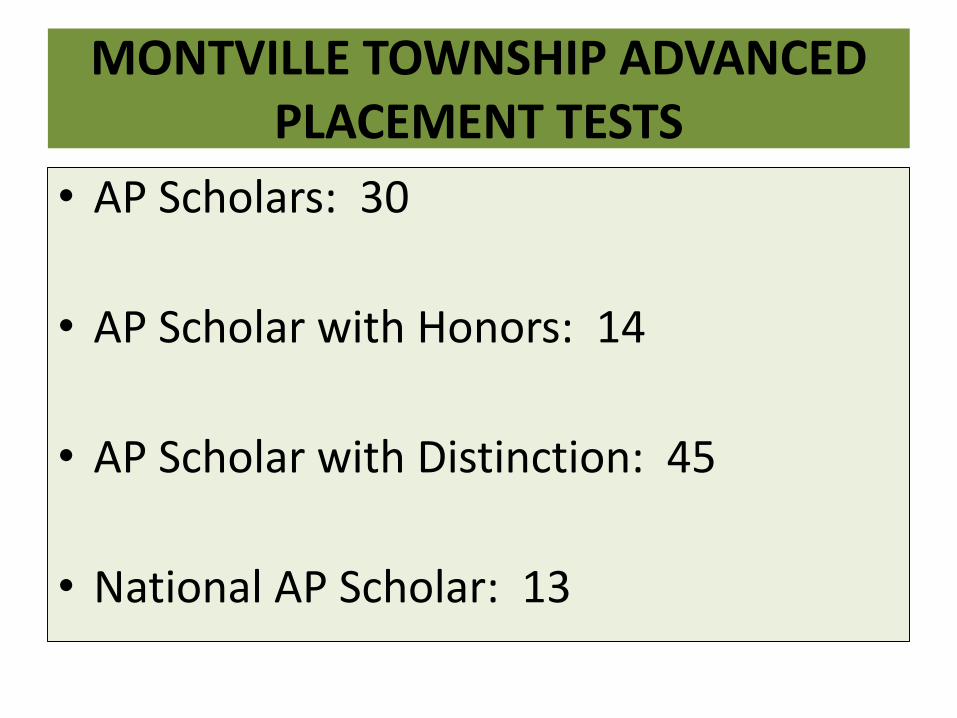
MONTVILLE TOWNSHIP ADVANCED PLACEMENT TESTS
• AP Scholars: 30
• AP Scholar with Honors: 14
• AP Scholar with Distinction: 45
• National AP Scholar: 13

MONTVILLE TOWNSHIP ADVANCED PLACEMENT TESTS
AP EXAMS WERE GIVEN IN 24 SUBJECTS
88.5% SCORED 3 OR HIGHER (A score of 3-5 is
considered passing and may be considered for college credit)
• 125 students received a score of 5
• 188 students received a score of 4
• 131 students received a score of 3

STUDENT ACCOMPLISHMENTS
• Forensics team ranked 2nd in NJ
• 40 students competed at DECA Nationals
• The Marching Band placed 3rd in NJ and 5th in the nation
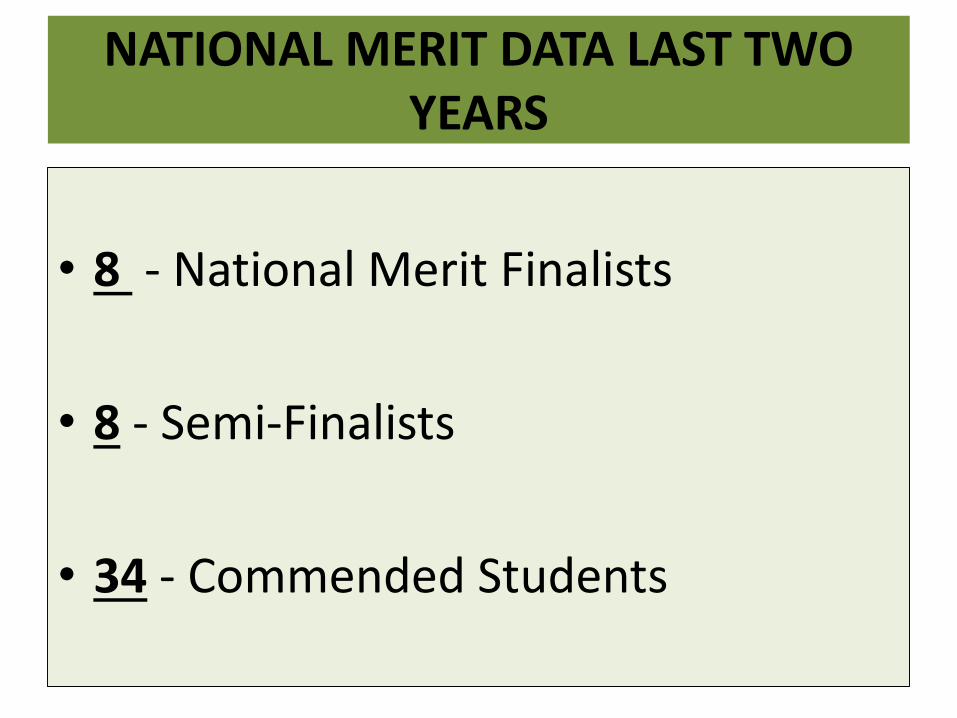
NATIONAL MERIT DATA LAST TWO YEARS
• 8 - National Merit Finalists
• 8 - Semi-Finalists
• 34 - Commended Students
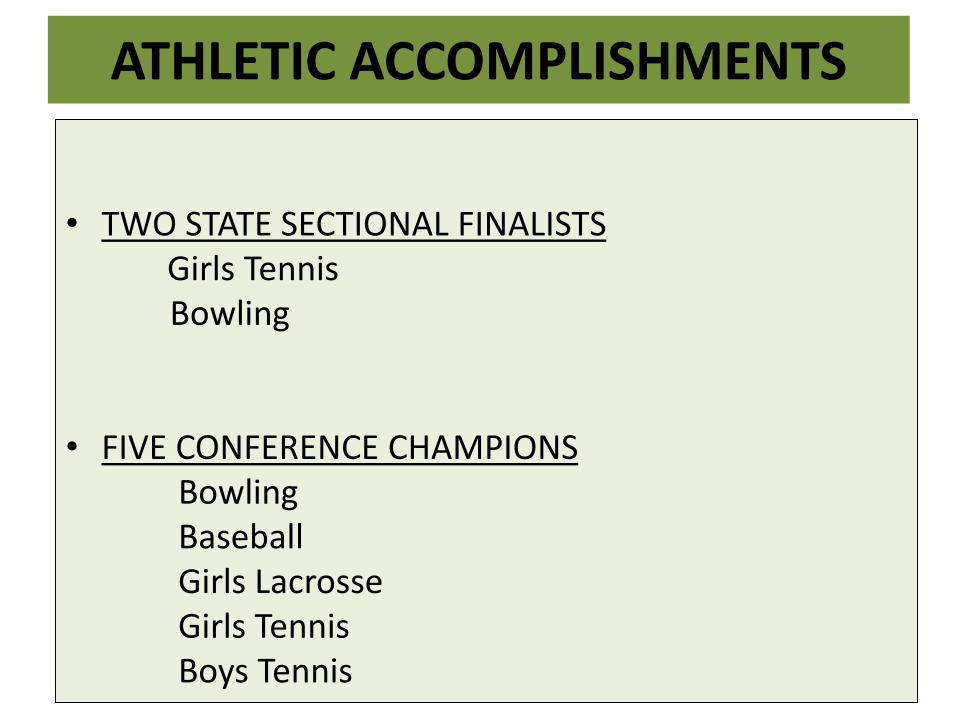
• TWO STATE SECTIONAL FINALISTSGirls TennisBowling
• FIVE CONFERENCE CHAMPIONSBowlingBaseballGirls LacrosseGirls TennisBoys Tennis
ATHLETIC ACCOMPLISHMENTS

• 106 ATHLETES RECEIVED ALL CONFERENCE RECOGNITION
• 34 ATHLETES RECEIVED ALL COUNTY RECOGNITION
• 7 ATHLETES RECEIVED ALL-STATE RECOGNITION
• 12 INDIVIDUAL SCHOOL RECORDS WERE SET BY OUR ATHLETES
ATHLETIC ACCOMPLISHMENTS

CLASS OF 2013 GRADUATES
96% Attended College/University
• 4 Yr. College-89%• 2 Yr. College- 7%• Other – 4%–Career Schools–Military–Employment–Gap Year

SAMPLE OF THE COLLEGE ACCEPTANCES 2010-2013
Boston College Boston University BrandeisCal Tech College of NJ Carnegie MellonColumbia Bentley CornellDartmouth Fordham GWUGeorgetown Harvard LehighU MASS Michigan Chestnut HillNYU Northwestern American Penn State Penn PrincetonRPI Rochester RutgersSouthern Cal Syracuse TrinityUC Berkeley West Point U MarylandVillanova Roger Williams U TexasUVA Vanderbilt William and MaryU of Chicago Hamilton Notre Dame

WHAT NOW?
• Overall, our students outperform their counterparts from districts that are similar to Montville Township
• Continue professional development focused on differentiating instructional practice
• Align the CCC Standards, update curriculum materials, monitor instruction to maximize teacher effectiveness
• Continue the implementation of the new Teacher and Principal evaluation systems

APPENDIX
2013 NJASK Language Arts 2013 NJASK Math
Total Students Prof. and Advanced Total Students Prof. and Advanced
District DFG State District DFG State
Grade 3 84 82.8 66.4 Grade 3 91.1 90.7 77.7
Grade 4 81 78.6 59.4 Grade 4 95.3 91 78.3
Grade 5 83.4 79.6 61.3 Grade 5 93.8 91.7 79.9
Grade 6 82.2 84 66.2 Grade 6 86.9 90.3 78.9
Grade 7 87.6 84.7 65.2 Grade 7 82.2 81.2 63.5
Grade 8 96.8 93.6 81.9 Grade 8 88.8 84.9 78
Grade 11 96.4 97.5 91.6 Grade 11 91.4 91.4 79.7

WHAT ARE THE SCHOOL
PERFORMANCE REPORTS?

WHAT IS DIFFERENT?
OLD NEW
Report Card Performance Reports
District comparison School comparison
District Factor Group Peer group (30)
Comparison to state Comparison to state
Limited data Large amount of data

WHAT IS THE MOTIVATION?
• NCLB
• The Economy
• International competition
• Race to the Top Funding
• Interest in characterizing a significant number of schools as “lagging” behind their peers???

SIGNIFICANT QUOTES FROM THE NJ DEPARTMENT OF EDUCATION
•“The idea, according to the state, is to encourage all schools to improve.”
• "Every school in New Jersey has some area that needs improvement," the state said in a document prepared to explain the new reports. "The performance reports ... will assist every school in taking the next step for improvement."

THOUGHTS FROM THE NJ STATE EDUCATION DEPARTMENT
• Present assessments do not differentiate
• 2011-2017 – Target Years – NCLB Waiver
• The reports create some seeming contradictions. A high school may hit 100 percent of stated targets —but be placed in the 44th percentile among its peers in area such as "Graduation and Post Secondary."

THOUGHTS FROM THE MONTVILLE TOWNSHIP SUPERINTENDENT
• Uneven success of NCLB leads to change
• New initiative is untried
• Data does not lead us to more effective instructional practices
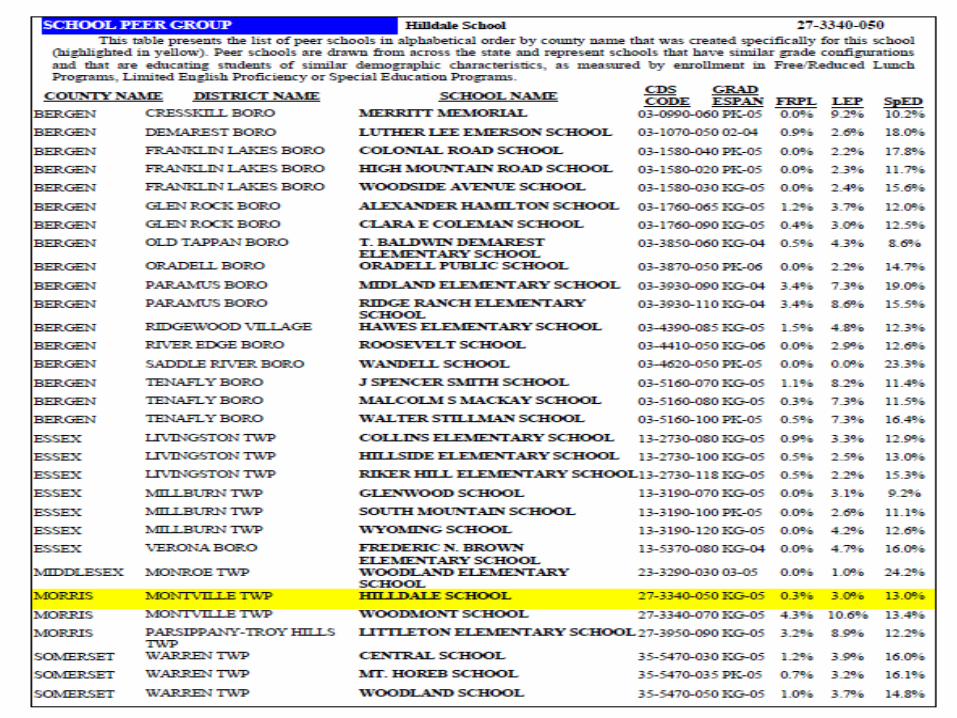
• Peer groups recalculated yearly
– % free and reduced lunch
– % LEP
– % Special Education
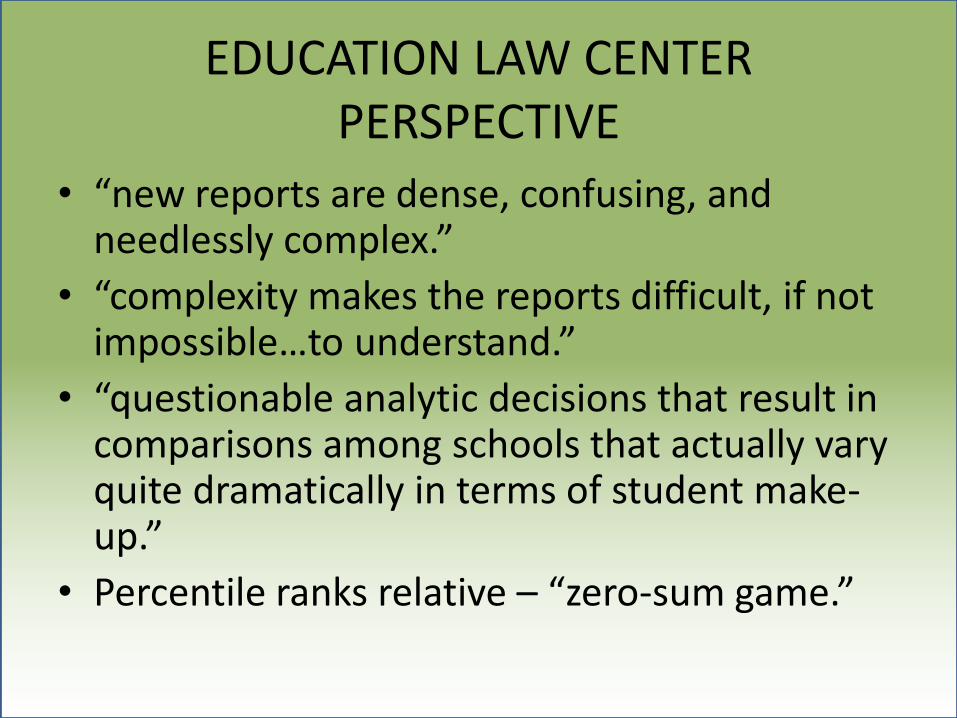
EDUCATION LAW CENTERPERSPECTIVE
• “new reports are dense, confusing, and needlessly complex.”
• “complexity makes the reports difficult, if not impossible…to understand.”
• “questionable analytic decisions that result in comparisons among schools that actually vary quite dramatically in terms of student make-up.”
• Percentile ranks relative – “zero-sum game.”
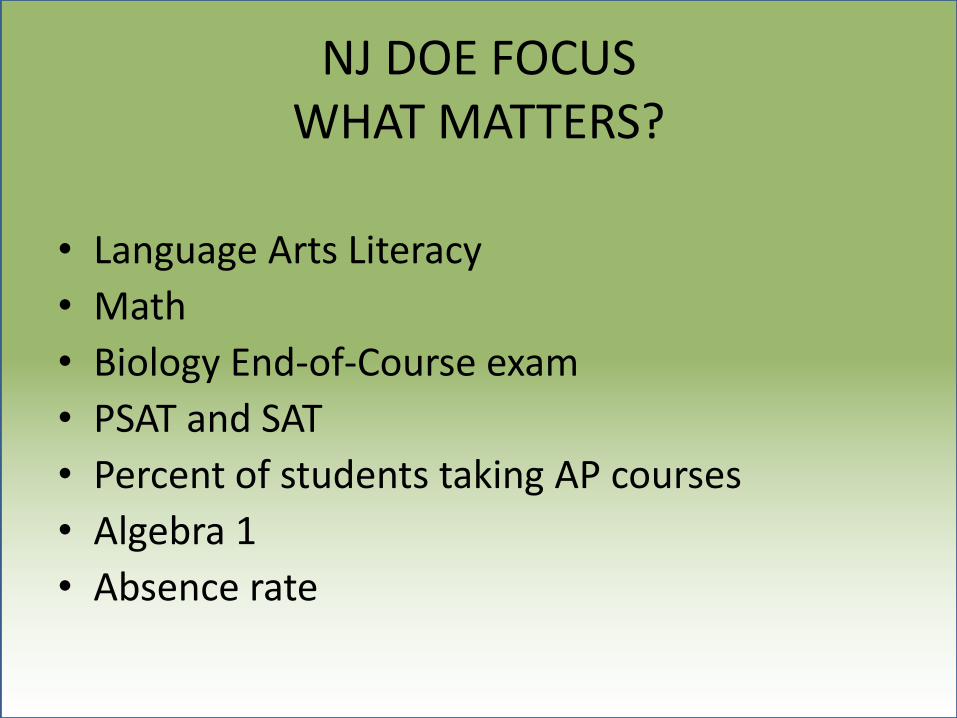
NJ DOE FOCUSWHAT MATTERS?
• Language Arts Literacy
• Math
• Biology End-of-Course exam
• PSAT and SAT
• Percent of students taking AP courses
• Algebra 1
• Absence rate

PERFORMANCE AREAS
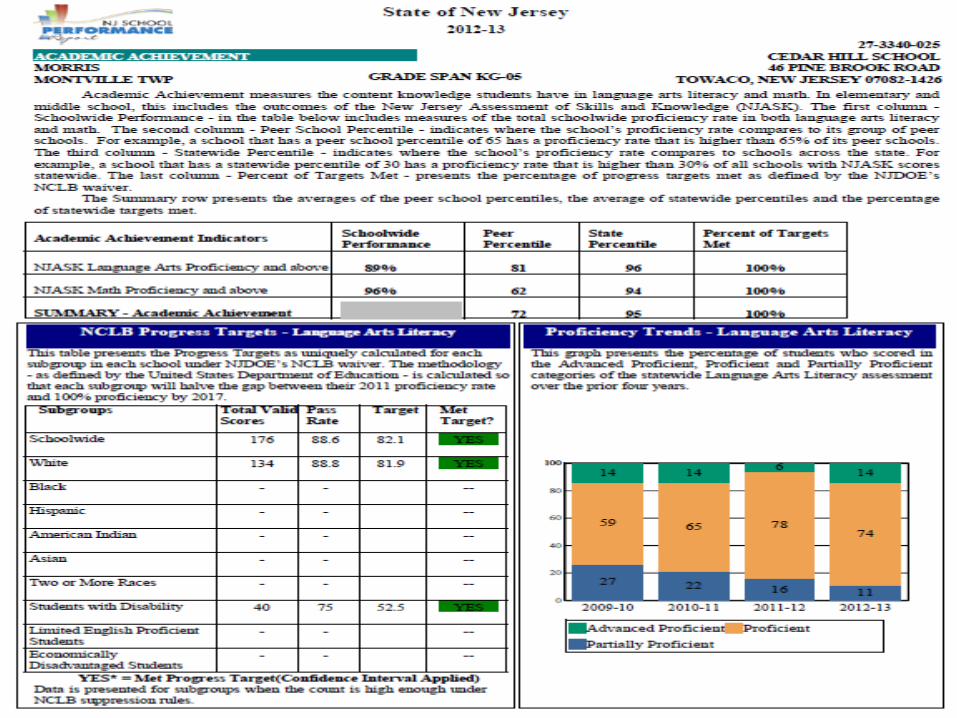
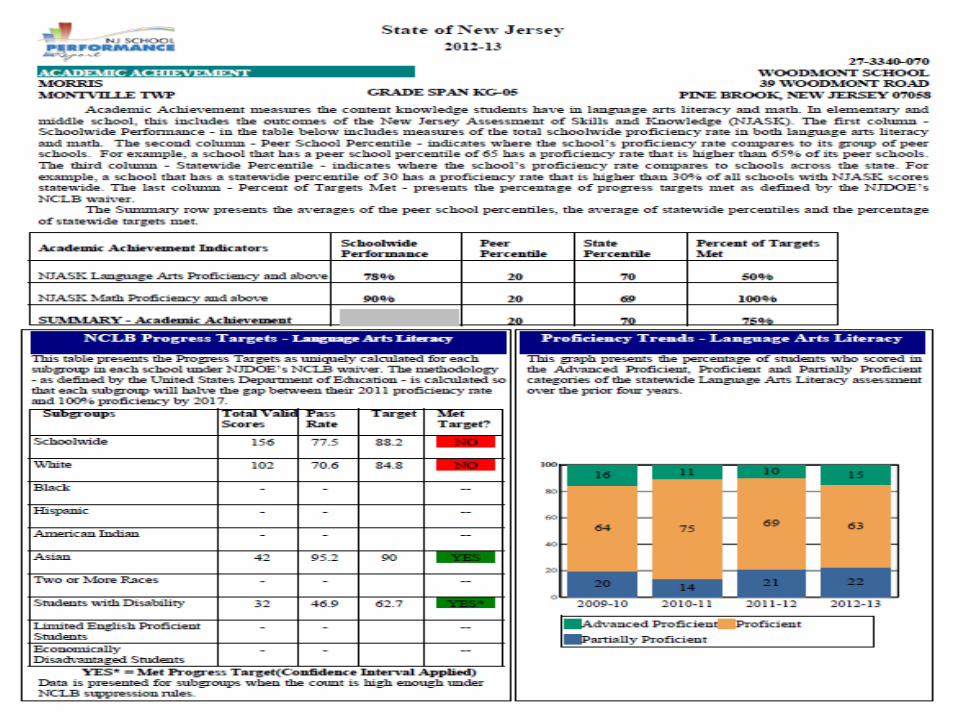
• Academic Achievement
• College and Career Readiness
• Graduation and Post-Secondary – high school
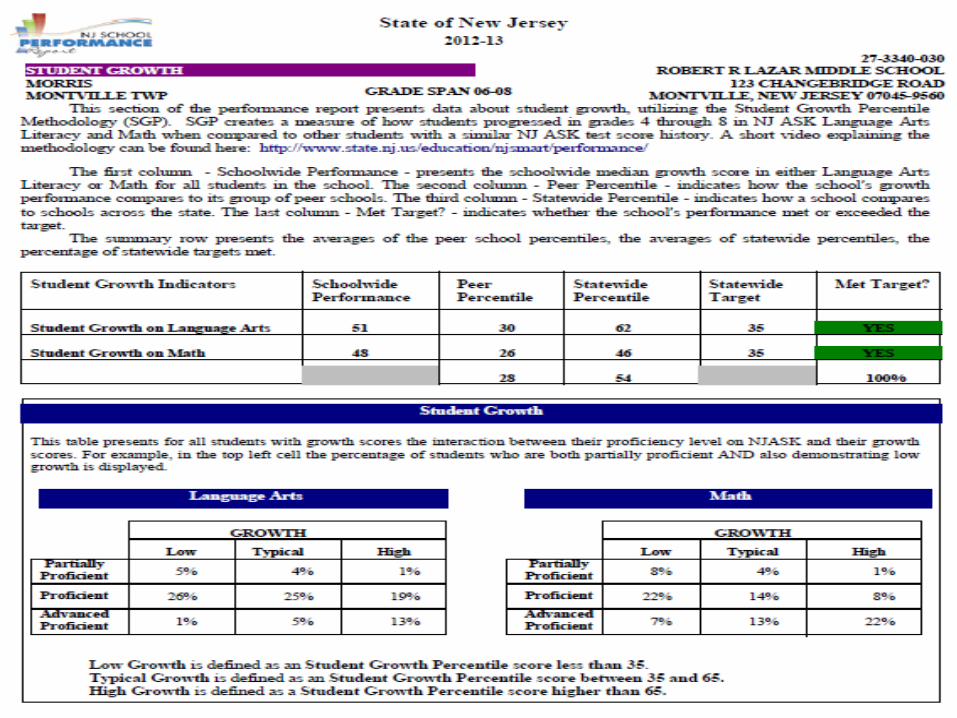
• Student Growth – middle and elementary

ACADEMIC ACHIEVEMENT
• Measures the content knowledge students have in language arts literacy and math. At the high school – High School Proficiency Assessment (HSPA). At elementary and middle school – Assessment of Skills and Knowledge (NJ ASK). Proficient or advanced proficient.

COLLEGE AND CAREER READINESS
• Measures the degree to which students are demonstrating behaviors that are indicative of future attendance and/or success in college and careers. High school – SAT, PSAT, AP courses. Elementary and middle school –attendance. Middle school – Algebra 1 in 7th
or 8th grade.
• Chronic absenteeism – 10% of school year
(18 days)

GRADUATION AND POST-SECONDARYHIGH SCHOOL
• Rate at which students who begin high school four years earlier graduate within four years.
• Measure of the rate at which students in a particular grade drop out of school.

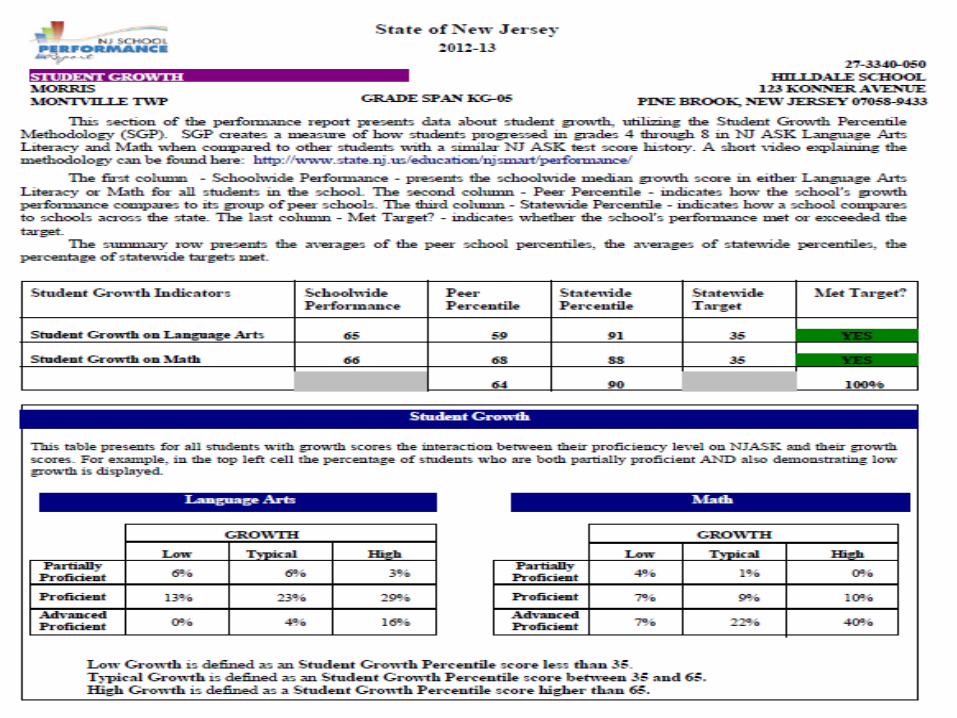
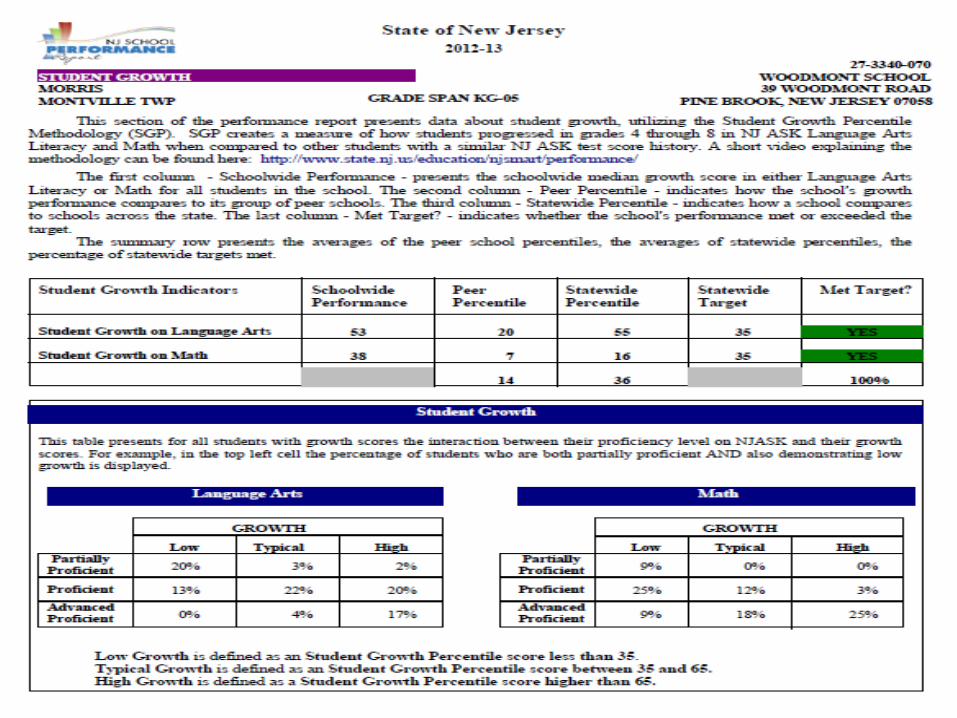
STUDENT GROWTHMIDDLE AND ELEMENTARY SCHOOL
• Measures the performance of students from one year to the next on the NJ ASK in Language Arts Literacy and Math compared to students with a similar history of performance on the NJ ASK.

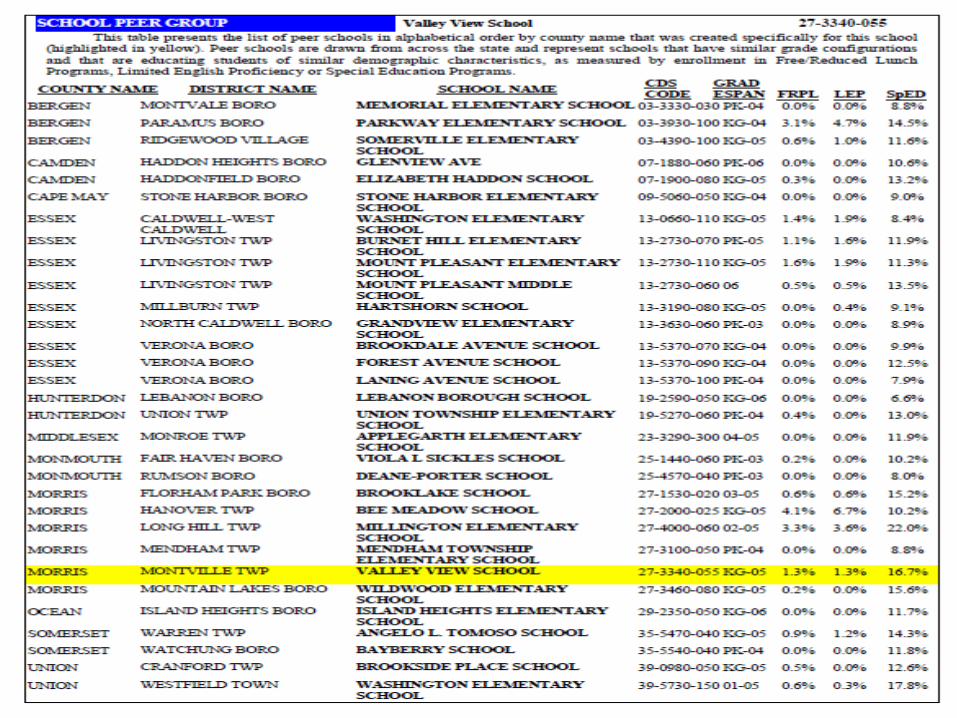
SCHOOL PERFORMANCE REPORTS
• Compared to School Peer Groups and the State
• Peer Rank Percentiles
• Statewide Rank Percentiles
• Percent of Targets Met
A CAREFUL LOOK AT RANK
• The arts
• The world of sports
• Your own home

Montville Township High School


Lazar


Cedar Hill


Hilldale


Woodmont


Valley View


William Mason


