the science and engineering of...
TRANSCRIPT

The Science and Engineering of CompostingA Note to Casual CompostersBackground InformationGetting the Right MixComposting ExperimentsCompost Engineering Fundamentals
● Background Information:
Invertebrates●
Microbes●
Chemistry●
Physics●
● Getting the Right Mix:
Introduction●
Moisture Content●
C/N Ratio
Bioavailability of Carbon & Nitrogen
Use of fertilizer nitrogen to balance C/N ratio■
Lignin effects on bioavailability
Lignin Table■
■
Effect of particle size on bioavailability■
❍
Estimating carbon content❍
●
Simultaneous Solution of Moisture & C/N Equations●
Download Excel Spreadsheets with compost mixture calculations for up to four ingredients (Macand PC)
●
● Composting Experiments:
The Science and Engineering of Composting
http://www.cfe.cornell.edu/compost/science.html (1 of 2) [1/16/2001 8:49:04 AM]

Ideas for Student Research Projects●
Monitoring the Compost Process
Moisture❍
Temperature❍
pH❍
Odor❍
Invertebrates❍
Microbes❍
●
● Compost Engineering Fundamentals:
Composting Process Analysis:
Calculating VS and moisture losses❍
Oxygen transport
Oxygen diffusion
Calculating the oxygen diffusion coefficient in air■
Calculating the oxygen diffusion coefficient in water■
■
Capillary theory and matric potential■
❍
●
Odor Management
Ammonia odors❍
Factors leading to anaerobic conditions
Excess moisture■
Inadequate porosity■
Rapidly degrading substrate■
Excessive pile size■
❍
Odor treatment - Biofiltration❍
●
Water Quality Protection●
CornellComposting
Science &Engineering
Compostingin Schools
Resources Contacts
The Science and Engineering of Composting
http://www.cfe.cornell.edu/compost/science.html (2 of 2) [1/16/2001 8:49:04 AM]

A Note to Casual CompostersComposting can be pursued at many different levels, from the gardener who likes to produce "blackgold" to the operator of a multi-acre commercial composting facility. Gardeners who compost their ownlandscaping and food scraps can follow a few simple rules of thumb and needn't worry about complexformulas, chemical equations, or studies of microorganisms. These are, however, importantconsiderations for municipal and commercial composting operations because of the need to ensure thatthe composting proceeds rapidly, doesn't cause odor or pest problems, and achieves temperatures highenough to kill pathogens.
Some of the topics in the Science and Engineering section may be far too technical to be relevant tocasual composters. On the other hand, some may be intriguing. You might, for example, wish to learnmore about the invertebrates or the microorganisms that create compost. You might be curious about thetemperature curve produced by compost as it goes through its cycle of heating and cooling. Or you mightlike to learn how to measure the pH or moisture content of your compost. You might even want to trycalculating desirable proportions for the materials you wish to compost.
We invite you to explore these pages to whatever level your curiosity takes you, realizing that compost isa rich topic for scientific research and discovery as well as a practical method of recycling organic matterand reducing solid waste.
CornellComposting
Science &Engineering
Compostingin Schools
Resources Contacts
The Science and Engineering of Composting
http://www.cfe.cornell.edu/compost/Note.html [1/16/2001 8:49:05 AM]

Invertebrates of the Compost PileThere is a complex food web at work in a compost pile, representing a pyramid with primary, secondary,and tertiary level consumers. The base of the pyramid, or energy source, is made up of organic matterincluding plant and animal residues.
Tertiary Consumers(organisms that eat secondary consumers)
centipedes, predatory mites,rove beetles, fomicid ants,
carabid beetles
Secondary Consumers(organisms that eat primary consumers)
springtails, some types of mites, feather-winged beetlesnematodes, protozoa, rotifera, soil flatworms
Primary Consumers(organisms that eat organic residues)
bacteria, fungi, actinomycetes,nematodes, some types of mites, snails, slugs,earthworms, millipedes, sowbugs, whiteworms
Organic Residuesleaves, grass clippings, other plant debris,
food scraps,fecal matter and animal bodies including those of soil invertebrates
As you can see in this pyramid, organic residues such leaves or other plant materials are eaten by sometypes of invertebrates such as millipedes, sow bugs, snails and slugs. These invertebrates shred the plantmaterials, creating more surface area for action by fungi, bacteria, and actinomycetes (a group oforganisms intermediate between bacteria and true fungi), which are in turn eaten by organisms such asmites and springtails.
Invertebrates of the Compost Pile
http://www.cfe.cornell.edu/compost/invertebrates.html (1 of 4) [1/16/2001 8:49:10 AM]

Many kinds of worms, including earthworms, nematodes, red worms and potworms eat decayingvegetation and microbes and excrete organic compounds that enrich compost. Their tunneling aerates thecompost, and their feeding increases the surface area of organic matter for microbes to act upon. As eachdecomposer dies or excretes, more food is added to web for other decomposers.
Nematodes: These tiny, cylindrical, often transparentmicroscopic worms are the most abundant of the physicaldecomposers - a handful of decaying compost containsseveral million. It has been estimated that one rotting applecontains 90,000. Under a magnifying lens they resemble
fine human hair.
Some species scavenge on decaying vegetation, some feed on bacteria, fungi, protozoa and othernematodes, and some suck the juices of plant roots, especially root vegetables.
Mites: Mites are the second most common invertebrate found in compost. Theyhave eight leg-like jointed appendages. Some can be seen with the naked eyeand others are microscopic. Some can be seen hitching rides on the back ofother faster moving invertebrates such as sowbugs, millipedes and beetles.Some scavenge on leaves, rotten wood, and other organic debris. Some specieseat fungi, yet others are predators and feed on nematodes, eggs, insect larvaeand other mites and springtails. Some are both free living and parasitic. Onevery common compost mite is globular in appearance, with bristling hairs on itsback and red-orange in color.
Springtails: Springtails are extremely numerous in compost. They arevery small wingless insects and can be distinguished by their ability tojump when disturbed. They run in and around the particles in thecompost and have a small spring-like structure under the belly thatcatapults them into the air when the spring catch is triggered. They chewon decomposing plants, pollen, grains, and fungi. They also eatnematodes and droppings of other arthropods and then meticulously
clean themselves after feeding.
Earthworms: Earthworms do the lion's share of thedecomposition work among the larger compost organisms. Theyare constantly tunneling and feeding on dead plants and decayinginsects during the daylight hours. Their tunneling aerates the compost and enables water, nutrients andoxygen to filter down. "As soil or organic matter is passed through an earthworm's digestive system, it isbroken up and neutralized by secretions of calcium carbonate from calciferous glands near the worm'sgizzard. Once in the gizzard, material is finely ground prior to digestion. Digestive intestinal juices richin hormones, enzymes, and other fermenting substances continue the breakdown process. The matterpasses out of the worm's body in the form of casts, which are the richest and finest quality of all humusmaterial. Fresh casts are markedly higher in bacteria, organic material, and available nitrogen, calcium,magnesium, phosphorus and potassium than soil itself." (Rodale)
Invertebrates of the Compost Pile
http://www.cfe.cornell.edu/compost/invertebrates.html (2 of 4) [1/16/2001 8:49:10 AM]

Slugs and snails (left): Slugs and snails generally feed on living plantmaterial but will attack fresh garbage and plant debris and will thereforeappear in the compost heap.
Centipedes (right): Centipedes are fastmoving predators found mostly in the top fewinches of the compost heap. They haveformidable claws behind their head which
possess poison glands that paralyze small red worms, insect larvae, newlyhatched earthworms, and arthropods - mainly insects and spiders. To viewa QuickTime movie of the centipede click on this image
Millipedes: They are slower and more cylindrical thancentipedes and have two pairs of appendages on each bodysegment. They feed mainly on decaying plant tissue but willeat insect carcasses and excrement.
Sow Bugs (right): Sow Bugs are fat bodied crustaceans with delicateplate-like gills along the lower surface of their abdomens which must bekept moist. They move slowly grazing on decaying vegetation.
Beetles (left): The most commonbeetles in compost are the rove beetle,ground beetle and feather-wingedbeetle. Feather-winged beetles feed onfungal spores, while the larger rove and ground beetles prey on otherinsects, snails, slugs and other small animals.
Ants: Ants feed on aphid honey-dew, fungi, seeds, sweets, scraps, otherinsects and sometimes other ants. Compost provides some of these foods and it also provides shelter fornests and hills. Ants may benefit the compost heap by moving minerals especially phosphorus andpotassium around by bringing fungi and other organisms into their nests.
Flies: During the early stages of the composting process, flies provide ideal airborne transportation forbacteria on their way to the pile. Flies spend their larval phase in compost as maggots, which do notsurvive thermophilic temperatures. Adults feed upon organic vegetation.
Spiders: Spiders feed on insects and other small invertebrates.
Invertebrates of the Compost Pile
http://www.cfe.cornell.edu/compost/invertebrates.html (3 of 4) [1/16/2001 8:49:10 AM]

Pseudoscorpions: Pseudoscorpions are predators which seize victims with theirvisible front claws, then inject poison from glands located at the tips of the claws.Prey include minute nematode worms, mites, larvae, and small earthworms.
Earwigs: Earwigs are large predators, easily seen with the naked eye. They moveabout quickly. Some are predators. Others feed chiefly on decayed vegetation.
CornellComposting
Science &Engineering
Compostingin Schools
Resources Contacts
Written by Nancy Trautmann, Cornell Center for the Environment
Credits
Invertebrates of the Compost Pile
http://www.cfe.cornell.edu/compost/invertebrates.html (4 of 4) [1/16/2001 8:49:10 AM]
Compost Microorganismsby Nancy Trautmann and Elaina Olynciw
The Phases of Composting
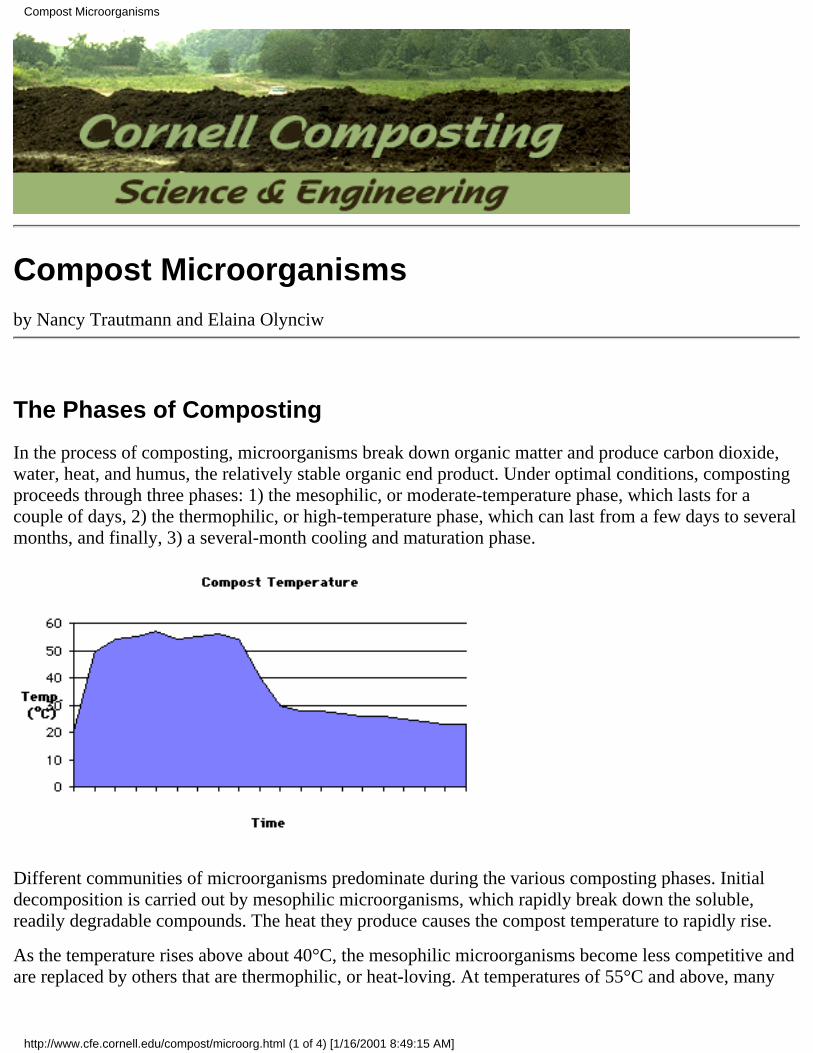
In the process of composting, microorganisms break down organic matter and produce carbon dioxide,water, heat, and humus, the relatively stable organic end product. Under optimal conditions, compostingproceeds through three phases: 1) the mesophilic, or moderate-temperature phase, which lasts for acouple of days, 2) the thermophilic, or high-temperature phase, which can last from a few days to severalmonths, and finally, 3) a several-month cooling and maturation phase.
Different communities of microorganisms predominate during the various composting phases. Initialdecomposition is carried out by mesophilic microorganisms, which rapidly break down the soluble,readily degradable compounds. The heat they produce causes the compost temperature to rapidly rise.
As the temperature rises above about 40°C, the mesophilic microorganisms become less competitive andare replaced by others that are thermophilic, or heat-loving. At temperatures of 55°C and above, many
Compost Microorganisms
http://www.cfe.cornell.edu/compost/microorg.html (1 of 4) [1/16/2001 8:49:15 AM]
microorganisms that are human or plant pathogens are destroyed. Because temperatures over about 65°Ckill many forms of microbes and limit the rate of decomposition, compost managers use aeration andmixing to keep the temperature below this point.
During the thermophilic phase, high temperatures accelerate the breakdown of proteins, fats, andcomplex carboydrates like cellulose and hemicellulose, the major structural molecules in plants. As thesupply of these high-energy compounds becomes exhausted, the compost temperature graduallydecreases and mesophilic microorganisms once again take over for the final phase of "curing" ormaturation of the remaining organic matter.
Bacteria
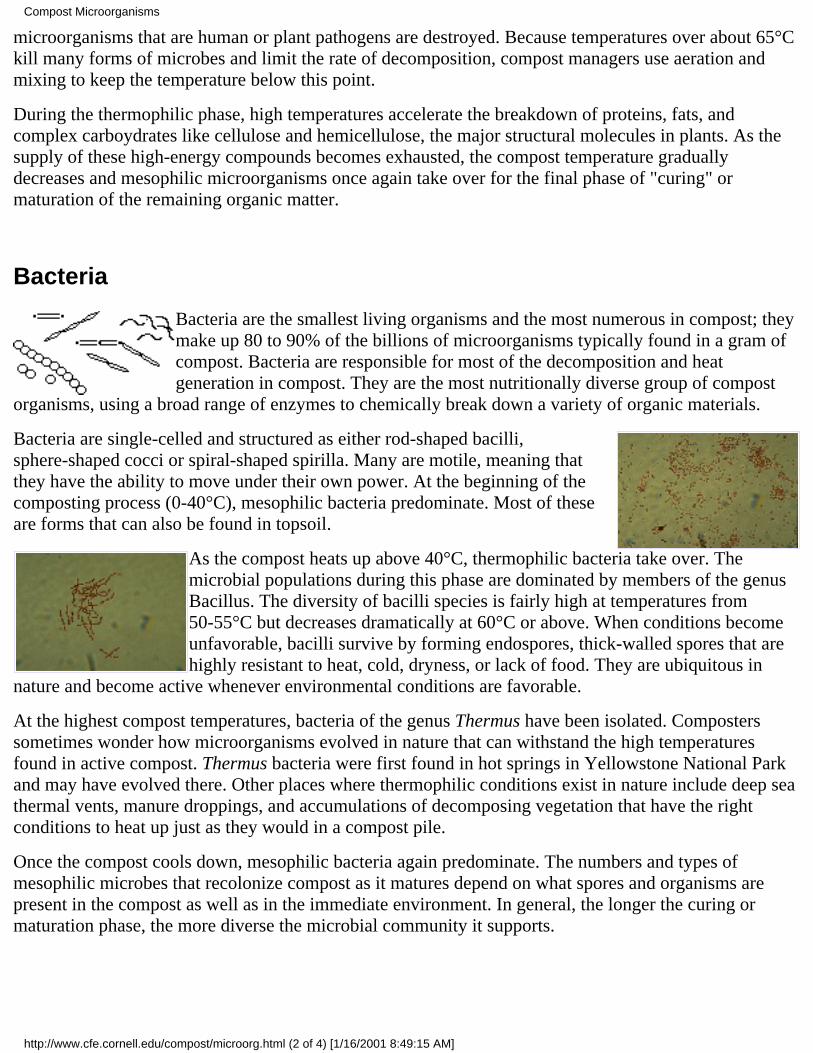
Bacteria are the smallest living organisms and the most numerous in compost; theymake up 80 to 90% of the billions of microorganisms typically found in a gram ofcompost. Bacteria are responsible for most of the decomposition and heatgeneration in compost. They are the most nutritionally diverse group of compost
organisms, using a broad range of enzymes to chemically break down a variety of organic materials.
Bacteria are single-celled and structured as either rod-shaped bacilli,sphere-shaped cocci or spiral-shaped spirilla. Many are motile, meaning thatthey have the ability to move under their own power. At the beginning of thecomposting process (0-40°C), mesophilic bacteria predominate. Most of theseare forms that can also be found in topsoil.
As the compost heats up above 40°C, thermophilic bacteria take over. Themicrobial populations during this phase are dominated by members of the genusBacillus. The diversity of bacilli species is fairly high at temperatures from50-55°C but decreases dramatically at 60°C or above. When conditions becomeunfavorable, bacilli survive by forming endospores, thick-walled spores that arehighly resistant to heat, cold, dryness, or lack of food. They are ubiquitous in
nature and become active whenever environmental conditions are favorable.
At the highest compost temperatures, bacteria of the genus Thermus have been isolated. Composterssometimes wonder how microorganisms evolved in nature that can withstand the high temperaturesfound in active compost. Thermus bacteria were first found in hot springs in Yellowstone National Parkand may have evolved there. Other places where thermophilic conditions exist in nature include deep seathermal vents, manure droppings, and accumulations of decomposing vegetation that have the rightconditions to heat up just as they would in a compost pile.
Once the compost cools down, mesophilic bacteria again predominate. The numbers and types ofmesophilic microbes that recolonize compost as it matures depend on what spores and organisms arepresent in the compost as well as in the immediate environment. In general, the longer the curing ormaturation phase, the more diverse the microbial community it supports.
Compost Microorganisms
http://www.cfe.cornell.edu/compost/microorg.html (2 of 4) [1/16/2001 8:49:15 AM]

Actinomycetes
The characteristic earthy smell of soil is caused by actinomycetes,organisms that resemble fungi but actually are filamentousbacteria. Like other bacteria, they lack nuclei, but they growmulticellular filaments like fungi. In composting they play animportant role in degrading complex organics such as cellulose,lignin, chitin, and proteins. Their enzymes enable them tochemically break down tough debris such as woody stems, bark,or newspaper. Some species appear during the thermophilic
phase, and others become important during the cooler curing phase, when onlythe most resistant compounds remain in the last stages of the formation ofhumus.
Actinomycetes form long, thread-like branched filaments that look like grayspider webs stretching through compost. These filaments are most commonly
seen toward the end of the composting process, in the outer 10 to 15 centimeters of the pile. Sometimesthey appear as circular colonies that gradually expand in diameter.
Fungi
Fungi include molds and yeasts, andcollectively they are responsible for thedecomposition of many complex plantpolymers in soil and compost. Incompost, fungi are important becausethey break down tough debris, enablingbacteria to continue the decompositionprocess once most of the cellulose hasbeen exhausted. They spread and grow vigorously by producing many cells and filaments, and they canattack organic residues that are too dry, acidic, or low in nitrogen for bacterial decomposition.
Most fungi are classified as saprophytes because they live on dead or dyingmaterial and obtain energy by breaking down organic matter in dead plants andanimals. Fungal species are numerous during both mesophilic and thermophilicphases of composting. Most fungi live in the outer layer of compost whentemperatures are high. Compost molds are strict aerobes that grow both asunseen filaments and as gray or white fuzzy colonies on the compost surface.
Compost Microorganisms
http://www.cfe.cornell.edu/compost/microorg.html (3 of 4) [1/16/2001 8:49:15 AM]

Protozoa
Protozoa are one-celled microscopic animals. They are found inwater droplets in compost but play a relatively minor role indecomposition. Protozoa obtain their food from organic matter in thesame way as bacteria do but also act as secondary consumersingesting bacteria and fungi.
Rotifers
Rotifers are microscopic multicellular organisms also found in films of water in thecompost. They feed on organic matter and also ingest bacteria and fungi.
Techniques for Observing Compost Microorganisms
Acknowledgments
The illustrations and photographs were produced by Elaina Olynciw, biology teacher atA.Philip Randolf High School, New York City, while she was working in the laboratory ofDr. Eric Nelson at Cornell University as part of the Teacher Institute of Environmental Sciences.
Thanks to Fred Michel (Michigan State University, NSF Center for Microbial Ecology) and TomRichard for their helpful reviews of and contributions to this document.
CornellComposting
Science &Engineering
Compostingin Schools
Resources Contacts
Credits
Compost Microorganisms
http://www.cfe.cornell.edu/compost/microorg.html (4 of 4) [1/16/2001 8:49:15 AM]

Compost Chemistry
C/N Ratio
Of the many elements required for microbial decomposition, carbon and nitrogen are the most important.Carbon provides both an energy source and and the basic building block making up about 50 percent ofthe mass of microbial cells. Nitrogen is a crucial component of the proteins, nucleic acids, amino acids,enzymes and co-enzymes necessary for cell growth and function.
To provide optimal amounts of these two crucial elements, you can use the carbon-to-nitrogen (C/N)ratio for each of your compost ingredients. The ideal C/N ratio for composting is generally considered tobe around 30:1, or 30 parts carbon for each part nitrogen by weight. Why 30:1? At lower ratios, nitrogenwill be supplied in excess and will be lost as ammonia gas, causing undesirable odors. Higher ratiosmean that there is not sufficient nitrogen for optimal growth of the microbial populations, so the compostwill remain relatively cool and degradation will proceed at a slow rate.
Typical C/N ratios for common compost materials can be looked up in published tables such asAppendix A, On-Farm Composting Handbook. In general, materials that are green and moist tend to behigh in nitrogen, and those that are brown and dry are high in carbon. High nitrogen materials includegrass clippings, plant cuttings, and fruit and vegetable scraps. Brown or woody materials such as autumnleaves, wood chips, sawdust, and shredded paper are high in carbon. You can calculate the C/N ratio ofyour compost mixture, or you can estimate optimal conditions simply by using a combination ofmaterials that are high in carbon and others that are high in nitrogen.
Materials High in Carbon C/N*autumn leaves 30-80:1straw 40-100:1wood chips or sawdust 100-500:1bark 100-130:1mixed paper 150-200:1newspaper or corrugated cardboard 560:1
Compost Chemistry
http://www.cfe.cornell.edu/compost/chemistry.html (1 of 3) [1/16/2001 8:49:16 AM]

Materials High in Nitrogen C:N*vegetable scraps 15-20:1coffee grounds 20:1grass clippings 15-25:1manure 5-25:1
* Source: Dickson, N., T. Richard, and R. Kozlowski. 1991. Composting to Reduce the Waste Stream: AGuide to Small Scale Food and Yard Waste Composting. Available from the Northeast RegionalAgricultural Engineering Service, Cornell University, 152 Riley-Robb Hall, Ithaca, NY 14853;607-255-7654.
As composting proceeds, the C/N ratio gradually decreases from 30:1 to 10-15:1 for the finished product.This occurs because each time that organic compounds are consumed by microorganisms, two-thirds ofthe carbon is given off as carbon dioxide. The remaining third is incorporated along with nitrogen intomicrobial cells, then later released for further use once those cells die.
Although attaining a C/N ratio of roughly 30:1 is a useful goal in planning composting operations, thisratio may need to be adjusted according to the bioavailability of the materials in question. Most of thenitrogen in compostable materials is readily available. Some of the carbon, however, may be bound up incompounds that are highly resistant to biological degradation. Newspaper, for example, is slower thanother types of paper to break down because it is made up of cellulose fibers sheathed in lignin, a highlyresistant compound found in wood. Corn stalks and straw are similarly slow to break down because theyare made up of a resistant form of cellulose. Although all of these materials can still be composted, theirrelatively slow rates of decomposition mean that not all of their carbon will be readily available tomicroorganisms, so a higher initial C/N ratio can be planned. Particle size also is a relevantconsideration; although the same amount of carbon is contained in comparable masses of wood chips andsawdust, the larger surface area in the sawdust makes its carbon more readily available for microbial use.
Oxygen
Another essential ingredient for successful composting is oxygen. As microorganisms oxidize carbon forenergy, oxygen is used up and carbon dioxide is produced. Without sufficient oxygen, the process willbecome anaerobic and produce undesirable odors, including the rotten-egg smell of hydrogen sulfide gas.
So, how much oxygen is sufficient to maintain aerobic conditions? Although the atmosphere is 21%oxygen, aerobic microbes can survive at concentrations as low as 5%. Oxygen concentrations greaterthan 10% are considered optimal for maintaining aerobic composting. Some compost systems are able tomaintain adequate oxygen passively, through natural diffusion and convection. Other systems requireactive aeration, provided by blowers or through turning or mixing the compost ingredients.
Nutrient Balance
Adequate phosphorus, potassium, and trace minerals (calcium, iron, boron, copper, etc.) are essential tomicrobial metabolism. Normally these nutrients are not limiting because they are present in ampleconcentration in the compost source materials.
pH
Compost Chemistry
http://www.cfe.cornell.edu/compost/chemistry.html (2 of 3) [1/16/2001 8:49:16 AM]
A pH between 5.5 and 8.5 is optimal for compost microorganisms. As bacteria and fungi digest organicmatter, they release organic acids. In the early stages of composting, these acids often accumulate. Theresulting drop in pH encourages the growth of fungi and the breakdown of lignin and cellulose. Usuallythe organic acids become further broken down during the composting process. If the system becomesanaerobic, however, acid accumulation can lower the pH to 4.5, severely limiting microbial activity. Insuch cases, aeration usually is sufficient to return the compost pH to acceptable ranges.
CornellComposting
Science &Engineering
Compostingin Schools
Resources Contacts
Credits
Compost Chemistry
http://www.cfe.cornell.edu/compost/chemistry.html (3 of 3) [1/16/2001 8:49:16 AM]

Compost PhysicsThe rate at which composting occurs depends on physical as well as chemical factors. Temperature is akey parameter determining the success of composting operations. Physical characteristics of the compostingredients, including moisture content and particle size, affect the rate at which composting occurs.Other physical considerations include the size and shape of the system, which affect the type and rate ofaeration and the tendency of the compost to retain or dissipate the heat that is generated.
Temperature Curve
Compost heat is produced as a by-product of the microbial breakdown of organic material. The heatproduction depends on the size of the pile, its moisture content, aeration, and C/N ratio. Additionally,ambient (indoor or outdoor) temperature affects compost temperatures.
You can chart the health and progress of your compost system by taking periodic temperaturemeasurements. A typical temperature curve for an unturned pile is shown below. How do you think thatperiodic turning would change this curve?
A well-designed indoor compost system, >10 gallons in volume, will heat up to 40-50°C in two to three
Compost Physics
http://www.cfe.cornell.edu/compost/physics.html (1 of 4) [1/16/2001 8:49:18 AM]

days. Soda bottle bioreactors, because they are so small, are more likely to peak at temperatures of30-40°C. At the other end of the range, commercial or municipal scale compost systems may take threeto five days to heat up and reach temperatures of 60-70°C. Compost managers strive to keep the compostbelow about 65°C because hotter temperatures cause the beneficial microbes to die off. If the pile getstoo hot, turning or aerating will help to dissipate the heat.
Decomposition occurs most rapidly during the thermophilic stage of composting (40-60°C), which lastsfor several weeks or months depending on the size of the system and the composition of the ingredients.This stage also is important for destroying thermosensitive pathogens, fly larvae, and weed seeds. Inoutdoor systems, compost invertebrates survive the thermophilic stage by moving to the periphery of thepile or becoming dormant. Regulations by the U.S. Environmental Protection Agency specify that toachieve a significant reduction of pathogens during composting, the compost should be maintained atminimum operating conditions of 40°C for five days, with temperatures exceeding 55°C for at least fourhours of this period. Most species of microorganisms cannot survive at temperatures above 60-65°C, socompost managers turn or aerate their systems to bring the temperature down if they begin to get this hot.
As the compost begins to cool, turning the pile usually will result in a new temperature peak because ofthe replenished oxygen supply and the exposure of organic matter not yet thoroughly decomposed. Afterthe thermophilic phase, the compost temperature drops and is not restored by turning or mixing. At thispoint, decomposition is taken over by mesophilic microbes through a long process of "curing" ormaturation. Although the compost temperature is close to ambient during the curing phase, chemicalreactions continue to occur that make the remaining organic matter more stable and suitable for use withplants.
Mechanisms of Heat Loss
The temperature at any point during composting depends on how much heat is being produced bymicroorganisms, balanced by how much is being lost through conduction, convection, and radiation.Through conduction, energy is transferred from atom to atom by direct contact; at the edges of a compostpile, conduction causes heat loss to the surrounding air molecules.
Convection refers to transfer of heat by movement of a fluid such as air or water. When compost gets hot,warm air rises within the system, and the resulting convective currents cause a steady but slowmovement of heated air upwards through the compost and out the top. In addition to this naturalconvection, some composting systems use "forced convection" driven by blowers or fans. This forced air,in some cases triggered by thermostats that indicate when the piles are beginning to get too hot, increasesthe rates of both conductive and convective heat losses. Much of the energy transfer is in the form oflatent heat -- the energy required to evaporate water. You can sometimes see steamy water vapor risingfrom hot compost piles or windrows.
The third mechanism for heat loss, radiation, refers to electromagnetic waves like those that you feelwhen standing in the sunlight or near a warm fire. Similarly, the warmth generated in a compost pileradiates out into the cooler surrounding air. The smaller the bioreactor or compost pile, the greater thesurface area-to-volume ratio, and therefore the larger the degree of heat loss to conduction and radiation.Insulation helps to reduce these losses in small compost bioreactors.
Moisture content affects temperature change in compost; since water has a higher specific heat than mostother materials, drier compost mixtures tend to heat up and cool off more quickly than wetter mixtures,
Compost Physics
http://www.cfe.cornell.edu/compost/physics.html (2 of 4) [1/16/2001 8:49:18 AM]

providing adequate moisture levels for microbial growth are maintained. The water acts as a kind ofthermal flywheel, damping out the changes in temperature as as microbial activity ebbs and flows.
Other Physical Factors
Particle SizeMicrobial activity generally occurs on the surface of the organic particles. Therefore, decreasing particlesize, through its effect of increasing surface area, will encourage microbial activity and increase the rateof decomposition. On the other hand, when particles are too small and compact, air circulation throughthe pile is inhibited. This decreases O2 available to microorganisms within the pile and ultimatelydecreases the rate of microbial activity.
Particle size also affects the availability of carbon and nitrogen. Large wood chips, for example, providea good bulking agent that helps to ensure aeration through the pile, but they provide less available carbonper mass than they would in the form of wood shavings or sawdust.
AerationOxygen is essential for the metabolism and respiration of aerobic microorganisms, and for oxidizing thevarious organic molecules present in the waste material. At the beginning of microbial oxidative activity,the O2 concentration in the pore spaces is about 15-20% (similar to the normal composition of air), andthe CO2 concentration varies form 0.5-5%. As biological activity progresses, the O2 concentration fallsand CO2 concentration increases. If the average O2 concentration in the pile falls below about 5%,regions of anaerobic conditions develop. Providing the anaerobic activity is kept to a minimum, thecompost pile acts as a bio-filter to trap and degrade the odorous compounds produced as a by-product ofanaerobic decomposition. However, should the anaerobic activity increase above a certain threshold,undesireable odors may result.
Maintaining aerobic conditions can be accomplished by various methods including drilling air holes,inclusion of aeration pipes, forced air flow, and mechanical mixing or turning. Mixing and turningincrease aeration by loosening up and increasing the porosity of the compost mixture.
MoistureA moisture content of 50-60% is generally considered optimum for composting. Microbially induceddecomposition occurs most rapidly in the thin liquid films found on the surfaces of the organic particles.Whereas too little moisture (<30%) inhibits bacterial activity, too much moisture (>65%) results in slowdecomposition, odor production in anaerobic pockets, and nutrient leaching. The moisture content ofcompostable materials ranges widely, as shown in the table below:
Compost Physics
http://www.cfe.cornell.edu/compost/physics.html (3 of 4) [1/16/2001 8:49:18 AM]
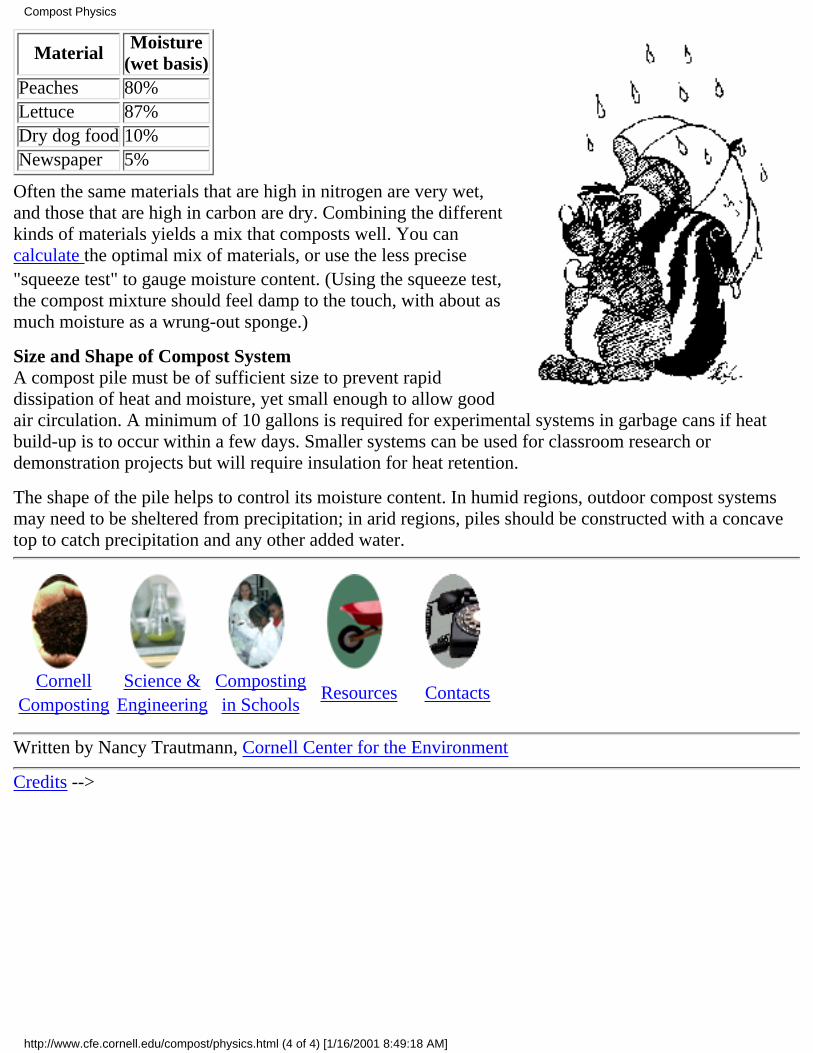
Material Moisture(wet basis)
Peaches 80%Lettuce 87%Dry dog food 10%Newspaper 5%
Often the same materials that are high in nitrogen are very wet,and those that are high in carbon are dry. Combining the differentkinds of materials yields a mix that composts well. You cancalculate the optimal mix of materials, or use the less precise"squeeze test" to gauge moisture content. (Using the squeeze test,the compost mixture should feel damp to the touch, with about asmuch moisture as a wrung-out sponge.)
Size and Shape of Compost SystemA compost pile must be of sufficient size to prevent rapiddissipation of heat and moisture, yet small enough to allow goodair circulation. A minimum of 10 gallons is required for experimental systems in garbage cans if heatbuild-up is to occur within a few days. Smaller systems can be used for classroom research ordemonstration projects but will require insulation for heat retention.
The shape of the pile helps to control its moisture content. In humid regions, outdoor compost systemsmay need to be sheltered from precipitation; in arid regions, piles should be constructed with a concavetop to catch precipitation and any other added water.
CornellComposting
Science &Engineering
Compostingin Schools
Resources Contacts
Written by Nancy Trautmann, Cornell Center for the Environment
Credits -->
Compost Physics
http://www.cfe.cornell.edu/compost/physics.html (4 of 4) [1/16/2001 8:49:18 AM]

Getting the Right MixCalculations for Thermophilic Composting
Tom L. Richard and Nancy M. Trautmann
One of the first tasks in developing a successful composting program is getting the right combination ofingredients. Two parameters are particularly important in this regard: moisture content and the carbon tonitrogen (C/N) ratio.
Moisture is essential to all living organisms, and most microorganisms, lacking mechanisms for moistureretention (like our skin), are particularly sensitive in this regard. Below a moisture content of 35 to 40%,decomposition rates are greatly reduced; below 30% they virtually stop. Too much moisture, however, isone of the most common factors leading to anaerobic conditions and resulting odor complaints. Theupper limit of moisture varies with different materials, and is a function of their particle sizes andstructural characteristics, both of which affect their porosity. For most compost mixtures, 55 to 60% isthe recommended upper limit for moisture content. Because composting is usually a drying process(through evaporation due to microbially generated heat), starting moisture contents are usually in thisupper range.
Of the many elements required for microbial decomposition, carbon and nitrogen are both the mostimportant and the most commonly limiting (occasionally phosphorous can also be limiting). Carbon isboth an energy source (note the root in our word for high energy food: carbohydrate), and the basicbuilding block making up about 50 percent of the mass of microbial cells.
Nitrogen is a crucial component of proteins, and bacteria, whose biomass is over 50% protein, needplenty of nitrogen for rapid growth. When there is too little nitrogen, the microbial population will notgrow to its optimum size, and composting will slow down. In contrast, too much nitrogen allows rapidmicrobial growth and accelerates decomposition, but this can create serious odor problems as oxygen isused up and anaerobic conditions occur. In addition, some of this excess nitrogen will be given off asammonia gas that generates odors while allowing valuable nitrogen to escape. Therefore, materials with ahigh nitrogen content, such as fresh grass clippings, require more careful management to insure adequateoxygen transport , as well as thorough blending with a high carbon waste. For most materials, a C/N ratioof about 30 to 1 (by weight) will keep these elements in approximate balance, although several other
Getting the Right Mix
http://www.cfe.cornell.edu/compost/calc/rightmix.html (1 of 2) [1/16/2001 8:49:18 AM]

factors can also come into play.
So, if you have several materials you want to compost, how do you figure out the appropriate mix toachieve moisture and C/N goals? The theory behind calculating mix ratios is relatively simple - highschool algebra is the only prerequisite. To help you understand these equations, and calculate the rightmix for your situation, we developed a set of informative pages, on-line calculations, and spreadsheetsyou can download and operate anytime with software on your own computer. You can access thismaterial directly from the Cornell Composting Science and Engineering page, or by clicking on one ofthe items below:
Moisture ContentCarbon/Nitrogen Ratios
CornellComposting
Science &Engineering
Compostingin Schools
Resources Contacts
Getting the Right Mix
http://www.cfe.cornell.edu/compost/calc/rightmix.html (2 of 2) [1/16/2001 8:49:18 AM]
Moisture Content
by Nancy Trautmann and Tom Richard
When deciding what proportions of various materials to mix together in making compost, the moisture ofthe resulting mixture is one of the critical factors to consider. The following steps outline how to designyour intital mix so that it will have a suitable moisture level for optimal composting.
Calculate the % moisture for each of the materials you plan to compost.a) Weigh a small container.b) Weigh 10 g of the material into the container.c) Dry the sample for 24 hours in a 105-110°ree;C oven.d) Reweigh the sample, subtract the weight of the container, and determine the moisture contentusing the following equation:
Mn = ((Ww-Wd)/Ww) x 100in which:Mn = moisture content (%) of material nWW = wet weight of the sample, andWd = weight of the sample after drying.
Suppose, for example, that you weigh 10 g of grass clippings (Ww) into a 4 g container and thatafter drying the container plus clippings weighs 6.3 g. Subtracting out the 4-g. container weightleaves 2.3 g as the dry weight (Wd) of your sample. Percent moisture would be:
Mn = ((Ww-Wd)/Ww) x 100= ((10 - 2.3) / 10) x 100= 77% for the grass clippings
1.
Choose a moisture goal for your compost mixture. Most literature recommends a moisture contentof 50%-60% by weight for optimal composting conditions.
2.
The next step is to calculate the relative amounts of materials you should combine to achieve yourmoisture goal. The general formula for percent moisture is:
3.
Moisture Content
http://www.cfe.cornell.edu/compost/calc/moisture_content.html (1 of 3) [1/16/2001 8:49:20 AM]

in which:Qn = mass of material n ("as is", or "wet weight")G = moisture goal (%)Mn = moisture content (%) of material n
You can use this formula directly to calculate the moisture content of a mixture of materials, andtry different combinations until you get results in a reasonable range. If you have a browsercapable of handling Java script (e.g. Netscape version 2.0 or higher), you can try this formula outfor up to 3 materials.
Using trial and error to determine what proportions to use for a mixture will work, but there is afaster way. For two materials, the general equation can be simplified and solved for the mass of asecond material (Q2) required in order to balance a given mass of the first material (Q1). Note thatthe moisture goal must be between the moisture contents of the two materials being mixed.
For example, suppose you wish to compost 10 kg grass clippings (moisture content = 77%). Inorder to achieve your moisture goal of 60% for the compost mix, you calculate the mass of leavesneeded (moisture content = 35%):
Q2= ((10 kg)(60) - (10 kg)(77)) / (35 - 60)= 6.8 kg leaves
Mixtures of 3 or more materials can also be solved in a similar way (although the algebra is morecomplicated), but for an exact solution the amounts of all but one material must be specified. Tofind the mass of the third material (Q3) given the masses of the first two (Q1 and Q2) plus all threemoisture contents (M1, M2, and M3) and a goal (G), solve:
With an internet browser that incorporates the JavaScript language, you can try calculatingmixtures ratios based on moisture goals for up to three materials.
Moisture Content
http://www.cfe.cornell.edu/compost/calc/moisture_content.html (2 of 3) [1/16/2001 8:49:20 AM]

CornellComposting
Science &Engineering
Compostingin Schools
Resources Contacts
Moisture Content
http://www.cfe.cornell.edu/compost/calc/moisture_content.html (3 of 3) [1/16/2001 8:49:20 AM]
C/N Ratio
Tom Richard and Nancy Trautmann
Once you have calculated the moisture content of your compost mixture, the other important calculationis the carbon-to-nitrogen ratio (C/N). Grass clippings and other green vegetation tend to have a higherproportion of nitrogen (and therefore a lower C/N ratio) than brown vegetation such as dried leaves orwood chips. If your compost mix is too low in nitrogen, it will not heat up. If the nitrogen proportion istoo high, the compost may become too hot, killing the compost microorganisms, or it may go anaerobic,resulting in a foul-smelling mess. The usual recommended range for C/N ratios at the start of thecomposting process is about 30/1, but this ideal may vary depending on the bioavailability of the carbonand nitrogen. As carbon gets converted to CO2 (and assuming minimal nitrogen losses) the C/N ratiodecreases during the composting process, with the ratio of finished compost typically close to 10/1.
Typical C/N ratios and nitrogen values for many kinds of compostable substances can be looked up inpublished tables such as Appendix A, On-Farm Composting Handbook. Some additional nitrogen andash data is in the table of Lignin and Other Constituents of Selected Organic Materials. (A No-Framesversion of the Table of Lignin is also available.) To calculate the carbon content given C/N and percentnitrogen, solve:
%C = %N x C/N
You may be able to measure the carbon and nitrogen content of your own materials and then calculatethe ratio directly. Soil nutrient analysis laboratories or environmental testing laboratories can do thenitrogen test, and maybe carbon as well . Your local Cooperative Extension office can give you thenames of soils laboratories in your area. The Cornell Nutrient Analysis Lab has information about theirprocedures for total carbon, organic carbon, and total nitrogen analysis. You can also estimate the carboncontent from ash or volatile solids data if either is available. Once you have the C/N ratios for thematerials you plan to compost, you can use the following formula to figure out the ratio for the mixtureas a whole:
C/N Ratio
http://www.cfe.cornell.edu/compost/calc/cn_ratio.html (1 of 3) [1/16/2001 8:49:23 AM]

in which: R = C/N ratio of compost mixture Qn = mass of material n ("as is", or "wet weight") Cn = carbon (%) of material n Nn = nitrogen (%) of material n Mn = moisture content (%) of material n
This equation can also be solved exactly for a mixture of two materials, knowing their carbon, nitrogen,and moisture contents, the C/N ratio goal, and specifying the mass of one ingredient. By simplifying andrearranging the general equation, the mass of the second material required would be:
Returning to the previous example of grass and leaves, lets assume the nitrogen content of the grass is2.4% while that of the leaves is 0.75%, and the carbon contents are 45% and 50% respectively. Simpledivision shows us that the C/N ratio of the grass is 18.75 and the C/N content of the leaves is 66.67% Forthe same 10 kg of grass we had before, if our goal is a C/N ratio of 30:1, the solution is:
Note that we need only 3.5 kg leaves to balance the C/N ratio, compared with 6.8 kg leaves needed toachieve the 60% moisture goal according to our previous moisture calculation. If the leaves were wetteror had a higher C/N ratio, the difference would be even greater. So how many leaves should you add?
If we solve the general form of the C/N equation for the 10 kg of grass and the 6.8 kg of leaves(determined from the moisture calculation), and use the same values for percent moisture, C, and N, theresulting C/N ratio is a little less than 37:1. In contrast, if we solve the general form of the moistureequation for 10 kg of grass and only 3.5 kg of leaves, we get a moisture content over 66%. (To gainfamiliarity with using the equations, you can check these results on your own).
In this example, as is often the case, moisture is the more critical variable. This is especially true towardthe wet end of the optimum (>60%), where anaerobic conditions are likely to result. So it is usually bestto err on the side of a high C/N ratio, which may slow down the compost a bit but is more likely to betrouble free. If, on the other hand, your mixture is dry, then you should optimize the C/N ratio and addwater as required.
As with moisture calculations, mixtures of 3 or more materials can be solved for the mass of the thirdmaterial if the first two are specified (one equation & one unknown). Given the carbon, nitrogen andmoisture contents of each ingredient, the masses of the first two, and the C/N ratio goal, the solution for
C/N Ratio
http://www.cfe.cornell.edu/compost/calc/cn_ratio.html (2 of 3) [1/16/2001 8:49:23 AM]

the mass of the third material is:
If we also want to consider moisture content, we can solve both equations simultaneously (moisture andC/N) for any two unknowns.
CornellComposting
Science &Engineering
Compostingin Schools
Resources Contacts
C/N Ratio
http://www.cfe.cornell.edu/compost/calc/cn_ratio.html (3 of 3) [1/16/2001 8:49:23 AM]
Bioavailability of Carbon and NitrogenTom Richard
Carbon-to-nitrogen ratios may need to be adjusted depending on the bioavailability of these elements.This is commonly an issue with high carbon materials, which are often derived from wood and otherlignified plant materials, as increased lignin content reduces biodegradability. Particle size is also animportant factor, with smaller particles degrading more quickly than large particles of the same material.Bioavailability can also be a factor with nitrogen sources, especially fertilizer nitrogen, where nearlyinstant availability can exceed the assimilative capacity of the microbial community and be lost asammonia odors and nitrate in leachate.
CornellComposting
Science &Engineering
Compostingin Schools
Resources Contacts
Bioavailability of Carbon and Nitrogen
http://www.cfe.cornell.edu/compost/calc/bioavail.html [1/16/2001 8:49:23 AM]

Use of Fertilizer Nitrogen to balance C/N RatiosTom Richard
When composting high carbon materials such as leaves, additional nitrogen may be required to reducethe C/N ratio to the optimal range. If considering using fertilizer as an N source, one needs to proceedcautiously. While the theoretical number should be the same as calculated using the C/N ratio formulas,the nitrogen in fertilizers is released much more rapidly than that in organic nitrogen (from which therules of thumb are derived).
Organic nitrogen sources provide a natural "time release" that makes them available at a rate comparableto the growth rate of microorganisms in the compost, so they are utilized efficiently. The rapidavailability of nitrogen fertilizers is especially a concern in the fall and winter, when low temperaturesslow down the growth rate of microorganisms, and nitrogen uptake will be correspondingly slow. Tomimic a natural time release with synthetic fertilizers, they should be applied sparingly and in a series ofapplications. While there is not a research base on which to estimate what the right rate would be,sniffing for ammonia volatilization may indicate if too much was applied too soon. In addition, becausenone of the fertilizer nitrogen is locked into compounds that are difficult to degrade (as is the case withorganic sources), the total applied should be significantly less than the calculations indicate - perhaps halfto two thirds.
CornellComposting
Science &Engineering
Compostingin Schools
Resources Contacts
Use of Fertilizer Nitrogen to balance C/N Ratios
http://www.cfe.cornell.edu/compost/calc/fertnit.html [1/16/2001 8:49:24 AM]

The Effect of Lignin on Biodegradability
Tom Richard
Plant cell wall material is composed of three important constituents: cellulose, lignin, and hemicellulose.Lignin is particularly difficult to biodegrade, and reduces the bioavailability of the other cell wallconstituents. A bit of knowledge about each of these constituents is helpful in understanding the vastlydifferent rates that different plant materials decompose. This discussion also presents the mathematicalmodels developed to compensate for the effect of lignin on biodegradability in anaerobic systems, andsuggests some constraints on applying these models to aerobic composting systems.
Cell Wall Constituents
Cellulose is a long chain of glucose molecules, linked to one another primarily with glycosidicbonds. The simplicity of the cellulosic structure, using repeated identical bonds, means that only a smallnumber of enzymes are required to degrade this material. Although people do not produce the enzymesrequired for cellulose degradation (and thus do not get much energy from eating paper, straw or othercellulosic material), some microorganisms do. Cows and other ruminants create an environment in theirrumen which encourages this microbial degradation, converting cellulose to volatile fatty acids andmicrobial biomass which the ruminant can then digest and use.
Hemicelluloses are branched polymers of xylose, arabinose, galactose, mannose, and glucose.Hemicelluloses bind bundles of cellulose fibrils to form microfibrils, which enhance the stability of thecell wall. They also cross-link with lignin, creating a complex web of bonds which provide structuralstrength, but also challenge microbial degradation (Ladisch et al., 1983; Lynch, 1992).
Lignin is a complex polymer of phenylpropane units, which are cross-linked to each other with a varietyof different chemical bonds. This complexity has thus far proven as resistant to detailed biochemicalcharacterization as it is to microbial degradation, which greatly impedes our understanding of its effects.Nonetheless, some organisms, particularly fungi, have developed the necessary enzymes to break ligninapart. The initial reactions are mediated by extracellular lignin and manganese peroxidases, primarilyproduced by white-rot fungi (Kirk and Farrell, 1987. Actinomycetes can also decompose lignin, buttypically degrade less than 20 percent of the total lignin present (Crawford, 1986; Basaglia et al., 1992).Lignin degradation is primarily an aerobic process, and in an anaerobic environment lignin can persist forvery long periods (Van Soest, 1994).
The Effect of Lignin on Biodegradability
http://www.cfe.cornell.edu/compost/calc/lignin.html (1 of 7) [1/16/2001 8:49:27 AM]

Because lignin is the most recalcitrant component of the plant cell wall, the higher the proportion oflignin the lower the bioavailability of the substrate. The effect of lignin on the bioavailability of other cellwall components is thought to be largely a physical restriction, with lignin molecules reducing thesurface area available to enzymatic penetration and activity (Haug, 1993).
Modeling Lignin's Impacts on Biodegradability in Anaerobic Systems
Chandler et al. (1980) formulated a mathematical correction for bioavailability of an organic substratebased on its lignin content. Using data collected from the anaerobic degradation of a range oflignocellulosic materials (40 day retention time), they developed a linear relationship to describe thiseffect:
Kayhanian and Tchobanoglous (1992) proposed using this equation to adjust C/N ratios for mixturecalculations in a sequenced anaerobic / aerobic process. The effect, for highly lignified materials, can besignificant. For example, using their lignin data for newspaper versus office paper:
Material Lignin Content(% of VS)
Biodegradable fractionof VS
Newsprint 21.9 0.217Office paper O.4 0.819
Thus, while about 82% of the carbon in office paper is biodegradable, only 22% of the carbon innewsprint would be available through anaerobic digestion. Put another way, it would take almost 4 tonsof newsprint amendment to provide the same bioavailable carbon as 1 ton of office paper. This clearlyhas significant implications for mixture ratio calculations.
Further evaluation of Chandler et al.'s (1980) relationship compared the predicted biodegradability withlong term (75 day) batch studies in a high-solids anaerobic digestor (Kayhanian, 1995). The predictedbiodegradability of this solid waste mixture based on its lignin content (typically 4%) was 68%, whichwas comparable to the 70% biodegradability measured in the long term batch study.
The linear relationship given by Chandler et al. (1980) is simple, and appears to provide reasonableaccuracy for materials of relatively low lignin content. While Chandler et al.'s relationship makesmechanistic sense for relatively small lignin fractions, materials with a high lignin content may beaffected differently. With a large amount of lignin present, some of the lignin would be overlapping otherlignin molecules rather than cellulose, so the incremental effect will be smaller(Conrad et al., 1984).Recent analysis of extensive databases on the maximum digestibility of lignocellulosic materials in therumen suggests a log-linear relationship provides a better fit (Van Soest, 1996):
The Effect of Lignin on Biodegradability
http://www.cfe.cornell.edu/compost/calc/lignin.html (2 of 7) [1/16/2001 8:49:27 AM]

Applying the formula of Van Soest (1996) to the cell wall fraction, we can calculate an overallbiodegradable carbon content:
This biodegradable carbon content can then be used to calculate biodegradable C/N ratios using the usualformulas. If we apply this equation to newsprint, wheat straw, maple wood chips and poultry manure,using data from the Table of Lignin and Other Constituents of Selected Organic Materials and othersources, we get the following biodegradable C/N ratios (access a No-Frames version of the Table ofLignin here):
MaterialCarbon
(%)(Total)
C/N(Total)
Carbon (%)(biodegradable)
C/N(biodegradable)
Lignin(%)(dry
basis)
Cellwall(%)(dry
basis)
Nitrogen(%)
(dry basis)
newsprint 39.3 115.5 18.4 54.2 20.9 97.0 0.34wheat straw 51.1 88.7 33.6 58.4 23.0 95.0 0.58manure,poultry
43.3 9.6 41.8 9.3 2.0 38.0 4.51
wood chips,maple
49.7 51.2 43.8 45.1 12.7 32.0 0.97
Note, however, that when correcting carbon/nitrogen ratio calculations for lignin content, it may also benecessary to reduce the carbon/nitrogen goal. The typical recommended C/N ratio of 30:1 mustpresumably already include some discount for lignin, which is a component of most commoncarbonaceous materials.
It is also important to remember that these formulas are all based on data from anaerobic systems. Sincelignin is degradable (albeit slowly) in aerobic systems, the restriction on biodegradability will be less inaerobic composting.
Lignin degradation under aerobic conditions
There is some debate and perhaps significant variability in the rate of lignin decomposition in aerobic
The Effect of Lignin on Biodegradability
http://www.cfe.cornell.edu/compost/calc/lignin.html (3 of 7) [1/16/2001 8:49:27 AM]

systems. Lynch and Wood (1985) state that "little, if any, lignin degradation occurs during composting",and Iiyama et al. (1995) assume constant lignin as the basis of their calculations of polysaccharidedegradation. However, Hammouda and Adams (1989) measured lignin degradation ranging from 17% to53% in grass, hay and straw during 100 days of composting, and Tomati et al. (1995) measured a 70%reduction in the lignin content of olive waste compost after 23 days under high moisture (65-83%)thermophillic conditions. Interestingly, after this initially high decomposition rate under thermophillicconditions, Tomati et al. found no further reductions in lignin content during the subsequent 67 daysunder mesophillic conditions. In contrast, in a laboratory incubation study, Horwath et al. (1995)measured 25% lignin degradation during mesophillic composting and 39% during thermophilliccomposting of grass straw during 45 day experiments.
Adding small quantities of nitrogen to woody materials can increase lignin degradation rates. Over a twoweek incubation with a white-rot fungi at 39-40°C (the optimum temperature for growth ofPhanerochaete chrysosporium, the fungi used in this experiment), adding only 0.12% nitrogen (dryweight basis), lignin degradation in alder pulp increased from 5.2% to 29.8% (Yang et al., 1980). In thissame study, the increase in lignin degradation of hemlock pulp with 0.12% supplemental nitrogen wasonly 2.2% to 3.9%, and additional nitrogen did not provide further benefit. The differences between plantspecies is likely related to differences in lignin structure, with gymnosperm lignin composed of coniferylalcohols, angiosperm lignin composed of both coniferyl and sinapyl alcohols, and grass lignin ofconiferyl, sinapyl, and p -coumaryl alcohols (Ladisch et al., 1983).
While significant lignin degradation appears possible during aerobic composting, a number of factors arelikely to affect the decomposition rate. Conditions which favor the growth of white-rot fungi, includingadequate nitrogen, moisture, and temperature, all appear to be important in encouraging lignindecomposition, as does the composition of the lignocellulosic substrate itself.
The impact of lignin degradation on the biodegradability of the remaining carbon has not beenextensively researched. In one of the few studies which might provide such insight, Latham (1979)measured a 5 to 11% increase in anaerobic digestability of barley straw after 3 to 4 week aerobicincubations at 30°C with various pure cultures of white-rot fungal species. Increases in biodegradabilitywould likely be even greater with a mixed culture under themophillic conditions, as evidenced by thelignin degradation rates cited above.
Pretreatment to enhance biodegradability
Biodegradability can be enhanced by pretreatment of lignocellulosic materials, including acid (Grethelin,1985) or alkali treatment (Jackson, 1977; Van Soest, 1994), ammonia and urea (Basaglia et al., 1992;Van Soest, 1994), physical grinding and milling (Ladisch et al., 1983; Fahey et al, 1992), fungaldegradation and steam explosion (Sawada et al, 1995), and combined alkali and heat treatment (Gossettet al., 1976). Gharpuray et al. (1983) examined several of these pretreatment options individually and incombination, and found that those treatments which enhanced specific surface area were most effectiveat increasing enzymatic hydrolysis.
While pretreatment may be uneconomical when considered as a separate process in compost feedstockpreparation, in some cases it may be incorporated in other preprocessing operations at little additionalcost. However, because many lignocellulosic ingredients in composting serve dual roles as energy
The Effect of Lignin on Biodegradability
http://www.cfe.cornell.edu/compost/calc/lignin.html (4 of 7) [1/16/2001 8:49:27 AM]
sources and porosity enhancers, treatments which reduce porosity and pore size distributions may provecounterproductive to maintaining an aerobic process.
Summary and Conclusions
Researchers have developed quantitative relationships between lignin content and the biodegradability oflignocellulosic materials during anaerobic digestion. However, before applying these formulas to aerobiccomposting other factors should be considered. Several studies indicate significant biodegradation oflignin can occur during composting, which would increase the availability of other plant cell wallmaterials. Bioavailability will also be affected by particle size and other factors for which no quantitativecorrection presently exists. When analyzing aerobic composting systems, the mathematical relationshipsdeveloped by Chandler et al. (1980) and Van Soest (1996) are best used in a comparative sense, to helpunderstand the differences in bioavailability of different composting substrates.
Acknowledgment
Martin Traxler provided very helpful discussions and comments during the creation of this document.
References
Basaglia, M. , G. Concheri, S. Cardinali, M.B. Pasti-Grigsby, and M.P. Nuti. 1992. Enhanceddegradation of ammonium-pretreated wheat straw by lignocellulolytic Streptomyces spp. CanadianJournal of Micorbiology 38(10):1022-1025. Return to citation in text.
Chandler, J.A., W.J. Jewell, J.M. Gossett, P.J. Van Soest, and J.B. Robertson. 1980. Predicting methanefermentation biodegradability. Biotechnology and Bioengineering Symposium No. 10, pp. 93-107.Return to citation in text.
Conrad, H.R., W.P. Weiss, W.O. Odwongo, and W.L. Shockey. 1984. Estimating net energy of lactationfrom components of cell solubles and cell walls. J. Dairy Sci. 67:427-436. Return to citation in text.
Crawford, D.L. 1986. The role of actinomycetes in the decomposition of lignocellulose. FEMS Symp.34:715-728. Return to citation in text.
Fahey, G.C., Jr., L.D. Bourguin, E.C. Titgemeyer, and D.G. Atwell. 1992. Post-harvest treatment offibrous feedstuffs to improve their nutritive value. pp 715-755. In: Forage Cell Wall Structure andDigestibility. H.G. Hung, D.R/ Buxton, R.D.Hatfield, and J. Ralph, (eds.). American Society ofAgronomy, Madison, WI. Return to citation in text.
Gharpuray, M.M., Y.-H. Lee, and L.T. Fan. 1983. Structural modification of lignocellulosics bypretreatments to enhance enzymatic hydrolysis. Biotechnology and Bioengineering 25(11):157-172.Return to citation in text.
Gossett, J.M., J.B. Healy, Jr., W.F. Owen, D.C. Stuckey, L.Y. Young, and P.L. McCarty. 1976. HeatTreatment of Refuse for Increasing Anaerobic Biodegradability. Final Report. ERDA/NST/7940-7612.National Technical Invormation Service, Springfield, VA. Return to citation in text.
Grethelin, H.E. 1985. The effect of pore size distribution on the rate of enzymatic hydrolysis of cellulosicsubstrates. Bio/Technology 3:155-160, Return to citation in text.
The Effect of Lignin on Biodegradability
http://www.cfe.cornell.edu/compost/calc/lignin.html (5 of 7) [1/16/2001 8:49:27 AM]

Hammouda, G.H.H. and W.A. Adams. 1989. The decomposition, humification and fate of nitrogenduring the composting of some plant residues. pp 245-253. In: Compost: Production, Quality and Use.M. De Bertoldi, M. P. Ferranti, P. L'Hermite, and F. Zucconi (eds.). Elsevier Applied Science. London.853 pp. Return to citation in text.
Haug, R.T. 1993. The Practical Handbook of Compost Engineering. Lewis Publishers, Boca Raton, Fl.717 pages. Return to citation in text.
Howarth, W.R., L.F. Elliott, and D.B. Churchill. 1995. Mechanisms regulating composting of highcarbon to nitrogen ratio grass straw. Compost Science and Utilization 3(3):22-30. Return to citation intext.
Iiyama, K., T.B.T. Lam, B.A. Stone, P.S. Perrin, and B.J. Macauley. 1995. Compositional changes incomposts during composting and mushroom growth: comparison of conventional and environmentallycontrolled composts from commercial farms. Compost Science and Utilization 3(3):14-21. Return tocitation in text.
Jackson, M.B. 1977. Review article: The alkali treatment of straws. Animal Feed Science andTechnology 2:105-130. Return to citation in text.
Kayhanian, M. 1995. Biodegradability of the organic fraction of municipal solid waste in a high-solidsanaerobic digestor. Waste Management and Research 13:123-136. Return to citation in text.
Kayhanian, M. and Tchobanoglous, G. 1992. Computation of C/N ratios for various organic fractions.BioCycle 33 (5):58-60. Return to citation in text.
Kirk, T.K. and R.L. Farrell. 1987. Enzymatic "combustion": the microbial degradation of lignin. Annu.Rev. Microbiol. 41:465-505. Return to citation in text.
Ladisch, M.R., K.W. Lin, M. Voloch, and G.T. Tsao. 1983. Process considerations in the enzymatichydrolysis of biomass. Enzyme Microb. Technol. 5(2):82-102. Return to citation in text.
Latham, M.J. Pretreatment of barley straw with white-rot fungi to improve digestion in the rumen. pp131-137. In: Straw Decay and its Effect on Disposal and Utilization. E. Grossbard (ed.). John Wiley &Sons, Chichester. 337 pp. Return to citation in text.
Lynch, J.M. and D.A. Wood. 1985. Controlled microbial degradation of lignocellulose: the basis forexisting and novel approaches to composting. pp 183-193.In: Composting of Agricultural and OtherWastes. J. K. R. Gasser (ed.). Elsevier Applied Science. Return to citation in text.
Lynch, J.M. 1992. Substrate availability in the production of composts.Proceedings of the InternationalComposting Research Symposium. H.A.J. Hoitink and H. Keener (Editors). pp 24-35. Return to citationin text.
Sawada, T., Y. Nakamura, F. Kobayashi, M. Kuwahara,and T. Watanabe. 1995. Effects of fungalpretreatment and steam explosion pretreatment on enzymatic saccharification of plant biomass.Biotechnology and Bioengineering 48: 719-724. Return to citation in text.
The Effect of Lignin on Biodegradability
http://www.cfe.cornell.edu/compost/calc/lignin.html (6 of 7) [1/16/2001 8:49:27 AM]
Tomati, U., E. Galli, L. Pasetti, and E. Volterra. 1995. Bioremediation of olive-mill wastewaters bycomposting. Waste Management and Research 13:509-518. Return to citation in text.
Van Soest, P.J. 1994. The Nutritional Ecology of the Ruminant, 2nd edition. Cornell University Press.Ithaca, NY. 476 pp. Return to citation in text.
Van Soest, P.J. 1996. Personal communication. Return to citation in text.
Yang, H. H., M. J. Effland, and T. K. Kirk. 1980. Factors influencing fungal degradation of lignin in arepresentative lignocellulosic, thermomechanical pulp. Biotechnology and Bioengineering 22(1):65-77.Return to citation in text.
CornellComposting
Science &Engineering
Compostingin Schools
Resources Contacts
For general questions about composting, please browse this and other composting websites, or make useof the compost listserves.
For specific comments related to this page, please contact the Cornell Waste Management Institute(format and style), or Tom Richard (technical content).
This page was created on April 9, 1996This page was last updated on October 2000
The Effect of Lignin on Biodegradability
http://www.cfe.cornell.edu/compost/calc/lignin.html (7 of 7) [1/16/2001 8:49:27 AM]

Back to the Cornell Composting Homepage
Lignin and Other Constituents ofSelected Organic Materials
Substrate Lignin Cell Wall Lignin/cell wall Crude Protein Cell Soluble Wheat straw 8.9 77.1 11.6 9.3 22.9 Corn stalks 3.9 49.6 7.8 6.6 50.4Corn leaves 3.8 59.3 6.5 19.0 40.7 Cattails 8.5 63.5 13.4 13.6 36.5 Treated kelp 6.0 33.2 18.1 30.0 66.8 Water hyacinth 8.7 60.1 14.5 17.7 39.9 Corn meal 2.0 21.6 9.1 11.1 78.4 Newsprint 20.9 88.7 23.6 5.1 11.3 Elephant m. 10.4 77.4 13.5 7.0 22.6 Chicken m. 3.4 454.2 7.5 33.9 54.8 Pig m. 2.2 40.5 5.4 27.6 59.5 Cow m. 8.1 57.1 14.1 19.4 42.9 Cow m. 7.9 52.3 15.1 20.1 47.7 Cow m. 10.1 62.9 16.1 17.2 37.1 Pin cherry 8.98 26.2 34.3 1.77 Yellow birch 12.0 42.5 28.2 1.42 Sugar maple 8.49 32.5 26.1 0.97 Beech 12.7 61.5 20.7 1.55
CornellComposting
Science &Engineering
Compostingin Schools
Resources Contacts
Substrate Compostition Table
http://www.cfe.cornell.edu/compost/lignin.table.html (1 of 2) [1/16/2001 8:49:30 AM]

For general questions about composting, please browse this and other composting websites, or make useof the compost listserves.
For specific comments related to this page, please contact the Cornell Waste Management Institute(format and style), or Tom Richard (technical content).
This page was created on September 4, 1996This page was last updated on September 4, 1996
Substrate Compostition Table
http://www.cfe.cornell.edu/compost/lignin.table.html (2 of 2) [1/16/2001 8:49:30 AM]

The Effect of Particle Size on BioavailabilityTom Richard
Decomposition occurs primarily on or near the surfaces of particles, where oxygen diffusion into theaqueous films covering the particle is adequate for aerobic metabolism, and the substrate itself is readilyaccessible to microorganisms and their extracellular enzymes. Small particles have more surface area perunit mass or volume than large particles, so if aeration is adequate small particles will degrade morequickly. Experiments have shown that the process of grinding compost materials can increase thedecomposition rate by a factor of two (Gray and Sherman, 1970). Gray et al. (1971) recommend aparticle size of 1.3 to 7.6 cm (0.5 to 2 inches), with the lower end of this scale suitable for forced aerationor continuously mixed systems, and the upper end for windrow and other passively aerated systems.
A theoretical calculation by Haug (1993) suggests that for particles larger than 1 mm in thickness,oxygen may not diffuse all the way into the center of the particle. Thus the interior regions of largeparticles are probably anaerobic, and decomposition rates in this region are correspondingly slow.However, anaerobic conditions are more of a problem with small particles, as the resulting narrow poresreadily fill with water due to capillary action. These issues are addressed more fully in the section onfactors leading to anaerobic conditions.
References:
Gray, K.R., and K. Sherman, 1970. Public Cleansing 60(7):343-354.Gray, K.R., K. Sherman, and A.J. Biddlestone. Process Biochemistry 6(10):22-28.Haug, R.T., 1993. Practical Handbook of Compost Eng'g. Lewis Publishers, Boca Ratan, FL. p.411.
The effect of Particle Size on Bioavailability
http://www.cfe.cornell.edu/compost/calc/partsize.html (1 of 2) [1/16/2001 8:49:33 AM]

CornellComposting
Science &Engineering
Compostingin Schools
Resources Contacts
The effect of Particle Size on Bioavailability
http://www.cfe.cornell.edu/compost/calc/partsize.html (2 of 2) [1/16/2001 8:49:33 AM]
Estimating Carbon contentTom Richard
If you know the nitrogen content for an ingredient, but not the carbon content or the C/N ratio, you canestimate the % C based on the volatile solids content if that value is known or can be measured. VolatileSolids (VS) are the components (largely carbon, oxygen, and nitrogen) which burn off an already drysample in a laboratory furnace at 500-600°C, leaving only the ash (largely calcium, magnesium,phosporus, potassium, and other mineral elements that do not oxidize). For most biological materials thecarbon content is between 45 to 60 percent of the volatile solids fraction. Assuming 55 percent (Adams etal., 1951), the formula is:
% Carbon = (% VS) / 1.8where % VS = 100 - % Ash
References
Adams, R. C., F. S. MacLean, J. K. Dixon, F. M. Bennett, G. I. Martin, and R. C. Lough. 1951. Theutilization of organic wastes in N.Z.: Second interim report of the inter-departmental committee. NewZealand Engineering (November 15, 1951):396-424. Return to citation in text.
CornellComposting
Science &Engineering
Compostingin Schools
Resources Contacts
Estimating Carbon content
http://www.cfe.cornell.edu/compost/calc/carbon.html [1/16/2001 8:49:33 AM]
Solving the Moisture and Carbon-NitrogenEquations SimultaneouslyTom Richard
In high school algebra we learn that for any number of independent equations we can usually solve forthat same number of unknowns. In this case we have two equations (one for moisture and one for thecarbon-nitrogen ratio), and we can solve them for any two unknowns. Normally we use this approach todevelop a mix ratio of several different ingredients, knowing the moisture, carbon, and nitrogen contentsof each. If we specify the quantities of all but two ingredients, and the C/N and moisture content we'dlike to achieve in the mixture, we can solve for those two remaining quantities to get the mix we want.
In selecting which material quantities to specify and which to solve for as unknowns, it is important touse a little common sense. If your moisture goal is 60%, and you are trying to compost wet leaves,sawdust, grass, and food scraps, it would be smart to make sawdust one of the unknown quantities, sinceall the other materials are likely to have moisture contents greater than 60%. There is no way to bring themoisture content of a mix down by adding more of a wet ingredient, and, similarly, there is no way tobring the C/N ratio up by adding high nitrogen materials.
Another useful tip, particularly for dry ingredients, is to include water as one of the unknowns. Waterwill bring up the moisture content without altering the C/N ratio. And since water is cheap and usuallyreadily available, it can be an easy way to develop an appropriate mix.
The solution can be obtained in a number of ways using linear algebra or matrices. With patience, onecan use simple algebraic methods to solve the moisture equation for one of the unknown quantities, andthen substitute that value in the C/N equation and solve the C/N equation for the other unknown. At thatpoint, back-substitution into the solution of the moisture equation gives both unknowns in terms ofknown values.
The algebraic manipulations required for a mixture of three materials are fairly straightforward but dotake a little time, as is evident from the solution below.
The three ingredient equation for moisture is:
Solving the Moisture and Carbon-Nitrogen Equations Simultaneously
http://www.cfe.cornell.edu/compost/calc/simultaneous.html (1 of 5) [1/16/2001 8:49:37 AM]
in which: Qn = mass of material n ("as is", or "wet weight") G = moisture goal (%) Mn = moisture content (%) of material n
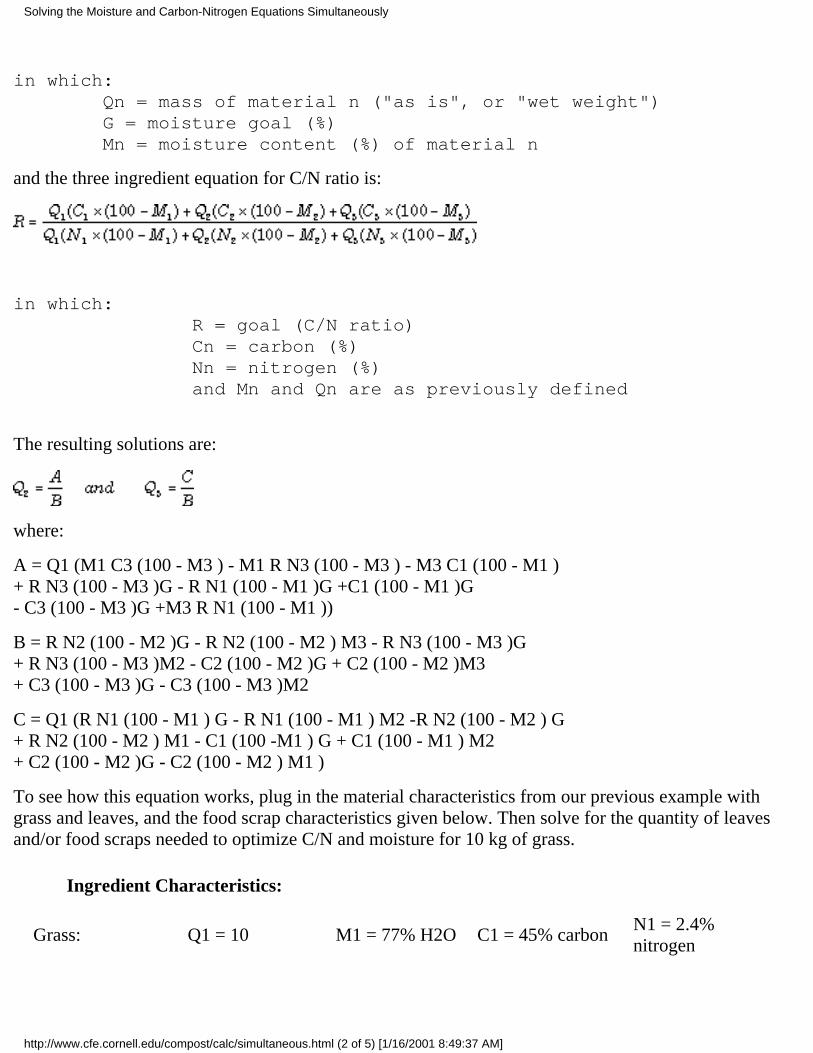
and the three ingredient equation for C/N ratio is:
in which: R = goal (C/N ratio) Cn = carbon (%) Nn = nitrogen (%) and Mn and Qn are as previously defined
The resulting solutions are:
where:
A = Q1 (M1 C3 (100 - M3 ) - M1 R N3 (100 - M3 ) - M3 C1 (100 - M1 )+ R N3 (100 - M3 )G - R N1 (100 - M1 )G +C1 (100 - M1 )G- C3 (100 - M3 )G +M3 R N1 (100 - M1 ))
B = R N2 (100 - M2 )G - R N2 (100 - M2 ) M3 - R N3 (100 - M3 )G+ R N3 (100 - M3 )M2 - C2 (100 - M2 )G + C2 (100 - M2 )M3+ C3 (100 - M3 )G - C3 (100 - M3 )M2
C = Q1 (R N1 (100 - M1 ) G - R N1 (100 - M1 ) M2 -R N2 (100 - M2 ) G+ R N2 (100 - M2 ) M1 - C1 (100 -M1 ) G + C1 (100 - M1 ) M2+ C2 (100 - M2 )G - C2 (100 - M2 ) M1 )
To see how this equation works, plug in the material characteristics from our previous example withgrass and leaves, and the food scrap characteristics given below. Then solve for the quantity of leavesand/or food scraps needed to optimize C/N and moisture for 10 kg of grass.
Ingredient Characteristics:
Grass: Q1 = 10 M1 = 77% H2O C1 = 45% carbonN1 = 2.4%nitrogen
Solving the Moisture and Carbon-Nitrogen Equations Simultaneously
http://www.cfe.cornell.edu/compost/calc/simultaneous.html (2 of 5) [1/16/2001 8:49:37 AM]

Leaves: Q2 = ? M2 = 35% H2O C2 = 50% carbonN3 = 0.75%nitrogen
Food scraps: Q3 = ? M3 = 80% H2O C3 = 42% carbonN3 = 5.0%nitrogen
Mixture Goals:
Moisture: G = 60%
C/N ratio: R = 30
A = 10 x (77 x 42 x (100 - 80) - 77 x 30 x 5.0 x (100 - 80) - 80 x 45 x (100 - 77)+ 30 x 5.0 x (100 - 80) x 60 - 30 x 2.4 x (100 - 77) x 60 +45 x (100 - 77) x 60- 42 x (100 - 80) x 60 +80 x 30 x 2.4 x (100 - 77))
A = -243,000
B = 30 x 0.75 x (100 - 35) x 60 - 30 x 0.75 x (100 - 35) x 80 - 30 x 5.0 x (100 - 80) x 60+ 30 x 5.0 x (100 - 80) x 35 - 50 x (100 - 35) x 60 + 50 x (100 - 35) x 80+ 42 x (100 - 80) x 60 - 42 x (100 - 80) x 35
B = - 18,250
C = 10 x (30 x 2.4 x (100 - 77) x 60 - 30 x 2.4 x (100 - 77) x 35- 30 x 0.75 x (100 - 35) x 60 + 30 x 0.75 x (100 - 35) x 77 - 45 x (100 - 77) x 60+ 45 x (100 - 77) x 35 + 50 x (100 - 35) x 60 - 50 x (100 - 35) x 77 )
C = -148,625
Remembering that
we find that:
Q2 = 13.31 kg and Q3 = 8.14 kg
Thus if we mix 13 kg of leaves and 8 kg of food scraps with the initial 10 kg grass clippings, the mixturewill achieve our goals of 60% moisture and a 30:1 C/N ratio.
Note that this simultaneous solution for three ingredients depends entirely on having the right threeingredients to combine. With many combinations the resulting Q2 and/or Q3 will be negative, indicatingthat no solution is possible. In that case you can add an additional material to add to the mix, such assawdust or wood chips if the moisture or nitrogen levels are too high. Of course, if we add moreingredients, we also need a different formula to determine the solution.
For increasing numbers of materials, this formula becomes even more complicated. The solution for amixture of four ingredients follows.
Solving the Moisture and Carbon-Nitrogen Equations Simultaneously
http://www.cfe.cornell.edu/compost/calc/simultaneous.html (3 of 5) [1/16/2001 8:49:37 AM]
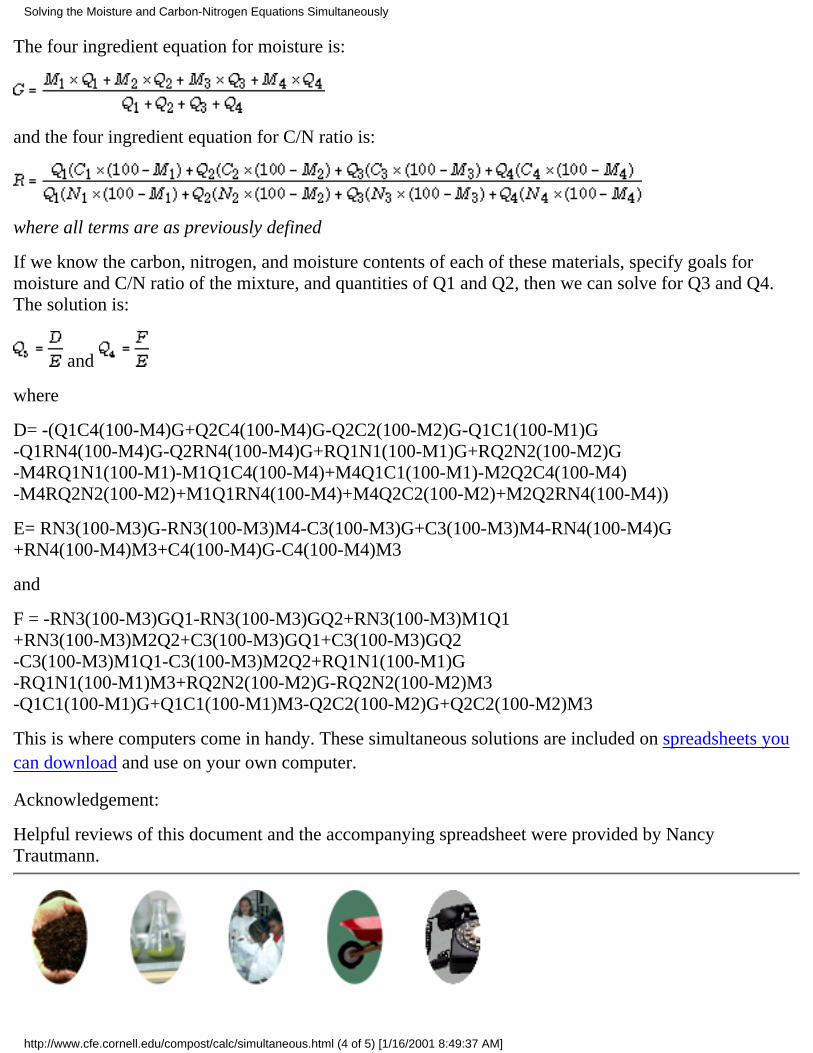
The four ingredient equation for moisture is:
and the four ingredient equation for C/N ratio is:
where all terms are as previously defined
If we know the carbon, nitrogen, and moisture contents of each of these materials, specify goals formoisture and C/N ratio of the mixture, and quantities of Q1 and Q2, then we can solve for Q3 and Q4.The solution is:
and
where
D= -(Q1C4(100-M4)G+Q2C4(100-M4)G-Q2C2(100-M2)G-Q1C1(100-M1)G-Q1RN4(100-M4)G-Q2RN4(100-M4)G+RQ1N1(100-M1)G+RQ2N2(100-M2)G-M4RQ1N1(100-M1)-M1Q1C4(100-M4)+M4Q1C1(100-M1)-M2Q2C4(100-M4)-M4RQ2N2(100-M2)+M1Q1RN4(100-M4)+M4Q2C2(100-M2)+M2Q2RN4(100-M4))
E= RN3(100-M3)G-RN3(100-M3)M4-C3(100-M3)G+C3(100-M3)M4-RN4(100-M4)G+RN4(100-M4)M3+C4(100-M4)G-C4(100-M4)M3
and
F = -RN3(100-M3)GQ1-RN3(100-M3)GQ2+RN3(100-M3)M1Q1+RN3(100-M3)M2Q2+C3(100-M3)GQ1+C3(100-M3)GQ2-C3(100-M3)M1Q1-C3(100-M3)M2Q2+RQ1N1(100-M1)G-RQ1N1(100-M1)M3+RQ2N2(100-M2)G-RQ2N2(100-M2)M3-Q1C1(100-M1)G+Q1C1(100-M1)M3-Q2C2(100-M2)G+Q2C2(100-M2)M3
This is where computers come in handy. These simultaneous solutions are included on spreadsheets youcan download and use on your own computer.
Acknowledgement:
Helpful reviews of this document and the accompanying spreadsheet were provided by NancyTrautmann.
Solving the Moisture and Carbon-Nitrogen Equations Simultaneously
http://www.cfe.cornell.edu/compost/calc/simultaneous.html (4 of 5) [1/16/2001 8:49:37 AM]

CornellComposting
Science &Engineering
Compostingin Schools
Resources Contacts
Solving the Moisture and Carbon-Nitrogen Equations Simultaneously
http://www.cfe.cornell.edu/compost/calc/simultaneous.html (5 of 5) [1/16/2001 8:49:37 AM]

Compost Mixture Calculation SpreadsheetsYou can download spreadsheets with built in equations to solve compost mixture calculations for up to 4ingredients. Spreadsheets are provided in several common Macintosh and DOS/Windows formats. Usethe one that is most current for your spreadsheet software. You can also ftp these files fromftp://www.cfe.cornell.edu/compost/
Note: if your spreadsheet software package is not listed, try downloading one of the earlier versionsprovided and importing it to your spreadsheet package.
Apple Macintosh Operating System
These files are compressed using Stuffit and encoded with BinHex:
Excel for Macintosh, Version 3●
Excel for Macintosh, Version 5●
Dos/Windows Operating System
Excel, Version 3●
Excel, Version 5●
Lotus Worksheet version 1●
Lotus Worksheet version 3●
Lotus Worksheet version 4●
Compost Mixture Calculation Spreadsheets
http://www.cfe.cornell.edu/compost/download.html (1 of 2) [1/16/2001 8:49:37 AM]

CornellComposting
Science &Engineering
Compostingin Schools
Resources Contacts
Compost Mixture Calculation Spreadsheets
http://www.cfe.cornell.edu/compost/download.html (2 of 2) [1/16/2001 8:49:37 AM]

Ideas for Student Research Projects
Compost Ingredients
Garden supply stores and catalogs often sell compost "starters," which supposedly speed up thecomposting process. Develop a recipe for a compost starter and design a research project to test its effecton the compost temperature profile.
How well do human nutrition concepts apply to compost microorganisms? For example, will themicrobes get a "sugar high," demonstrated by a quick, high temperature peak when fed sugary foods,compared with a longer but lower peak for more complex carbohydrates?
Measure the pH of a number of different compost mixes. How does the pH of initial ingredients affectthe pH of finished compost?
Some instructions call for adding lime to increase the pH when compost ingredients are mixed. Otherinstructions caution to avoid this because it causes a loss of nitrogen. How does adding various amountsof lime to the initial ingredients affect the pH of finished compost?
Microorganisms
Composting recipes sometimes call for inoculating the pile by mixing in a few handfuls of finishedcompost. Is there any observable difference in appearance of microbes between systems that have andhave not been inoculated?
Does the pH of the initial compost ingredients affect the populations of microorganisms duringcomposting?
Compost Physics
What type of insulation works best for soda bottle bioreactors? Does it help to have a reflective layer? Dodifferent insulative materials or different thicknesses affect the temperature profile?
When constructing compost bins or piles, some people incorporate perforated pipe, wire mesh, or othersystems to increase passive air flow. What is the effect of different methods of aeration on thetemperature profile of any one compost system?
Compost Research Possibilities
http://www.cfe.cornell.edu/compost/ResearchIdeas.html (1 of 3) [1/16/2001 8:49:40 AM]

How do various means and schedules for turning a pile affect the temperature profile and the time neededfor production of finished compost?
What is the effect of forced aeration (with an aquarium pump or similar apparatus) on the temperatureprofile in a soda bottle or a two-can bioreactor?
Try mixing the same ingredients in a large outdoor pile, a two-can bioreactor, and a soda bottlebioreactor. Which system reaches the hottest temperatures? Which remains hot the longest? How doesthis affect the compost produced?
What is the effect of layering versus mixing organic ingredients on the compost pile temperature profile?
Worm Composting
Do organic wastes in compost break down more readily in the presence of worms than throughcomposting that depends solely on microbial decomposition?
In some experiments, plants have not show increased growth when planted in fresh worm castings. Doesaging or "curing" worm castings increase their ability to enhance plant growth? Are there chemicaldifferences between fresh and older worm castings? Should worm compost be mixed with soil beforebeing used to grow plants?
How do different food sources affect reproductive and growth rates of red worms (Eisenia fetida)?
Red worms grow best in wastes with pH between 5.0 and 8.0. How sensitive are their cocoons to pH?Will they hatch after being exposed to extreme pH? How sensitive are they to extreme drought ortemperatures?
Effects of Compost on Plant Growth
Some leaves, such as those of black walnut or eucalyptus trees, contain chemicals that inhibit growth ofother plants. Are these compounds broken down by composting?
Finished compost is near neutral pH. Can you design an experiment to answer one or more of thefollowing questions: Is compost detrimental to use on acid-loving plants such as blueberries or azaleas?Does compost buffer the soil pH, making it harder to provide acidic conditions? How does it compare topeat moss in this regard?
Water in which compost has been soaked (often called compost tea) is said to be beneficial to plants. Canyou design experiments to test whether different types, concentrations, and amounts of compost teaenhance plant growth?
In China, farmers dig parallel trenches and fill them with organic wastes mixed with cocoons of Eiseniafetida. Soybeans planted in rows between the trenches are highly productive. Can you design and test aplanting system using vermicompost?
These are a few ideas about possibilities for student research projects on composting. For more ideas,plus detailed information about techniques for carrying out composting experiments, refer to the newbook, Composting in the Classroom: Scientific Inquiry for High School Students, by N.M.
Compost Research Possibilities
http://www.cfe.cornell.edu/compost/ResearchIdeas.html (2 of 3) [1/16/2001 8:49:40 AM]

Trautmann and M.E. Krasny. ISBN 0-7872-4433-3.
Available from Kendall/Hunt Publishing Company at 1-800-228-0810 (US) or1-319-589-1000 (International).
CornellComposting
Science &Engineering
Compostingin Schools
Resources Contacts
Credits
Compost Research Possibilities
http://www.cfe.cornell.edu/compost/ResearchIdeas.html (3 of 3) [1/16/2001 8:49:40 AM]
Monitoring the Composting ProcessAs composting proceeds, a number of changes occur in its physical, chemical, and biologicalcharacteristics. Monitoring some of these variables will help you to assess the status of your compost andto compare the progress of systems with different initial conditions or ingredients.
Moisture●
Temperature●
pH●
Odor●
Invertebrates●
Microbes●
Volatile Solids●
CornellComposting
Science &Engineering
Compostingin Schools
Resources Contacts
Credits
Monitoring the Composting Process
http://www.cfe.cornell.edu/compost/monitor/monitoring.html [1/16/2001 8:49:40 AM]
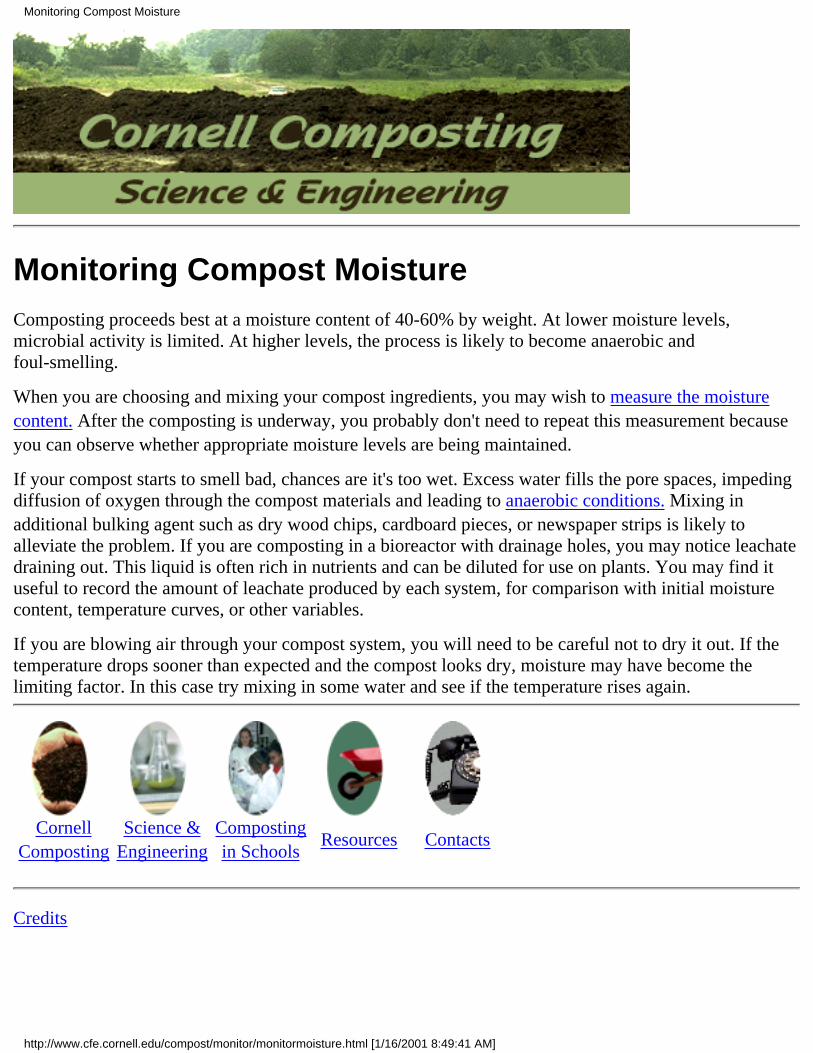
Monitoring Compost MoistureComposting proceeds best at a moisture content of 40-60% by weight. At lower moisture levels,microbial activity is limited. At higher levels, the process is likely to become anaerobic andfoul-smelling.
When you are choosing and mixing your compost ingredients, you may wish to measure the moisturecontent. After the composting is underway, you probably don't need to repeat this measurement becauseyou can observe whether appropriate moisture levels are being maintained.
If your compost starts to smell bad, chances are it's too wet. Excess water fills the pore spaces, impedingdiffusion of oxygen through the compost materials and leading to anaerobic conditions. Mixing inadditional bulking agent such as dry wood chips, cardboard pieces, or newspaper strips is likely toalleviate the problem. If you are composting in a bioreactor with drainage holes, you may notice leachatedraining out. This liquid is often rich in nutrients and can be diluted for use on plants. You may find ituseful to record the amount of leachate produced by each system, for comparison with initial moisturecontent, temperature curves, or other variables.
If you are blowing air through your compost system, you will need to be careful not to dry it out. If thetemperature drops sooner than expected and the compost looks dry, moisture may have become thelimiting factor. In this case try mixing in some water and see if the temperature rises again.
CornellComposting
Science &Engineering
Compostingin Schools
Resources Contacts
Credits
Monitoring Compost Moisture
http://www.cfe.cornell.edu/compost/monitor/monitormoisture.html [1/16/2001 8:49:41 AM]

Monitoring Compost TemperatureTemperature is one of the key indicators in composting. Is the system heating up? How hot does it get?How long does it remain hot? How does mixing affect the temperature profile?
Heat is generated as a byproduct of microbial breakdown of organic material, and you can use thetemperature of your compost to gauge how well the system is working and how far along thedecomposition has progressed. For example, if your compost heats up to 40 or 50C, you can deduce thatthe ingredients contained adequate nitrogen and moisture for rapid microbial growth.
To take your temperature readings, make sure to use a probe that reaches deep into the compost. Leavethe probe in place long enough for the reading to stabilize, then move it to a new location. Take readingsin several locations, including at various depths from the top and sides. Compost may have hotter andcolder pockets depending on the moisture content and chemical composition of ingredients. Can you findtemperature gradients with depth? Where do you find your hottest readings? For systems in which airenters from the bottom, the hottest locations tend to be two-thirds or more of the way up. Is this true foryour system?
By graphing compost temperature over time, you can tell how far along the decomposition hasprogressed. A well constructed compost system will heat up to 40 or 50C within two to three days. Asreadily decomposable organic matter becomes depleted, the temperature begins to drop and the processslows considerably.
The temperature at any point depends primarily on how much heat is being produced by microorganismsand how much is lost through aeration and surface cooling. How long the system remains hot thereforedepends on the chemical composition of the ingredients as well as the size and shape of the system.Moisture content also affects temperature change; since water has a higher specific heat than most othermaterials, drier compost mixtures tend to heat up and cool off more quickly than wetter mixtures,providing adequate moisture levels for microbial growth are maintained.
You may decide to design your compost experiments to look for variables or combinations of variablesthat produce the highest temperatures in the shortest amount of time, or perhaps those that maintain hottemperatures for the longest period. One useful way to analyze your data might be to plot the maximumtemperature and the time to reach maximum temperature for each compost system as a function of theexperimental variable. For example, you could plot the maximum temperature for each system versus thepercent moisture of the compost ingredients.
Monitoring Compost Temperature
http://www.cfe.cornell.edu/compost/monitor/monitortemp.html (1 of 2) [1/16/2001 8:49:42 AM]

For more information on the science of compost temperatures, go to the Physics of Composting.
CornellComposting
Science &Engineering
Compostingin Schools
Resources Contacts
Credits
Monitoring Compost Temperature
http://www.cfe.cornell.edu/compost/monitor/monitortemp.html (2 of 2) [1/16/2001 8:49:42 AM]

Monitoring Compost pH
Why is compost pH worth measuring? Primarily because you can use it to follow the process ofdecomposition. Compost microorganisms operate best under neutral to acidic conditions, with pH's in therange of 5.5 to 8. During the initial stages of decomposition, organic acids are formed. The acidicconditions are favorable for growth of fungi and breakdown of lignin and cellulose. As compostingproceeds, the organic acids become neutralized, and mature compost generally has a pH between 6 and 8.
If anaerobic conditions develop during composting, organic acids may accumulate rather than breakdown. Aerating or mixing the system should reduce this acidity. Adding lime (calcium carbonate)generally is not recommended because it causes ammonium nitrogen to be lost to the atmosphere asammonia gas. Not only does this cause odors, it also depletes nitrogen that is better kept in the compostfor future use by plants.
At any point during composting, you can measure the pH of the mixture. In doing this, keep in mind thatyour compost is unlikely to be homogeneous. You may have found that the temperature varied fromlocation to location within your compost, and the pH is likely to vary as well. You therefore should planto take samples from a variety of spots. You can mix these together and do a combined pH test, or testeach of the samples individually. In either case, make sure to make several replicate tests and to report allof your answers. (Since pH is measured on a logarithmic scale, it doesn't make sense mathematically totake a simple average of your replicates).
pH can be measured using any of the following methods. Whichever method you choose, make sure tomeasure the pH as soon as possible after sampling so that continuing chemical changes will not affectyour results:
Soil Test Kit
Test kits for analysis of soil pH can be used without modification for compost samples. Simply followthe manufacturer's instructions.
pH Paper
If your compost is moist but not muddy, you can insert a pH indicator strip into the compost, let it sit fora few minutes to soak up water, then read the pH using color comparison.
Compost Extractions
Monitoring Compost pH
http://www.cfe.cornell.edu/compost/monitor/monitorph.html (1 of 3) [1/16/2001 8:49:43 AM]
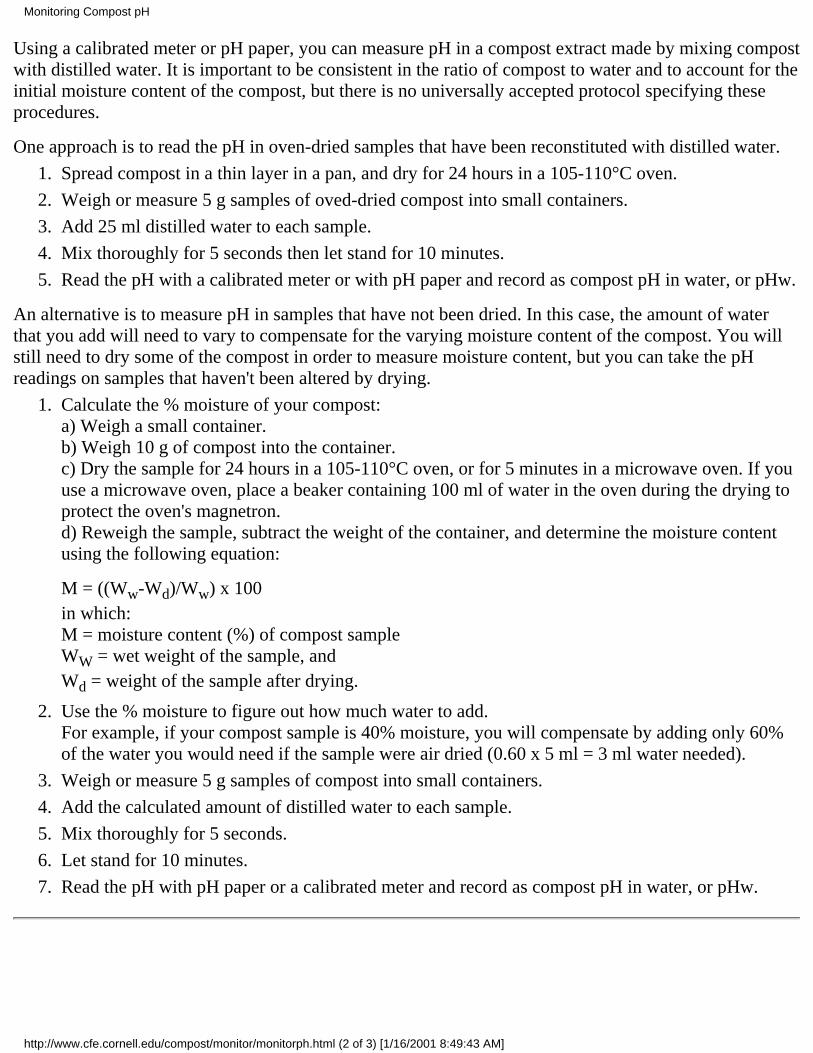
Using a calibrated meter or pH paper, you can measure pH in a compost extract made by mixing compostwith distilled water. It is important to be consistent in the ratio of compost to water and to account for theinitial moisture content of the compost, but there is no universally accepted protocol specifying theseprocedures.
One approach is to read the pH in oven-dried samples that have been reconstituted with distilled water.
Spread compost in a thin layer in a pan, and dry for 24 hours in a 105-110°C oven.1.
Weigh or measure 5 g samples of oved-dried compost into small containers.2.
Add 25 ml distilled water to each sample.3.
Mix thoroughly for 5 seconds then let stand for 10 minutes.4.
Read the pH with a calibrated meter or with pH paper and record as compost pH in water, or pHw.5.
An alternative is to measure pH in samples that have not been dried. In this case, the amount of waterthat you add will need to vary to compensate for the varying moisture content of the compost. You willstill need to dry some of the compost in order to measure moisture content, but you can take the pHreadings on samples that haven't been altered by drying.
Calculate the % moisture of your compost:a) Weigh a small container.b) Weigh 10 g of compost into the container.c) Dry the sample for 24 hours in a 105-110°C oven, or for 5 minutes in a microwave oven. If youuse a microwave oven, place a beaker containing 100 ml of water in the oven during the drying toprotect the oven's magnetron.d) Reweigh the sample, subtract the weight of the container, and determine the moisture contentusing the following equation:
M = ((Ww-Wd)/Ww) x 100in which:M = moisture content (%) of compost sampleWW = wet weight of the sample, andWd = weight of the sample after drying.
1.
Use the % moisture to figure out how much water to add.For example, if your compost sample is 40% moisture, you will compensate by adding only 60%of the water you would need if the sample were air dried (0.60 x 5 ml = 3 ml water needed).
2.
Weigh or measure 5 g samples of compost into small containers.3.
Add the calculated amount of distilled water to each sample.4.
Mix thoroughly for 5 seconds.5.
Let stand for 10 minutes.6.
Read the pH with pH paper or a calibrated meter and record as compost pH in water, or pHw.7.
Monitoring Compost pH
http://www.cfe.cornell.edu/compost/monitor/monitorph.html (2 of 3) [1/16/2001 8:49:43 AM]

CornellComposting
Science &Engineering
Compostingin Schools
Resources Contacts
Credits
Monitoring Compost pH
http://www.cfe.cornell.edu/compost/monitor/monitorph.html (3 of 3) [1/16/2001 8:49:43 AM]

Monitoring Compost OdorsA well-constructed compost system should not produce offensive odors, although it will not be odor-free.You can use your nose to detect potential problems as your composting progresses. For example, if younotice an ammonia odor, your mix probably is too rich in nitrogen (the C/N ratio is too low), and youshould mix in a carbon source such as leaves or wood shavings. If you smell a musty odor, it may bebecause the mix is too moist, which you can correct by adding more of your bulking agent. Leftuncorrected, compost that is too wet may go anaerobic, producing a foul sulfurous odor that is hard toignore. If this occurs in indoor bioreactors, you may wish to take them outside or vent them to theoutside, then aerate or mix thoroughly and add additional absorbant material such as wood chips orsawdust. In an outdoor compost pile, turning the pile may be sufficent to correct the anaerobic condition,although initially this may make the odor even more pronounced.
CornellComposting
Science &Engineering
Compostingin Schools
Resources Contacts
Credits
Monitoring Compost Odors
http://www.cfe.cornell.edu/compost/monitor/monitorodor.html [1/16/2001 8:49:43 AM]

Observing Compost Invertebratesby Elaina Olynciw
Background
In outdoor compost piles, a wide range of invertebrates take part in the decompostion of organic matter.Try monitoring invertebrate life in the pile over the course of the compost process. How long is it beforeyou locate the first invertebrates? What happens to them when the pile heats up? Do you find differentorganisms later on, after the pile cools down?
In indoor container composting you may find fewer (or no) invertebrates, and decomposition isaccomplished by microbes alone.
Materials
light-colored trays or pans●
tweezers, spoons, or tongue depressors●
Procedure
One method of collecting invertebrates is to take grab samples of compost from various locations in theheap. Some organisms such as centipedes and sowbugs will be more likely to be found near the surface.Others will be found deeper in the heap. Spread each compost sample in a large tray or pan, preferablylight in color for maximum contrast. Students should use wooden tongue depressors, plastic spoons, orother instruments that will not hurt the organisms, to sort through the compost. Flashlights andmagnifying lenses can be used to enhance the observation. The larger organisms, such as worms,centipedes, millipedes, sowbugs, earwigs, spiders, ants, beetles, snails, slugs, some mites, etc., can beobserved with the naked eye. To get a closer look, place samples of the compost in petri dishes or watchglasses and observe them under a dissecting microscope.
An alternative method of separating small arthropods in compost is by using a "Berlese funnel". Thismethod will provide a higher concentration of arthropods to view. Place a funnel with a 10-30 cm upperdiameter in a ring stand. Attach a circle of 10mm wire mesh (hardware cloth) or window screen 8 cm
Observing Compost Macroinvertebrates
http://www.cfe.cornell.edu/compost/macroinvertebrates.html (1 of 2) [1/16/2001 8:49:44 AM]

below the funnel. Just below the funnel, place a vial to collect the specimens. Position a light source (25watt) 2.0 - 2.5 cm above the funnel, or place the collecting apparatus in a sunny location. The light andheat drive the negatively phototaxic compost organisms downward through the funnel and into thecollecting jar. If you use too strong a light source, the organisms will dry up and die before making itthrough the funnel.
Place compost in the funnel and then partially fill the vial with water if you want to observe liveorganisms. Observe the organisms about 2 to 4 days later. They will remain alive and float on top of thewater. You can place them in a petri dish or watch glass and observe them under a dissecting microscopeor with a magnifying glass. You should find small arthropods, including many different kinds of mites, afew different insect larvae, springtails, small millipedes, ants, etc.
The organisms can be lifted out with a paint brush and maintained in small chambers of plaster of paris(mixed with powdered charcoal to aid observation). This substrate must be kept continually moist to keepthe arthropods alive. Adding brewer's yeast to the substrate provides a food supply for many species.
A mixture of 90% percent ethanol and 10% glycerol can be used to collect the arthropods if preservedorganisms are needed for quantitative study. A grid of 1.0cm squares can be set up on a petri dish forcounting. Removal of organisms can be accomplished with an angled sewing needle that has been filedflat. The pointed end can be imbedded in a cork or wooden dowel or matchstick. Thin, drawn out pipettescan also be used and rinsed out with alcohol if organisms get stuck.
CornellComposting
Science &Engineering
Compostingin Schools
Resources Contacts
Credits
Observing Compost Macroinvertebrates
http://www.cfe.cornell.edu/compost/macroinvertebrates.html (2 of 2) [1/16/2001 8:49:44 AM]

Observing Compost Microorganisms
Introduction
Observe the microbial communities in your compost over the course of several weeks or months as thecompost heats up and then later returns to ambient temperature. Can you identify differences in microbialcommunities at various stages of the composting process?
Materials
compound microscope●
.85% NaCl (physiological saline)●
methylene blue stain (Prepare stain by adding 1.6 g methylene blue chloride to 100 ml of 95%ethanol, then mixing 30 ml of this solution with 100 ml of 0.01% aqueous solution of KOH)
●
Procedure
Make a wet mount by putting a drop of water or physiological saline on a microscope slide andtransfering a small amount of compost to the drop. Make sure not to add too much compost or youwill not have enough light to observe the organisms.
1.
Stir the compost into the water or saline (the preparation should be watery) and apply a cover slip.2.
Observe under low and high power. You should be able to find many nematodes (they should bevery wiggly), flatworms, rotifers (notice the rotary motion of cilia at the anterior end of the rotiferand the contracting motion of the body), mites, springtails and fast-moving protozoans. Pieces offungi mycelia can be seen, but might be difficult to recognize. Bacteria can be seen as very tiny,roundish particles, which seem to be vibrating in the background.
3.
If you want to observe the bacteria directly, you can prepare a stained slide and observe the slideusing a 100X oil immersion lens. To prepare a stained slide, mix a small amount of compost with adrop of physiological saline on a slide. Spread with a toothpick. Let the mixture air dry until yousee a white dried film on the slide. Next fix the bacteria to the slide by passing the slide through a
4.
Observing Compost Microorganisms
http://www.cfe.cornell.edu/compost/observingmicro.html (1 of 2) [1/16/2001 8:49:45 AM]

hot flame a few times. Stain the slide using methylene blue stain. Flood the slide with themethylene blue stain for one minute and then rinse with distilled water and gently blot dry usingblotting or filter paper.
Fungi and actinomycetes may be difficult to recognize with the above technique because the entireorganism (including the mycelium, reproductive bodies and cells) will probably not remaintogether. Fungi and actinomycetes will be observed best if you can find fungal growth on thesurface of the compost heap. The growth looks fuzzy, powdery, or like a spiderweb. Lift somecompost with the sample on top, and and prepare a slide with cover slip to view under themicroscope. You should be able to see the fungi well under 100X and 400X. The actinomycetescan be heat-fixed and gram-stained to view under oil immersion at 1000X.
5.
To separate nematodes, rotifers, and protozoans, a continuous column of water leading from thecompost to the collection vial is necessary, and the following adaptation of the above methodshould be used: The compost is put into a beaker with the screen stretched across the top and tapedin place. The beaker is then turned over into the funnel. Plastic tubing is placed at the end of thefunnel stem and a screw clamp is placed a few inches below the end of the funnel stem on thepastic tubing.
The plastic tubing should lead into a collection vial or small beaker. The clamp is closed and wateris poured into the funnel until the beaker is about 1/2 filled. After a few days the clamp is slightlyand slowly opened and organisms which have concentrated at the end of the tubing should fall intothe vial.
6.
Techniques for Detailed Study of Compost Microorganisms
This protocol was written by Elaina Olynciw, biology teacher at A. Philip Randolph High School, NewYork City, while working in the laboratory of Dr. Eric Nelson at Cornell University as part of theTeacher Institute of Environmental Sciences.
CornellComposting
Science &Engineering
Compostingin Schools
Resources Contacts
Credits
Observing Compost Microorganisms
http://www.cfe.cornell.edu/compost/observingmicro.html (2 of 2) [1/16/2001 8:49:45 AM]

Determining Volatile Solids and Moisture LossesTom Richard
In large and even medium sized composting systems it can be difficult to directly measure the mass ofsubstrate once the composting process has started, so it is difficult to determine the mass that has beendegraded to CO2 and H2O. For a completely mixed reactor, the ash and volatile solids percents of asample and the original mass data can be used to calculate the volatile solids mass remaining using thefollowing equation:
Note that for any sample, ash and volatile solids are related by:
VS%= 100-Ash%
The reduction in volatile solids concentration is gradual and often small, so replicated samples should beashed to insure a statistically representative result.
You can combine this result with moisture data to determine the moisture loss from the compost. First,calculate the VS loss, and then subtract this DVS from the total dry solids (TS) in the system to get theTS mass at time t (note that the ash fraction of TS is conserved, so the loss of TS is equal to the loss ofVS):
Determining Volatile Solids and Moisture Losses
http://www.cfe.cornell.edu/compost/calc/vs_moistureloss.html (1 of 3) [1/16/2001 8:49:48 AM]

At any point in time, the mass of water remaining in the compost can be calculated from:
In addition to the mass changes in volatile solids or water, one can also calculate the percent reductionsin VS or H2O using the following formulas:
and
Acknowledgement:
Many thanks to Mr. Vladimir Knezevic for correcting an error in the formula for the percentreduction in the mass of water. The corrected formula was posted on this page November 17, 2000.
Determining Volatile Solids and Moisture Losses
http://www.cfe.cornell.edu/compost/calc/vs_moistureloss.html (2 of 3) [1/16/2001 8:49:48 AM]

CornellComposting
Science &Engineering
Compostingin Schools
Resources Contacts
Determining Volatile Solids and Moisture Losses
http://www.cfe.cornell.edu/compost/calc/vs_moistureloss.html (3 of 3) [1/16/2001 8:49:48 AM]

Oxygen Transport
Tom Richard
Convection and diffusion are the two mechanisms by which oxygen moves from the open air into acomposting matrix and ultimately to the microorganisms themselves. Oxygen transport is intimatelyrelated to the moisture content of the compost, as both convection and diffusion are reduced by watersaturated pores. Capillary theory and matric potential relationships provide a theoretical framework forevaluating the effects of moisture content on air filled porosity.
Convection
Convection can be categorized as either "forced" (driven by mechanical means) or "natural" (caused bythe bouyancy of hot air). In a system with mechanical aeration, blowers move air through the larger poresat relatively high velocities. In a passive system, hot air can often be seen slowly rising out of the tops ofpiles, and natural convection pulls cool oxygen rich air in to replace it.
Water filled pores create a major impediment to uniform convective air movement, by creating zones ofhigh resistance. As air short-circuits through unsaturated zones, the aerobic regions generate more heatand become even drier, while the wetter regions become anaerobic. One of the principal functions ofmixing and turning compost is to redistribute moisture, to minimize this preferential airflow and thenonuniform decomposition that results.
Diffusion
While these convective mechanisms are important for the pile overall, oxygen diffusion through thesmaller pores and into the aqueous film surrounding compost particles is essential to maintaining aerobicconditions for the active microorganisms. A saturated matrix also dramatically reduces oxygen diffusion,which is 6000 to 10,000 times greater in air than in water. Diffusion can be mathematically modeled forthe range of conditions in a composting matrix, as described in the pages below:
Oxygen Diffusion
Calculating the oxygen diffusion coefficient in air●
Calculating the oxygen diffusion coefficient in water●
Oxygen Transport
http://www.cfe.cornell.edu/compost/oxygen/oxygen.transport.html (1 of 2) [1/16/2001 8:49:49 AM]

CornellComposting
Science &Engineering
Compostingin Schools
Resources Contacts
For general questions about composting, please browse this and other composting websites, or make useof the compost listserves.
For specific comments related to this page, please contact the Cornell Waste Management Institute(format and style), or Tom Richard (technical content).
Dept. of Agricultural & Biological EngineeringNew York State College of Agriculture and Life SciencesRiley-Robb HallCornell UniversityIthaca, NY 14853-5701Phone: 607-255-2488
This page was created on March 29, 1996This page was last updated on October 2000
Oxygen Transport
http://www.cfe.cornell.edu/compost/oxygen/oxygen.transport.html (2 of 2) [1/16/2001 8:49:49 AM]

Oxygen Diffusion
Tom Richard
Diffusion is a reflection of the fact that molecules, as they vibrate with random motion in a gas or liquid,move toward an equilibrium where all the molecular species in the mixture are uniformly dispersed, andthe concentration of any one species is the same everywhere.
The diffusion equation (Fick's second law), states that the rate of molecular diffusion is proportional tothe second derivative of its concentration. It its most general form this can be written:
Source: Bird et al., 1960.
For a one dimensional concentration gradient of oxygen in air, this simplifies to:
Oxygen Diffusion
http://www.cfe.cornell.edu/compost/oxygen/oxygen.diff.html (1 of 3) [1/16/2001 8:49:51 AM]

For a one dimensional concentration gradient of oxygen in water, the simplified equation is:
In a composting system, the concentration gradient is a function of the rates of oxygen supply andaerobic biodegradation and oxygen uptake (link coming soon). The O2 concentration gradient is thedriving force that moves O2 into the pile by diffusion, and there is a corresponding CO2 gradient drivingdiffusion of CO2 out of the pile. From the practical standpoint of process management, it is the diffusionof O2 that is critical to maintaining aerobic conditions, so that will be the focus of the present analysis.
A detailed discussion is provided for calculating the oxygen diffusion coefficient in air, as well as theprocedure for calculating the oxygen diffusion coefficient in water. Using this analysis, we find that theO2 diffusion coefficient in saturated air (at 15% O2 concentration) is 5700 to 10,800 times greater thanin water (at 60°C and 20°e;C respectively). When oxygen is forced to diffuse through water saturatedpores, this restriction on oxygen transport is one of the most important factors leading to anaerobicconditions.
Reference
Bird, R.B., W.E. Stewart, and E.N. Lightfoot. 1960. Transport Phenomena. John Wiley & Sons. NY. 780pp. Return to citation in text.
CornellComposting
Science &Engineering
Compostingin Schools
Resources Contacts
For general questions about composting, please browse this and other composting websites, or make useof the compost listserves.
For specific comments related to this page, please contact the Cornell Waste Management Institute(format and style), or Tom Richard (technical content).
Dept. of Agricultural & Biological EngineeringNew York State College of Agriculture and Life SciencesRiley-Robb HallCornell UniversityIthaca, NY 14853-5701Phone: 607-255-2488
Oxygen Diffusion
http://www.cfe.cornell.edu/compost/oxygen/oxygen.diff.html (2 of 3) [1/16/2001 8:49:51 AM]

This page was created on March 29, 1996This page was last updated on October 2000
Oxygen Diffusion
http://www.cfe.cornell.edu/compost/oxygen/oxygen.diff.html (3 of 3) [1/16/2001 8:49:51 AM]

Calculating the Oxygen Diffusion Coefficient in Air
Tom Richard
This discussion is part of a section on oxygen transport and oxygen diffusion in compost, which providesbackground on the general concepts and equations.
Diffusion theory for gases is based on the kinetic molecular theory of gases, initially developed byLudwig Boltzman and James C. Maxwell in the 19th century. This theory provides a rigorous set ofequations which allow us to calculation diffusion coefficients under a wide range of conditions.
The Effects of Temperature and Pressure on Diffusion
The diffusion coefficient D is a function of both temperature and pressure. Diffusion increases withincreasing temperature (as molecules move more rapidly), and decreases with increasing pressure (whichpacks more molecules in a given volume, making it harder for them to move). These temperature andpressure effects are illustrated by equation (1),which applies to the diffusion coefficient between any twocomponents of a mixture (called a binary pair):
Source: Bird et al., 19601; Welty et al., 19842
For binary pairs of oxygen with nitrogen, carbon dioxide, and water, and in the temperature range from
0°C to 80°C, ranges from about 1.3 to 3.5. Using tabulated values for for each of the gases
Oxygen Diffusion/Air
http://www.cfe.cornell.edu/compost/oxygen/oxygen.diff.air.html (1 of 4) [1/16/2001 8:49:55 AM]
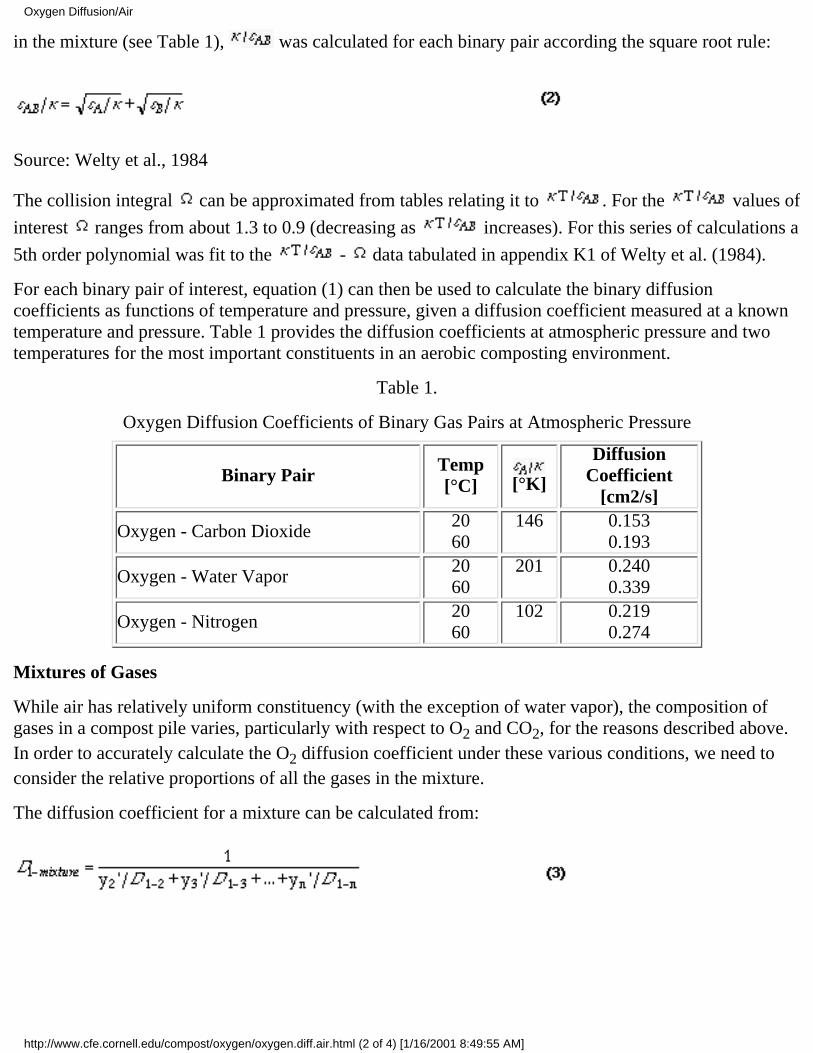
in the mixture (see Table 1), was calculated for each binary pair according the square root rule:
Source: Welty et al., 1984
The collision integral can be approximated from tables relating it to . For the values of
interest ranges from about 1.3 to 0.9 (decreasing as increases). For this series of calculations a
5th order polynomial was fit to the - data tabulated in appendix K1 of Welty et al. (1984).
For each binary pair of interest, equation (1) can then be used to calculate the binary diffusioncoefficients as functions of temperature and pressure, given a diffusion coefficient measured at a knowntemperature and pressure. Table 1 provides the diffusion coefficients at atmospheric pressure and twotemperatures for the most important constituents in an aerobic composting environment.
Table 1.
Oxygen Diffusion Coefficients of Binary Gas Pairs at Atmospheric Pressure
Binary Pair Temp[°C] [°K]
DiffusionCoefficient
[cm2/s]
Oxygen - Carbon Dioxide2060
146 0.1530.193
Oxygen - Water Vapor2060
201 0.2400.339
Oxygen - Nitrogen2060
102 0.2190.274
Mixtures of Gases
While air has relatively uniform constituency (with the exception of water vapor), the composition ofgases in a compost pile varies, particularly with respect to O2 and CO2, for the reasons described above.In order to accurately calculate the O2 diffusion coefficient under these various conditions, we need toconsider the relative proportions of all the gases in the mixture.
The diffusion coefficient for a mixture can be calculated from:
Oxygen Diffusion/Air
http://www.cfe.cornell.edu/compost/oxygen/oxygen.diff.air.html (2 of 4) [1/16/2001 8:49:55 AM]
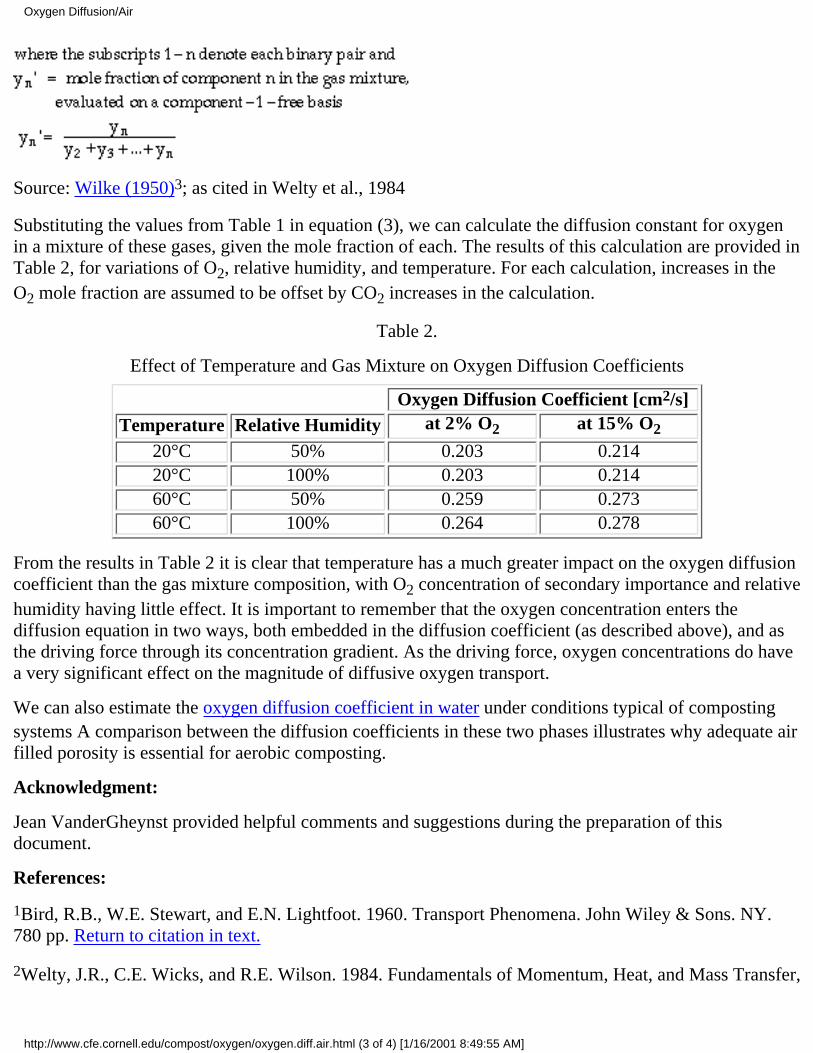
Source: Wilke (1950)3; as cited in Welty et al., 1984
Substituting the values from Table 1 in equation (3), we can calculate the diffusion constant for oxygenin a mixture of these gases, given the mole fraction of each. The results of this calculation are provided inTable 2, for variations of O2, relative humidity, and temperature. For each calculation, increases in theO2 mole fraction are assumed to be offset by CO2 increases in the calculation.
Table 2.
Effect of Temperature and Gas Mixture on Oxygen Diffusion Coefficients
Oxygen Diffusion Coefficient [cm2/s]Temperature Relative Humidity at 2% O2 at 15% O2
20°C 50% 0.203 0.21420°C 100% 0.203 0.21460°C 50% 0.259 0.27360°C 100% 0.264 0.278
From the results in Table 2 it is clear that temperature has a much greater impact on the oxygen diffusioncoefficient than the gas mixture composition, with O2 concentration of secondary importance and relativehumidity having little effect. It is important to remember that the oxygen concentration enters thediffusion equation in two ways, both embedded in the diffusion coefficient (as described above), and asthe driving force through its concentration gradient. As the driving force, oxygen concentrations do havea very significant effect on the magnitude of diffusive oxygen transport.
We can also estimate the oxygen diffusion coefficient in water under conditions typical of compostingsystems A comparison between the diffusion coefficients in these two phases illustrates why adequate airfilled porosity is essential for aerobic composting.
Acknowledgment:
Jean VanderGheynst provided helpful comments and suggestions during the preparation of thisdocument.
References:
1Bird, R.B., W.E. Stewart, and E.N. Lightfoot. 1960. Transport Phenomena. John Wiley & Sons. NY.780 pp. Return to citation in text.
2Welty, J.R., C.E. Wicks, and R.E. Wilson. 1984. Fundamentals of Momentum, Heat, and Mass Transfer,
Oxygen Diffusion/Air
http://www.cfe.cornell.edu/compost/oxygen/oxygen.diff.air.html (3 of 4) [1/16/2001 8:49:55 AM]

3rd Ed. John Wiley & Sons,NY. 803 pp. Return to citation in text.
3Wilke, C.R. 1950. Chemical Engineering Progress 46:95-104. Return to citation in text.
CornellComposting
Science &Engineering
Compostingin Schools
Resources Contacts
Oxygen Diffusion/Air
http://www.cfe.cornell.edu/compost/oxygen/oxygen.diff.air.html (4 of 4) [1/16/2001 8:49:55 AM]

Calculating the Oxygen Diffusion Coefficient inWater
Tom Richard
This discussion is part of a section on oxygen transport and oxygen diffusion in compost, which providesbackground on the general concepts and equations.
Estimates of the diffusion coefficient in liquids often use a correlation developed by Wilke and Chang,1955, which is based on the Stokes-Einstein equation:
where
= an "association" parameter for the solvent water = 2.26 (Reid et al., 1977)
= the molar volume of oxygen = 25.6 cm3/g - mole (Welty et al., 1984)
This equation, which lacks the rigorous theoretical foundation used to develop the equations for gasmixtures, is usually accurate to ± 10% for dilute solutions of nondissociating solutes (Bird, et al., 1960).
For the purposes of this analysis, we neglect the effects of dissolved substrate and microorganisms andassume that the solvent is water. Substituting the given values into this equation, we can calculate thediffusion constant for oxygen in an aqueous solution. The results of this calculation, for the range oftemperatures common in composting systems, are provided in table 1.
Table 2.
Effect of Temperature and on the Oxygen Diffusion Coefficients in Water
Oxygen Diffusion/Water
http://www.cfe.cornell.edu/compost/oxygen/oxygen.diff.water.html (1 of 3) [1/16/2001 8:49:57 AM]

TemperatureViscosity of H2O
[centipoises](Weast, 1969)
O2 Diffusion Coefficient[cm2/s]
20°C 1.002 0.000019740°C 0.653 0.000032450°C 0.547 0.000039960°C 0.467 0.0000482
From these results we can see that the oxygen diffusion coefficient in water is strongly affected bytemperature. This effect is even stronger than was the case in air, more than doubling as temperaturesincrease from 20°C to 60°C.
The other, more significant, comparison with the oxygen diffusion coefficient calculated in air is themagnitude of the coefficient. The O2 diffusion coefficient in saturated air (15% oxygen) is 5,700 to10,800 times greater than in water (60°C and 20°C respectively). When oxygen is forced to diffusethrough water saturated pores, this restriction on oxygen transport quickly leads to anaerobic conditions.
These implications are discussed in further in the section on factors leading to anaerobic conditions.
References:
Bird, R.B., W.E. Stewart, and E.N. Lightfoot. 1960. Transport Phenomena. John Wiley & Sons. NY. 780pp. Return to citation in text.
Reid, R.C., J.M. Praunsnitz, and T.K. Sherwood. 1977. The Properties of Gases and Liquids, ThirdEdition. McGraw-Hill. NY. p. 578. Return to citation in text.
Weast, R.C. (ed.) 1969. CRC Handbook of Chemistry and Physics, 50th Edition. p F-36. Return tocitation in text.
Welty, J.R., C.E. Wicks, and R.E. Wilson. 1984. Fundamentals of Momentum, Heat, and Mass Transfer,Third Edition. John Wiley & Sons,NY. 803 pp. Return to citation in text.
Wilke, C.R., and P. Chang. 1955. A.E.CH.E. Journal 1: 264-270. Return to citation in text.
CornellComposting
Science &Engineering
Compostingin Schools
Resources Contacts
For general questions about composting, please browse this and other composting websites, or make useof the compost listserves.
Oxygen Diffusion/Water
http://www.cfe.cornell.edu/compost/oxygen/oxygen.diff.water.html (2 of 3) [1/16/2001 8:49:57 AM]

For specific comments related to this page, please contact the Cornell Waste Management Institute(format and style), or Tom Richard (technical content).
Dept. of Agricultural & Biological EngineeringNew York State College of Agriculture and Life SciencesRiley-Robb HallCornell UniversityIthaca, NY 14853-5701Phone: 607-255-2488
This page was created on March 29, 1996This page was last updated on October 2000
Oxygen Diffusion/Water
http://www.cfe.cornell.edu/compost/oxygen/oxygen.diff.water.html (3 of 3) [1/16/2001 8:49:57 AM]

Capillary Theory and Matric Potential
Tom Richard
Moisture content affects oxygen transport in several ways. The first effect of moisture content on oxygendiffusion is the increase in aqueous film thickness around individual particles in the mixture. The secondeffect, and the topic of this discussion, is a matrix effect, acting on the aggregate of compost particles. Asmoisture content increases, capillary action fills the small pores with water, often dramatically increasingthe distance oxygen must diffuse through the aqueous phase. The theory that predicts these capillary
effects is based on soil matric potential rather than moisture content, but these two parameters arerelated. Miller (1989) fit a linear relationship to data from a mixture of sewage sludge and wood chips:
In this mixture the matric potential was zero at 64% moisture, but both this intercept and the slope mayvary for different materials and mixtures. Miller (1996) also indicated that a second order polynomial(Figure 2, 1989) fit the data somewhat better than the linear relationship given. Serra-Wittling et al.(1996), working with muncipal solid waste compost, measured a matric potential of -10 kPa at 62%moisture, agreeing with Miller's result at least at high moisture contents.
If we view the compost matrix as an idealized mixture of solids and pores which take the form ofcapillary tubes, equilibrium between the upward forces of surface tension and the downward force ofgravity will be found at:
Capillary Theory and Matric Potential
http://www.cfe.cornell.edu/compost/oxygen/capillary.html (1 of 4) [1/16/2001 8:49:59 AM]

(Bear, 1972; Weast, 1969; Kabat and Beekma, 1994 )
If we assume the fluid in the pores has the same properties as water, the matrix is a bundle of uniform
tubes, and neglect other forces such as osmotic potential, we can set and solve forthe radius at any given matric potential. The result, for the properties of water at 55°C, is:
The assumptions stated above make it clear that this result is greatly simplified version of reality.Nonetheless, it illustrates the dramatic effect increases in moisture have on the size of air filled poresnear saturation. Combining equation (3) with Miller's (1989) relationship between moisture content andmatric potential, Table 1 gives the critical air filled pore radius at a given moisture content. Pores largerthan this critical dimension remain largely air filled, while smaller pores are filled with water.
Table 1. Critical Pore Radius
Moisture Content(%)
Matric Potential(kPa)
Critical poreradius (mm)
30 -239.8 0.0005640 -169.4 0.0008050 -98.9 0.0013655 -63.7 0.0021260 -28.5 0.0047362 -14.4 0.0093564 -0.3 0.391
64.048 -0.00007 19.2
As moisture content increases from 60 to 64%, the critical radius increases from 0.005 mm to 0.4 mm,and an additional small increase from 64 to 64.05% will saturate all pores for this particular mixture. It isimportant to reiterate that this example is based on Miller's (1989) relationship described in equation 1,
Capillary Theory and Matric Potential
http://www.cfe.cornell.edu/compost/oxygen/capillary.html (2 of 4) [1/16/2001 8:49:59 AM]

above, and other mixtures will saturate at different moisture contents, varying between 60% to over 70%in some cases. For a compost mixture with its largest particles in the recommended range of 1.3 to 7.6cm (Gray et al, 1971), it is easy to see that small increases in moisture content in the range nearsaturation will quickly fill most of the pores with water, with a corresponding reduction in the potentialfor diffusion to supply needed oxygen to the decomposition process.
Acknowledgement:
Marc Jalbert provided helpful comments and corrected an error in the previous version of this document(corrected Nov. 8, 2000).
References:
Bear, J. 1972. Dynamics of fluids in porous media. American Elsevier, New York. 764 pp. Return tocitation in text.
Gray, K.R., K. Sherman, and A.J. Biddlestone. 1971. Review of composting. II. The practical process.Process Biochemistry 6(10):22-28. Return to citation in text.
Kabat, P., and J. Beekma. 1994. Water in the unsaturated zone. In: Drainage Principles and Applications.H.P. Ritzema (Ed.) ILRI Publication 16, 2nd Ed. International Institute for Land Reclamation andImprovement, Wageningen, The Netherlands. pp 383-434. Return to citation in text.
Miller, F.C. 1989. Matric water potential as an ecological determinant in compost, a substrate densesystem. Microbial Ecology 18(1):59-71. Return to citation in text.
Miller, F.C. 1996. Personal communication. Return to citation in text.
Serra-Whittling, C., S. Houot, and E. Barriuso. 1996. Modification of soil water retention and biologicalproperties by municipal solid waste compost. Compost Science & Utilization 4(1):44-52. Return tocitation in text.
Weast, R.C. (Editor). 1969. Handbook of Chemistry and Physics, 50th Edition. Chemical RubberCompany, Inc. Cleveland, OH. p. F-30. Return to citation in text.
CornellComposting
Science &Engineering
Compostingin Schools
Resources Contacts
For general questions about composting, please browse this and other composting websites, or make useof the compost listserves.
For specific comments related to this page, please contact the Cornell Waste Management Institute(format and style), or Tom Richard (technical content).
Capillary Theory and Matric Potential
http://www.cfe.cornell.edu/compost/oxygen/capillary.html (3 of 4) [1/16/2001 8:49:59 AM]
Dept. of Agricultural & Biological EngineeringNew York State College of Agriculture and Life SciencesRiley-Robb HallCornell UniversityIthaca, NY 14853-5701Phone: 607-255-2488
This page was created on March 29, 1996This page was last updated on November 8, 2000
Capillary Theory and Matric Potential
http://www.cfe.cornell.edu/compost/oxygen/capillary.html (4 of 4) [1/16/2001 8:49:59 AM]

Odor Management
Tom Richard
Odor is perhaps the most common problem associated with composting, and the failure to adequatelyaddress it has led to numerous neighbor complaints and the closure of many large scale facilities.Fortunately, for the most part odors can be controlled, but proper management can take time and money.
At many composting sites odors originate with the incoming ingredients, which may have been storedanaerobically (without oxygen) for a week or more before transport to the site. Once these ingredients areincorporated into the composting system, subsequent odor problems are usually a result of low oxygen oranaerobic conditions. Anaerobic odors - (coming soon!) include a wide range of compounds, mostnotoriously the reduced sulfur compounds (e.g. hydrogen sulfide, dimethyl sulfide, dimethyl disulfide,and methanethiol), volatile fatty acids, aromatic compounds and amines. Ammonia is the most commonodor that can be formed aerobically as well as anaerobically, and thus has its own set of managmentoptions.
Incoming ingredients
If organic feedstocks are already anaerobic and odorous when they arrive at the site, they need to bebrought to an aerobic state as quickly as possible. Usually this means combining them with a coarse, drybulking amendment to increase the porosity and allow oxygen penetration. Experiences vary as to theoptimum frequency of subsequent turning, which depends on how thoroughly materials are mixedinitially, as well as the porosity of the pile. If the porosity is adequate, it may make sense for the materialto sit for a few days or weeks to get through the initial period of high oxygen demand.
Oxygen
Oxygen is the obvious compound to add when the source of the odors is anaerobic metabolism. Forcedaeration systems provide a way to mechanically introduce oxygen, and are common at facilitiescomposting materials like biosolids (sewage sludge) with a high potential to generate odors. Thesesystems require relatively uniform pile shapes and porosity to reduce the potential for air to short-circuitalong the path of least resistance. In passively aerated systems, which depend on diffusion and naturalconvection, adequate porosity is essential to reduce the resistance to oxygen movement. The pile orwindrow dimensions must also be appropriate for both the mix of ingredients and stage in thecomposting process, so that the oxygen diffusing into the pile is not entirely consumed before it reaches
Odor Management
http://www.cfe.cornell.edu/compost/odors/odor.html (1 of 3) [1/16/2001 8:50:00 AM]

the center.
In addition to these traditional approaches to aeration, oxidizing chemicals like hydrogen peroxide,potassium permanganate, and chlorine are used by the wastewater treatment industry for odor control.These compounds will chemically oxidize anaerobic odors, but may kill the composting microorganismsas well. This is especially true for chlorine. In low concentrations, evenly incorporated in a pile, acompound like potassium permanganate could be effective, but would probably also be expensive.
Odors can also be biologically oxidized after they have formed, and this is probably tremendouslyimportant for most composting systems. Odorous anaerobic products produced in the low oxygen centerof a pile usually pass through an aerobic zone on the way out. Microorganisms will then degrade theodors aerobically. This process probably occurs on both a macro scale (the pile as a whole) and a microscale (within individual particles or clumps), essentially providing in situ biofiltration. When turning ananaerobic compost pile this advantage is lost, which is why frequent turning is not the best way to dealwith an odor problem, and instead often makes the problem worse. In a windrow system, it is far better toaddress the fundamentals of porosity and pile size to insure adequate passive aeration (diffusion andconvection) throughout the compost pile.
Catalysts and Innocula
Catalysts purport to degrade odorous compounds, usually via biologically generated enzymes. A catalystfacilitates a reaction without itself being permanently changed by the reaction, and thus each enzyme canact on many molecules of an odorous compound before it is eventually degraded. Enzymatic catalysts arenormally applied either on the surface of a compost pile or in the airspace above it. A number of productsare on the market, but very little independent research has been done to verify their effectiveness.
Summary
Preventing excessive odors requires consistent management of the composting process, starting withprompt attention to incoming ingredients. Wet materials should be mixed with a porous bulkingamendment to provide the necessary pre-conditions for oxygen transport, and then must be aerated orturned as required during the active stages of the composting process. Understanding the factors leadingto anaerobic conditions, including the interactions of particle size, porosity, moisture, and oxygentransport, will provide additional insights into odor prevention. While the emphasis should always be onprevention, odor treatment - (coming soon!) may also be required, particularly in sensitiveneighborhoods.
Acknowledgments
Helpful reviews and discussions related to this document were provided by James Gossett, NancyTrautmann, Daniel Cogan, and Cary Oshins.
Odor Management
http://www.cfe.cornell.edu/compost/odors/odor.html (2 of 3) [1/16/2001 8:50:00 AM]

CornellComposting
Science &Engineering
Compostingin Schools
Resources Contacts
For general questions about composting, please browse this and other composting websites, or make useof the compost listserves.
For specific comments related to this page, please contact the Cornell Waste Management Institute(format and style), or Tom Richard (technical content).
Dept. of Agricultural & Biological EngineeringNew York State College of Agriculture and Life SciencesRiley-Robb HallCornell UniversityIthaca, NY 14853-5701Phone: 607-255-2488
This page was created on April 10, 1996This page was last updated on October 2000
Odor Management
http://www.cfe.cornell.edu/compost/odors/odor.html (3 of 3) [1/16/2001 8:50:00 AM]

Ammonia Odors
Tom Richard
Ammonia is among the most common odors found at composting facilities. Fortunately, ammonia is nota pervasive odor, so it does not require a large number of dilutions to reduce concentrations below theodor threshold. Ammonia also disperses easily, since is lighter than air (its density is 60% that of air),and does not settle in low lying areas the way hydrogen sulfide and other dense odorous compounds do.These factors make ammonia odors more prevalent on-site than off-site.
Ammonia odors can be formed aerobically as well as anaerobically, so the control strategiesrecommended for anaerobic odors may not apply. Noticeable ammonia losses primarily result from a lowC/N ratio. The microorganisms are very efficient at utilizing nitrogen when that is the limiting nutrient.The smell of ammonia is an indicator that nitrogen is in excess, and carbon/energy is limiting instead.Ammonia losses are common when composting high nitrogen materials such as fresh grass clippings ormanure, and are often accompanied by other nitrogen losses in runoff or infiltration. At large compostingfacilities these nitrogen losses could threaten surface or groundwater quality.
Another factor affecting the magnitude of ammonia volatilization is pH. NH3 (gaseous ammonia) and
NH4+ (aqueous ammonium ion) are in equilibrium at a pH of about 9, with higher pH's forcing more
NH4+ into the gas form that you can smell. Thus ammonia is rarely noticed if the pH is acidic , and
adding lime to a pile will increase the ammonia odor. The equilibrium relationship is defined by thefollowing equation.
Source: Sawyer and McCarty, 1978)
Ammonia Odors
http://www.cfe.cornell.edu/compost/odors/ammonia.html (1 of 3) [1/16/2001 8:50:02 AM]
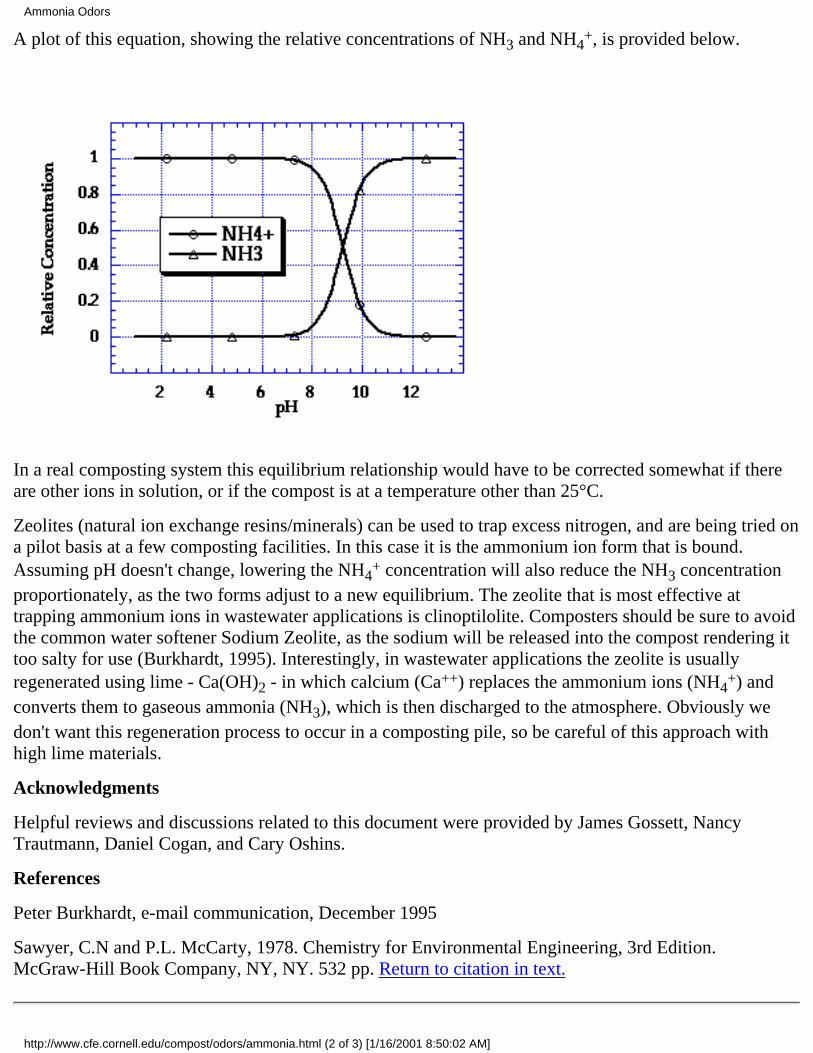
A plot of this equation, showing the relative concentrations of NH3 and NH4+, is provided below.
In a real composting system this equilibrium relationship would have to be corrected somewhat if thereare other ions in solution, or if the compost is at a temperature other than 25°C.
Zeolites (natural ion exchange resins/minerals) can be used to trap excess nitrogen, and are being tried ona pilot basis at a few composting facilities. In this case it is the ammonium ion form that is bound.Assuming pH doesn't change, lowering the NH4
+ concentration will also reduce the NH3 concentrationproportionately, as the two forms adjust to a new equilibrium. The zeolite that is most effective attrapping ammonium ions in wastewater applications is clinoptilolite. Composters should be sure to avoidthe common water softener Sodium Zeolite, as the sodium will be released into the compost rendering ittoo salty for use (Burkhardt, 1995). Interestingly, in wastewater applications the zeolite is usuallyregenerated using lime - Ca(OH)2 - in which calcium (Ca++) replaces the ammonium ions (NH4
+) andconverts them to gaseous ammonia (NH3), which is then discharged to the atmosphere. Obviously wedon't want this regeneration process to occur in a composting pile, so be careful of this approach withhigh lime materials.
Acknowledgments
Helpful reviews and discussions related to this document were provided by James Gossett, NancyTrautmann, Daniel Cogan, and Cary Oshins.
References
Peter Burkhardt, e-mail communication, December 1995
Sawyer, C.N and P.L. McCarty, 1978. Chemistry for Environmental Engineering, 3rd Edition.McGraw-Hill Book Company, NY, NY. 532 pp. Return to citation in text.
Ammonia Odors
http://www.cfe.cornell.edu/compost/odors/ammonia.html (2 of 3) [1/16/2001 8:50:02 AM]
CornellComposting
Science &Engineering
Compostingin Schools
Resources Contacts
For general questions about composting, please browse this and other composting websites, or make useof the compost listserves.
For specific comments related to this page, please contact the Cornell Waste Management Institute(format and style), or Tom Richard (technical content).
This page was created on April 10, 1996This page was last updated on October 2000
Ammonia Odors
http://www.cfe.cornell.edu/compost/odors/ammonia.html (3 of 3) [1/16/2001 8:50:02 AM]

Factors Leading to Anaerobic Conditions
Tom Richard
Significant release of anaerobic odors from a composting system is usually a symptom that someimportant management factor has been neglected or misunderstood. This discussion is an attempt toenhance your understanding of the conditions which can lead to odor formation, in the hopes that theycan be avoided or at least minimized in the future.
The most common factors which result in anaerobic odors are:
1) excess moisture,2) inadequate porosity,3) a rapidly degrading substrate, and4) excessive pile size.
All of these factors make it more difficult for oxygen to penetrate throughout a pile before it is depleted,or allow airflow to short-circuit around large zones which become anaerobic. One of the mechanisms ofoxygen transport is diffusion, which is function of the concentration difference between the outside air(21% oxygen) and the oxygen concentration in the interior of the pile (if anaerobic, zero). In a passivelyaerated or windrow system, diffusion is assisted by natural convection, but that assistance is probablylimited to the upper and outer parts of the pile (Miller et al., 1989). Even with a forced aeration system,the blower's effects are mostly confined to large pores, and diffusion is needed to drive oxygenmovement from the large pores into small pores and the aqueous films surrounding particles.
If we examine the equations governing oxygen diffusion in air, we see that diffusivity increases withtemperature, and decreases with increasing pressure. Under conditions typical of composting systems,the gas phase oxygen diffusion coefficient can range from 0.20 cm2/sec to 0.28 cm2/sec .
While the diffusion coefficient can vary depending on the conditions in the gas phase, even moredramatic effects are seen when the oxygen has to diffuse through water rather than air. In water at 60°C,the oxygen diffusion coefficient is approximately 4.8 x 10⁻⁵ cm2/sec, almost 4 orders of magnitudesmaller than that in air. Because the impact of moisture is so dramatic, excess moisture is the mostcommon factor leading to anaerobic conditions.
Factors Leading to Anaerobic Conditions
http://www.cfe.cornell.edu/compost/odors/factors.html (1 of 2) [1/16/2001 8:50:03 AM]

Reference
Miller, F.C., E.R. Harper, and B.J. Macauley. 1989. Field examination of temperature and oxygenrelationships in mushroom composting stacks - consideration of stack oxygenation based on utilizationand supply. Australian Journal of Experimental Agriculture 29(5):741-750. Return to citation in text.
CornellComposting
Science &Engineering
Compostingin Schools
Resources Contacts
For general questions about composting, please browse this and other composting websites, or make useof the compost listserves.
For specific comments related to this page, please contact the Cornell Waste Management Institute(format and style), or Tom Richard (technical content).
This page was created on April 10, 1996This page was last updated October 2000
Factors Leading to Anaerobic Conditions
http://www.cfe.cornell.edu/compost/odors/factors.html (2 of 2) [1/16/2001 8:50:03 AM]
Excess Moisture
Tom Richard
Because oxygen diffuses so much slower in water than in air, excess moisture reduces oxygenpenetration. This reduction occurs in two ways. First, because moist compost is hydrophilic (it loveswater), water is strongly held to the surfaces of particles, so as water content increases the thickness ofthe aqueous film surrounding each particle increases. The second, closely related effect, is a matrix effectdue to capillarity -- water fills the smallest pores first, and thus creates water filled zones betweenparticles, which slow oxygen diffusion and result in anaerobic clumps.
Moisture and aqueous film thickness
Figure 1 is an illustration of the first effect, aqueous film thickness, at the scale of an individual particle.
Excess Moisture
http://www.cfe.cornell.edu/compost/odors/excess.moisture.html (1 of 5) [1/16/2001 8:50:06 AM]

Figure 1. The effect of aqueous film thickness on anaerobic odor production.
The top half of the figure illustrates a particle with a thick film of water, while in the lower half of thefigure the film thickness is considerably reduced. Note that in both cases the substrate concentration ishigh at the particle surface, the oxygen concentration is high at the air/water interface, and the oxygenconcentration decreases as it moves into the film and substrate is oxidized. In the interior of the particle,where the oxygen concentration approaches zero, anaerobic metabolic activity (indicated by purple dots)produces odors, some of which are oxidized as they diffuse out toward the airstream. With a thick layerof water (which typically occurs with moisture contents greater than 60%), oxygen is depleted before itcan fully penetrate the aqueous film, and the levels of odorous gases generated in the anaerobic zone isso high that even after some oxidation in the outer layers of the aqueous film, they are detectable in theairstream. When the aqueous film is thinner (moisture contents between 35 and 60%), oxygen penetratesfurther, odor concentrations in the liquid are lower, and they are oxidized before they can diffuse backout into the airstream.
Excess Moisture
http://www.cfe.cornell.edu/compost/odors/excess.moisture.html (2 of 5) [1/16/2001 8:50:06 AM]

Figure 2 illustrates the effects of moisture content on the location of aerobic, fermentation, and anaerobiczones within a particle and in the aqueous film surrounding it. Regions of primarily aerobic metabolismare indicated with yellow dots, the fermentation zone is indicated with pink dots, and anaerobicmetabolic regions are indicated with purple dots. Although many of the most offensive odors areanaerobically generated, fermentation can generate alcohols and other "sweet" or "silage" type smellswhich some people may find offensive. If these fermentation odors are prevalent they indicate large areasof the composting system are anoxic (without oxygen), and any further restrictions on oxygen transportmay lead to anaerobic odor problems. Alcohols and other fermentation products, like the anaerobicodors, will degrade aerobically if given sufficient opportunity.
Figure 2. Metabolic Regions as a function of moisture content.
The second limitation of increasing moisture content on oxygen diffusion is through the filling of smallpores with water, often dramatically increasing the distance oxygen must diffuse through the aqueousphase. The effective size of pores filled at different moisture contents can be analyzed on the basis
Excess Moisture
http://www.cfe.cornell.edu/compost/odors/excess.moisture.html (3 of 5) [1/16/2001 8:50:06 AM]

capillary theory and matric potential relationships, applying approaches developed for soil physics andporous media.
The resulting anaerobic zones within an otherwise aerobic matrix are illustrated by the contrast betweenfigures 3 and 4. In figure 3, the compost is at an appropriate moisture content, with aqueous filmssurrounding particles and air filled pores between particles. The arrows indicate a hypothetical depth thatoxygen can penetrate from an air filled pore, which in this case completely penetrates all the particles.
Figure 3. In a properly moist compost matrix, the particles (brown) are surrounded by aqueousfilms (blue), but are separated by air filled pores (white).
Figure 4 illustrates those same particles with a higher moisture content. Note that all but the largest poreshave filled with water, leading to considerable regions of anaerobic activity
Excess Moisture
http://www.cfe.cornell.edu/compost/odors/excess.moisture.html (4 of 5) [1/16/2001 8:50:06 AM]

Figure 4. Anaerobic zones (purple dots) are created as increasing water content fills small pores, sooxygen must diffuse farther through water.
With most composting materials, as moisture content increases beyond about 60%, the pores will rapidlyfill and anaerobic conditions will result. But even at normally acceptable moisture content, anaerobicconditions are likely if compaction or small particle sizes lead to inadequate porosity.
CornellComposting
Science &Engineering
Compostingin Schools
Resources Contacts
For general questions about composting, please browse this and other composting websites, or make useof the compost listserves.
For specific comments related to this page, please contact the Cornell Waste Management Institute(format and style), or Tom Richard (technical content).
This page was created on April 10, 1996This page was last updated on October 2000
Excess Moisture
http://www.cfe.cornell.edu/compost/odors/excess.moisture.html (5 of 5) [1/16/2001 8:50:06 AM]

Inadequate Porosity
Tom Richard
The particle size distribution, bulk density, and porosity of a compost mixture are the second group offactors that can lead to anaerobic conditions. These physical characteristics of the compost mixture caninteract with high moisture levels to reduce oxygen transport. Small particle sizes reduce the number oflarge pores and increase the likelihood that oxygen will need to diffuse a long way through small pores(which are more likely to be filled with water, as described in the section on capillary theory and matricpotential).
The shape, size, and structure of particles affects how they settle, with tight packing arrangementsincreasing the bulk density and reducing the air filled porosity (free air space). Compaction (causedmechanically or by the weight by overburden in tall piles) encourages tight packing as well. Several ofthese effects are illustrated in Figure 1 below:
Figure 1. Effective cross sectional area as a function of particle size distribution, shape, andpacking density.
Inadequate Porosity
http://www.cfe.cornell.edu/compost/odors/inadeq.porosity.html (1 of 3) [1/16/2001 8:50:08 AM]

The white space between the particles in figure 1 illustrates the effective cross sectional area of eachmatrix. Estimates of effective cross sectional area can be used to apply the diffusion equation to a porousmedia like compost, correcting for the fact that diffusion only occurs in the pore space and is furtherconstrained by tortuosity of those pores. A useful result of this correction is the apparent diffusioncoefficient, which in soils has been shown to be roughly proportional to the square of the air filledporosity (Papendick and Campbell, 1981):
Deffective = S2 x D
where
Deffective = effective diffusion coefficient
S = air filled porosity, and
D = the diffusion coefficient in air
Assuming a compost matrix experiences similar effects, we can use this equation to estimate the impactof density on diffusion. Since any increase in bulk density is at the expense of the air filled porosity (thesolid and aqueous phases can be considered incompressible), relatively small changes in volume canhave a significant effect.
For example, suppose a pile of compost has an initial air filled porosity of 30%, and the volume of a pileis reduced by 10% through compaction and size reduction after the first pass of a windrow turner.Assuming constant moisture and solids content, the air filled porosity would be reduced from 30% to20%, a 33% reduction [(0.30-0.20)/0.30], and the apparent diffusion coefficient will be reduced by 56%[(0.09 - 0.04)/0.09]. This significant change in oxygen diffusion might easily pass unnoticed in thewindrow itself, where volume reductions of greater than 50% are common, and 80% is not unheard ofwith an initially loose material like autumn leaves.
To the extent that natural or forced convection is important in oxygen transport, small diameter pores cancause problems even if total air filled porosity is maintained. The increased frictional resistance from thewalls in small pores reduces any mass flow of oxygen that would otherwise occur. In addition, the airchannels in a composting matrix are not a bundle of continuous straight tubes, but twist and bend intortuous path, with many dead ends and narrow passages. These factors further reduce oxygen transportin ways that are difficult to quantify.
The physical characteristics of the compost matrix affect the ease with which oxygen can move into apile. But the distance it penetrates is also a function of how quickly it is being used up. A rapidlydegrading substrate, like grass clippings or food scraps, can use up oxygen more rapidly than it is beingreplaced.
Reference
Papendick, R.I., and Campbell, G.S. 1981. Theory and measurement of water potential. pp 1-22. In:Water Potential Relations in Soil Microbiology. SSSA special publication No. 9. J.F. Parr, W.R. Gardnerand L. F. Elliott, (eds.). Soil Science Society of America: Madison, Wis. U.S.A. Return to citation in text.
Inadequate Porosity
http://www.cfe.cornell.edu/compost/odors/inadeq.porosity.html (2 of 3) [1/16/2001 8:50:08 AM]
CornellComposting
Science &Engineering
Compostingin Schools
Resources Contacts
For general questions about composting, please browse this and other composting websites, or make useof the compost listserves.
For specific comments related to this page, please contact the Cornell Waste Management Institute(format and style), or Tom Richard (technical content).
This page was created on April 10, 1996This page was last updated on October 2000
Inadequate Porosity
http://www.cfe.cornell.edu/compost/odors/inadeq.porosity.html (3 of 3) [1/16/2001 8:50:08 AM]

Rapidly Degrading Substrate
Tom Richard
The oxygen content at any location in a composting pile reflects a balance between oxygen supply andoxygen consumption. Rapidly degrading substrates like grass clippings or food scraps consume oxygenmuch more rapidly than leaves or digested sewage sludge. Oxygen consumption is a function of substratecharacteristics (C/N ratio, bioavailability, moisture, particle size, and other issues -- described in thesection Getting the Right Mix) and environmental conditions (temperature, moisture, oxygenconcentration, and pH -- described under chemistry and physics in the background information section).
Oxygen uptake rates measured in compost vary widely, from less than 1 to over 10 g O2/kg volatilesolids per hour (Haug, 1993). Rates for a variety of substrate materials under typical environmentalconditions are detailed in the section on biodegradation rates and oxygen uptake (coming soon) .
To provide for the increased oxygen demand of a rapidly degrading substrate, oxygen supply must alsobe increased. In forced aeration systems this can often be accomplished by increasing the blower size oroperating frequency. With passive systems, any restrictions on oxygen transport such as inadequateporosity or excess moisture must be reduced. A final alternative, which is commonly practiced with grassclippings and food scraps, is to reduce the pile size.
Reference
Haug, R.T. 1993. The Practical Handbook of Compost Engineering. Lewis Publishers, Boca Raton. 717pp. Return to citation in text.
CornellComposting
Science &Engineering
Compostingin Schools
Resources Contacts
For general questions about composting, please browse this and other composting websites, or make use
Factors Leading to Anaerobic Conditions
http://www.cfe.cornell.edu/compost/odors/degrading.substrate.html (1 of 2) [1/16/2001 8:50:09 AM]

of the compost listserves.
For specific comments related to this page, please contact the Cornell Waste Management Institute(format and style), or Tom Richard (technical content).
This page was created on April 10, 1996This page was last updated on October 2000
Factors Leading to Anaerobic Conditions
http://www.cfe.cornell.edu/compost/odors/degrading.substrate.html (2 of 2) [1/16/2001 8:50:09 AM]

Excessive Pile Size
Tom Richard
Composting comes in many shapes and sizes, from 1 liter vacuum bottles to warehouse sized industrialsystems. In all of these systems, the correct pile size balances the heat generated by microbialdecomposition with the heat lost through conduction, convection, and radiation, keeping most of thecompost between 40°C and 60°C (for more on the mechanisms of heat loss, see the physics page in ourbackground information section).
Passively aerated systems, which depend on diffusion and natural convection for oxygen transport,usually have a large open surface area to encourage air movement, with corresponding convective heatlosses. This large surface area also results in conductive and radiant heat loss. Because heat loss in thesesystems is largely a function of exposed surface area (as well as ambient temperatures), and microbialheat generation largely a function of volume (assuming the environmental conditions are near optimum),for any material and configuration there will be an ideal surface to volume ratio. Larger piles, with asmaller surface to volume ratio, will tend to overheat, while small piles will be too cool. For materials ina typical windrow configuration (where the width of the windrow is about double the height), the idealheight will usually be in the range of 1 to 3 meters. Rapidly degrading, dense mixtures that include grassclippings, food scraps or manure will be at the lower end of this range, while porous, slowly degradingpiles of leaves will be at the upper end.
With a forced aeration system, convective heat loss can be increased by increasing the aeration rate.Although this will reduce the average temperature of the pile, one also has to be careful to insure that thetemperature extremes are not too great. With very large piles, regions near the air inlet will beexcessively cooled and dried, while other regions near the exhaust may be to hot. As with passivelyaerated systems, the ideal size of a forced aeration pile depends on the characteristics of the materialbeing composted and the geometry of the composting system. For most materials, in systems usingambient air (air once through), the maximum height (or airflow path length) is 2 to 3 meters. Tunnelreactor systems, which can recycle the airflow, typically operate at higher airflow rates with a smallertemperature difference between the inlet and the outlet. Recycling the airflow, or using pre-heated air,thus allows an increase in reactor size while still maintaining a tolerable degree of process control.
Excessive Pile Size
http://www.cfe.cornell.edu/compost/odors/excessive.pile.size.html (1 of 2) [1/16/2001 8:50:10 AM]

CornellComposting
Science &Engineering
Compostingin Schools
Resources Contacts
For general questions about composting, please browse this and other composting websites, or make useof the compost listserves.
For specific comments related to this page, please contact the Cornell Waste Management Institute(format and style), or Tom Richard (technical content).
This page was created on April 10, 1996This page was last updated on October 2000
Excessive Pile Size
http://www.cfe.cornell.edu/compost/odors/excessive.pile.size.html (2 of 2) [1/16/2001 8:50:10 AM]

Odor Treatment - Biofiltration
Tom Richard
Odor control is one of the primary concerns of large scale composting facilities, especially those locatednear residential areas. While good process management and careful housekeeping can greatly reduceodors, in many cases some method of odor treatment will still be required. There are several options forodor treatment, including chemical stripping, thermal destruction, and biofiltration. In many casesbiofiltration is both the least expensive and most effective treatment option, which has led to itswidespread use in the composting industry today.
Biofiltration
A biofilter uses moist organic materials to adsorb and then biologically degrade odorous compounds.Cooled and humidified compost process air is typically injected through a grid of perforated pipes into abed of filtration media. The materials that have been used for biofilter construction include compost, soil,peat, chipped brush and bark, sometimes blended with a biologically inert material such as gravel tomaintain adequate porosity. Biofilter bed depths typically range from 1 to 1.5 meters deep, withshallower beds subject to short-circuiting of gas flow and deeper beds more difficult to keep uniformlymoist. Biofilters have been shown to be effective at treating essentially all of the odors associated withcomposting, including ammonia and a wide range of volatile organic compounds (including sulfurcompounds and amines).
The principle design criteria is the airflow rate per unit surface area of the biofilter. Literature values forbiofilter airflows range from 0.005 to 0.0025 m/s (1 to 5 cfm/ft²) and are typically 0.015 to 0.02 m/s (3 to4 cfm/ft²). For the purpose of selecting the biofilter blower, the backpressure expected across the biofilterat this airflow rate is usually in the range of 20 to 120 mm H2O/m depth (0.22 to 0.9 inches H2O/ft),although the pressure drop can be considerably higher through dense composts and soil.
For soil filters, standard specifications are (in SI units, from Skoda, 1991):
linear velocity of gas: 0.5-1 cm/s●
static pressure of gas: < 250 mm Hg●
humidity of gas: non-saturated with water●
temperature of gas: 5-40°C●
Odor Treatment - Biofiltration
http://www.cfe.cornell.edu/compost/odors/odortreat.html (1 of 3) [1/16/2001 8:50:11 AM]

moisture content of soil: 40-70% of maximum water holding capacity●
temperature of soil: optimum between 20-37°C●
pH of soil: optimum about 7●
Unsaturated air coming out of the compost building will dry the biofilter and rewetting from the surfaceis generally not uniform. A simple humidification scheme is illustrated in the schematic diagram below.
Biofilter Schematic:
References:
Haug, R.T. 1993. The Practical Handbook of Compost Engineering. Lewis Publishing, Boca Raton, FL.
Lesson, G. and K.A.M. Winer. 1991. Biofiltration: An innovative air pollution control technology forVOC emissions. J. Air Waste Mgt. Assoc., 41(8):1045-1054.
Shoda, M. 1991. Methods for the biological treatment of exhaust gases. In: Biological Degradation ofWastes. A.M. Martin (ed.) Elsevier Applied Science, London. pp. 1-30.
Williams, T.O. and F.C. Miller. 1992. Odor control using biofilters. BioCycle 33(10):72-77.
Williams, T.O. and F.C. Miller. 1992. Biofilters and facility operations. BioCycle 33(11):75-79.
CornellComposting
Science &Engineering
Compostingin Schools
Resources Contacts
For general questions about composting, please browse this and other composting websites, or make useof the compost listserves.
Odor Treatment - Biofiltration
http://www.cfe.cornell.edu/compost/odors/odortreat.html (2 of 3) [1/16/2001 8:50:11 AM]

For specific comments related to this page, please contact the Cornell Waste Management Institute(format and style), or Tom Richard (technical content).
This page was created on January 23, 1997This page was last updated on October 2000
Odor Treatment - Biofiltration
http://www.cfe.cornell.edu/compost/odors/odortreat.html (3 of 3) [1/16/2001 8:50:11 AM]

Water Quality Protection
Tom Richard
Composting has long been viewed as an environmentally beneficial activity. To maintain that positivereputation it is essential that compost facilities consider and mitigate any adverse environmental impacts.Water quality protection can be accomplished at most composting facilities by proper attention to siting,ingredient mixtures, and compost pile management.
The results of water quality monitoring studies at Cornell and elsewhere indicate that outdoor windrowcomposting can be practiced in an environmentally sound manner (Richard and Chadsey, 1994;Rymshaw et al., 1992; Cole, 1994). However, there are a few aspects of this process that can potentiallycreate problems. For leaf composting, the primary concerns are BOD and phenol concentrations found inwater runoff and percolation. Biochemical Oxygen Demand and phenols are both natural products ofdecomposition, but the concentrated levels generated by large-scale composting should not be dischargedinto surface water supplies. Additional potential concerns when composting nutrient rich materials suchas grass, manure, or sewage sludge include nitrogen compounds such as nitrate and ammonia, and insome cases phosphorus as well. With manure or sewage sludge there may also be pathogen concerns.These concerns, while important, are readily managed, and can be mitigated through careful facilitydesign and operation.
Water Quality Protection
http://www.cfe.cornell.edu/compost/waterqual.html (1 of 7) [1/16/2001 8:50:18 AM]
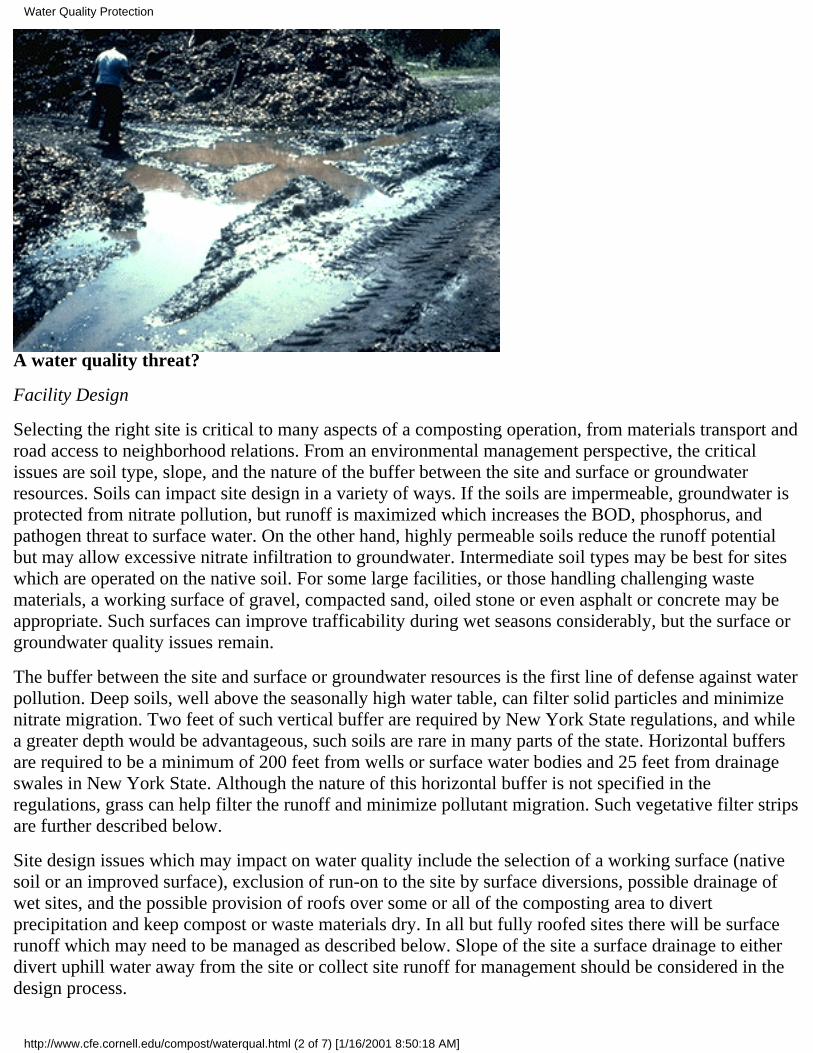
A water quality threat?
Facility Design
Selecting the right site is critical to many aspects of a composting operation, from materials transport androad access to neighborhood relations. From an environmental management perspective, the criticalissues are soil type, slope, and the nature of the buffer between the site and surface or groundwaterresources. Soils can impact site design in a variety of ways. If the soils are impermeable, groundwater isprotected from nitrate pollution, but runoff is maximized which increases the BOD, phosphorus, andpathogen threat to surface water. On the other hand, highly permeable soils reduce the runoff potentialbut may allow excessive nitrate infiltration to groundwater. Intermediate soil types may be best for siteswhich are operated on the native soil. For some large facilities, or those handling challenging wastematerials, a working surface of gravel, compacted sand, oiled stone or even asphalt or concrete may beappropriate. Such surfaces can improve trafficability during wet seasons considerably, but the surface orgroundwater quality issues remain.
The buffer between the site and surface or groundwater resources is the first line of defense against waterpollution. Deep soils, well above the seasonally high water table, can filter solid particles and minimizenitrate migration. Two feet of such vertical buffer are required by New York State regulations, and whilea greater depth would be advantageous, such soils are rare in many parts of the state. Horizontal buffersare required to be a minimum of 200 feet from wells or surface water bodies and 25 feet from drainageswales in New York State. Although the nature of this horizontal buffer is not specified in theregulations, grass can help filter the runoff and minimize pollutant migration. Such vegetative filter stripsare further described below.
Site design issues which may impact on water quality include the selection of a working surface (nativesoil or an improved surface), exclusion of run-on to the site by surface diversions, possible drainage ofwet sites, and the possible provision of roofs over some or all of the composting area to divertprecipitation and keep compost or waste materials dry. In all but fully roofed sites there will be surfacerunoff which may need to be managed as described below. Slope of the site a surface drainage to eitherdivert uphill water away from the site or collect site runoff for management should be considered in thedesign process.
Water Quality Protection
http://www.cfe.cornell.edu/compost/waterqual.html (2 of 7) [1/16/2001 8:50:18 AM]
A number of factors combine to determine the quality of water running off compost sites. One obviousfactor which is often overlooked is the excess water running onto the site from upslope. Diversionditches and berms which divert that water around the site will minimize the runoff which needs to bemanaged. Siting the facility on a soil with moderate to high permeability will also significantly reducethe runoff generated on the site. For the runoff which remains, alternatives to surface discharge includesuch simple technologies as soil treatment, filter strips, or recirculation, so that sophisticated collectionand treatment systems should not be needed.
These simple, low-cost treatment strategies have proven effective for a variety of wastewaters andorganic wastes (Loehr et. al., 1979). Soil treatment forces the percolation of water through the soilprofile, where these organic compounds can be adsorbed and degraded. Vegetative filter strips slow themotion of runoff water so that many particles can settle out of the water, while others are physicallyfiltered and adsorbed onto plants. Recirculation would involve pumping the runoff water back into thecompost windrows, where the organic compounds could further degrade and the water would beevaporated through the composting process. This last option should work very well during dry summeror early fall weather, when water often needs to be added, but would not be appropriate if the moisturecontent of the compost was already high.
Operations
The day to day operation of the composting site offers considerable opportunities to minimize waterquality impacts. The proper selection, mixing, and management of materials can help control overallrunoff, BOD, pathogen and nutrient movement. Assuring appropriate moisture and carbon to nitrogen(C:N) ratios throughout the composting process can be very effective at limiting these pollutants. Areview of the basic principles of compost facility operations, with more detailed discussion of theseissues as well as data on C:N ratios, water content, and bulk density of some common agriculturalcomposting materials are provided in the NRAES On Farm Composting Handbook (Rynk et al., 1992)and the Getting the Right Mix section of these web pages.
Nitrate is most easily controlled by maintaining an appropriate C:N ratio in the composting mixture. Rawmaterials should normally be blended to approximately 30:1 carbon to nitrogen ratio by weight. The ratiobetween these key elements is based on microbial biomass and energy requirements. Inadequate nitrogen(a high C:N ratio) results in limited microbial biomass and slow decomposition, while excess nitrogen (alow C:N ratio) is likely to leave the composting system as either ammonia (odors) or nitrate (waterpollution). In a nitrogen limited system microorganisms efficiently assimilate nitrate, ammonia and othernitrogen compounds from the aqueous phase of the compost, thus limiting the pollution threat.
The ideal ratio of carbon to nitrogen will depend on the availability of these elements to microbialdecomposition. Carbon availability is particularly variable, depending on the surface area or particles andthe extent of lignification of the material. Composting occurs in aqueous films on the surfaces ofparticles, so greater surface area increases the availability of carbon compounds. Lignin, because of itscomplex structure and variety of chemical bonds, is resistant to decay. For both of these reasons thecarbon in large wood chips is less available than that in straw or paper, so greater quantities of woodchips would be required to balance a high nitrogen source like manure.
The data from experimental studies indicates low C:N ratio mixtures can generate nitrate levels above thegroundwater standard (Rymshaw et al.; 1992, Cole, 1994) Much of this nitrate in runoff and leachate will
Water Quality Protection
http://www.cfe.cornell.edu/compost/waterqual.html (3 of 7) [1/16/2001 8:50:18 AM]

infiltrate into the ground. While microbial assimilation and denitrification may somewhat reduce theselevels as water passes through the soil, these processes will have a limited effect and are difficult tocontrol. Proper management of the C:N ratio is perhaps the only practical way to limit nitratecontamination site short of installing an impermeable pad and water treatment system.
The other important factor to consider when creating a composting mixture is water content. From amicrobial standpoint, optimal water content should be in the 40 to 60% range. This moisture content is abalance between water and air filled pore space, allowing adequate moisture for decomposition as well asairflow for oxygen supply. The ideal water content will vary somewhat with particle size and density,and fine, dense organic substrates should be drier if adequate aeration is to be assured. Excess water, inaddition to increasing the odor potential via anaerobic decomposition, will increase the runoff andleachate potential of a composting pile during rainfall events.
With both C:N ratios and moisture content, the optimum water and nitrogen levels for rapid compostingmay create a greater than necessary water pollution threat. Increasing the C:N ratio from 30:1 to 40:1 anddecreasing the water content from 60 % to 50% may slow down decomposition somewhat, but canprovide an extra margin of safety in protecting water quality.
Once the materials are mixed and formed into a compost pile windrow management becomes animportant factor. Windrows should be oriented parallel to the slope, so that precipitation landing betweenthe windrows can move freely off the composting area. Pile shape can have a considerable influence onthe amount of precipitation retained in a pile, with a flat or concave top retaining water and a convex orpeaked shape shedding water, particularly in periods of heavy rain. These effects are most pronouncedwhen the composting process is just starting or after a period of dry weather. In the early phases ofcomposting a peaked windrow shape can act like a thatched roof or haystack, effectively shedding water.Part of this effect is due to the large initial particle size, and part is due to waxes and oils on the surfacesof particles. Both of these initial effects will diminish over time as the material decomposes. During dryweather the outer surface of even stabilized organic material can become somewhat hydrophobic,limiting absorption and encouraging runoff.
If a pile does get too moist, the only practical way to dry it is to increase the turning frequency. Theclouds of moisture evident during turning release significant amounts of water, and the increasedporosity which results from turning will increase diffusion and convective losses of moisture betweenturnings. This approach can be helpful during mild or warm weather, but caution must be exercised inwinter when excessive turning can cool the pile.
Runoff management
Implementation of the preventative measures described above can considerably reduce the waterpollution threat. However, some facilities may require additional management of runoff from the site. Asindicated above, the runoff pollutants of primary concern are BOD and phosphorus, largely associatedwith suspended solids particles. Pathogenic cysts may either be absorbed on particles or be free insolution, and again the relative significance is not adequately researched. Four readily available strategiesexist to help control these pollutants: vegetative filter strips, sediment traps or basins, treatment ponds,and recirculation systems.
This simplest runoff management strategy is the installation of a vegetative filter strip. Vegetative filterstrips trap particles in dense surface vegetation. Grasses are commonly used, and must be planted in a
Water Quality Protection
http://www.cfe.cornell.edu/compost/waterqual.html (4 of 7) [1/16/2001 8:50:18 AM]
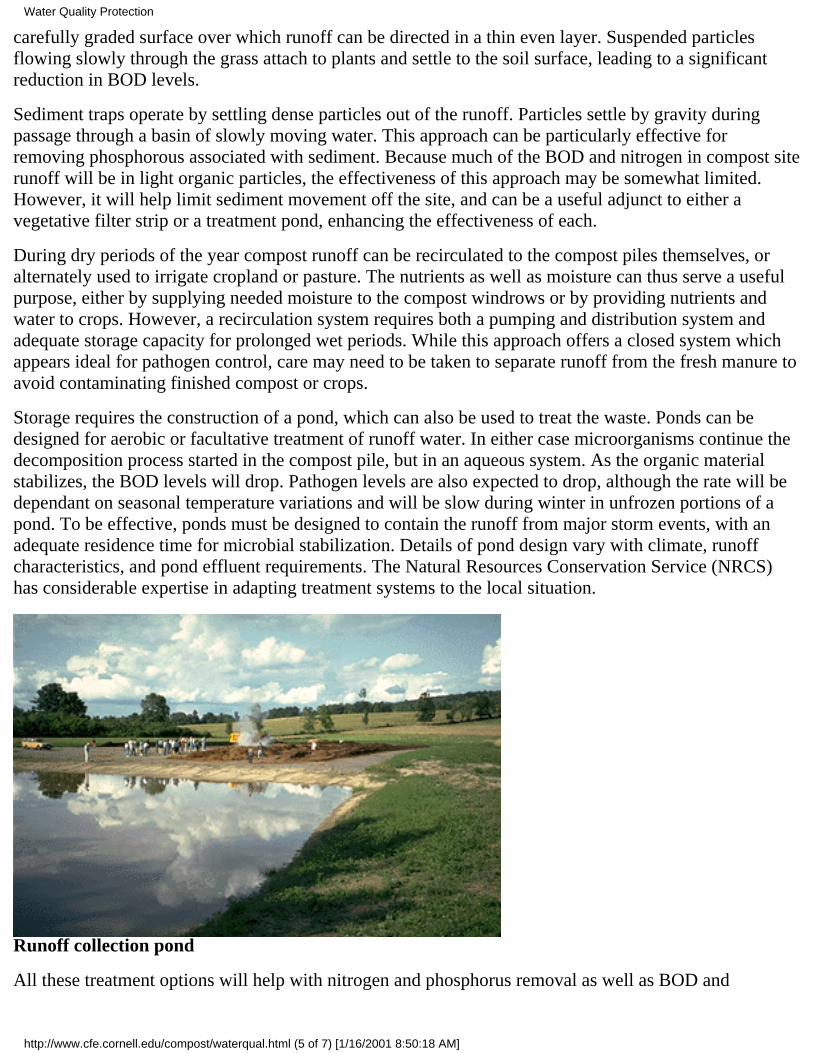
carefully graded surface over which runoff can be directed in a thin even layer. Suspended particlesflowing slowly through the grass attach to plants and settle to the soil surface, leading to a significantreduction in BOD levels.
Sediment traps operate by settling dense particles out of the runoff. Particles settle by gravity duringpassage through a basin of slowly moving water. This approach can be particularly effective forremoving phosphorous associated with sediment. Because much of the BOD and nitrogen in compost siterunoff will be in light organic particles, the effectiveness of this approach may be somewhat limited.However, it will help limit sediment movement off the site, and can be a useful adjunct to either avegetative filter strip or a treatment pond, enhancing the effectiveness of each.
During dry periods of the year compost runoff can be recirculated to the compost piles themselves, oralternately used to irrigate cropland or pasture. The nutrients as well as moisture can thus serve a usefulpurpose, either by supplying needed moisture to the compost windrows or by providing nutrients andwater to crops. However, a recirculation system requires both a pumping and distribution system andadequate storage capacity for prolonged wet periods. While this approach offers a closed system whichappears ideal for pathogen control, care may need to be taken to separate runoff from the fresh manure toavoid contaminating finished compost or crops.
Storage requires the construction of a pond, which can also be used to treat the waste. Ponds can bedesigned for aerobic or facultative treatment of runoff water. In either case microorganisms continue thedecomposition process started in the compost pile, but in an aqueous system. As the organic materialstabilizes, the BOD levels will drop. Pathogen levels are also expected to drop, although the rate will bedependant on seasonal temperature variations and will be slow during winter in unfrozen portions of apond. To be effective, ponds must be designed to contain the runoff from major storm events, with anadequate residence time for microbial stabilization. Details of pond design vary with climate, runoffcharacteristics, and pond effluent requirements. The Natural Resources Conservation Service (NRCS)has considerable expertise in adapting treatment systems to the local situation.
Runoff collection pond
All these treatment options will help with nitrogen and phosphorus removal as well as BOD and
Water Quality Protection
http://www.cfe.cornell.edu/compost/waterqual.html (5 of 7) [1/16/2001 8:50:18 AM]

pathogens. Sediment basins and ponds will settle out particulate matter, which includes bound nutrientssuch as phosphorus. However, these sedimentation mechanisms are not likely to remove nutrients orBOD as well as soil adsorption and crop uptake in a land treatment system. For nitrogen removal,vegetative filter strips and irrigation systems can both be effective, and either is enhanced by alternatingflow pulses with rest periods. Phosphorus removal is most efficient under aerobic conditions, andirrigation systems generally show higher removal rates than vegetative filter strips although either can beeffective. Although little is currently known about the effectiveness of these approaches in destroying thepathogens of concern, increased opportunities for adsorption, desiccation, and other forms ofenvironmental and microbiological stress are integral to the physical and biological treatment processesdescribed. An appropriate combination of these removal mechanisms can be designed to address thepollution parameters of local concern.
Summary
Water quality protection at a composting site can be accomplished through proper site design, operations,and runoff management. Composting facilities vary widely in size, materials processed, and sitecharacteristics, and all these factors will effect the design of appropriate preventative measures. Althoughthe available evidence is limited, current indications are that runoff from composting windrows has BODand nutrient levels comparable to low strength municipal wastewaters. Land treatment systems whichhave proven effective for these alternative wastewaters we can expect to be effective for windrowcomposting facilities as well.
References
Cole, M.A. 1994. Assessing the impact of composting yard trimmings. BioCycle 35(4):92-96.
Loehr, R. C., W. J. Jewell, J. D. Novak, W. W. Clarkson, G. S. Friedman. 1979. Land Application ofWastes, Vol. II. Van Nostrand Reinhold Co. New York, NY.
Richard, T.L. and M. Chadsey. 1994. Environmental Impact Assessment. In: Composting SourceSeparated Organics. Edited by BioCycle staff. J.G. Press, Inc. Emmaus, PA. pp 232-237. Also publishedin 1990 as: Environmental monitoring at a yard waste composting facility. BioCycle. 31(4):42-46.
Rymshaw, E., M.F. Walter, and T.L. Richard. 1992. Agricultural Composting: EnvironmentalMonitoring and Management Practices. Dept. of Ag. & Bio. Eng., Cornell University, Ithaca, NY.
Rynk, R., M. van de Kamp, G.B. Willson, M.E. Singley, T.L. Richard, J.J. Kolega, F.R. Gouin, L.Laliberty, Jr., K. Day, D.W. Murphy, H.A.J. Hoitink, and W.F. Brinton. 1992. On-Farm CompostingHandbook. NRAES, Cornell University, Ithaca, NY. 186 pp.
Water Quality Protection
http://www.cfe.cornell.edu/compost/waterqual.html (6 of 7) [1/16/2001 8:50:18 AM]

CornellComposting
Science &Engineering
Compostingin Schools
Resources Contacts
For general questions about composting, please browse this and other composting websites, or make useof the compost listserves.
For specific comments related to this page, please contact the Cornell Waste Management Institute(format and style), or Tom Richard (technical content).
This page was created on September 16, 1996
This page was updated October 2000
Water Quality Protection
http://www.cfe.cornell.edu/compost/waterqual.html (7 of 7) [1/16/2001 8:50:18 AM]

CornellComposting
Science &Engineering
Compostingin Schools
Resources Contacts
Welcome to . . .CORNELL Composting
This website provides access to a variety of composting educational materials and programs developed atCornell University.
Everything you ever wanted to know about composting, but wereafraid to ask?
Not quite, but we do hope we've assembled some useful information.
The Cornell Composting Website was developed by Tom Richard, Nancy Trautmann, Marianne Krasny,Sue Fredenburg and Chris Stuart.
All material is protected by Section 107 of the 1976 copyright law. Copyright © is held by CornellUniversity. If you intend to use this material, please acknowledge its author and source.
New! Compost Marketing & Labeling Project
CORNELL Composting
http://www.cfe.cornell.edu/compost/Composting_Homepage.html (1 of 2) [1/16/2001 8:50:21 AM]
Compost Survey Maps and Database
Search our maps and database for compost facilities throughout New York State. See the results of asurvey that was recently conducted by the Cornell Waste Management Institute to locate compostingfacilities throughout the State of New York.
Compost Case Studies
The Cornell Waste Management Institute project to increase the capacity to compost the tremendousamount of food scraps produced in New York State. Includes decriptions of sponsored projects includingCornell's own Food Scrap Composting operation.
Science and Engineering
This section outlines the basic science and engineering principles involved in the composting process.There are a number of calculations and experiments you can try out on your own.
Composting in Schools
A special section for students and teachers using composing in the classroom. Don't miss the section on"weird and unusual composting."
Composting Resources
An annotated listing of written and audio visual publications, with prices and ordering information. Manyslides and illustrations are also provided, so if you have a slow connection you may want to turn offautomatic image loading.
Composting Contacts
Please direct all general inquiries to one of the resources on this list.
For general questions about composting, please browse this and other composting websites, or make useof the compost listserves.
For specific comments related to this page, please contact the Cornell Waste Management Institute(format and style), or Tom Richard, (technical content).
This page was created on August 29, 1995This page was last updated October 2000
CORNELL Composting
http://www.cfe.cornell.edu/compost/Composting_Homepage.html (2 of 2) [1/16/2001 8:50:21 AM]
Composting in SchoolsWhy Composting?●
Teacher's Page●
Ideas for Student Research Projects●
Compost Quiz●
Science and Engineering●
Composting Indoors●
Composting Outdoors●
Weird and Unusual Composting●
Frequently Asked Questions●
Glossary●
The information in this site, and a whole lot more, is contained in our book Composting in theClassroom and video It's Gotten Rotten.
CornellComposting
Science &Engineering
Compostingin Schools
Resources Contacts
Credits
Awards
Composting in Schools
http://www.cfe.cornell.edu/compost/schools.html [1/16/2001 8:50:22 AM]

Back to the Cornell Composting Homepage
Additional resources from the Cornell Waste Management Institute
The resources listed below are available from the following address unless otherwisenoted:
Cornell University Resource Center7 Business & Technology ParkIthaca, NY 14850Phone: 607-255-2090Fax: 607-255-9946E-mail: [email protected] Extension On-Line Catalog
WRITTENComposting Challenges and Solutions in New York State
A Summary of the series of Rountables conducted in Upstate NY in the summer of 1998.
Reducing the NYC Waste Stream: The Potential Role for Composting
A Summary of the April 3, 1998 Composting Roundtable.
Master Composter Program Implementation Guide & Master Composter Resource Manual byCWMI - 1998A sourcebook for Master Composters and Educators. For more info see the description on theEducational Resource Page
Cornell Composting Resources
http://www.cfe.cornell.edu/compost/Compost_Resources.html (1 of 5) [1/16/2001 8:50:26 AM]

Composting in the Classroom: Scientific Inquiry for High School Students, by Nancy Trautmannand Marianne Krasny - 1997
A comprehensive guide for teachers interested in guiding composting research projects by highschool students. ISBN 0-7872-4433-3. Available from Kendall/Hunt Publishing Co.,1-800-228-0810 (US) or 1-319-589-1000 (International).
Agricultural Composting: A Feasibility Study for New York Farms - 1993
Supported by the NYS Dept. of Agriculture & Markets, this study explores equipment and laborcosts, land and management requirements. Out of Print - available in electronic form only (145 K).
MSW Composting Fact Sheet Series - 1993
7 fact sheets developed from a special issue of Biomass & Bioenergy, 4-6 pgs. each. Produced bythe Cornell Waste Management Institute. Purchase from Cornell University Resource Center, $7.
On-Farm Composting Handbook - 1992
Comprehensive, up-to-date guide on many aspects of farm-scalecomposting. Produced by and available from the Northeast RegionalAgricultural Engineering Service (NRAES), Cornell University, 152Riley-Robb Hall, Ithaca, NY 14853; 607-255-7654; 186 pgs., $25.
Municipal Yard Waste Composting: Operator's Fact Sheets - 1992
10 fact sheets covering the different aspects of operating a composting facility. Produced byDepartment of Agricultural & Biological Engineering at Cornell University. Available fromCornell University Resource Center, $4.
Composting at Home, Let It Rot!! It's Nature's Way of RecyclingComposting handbook available free from Cornell Cooperative Extension of Albany County,Martin Rd, PO Box 479, Voorheesville, NY 12186; phone: 518-765-3500.
Composting to Reduce the Waste Stream: A Guide to Small Scale Food and Yard WasteComposting-1991
Explains how to construct and maintain a compost pile. Outlines factors that affect the compostingprocess including aeration, moisture and temperature. Illustrations, tables, diagrams, andstep-by-step instructions for constructing compost bins. Produced by and available from theNortheast Regional Agricultural Engineering Service, Cornell University, 152 Riley-Robb Hall,Ithaca, NY 14853; 607-255-7654, $7.
Composting: Waste to ResourcesA 36 page guide on the how-to's of composting for the beginner, including youth and educators,also two posters and designs for compost systems. Available from Cornell Resource Center, $8.
Economics of Yard Waste Composting in Westchester County, NYReport shows that home, municipal and regional composting of yard waste can reduce the neteconomic and environmental costs of solid waste management in Westchester County. Availablefrom Dept of Ag Econ, Publications, Warren Hall, Ithaca, NY 14853; 607-255-2102.
Cornell Composting Resources
http://www.cfe.cornell.edu/compost/Compost_Resources.html (2 of 5) [1/16/2001 8:50:26 AM]
Fact Sheet and Viewpoint 2: "Yard Waste Composting," and "Composting as a WasteManagement Strategy New Directions-New Questions"
Produced by the Cornell University Waste Management Institute. 4 pgs. each, available fromCornell University Resource Center, $3/set.
Home Composting Brochure - 1989 (Catalog code 329FFHSW)
Produced by the Cornell Department of Agricultural Engineering. Available from CornellUniversity Resource Center, $1.
Municipal Compost Management Home Study Program - 1991An approach to assessing, designing, and managing a composting system for municipalities. TheMunicipal Compost Management video program contains all of the materials needed to conduct aneffective workshop. Developed by the Cornell University Waste Management Institute, withfunding from ShopRite supermarkets. Available from the Home Study Program, Warren Hall,Cornell University, Ithaca, NY 14853; 607-255-2226, $95. The complete educational videoprogram is $295.
Yard Waste Management: A Planning Guide for NYS - 1990
Outlines the major considerations of municiple yard waste management,and provides the information needed to design an effective program.Prepared by Agricultural & Biological Engineering, Cornell University.Available from NYSDEC, 50 Wolf Rd, Albany, NY 12233;518-457-7337.
Yard Waste Management in New York State: Case Studies and the Economics of Composting -1996
Community and Environmental Management Series No. 1, Cornell Local Government Program,March 1996. (147 pgs). Presents a comprehensive overview of the status of municipal yard wastemanagement activities in NYS as of the early 1990s. Existing municipal sites are categorizedaccording to idealized mixed waste, low, medium or high intensity management scenarios. Surveydata summarizing the cost, revenue, collection, end-product use and operational characteristics ofexisting facilities are reported by scenario. Detailed descriptions and cost/revenue budgetworksheets for seven municipal facilities are included. Available from the Cornell LocalGovernment Program, 214 Warren Hall, Cornell University, Ithaca, NY 14853; 607-255-1583, $5.
Energy and Municipal Yard Waste Management - 1996Community and Environmental Management Series No. 2, Cornell Local Government Program,March 1996. (88 pgs). Estimates and compares the amounts of energy typically utilized orgenerated in collecting, transporting, managing and otherwise disposing of yard wastes.Comparisons are based on scenarios typical of NY municipalities. The energy implications of avariety of collection, composting, chipping, methane recovery and waste-to-energy technologiesare considered. Available from the Cornell Local Government Program, 214 Warren Hall, CornellUniversity, Ithaca, NY 14853; 607-255-1583, $5.
Cornell Composting Resources
http://www.cfe.cornell.edu/compost/Compost_Resources.html (3 of 5) [1/16/2001 8:50:26 AM]

AUDIO VISUALCOMPOST: Truth or Consequences
Truth or Consequences is our new video, designed for people who would like to take the mysteryout of home composting. The information is presented in an informal, entertaining way to makelearning about composting fun!
It's Gotten Rotten
A 20-minute video designed to introduce high school students to the science of composting. Itfocuses primarily on the biology of the invertebrates and microorganisms that decompose organicmatter. Available from Cornell University Resource Center.
Home Composting
48 slides/script on backyard composting, developed by Cornell Cooperative Extension. Availableon loan to NYS Cooperative Extension agents from the Home Grounds Lending Library, 20 PlantScience Bldg., Cornell University, Ithaca, NY 14853; 607-255-3134.
Yard Waste Composting for Municipalities - 1989
Slide set produced by the Cornell Agricultural and Biological Engineering Department, $49/loan$18. Available from Cornell University Resource Center.
Composting Exhibit - 1988Produced by Cornell Cooperative Extension. Three-panel display and accompanying fact sheet oncomposting. True/false questions wired to light up, when correctly answered. Available on loan toNYS Cooperative Extension agents only, for $20/day or $40/week from the Cornell UniversityResource Center.
Recycling Yard Waste, A Tour of Community Programs - 199135-minute video showing different municipalities recycling yard waste through composting andchipping as an alternative to traditional waste disposal techniques. Produced to help local officialsand citizens make informed choices about managing municipal yard waste. Available from CornellUniversity Resource Center, $48/loan $18.
Turning Over an Old Leaf: The 20% Solution - 19927-minute video produced to help citizens and local officials understand how composting andchipping yard wastes can save them money. Available from Cornell University Resource Center,$24/loan $18.
CornellComposting
Science &Engineering
Compostingin Schools
Resources Contacts
Cornell Composting Resources
http://www.cfe.cornell.edu/compost/Compost_Resources.html (4 of 5) [1/16/2001 8:50:26 AM]

All material is protected by Section 107of the 1976 copyright law. Copyright © is held byCornellUniversity. If you intend to use this material, please acknowledgeits author and source.
For general questions about composting, please browse thisand other composting websites,or make useof the compostlistserves.
For specific comments related to this page, please contact the Cornell Waste Management Institute(format and style),or TomRichard (technical content).
This page was created on August 3, 1995This page was last updated on October 2000
Cornell Composting Resources
http://www.cfe.cornell.edu/compost/Compost_Resources.html (5 of 5) [1/16/2001 8:50:26 AM]
Organizations:
Natural Resource, Agriculture, and Engineering Service (NRAES)
(formerly Northeast Regional Agricultural Engineering Service)
http://nraes.org
NRAES produces and distributes many up-to-date comprehensiveguides related to composting. You mayfind "On-Farm CompostingHandbook" NRAES-54, or "Field Guide to On-FarmComposting",NRAES-114 and/or "Composting for Municipalities, Planningand Design Considerations"NRAES-94 useful. They are availablefrom Natural Resources Agricultural Engineering Service(NRAES).See their contact information below. A complete list of NRAESpublications is also available.E-mail orders are accepted.
*Please note that NRAES distributes and markets publicationsbut does not have experts on staff toanswer questions about composting.
Cooperative Extension152 Riley-Robb HallIthaca, NY 14853-5701Phone: 607-255-7654Fax: 607-254-8770
e-mail: [email protected]
To place an order:
http://nraes.org/nraesform.html
On-Farm Composting page:
http://nraes.org/publications/nraes54.html
General publications page:
Other Contacts
http://www.cfe.cornell.edu/compost/Contacts.html (1 of 4) [1/16/2001 8:50:27 AM]

http://nraes.org/publications.html
The Composting Council
(a trade and professional organization)114 South Pitt StreetAlexandria, Virginia 22314phone: 703-739-2402fax: 703-739-2407
e-mail: [email protected]
http://CompostingCouncil.org
Woods End Agricultural Institute, Inc.
Rural Route #2, Box 1850Mt. Vernon, Maine 04352phone: 207-293-2453fax: 207-293-2488
http://www.maine.com/woodsend/inst.htm
In New York:285 Hungry Hollow RoadChestnut Ridge, NY 10977phone: 914-352-0145fax: 914-352-0149
e-mail: [email protected]
Websites:A few web sites on composting:
Rot Web
Provides information on a variety of issues related to homecomposting. Includes a list of homecomposting publications andlinks to other sites.
http://www.indra.com/~topsoil/Compost_Menu.html
Other Contacts
http://www.cfe.cornell.edu/compost/Contacts.html (2 of 4) [1/16/2001 8:50:27 AM]

The Composting Resource Page
Provides access to information on composting from backyardto large scale systems. Includes aninteractive bulletin boardfor questions and answers.
http://www.oldgrowth.org/compost
Home Composting
If you are a non-profit home composting group, this site willprovide a free web page for you and link itto their site. Alsoincluded: a list of organic materials with appropriate compostmethods for each, as wellas instructions for building bins, compostingwith worms, and other composting methods.
http://www.mastercomposter.com
BioNet
Includes access to technical publications and a database ofwaste management sites, in German andEnglish.
http://www.bionet.net/
Listserves:
Subscription information forthe interactive mailing list "Compost"
This listserve provides an ongoing discussion of issues relatedto composting. If you have a question,simple or complex, thechances are someone on the list has the answer and would be happyto help youout.
Leaf Mulching Discussion Group
An interactive resource for information, query, and discussion on leaf mulching, the application ofnoncomposted municipal leaves to farmland.
Publications:
Other Contacts
http://www.cfe.cornell.edu/compost/Contacts.html (3 of 4) [1/16/2001 8:50:27 AM]

BioCycle
Journal of Composting & RecyclingThe JG Press, Inc.419 State AvenueEmmaus, PA 18049phone: 610-967-4135
e-mail: [email protected]://www.jgpress.com
Composting News
Ken McEntee, Editor13727 Holland RoadCleveland, OH 44142phone: 216-362-7979fax: 216-362-6553
e-mail: [email protected]://www.recycle.cc
CornellComposting
Science &Engineering
Compostingin Schools
Resources Contacts
For general questions about composting, please browse thisand other composting websites, or makeuseof the compost listserves.
This page was created on January 31, 1996This page was last updated October 2000
Other Contacts
http://www.cfe.cornell.edu/compost/Contacts.html (4 of 4) [1/16/2001 8:50:27 AM]

Back to the On-Farm Composting Handbook, Table of Contents
App. A Characteristics of Raw MaterialsTable A.1
% N C:N ratio Moisture Bulk density Type of (dry (weight content % (pounds per
Material value weight) to weight) (wet weight) cubic yard) Crop residues and fruit/vegetable-processing wastes Apple filter cake Typical 1.2 13 60 1,197Apple pomace Typical 1.1 48 88 1,559Apple-processing sludge Typical 2.8 7 59 1,411Cocoa shells Typical 2.3 22 8 798Coffee grounds Typical - 20 - -Corn cobs Range 0.4-0.8 56-123 9-18 -
Average 0.6 98 15 557Corn stalks Typical 0.6-0.8 60-73 a 12 32Cottonseed meal Typical 7.7 7 - -Cranberry filter cake Typical 2.8 31 50 1,021(with rice hulls) Typical 1.2 42 71 1,298Cranberry plant (stems,leaves)
Typical 0.9 61 61 -
Cull potatoes Typical - 18 78 1,540Fruit wastes Range 0.9-2.6 20-49 62-88 -
Average 1.4 40 80 -Olive husks Typical 1.2-1.5 30-35 8-10 -Potato-processing sludge Typical - 28 75 1,570Potato tops Typical 1.5 25 - -Rice hulls Range 0-0.4 113-1120 7-12 185-219
Average 0.3 121 14 202Soybean meal Typical 7.2-7.6 4-6 - -Tomato-processing waste Typical 4.5 11 a 62 -Vegetable produce Typical 2.7 19 87 1,585Vegetable wastes Typical 2.5-4 11-13 - -
Fish and meat processingBlood wastes(slaughterhouse waste anddried blood)
Typical 13-14 3-3.5 10-78 -
On-Farm Composting Handbook Appendix A, Table A.1
http://www.cfe.cornell.edu/compost/OnFarmHandbook/apa.taba1.html (1 of 5) [1/16/2001 8:58:38 AM]

Crab and lobster wastes Range 4.6-8.2 4.0-5.4 35-61 -
Average 6.1 4.9 47 240Fish-breading crumbs Typical 2.0 28 10 -Fish-processing sludge Typical 6.8 5.2 94 -Fish wastes (gurry, racks,and so on)
Range 6.5-14.2 2.6-5.0 50-81 -
Average 10.6 3.6 76 -Mixed slaughterhousewaste
Typical 7-10 2-4 - -
Mussel wastes Typical 3.6 2.2 63 -Poultry carcasses Typical 2.4 b 5 65 -Paunch manure Typical 1.8 20-30 80-85 1,460Shrimp wastes Typical 9.5 3.4 78 -
ManuresBroiler litter Range 1.6-3.9 12-15 a 22-46 756-1,026
Average 2.7 14 a 37 864
Cattle Range 1.5-4.2 11-30 67-87 1,323-1,674Average 2.4 19 81 1,458
Dairy tie stall Typical 2.7 18 79 -Dairy free stall Typical 3.7 13 83 -
Horse-general Range 1.4-2.3 22-50 59-79 1,215-1,620
Average 1.6 30 72 1,379
Horse-race track Range 0.8-1.7 29-56 52-67 -Average 1.2 41 63 -
Laying hens Range 4-10 3-10 62-75 1,377-1,620
Average 8.0 6 69 1,479
Sheep Range 1.3-3.9 13-20 60-75 -Average 2.7 16 69 -
Swine Range 1.9-4.3 9-19 65-91 -
Average 3.1 14 80 -
Turkey litter Average 2.6 16 a 26 783
On-Farm Composting Handbook Appendix A, Table A.1
http://www.cfe.cornell.edu/compost/OnFarmHandbook/apa.taba1.html (2 of 5) [1/16/2001 8:58:38 AM]

Municipal wastesGarbage (food waste) Typical 1.9-2.9 14-16 69 -
Night soil Typical 5.5-6.5 6-10 - -
Paper from domestic refuse Typical 0.2-0.25 127-178 18-20 -
Pharmaceutical wastes Typical 2.6 19 - -
Refuse (mixed food, paper, Typical 0.6-1.3 34-80 - -and so on)
Sewage sludge Range 2-6.9 5-16 72-84 1,075-1,750Activated sludge Typical 5.6 6 - -Digested sludge Typical 1.9 16 - -
Straw, hay, silageCorn silage Typical 1.2-1.4 38-43 a 65-68 -
Hay-general Range 0.7-3.6 15-32 8-10 -
Average 2.10 - - -
Hay-legume Range 1.8-3.6 15-19 - -Average 2.5 16 - -
Hay-non-legume Range 0.7-2.5 - - -
Average 1.3 32 - -
Straw-general Range 0.3-1.1 48-150 4-27 58-378Average 0.7 80 12 227
Straw-oat Range 0.6-1.1 48-98 - -
Average 0.9 60 - -
Straw-wheat Range 0.3-0.5 100-150 - -Average 0.4 127 - -
Wood and paperBark-hardwoods Range 0.10-0.41 116-436 - -
On-Farm Composting Handbook Appendix A, Table A.1
http://www.cfe.cornell.edu/compost/OnFarmHandbook/apa.taba1.html (3 of 5) [1/16/2001 8:58:38 AM]

Average 0.241 223 - -Bark-softwoods Range 0.04-0.39 131-1,285 - -
Average 0.14 496 - -Corrugated cardboard Typical 0.10 563 8 259Lumbermill waste Typical 0.13 170 - -Newsprint Typical 0.06-0.14 398-852 3-8 195-242Paper fiber sludge Typical - 250 66 1140Paper mill sludge Typical 0.56 54 81 -Paper pulp Typical 0.59 90 82 1403Sawdust Range 0.06-0.8 200-750 19-65 350-450
Average 0.24 442 39 410Telephone books Typical 0.7 772 6 250Wood chips Typical - - - 445-620Wood-hardwoods Range 0.06-0.11 451-819 - -(chips, shavings, and soon)
Average 0.09 560 - -
Wood-softwoods Range 0.04-0.23 212-1,313 - -(chips, shavings, and soon)
Average 0.09 641 - -
Yard wastes and other vegetationGrass clippings Range 2.0-6.0 9-25 - -
Average 3.4 17 82 -Loose Typical - - - 300-400Compacted Typical - - - 500-800Leaves Range 0.5-1.3 40-80 - -
Average 0.9 54 38 -Loose and dry Typical - - - 100-300Compacted and moist Typical - - - 400-500Seaweed Range 1.2-3.0 5-27 - -
Average 1.9 17 53 -Shrub trimmings Typical 1.0 53 15 429Tree trimmings Typical 3.1 16 70 1,296Water hyacinth-fresh Typical - 20-30 93 405
Note: Data was compiled from many references listed in the suggested readings section of this handbook(pages 179-180). Where several values are available, the range and average of the values found in theliterature are listed. These should not be considered as the true ranges or averages, just representativevalues.
a Estimated from ash or volatile solids data.
On-Farm Composting Handbook Appendix A, Table A.1
http://www.cfe.cornell.edu/compost/OnFarmHandbook/apa.taba1.html (4 of 5) [1/16/2001 8:58:38 AM]

b Mostly organic nitrogen.
On-Farm Composting Handbook, Table of Contents
CornellComposting
Science &Engineering
Compostingin Schools
Resources Contacts
Reprinted with permission from On-Farm Composting Handbook (NRAES-54). ©1992 by NRAES(Northeast Regional Agricultural Engineering Service). All rights reserved. For more information, pleasecontact NRAES, (607)255-7654, or [email protected].
For general questions about composting, please browse this and other composting websites, or make useof the compost listserves.
For specific comments related to this page, please contact the Cornell Waste Management Institute(format and style), or Tom Richard (technical content).
This page was created on January 26, 1996This page was last updated on October 2000
On-Farm Composting Handbook Appendix A, Table A.1
http://www.cfe.cornell.edu/compost/OnFarmHandbook/apa.taba1.html (5 of 5) [1/16/2001 8:58:38 AM]

Back to the Cornell Composting HomepageBack to the Effect of Lignin on BiodegradabilityBack to the C/N Ratio
(Sources:)
Ingredient Lig % Cellulose (%) Hemicellulose (%) Nitrogen % Ash %(all data on a dry matterbasis)Acorns 13 -- -- 0 --Alfalfa 7.5 24 8 2.72Meal dehydrated (dehy) 15% 13 23 14 2.56 10Meal dehy 17% 10 25 10 2.72 11Hay, early (E.) vegetative(veg.) 5.3 20.7 10 3.744 10Hay, late (L.) veg. 6.5 21.5 11 3.472 10Hay, E. bloom (bl.) 7.1 23.9 11 3.04 9Hay, medium (M.) bl. 8.7 27.3 10 2.72 9Hay, full (F.) bl. 10.4 30.6 10 2.08 9Hay, L. bl. 12.2 30.8 12 1.92 8Hay, E. veg. 6 19 8 4.8 10Hay, L. veg. 7 20 10 4.32 9Hay, E. bl. 8 22 10 4 9Hay, M. bl. 10 25 9 3.52 8Hay, F. bl. 11 26 11 3.04 8Hay, L. bl. 12.2 26.8 14 2.72 8Hay, mature 14.4 29.6 14 2.24 7Hay, seeded 17 32 21 1.92 7Hay, weathered 15 30 13 1.6 8Wilted SilageE. bl. 35% dry matter (DM) 10 23 10 3.04 9M. bl. 38% DM 11 24 12 2.72 9F. bl. 40% DM 12 30 9 2.56 8Almond Hulls, good 6.1 10.9 5 0 7Medium quality 10 17 4 0 7Molded 30 27 0 0 8Apple pomace 5 -- -- < 0.5 --Bagasse 18.9 33.4 30.0 -- 2.4Bagasse 11 38 34 -- --Bahiagrass, 30% DM 7 31 30 1.424 10Hay 8 33 31 1.312 11
Substrate Compostition Table
http://www.cfe.cornell.edu/compost/calc/lignin.noframes.html (1 of 8) [1/16/2001 9:02:54 AM]

Bakery Waste 1 12 5 1.44 5Bamboo 20.1 -- 19.6 -- 3.3Barley, GrainHeavy 2 5 12 2.08 3Grain Light 2.9 7.1 18 2.24 4Malt Sprouts w/hulls 3 15 28 4.496 7Straw 11 48 21 0.688 7Beet Pulp, dehy 2 31 21 1.232 5+Steffen's filtrate 2 19 21 1.6 6Bermudagrass 7 32 38 1.44Coastal Hay, L. veg. 6 26 38 1.6 8Black pepper 18 -- -- 1.28 --Bloodmeal -- -- -- 14.672 7Brewers, Grains, dehy 6 18 22 4.16 4-Grains wet, 21% DM 4 19 19 4.16 10Brome 5.5 27 15.3 -- --Hay, Pre-bl. 5 33 27 1.68 10Hay, L. bl. 8 36 28 1.184 9Smooth, Hay M. bl. 4 33 29 2.336 10Hay, mature 8 37 26 0.928 8Canarygrass, Reed, Hay 4 32 28 1.648 10Carrot Roots, fr. 12% DM 0 8 1 1.584 8Cattails 8.5 -- -- 2.176 --Celery seed 22 -- -- 2.4 --Cinnamon bark 20 -- -- 0 --Citrus pulp, dehydrated 3 19 1 1.12 7Clover, Ladino, Hay 7 22 7 3.52 10Clover, Red, Hay 10 31 15 2.56 9Cocoa bean 25 -- -- 2.56 --Coconut meal 10 -- -- 3.44 --Coffee Grounds 15 -- 9 0 2hulls (bran) 20 51 22 0 5CornBran 1 15 44 1.76 3Cobs, ground 7 28 55 0.512 2Cob - 36.5 28 -- --Cob 7 -- -- 0.48 --Corn leaves 3.8 -- -- 3.04 --Corn meal 2 -- -- 1.776 --Distillers grain, dehy 5 12 33 4.16 4
Substrate Compostition Table
http://www.cfe.cornell.edu/compost/calc/lignin.noframes.html (2 of 8) [1/16/2001 9:02:54 AM]

wet 4 11 25 4.16 4grains + solubles 4 12 28 4.72 5solubles, dehy 1 6 16 4.752 8Fodder 3 30 22 1.424 2.4Gluten feed 1 11 33 4.096 5Gluten meal 1 8 28 7.488 3Gluten meal 60% crudeprotein 1 4 9 10.752 2Grain cracked 0.2 2.8 6 1.6 2Grain flaked 0.2 2.8 6 1.6 2Grain ground 0.2 2.8 6 1.6 2Grain high moisture 0.2 2.8 6 1.696 2Hominy 2 11 42 1.84 1Stover 11 28 28 1.056 7Whole ear (corn & cob) 2 10 16 1.44 2Corn Silage 3 26 16 1.44-45% grain 3 23 15 1.44 5+NPN 3 23 15 2.08 5+NPN + Ca 3 23 15 2.08 7-35% grain 4 24 18 1.376 7-25% grain 5 26 21 1.328 8-40% grain 4 23 18 1.472 4NPN 4 23 18 2.112 4NPN + Ca 4 23 18 2.08 625% grain 6 27 22 1.328 7Stalklage 7 38 23 1.008 9Immature (25% DM no ears) 3 35 22 1.44 11Cornstalk 11 38 26 -- 3Cornstalk 3.9 -- -- 1.056 --Cornstalk 11 33.5 32.6 -- 1Cotton -- 80-95 5-20 -- --Cottonseedhulls 24 49 17 0.656 4Black whole seed 15 16 9 3.68 5high lint 16 21 10 3.2 4seed meal, mech. ex. 6 14 8 7.04 7Solv. 41% crude protein(CP) 6 13 7 7.296 7Solv. 43% CP 7 14 7 7.824 7Cotton straw 15 42 12 -- --Distillers' grains 5 -- -- 3.52 --
Substrate Compostition Table
http://www.cfe.cornell.edu/compost/calc/lignin.noframes.html (3 of 8) [1/16/2001 9:02:54 AM]

Feather meal -- -- -- 12.48 4Fescue, Alta, Hay 6.5 34.5 29 1.632 10Fescue, K31, Hay 4 31 28 2.624 9Hay F. bl. 5 34 28 1.936 8mature 7 35 28 1.472 7Fescue, Meadow, Hay 7 36 22 1.456 8Tall fescue 3.1 30 24.5 -- --Fishmeal 10.656 25Fruit pits 40 -- -- -- --Ginger root 6 -- -- 1.6 --Grape pomace 17 -- -- 0 --Grape pomace 35 19 1 0 10Grape stems 12 -- -- < 0.5 --Guineagrass 8 35 26 1.44Kelp, treated 6 -- -- 4.8 --Linseed meal 7 -- -- 4.48 --mech. ex. 7 10 8 6.064 6meal solv. ex. 6 13 6 6.128 6Lupins 3.3 -- -- 5.472 --ManureElephant manure 10.4 -- -- 1.12 --Chicken manure 3.4 -- -- 5.424 --Pig manure 2.2 -- -- 4.416 --Cow manure sample 1 8.1 -- -- 3.104 --Cow manure sample 2 7.9 -- -- 3.216 --Cow manure sample 3 10.1 -- -- 2.752 --Millet feed 4 13 2.064 3Milo see sorghumMolasses beet,79% DM 0 0 0 0.48 11Molasses cane,73% DM 0 0 0 1.28 8Municipal refuse -- 76 -- -- --Napiergrass fr. 8 36 28 1.44-30 days DM 10 35 25 1.392 9-60 days DM 14 33 28 1.248 6Needle and thread 6 37 40 0.656 20Nutmeg hulls 17 -- -- 0.16 --Oats, grain gr. 0 0-38 lb/bushel 3 13 16 2.128 3
Substrate Compostition Table
http://www.cfe.cornell.edu/compost/calc/lignin.noframes.html (4 of 8) [1/16/2001 9:02:54 AM]

-32 lb/bushel 4 17 21 2.096 5Hay 6 30 30 1.488 8Hulls 8 34 36 0.624 7Silage dough 9 23 24 1.6 7Straw 14 33 23 0.704 8Olive waste 28 -- -- 0 --Orchard grass 4.7 30 14.4 -- --Orchardgrass, young 4.3 26 25 2.4Hay E. bl. 4 30 23 1.632 10Hay, L. bl. 4 34 27 1.344 9Palm kernel oil meala 14 -- -- 0.24 --Pangola grass 7 34 29 1.76fresh pangola grass, 21%DM 5 33 32 1.648 10Paper ProductsBrown cardboard 12 72 -- -- 1.7Christian Science Monitor 21 60 -- -- 0.4Manchester Guardian 3 59 -- -- 30Newsprint 20.9 -- -- 0.816 --Playboy 9 51 -- -- 24Solka floc (cellulose) 5 84 -- -- 0.3Washington Post 26 55 -- -- 0.4Whatman no. 41 5 89 -- -- 0.2Pea vines, Silage, 25% DM 9 40 10 2.096 12Peanut, Hulls 23 42 9 1.248 4Meal -- -- 8 8.32 6Peanut skin 7 -- -- < 0.5 --Pineapple, bran 7 30 36 0.736 3Potato tubers 1 1 4 1.424 6Poultry, Manure 2 12 24 4.512 22Pricklypear, fr. 17% DM 1 1 4 0.768 6Rapeseed meal 3.7 -- -- 6.768 8Red Top, fr. 29% DM 8 32 24 1.856 8Reed Canary grass 5.3 28 16.5 -- --Reed foxtail 4.5 29 17.7 -- --Ricebran 3.3 10.7 11 2.08 10Grain, ground 2.1 -- -- 1.424 5Grain, polished <1 <1 -- 1.376 1hulls 17 55 10 0.48 20
Substrate Compostition Table
http://www.cfe.cornell.edu/compost/calc/lignin.noframes.html (5 of 8) [1/16/2001 9:02:54 AM]

straw 12.5 32.1 24.0 -- 17.5Russian Thistle, 11 33 20 1.792 15Rye grain 1 -- -- 2.208 2Ryegrass, Hay 2 28 11 1.376 10Ryegrass, Straw 5 37 27 -- --Safflower, Mealmech. ex. 14 27 18 3.536 4meal solv. ex. 14 27 17 4.064 4Sagebrush, Big s.c. 12 18 12 1.488 7Sesame seed 2 -- -- -- --Sorghum, Grain dry (milo) 1.4 3.6 18 1.984 2Grain rolledb 1.4 3.6 18 1.984 2Grain, steam flaked 1.4 3.6 18 1.92 2-Silage, 30% DM 6 32 26 1.2 9Soybean, Hulls 2 48 17 1.936 5Soybean meal -44 0.3 9.7 4 7.84 7Soybean meal -49 0.2 5.8 2 8.8 7Soybean Straw 16 38 16 0.832 6Soybean whole 0.2 8.8 4 6.848 6Sudangrass, Hay 4 35 27 1.808 10-Silage, 28% DM 5 37 29 1.728 10Sugar beet pulp 5 -- -- 1 --SunflowerSunflower hulls 19 -- -- -- --Sunflower meal 12 21 7 4.144 6Tapioca -- -- -- 0.496 3TimothyTimothy, mature 7.3 31 29 1.12Hay L. veg. 3 27 25 2.24 8Hay, E. bl. 4 30 27 1.76 7Hay, M. bl. 5 31 31 1.44 7Hay, L. bl. 6 34 28 1.28 7Hay, Milk st. 7 36 28 1.12 6Hay, seed st. 9 36 27 0.96 6-Silage, L. bl. 42% DM 7 34 24 1.44 7TomatoTomato pomace, dried 11 39 5 2.56 8Tomato vines - -- -- -- --Trefoil, birdft., Hay 9 27 11 2.608 7Turnip, fr. 9% DM 10 24 10 1.888 2
Substrate Compostition Table
http://www.cfe.cornell.edu/compost/calc/lignin.noframes.html (6 of 8) [1/16/2001 9:02:54 AM]

Urea 0 0 0 46.72 0Vanilla bean 14 -- -- 0 --Vetch, Hay 8 25 15 3.328 7Water hyacinth 8.7 -- -- 2.832 --Wheatbran 3 12 36 2.736 7Grain, Hard red spring 1 4 11 1.808 2Grain, soft white 0.6 3.4 10 1.808 2Hay, E. veg. 4 26 22 1.92 8Hay, headed 7 34 27 1.36 7Middlings 2.2 8.8 26 2.944 2.4Silage dough 7.7 25.3 19 1.296 8Straw 8.9 -- -- 1.488 --Straw 14 40 31 0.576 8Straw 18.0 30.5 28.4 -- 11.0Straw 18 34 27.6 -- 1.3Straw 7 42 31 -- --Wheatgrass crest., Hay 6 30 29 1.44 9Whey, Acid -- -- -- 2.272 10Delact. -- -- 2.864 17Winterfat, s.c. 10 34 28 1.728 15WoodAspen 15.5 50.8 28.7 -- 0.2Balsam Fir 28 42.7 24.4 -- 0.2Beech 12.7 27.7 21.1 1.44 --Birch 19.5 38.8 37.3 -- 0.3Birch 19.5 40.0 39.0 -- 0.3Pin cherry 8.98 8.77 8.4 1.77 --Pine 27.8 44.0 26.0 -- 0.4Pine 27.8 42 23.5 -- 0.4Pine kraft pulp 5.0 77.0 18.0 -- 0.4Red maple 23 39 33 -- 0.2Spruce 28.6 42 26.5 -- 0.4Spruce 28.6 43.0 27.0 -- 0.4Sugar maple 8.49 14.1 9.95 0.97 --Yellow birch 12 17.3 13.2 1.42 --
Sources:Van Soest, Peter J. 1994. Nutritional ecology of the ruminant. Cornell University Press, Ithaca, NewYork. 476 pp.Ladisch, M. R., K. W. Lin, M. Voloch, and G. T. Tsao. 1983. Process considerations in the enzymatic
Substrate Compostition Table
http://www.cfe.cornell.edu/compost/calc/lignin.noframes.html (7 of 8) [1/16/2001 9:02:54 AM]

hydrolysis of biomass. Enzyme and Microb. Technol. 5(2):81-160.Lynch, J. M. 1987. Lignocellulolysis in Composts. In: Compost: Production, Quality and Use (M. DeBertoldi, M. P. Ferranti, P. L.'Hermite, and F. Zucconi, ed.). Elsevier Applied Science, New York. 853pp.Nodvin, S. C. 1983. Effects of distrubance on decomposition processes and on sulfur cycling in thenorthern hardwood forest. Ph.D. Thesis, Cornell University.Chandler, J. A. , Jewell, W. J., Gossett, J. M., Van Soest, P. J., and Robertson, J. B. 1980. PredictingMethane Fermentation. Biotechnology and Bioengineering Symp. No.10., John Wiley and Sons, Inc. pp.93-107.
Return to table
All material is protected by Section 107 of the 1976 copyright law. Copyright © is held by CornellUniversity. If you intend to use this material, please acknowledge its author and source.
For general questions about composting, please browse this and other composting websites, or make useof the compost listserves.
For specific comments related to this page, please contact the Cornell Waste Management Institute(format and style), or Tom Richard (technical content).
This page was created on December 24, 1996This page was last updated October 2000
Substrate Compostition Table
http://www.cfe.cornell.edu/compost/calc/lignin.noframes.html (8 of 8) [1/16/2001 9:02:54 AM]

Calculate C/N Ratio For Three MaterialsThis calculation solves for the carbon to nitrogen ratio of up to three materials. Enter the mass of eachmaterial (wet weight), percentage of carbon, percentage of nitrogen, and percentage of moisture, thenclick on the calculate button. If you have less than three materials be sure to enter zeroes in the fields forthe missing materials.
Note - Use whole numbers
Ingredient % H20 Weight % Carbon % Nitrogen C/N Ratio
Result:
Here's the Formula:Given overall moisture percentage goal of (g)
Ingredient %H20 Weight %Carbon %Nitrogen C/N Ratio
1 M1 Q1 C1 N1
2 M2 Q2 C2 N2
3 M3 Q3 C3 N3
R
in which: R = C/N ratio Qn = mass of material n ("as is", or "wet weight") Cn = carbon (%) Nn = nitrogen (%) Mn = moisture content (%) of material n
Calculate the Carbon to Nitrogen Ratio
http://www.cfe.cornell.edu/compost/calc/2.html [1/16/2001 9:03:10 AM]

Calculate Percent Moisture of CompostIn this example, you can calculate the moisture content in compost, given three ingredients, theirindividual moisture contents and their individual weights.
Enter the percentages and weights below and then click on the calculate button to get the result. To solvefor less than three ingredients enter zeroes in rows where ingredient is missing.
Ingredient % H20 Weight
Solve for % Moisture:
Here's the Formula:
Ingredient %H20 Weighta xb yc z
% Moisture(H20) = ((a*x) + (b*y) + (c*z)) / (x + y + z)
Percent Moisture Calculating Spreadsheet
http://www.cfe.cornell.edu/compost/calc/1a.html [1/16/2001 9:04:41 AM]
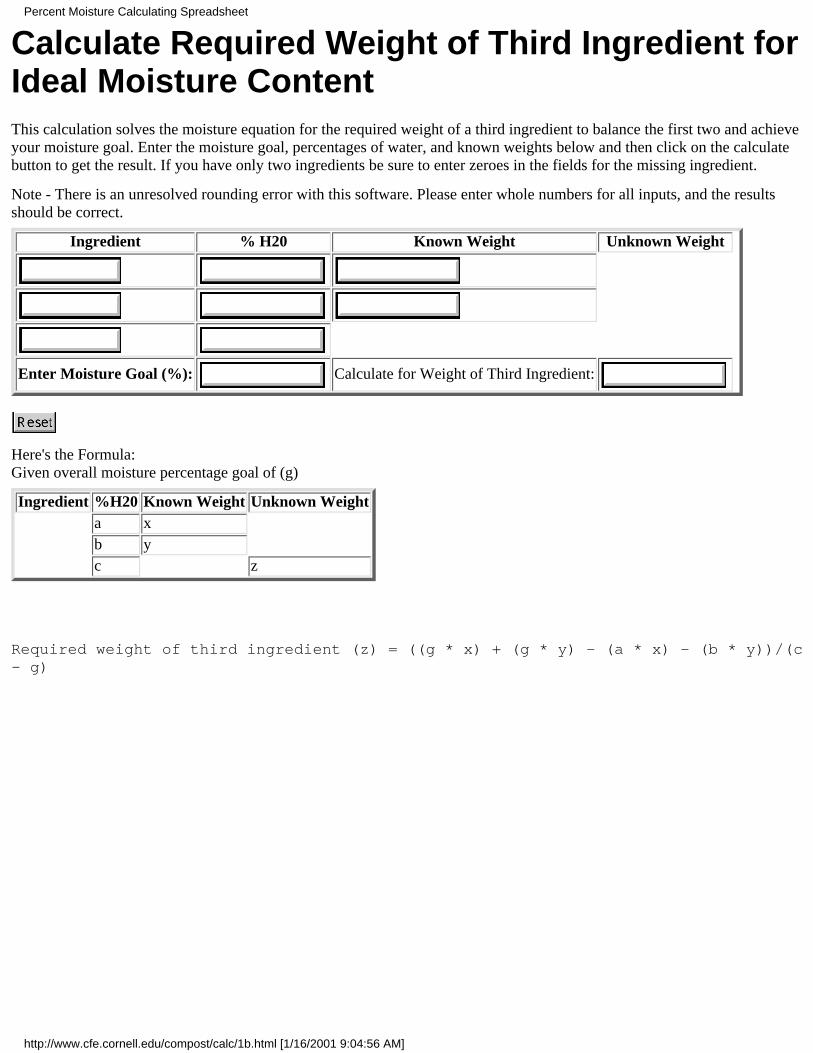
Calculate Required Weight of Third Ingredient forIdeal Moisture ContentThis calculation solves the moisture equation for the required weight of a third ingredient to balance the first two and achieveyour moisture goal. Enter the moisture goal, percentages of water, and known weights below and then click on the calculatebutton to get the result. If you have only two ingredients be sure to enter zeroes in the fields for the missing ingredient.
Note - There is an unresolved rounding error with this software. Please enter whole numbers for all inputs, and the resultsshould be correct.
Ingredient % H20 Known Weight Unknown Weight
Enter Moisture Goal (%): Calculate for Weight of Third Ingredient:
Here's the Formula:Given overall moisture percentage goal of (g)
Ingredient %H20 Known Weight Unknown Weighta xb yc z
Required weight of third ingredient (z) = ((g * x) + (g * y) - (a * x) - (b * y))/(c- g)
Percent Moisture Calculating Spreadsheet
http://www.cfe.cornell.edu/compost/calc/1b.html [1/16/2001 9:04:56 AM]