the science and politics of cell phones and driver...
TRANSCRIPT
The Science and Politics of Cell Phones and Driver Distraction
Louis Tijerina, Ph.D.Ford Motor CompanyDecember 1, 2009
Key Points
� A growing number of drivers are using hand-held electronics while driving
� Driver distraction is a real concern, though available data indicate that it is a smaller part of the highway safety problem than commonly believed
� “Naturalistic” real-world driving research indicates that visual distraction –or looking away from the road – is the main contributor to crashes
� Cognitive distraction plays less of a role in crashes and near miss events
� Bans on hand-held cell phones and texting with hand-held devices are consistent with the latest research
� Many studies show that hands-free, voice-based interfaces offer advantages over hand-held
Crash Statistics and Wireless
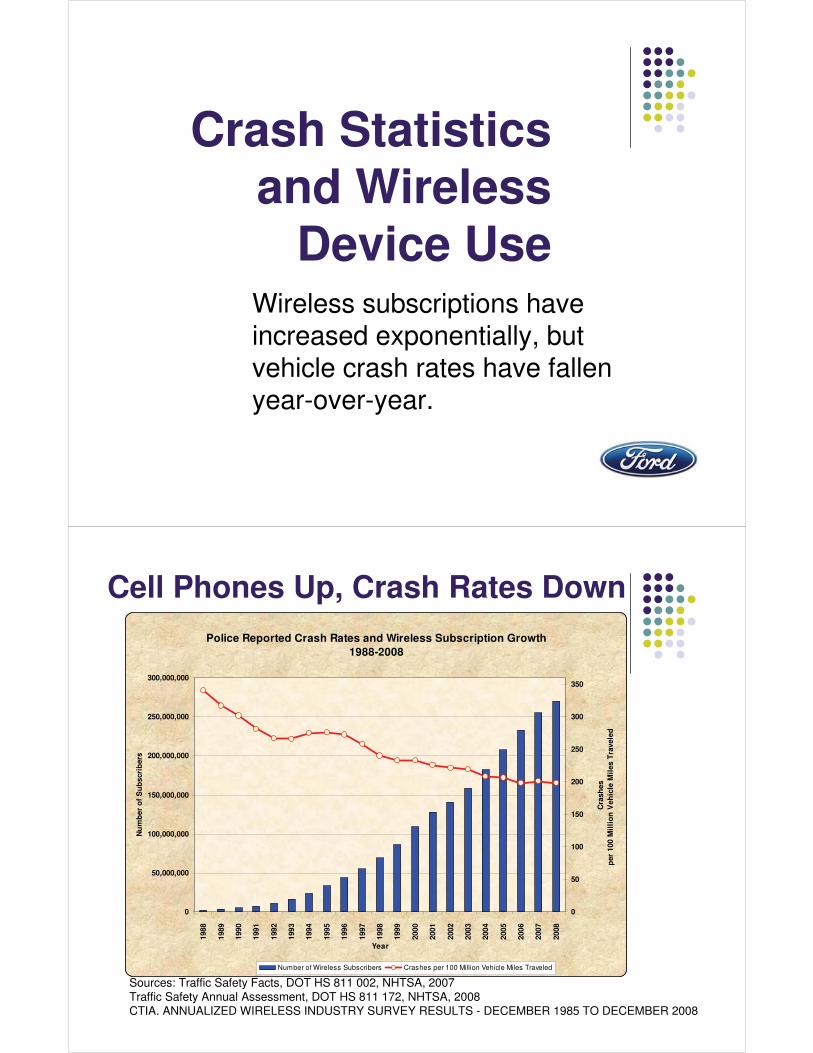
Device UseWireless subscriptions have increased exponentially, but vehicle crash rates have fallen year-over-year.
Cell Phones Up, Crash Rates Down
Sources: Traffic Safety Facts, DOT HS 811 002, NHTSA, 2007Traffic Safety Annual Assessment, DOT HS 811 172, NHTSA, 2008CTIA, ANNUALIZED WIRELESS INDUSTRY SURVEY RESULTS - DECEMBER 1985 TO DECEMBER 2008
Police Reported Crash Rates and Wireless Subscription Growth1988-2008
0
50,000,000
100,000,000
150,000,000
200,000,000
250,000,000
300,000,000
1988
1989
1990
1991
1992
1993
1994
1995
1996
1997
1998
1999
2000
2001
2002
2003
2004
2005
2006
2007
2008
Year
Nu
mb
er o
f S
ub
scri
ber
s
0
50
100
150
200
250
300
350
Cra
shes
per
100
Mil
lio
n V
ehic
le M
iles
Tra
vele
d
Number of Wireless Subscribers Crashes per 100 Million Vehicle Miles Traveled
Epidemiological Studies of Cellphones and
Driving Safety
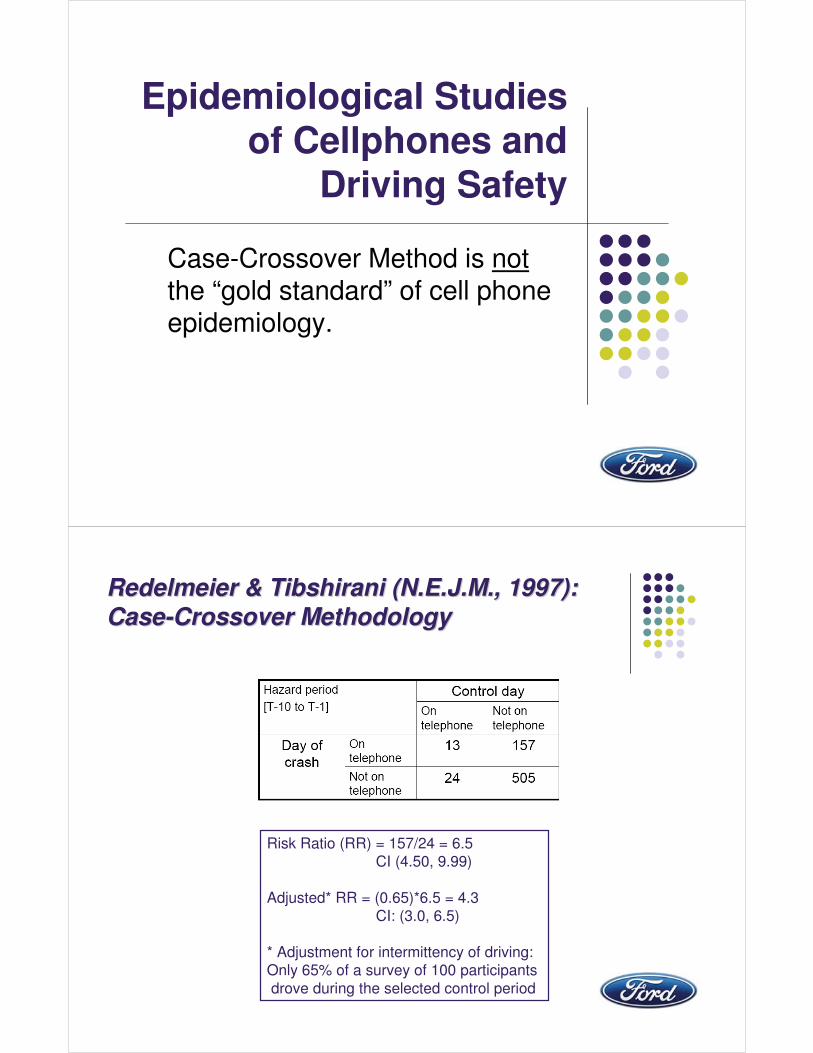
Case-Crossover Method is notthe “gold standard” of cell phone epidemiology.
Redelmeier & Tibshirani (N.E.J.M., 1997): Redelmeier & Tibshirani (N.E.J.M., 1997): CaseCase--Crossover MethodologyCrossover Methodology
Risk Ratio (RR) = 157/24 = 6.5CI (4.50, 9.99)
Adjusted* RR = (0.65)*6.5 = 4.3CI: (3.0, 6.5)
* Adjustment for intermittency of driving:Only 65% of a survey of 100 participants drove during the selected control period

Some Problems with the Case-Crossover Design
� Misclassification bias due to uncertainty in collision times
� Intermittency in Driving & recall bias
� Sampling Bias
Bellavance (2005) compared cell phone records(exact) & police records (inexact) for N = 104cases. He found 61% of emergency calls were made BEFORE the reported collision time.
Source: Bellavance (2005).
Laberge-Nadeau, et al. (A.A.P., 2003)
� Participants: N= 36,077 � Cell phone Users:
� Males: 9352; Female: 3339� Non-cell phone users:
� Males: 13590; Female: 9797� Method:
� Two Cohorts Design (2 groups)� Data sources: SAAQ questionnaire;
driving records; cell phone call details � Analysis:
� Odds Ratio (OR) of having at least 1 crash in a given year calculated for cell phone users relative to non-users
� Results:� Risk is 1.38 higher for cell phone users� Risk ratio drops to 1.11 (CI: 1.02, 1.22) for
men and 1.21 (CI: 1.03, 1.40) for women when other factors (e.g., miles driven) are taken into account
� A dose-response relationship was found between frequency of cell phone use and crash risk� Heavy Use: Over twice baseline� Minimal use: Similar to baseline
Recent Naturalistic Data
and ResultsVisual distraction, not cognitive distraction, is the main contributor to crash and near-crash involvement. Drivers choose to act when driving demand is low.
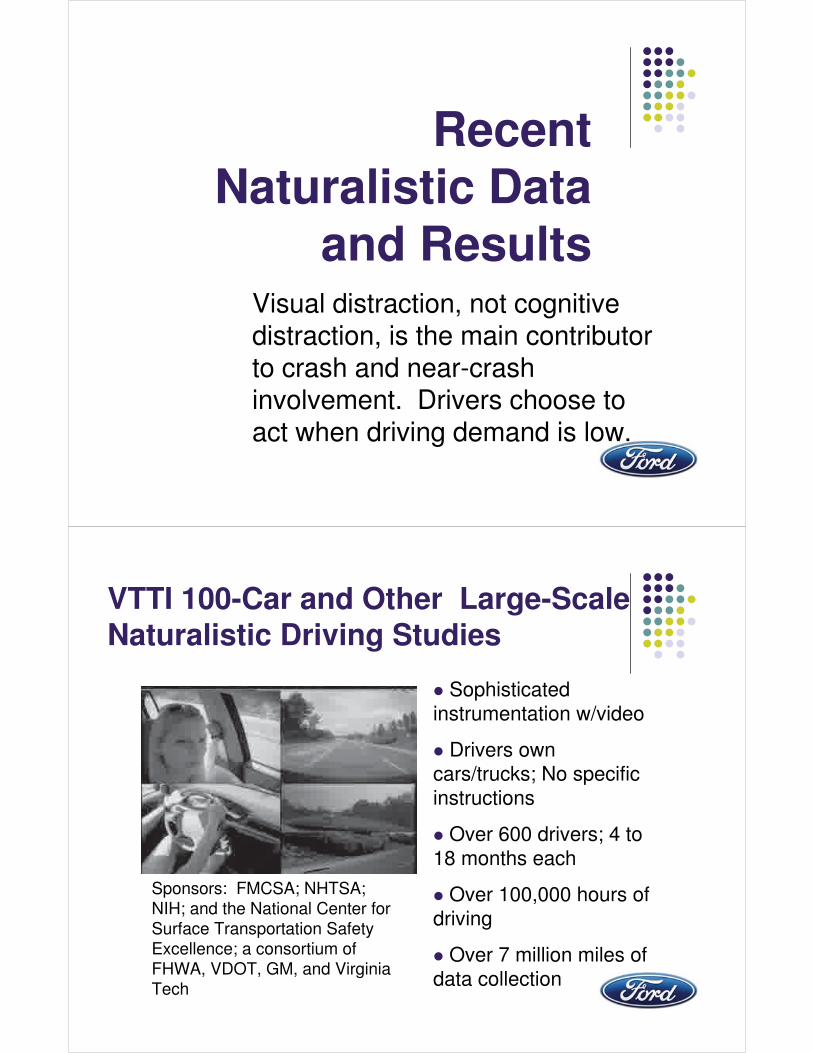
VTTI 100-Car and Other Large-Scale Naturalistic Driving Studies
� Sophisticated instrumentation w/video
� Drivers own cars/trucks; No specific instructions
� Over 600 drivers; 4 to 18 months each
� Over 100,000 hours of driving
� Over 7 million miles of data collection
Sponsors: FMCSA; NHTSA; NIH; and the National Center for Surface Transportation Safety Excellence; a consortium of FHWA, VDOT, GM, and Virginia Tech
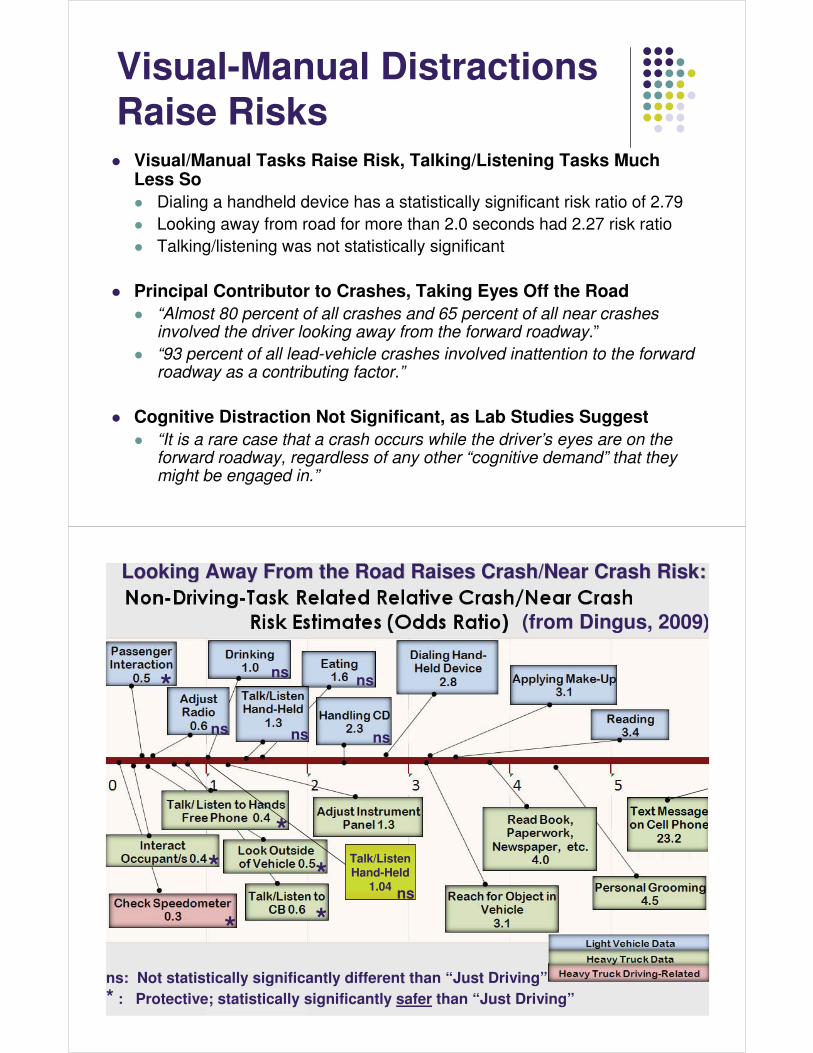
Visual-Manual Distractions Raise Risks� Visual/Manual Tasks Raise Risk, Talking/Listening Tasks Much
Less So� Dialing a handheld device has a statistically significant risk ratio of 2.79� Looking away from road for more than 2.0 seconds had 2.27 risk ratio� Talking/listening was not statistically significant
� Principal Contributor to Crashes, Taking Eyes Off the Road� “Almost 80 percent of all crashes and 65 percent of all near crashes
involved the driver looking away from the forward roadway.”� “93 percent of all lead-vehicle crashes involved inattention to the forward
roadway as a contributing factor.”
� Cognitive Distraction Not Significant, as Lab Studies Suggest� “It is a rare case that a crash occurs while the driver’s eyes are on the
forward roadway, regardless of any other “cognitive demand” that they might be engaged in.”
(from Dingus, 2009)
nsns
* : Protective; statistically significantly safer than “Just Driving”
ns
ns
ns*
ns: Not statistically significantly different than “Just Driving”
**
** *
Talk/ListenHand-Held
1.04 ns
Looking Away From the Road Raises Crash/Near Crash Risk: Looking Away From the Road Raises Crash/Near Crash Risk:
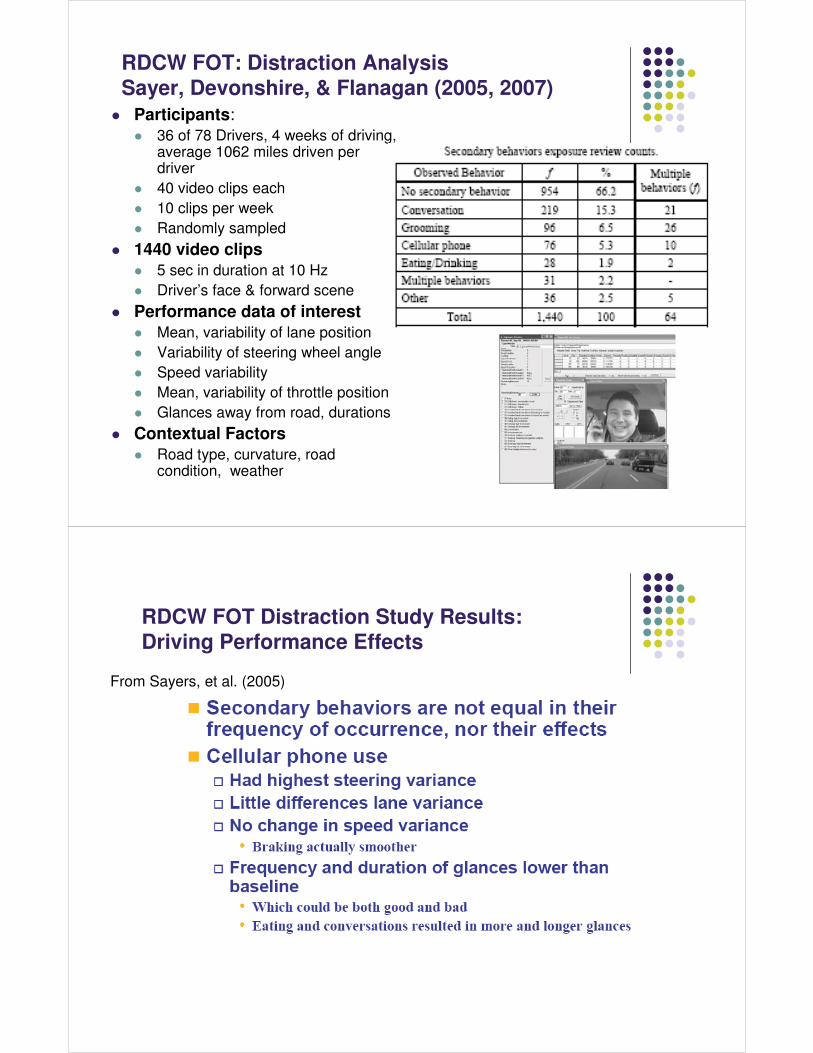
RDCW FOT: Distraction Analysis Sayer, Devonshire, & Flanagan (2005, 2007)
� Participants:� 36 of 78 Drivers, 4 weeks of driving,
average 1062 miles driven per driver
� 40 video clips each� 10 clips per week� Randomly sampled
� 1440 video clips� 5 sec in duration at 10 Hz� Driver’s face & forward scene
� Performance data of interest� Mean, variability of lane position� Variability of steering wheel angle� Speed variability� Mean, variability of throttle position� Glances away from road, durations
� Contextual Factors� Road type, curvature, road
condition, weather
RDCW FOT Distraction Study Results:Driving Performance Effects
From Sayers, et al. (2005)
RDCW FOT Distraction Study Results:Driving Context During Secondary Tasks
From Sayers, et al. (2005)
Hands-Free vs. Hand-Held Interfaces
Hands-free, voice interfaces have significant benefits over hand-held, visual-manual interfaces for command and data entry.
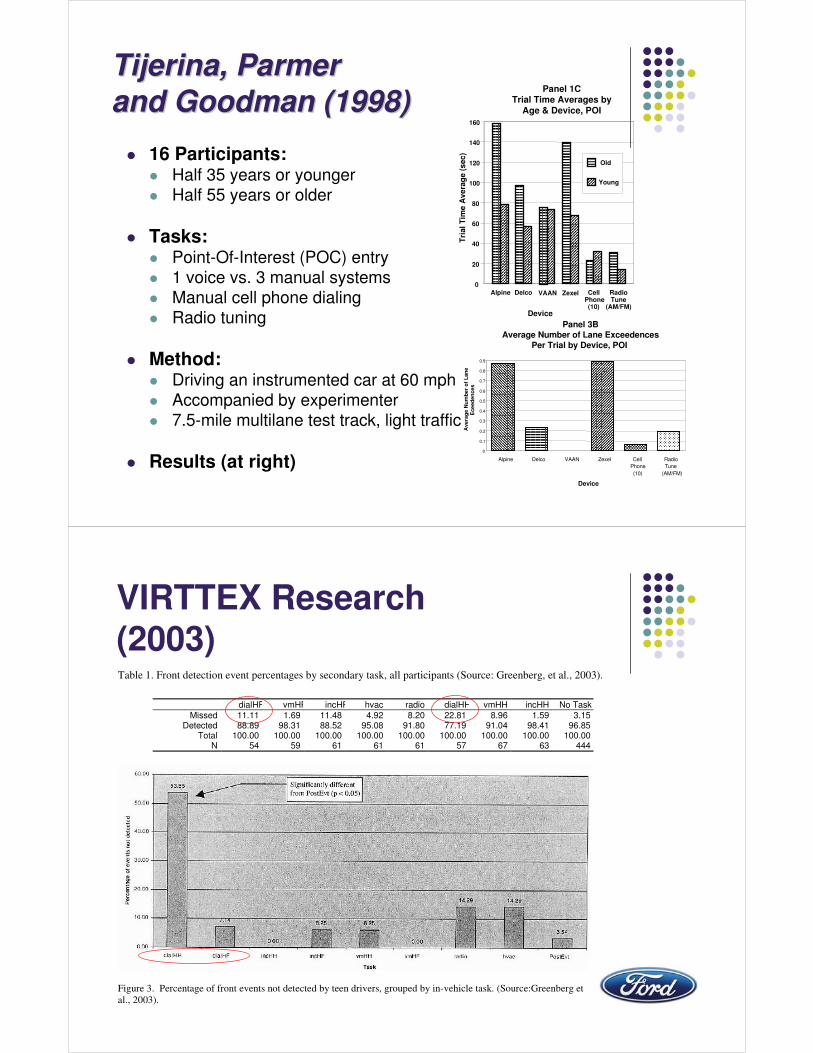
Tijerina, ParmerTijerina, Parmerand Goodman (1998)and Goodman (1998)
� 16 Participants:� Half 35 years or younger� Half 55 years or older
� Tasks:� Point-Of-Interest (POC) entry� 1 voice vs. 3 manual systems� Manual cell phone dialing� Radio tuning
� Method:� Driving an instrumented car at 60 mph� Accompanied by experimenter� 7.5-mile multilane test track, light traffic
� Results (at right)
Panel 1CTrial Time Averages by
Age & Device, POI
0
20
40
60
80
100
120
140
160
Alpine Delco VAAN Zexel CellPhone(10)
RadioTune
(AM/FM)Device
Tri
al T
ime
Ave
rag
e (s
ec)
Old
Young
Panel 3BAverage Number of Lane Exceedences
Per Trial by Device, POI
0
0.1
0.2
0.3
0.4
0.5
0.6
0.7
0.8
0.9
Alpine Delco VAAN Zexel CellPhone(10)
RadioTune
(AM/FM)
Device
Ave
rag
e N
um
ber
of
Lan
eE
ceed
ence
s
VIRTTEX Research (2003)
Figure 3. Percentage of front events not detected by teen drivers, grouped by in-vehicle task. (Source:Greenberg et al., 2003).
Table 1. Front detection event percentages by secondary task, all participants (Source: Greenberg, et al., 2003).
dialHF vmHF incHF hvac radio dialHH vmHH incHH No Task Missed 11.11 1.69 11.48 4.92 8.20 22.81 8.96 1.59 3.15
Detected 88.89 98.31 88.52 95.08 91.80 77.19 91.04 98.41 96.85 Total 100.00 100.00 100.00 100.00 100.00 100.00 100.00 100.00 100.00
N 54 59 61 61 61 57 67 63 444
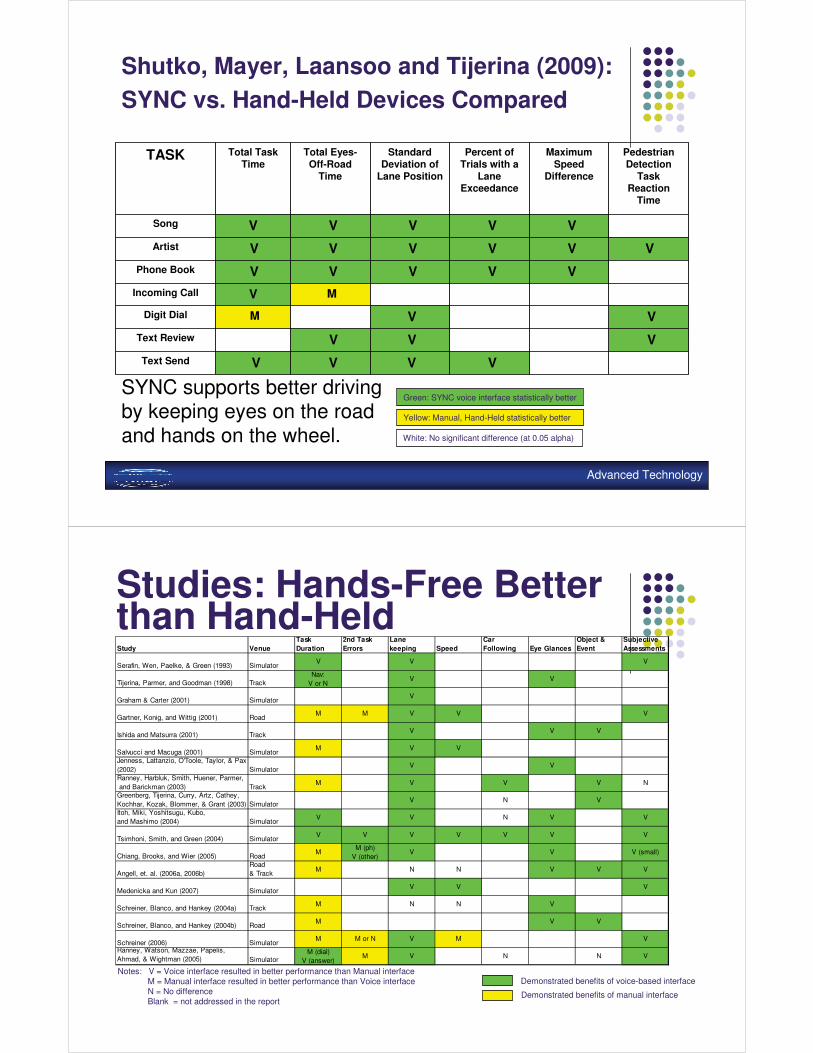
Shutko, Mayer, Laansoo and Tijerina (2009): SYNC vs. Hand-Held Devices Compared
Yellow: Manual, Hand-Held statistically better
VVVVText Send
VVVText Review
VVMDigit Dial
MVIncoming Call
VVVVVPhone Book
VVVVVVArtist
VVVVVSong
Pedestrian Detection
Task Reaction
Time
Maximum Speed
Difference
Percent of Trials with a
Lane Exceedance
Standard Deviation of
Lane Position
Total Eyes-Off-Road
Time
Total Task Time
TASK
Green: SYNC voice interface statistically better
White: No significant difference (at 0.05 alpha)
Advanced Technology
SYNC supports better drivingby keeping eyes on the road and hands on the wheel.
Notes: V = Voice interface resulted in better performance than Manual interfaceM = Manual interface resulted in better performance than Voice interfaceN = No differenceBlank = not addressed in the report
Demonstrated benefits of voice-based interface
Demonstrated benefits of manual interface
Studies: Hands-Free Better than Hand-HeldStudy Venue
Task Duration
2nd TaskErrors
Lane keeping Speed
Car Following Eye Glances
Object & Event
Subjective Assessments
Serafin, Wen, Paelke, & Green (1993) SimulatorV V V
Tijerina, Parmer, and Goodman (1998) TrackNav:
V or NV V
Graham & Carter (2001) SimulatorV
Gartner, Konig, and Wittig (2001) RoadM M V V V
Ishida and Matsurra (2001) TrackV V V
Salvucci and Macuga (2001) SimulatorM V V
Jenness, Lattanzio, O'Toole, Taylor, & Pax (2002) Simulator
V V
Ranney, Harbluk, Smith, Huener, Parmer, and Barickman (2003) Track
M V V V N
Greenberg, Tijerina, Curry, Artz, Cathey, Kochhar, Kozak, Blommer, & Grant (2003) Simulator
V N V
Itoh, Miki, Yoshitsugu, Kubo, and Mashimo (2004) Simulator
V V N V V
Tsimhoni, Smith, and Green (2004) SimulatorV V V V V V V
Chiang, Brooks, and Wier (2005) RoadM
M (ph)V (other)
V V V (small)
Angell, et. al. (2006a, 2006b)Road & Track
M N N V V V
Medenicka and Kun (2007) SimulatorV V V
Schreiner, Blanco, and Hankey (2004a) TrackM N N V
Schreiner, Blanco, and Hankey (2004b) RoadM V V
Schreiner (2006) SimulatorM M or N V M V
Ranney, Watson, Mazzae, Papelis, Ahmad, & Wightman (2005) Simulator
M (dial)V (answer)
M V N N V
Why Don’t Laboratory and Simulator Research Agree with Real-World Findings?
Unusually difficult materials, methodological biases, and absence of driver choice and compensation threaten external validity.
Examples of Cell Phone Research Conversations
� Underspecified� e.g., ‘Topics of interest to the participant’
� Mental Arithmetic (or variations)� Incoming message: “How many miles will you travel in 2.5 hrs if you average 40 mph?” Driver: “100 mi”
� Baddeley Grammatical Reasoning (GR) Test (or variations)� Incoming message: "A follows B --- BA". Driver (correct response): “True“� Incoming message: “B is not followed by A – BA.” Driver (correct response): “False”
� Working Memory Span Task� Incoming message: “The train bought a newspaper.” Driver (correct response): “No” (not sensible)� Incoming message: “The boy brushed his teeth.” Driver (correct response): “Yes” (sensible)� After 5 sentences, recall the last word in each, in order
� Cognitive Performance Assessment Batteries (PABs), e.g., Rosenbaum Battery� Monologue: Incoming message: “Tell me as much as you can about the interior of your car”� Repeat sentence: Incoming message: “Undetected by the sleeping dog, the thief broke into Jane's Apt.”� Mental puzzles: Incoming message: “John is darker than Jim. Who is the lighter of the two?”
� Current Controversies or emotionally-laden topics� Clinton scandal� Salt Lake City Olympic Scandal� Politics, current events� “Close Call” stories, describing a time when you almost died
� Biographic questions
Research Need: Content analysis of real-world cell-phone conversations whiledriving: When, where, how often, how long, listening vs. talking emphasis, etc.
Example: Decrease in Brain Activation Associated with Listening to Someone Speak (Just et al., 2008; Brain Research)� Result: fMRI study showed simple auditory comprehension task led to
‘deteriorated driving’ & 37% reduction in parietal lobe activation� Validity Threats:
� Video game, not a car or simulator� Difficult, ‘winding’ course selected� Drivers could not adjust speed; Apparent speed was fixed at 43 mph � “Steering” was mouse or trackball, not steering wheel� Participants were told listening task and driving equally important � No realistic feedback on lanekeeping error:
� “ If the participant happened to steer the car into the side edge (berm) of the road, the program prevented the vehicle from leaving the road but recorded each time it made contact with the boundaries of the road as a road-maintenance error.” (p. 78)
� Participants not just listening/talking: Responses by button press� Interpretive Issues:
� The brain is highly non-linear: What does “37% reduction in parietal lobe activation” mean?
� How dangerous is thinking about whether “Botany is the study of plants”is a true or false statement?
Why Would Cell Phone Lab and Simulator Results Not Extrapolate to the Real World?
� (1) The conversational content, length, duration, number of turns, etc. in real world cell phone calls may be substantially less demanding than the conversations used in controlled studies;
� (2)The reaction time increase arising from conversations in previous studies may be too small to give rise to a detectable increase in real-world crash rates;
� (3) Lab-based event detection does not account fully for similar types of event detection in real driving, let alone for crashes;
� (4) Conversation may at times mitigate risks such as fatigue; � (5) Portable and embedded cell phones may have substantially
different human factors properties; and � (6) Drivers may tend to change behavior during calls in ways that
reduce net risk: place calls in relatively benign driving conditions, reduce risky driving maneuvers, increase headway, glance longer to the forward roadway, increase glances to mirrors after an event.
Costs and Benefits of Cell
Phone BanHarvard Center for Risk Analysis Studies
Harvard Center for Risk Analysis� Cohen and Graham (2003):
� “The annual value of the benefits gained by eliminating crashes caused by cell phone use would amount to $43 billion...The valueof the eliminated calls would also amount to $43 billion...The central estimate result suggests that banning cell phone use while driving is virtually a break-even proposition...”
� Lissy, Cohen, Park and Graham (2000) listed cell phone benefits:� Cell phones help prevent unnecessary trips, provide parental and
familial peace-of-mind, report criminal activity (e.g., drunk driving), convey emergency details and shorten response time, increase mental alertness during long, monotonous drives, enhance social connectedness, and improve productivity.
Conclusion� Use of electronics while driving are increasing, expected to continue.
� Driver distraction is a real concern, though the nature and magnitude of the driver distraction problem is different than simulator studies and public opinion suggest
� Real-world driving research indicates talking and listening on hand-held phones are not nearly so risky as visually distracting tasks
� Policy actions to discourage activities that take a driver’s eyes off the road can reduce risks
� Public outreach and education to inform drivers of distraction effects and remind them of their responsibility to drive safely are also appropriate
� Research indicates there are benefits to hands-free voice interfaces over hand-held visual-manual devices
End of Slides