the scientific and international context for the fifth …...the scientific and international...
TRANSCRIPT

The scientific and international context for the fifth carbon budget
October 2015
Acknowledgements
The Committee would like to thank:
The team that prepared the analysis for this report: This was led by Matthew Bell, Adrian Gault and Mike Thompson and included Owen Bellamy, Ewa Kmietowicz, Amy McQueen, Dean Pearson and Stephen Smith.
Other members of the Secretariat who contributed to this report: Jo Barrett and David Joffe.
A number of organisations and individuals for their significant support: Climate Action Tracker, the Department of Energy and Climate Change, the AVOID 2 consortium, the Grantham Institute on Climate Change, Matthew England and Jules Kajtar (University of New South Wales), Louise Jeffery (Potsdam Institute for Climate Impact Research), Carman Mak (Imperial College London), Alex Luta and Damien Morris (Sandbag), Martin Parry (Adaptation Sub-Committee, Joeri Rogelj (IIASA) and David Vaughan (British Antarctic Survey).
__________________________________________________________________
1

Contents
The Committee 3-5
________________________________________________________________________________
Executive summary 6-10
________________________________________________________________________________
Chapter 1: The science of climate change 11-26
________________________________________________________________________________
Chapter 2: International action to limit climate change 27-49
________________________________________________________________________________
Chapter 3: The EU and UK share of international action 50-68
________________________________________________________________________________
__________________________________________________________________
2

The Committee
The Rt. Hon John Gummer, Lord Deben, Chairman
The Rt. Hon John Gummer, Lord Deben, was the Minister for Agriculture, Fisheries and Food between 1989 and 1993 and was the longest serving Secretary of State for the Environment the UK has ever had. His sixteen years of top-level ministerial experience also include Minister for London, Employment Minister and Paymaster General in HM Treasury.
He has consistently championed an identity between environmental concerns and business sense. To that end, he set up and now runs Sancroft, a corporate responsibility consultancy working with blue-chip companies around the world on environmental, social and ethical issues. Lord Deben is Chairman of Valpak Limited and the Association of Professional Financial Advisors.
Professor Samuel Fankhauser
Professor Samuel Fankhauser is Co-Director of the Grantham Research Institute on Climate Change and Deputy Director of the ESRC-funded Centre for Climate Change Economics and Policy, both at the London School of Economics. He is a Director at Vivid Economics and a former Deputy Chief Economist of the European Bank for Reconstruction and Development.
Professor Sir Brian Hoskins
Professor Sir Brian Hoskins, CBE, FRS is the Chair of the Grantham Institute for Climate Change and the Environment at Imperial College London and Professor of Meteorology at the University of Reading. His research expertise is in weather and climate processes. He is a member of the scientific academies of the UK, USA, and China.
__________________________________________________________________
3

Paul Johnson
Paul Johnson has been director of the Institute for Fiscal Studies since January 2011. He is a visiting professor at UCL. Paul has published and broadcast extensively on the economics of public policy including tax, welfare, inequality and poverty, pensions, education, climate change and public finances. He is author of major books on pensions, tax and inequality. He is one of the authors of the “Mirrlees review” of tax system design. Paul has previously worked at the FSA and has been chief economist at the Department for Education and director of public spending in HM Treasury as well as deputy head of the UK Government Economic Service.
Paul is currently a member of the council and executive committee of the Royal Economic Society, a member of the banking standards board and has just completed an independent review of consumer price inflation statistics for the UK Statistics Authority. He has previously served on the council of the Economic and Social Research Council. He was a founder council member of the Pensions Policy Institute and in 2010 he led a review of the policy of auto-enrolment into pensions for the new government.
Professor Dame Julia King
Professor Dame Julia King is a Fellow of the Royal Academy of Engineering (FREng) and was made a CBE for ‘Services to Materials Engineering’ in 1999. She was appointed by the Chancellor of the Exchequer in March 2007 to lead the ‘King Review’ to examine the vehicle and fuel technologies that, over the next 25 years, could help to reduce carbon emissions from road transport.
She is currently Vice-Chancellor of Aston University, and is one of the UK’s Business Ambassadors, supporting UK companies in the areas of low carbon and transport. Following on from a career as an academic researcher and lecturer in materials engineering at the Universities of Cambridge and Nottingham, Julia King joined Rolls-Royce PLC in 1994. At Rolls-Royce, she held a number of senior executive appointments, including Director of Advanced Engineering for the Industrial Power Group and Engineering Director for the Marine Business. Julia returned to academia in 2004 as Principal of the Engineering Faculty at Imperial College, London, moving to Aston in 2006.
__________________________________________________________________
4

Lord John Krebs
Professor Lord Krebs Kt FRS FMedSci ML is Emeritus Professor of Zoology at Oxford University. He was Principal of Jesus College, Oxford between 2005 and 2015. Previously, he held posts at the University of British Columbia, the University of Wales, and Oxford, where he was lecturer in Zoology, 1976-88, and Royal Society Research Professor, 1988-2005. From 1994-1999, he was Chief Executive of the Natural Environment Research Council and, from 2000-2005, Chairman of the Food Standards Agency. He is a member of the U.S. National Academy of Sciences.
He was chairman of the House of Lords Science & Technology Select Committee from 2010 to 2014, President of the British Science Association in 2012 and is a member of the House of Lords Energy and Environment Subcommittee of the EU Select Committees (2015-).
Lord Robert May
Professor Lord May of Oxford, OM AC FRS holds a Professorship at Oxford University. He is a Fellow of Merton College, Oxford. He was until recently President of the Royal Society, and before that Chief Scientific Adviser to the UK Government and Head of its Office of Science and Technology.
Professor Jim Skea
Professor Jim Skea has research interests in energy, climate change and technological innovation. He has been RCUK Energy Strategy Fellow since April 2012 and a Professor of Sustainable Energy at Imperial College since 2009. He was Research Director of the UK Energy Research Centre 2004-12 and Director of the Policy Studies Institute 1998-2004.
He has operated at the interface between research, policy-making and business throughout his career. He is President of the Energy Institute and was elected co-Chair of IPCC Working Group III in 2015. He was awarded a CBE for services to sustainable energy in 2013 and an OBE for services to sustainable transport in 2004.
__________________________________________________________________
5

Under the Climate Change Act (2008) the Committee is required to advise the Government, by the end of 2015, on the level of the UK’s fifth carbon budget. The budget will set the limit on the amount of greenhouse gases that can be emitted by the UK between 2028 and 2032.
The fifth budget marks the halfway point from the first budget (2008-12) to the UK’s 2050 target to reduce greenhouse gas emissions by at least 80% below 1990 levels. It follows on from the first four legislated carbon budgets, which were set on the basis that UK emissions are reduced by at least 50% in 2025 relative to 1990 (25% relative to 2014).
The advice must take into account criteria set out in the Act. These criteria include climate science, international circumstances, and the impact of the budget on the economy, the government’s fiscal position, affordability of energy for households, security of supply and the competitiveness of businesses.
We will deliver our fifth carbon budget recommendation, reflecting the full set of criteria, in a report to be published towards the end of November. In developing our advice we are publishing in advance:
• Our assessment of the state of climate science and international circumstances. The UNconference in Paris at the end of 2015 makes these criteria particularly pertinent. This is thesubject of this report.
• Scenarios for development of the power sector through the 2020s, setting out approaches toincreasing the availability of low-carbon power whilst minimising costs and ensuring a secureelectricity supply. The report on this will be published later in October.
Figure 1 provides a representation of how these reports fit together in providing our advice.
Executive summary
__________________________________________________________________
6

Figure 1: Framework for the Committee’s advice
Key findings from this report1
1. The science of climate change
• It is clear that the climate is changing as a result of greenhouse gas emissions. This is leadingto rising temperatures and sea levels, retreating ice and other changes to the naturalenvironment. Global average temperature has risen around 0.9°C and sea level around 20cmsince the late 19th Century.
• Many impacts are already being detected across the world, from changes in extreme weatherand ecosystems, to a slowdown in productivity gains for some key crops.
• Further emissions will lead to further warming and change. With rapid global action to cutemissions, total human-induced warming could be held below 2°C. Under baselines assumingno action, warming could exceed 6°C.
1 We provide full supporting evidence for these findings in the main chapters of the report.
UK Carbon Budgets
Climate science
• Evidence for human-caused climate change• Future climate risk• How climate risks can be reduced
International circumstances
• UNFCCC process and national pledges• Global policy and technology• Projected emissions• Cost-effective global pathways• EU circumstances
Power sector scenarios
• Meet demand at lowest cost• Innovation and option
development to ensure 2050 target achievable
• Ensure security of supply
Cost-effective path to 2050 target
• Cost-effective measures toreduce emissions
• Barriers to deployment• Cost reduction for key
technologies• Range of ways to meet 2050
target kept in play• Uncertainties in demand, fuel
prices and costs/availability ofkey technologies
Other criteria
• Competitiveness• Technology• Fiscal circumstances• Social circumstances• Energy supplies• Devolved administrations
Science and international reportPower sector report5th Carbon Budget advice
__________________________________________________________________
7

• There is no simple threshold beyond which climate change moves from safe to dangerous.Some disruption and irreversible losses are expected at 2°C. Losses accelerate with warming,and very severe damage is expected in a world reaching 4°C. The impacts will be unevenlydistributed and there are currently wide uncertainties about their magnitude.
• The increase in global temperature is determined mainly by total carbon dioxide emissionsover time, which must fall to near zero in order to limit warming. The allowable total for alikely2 chance of staying below 2°C will be exceeded in the mid-2030s if global emissionscontinue at the current rate.
2. International action to limit climate change
• The UK’s carbon budgets are domestic commitments, but set in the context of effortsworldwide to reduce greenhouse gas emissions.
• The UN has formally adopted an objective to limit global temperature rise to 2°C, andcountries are submitting pledges to reduce emissions post-2020. The aim is to adopt a newagreement, with legal status, in Paris at the end of 2015.
• Many countries and sub-national bodies have made commitments for deep emissionsreduction and are now delivering against these. Penetration of low-carbon technologiesaround the world is increasing, although these still account for a relatively small share ofglobal energy production.
• Lowest-cost paths with a likely chance of staying below 2°C require global emissions to peakaround 2020 with steep reductions thereafter (e.g. to 40-70% below 2010 levels in 2050). UNpledges made so far are not on this path. There is scope to reduce the gap through remainingpledges, increases in existing ambition and further commitments to reduce emissionsbeyond 2030.
• Both the UK and EU have objectives to reduce their greenhouse gas emissions in 2050 to atleast 80% below 1990 levels. These objectives remain appropriate in the light of the latestevidence regarding global emissions pathways consistent with 2°C.
3. The EU and UK share of international climate action
• The EU’s Member States have agreed a 2030 target for EU emissions of at least 40% below1990 levels. This is also the EU’s collective pledge for 2030 as part of the UN process towards aglobal deal. It is currently one of the more ambitious pledges.
• Our best estimate is that the EU 2030 agreement could mean a reduction in UK emissionsover the fifth carbon budget period of 54% below 1990 levels. The precise UK share cannot beknown with certainty until final rules governing Member States’ shares are agreed. Reflectingthese uncertainties suggests the UK will contribute emissions reductions within a range of 51-57% (Box 1).
2 Our original advice on the UK 2050 target, which predated international agreement on the 2°C limit, proposed that the world should keep a 50% likelihood of staying close to 2°C by 2100 (and keep the likelihood of a 4°C rise to very low levels). From this we inferred global emissions in 2050 should be 51-59% below 2010 levels. This is within the range for at least a 66% likelihood of 2°C (defined as “likely”) according to IPCC AR5. __________________________________________________________________
8

• The EU’s agreed 2030 target is at the lower end of ambition compared to the cost-effectivepath to its 2050 objective. It is below estimates for a ‘fair’ EU share of a global 2°C pathway,and the UK’s likely contribution is at the low end of ambition compared to its global ‘fair’share.
• The EU should be prepared to raise its ambition as a contribution to closing a globalemissions gap in 2030, provided other countries make similar commitments.
Box 1: UK share of EU effort to 2030
Final rules have not been agreed for the distribution to Member States of the EU pledge to reduce 2030 emissions by at least 40% below 1990 levels. The UK share will depend on allocation rules for each of the traded sectors of the economy (covered by the EU Emissions Trading System – EU ETS) and the non-traded sectors:
• It has been agreed that the EU-wide cap on emissions under the EU ETS will be 43% lowerthan 2005 levels by 2030. The UK share of allowances under this cap depends on rules yetto be finalised. Our best estimate is that it could imply a 49% reduction in the UK’s tradedsector allocation from 2005 to 2030, within a range of 44-53%.
• It has been agreed that EU-wide emissions in sectors not covered by the EU ETS will be 30%below 2005 levels by 2030. It has also been agreed that the maximum required reductionfrom any Member State will be 40% below 2005 emissions. Our analysis for the UK’s likelyreduction under the EU agreement suggests a best estimate of 37.5%, within a range 35-40%.
Compared to 1990 levels, our overall best estimate for the UK’s share of the EU 2030 pledge is for a 54% reduction in emissions in 2030. Reflecting the uncertainties gives a range of 51-57%.
Source: Further detail of the assumptions for these estimates is set out in Chapter 3.
Implications for the fifth carbon budget
Our findings in this report suggest that a fifth carbon budget reflecting current international circumstances and EU commitments requires, on a best estimate, a reduction in UK emissions by 2030 of around 54% on 1990 levels:
• International action. The world is acting to tackle climate change. The agreement inDecember 2015, under the UN process, could provide the legal basis for international actionbeyond 2020. The 2°C limit requires substantial global emission cuts by 2030. The UK shouldcontinue to play its part.
• The EU 2030 pledge. The EU’s Member States have agreed to reduce EU emissions by at least40% below 1990 levels in 2030. The UK has supported rules for dividing reductions betweenMember States which imply higher effort from richer countries like the UK, Germany andFrance. This is a fair, sensible and practical approach. For the current EU agreed pledge ourbest estimate is that this means a UK reduction of 54% below 1990 levels in 2030, within therange 51-57%.
__________________________________________________________________
9

However, to stay on a cost-effective track to the agreed 2°C objective, guided by the latest climate science, more effort will be required across the world by 2030 than currently pledged, including from the EU:
• The EU and UK 2050 targets. The EU and UK targets of at least an 80% reduction comparedto 1990 remain an appropriate contribution to global action towards 2°C. The fifth carbonbudget will need to be on a path to this target.
• Expectation of a process beyond Paris to raise ambition. Current pledges to the UN underthe Paris process suggest that, globally, more is needed to limit the risk of going beyond 2°C.There is scope for this in future, given more is possible at low cost and the intention for Paristo include a mechanism to raise ambition. The UK Government has previously suggested a50% reduction for the EU by 2030.
We will consider further the implications for the level of the fifth carbon budget when we provide our advice in November, taking into account the full range of factors required under the Climate Change Act.
While the process of submitting pledges in advance of Paris means important information is already available, more continues to arrive and there is scope for the Paris conference to produce significant new developments. We will send a letter to the Secretary of State after the Conference to set out if and how this affects our published advice.
__________________________________________________________________
10

Introduction and key messagesIn this chapter we consider the scientific understanding that underpins the rationale for reducing greenhouse gas emissions. While we note some recent research developments, much of the material was covered in our previous carbon budget advice (in 2008, 2010 and 2013). This reflects the fact that the evidence linking greenhouse gas emissions to climate risk is robust and widely agreed by experts.
We briefly revisit the key observations that show the world has been warming for several decades, and that this is mainly due to human activities rather than natural fluctuations. We then focus on impacts on human and natural systems: those already being observed, and potential future impacts which will depend significantly on the path of human activity. Finally we set out the implications for global emissions from setting a limit to global temperature change.
Our key messages are:
• It is clear that the climate is changing as a result of greenhouse gas emissions. This is leadingto rising temperatures and sea levels, retreating ice and other changes to the naturalenvironment. Global average temperature has risen around 0.9°C and sea level around 20cmsince the late 19th Century.
• Many impacts are already being detected across the world, from changes in extreme weatherand ecosystems, to a slowdown in productivity gains for some key crops.
• Further emissions will lead to further warming and change. With rapid global action to cutemissions, total human-induced warming could be held below 2°C. Under baselines assumingno action, warming could exceed 6°C.
__________________________________________________________________
11
Chapter 1: The science of climate change

• There is no simple threshold beyond which climate change moves from safe to dangerous.Some disruption and irreversible losses are expected at 2°C. Losses accelerate with warming,and very severe damage is expected in a world reaching 4°C. The impacts will be unevenlydistributed and there are wide uncertainties about their magnitude.
• The increase in global temperature is determined mainly by total carbon dioxide emissionsover time, which must fall to near zero in order to limit warming. The allowable total for alikely chance of staying below 2°C will be exceeded in the mid-2030s if global emissionscontinue at the current rate.
We set out the analysis underpinning these key messages in five sections:
1. Evidence for human-caused climate change
2. Impacts already occurring around the world
3. Potential future climate change
4. Climate risks
5. Implications for the fifth carbon budget
Much of the information presented here is covered at length in the latest assessment of the Intergovernmental Panel on Climate Change (IPCC AR5)3. The fundamental points – that global warming is happening, driven by human activity and with large potential impacts – are agreed by the world’s leading scientific bodies4.
1. Evidence for human-caused climate changeThe Earth is gaining energy and hence warming, driven principally by greenhouse gas emissions from human activity:
• Warming is seen at the surface and in the atmosphere and oceans as measured by severaldifferent scientific institutions. Global average surface temperature is now about 0.9°C abovelate-19th Century levels (Figure 1.1).
• The basic fact that greenhouse gases in the air warm the surface of the Earth has beenunderstood for over a century and is well-established.
• Greenhouse gases are being emitted by human activities (principally carbon dioxide fromfossil fuel burning) at an increasing rate and are accumulating in the atmosphere. Emissionsof other air pollutants have a net cooling influence, partially offsetting greenhouse warmingto date.
• Trends in climate are also influenced by natural factors. Solar variations and volcaniceruptions affect the global energy balance. Natural cycles within the climate system (such asEl Niño) move energy between the surface, air and oceans. These cycles are known to have astrong influence in some regions on timescales from a year up to a few decades.
3 https://www.ipcc.ch/report/ar5/ 4 See for instance Royal Society and US National Academy of Sciences Climate Change Evidence & Causes (https://royalsociety.org/~/media/Royal_Society_Content/policy/projects/climate-evidence-causes/climate-change-evidence-causes.pdf); and the Climate Communique written by 24 UK academic societies (http://www.iop.org/news/15/jul/file_65971.pdf). __________________________________________________________________
12
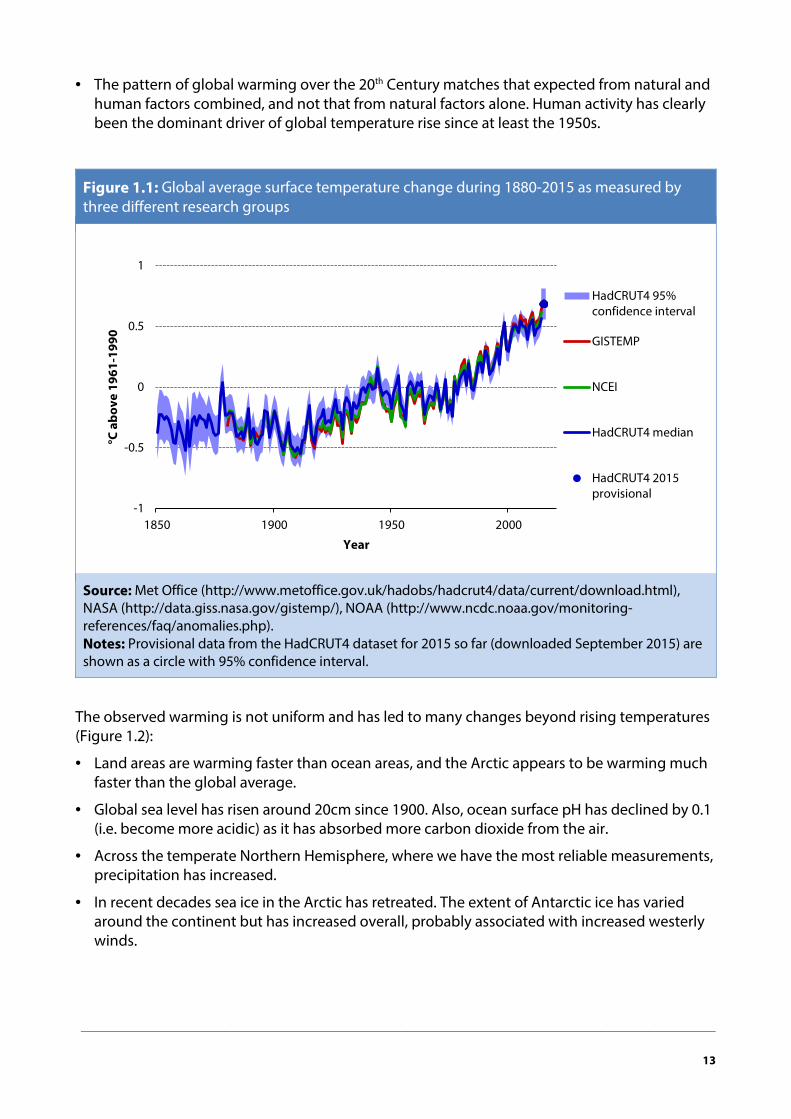
• The pattern of global warming over the 20th Century matches that expected from natural andhuman factors combined, and not that from natural factors alone. Human activity has clearlybeen the dominant driver of global temperature rise since at least the 1950s.
Figure 1.1: Global average surface temperature change during 1880-2015 as measured by three different research groups
Source: Met Office (http://www.metoffice.gov.uk/hadobs/hadcrut4/data/current/download.html), NASA (http://data.giss.nasa.gov/gistemp/), NOAA (http://www.ncdc.noaa.gov/monitoring-references/faq/anomalies.php). Notes: Provisional data from the HadCRUT4 dataset for 2015 so far (downloaded September 2015) are shown as a circle with 95% confidence interval.
The observed warming is not uniform and has led to many changes beyond rising temperatures (Figure 1.2):
• Land areas are warming faster than ocean areas, and the Arctic appears to be warming muchfaster than the global average.
• Global sea level has risen around 20cm since 1900. Also, ocean surface pH has declined by 0.1(i.e. become more acidic) as it has absorbed more carbon dioxide from the air.
• Across the temperate Northern Hemisphere, where we have the most reliable measurements,precipitation has increased.
• In recent decades sea ice in the Arctic has retreated. The extent of Antarctic ice has variedaround the continent but has increased overall, probably associated with increased westerlywinds.
-1
-0.5
0
0.5
1
1850 1900 1950 2000
°C a
bove
196
1-19
90
Year
HadCRUT4 95%confidence interval
GISTEMP
NCEI
HadCRUT4 median
HadCRUT4 2015provisional
__________________________________________________________________
13

Figure 1.2: Observed patterns of change in surface temperature (top) and precipitation (bottom)
Source: IPCC AR5 Notes: Temperature changes (top) span the period 1901-2012 while precipitation trends (bottom) span 1951-2010 due to less complete coverage before 1950. Trends are only shown for grid boxes with substantial coverage over the period (other areas are white). Grid boxes where the trend is significant at the 10% level are indicated by a + sign.
__________________________________________________________________
14

• The ice sheets over Greenland and Antarctica are losing mass. New observations show fasterice loss than reported in IPCC AR5, especially along the West Antarctic coast5. The structure ofthe ice sheet here makes it vulnerable to collapse, potentially adding 3.5-5m to sea level overseveral centuries even without further warming. New modelling suggests collapse mayalready be under way, but more detailed models are needed to support this6.
The global climate has therefore undergone substantial change in recent decades. Global average temperature is only one indicator of this change. A wealth of theory and observations points clearly to human activity, and greenhouse gases in particular, being the principal cause.
2. Impacts already occurring around the worldImpacts from climate change are being seen on all continents and across the oceans. This is detectable even in the presence of other, confounding drivers such as population growth and development, pollution and land use change7:
• Many hundreds of published studies find links between recent climate change and impactson the natural world and human society.
• For instance, scientists are highly confident that climate change is bleaching coral on reefsworldwide; greening and fruiting trees earlier in the year across Europe; reducing river flowsacross South Western Australia; forcing plant and animal species towards the poles and tohigher elevations around the world; and negatively impacting those living in the Arctic.
• There has been a negative effect on the global growth in productivity of some key crops, witha reduction of 2 %/decade (0-5 %/decade8) for wheat, and 1 %/decade (0-3 %/decade) formaize. Some crops in Europe and southern South America have experienced gains due toclimate change, while South Asia and wheat in Europe have incurred losses.
The warming is having a measurable influence on individual weather events such as heat waves in Europe and hurricanes in the US:
• It has been estimated that high-precipitation events (i.e. those expected once every threeyears in pre-industrial times) are already around 20% more likely, and high-temperatureevents four times more likely9.
• European heat waves as strong as in 2003 (when crop yields fell, power stations were shutdown due to overheating and the heat-related death toll ran into tens of thousands) areestimated to have been made at least twice as likely by human activity. A recent updatesuggests the warming since 2003 now makes it ten times more likely to occur again10.
5 McMillan et al. (2014) Increased ice losses from Antarctica detected by CryoSat-2, Geophysical Research Letters; Rignot et al. (2014) Widespread, rapid grounding line retreat of Pine Island, Thwaites, Smith, and Kohler glaciers, West Antarctica, from 1992 to 2011, Geophysical Research Letters. 6 Joughin et al. (2014) Marine Ice Sheet Collapse Potentially Under Way for the Thwaites Glacier Basin, West Antarctica, Science 7 IPCC WG2 AR5 Technical Summary 8 Brackets indicate 10-90% confidence ranges. 9 Fischer & Knutti (2015) Anthropogenic contribution to global occurrence of heavy-precipitation and high-temperature extremes, Nature Climate Change 10 Christidis et al. (2015) Dramatically increasing chance of extremely hot summers since the 2003 European heatwave, Nature Climate Change __________________________________________________________________
15

• The coastal surge brought to Manhattan by Hurricane Sandy in 2012 was made 20cm higherby sea level rise, increasing losses in New York by 30%11. In addition, the above-average seasurface temperatures at the time increased its wind speeds and rainfall12.
These impacts give an indication of the widespread and pervasive nature of climate risk. As emissions continue these risks would be expected to increase.
3. Potential future climate changeContinuing greenhouse gas emissions will lead to further warming and change. In relation to global temperature, it remains possible that rapid emissions reduction could limit human-induced warming to less than 2°C above late 19th Century levels. If emissions grow unabated, this warming rises to potentially more than 6°C:
• Under baseline scenarios in which no action is taken, energy system models predict acontinued increase in global emissions. As a result global temperature in 2100 would be 2.5-7.8°C (5-95% confidence range) above late 19th Century levels and rising13.
• Under an ambitious mitigation scenario considered by the IPCC, in which emissions peak nowand decline to zero or further before 2100, global temperature rise would be 0.9-2.3°C.
• Natural cycles will continue to affect trends, especially on regional scales. However, the recent“pause” or “slowdown” in global temperature rise does not substantially affect long-termprojections of warming (Box 1.1).
• Large volcanic eruptions, when they occur, will lower global temperature for a year or two. Amajor downswing in solar activity over several decades, considered possible but unlikely,would also lower global temperature by a few tenths of a degree14.
Box 1.1: Has there been a pause in global warming and does it affect future projections?
Although the world has clearly warmed since the 1950s, global average surface temperature has risen relatively slowly in recent years. Periods of slower (and faster) temperature rise are to be expected, and this “pause” does not substantially affect long-term projections.
• The pause has no agreed start date, but most estimates of global surface temperature showa slower rise during 2000-14 than the average since the 1950s.
• Nevertheless, the last 15 years are the warmest on record stretching back to the 1850s, and2015 is extremely likely to set a new high (Figure 1.1).
• Average surface temperature is only one indicator of climate change. Others, such as sealevel rise and Arctic sea ice decline, have not paused during this time.
• Short-term fluctuations in global temperature are to be expected, and can be seen fromyear to year and decade to decade in the observations. They are caused by two factors:
11 Lloyd’s (2014) Catastrophe Modelling and Climate Change 12 Magnusson et al. (2014) Evaluation of Medium-Range Forecasts for Hurricane Sandy, Monthly Weather Review 13 IPCC WG3 AR5 Technical Summary; see also further discussion in Chapter 2 14 Ineson et al. (2015) Regional climate impacts of a possible grand solar minimum, Nature Communications __________________________________________________________________
16
Box 1.1 (cont.): Has there been a pause in global warming and does it affect future projections?
– Changes in the rate of energy going into the climate system (e.g. from greenhousegases, the Sun’s activity, volcanoes and air pollutants).
– “Internal variability”, or natural cycles within the climate system, moving heat betweenthe surface, air and oceans. These are generally difficult to forecast.
• Scientists think a mix of factors have driven the pause: transfer of more surface heat to thedeeper oceans by internal variability; cooling from volcanoes and air pollution; and a dip inthe Sun’s cycle of activity. A lack of sufficient observations (especially in the oceans) makesit hard to quantify each of these very precisely.
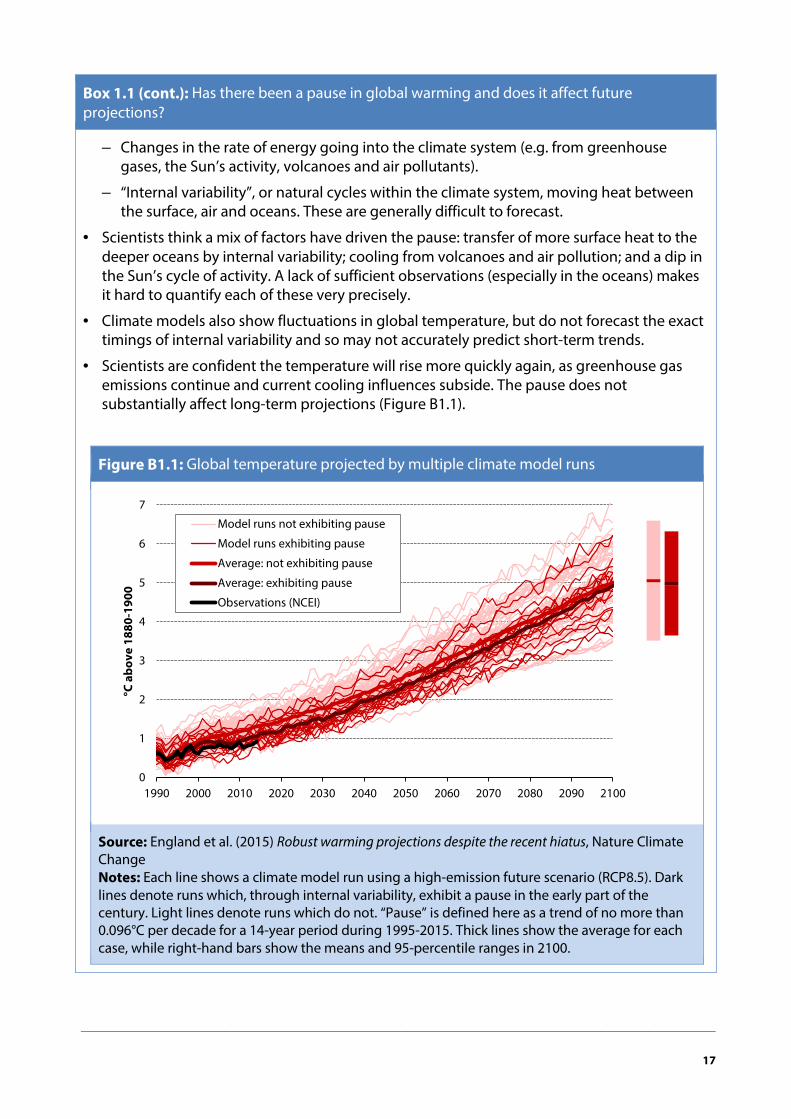
• Climate models also show fluctuations in global temperature, but do not forecast the exacttimings of internal variability and so may not accurately predict short-term trends.
• Scientists are confident the temperature will rise more quickly again, as greenhouse gasemissions continue and current cooling influences subside. The pause does notsubstantially affect long-term projections (Figure B1.1).
Figure B1.1: Global temperature projected by multiple climate model runs
Source: England et al. (2015) Robust warming projections despite the recent hiatus, Nature Climate Change Notes: Each line shows a climate model run using a high-emission future scenario (RCP8.5). Dark lines denote runs which, through internal variability, exhibit a pause in the early part of the century. Light lines denote runs which do not. “Pause” is defined here as a trend of no more than 0.096°C per decade for a 14-year period during 1995-2015. Thick lines show the average for each case, while right-hand bars show the means and 95-percentile ranges in 2100.
0
1
2
3
4
5
6
7
1990 2000 2010 2020 2030 2040 2050 2060 2070 2080 2090 2100
°C a
bove
188
0-19
00
Model runs not exhibiting pause
Model runs exhibiting pause
Average: not exhibiting pause
Average: exhibiting pause
Observations (NCEI)
NH H
__________________________________________________________________
17

Warming will lead to changes across all parts of the climate system, with very long-term implications:
• Sea level rise will accelerate over the coming decades, reaching about 0.5-1m above 1900levels by the end of the century. An increasing contribution will come from the Greenland IceSheet. Larger rises would occur if the Antarctic Ice Sheet were to collapse.
• Though with some exceptions, the contrast between wet and dry regions of the world willgenerally increase, and heavy rainfall events will tend to become more intense.
• Ocean pH will continue to decline as the concentration of carbon dioxide increases.
• Some evidence – especially from warmer climates deep in Earth’s past – suggests morefundamental shifts are possible, particularly at high levels of warming. These include changesto circulation patterns in the atmosphere and ocean (including the Gulf Stream which feedsmild weather to the UK), changes to monsoons, dieback of the Amazon forests and furtherfeedbacks from release of carbon in thawing permafrost.
• The long-lived nature of raised carbon dioxide concentrations means that, even if emissionswere to cease, temperatures would remain high, ice sheets would recede, sea level wouldcontinue rising, and other changes would persist for several centuries.
The increase in global temperature will be determined mainly by total carbon dioxide emissions over time. These emissions must fall to near zero (or, in the case of delayed action, go negative) in order to limit warming:
• IPCC AR5 estimated the total carbon dioxide emissions over time consistent with stayingbelow specific global temperature limits. To preserve a 50% likelihood of keeping warmingbelow 2˚C, the total remaining allowable emissions from 2011 is around 1100 GtCO2. For atleast a 66% (i.e. “likely”) chance, this total decreases to around 1000 GtCO2.
• These totals accounts for projected emissions of other greenhouse gases and particles butapply to global emissions of carbon dioxide only (Figure 1.3).
• If global emissions continue at the current rate, the total for a likely chance of staying below2°C will be exceeded in the mid-2030s, and for a medium chance by the late 2030s
__________________________________________________________________
18

Figure 1.3: Relationship between global temperature rise and cumulative carbon dioxide emissions
Source: IPCC AR5 Notes: Black line shows observations, coloured lines show results for the main IPCC future scenarios (RCPs). Grey shaded region is the relationship for CO2 only, not including the influence from other greenhouse gases and air pollutants.
The range in projected warming for any given emissions scenario reflects the difficulty in accounting precisely for all the processes and feedbacks in the climate system. Research is ongoing to narrow this range, but it remains wide:
• One metric of projected warming is the Transient Climate Response (TCR), which is the globaltemperature rise immediately after ramping up carbon dioxide concentration to doubleprevious levels.
• Based on a range of studies using different lines of evidence, IPCC AR5 concluded that theTCR is 66% likely to be in the range 1-2.5°C and 95% likely to be less than 3°C.
__________________________________________________________________
19

• Since IPCC AR5 there have been several more studies on TCR and the processes that control it.Some support the lower end of the IPCC range while others support the upper end15.
• In our Fourth Carbon Budget Review (2013) we noted that the probability of exceeding globaltemperature thresholds depends strongly on assumed TCR. Nevertheless, even under apathway of rapid emissions reductions and with the lowest distribution of TCR cited in IPCCAR5, the likelihood of crossing 2°C is over 10% (Table 1.1).
• Furthermore, there are feedbacks not currently in climate models but beginning to bequantified (such as further carbon release from thawing permafrost). For the medium TCRassumption in Table 1.1, we estimated in our 2013 Review that these feedbacks could add justunder 10% (with a range of -20% to 30%) to the likelihood of exceeding 2°C.
Table 1.1: Likelihood of exceeding global temperature thresholds for a rapid emissions reduction pathway, using different assumptions for Transient Climate Response (TCR)
Likelihood of exceedance in 2100 (global temperature above pre-industrial)
Transient Climate Response (TCR) assumption
Low (Otto et al., 2013)
Medium (Forster et al., 2013)
High (Stott & Forest, 2007)
2°C 11% 57% 81%
3°C 1% 14% 27%
4°C 0% 4% 7%
Source: CCC (2013) Fourth Carbon Budget Review – part 1: assessment of climate risk and the international response. Notes: Results are for global emissions peaking in 2020, 50% below 2007 levels in 2050 and 85% below in 2100. Low, medium and high assumptions are taken from the range of TCR studies cited in IPCC AR5.
The potential size and rate of global warming is very large compared to previous changes during human history:
• Some regional climate change has been experienced by human populations in the past (e.g.US megadroughts, monsoon changes) but the best available evidence suggests globaltemperature has not varied by more than several tenths of a degree during the course ofhuman civilisation (i.e. the last 6,000 years or so). It is partly this lack of historical precedentthat creates uncertainty in future impacts.
• In the deeper past we do know that Earth’s climate has been very different. For instanceduring the peak of the last “ice age” (around 20,000 years ago) global average temperaturewas in the region of 3-8°C below pre-industrial levels.
15 See for instance Lewis & Curry (2015) The implications for climate sensitivity of AR5 forcing and heat uptake estimates, Climate Dynamics; Qu et al (2014) On the spread of changes in marine low cloud cover in climate model simulations of the 21st century, Climate Dynamics.
__________________________________________________________________
20

• During this time there were kilometres-thick ice sheets over North America and NorthernEurope, large-scale weather patterns were substantially different to now, there was much lessrainfall, more dust and fewer rainforests.
These points suggest we should expect dramatic changes for 4°C or more warming this century.
4. Climate risksFuture climate change will have many implications around the world, increasing various risks to people and the environment while reducing some others. This section focusses on key climate risks at the global scale which can inform thinking about global ambition to reduce emissions.
Existing emissions targets stem from objectives to keep a substantial chance of staying below a 2°C rise in global temperature above pre-industrial levels:
• There is international agreement that global temperature should not rise more than 2°Cabove pre-industrial levels (see Chapter 2).
• In previous CCC advice on the 2050 target and carbon budgets (which predates internationalagreement on 2°C) we have proposed the world should seek to keep central (i.e. 50%)estimates of global temperature in 2100 close to 2°C above pre-industrial levels, and keep theprobability of a 4°C rise to very low levels (e.g. 1%).
There is no simple threshold beyond which climate change moves from safe to dangerous, but global aggregate damages will accelerate with warming. There may be benefits in some locations, although some disruption and irreversible losses are expected even at the low end of projected warming. Impacts will not be distributed evenly, with damages falling disproportionately on the poor and vulnerable in both developed and developing regions16. For instance:
• Crop yields will decline further in parts of Africa, Asia and Latin America, where many rely onsubsistence farming. Meanwhile the UK may see greater agricultural potential (barring otherconstraints, notably soil fertility and water17). Around the world, yields are expected todecrease and become more variable, impacting on food security18.
• Sea level rise will cause coastal flooding and saline intrusion into freshwater resources. Low-lying islands may face a long-term existential threat. Especially large risks to people andassets are found in major coastal cities such as Mumbai, Shanghai, New Orleans, New York,Amsterdam and London19.
• Extreme weather has major impacts on the elderly and vulnerable even in the developedworld, as heat waves in Paris20 and Chicago21 have shown. In tropical regions extreme heatevents may start to exceed the survival limits of fully-fit people. In temperate parts of theworld (including the UK) there will also be a reduction in the impacts from cold snaps.
16 IPCC WG2 AR5 Technical Summary 17 Defra (2012) UK Climate Change Risk Assessment: Government report 18 Challinor et al (2014) A meta-analysis of crop yield under climate change and adaptation, Nature Climate Change;
Rosenzweig et al. (2014) Assessing agricultural risks of climate change in the 21st century in a global gridded crop model intercomparison, Proceedings of the National Academy of Sciences
19 Nicholls et al. (2008) Ranking port cities with high exposure and vulnerability to climate extremes, OECD Environment Working Papers No. 1
20 Robine, et al. (2008) Death toll exceeded 70,000 in Europe during the summer of 2003, Comptes Rendus __________________________________________________________________
21
• In the Arctic, where snow and ice are retreating, access to new routes and resources will openup. At the same time this retreat puts local cultures and ecosystems in existential risk.
• Coral reefs (home to a quarter of all fish species and a key source of food, coastal protectionand income) will suffer widespread losses from ocean warming and acidification. Otherecosystems are at risk, including on mountains (where species must move to higher, smallerzones of habitability) and in the tropics (where species already live near their thermal limits).
There are deep uncertainties in quantifying future impacts because they depend not only on projections of future climate but also of future society (i.e. how many people there are, where they live, what they do, and the resources they have to cope and adapt). However, there is wide-ranging agreement climate change will have far-reaching and systemic consequences. Holding global temperature rise to 2°C does not eliminate climate risks but does reduce many of them substantially.
• IPCC AR5 concluded warming of 1.5°C above late 19th Century levels leads to high risk ofdamage from extreme weather and of losing sensitive ecosystems. Warming of around 2.5°Cbrings high risk of large-scale singularities (such as irreversible ice sheet melting leading tomore sea level rise) and severe global impacts on the economy and environment. Warming ofaround 4.5°C puts global food security in doubt.
• Both the US Department of Defense22 and the UK Ministry of Defence23 identify climatechange as presenting risks to their operations and to global security. They consider it to be a“threat multiplier” which can trigger or amplify existing social instabilities.
• The 2015 Lancet Commission on Health and Climate Change concluded it could be thebiggest global health threat of the century, primarily through indirect effects from water,food security and extreme weather. It also noted that measures to reduce emissions oftenprovide health co-benefits24.
• The World Bank focussed on possible impacts in a 4°C world, concluding they would be“devastating” and need to be avoided25.
In order to illustrate the scale of the risks we commissioned26 a consortium of scientists to estimate impacts at 2°C, 3°C and 4°C above pre-industrial levels by the end of the century, assuming a “middle of the road” socio-economic future (Box 1.2). They found the following:
• Relative to no change in climate, global wheat and maize yields could be 20-30% and 25-50%lower at 4°C, respectively, even assuming farmers adapt their planting times and cropvarieties. (Together with rice these crops provide 60% of world food energy intake27 andwithout climate change, yield projections to 2050 roughly match rising global demand28).
Biologies 21 Klinenberg (2003) Heat Wave: A Social Autopsy of Disaster in Chicago 22 Department of Defense (2014) Quadrennial Defense Review 23 MoD (2014) Global Strategic Trends out to 2045 24 Watts et al. (2015) Health and climate change: policy responses to protect public health, The Lancet 25 World Bank (2012) Turn Down the Heat: Why a 4°C warmer world must be avoided. 26 AVOID 2 (2015) The global impacts of climate change under pathways that reach 2, 3 and 4°C above pre-industrial
levels 27 http://www.fao.org/docrep/u8480e/u8480e07.htm 28 Alexandratos and Bruinsma (2012) World agriculture towards 2030/2050: the 2012 revision. ESA Working paper No.
12-0, FAO __________________________________________________________________
22
• Roughly 3-30 million additional people could suffer coastal flooding each year due to 4°Cwarming, even assuming defences continue to improve with rising population and wealth.Further protection can bring these numbers down to about 125,000 per year, at an annualaverage capital cost of around $10bn.
• Impacts from flooding of major rivers will also increase. 4°C warming could expose 80-350million more people per year, in addition to around 60 million more exposed due to growthand development. This assumes flood defences stay fixed over time; as with coastal flooding,further investment could help lower damages.
• The total number of people exposed to water stress will not change significantly with climatechange, but this masks large regional differences. Access to freshwater may rise in East Africa,India, northern Russia and Alaska. But at 4°C, 1-3.5 billion people may face enhanced waterstress in places such as South Europe, North Africa and the Middle East.
• Combined heat and humidity (captured by the Wet Bulb Globe Temperature, WBGT) limitspeoples’ ability to function. WBGTs above 32°C risk death even for healthy people at rest, butalmost never occur currently and would still be very rare for 2°C global warming. By 4°C,however, exposure in parts of South Asian and Africa would rise dramatically.
• At 4°C around 50-65% of plant and amphibian species, and around 25-40% of bird andmammal species, are expected to lose at least half of their suitable climatic range.
These estimates are incomplete. They are based on models which do not capture potentially important climate shifts (see Section 3); they do not consider the compound effects of impacts occurring together; and they only sample a subset of all potential impacts (not considered here for example are wider implications for health, supply chains, finance, and national security).
Box 1.2: Estimate of changes in global impacts with increasing global temperature
We commissioned the AVOID2 consortium to quantify future global impacts across a range of sectors. They used an existing set of impact models that have already been used in peer-reviewed literature. The models are applied here to a fixed scenario of population and wealth, but with 2, 3 and 4°C warming above pre-industrial levels in 2100. Impact ranges at each temperature level come from using different climate models as inputs, reflecting uncertainty in the future pattern of regional temperature and rainfall.
The estimates mainly represent exposure to impact, which may be reduced by adaptation. Some adaptations are included, however: coastal flooding data assumes flood defences evolve with population and wealth; crop productivity assumes crop varieties and time of planting are adjusted to optimise yields; plants and animals are assumed to disperse to new areas at historically-observed rates. Crop productivity numbers do not include expected gains from improved breeding and farming practices, while habitat loss numbers exclude direct (non-climatic) losses expected from human activity.
__________________________________________________________________
23

Box 1.2 (cont.): Estimate of changes in global impacts with increasing global temperature
Figure B1.2: Potential global impacts from climate change at the end of the century
Source: AVOID 2 (2015) The global impacts of climate change under pathways that reach 2, 3 and 4°C above pre-industrial levels Notes: Plots shows estimates as a function of global temperature in 2100 relative to pre-industrial levels. Bars denote median and whiskers the 10-90% range of outputs due to climate model differences in projected regional temperature and precipitation. For productivity and habitat loss whiskers denote the full range from a more limited set of climate models. Where shown, circles show impacts in a 1961-1990 climate, i.e. the impacts in 2100 from population and wealth growth.
0
1
2
3
4
2°C 3°C 4°C
Billi
on p
eopl
e
Exposure to increased water stress
-60
-40
-20
02°C 3°C 4°C
% c
hang
e
Spring wheat productivity
-60
-40
-20
02°C 3°C 4°C
% c
hang
e
Maize productivity
0
10
20
30
40
2°C 3°C 4°C
Billi
on p
eopl
e-da
ys/y
ear
Exposure to extreme heat stress
0
10
20
30
40
2°C 3°C 4°CMill
ion
peop
le/y
ear
Affected by coastal floods (assumes evolving protection)
0
100
200
300
400
2°C 3°C 4°C
Mill
ion
peop
le/y
ear
Exposure to river floods(assumes fixed protection)
020406080
100
2°C 3°C 4°C
% o
f spe
cies
Plants with >50% habitat loss
020406080
100
2°C 3°C 4°C
% o
f spe
cies
Mammals with >50% habitat loss
__________________________________________________________________
24

According to the assessment in Box 1.2, limiting warming to 2°C rather than 4°C this century leads to reductions in global total impacts across all indicators (Table 1.2).
Table 1.2: Differences in impact indicators at 2°C above pre-industrial global average surface temperature in 2100, relative to 4°C
Impact Reduction (2°C relative to 4°C)
People with increased exposure to water stress 280 (150-580) million
People-days exposure to extreme heat stress 12 (4-34) billion/yr
People exposed to major river floods (assuming fixed protection over time)
120 (25-195) million/yr
People affected by coastal flooding (assuming protection improves with population and wealth)
12 (3-27) million/yr
Spring wheat, maize crop productivity -8 (-12 to -7)%, -24 (-33 to -23)%
Plant, mammal species losing at least half of climatic habitat
34 (31-37)%, 21 (17-25)%
Source: AVOID 2 (2015) The global impacts of climate change under pathways that reach 2, 3 and 4°C above pre-industrial levels
These results show that adaptation (i.e. preparing for future impacts) is a necessary complement to mitigation (i.e. reducing emissions to limit future warming). This is true for the UK which, although unlikely to be worst affected by climate change, still faces risks:
• Looking across the risks to the UK, the CCC’s Adaptation Sub-Committee (ASC) has identifiedfour key areas where progress has been made but further steps are necessary: water scarcity;flooding; heat stress in the built environment; and impacts on natural assets and agriculture.
• In 2016 the ASC will publish its advice to the Government on the second national ClimateChange Risk Assessment. In the interim it is publishing updated projections of wateravailability, flooding, natural assets and extreme events29.
29 See CCC website for further details: www.theccc.org.uk/publications/ __________________________________________________________________
25

5. Implications for the fifth carbon budgetThe nature of climate change risks and the many unknowns make a simple cost-benefit approach to climate action untenable:
• In setting a level of ambition for climate policy, global climate risks from greenhouse gasemissions need to be weighed against the challenges and opportunities arising fromdecarbonising society.
• Quantitative projections of future climate impacts are subject to deep uncertainty and coveronly on a limited subset of all potential impacts.
• Aggregating impacts relies on subjective assumptions about the value of future impactsversus those in the present, of impacts on the rich versus the poor, and of non-monetaryimpacts such as those on human health and the natural world.
The internationally-agreed limit to warming, and the UK’s own emissions targets, are based on an approach which seeks to minimise the largest risks. On the basis of the latest climate science we judge that this level of ambition remains broadly appropriate for now:
• The CCC’s past advice has been based on an objective to keep central estimates of warmingby 2100 close to 2°C above pre-industrial levels, and also keep the chance of a 4°C rise to verylow levels (e.g. 1%).
• There is now international agreement on limiting global temperature to no more than 2°Cabove pre-industrial levels (see Chapter 2). Compared to the CCC objective this is less expliciton the acceptable likelihood of crossing 2°C, but is arguably more ambitious.
• Our recommendation was based on a broadly similar assessment of climate risk to the latestunderstanding.
• Given the link between peak temperature and cumulative carbon dioxide emissions, theultimate aim (beyond 2050) should be to get to zero net carbon dioxide emissions globally.
Remaining uncertainties mean we will keep a watching brief on climate science and periodically review implications for UK emission targets.
__________________________________________________________________
26

Introduction and key messages The Climate Change Act requires us to take account of international circumstances when developing our recommendations for carbon budgets. In considering appropriate UK action it is important to assess the feasibility of global emissions pathways consistent with meeting climate goals, and the developments in low-carbon technologies and measures compatible with that.
Our key messages are:
• The UK’s carbon budgets are domestic commitments, but set in the context of effortsworldwide to reduce greenhouse gas emissions.
• The UN has formally adopted an objective to limit global temperature rise to 2°C andcountries are submitting pledges (‘Intended Nationally Determined Contributions’ - INDCs) toreduce emissions post-2020. The aim is to adopt a new agreement, with legal status, in Parisat the end of 2015.
• Many countries and sub-national bodies have made commitments for deep emissionsreduction and are now delivering against these. Penetration of low-carbon technologies andmeasures around the world is increasing, although these still account for a relatively smallshare of global energy production:
– 75% of global emissions are covered by economy-wide reduction targets. There isincreased action at sub-national, city and business levels.
– In 2013, 18% of global emissions were covered by some form of carbon pricing schemeand 76% of global transport emissions were covered by legislated fuel efficiency standardsin 2015.
Chapter 2: International action to limit climate change
__________________________________________________________________
27

– Deployment of low-carbon technologies (notably renewables and low-carbon vehicles) isincreasing and more large-scale Carbon Capture and Storage (CCS) plants are indevelopment. High deployment rates have led to large cost reductions for sometechnologies (e.g. solar PV module prices fell 70% between 2009 and 2015), such that theyare cost-competitive with fossil fuel generation in many applications and parts of theworld.
• Lowest-cost paths with a likely chance of staying below 2°C require global emissions to peakaround 2020 with steep reductions thereafter (e.g. to 40-70% below 2010 levels in 2050). UNpledges made so far are not on this path. There is scope to reduce the gap through remainingpledges, increases in existing ambition and further commitments to reduce emissionsbeyond 2030.
• Both the UK and EU have objectives to reduce their greenhouse gas emissions in 2050 to atleast 80% below 1990 levels. These objectives remain appropriate in the light of the latestevidence regarding global emissions pathways consistent with 2°C.
We set out the analysis underpinning these conclusions in five sections:
1. International negotiations and national pledges
2. Global developments in policy and technology
3. Consistency of UN pledges with global emissions paths to 2°C
4. EU and UK 2050 objectives
5. Implications for the fifth carbon budget
1. International negotiations and national pledgesInternational negotiations on climate change are governed through the United Nations Framework Convention on Climate Change (UNFCCC), to which 195 countries plus the EU are party. Under this process countries have agreed to limit global temperature rise to 2°C above pre-industrial levels, and many countries have made emission pledges for 2020. At the Conference of Parties (COP) in Paris this year the aim is to reach a comprehensive and binding agreement going beyond 2020.
In this section we set out latest developments in the UN process and progress towards agreeing post-2020 pledges at the Paris conference.
The UN process and the agreed 2°C limit
In 1992 the UNFCCC set out the goal of “preventing dangerous anthropogenic interference with the climate system”. Countries have formally agreed this to mean limiting the increase in global temperature to below 2°C30 (Box 2.1), to work towards deep cuts in emissions and to assess progress towards meeting this objective:
30 A limit of 1.5°C above pre-industrial levels has also been proposed and has been the subject of a UNFCCC review. Further details at http://unfccc.int/science/workstreams/the_2013-2015_review/items/6998.php. __________________________________________________________________
28

• Under the 2009 Copenhagen Accord countries agreed to come forward with pledges to limitor reduce emissions covering the period to 2020. 86 countries plus the EU subsequentlymade pledges, including all major emitters and covering the bulk of global emissions.
• At the Durban negotiations in 2011 it was agreed to deliver a new and universal greenhousegas reduction agreement ‘with legal force’ by 2015, for the period beyond 2020. The aim isthat this new deal will govern post-2020 emissions pledges, financing and adaptation to theimpacts of climate change (Box 2.2).
A key element under discussion for the Paris negotiations is a forward-looking regime of commitment periods with a mechanism to enhance ambition over time.
Box 2.1: Interpreting the 2°C limit
The implication of the 2°C limit for global emissions depends on a judgment about acceptable risk:
• There is some uncertainty in the sensitivity of the climate to emissions. We cannot thereforebe sure a given emissions path will keep the world below a given global temperature.Instead paths have likelihoods of crossing different temperature thresholds (see Chapter 1).
• UNFCCC parties have not specified an acceptable likelihood for staying below 2°C.However, key analyses feeding into the international negotiations (such as those by theIntergovernmental Panel on Climate Change (IPCC) and United Nations EnvironmentProgramme (UNEP)) tend to provide estimates of emissions limits consistent with a ‘likely’(i.e. at least 66%) or ‘medium’ (i.e. 50-66%) chance of staying below 2°C this century.
• The IPCC’s Fifth Assessment Report (AR5) concluded that pathways likely to stay below 2°Cshow global greenhouse gas emissions in 2050 of 15-29 GtCO2e (see Section 3). G7 leadersrecently endorsed the lower end of this range and ‘decarbonisation of the global economyover the course of this century’ as policy goals31.
• CCC advice (predating the UNFCCC agreement on 2°C) assumed the world should seek tokeep central (i.e. 50%) probabilities of global temperature in 2100 close to 2°C above pre-industrial levels, and keep the probability of a 4°C rise to very low levels (e.g. 1%).
• Although this CCC goal appears to leave only a ‘medium’ chance of 2°C, the UK 2050 targetwas based on global emissions in 2050 (20-24 GtCO2e) in the middle of the IPCC range for‘likely’ pathways. The difference is due partly to assumptions around climate sensitivity andemissions before and after 2050.
31 Leaders’ Declaration, G7 Summit (2015) https://www.g7germany.de/Content/DE/_Anlagen/G8_G20/2015-06-08-g7-abschluss-eng.pdf
__________________________________________________________________
29
Box 2.2: Aims for Paris agreement
Key elements of a successful agreement at the Paris COP are likely to include the following:
• Ambitious national plans from 2020 onwards to limit global greenhouse gas (GHG)emissions to a level consistent with the 2°C climate objective. This may involve acceleratedaction pre-2020 such that cumulative emissions levels to 2°C are easier to meet.
• A strong legal basis with clear rules, underpinned by a governance framework with powersto review and strengthen ambition in regular time periods.
• Strong action plans and investment strategies to ensure the commitments are credible anddeliverable.
• It should build on and extend existing support for mitigation as well as climate resilienceand adaptation efforts.
Post-2020 pledges
Ahead of the Paris conference in December 2015, countries agreed to submit their post-2020 pledges to the UN. These are typically for 2025 or 2030.
By 2 October 146 countries had submitted their ‘Intended Nationally Determined Contribution’ (INDC) to the UNFCCC, covering 87% of global emissions. This includes all developed countries and 70% of developing countries, and includes the major emitters (e.g. China, the US, the EU and India) (Table 2.1):
• China has pledged to peak emissions by 2030, to reduce the carbon intensity of GDP by 60-65% below 2005 levels in 2030, increase the share of non-fossil fuels in primary energygeneration to around 20% by 2030 and to take significant action on afforestation.
• The US has pledged to reduce its emissions by 26-28% below 2005 levels by 2025.
• The EU has pledged to reduce its emissions by at least 40% below 1990 levels by 2030 (seeChapter 3).
• India pledged by 2030 to lower its emission intensity of GDP by 33-35% below 2005 levels, toincrease the share of non-fossil fuel based power generation capacity to 40% of capacity, andto create an additional cumulative carbon sink of 2.5-3 GtCO2e through forest and tree cover.
• Mexico plans to reduce GHG emissions by 22% below business as usual in 2030, increasing to36% conditional on a global agreement. This is on track towards its legislated 2050 target of a50% reduction below 2005 levels.
In addition to these pledges, international aviation and shipping emissions are regulated through their respective international agencies, the International Civil Aviation Organisation (ICAO) and the International Maritime Organisation (IMO). The ICAO and the IMO have made some progress developing and implementing emission reduction policies, but have not made official UN pledges (Box 2.3).
__________________________________________________________________
30

Table 2.1: Summary of INDCs from selected countries
Country Reference
year Metric Reduction by 2030
(see notes)
China 2005 Emissions intensity of GDP 60-65%
EU (28)* 1990 Emissions 40%
USA†* 2005 Emissions 26-28%
India 2005 Emissions intensity of GDP 33-35%
Brazil† 2005 Emissions 37%
Australia 2005 Emissions 26-28%
Canada 2005 Emissions 30%
Russian Federation 1990 Emissions 25-30%
Mexico 2030 Business as usual 25-40%
Japan 2013 Emissions 26%
New Zealand* 2005 Emissions 30%
Switzerland 1990 Emissions 50%
South Korea* 2030 Business as usual 37%
Norway 1990 Emissions 40%
Ethiopia 2030 Business as usual 64%
Source: Climate Action Tracker and UNFCCC. Notes: INDCs are for 2030 except for 2025 denoted with †, and include emissions from Land Use, Land Use Change and Forestry except where denoted with *.
__________________________________________________________________
31

Box 2.3: Progress reducing global international aviation and shipping emissions
International aviation and shipping (IAS) contribute 3% of current global CO2 emissions, and are projected to grow significantly unless further measures are taken32. These emissions are not accounted for in any single country’s national accounting. The Kyoto Protocol delegated responsibility to limit and reduce emissions from IAS sectors to their relevant UN regulatory bodies, the International Civil Aviation Organisation (ICAO) and the International Maritime Organisation (IMO). Progress towards reducing these emissions has so far been slow.
• Aviation. The ICAO is aiming to agree a global market-based measure in 2016, forimplementation from 2020. The EU has already taken steps to include intra-EU flights in theEU Emissions Trading System and the US Environment Protection Agency (EPA) hasrecently classified emissions from aviation as contributing to air pollution that causesclimate change. These developments could encourage the eventual implementation of aninternational agreement to curb emissions from aviation. In 2010 the ICAO also set a goal ofimproving fuel efficiency by 2% per year up to 2020, an aspirational goal to continue thisrate to 2050 and an aspirational goal to keep net carbon emissions flat from 202033.Progress on the first of these has been around half the target rate on a fuel/passenger kmbasis34. Additionally the aviation industry has pledged to reduce net emissions in 2050 to50% below 2005 levels35.
• Shipping. In 2011 the IMO agreed the Energy Efficiency Design Index (EEDI), a standardwhich aims to improve fuel efficiency of new ships by up to 30% by 2025. This wasintroduced in 2013. In 2015 the EU adopted regulations establishing a system formonitoring and reporting of emissions from ships using EU ports. This will apply from 1January 2018.
2. Global developments in policy and technologyAs well as progress towards a global agreement, it is important to monitor progress implementing low-carbon policies and measures in order to provide confidence that the path towards 2°C can be met. In this section we consider the key drivers of global emissions and set out global developments in low-carbon laws, policies and technologies.
We conclude that there is evidence of increased implementation of low-carbon laws and pledges. Global coverage of low-carbon measures such as carbon trading and vehicle standards is widening, as is deployment of low-carbon technologies, although these will need to ramp up rapidly to be on a pathway consistent with 2°C.
Key drivers of global emissions
Between 1990 and 2012 global greenhouse gas emissions grew by 42 % (Figure 2.1), made up
32 New Climate Economy (2015) Raising Ambition to Reduce International Aviation and Maritime Emissions 33 ICAO (2010) Resolutions adopted by the Assembly – 38th Session 34 The International Council on Clean Transportation (2015) Fuel efficiency trends for new commercial jet aircraft: 1960
to 2014 35 Air Transport Action Group (2012) A Sustainable Flightpath Towards Reducing Emissions __________________________________________________________________
32

largely of carbon dioxide from fossil fuel burning and industry. Population increased by 33% and GDP by 79% over the period meaning that, although emissions continued to increase, the amount of greenhouse gases produced per unit of GDP fell by around 20%.
• The largest contribution to the growth in emissions came from developing countries, inparticular China which is now the world’s largest emitting country.
• CO2 emissions from fossil fuels and industry grew 55% during 1990-2012. In 2012 theyconstituted 70% of all long-lived greenhouse gas emissions.
• Around 60% of the growth in global energy-related CO2 emissions since 2000 has come fromincreased use of coal, which by 2012 was responsible for 43% of global CO2 emissions fromfossil fuel combustion36.
• In 2014 global CO2 emissions are estimated to have been the same as in 2013. As global GDProse by around 2.5% this is the first time emissions have not increased in a period ofeconomic growth.
The future path for global emissions will be determined by a number of factors, including demographic trends, the structure and rate of economic growth and the mix of high- and low-carbon technologies in use. The global energy system is largely fossil-fuel based and in the absence of further policies and measures, global emissions are projected to continue growing
36 CCC calculations based on BP (2015) Statistical Review of World Energy.
Figure 2.1: Global CO2 emissions (1990-2012)
Source: World Resources Institute CAIT database. Notes: Includes Land Use, Land Use Change and Forestry (LULUCF) emissions.
0
5
10
15
20
25
30
35
40
45
50
1990
1991
1992
1993
1994
1995
1996
1997
1998
1999
2000
2001
2002
2003
2004
2005
2006
2007
2008
2009
2010
2011
2012
GtC
O2/
yr
Rest of World
Africa
Non-China Asia
EU 28
United States
China
__________________________________________________________________
33

(Box 2.4). For example, the International Energy Agency (IEA)37 estimates that with no change in current or planned policy, global CO2 emissions from fossil-fuel burning and industry will rise by 20% above today’s level by 2040, leading to a long-term rise in global average temperature of around 3.5°C.
The transition will require a strong legislative framework across countries and sectors and an acceleration of investment in low-carbon technologies. We now turn to consider latest developments in these areas.
Box 2.4: Outlook for incumbent technologies
In the absence of new policies global primary energy use is expected to grow with a continued reliance on fossil fuels.
The IEA’s ‘New Policies’ scenario forecasts energy demand and emissions to 2040 based on policies in place, planned or announced by mid-2014. Under this scenario, primary energy demand is projected to grow 37% between 2012 and 2040.
The scenario considers the global outlook for the electricity, transport and industry and building sectors:
• Electricity. The majority of electricity is expected to be generated from coal and naturalgas in 2040. However, the overall share of total fossil fuels decreases from 68% in 2012 to55% in 2040; most of this decrease in share is absorbed by renewables which comprise 35%of the total investment in the power sector out to 2040.
• Transport. The transport sector is heavily reliant on fossil fuels, with around 95% of roadtransport energy from oil in 2012. Under the New Policies scenario this reliance is expectedto continue, with alternative road fuels taking only a minor share. The number of vehicles inthe global fleet is forecast to double to 2040, mostly from non-OECD countries, but due tothe uptake of fuel efficiency standards energy consumption is projected to increase only40%.
• Industry & Buildings. Energy demand in industry is expected to increase an average 1.4%per year and in buildings an average of 1% per year to 2040. Most of the growth in bothsectors is expected from non-OECD countries – for example, nearly 50% of industrial energygrowth is expected from China and India.
Overall, the implication is that global emissions are projected to grow 20% to 2040, consistent with a long-term global average temperature increase of 3.6°C.
Source: IEA (2014) World Energy Outlook 2014
37 IEA (2014) World Energy Outlook __________________________________________________________________
34
Global coverage of low-carbon laws and pledges
Alongside the UN process of agreeing global emission reductions, country-level laws and targets will be required in order to deliver national pledges. Commitments to reduce emissions are being developed and put in place at national, sub-national and city and business levels:
• National climate change laws and policies. Climate change legislation is becoming moreprevalent. Over 75% of global emissions are covered by some form of economy-widereduction target, across 98 countries plus the EU38. Of these, 75 countries plus the EU haveframework laws (statute or regulation equivalent), providing greater credibility for thedevelopment of policy to support low-carbon technology and markets. Some countries,including Mexico, France, Denmark and Finland have also passed Climate Change Acts inrecent years that legislate emissions reduction targets, including reductions in emissions by2050 of up to 80%.
• Sub-national pledges and policies. Action at the sub-national level can be significant giventhe size of some regional economies. Action is most prevalent in some US states andCanadian provinces, including joint initiatives on carbon pricing and zero-emission vehicles.
– In the US, 12 states have legislated emissions targets and five have 2050 targets. Forexample, California − the largest US state by GDP − has pledged to reduce emissions by40% below 1990 levels in 2030 and 80% by 2050. California’s cap-and-trade scheme nowcovers 85% of state emissions and was linked to Quebec’s scheme in 2014.
– In Canada, four provinces have emission reduction targets for 2020: British Columbia,Vancouver, Ontario and Quebec. Ontario also has a target to reduce emissions by 37% on1990 levels by 2030.
– Cross-state initiatives to reduce emissions include the Regional Greenhouse Gas Initiative(a cap-and-trade system covering power sector emissions in nine Eastern US states) andthe Western Climate Change Initiative (a market-based system between seven US statescovering around 20% of US GDP, and four Canadian provinces covering 76% of CanadianGDP).
– In the US, eight states have agreed a joint target for at least 3.3 million zero-emissionvehicles on the road by 2025 and have developed an action plan to deliver this.
• Other pledges. Cities and businesses can have a significant impact on emissions; the top1,000 GHG emitting companies produce one-fifth of global emissions39. Other pledges andcollaborative measures have grown in recent years.
– The Covenant of Mayors, covering around 6,300 cities, was set up to support thedeployment of sustainable energy policies by local authorities.
– As part of the Science Based Targets initiative, a range of leading companies have pledgedambitious science-based emissions targets. For example, Coca Cola Enterprises aims toreduce its emissions from operations by 50% below 2007 levels by 2020.
– UNEP estimate the reduction from non-national pledges to be approximately 2.9 GtCO2e(5% of global emissions) in 2020. This includes regions, cities, companies and sectors andexcludes overlapping emission reductions from national pledges40.
38 Nachmany, M. et al (2015) The 2015 Global Climate Legislation Study 39 UNEP (2015) Climate commitments of sub-national actors and business 40 UNEP (2015) Climate commitments of sub-national actors and business __________________________________________________________________
35

Climate legislation and pledges can be effective at providing a framework for long-term objectives and stability to investors. Development of low-carbon policies and regulation is then necessary to deliver these targets.
Action in individual countries and sectors
The range of emissions reduction pledges now in place has led to increased global coverage of low-carbon policy measures including carbon pricing and vehicle standards. There has also been some limited reform of fossil fuel subsidies. China and the US, the world’s highest carbon-emitting countries, are implementing measures to deliver their emission reduction goals (Box 2.5).
• Carbon pricing. In 2013 18% of global emissions41 were covered by carbon pricing in theform of emission trading systems or carbon taxes (Figure 2.2). However, there is a widedisparity in carbon prices. The major emission trading systems (e.g. the EU ETS, pilot systemsin China, the North American linked markets and the newly introduced South Korean ETS)trade at carbon prices up to around €10/tCO2, whilst there are a range of carbon taxes acrossEurope at varying levels (e.g. €14.50/tCO2 in France rising to €56/tCO2 in 2020 and €100/tCO2
in 2030; €55/tCO2 in Switzerland42).
• Vehicle emission/fuel efficiency standards. In 2015, 76% of global transport emissionswere covered by legislated fuel efficiency standards (Figure 2.3). These standards are set tobecome increasingly stringent over time (Figure 2.4) and will require increasing use of ultra-low emission vehicles.
• Fossil fuel subsidy reform. In 2014, 13% of CO2 emissions were linked to fossil-fuelconsumption subsidies, at an implicit subsidy of $115/tCO2
43. This represents around four-times the value of subsidies to global renewable energy. Subsidies encourage inefficientallocation of resources, increase emissions due to inefficient energy use and increasegovernment spending. The major oil and gas exporting countries in the Middle East andNorth Africa account for around half of global fossil fuel spending. Some countries, includingIndia, Indonesia, and Malaysia have abolished subsidies on some fuels and are reformingothers, helped by lower oil prices, whilst others including Iran, Kuwait and Venezuela areconsidering them.
41 Non-surface transport combustion emissions 42 World Bank (2015) State and Trends of Carbon Pricing 43 IEA (2015) Energy and Climate Change, World Energy Outlook Special Report __________________________________________________________________
36
Box 2.5: Action in China and the US
China is the world’s highest emitter of CO2 and the second largest economy. In 2012 it was responsible for 28% (9.3 GtCO2) of global CO2 emissions, and in 2014 accounted for 9% of global GDP and 19% of the world’s population.
In the Copenhagen Accord, China pledged to reduce its carbon intensity by 40-45% by 2020 and set out a five-year plan to achieve this. Other key actions in China include:
• Renewables: Renewable generation capacity in China nearly tripled between 2005 and 2013, and represented 30% of capacity (380 GW) in 2015. It aims to install at least 700 GW of renewable capacity by 2020 and has targets for specific technologies to achieve this.
• Coal: In 2012 coal supplied 66% of total energy consumption. There is a target to reducethis to 62% by 2020. In March 2015 the government set out an action plan which limits coalconsumption on a decreasing scale to 2020.
• Carbon pricing: Carbon trading in China has been in development since 2008. Sevenmandatory schemes for emission trading have been introduced, ahead of a nationalscheme expected to be launched in 2018. The pilot schemes have a coverage of around 1GtCO2e, which is twice that of total UK emissions.
• Transport: China has a target for fuel efficiency of new passenger cars of 117gCO2/km by2020 (an improvement of around 4.2% per annum), and for five million electric vehicles onthe road by 2020. It is also only one of four countries worldwide to have a target to improvethe carbon intensity of heavy duty vehicles and buses, by 11% between 2011 and 2015.
The US is the world’s highest per capita emitter of CO2 emissions and the largest economy. In 2012 the US was responsible for 15% (5.1 GtCO2) of global CO2 emissions, and in 2014 accounted for 25% of global GDP and 4% of world population.
• Recent climate policy developments: In 2015 the US EPA announced plans for a numberof key climate regulations. These included publication of the Clean Power Plan outliningmeasures to reduce emissions from power plants by 30% below 2005 levels by 2030, and achange to the legal classification of emissions from planes to bring them in scope ofclimate regulation.
• Transport: The US has a fuel efficiency standard for new cars of 93 gCO2/km for 2025(requiring a 6.8% annual improvement). In 2014 it also introduced fuel efficiency standardscovering HGVs, which are expected to save 76 MtCO2 per year by 2030.
• Energy consumption: New energy efficiency standards have been set for household andindustry products (e.g. the phasing out of incandescent light bulbs), which are cumulativelyexpected to save at least 3 GtCO2 by 2030
Source: IRENA (2014) Renewable Energy Prospects in China; ICCT (2014) The State of Clean Transport Policy
__________________________________________________________________
37

Figure 2.2: Proportion of global emissions covered by a carbon price (2013)
Source: CCC calculations based on World Bank (2014) and various national sources Notes: Proportion of global emissions excludes surface transport emissions. Excludes expansion of scope of Californian ETS in 2015; proportion covered would be higher taking this into account.
Figure 2.3: Proportion of global surface transport emissions covered by emission/fuel efficiency standards (2015)
Source: CCC calculation based on www.transportpolicy.net and IEA emissions data.
Not Covered82%
Covered18%
Not Covered
South Korea
Mexico
USA
South Africa
Japan
China
EU-28
Other
Not covered24%
Covered76%
Not covered
Brazil
Japan
India
China
EU-28
USA
Other
__________________________________________________________________
38
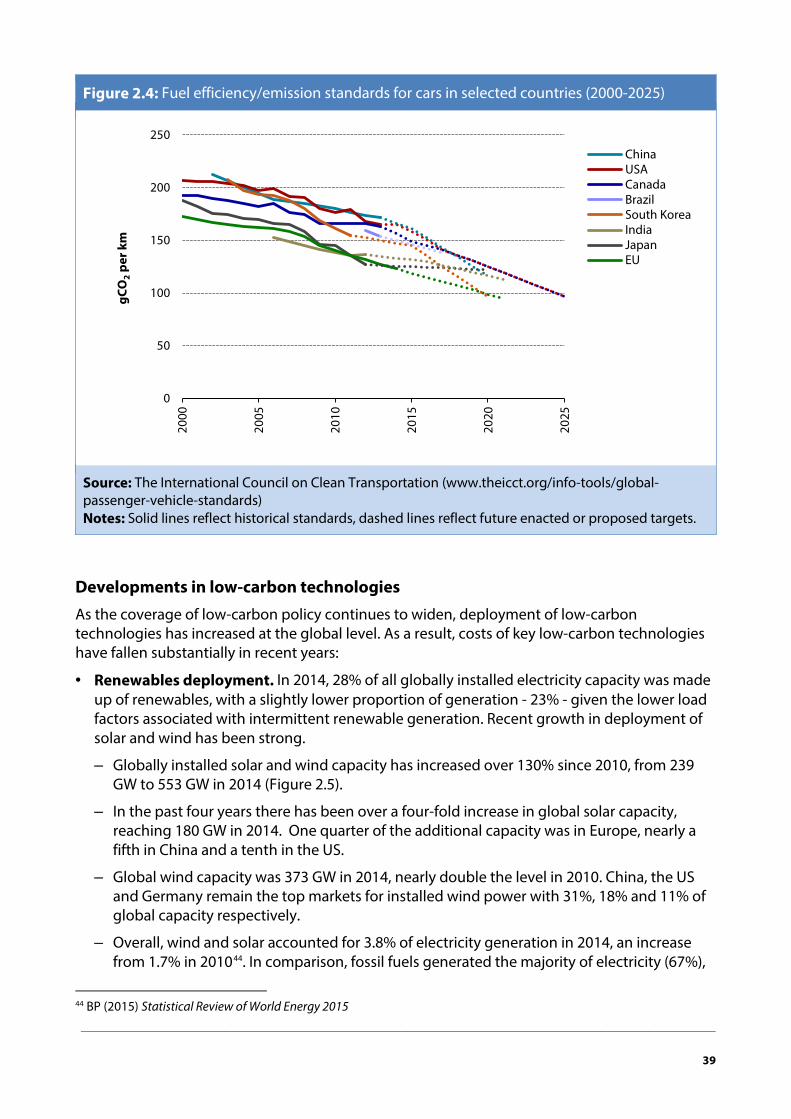
Figure 2.4: Fuel efficiency/emission standards for cars in selected countries (2000-2025)
Source: The International Council on Clean Transportation (www.theicct.org/info-tools/global-passenger-vehicle-standards) Notes: Solid lines reflect historical standards, dashed lines reflect future enacted or proposed targets.
Developments in low-carbon technologies
As the coverage of low-carbon policy continues to widen, deployment of low-carbon technologies has increased at the global level. As a result, costs of key low-carbon technologies have fallen substantially in recent years:
• Renewables deployment. In 2014, 28% of all globally installed electricity capacity was madeup of renewables, with a slightly lower proportion of generation - 23% - given the lower loadfactors associated with intermittent renewable generation. Recent growth in deployment ofsolar and wind has been strong.
– Globally installed solar and wind capacity has increased over 130% since 2010, from 239GW to 553 GW in 2014 (Figure 2.5).
– In the past four years there has been over a four-fold increase in global solar capacity,reaching 180 GW in 2014. One quarter of the additional capacity was in Europe, nearly afifth in China and a tenth in the US.
– Global wind capacity was 373 GW in 2014, nearly double the level in 2010. China, the USand Germany remain the top markets for installed wind power with 31%, 18% and 11% ofglobal capacity respectively.
– Overall, wind and solar accounted for 3.8% of electricity generation in 2014, an increasefrom 1.7% in 201044. In comparison, fossil fuels generated the majority of electricity (67%),
44 BP (2015) Statistical Review of World Energy 2015
0
50
100
150
200
250
2000
2005
2010
2015
2020
2025
gCO
2pe
r km
ChinaUSACanadaBrazilSouth KoreaIndiaJapanEU
__________________________________________________________________
39

with the remaining 29% supplied by nuclear and other renewables, mainly hydropower.
– IEA analysis45 suggests that the annual installation rate of wind and solar capacity will needto almost double by 2020, from nearly 80 GW per year between 2010 and 2014 to 145 GWper year to 2050, in order to be on a 2°C consistent path.
Figure 2.5: Installed global wind and solar capacity (2000-2014)
Source: BP (2015) Statistical Review of World Energy 2015
• Electric vehicles. Global sales of electric vehicles (battery electric and plug-in hybrid) reached300,000 in 2014, an increase of 53% over 2013. This is only 0.4% of global car sales, butreflects a very early market. Norway had the highest share of electric vehicles in new car sales,at 12.5% (compared with 0.6% in the UK).
• Carbon Capture and Storage (CCS). There are 14 large-scale CCS projects in operation andeight under construction, with a total capture capacity of 40 MtCO2 per year. The first large-scale power sector project, at Boundary Dam in Canada, became operational in 2014. Afurther eight large-scale power CCS projects, mainly in North America, are expected to beoperational by 2020. However, there have been problems in some projects, and questionsremain whether the flow of projects is sufficient.
• Technology costs. Costs of key low-carbon technologies, including renewables and batteries,have fallen substantially in recent years (Figures 2.6 and 2.7). As a result, costs of electricityfrom onshore wind and solar PV are in the range of fossil fuel-power generation costs in manyplaces.
45 IEA (2015) Energy Technology Perspectives 2015
0
100
200
300
400
500
600
2000
2001
2002
2003
2004
2005
2006
2007
2008
2009
2010
2011
2012
2013
2014
GW Solar
Wind
__________________________________________________________________
40

– Between 2009 and 2014, solar PV module prices are estimated to have fallen by around70%. As a result, the generation cost of utility-scale solar PV is now competitive with fossilgeneration in some regions (e.g. Dubai and Chile).
– Costs of onshore wind continue to fall, though more slowly than for solar PV. Manyprojects are cost-competitive with fossil fuel generation, with the best projects generatingat $50/MWh compared with global fossil-based generation costs of $40-120/MWh in2014.46
– A comprehensive study of battery costs estimated costs of lithium-ion batteries to havefallen by 14% per year between 2007 and 201447. Since battery costs make up the bulk ofthe cost difference between electric and conventional vehicles, these reductions bringelectric vehicles closer to the cost-competitive level. However, reductions are dependenton increasing demand for electric vehicles, which will require continued governmentsupport.
In the next section we consider whether countries’ pledges on emissions reduction are consistent with global emission pathways to achieve 2°C.
Figure 2.6: Developments in solar PV module prices
Source: www.pvxchange.com
46 International Renewable Energy Agency (2015) Renewable Power Generation Costs in 2014 47 Nykvist, B. & Nilsson, M (2015) Rapidly falling costs of battery packs for electric vehicles, Nature Climate Change 5, 329-332
0.0
0.5
1.0
1.5
2.0
2.5
2009
2010
2011
2012
2013
2014
€pe
r pea
k w
atta
ge
Japan, Korea
Germany
China
South-East Asia, Taiwan
__________________________________________________________________
41

Figure 2.7: Costs of battery packs in Battery Electric Vehicles
Source: Nykvist, B. & Nilsson, M. (2015) Rapidly falling costs of battery packs for electric vehicles, Nature Climate Change Notes: Reflects costs of Lithium-ion batteries.
3. Consistency of UN pledges with global emissions paths to 2°CThe aim of this section is to assess whether current actions and pledges are consistent with global emissions pathways to 2°C. We start by looking at emission pathways on track to meet this objective and go on to compare these with global emissions implied by countries’ emissions reduction pledges.
Our conclusion is that current pledges are not on a cost-effective path to 2°C, but that this gap can be reduced through remaining pledges, by increasing ambition in pledges and through further commitments to reduce emissions beyond 2030.
Cost-effective global emissions paths to 2°C
Lowest-cost pathways with a substantial likelihood of staying below 2°C require peaking around 2020 and then entail steep reductions towards net zero or even negative emissions by the end of the century (Figure 2.8).
• The IPCC’s Fifth Assessment Report concluded that pathways that are likely (i.e. with at a leasta 66% chance) to stay below 2°C show a 40-70% reduction in global greenhouse gasemissions by 2050, relative to the 2010 level of 49 GtCO2e, and have emissions near zero orbelow by 2100.
0
250
500
750
1000
1250
1500
1750
2000
2005
2010
2015
2020
2025
2030
2014
US$
per
kW
h
95% confidence interval: wholeindustry95% confidence interval: marketleadersPublications, reports andjournalsNews items with expertstatementsLog fit of news, reports andjournalsAdditional cost estimateswithout clear methodMarket leader, Nissan Motors,LeafMarket leader, Tesla Motors,Model SOther battery electric vehicles
Log fit of market leaders only
Log fit of all estimates
Future costs estimated inpublications<$150 per kWh goal forcommercialization
__________________________________________________________________
42

• These conclusions are derived from runs of several different models which simulate globalenergy and emissions using different methods and levels of detail (Box 2.6).
• Studies by the IEA48 and the recent Deep Decarbonization Pathways Project49 confirm suchpathways remain technically feasible without changing global economic and developmentprospects.
• In the IEA’s ‘2 degree’ scenario, consumption of coal peaks before 2020 and falls 42%between 2012 and 2035. The share of power generation coming from unabated coal fallsfrom 40% in 2012 to 0.5% in 2050, while the share for unabated gas falls from 22% to 7% andlow-carbon increases from 32% to 93% of electricity generation over the same period.
Figure 2.8: Global emission pathways consistent with 2°C
Source: IPCC AR5 WG3 database Notes: Chart shows global emission pathways consistent with a ‘likely’ (i.e. at least 66%) and ‘medium’ (i.e. 50-66%) chance of staying below 2°C in 2100. 10 model scenarios are available in the IPCC database for a likely chance and four for a medium chance. Shaded areas give the range within which 60% of the model scenarios lie, while central lines give the median emissions.
48 IEA (2015) Energy and climate change: World Energy Outlook Special Report 49 Deep Decarbonization Pathways Project (2015) Pathways to deep decarbonization 2015 report
-10
0
10
20
30
40
50
60
2000
2020
2040
2060
2080
2100
GtC
O2e
/yr Medium: 20-80% range
Likely: 20-80% range
Medium: central
Likely: central
__________________________________________________________________
43

Box 2.6: Integrated Assessment Models and scenarios of future global emissions
Quantitative estimates of future global emissions consistent with different levels of warming come from Integrated Assessment Models (IAMs). The IPCC’s most recent assessment (and the most recent UNEP Gap Report) used 1,184 scenarios produced by 31 IAMs. Each IAM simulates (at a minimum) the global energy system, but they have important differences in scope, detail and numerical methods:
• Models differ dramatically in the level of detail they contain. Some attempt to include allsectors of the economy and even have a simple representation of how emissions translateinto climate change. Some have much more disaggregation of different technologyoptions and regions of the world than others.
• Some assume perfect foresight (i.e. they optimise at each point in time as if they knowfuture demand, targets, options and costs precisely). Others are myopic and optimise basedonly on information at that point in time in the simulation.
• They take very different economic approaches: for example, trade may be assumed tooperate perfectly with a single global price for energy commodities and carbon permits. Inother models trade is not modelled explicitly or is more limited.
• Individual simulations are driven by different parameters or restrictions on the future. Forinstance, some are driven by a single global carbon price or emissions target, others by amore fragmented development of climate action. Some apply limits on certain options toreduce emissions (such as nuclear power or bioenergy).
All IAM scenarios are simplifications, and these differences mean they are not all equally likely visions of the future. They help to give insights into costs and technology deployment under specific assumptions, but they have an approach to socio-economic behaviour and innovation that is highly simplified. There is always scope for unpredicted economic shocks, new technologies, and changes in behaviour to affect the future. Care should be taken therefore in judging the feasibility of different futures on the basis of these model results.
Delayed action such that global emissions peak after 2020 will raise the costs of achieving climate goals and introduce heavier dependence on technologies which are currently unproven at scale. Ultimately, continued delay will lead to likely warming above 2°C:
• Peak temperature depends largely on cumulative emissions over time (see Chapter 1). Thismeans paths with delayed peaking require more rapid reductions post-peak and have astronger emphasis on negative emissions in the second half of the century to maintain thesame level of warming.
• Deeper and more rapid post-peak reductions lead to higher costs.
– According to IPCC AR5, delaying action until 2030, even with only moderate emissionsgrowth, leads to a 14-50% increase in costs relative to immediate action.
– IEA analysis50 also considered a delay scenario where global emissions rise in line withcurrent policies to 2020, but need to be cut more sharply thereafter to get back on a
50 IEA (2013) Redrawing the Energy-Climate Map __________________________________________________________________
44
trajectory compatible with the 2°C scenario. In this scenario investment costs of $1.5 trillion are avoided in the period to 2020, but an additional $5 trillion of investments are required between 2020 and 2035, through the early scrappage of assets and foregoing early learning and development opportunities.
• Many 2°C scenarios already assume large-scale use of bioenergy with Carbon Capture andStorage to provide negative emissions. There are questions about availability of sustainablebioenergy resource to levels assumed. Other negative emission technologies could play a rolebut are currently speculative (Box 2.7).
• If global emissions are allowed to grow to 55 GtCO2e or more in 2030, many energy systemmodels are unable to find a low enough path for emissions to keep a 50% chance of 2°C, evenwith optimistic assumptions about technology deployment and global co-operation.
Box 2.7: The role of negative emissions
There are several ways to remove CO2 from the atmosphere - negative emission technologies - including afforestation and other land-use measures (AFOLU), bioenergy with carbon capture and storage (Bio CCS or BECCS), and direct air capture. These are at different stages of development, but most models of future emissions currently include AFOLU and BECCS as potentially cost-effective options.
For pathways that keep a high chance of 2°C, many models choose to deploy BECCS within the next couple of decades. By the latter half of the century AFOLU and BECCS play an extensive role such that net global CO2 emissions become zero or negative.
To the extent both CCS and sustainable bioenergy are both available, combining them is a sensible way to maximise emissions reduction. There are however issues with BECCS, and negative emissions technologies more widely, that are not captured well in models:
• BECCS and other industrial negative emissions technologies are untested at scale. Theirfuture costs and public acceptability are uncertain. The example of CCS has so far shownthat development may not occur as fast as initially expected.
• Very high use of bioenergy brings with it risks over environmental sustainability. Bioenergygrown on agricultural land involves trade-offs with food security, and not all bioenergycrops produce carbon savings relative to fossil fuels. There can also be trade-offs (orbenefits) to water availability and biodiversity.
Estimates of the global sustainable bioenergy resource vary greatly, but we concluded in our 2011 Bioenergy Review that a sensible planning assumption was up to around 110 Exajoules by 205051. Many model scenarios for 2°C considered by the IPCC exceed this limit (Figure B2.7).
51 CCC (2011) Bioenergy Review __________________________________________________________________
45
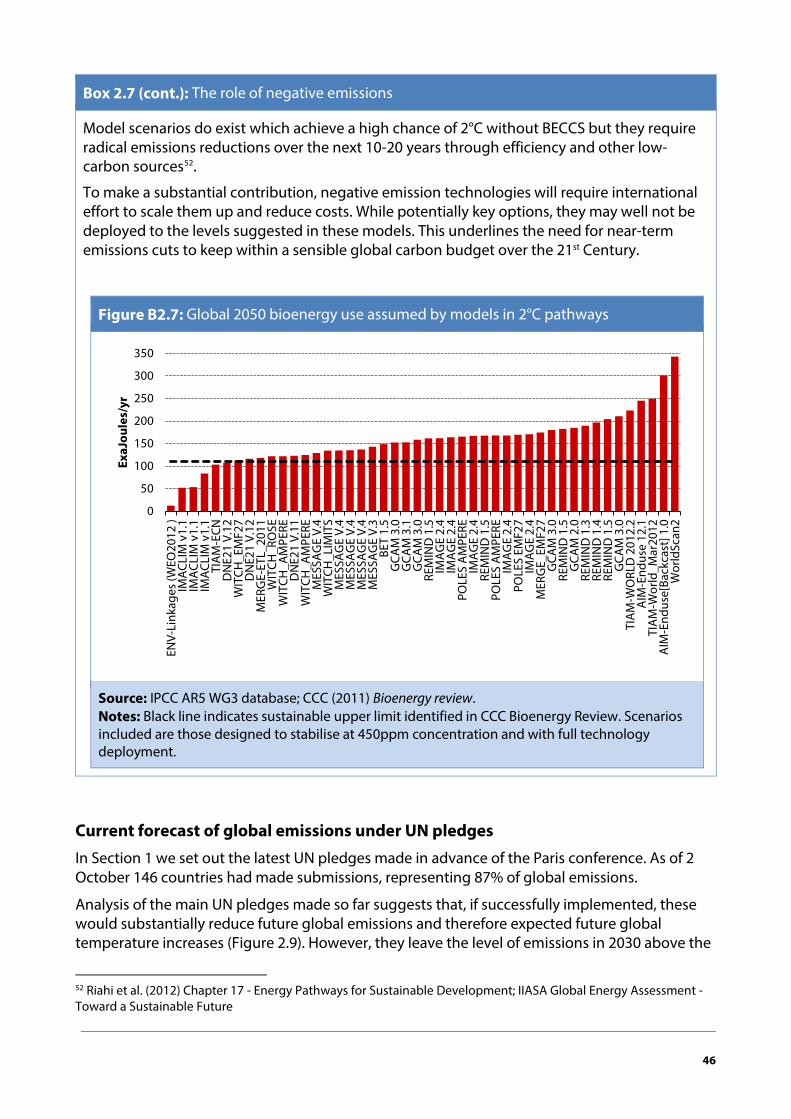
Box 2.7 (cont.): The role of negative emissions
Model scenarios do exist which achieve a high chance of 2°C without BECCS but they require radical emissions reductions over the next 10-20 years through efficiency and other low-carbon sources52.
To make a substantial contribution, negative emission technologies will require international effort to scale them up and reduce costs. While potentially key options, they may well not be deployed to the levels suggested in these models. This underlines the need for near-term emissions cuts to keep within a sensible global carbon budget over the 21st Century.
Figure B2.7: Global 2050 bioenergy use assumed by models in 2°C pathways
Source: IPCC AR5 WG3 database; CCC (2011) Bioenergy review. Notes: Black line indicates sustainable upper limit identified in CCC Bioenergy Review. Scenarios included are those designed to stabilise at 450ppm concentration and with full technology deployment.
Current forecast of global emissions under UN pledges
In Section 1 we set out the latest UN pledges made in advance of the Paris conference. As of 2 October 146 countries had made submissions, representing 87% of global emissions.
Analysis of the main UN pledges made so far suggests that, if successfully implemented, these would substantially reduce future global emissions and therefore expected future global temperature increases (Figure 2.9). However, they leave the level of emissions in 2030 above the
52 Riahi et al. (2012) Chapter 17 - Energy Pathways for Sustainable Development; IIASA Global Energy Assessment - Toward a Sustainable Future
0
50
100
150
200
250
300
350
ENV-
Link
ages
(WEO
2012
)IM
ACL
IM v
1.1
IMA
CLIM
v1.
1IM
ACL
IM v
1.1
TIA
M-E
CND
NE2
1 V.
12W
ITCH
_EM
F27
DN
E21
V.12
MER
GE-
ETL_
2011
WIT
CH_R
OSE
WIT
CH_A
MPE
RED
NE2
1 V.
11W
ITCH
_AM
PERE
MES
SAG
E V.
4W
ITCH
_LIM
ITS
MES
SAG
E V.
4M
ESSA
GE
V.4
MES
SAG
E V.
4M
ESSA
GE
V.3
BET
1.5
GCA
M 3
.0G
CAM
3.1
GCA
M 3
.0RE
MIN
D 1
.5IM
AG
E 2.
4IM
AG
E 2.
4PO
LES
AM
PERE
IMA
GE
2.4
REM
IND
1.5
POLE
S A
MPE
REIM
AG
E 2.
4PO
LES
EMF2
7IM
AG
E 2.
4M
ERG
E_EM
F27
GCA
M 3
.0RE
MIN
D 1
.5G
CAM
2.0
REM
IND
1.3
REM
IND
1.4
REM
IND
1.5
GCA
M 3
.0TI
AM
-WO
RLD
201
2.2
AIM
-End
use
12.1
TIA
M-W
orld
_Mar
2012
AIM
-End
use[
Back
cast
] 1.0
Wor
ldSc
an2
ExaJ
oule
s/yr
__________________________________________________________________
46

level consistent with a cost-effective 2°C pathway.
• Median estimates of business-as-usual global emissions in 2030 are 68 GtCO2e.
• Analysis53 of the INDCs suggests that global emissions are on track to reach 53-55 GtCO2e in2030.
• Pledges would therefore deliver substantial emission reductions and could lower expectedwarming in 2100 from around 4°C to around 2.7°C, with the potential to reach 2.5°C undermore stringent conditions54.
• Current pledges are not on a lowest-cost track to 2°C. Lowest-cost pathways from 2020 thatgive at least a 50% likelihood require global emissions of 42-47 GtCO2e or less by 2030. Thisimplies a gap of 6-13 GtCO2e compared with the INDCs in this analysis.
Figure 2.9: Effect of the UN pledges on long-term global emissions pathways
Source: Climate Action Tracker (2015) INDCs lower projected warming to 2.7°C: significant progress but still above 2°C
53 Climate Action Tracker (2015) INDCs lower projected warming to 2.7°C: significant progress but still above 2°C. This analysis covers 19 INDCs, covering 71% of global emissions and an estimate for India to bring this to 77%. 54 The 2.7°C estimate is based unconditional or lower-end pledges being delivered, and the 2.5°C estimate is based on conditional or upper-end pledges being met.
-50
0
50
100
150
200
1990
2000
2010
2020
2030
2040
2050
2060
2070
2080
2090
2100
GtC
O₂e
/yr
Baseline (4.1-4.8°C)
Current policy projections (3.3-3.8°C)Pledges (2.5-2.7°C)
Below 2°C (1.5-1.7°C)
Below 1.5°C (1.3-1.5°C)
Historical emissions
__________________________________________________________________
47

The gap between pledges and cost-effective 2°C pathways can be reduced through remainingpledges, by increasing ambition in existing commitments, and further commitments to reduce emissions beyond 2030: • INDCs are yet to come from around 50 countries, and 23% of global emissions are not
covered in the above analysis. This includes contributions from the international aviation andshipping sectors, which together represent 3% of global emissions but are expected to growrapidly in coming decades.
• Analysis by Climate Action Tracker (CAT) suggests that the ambition of INDCs vary, with somecountries not being in line with a ‘fair’ contribution to limit warming to 2°C; others have putforward INDCs inconsistent with their national 2050 targets.
• Many INDCs are backed up with some form of climate legislation or executive policies withdetailed plans of how these will be delivered. This provides credibility that their INDC targetwill be met and an opportunity to strengthen existing commitments.
• Many countries now have longer term emission reduction targets. For some, current pledgesare incompatible with these, and all countries will need to raise post-2030 ambition in orderto meet these.
Reducing the gap is challenging and will require effort to increase ambition across nations and sectors. A key way to achieve this will be creation of a review mechanism at the Paris conference to increase ambition to 2030 and beyond.
4. EU and UK 2050 objectivesBoth the EU and UK have longer-term targets to reduce their greenhouse gas emissions in 2050 to at least 80% below 1990 levels. These objectives remain appropriate in the light of the latest evidence regarding global emissions pathways consistent with 2°C.
• When advising on the UK 2050 target in 2008, we stated it was difficult to envisage a globalclimate deal which does not involve the UK reducing its emissions to a per person levelconsistent with the global average needed to meet the climate objective. This is because itwill be hard to find other nations much below the average, especially in a world ofsubstantially-declining emissions.
• On the basis of a world population around 9.7 billion in 205055, a 40-70% global cut ingreenhouse gas emissions below 2010 levels is equivalent to emissions per person of 1.5-3tCO2e in 2050.
• Applying this per person average to a projected UK 2050 population of around 74 million56
equates to domestic emissions in 2050 of 107-225 MtCO2e, a 73-87% reduction below 1990levels57. The UK’s 2050 target of at least an 80% reduction is at the centre of this range. Thiswould apply to all emitting sectors including international aviation and shipping.
• Applying the same logic to the EU28 as a whole leads to a 74-87% reduction below its 1990level (again, including international aviation and shipping).
55 Medium variant from UN (2015) World Population Prospects, 2015 Revision 56 Low migration variant from Office of National Statistics (2013) 2012-based National Population Projections 57 1990 carbon budget baseline plus international aviation and shipping bunker emissions, DECC (2015) Final UK greenhouse gas emissions national statistics: 1990-2013 __________________________________________________________________
48

5. Implications for the fifth carbon budgetOur advice on the fifth carbon budget must take into account international circumstances. In this chapter we have shown that the internationally agreed climate objective and the global emission pathways to achieve this are still feasible but increasingly challenging:
• There are significant climate change risks and costs involved in delaying action.
• Implementation of low-carbon technologies, laws, measures and pledges has progressed,giving higher confidence that a global deal can be delivered once agreed. The UK is acting ina context of increasing moves towards decarbonisation globally.
• Countries are delivering emissions reduction pledges ahead of the Paris conference in 2015.Current pledges are not on the lowest-cost path to the climate objective, and ambition needsto be ramped up to bridge this gap.
• The UK is an important player in driving forward EU and international ambition. Both the UKand EU have objectives to reduce their greenhouse gas emissions in 2050 to at least 80%below 1990 levels. These objectives remain appropriate in light of the latest evidenceregarding global emissions pathways consistent with 2°C,.
We will continue to monitor closely further progress towards a global deal, in particular outcomes from the Paris conference and progress to review and increase ambition post-2030.
__________________________________________________________________
49
Introduction and key messages The Climate Change Act requires us to assess European circumstances when advising on carbon budgets. Current and planned EU climate policy is important because it sets targets for Member States and provides some of the main policy instruments for reducing emissions.
In this chapter we set out the EU emissions target for 2030 agreed by the EU’s Member States, the implications of this for UK action to 2030 (which is the middle of the fifth carbon budget period), and consider the role of the EU in contributing to closing the global emissions gap for 2030 identified in Chapter 2.
Our key messages are:
• The EU’s Member States have agreed a 2030 target for EU emissions of at least 40% below1990 levels. This is also the EU’s collective pledge for 2030 as part of the UN process towards aglobal deal. It is currently one of the more ambitious pledges.
• Our best estimate is that the EU 2030 agreement could mean a reduction in UK emissionsover the fifth carbon budget period of 54% below 1990 levels. The precise UK share cannot beknown with certainty until final rules governing Member States’ shares are agreed. Reflectingthese uncertainties suggests the UK will contribute emission reductions within a range of 51-57%.
• The EU’s agreed 2030 target is at the lower end of ambition compared to the cost-effectivepath to its 2050 objective of an 80-95% reduction below 1990 levels. It is below estimates fora ‘fair’ EU share of a global 2°C pathway, and the UK’s likely contribution is at the low end ofambition compared to its global ‘fair’ share.
Chapter 3: The EU and UK share of international action
__________________________________________________________________
50

• The EU should be prepared to raise its ambition as a contribution to closing a globalemissions gap in 2030, provided other countries make similar commitments. The UKGovernment has previously argued for a 50% reduction in EU emissions in 2030 below 1990levels.
We set out the analysis underpinning these conclusions in four sections:
1. The EU’s 2030 target and its UN pledge
2. UK share of EU action to 2030
3. EU contributions to closing a 2030 global emissions gap
4. Implications for the fifth carbon budget
1. The EU’s 2030 target and its UN pledgeThe EU’s Member States have agreed a 2030 emissions target, and this also forms the basis for the EU’s collective pledge under the international UN negotiations (Chapter 2). In this section we outline the EU’s agreed 2030 target, timelines for its implementation, and implications for the pace of EU action.
The emissions target Member States agreed for the EU in 2030 is for at least a 40% reduction below 1990 levels58. The EU has formally submitted this as their pledge, collectively covering all the 28 countries in the EU, to the UN process leading to Paris59. A greater proportion of the reduction is to be achieved in sectors covered by the EU’s Emission Trading System (EU ETS):
• The agreement for at least a 40% reduction in emissions by 2030 compared to 1990 levels(equivalent to 35% below 2005 and 25% below 2012) specifically leaves open the possibilityof increasing ambition beyond 40% in light of developments in Paris.
• The target is to be achieved domestically, without purchase of international offset credits.
• Sectors covered by the EU ETS will reduce their emissions by 43% compared to 2005 levels.This means tightening the rate of reduction in the EU ETS cap, from 38 MtCO2e per year inPhase III (i.e. 1.74% of the average level of the EU ETS cap over 2008-12) to 48 MtCO2e per yearin Phase IV (i.e. 2.2% of the 2008-12 average).
• Sectors not covered by the EU ETS (the ‘non-ETS’ sectors) will reduce their emissions by 30%compared to 2005 levels.
The EU has also agreed a wider set of measures as part of the 2030 framework, including targets for renewable energy and energy efficiency, and significant structural reform of the EU ETS:
• Renewable energy. The agreement is for an EU-wide renewable energy target of at least27% by 2030. This is to be binding at the EU level but not translated into national targets.
• Energy efficiency. The agreement endorsed an indicative and non-binding energy efficiencyimprovement of at least 27% by 2030. This will be reviewed in 2020, with reference to a 30%target.
58 European Council Conclusions October 2014 (EUCO 169/14) 59 http://www4.unfccc.int/submissions/INDC/Published%20Documents/Latvia/1/LV-03-06-EU%20INDC.pdf __________________________________________________________________
51

• Reform of EU ETS. The European Parliament approved legislation in 2015 to introduce a‘Market Stability Reserve’ for the EU ETS (Box 3.1). The purpose of this is to address the currentsurplus of allowances within the system, and to improve the resilience of the system to majorshocks.
Box 3.1: The EU ETS Market Stability Reserve
Since the start of Phase III of the EU ETS (2013-20) there has been a large imbalance between supply and demand for allowances. A significant surplus of allowances has resulted in a low price of carbon under the system.
The surplus arose because demand weakened, largely but not exclusively as a result of the recession, whereas the annual supply of allowances was fixed.
In an attempt to provide a long-term solution, the EU has agreed to implement a ‘Market Stability Reserve’ (MSR)60. The aim of this is to address the current surplus of allowances and to improve the system’s resilience to major shocks:
• The MSR operates according to a set of pre-defined rules, which adjust the supply ofallowances depending on market conditions.
• When the pool of surplus allowances is large, new allowances are put into the MSR ratherthan auctioned. If the surplus shrinks below a certain level then allowances are releasedfrom the MSR.
The result is that supply and demand for allowances should be more closely aligned, with more stable incentives for emissions reduction.
While the 2030 framework was agreed by the European Council in October 2014, it is likely to take several years to implement and the final implications may not be known until around 2020:
• The agreement by the European Council reflects a high-level agreement on targets foremissions, renewables and energy efficiency.
• Implementation of the 2030 framework is being undertaken in a staged approach.
– The first stage covers the EU ETS: in 2015 the European Commission published a legislativeproposal for the rules covering Phase IV of the scheme, and legislation establishing theMarket Stability Reserve was approved.
– The second stage covers the non-ETS sectors, and more information on the approach tothese is expected in 2016.
• The experience of implementing the EU’s 2020 targets suggests it is likely to be several yearsuntil final legislation is passed and the full implications of this are known (i.e. potentially notuntil around 2020 - Box 3.2)
60 http://ec.europa.eu/clima/policies/ets/reform/index_en.htm __________________________________________________________________
52

Box 3.2: The EU’s 2030 agreement and timelines for implementation
The EU Council, which comprises the heads of all 28 Member State Governments, agreed the EU’s 2030 emissions target in October 2014. This was a high-level agreement with details of the implementation to be worked up and agreed over the coming years61:
• The agreement in 2014 was for a 2030 emissions reduction of at least 40% below 1990levels. The reduction is 43% below 2005 levels for those sectors covered by the EU ETS, and30% below 2005 in other sectors.
• The agreement also set out some implementation details. For the EU ETS this includes anincrease in the annual rate at which the cap is reduced, confirmation that free allocation toprotect against competitiveness risks will continue, and the creation of new modernisationand innovation funds. For the non-ETS sectors it was specified that the maximum MemberState reduction would be 40% below 2005 levels by 2030.
• In July 2015 the European Commission published a proposal for revised EU ETS legislationreflecting the 2014 Council agreement. A proposal for the non-ETS sectors is expected in2016. Both of these proposals will need to be agreed by the Parliament and Council.
Experience with the EU’s 2020 targets suggests that the final implications of the 2030 agreement for individual Member States may not be known for several years and possibly not until around 2020:
• The EU Council agreed the EU’s high-level 2020 targets in March 2007.
• In January 2008 the European Commission proposed legislation to support meeting thesetargets. These were agreed and passed into law in April 2009.
• The final details of implementation were not agreed until 2013. For example, this reflecteddetailed consideration of rules governing free allocation of allowances to industry underthe EU ETS (including which sectors were considered exposed to carbon leakage).
Therefore, the process from agreeing the EU’s 2020 targets until final implementation took around six years. Applying this to the EU’s agreement in 2014 for a 2030 target suggests the final implications may not be known until around 2020.
Overall, the implication is that the pace of EU-wide decarbonisation will increase during the 2020s and will need to increase further after 2030 in order to be on track to 2050:
• To meet the EU’s 2020 target of a 20% reduction in emissions below 1990 levels a reductionof 0.1% per year is required from 2012 (the latest year for which data is available). In practice,EU emissions are expected to outperform the 2020 target and fall at least 24% below 1990levels, implying an annual reduction of 0.7% per year from 2012 levels.
• The EU’s 40% target for 2030 would require a 2.8% reduction per year from the 2020 target, or2.3% per year taking into account the expected 2020 over-performance (and even less if the2020 reduction is greater than 24%).
• After 2030 a further increase in effort will be necessary, to around 5% per year, in order toreach the 2050 goal of at least an 80% reduction below 1990 levels.
61 European Council Conclusions October 2014 (EUCO 169/14) __________________________________________________________________
53

2. UK share of EU action to 2030Under the Climate Change Act we are required to assess the contribution towards meeting carbon budgets by sectors covered, and not covered, by the EU ETS. In this section we set out the UK’s likely share of reductions under the EU’s 2030 agreement, for both the EU ETS and non-ETS sectors over the fifth carbon budget period.
The UK’s share of the EU ETS cap to 2030
Under the 2030 agreement made by EU Member States, the EU-wide ETS cap will tighten by 2.2% per year62 after 2020 (i.e. by 48 MtCO2e per year). This is an increase from the 1.74% (38 MtCO2e) annual decline before 2020. The result is that the EU-wide cap will be 43% lower than 2005 levels by 2030 (Figure 3.1).
Figure 3.1: EU ETS cap to 2030
Source: Consolidated EU ETS Directive (2003/87/EC); European Commission COM(2015) 337 - Proposal for a Directive of the European Parliament and of the Council amending Directive 2003/87/EC to enhance cost-effective emission reductions and low-carbon investments; European Environment Agency EU ETS data viewer Notes: Cap covers stationary installations only and falls at 1.74% (38.3 MtCO2e per year) to 2020, and 2.2% (48.4 MtCO2e per year) post-2020.
62 This is a linear annual reduction, calculated as 2.2% of the average level of the EU ETS cap between 2008 and 2012.
0
500
1000
1500
2000
2500
2013
2014
2015
2016
2017
2018
2019
2020
2021
2022
2023
2024
2025
2026
2027
2028
2029
2030
MtC
O2e
/yr
EU ETS cap
EU ETS verified emissions
__________________________________________________________________
54

There are complexities in identifying the UK’s share of the EU-wide cap (Box 3.3). Based on the European Commission’s draft legislation published in 2015, our best estimate of the UK’s share of the EU ETS cap over the fifth carbon budget period is 610 MtCO2e63.
• There are a range of uncertainties given that the final rules for the EU ETS after 2020 have notyet been agreed. Reflecting these uncertainties suggests the range for the UK share of the EUETS cap could be 555-670 MtCO2e over the fifth carbon budget period.
• Our estimates assume the impact of the Market Stability Reserve (MSR) is neutral over thebudget period. To the extent that allowances are placed in or released from the MSR, the UK’sshare of the cap could differ in specific years (Box 3.4).
Box 3.3: Calculating the UK’s share of the EU ETS cap
The UK’s share of the EU ETS cap – which defines net emissions for the traded sector – is determined by two factors:
• The level of the EU ETS cap
• The proportion of the cap attributable to the UK.
For Phase III of the EU ETS (covering the period to 2020), these two factors can be accurately assessed in advance, given that they are determined by rules published in the legislation governing the EU ETS.
For Phase IV of the EU ETS (covering 2021-2030) the European Commission proposed, in July 2015, a revised set of rules reflecting the EU Council’s agreement on a 2030 EU emissions target64. This will affect the UK’s share of the EU ETS cap, as both the level of the EU cap and the proportion attributable to the UK could differ compared to Phase III:
• EU ETS cap. In Phase IV the EU cap will tighten at a faster rate compared to Phase III. Thecap falls by a fixed linear amount per year. In Phase III this was 1.74% of the average level ofthe EU cap between 2008-12, which equates to a reduction of 38.3 MtCO2e per year. InPhase IV the EU Council has agreed this rate of reduction will increase to 2.2%, equating toan annual linear reduction of 48.4 MtCO2e. The result is that the EU cap, excluding aviation,will reduce from 2,084 MtCO2e in 2013 to 1,816 MtCO2e in 2020 and 1,333 MtCO2e in 2030(Figure 3.1). As the fifth carbon budget covers the period to 2032, we assume the same rateof reduction continues for those two additional years.
• The proportion of the cap attributable to the UK will reflect the UK’s share of each of thefour elements which make up the cap in Phase IV: auctioned allowances, freely allocatedallowances, the Innovation Fund and the Modernisation Fund. The UK will also have a shareof the separate aviation cap:
63 All our estimates covering the fifth carbon budget period in this report are presented to the nearest 5 MtCO2e. 64 European Commission, Proposal for a Directive of the European Parliament and of the Council amending
Directive 2003/87/EC to enhance cost-effective emission reductions and low-carbon investments, 15th July 2015, COM (2015) 337 final.
__________________________________________________________________
55

Box 3.3 (cont.): Calculating the UK’s share of the EU ETS cap
– Auctioned allowances. The majority of allowances are sold by auction by MemberStates. In Phase III these represented 55% of the cap on average. Under the rules of theEU ETS Directive the UK received 10.0% of these allowances to auction. In Phase IV theshare of auctioning at the EU level is proposed to stay constant at the same proportionas Phase III. Reflecting minor changes in the proposed auctioning rules that remove aKyoto Protocol adjustment, the UK is expected to receive 10.3% of these allowances toauction.
– Freely allocated allowances. In Phase III energy-intensive industries at risk of carbonleakage were allocated allowances for free. A complex set of rules in the EU ETS Directivegovern how these are allocated. For Phase IV free allocation will continue, using thesame broad framework for allocation, with the detailed rules updated to better targetsectors at risk of carbon leakage. The expectation is that the new rules will not materiallychange the approach to free allocation, so the UK share will be close to that in Phase III.Our assumption for Phase IV is therefore to continue the UK’s share from Phase III (7.9%),but with a range of ±25% to reflect the uncertainty in the new rules.
– Innovation Fund. In Phase IV 400m allowances (3% of the cap over Phase IV) will beauctioned centrally to provide finance for innovative projects across all sectors in the EUETS. Given Fund finance is available to all EU ETS sectors and all Member States, weassume the UK receives a share based on its share of verified emissions in 2005 (12.0%),with a range of ±25% around this. We assume the 400m allowances are auctionedequally across the opening four years of Phase IV, mirroring the approach to a similarfund in Phase III (the NER300). If these allowances were auctioned equally across PhaseIV as a whole it would not materially change our central estimate, given the relativelysmall size of the Fund.
– Modernisation Fund. This makes up 2% of the EU cap in Phase IV. Access to theModernisation Fund is reserved for lower income EU Member States. The UK is thereforenot eligible for these allowances.
– Aviation. Emissions from flights within the EU are covered by the EU ETS, under aseparate cap which is semi-tradable with the main EU ETS. This includes domestic UKflights and UK flights to EU countries. Emissions from UK flights to non-EU countries arenot included. Carbon budgets only cover domestic aviation emissions, so we estimatethe UK’s share of the aviation emissions cap for domestic emissions, and add this to ourestimate of the UK’s share of the main EU ETS cap. We assume the approach for Phase IIIcontinues in Phase IV. That is, the cap is flat at 95% of 2004-06 average emissions (18.1MtCO2 for domestic aviation emissions across the EU), and the share is allocated on thebasis of the UK share in 2010 emissions (9.7%). We therefore add 1.7 MtCO2 per year toreflect that UK domestic aviation emissions are covered by the EU ETS.
__________________________________________________________________
56

Box 3.3 (cont.): Calculating the UK’s share of the EU ETS cap
Overall, our best estimate is that the UK’s share of the EU ETS cap will fall out to 2030, from 190 MtCO2e in 2013 to 167 MtCO2e in 2020 and 122 MtCO2e in 2030 (Figure B3.3). This primarily reflects a tightening EU-wide ETS cap, with the proportion of the stationary cap attributable to the UK increasing slightly in our central scenario from 9.0% in Phase III to 9.1% in Phase IV. This assumes a neutral effect of the Market Stability Reserve (Box 3.4). It implies a level for the traded sector over the five year fifth carbon budget period of 610 MtCO2e65, within a range of 555-670 MtCO2e.
Figure B3.3: Range for UK share of EU ETS cap under EU 2030 agreement
Source: CCC analysis based on European Council Conclusions October 2014 (EUCO 169/14) Notes: Includes UK stationary sources and UK domestic aviation. Assumes effect of Market Stability Reserve is neutral (Box 3.4). Outturn pre-2020 may differ from best estimate depending on level of closures, cessations and new entrants.
65 To the nearest 5 MtCO2e.
0
20
40
60
80
100
120
140
160
180
200
2013
2014
2015
2016
2017
2018
2019
2020
2021
2022
2023
2024
2025
2026
2027
2028
2029
2030
2031
2032
MtC
O2e
/yr
Best estimateRange
CB2 CB3 CB4 CB5
__________________________________________________________________
57
Box 3.4: Relationship between the EU ETS Market Stability Reserve and carbon budgets
The EU has agreed a ‘Market Stability Reserve’ (MSR) to improve the resilience of the system to major shocks (Box 3.1). The MSR operates by altering the supply of auctioned allowances according to pre-defined rules.
Under the accounting rules of the Climate Change Act66, the UK’s carbon budgets are measured against the ‘net carbon account’:
• The net carbon account comprises the UK’s share of the EU ETS cap plus UK emissions inthe non-ETS sectors.
• If the UK’s share of the EU ETS cap significantly differs in practice from the level assumedwhen setting the budget then this could have implications for the room available for non-ETS sectors (e.g. for a given level of budget, if the UK’s actual share of the EU ETS cap islower than assumed then the room for non-ETS sectors is increased, thus weakeningambition).
The operation of the MSR could therefore present an issue for carbon budget management, since we do not know in advance when, and to what extent, it will operate.
However, in principle the impact of the MSR can be managed through flexibility mechanisms in the Climate Change Act:
• The Climate Change Act provides for banking and borrowing between carbon budgets67.
• If, within a carbon budget period, UK allowances are withheld from auctioning and placedinto the MSR then we assume the equivalent amount of carbon budget units are banked.
• If these allowances are released from the MSR at a later date, then we assume theequivalent units are released for carbon budgets.
Our analysis therefore assumes carbon budgets are set on a neutral basis, with no operation of the MSR.
66 The Carbon Accounting (2013-2017 Budgetary Period) Regulations 2015 67 Climate Change Act 17 __________________________________________________________________
58

The UK’s share of the EU non-ETS reduction to 2030
Under the 2030 agreement made by EU Member States, EU-wide emissions in sectors not covered by the EU ETS will be 30% below 2005 levels by 2030 (Figure 3.2).
This EU-wide reduction will be translated to annual targets for each country, broadly following the approach already in place for the period to 2020.
For the fifth carbon budget period, our best estimate of the UK’s share of the non-ETS reduction under the EU agreement is 1,250 MtCO2e (Box 3.5).
• There are a number of uncertainties given the European Commission has not yet publishedtheir proposed specific legislation for these sectors. Taking these into account suggests arange for the UK’s non-ETS sector target of 1,195-1,300 MtCO2e over the fifth budget.
• More specific details are expected to be published in 2016, but EU Member States haveagreed the maximum required reduction for any country will be 40% below 2005 emissions.Countries are free to go further than this should they deem that to be cost-effective.
Figure 3.2: Agreed EU trajectory for non-ETS emissions to 2030
Source: CCC analysis based on: EU Decision No 406/2009/EC and Commission Decisions of 26 March 2013 and 31 October 2013; European Council Conclusions October 2014 (EUCO 169/14) Notes: Excludes LULUCF emissions.
0
500
1000
1500
2000
2500
3000
2013
2014
2015
2016
2017
2018
2019
2020
2021
2022
2023
2024
2025
2026
2027
2028
2029
2030
MtC
O2e
/yr
Path to 2020 target 2030 agreed path
__________________________________________________________________
59

Box 3.5: Calculating the UK share of the EU’s non-ETS 2030 target
Under the EU’s 2030 agreement sectors not covered by the EU ETS (the ‘non-ETS’ sectors) will reduce their emissions by 30% below 2005 levels. Each Member State will have annual targets to reduce their non-ETS emissions consistent with this, continuing the approach in place for the period to 2020. These set a floor for ambition in the non-ETS sectors, and Member States are free to go beyond this should they deem that cost-effective.
The UK’s share of the EU’s non-ETS reduction in 2030 will be determined by the 2020 non-ETS target, the agreed 2030 reduction, and the level of 2005 emissions:
• 2020 target. Under the EU’s 2020 package the UK has agreed to reduce its non-ETSemissions by 16% below 2005 levels by 2020. This has been converted into binding annualtargets covering the period 2013-20.68,69,70
• 2030 target. The UK’s final agreed 2030 non-ETS target will be between 35% and 40%below 2005 levels.
– Under the EU’s 2030 target the EU Council has agreed that the maximum reduction byany single Member State will be 40% below 2005 levels71.
– The European Commission has assessed the cost-effective UK reduction in 2030 as 35%below 2005 levels72; the final target is likely to be higher than this since there will be afurther adjustment to reflect relative GDP per capita.
– For our central assessment we assume a 2030 reduction of 37.5%. We link this linearly tothe existing agreed 2020 point.
• 2005 emissions. Both the 2020 and 2030 targets are set relative to 2005 emissions.However, there is uncertainty about the level of 2005 emissions which will be used. Current2020 targets were set using a version of the UK emissions inventory which has since beenupdated to reflect methodological developments (e.g. revised CO2-equivalence factorsfrom the IPCC’s 4th Assessment Report). Given there is provision in the existing non-ETSlegislation to review this, we assume that the latest version of the inventory is incorporatedin both the 2020 and 2030 target setting.
To be consistent with carbon budgets we add emissions from Land Use, Land Use Change and Forestry (LULUCF, which are not covered by the EU’s target), and extend the analysis to cover the fifth carbon budget period:
68 Decision No 406/2009/EC of the European Parliament and of the Council of 23 April 2009 on the effort of Member States to reduce their greenhouse gas emissions to meet the Community’s greenhouse gas emission reduction commitments up to 2020
69 Commission Decision of 26 March 2013 on determining Member States’ annual emission allocations for the period from 2013 to 2020 pursuant to Decision No 406/2009/EC of the European Parliament and of the Council
70 Commission Implementing Decision of 31 October 2013 on the adjustments to Member States’ annual emission allocation for the period from 2013 to 2020 pursuant to Decision No 406/2009/EC of the European Parliament and of the Council
71 European Council Conclusions October 2014 (EUCO 169/14) 72 Commission Staff Working Document, Impact Assessment Accompanying the document Communication from
the Commission to the European Parliament, the Council, the European Economic and Social Committee and the Committee of the Regions: A policy framework for climate and energy in the period from 2020 up to 2030, SWD (2014) 15 final
__________________________________________________________________
60
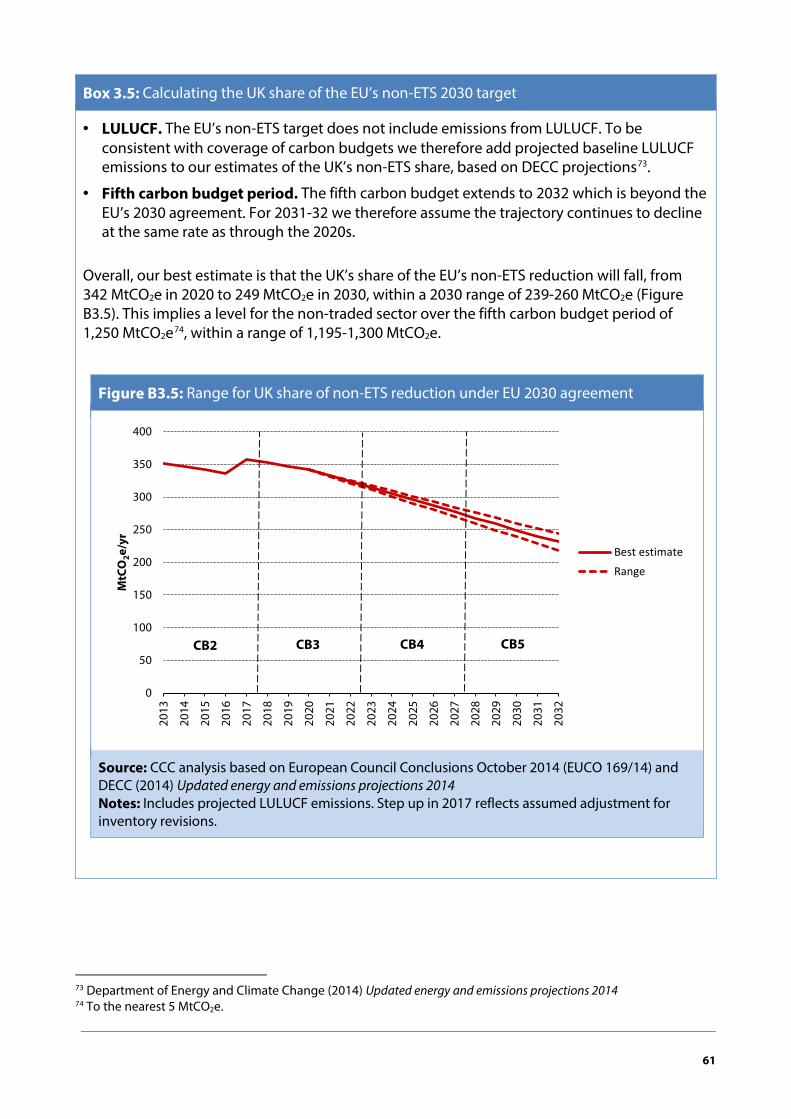
Box 3.5: Calculating the UK share of the EU’s non-ETS 2030 target
• LULUCF. The EU’s non-ETS target does not include emissions from LULUCF. To beconsistent with coverage of carbon budgets we therefore add projected baseline LULUCFemissions to our estimates of the UK’s non-ETS share, based on DECC projections73.
• Fifth carbon budget period. The fifth carbon budget extends to 2032 which is beyond theEU’s 2030 agreement. For 2031-32 we therefore assume the trajectory continues to declineat the same rate as through the 2020s.
Overall, our best estimate is that the UK’s share of the EU’s non-ETS reduction will fall, from 342 MtCO2e in 2020 to 249 MtCO2e in 2030, within a 2030 range of 239-260 MtCO2e (Figure B3.5). This implies a level for the non-traded sector over the fifth carbon budget period of 1,250 MtCO2e74, within a range of 1,195-1,300 MtCO2e.
Figure B3.5: Range for UK share of non-ETS reduction under EU 2030 agreement
Source: CCC analysis based on European Council Conclusions October 2014 (EUCO 169/14) and DECC (2014) Updated energy and emissions projections 2014 Notes: Includes projected LULUCF emissions. Step up in 2017 reflects assumed adjustment for inventory revisions.
73 Department of Energy and Climate Change (2014) Updated energy and emissions projections 2014 74 To the nearest 5 MtCO2e.
0
50
100
150
200
250
300
350
400
2013
2014
2015
2016
2017
2018
2019
2020
2021
2022
2023
2024
2025
2026
2027
2028
2029
2030
2031
2032
MtC
O2e
/yr
Best estimateRange
CB2 CB3 CB4 CB5
__________________________________________________________________
61

Implications of the EU 2030 target for the fifth carbon budget
The UK’s overall required reduction in emissions under the EU’s 2030 framework will reflect reductions in its share of the EU ETS cap and its share of the non-ETS reduction.
Our best estimate of the combination of the UK’s share of the EU 2030 target in the EU ETS and non-ETS sectors suggests a reduction of 54% below 1990 levels on average over the fifth carbon budget period, within a range of 51-57% (Figure 3.3).
In comparison, the legislated fourth carbon budget is 52% below 1990 levels in 202575. Our best estimate of the UK’s reduction under the EU’s 2030 agreement is that this therefore could imply a 2 percentage point reduction in average emissions from the fourth to fifth carbon budget (i.e. 18 MtCO2e). This compares to a 6.6 percentage point (54 MtCO2e) reduction per budget on average required to meet the UK’s 2050 target from the fourth carbon budget in 2025.
Figure 3.3: Range for UK emissions pathway under the EU's 2030 agreement
Source: DECC (2015) 2013 UK Greenhouse Gas Emissions, Final Figures; CCC analysis Notes: Reflects sum of the UK's share of the EU ETS cap (Figure B3.3) and EU non-ETS reduction (Figure B3.5). Excludes international aviation and shipping emissions. Discontinuity in 2013 due to inventory revisions; we assume this is reflected in EU targets from 2017 onwards.
75 When the fourth carbon budget was legislated it reflected a 50% reduction on 1990 levels. Subsequent inventory revisions mean it now reflects a 52% reduction.
0
100
200
300
400
500
600
700
800
900
1990
1995
2000
2005
2010
2015
2020
2025
2030
MtC
O2e
/yr Outturn
Best estimateRange
__________________________________________________________________
62

3. EU contributions to closing a 2030 global emissions gapWe concluded in Chapter 2 that the EU and UK’s 2050 commitments to reduce domestic emissions by at least 80% on 1990 levels remain appropriate but that, globally, there is a gap between UN pledges for 2030 and the cost-effective path to 2°C.
The gap to the cost-effective path could be closed through remaining pledges, by increasing ambition in pledges, and by further commitments beyond 2030. While the EU’s pledge is one of the more ambitious made so far (Chapter 2), in this section we consider what further EU and UK contributions to closing a global gap could be. We consider what a ‘fair’ share of a 2°C pathway implies under various equity criteria, and whether an EU reduction of 40% is on the cost-effective path to a 2050 reduction of 80-95% below 1990 levels.
Our conclusion is that the EU should be prepared go further than a 40% reduction below 1990 levels as a contribution to closing a 2030 global emissions gap, provided other countries make similar commitments.
Fair shares of global pathways to 2°C
There is no agreed approach for estimating what a ‘fair’ share of a global 2°C pathway would be for individual countries or regions in 2030. A range of methods reflecting different judgements over fairness and equity suggest the EU’s current 2030 target is below the required level of ambition on a range of metrics:
• A range of methods have been proposed for dividing a global 2°C pathway betweenindividual countries and regions. We have considered the implications of seven methodswhich reflect different dimensions of fairness, based on economic factors, convergence ofemissions and historic responsibility (Box 3.6).
• We use results from GLOCAF modelling to assess the implications of different methods for EUand UK emissions reduction in 2030. All methods show steep cuts for both the EU and UK,reflecting relative wealth and high historical emissions. For the EU we find a range between45-71% below 1990 levels in 2030, and for the UK we find a range of 53-80% (Figure 3.4).
– GLOCAF is a global model, developed by the Department of Energy and Climate Change,which represents emissions reduction potential across world regions and sectors, andwhich can assess the implications of different fairness metrics. We have used a globalemissions level in 2030 consistent with a likely chance of staying below 2°C (i.e. at least66%, 42 GtCO2e – see Chapter 2).
– The modelling suggests an indicative range for EU emissions in 2030 of 45-71% below1990 levels, and 53-80% for the UK. The UK takes on a slightly higher reduction than the EUas a whole, given its status as one of the wealthiest EU nations.
– The results are not evenly distributed across the range. Methods focussing on economicfactors and convergence of emissions by 2050 allocate smaller reductions, whereasmethods focussing on historical responsibility are outliers suggesting much higherreductions.
The EU’s agreed target for 2030 of at least a 40% reduction below 1990 levels is therefore below the estimated levels of ambition on this basis.
__________________________________________________________________
63

Box 3.6: ’Fair’ shares of global emission pathways
Several different methods have been proposed for determining a ‘fair’ share of global emissions between nations. They focus on different aspects of fairness, with some hybrid approaches combining the different aspects. The resulting allowances of emissions (or effort) could be made up through a combination of domestic action, trading and other forms of co-operation between nations.
The following ‘fair’ share methods are considered in this analysis and come from the GLOCAF model using the same methods described in Averchenkova et al (2014)76:
• Equal cumulative emissions: nations are allocated an emissions budget over a period oftime on the basis of their share of global population over the same period. For this analysiswe use the period 1990-2050.
• Brazilian proposal (or “index-based approach”): the share of emissions reduction(relative to a path of no climate action) is determined by contributions to historicalemissions. In this analysis we define this contribution as the nation’s share of cumulativeemissions during 1990-2020.
• Contraction and convergence: all nations converge towards equal per capita emissions bya given year (in this case 2050).
• Common but differentiated (CBD) convergence: as above, but using a staged approachin which low emitters can continue to increase emissions until they reach a specific level (inthis case global average per-capita emissions).
• Equal fraction of GDP: each nation faces the same mitigation cost as a fraction of nationalGDP.
• Income grouping: the amount paid by nations on mitigation is indexed by their GDP, suchthat wealthier countries pay a greater fraction than poorer ones. In this analysis “highincome” nations (as identified by the World Bank) are allocated double the fraction of theirGDP compared to others.
• Equal marginal cost: the marginal cost of mitigation (i.e. the carbon price) is set to be thesame across all nations.
76 Averchenkova, A. et al. (2014) Taming the beasts of “burden sharing”: an analysis of equitable mitigation actions and approaches to 2030 mitigation pledges, Centre for Climate Change Economics and Policy
__________________________________________________________________
64

Figure 3.4: Range for EU and UK 'fair' 2030 reduction under a global 2°C pathway
Source: GLOCAF modelling Notes: Compared to 1990 levels. Excludes international aviation and shipping emissions. Global emissions in 2030 assumed to be 42 GtCO2e.
The EU’s cost-effective path to its 2050 goal
The EU’s Member States have agreed a goal of reducing EU emissions by 80-95% below 1990 levels by 205077. Analysis of the cost-effective path to that objective suggests that the EU’s agreement for at least a 40% reduction in emissions below 1990 levels by 2030 is at the low end of ambition:
• In 2011 the European Commission published its Low-Carbon Roadmap, which set out theirassessment of the cost-effective path to the EU’s 2050 goal78. This concluded that the aimshould be to achieve a 25% reduction in EU emissions in 2020 below 1990 levels, and a 40-44% reduction in 2030 (Figure 3.5).
– The Roadmap specified these reductions should be achieved on a domestic basis, andtherefore without relying on purchase of international credits or offsets.
– A domestic reduction of 40-44% in 2030 could be achieved through a significant reductionin power sector emissions, roll-out of electric vehicles, substantial improvements in energyefficiency, penetration of low-carbon heating technologies as well as contributions fromindustry and non-CO2 greenhouse gases.
77 European Council Conclusions on EU position for the Copenhagen Climate Conference, 2968th Environment Council meeting, Luxembourg, 21 October 2009. 78 European Commission, A Roadmap for moving to a competitive low carbon economy in 2050, COM (2011) 112 final
0%
10%
20%
30%
40%
50%
60%
70%
80%
90%
0 1 2 3 4 5 6
2030
redu
ctio
n be
low
199
0
Brazilian proposal
Equal cumulativeemissionsIncome grouping
CBD convergence
Equal fraction of GDP
Equal marginal cost
Contraction &convergence
EU UK
__________________________________________________________________
65
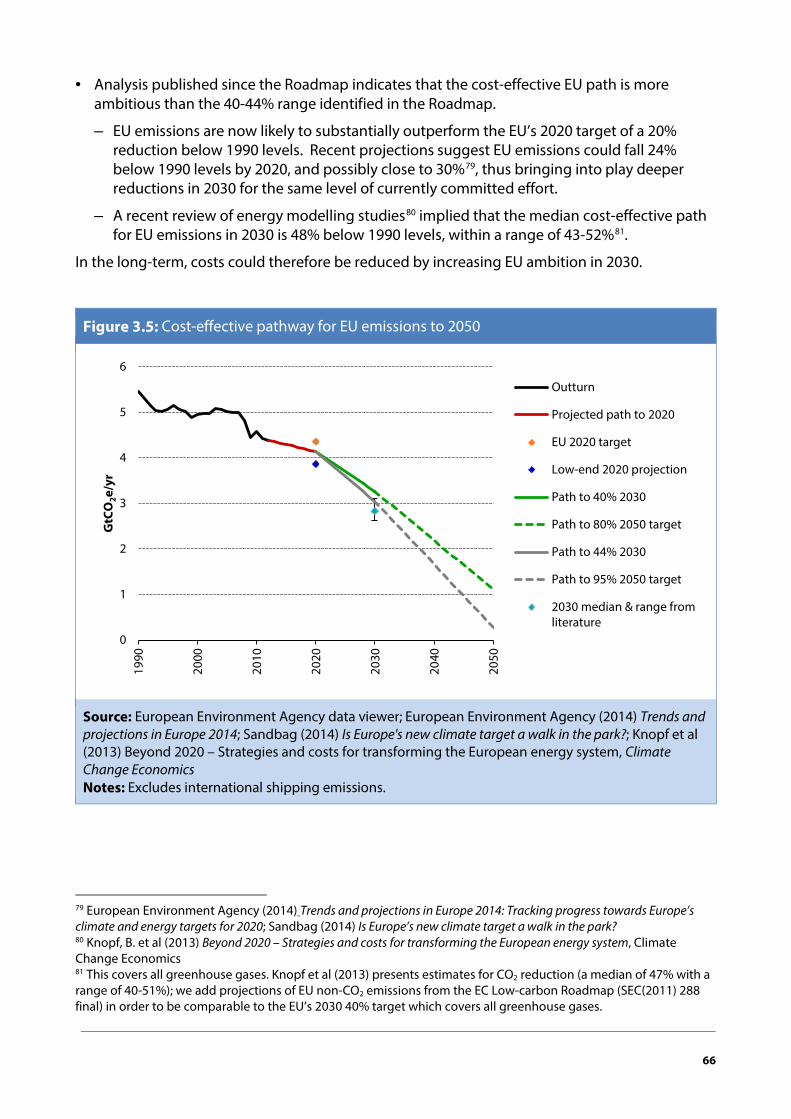
• Analysis published since the Roadmap indicates that the cost-effective EU path is moreambitious than the 40-44% range identified in the Roadmap.
– EU emissions are now likely to substantially outperform the EU’s 2020 target of a 20%reduction below 1990 levels. Recent projections suggest EU emissions could fall 24%below 1990 levels by 2020, and possibly close to 30%79, thus bringing into play deeperreductions in 2030 for the same level of currently committed effort.
– A recent review of energy modelling studies80 implied that the median cost-effective pathfor EU emissions in 2030 is 48% below 1990 levels, within a range of 43-52%81.
In the long-term, costs could therefore be reduced by increasing EU ambition in 2030.
Figure 3.5: Cost-effective pathway for EU emissions to 2050
Source: European Environment Agency data viewer; European Environment Agency (2014) Trends and projections in Europe 2014; Sandbag (2014) Is Europe's new climate target a walk in the park?; Knopf et al (2013) Beyond 2020 – Strategies and costs for transforming the European energy system, Climate Change Economics Notes: Excludes international shipping emissions.
79 European Environment Agency (2014) Trends and projections in Europe 2014: Tracking progress towards Europe’s climate and energy targets for 2020; Sandbag (2014) Is Europe’s new climate target a walk in the park? 80 Knopf, B. et al (2013) Beyond 2020 – Strategies and costs for transforming the European energy system, Climate Change Economics 81 This covers all greenhouse gases. Knopf et al (2013) presents estimates for CO2 reduction (a median of 47% with a range of 40-51%); we add projections of EU non-CO2 emissions from the EC Low-carbon Roadmap (SEC(2011) 288 final) in order to be comparable to the EU’s 2030 40% target which covers all greenhouse gases.
0
1
2
3
4
5
6
1990
2000
2010
2020
2030
2040
2050
GtC
O2e
/yr
Outturn
Projected path to 2020
EU 2020 target
Low-end 2020 projection
Path to 40% 2030
Path to 80% 2050 target
Path to 44% 2030
Path to 95% 2050 target
2030 median & range fromliterature
__________________________________________________________________
66
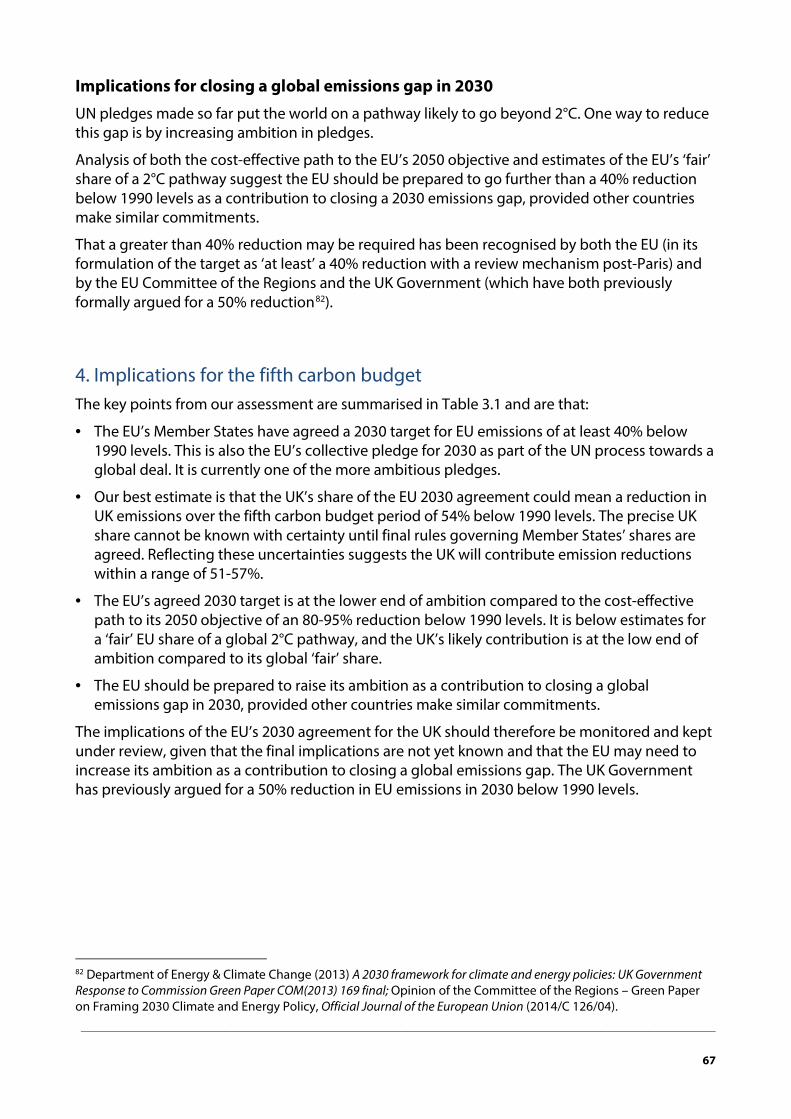
Implications for closing a global emissions gap in 2030
UN pledges made so far put the world on a pathway likely to go beyond 2°C. One way to reduce this gap is by increasing ambition in pledges.
Analysis of both the cost-effective path to the EU’s 2050 objective and estimates of the EU’s ‘fair’ share of a 2°C pathway suggest the EU should be prepared to go further than a 40% reduction below 1990 levels as a contribution to closing a 2030 emissions gap, provided other countries make similar commitments.
That a greater than 40% reduction may be required has been recognised by both the EU (in its formulation of the target as ‘at least’ a 40% reduction with a review mechanism post-Paris) and by the EU Committee of the Regions and the UK Government (which have both previously formally argued for a 50% reduction82).
4. Implications for the fifth carbon budgetThe key points from our assessment are summarised in Table 3.1 and are that:
• The EU’s Member States have agreed a 2030 target for EU emissions of at least 40% below1990 levels. This is also the EU’s collective pledge for 2030 as part of the UN process towards aglobal deal. It is currently one of the more ambitious pledges.
• Our best estimate is that the UK’s share of the EU 2030 agreement could mean a reduction inUK emissions over the fifth carbon budget period of 54% below 1990 levels. The precise UKshare cannot be known with certainty until final rules governing Member States’ shares areagreed. Reflecting these uncertainties suggests the UK will contribute emission reductionswithin a range of 51-57%.
• The EU’s agreed 2030 target is at the lower end of ambition compared to the cost-effectivepath to its 2050 objective of an 80-95% reduction below 1990 levels. It is below estimates fora ‘fair’ EU share of a global 2°C pathway, and the UK’s likely contribution is at the low end ofambition compared to its global ‘fair’ share.
• The EU should be prepared to raise its ambition as a contribution to closing a globalemissions gap in 2030, provided other countries make similar commitments.
The implications of the EU’s 2030 agreement for the UK should therefore be monitored and kept under review, given that the final implications are not yet known and that the EU may need to increase its ambition as a contribution to closing a global emissions gap. The UK Government has previously argued for a 50% reduction in EU emissions in 2030 below 1990 levels.
82 Department of Energy & Climate Change (2013) A 2030 framework for climate and energy policies: UK Government Response to Commission Green Paper COM(2013) 169 final; Opinion of the Committee of the Regions – Green Paper on Framing 2030 Climate and Energy Policy, Official Journal of the European Union (2014/C 126/04). __________________________________________________________________
67

Table 3.1: EU and UK emission reductions in 2030 under the EU’s agreement compared to other criteria
EU in 2030 UK in 2030
EU 2030 pledge vs. 1990 ≥40% 54% (51-57%)
EU ETS reduction vs. 2005 43% 48.7% (43.9-53.4%)
Non-ETS reduction vs. 2005 30% 37.5% (35.0-40.0%)
Cost-effective path to 2050 target vs. 1990 40-44%
(EC Roadmap)
48% (43-52%) (Literature)
See fifth carbon budget advice Nov
2015
‘Fair’ share of global 2°C pathway vs. 1990 45-71%* 53-80%*
Notes: *Range for ‘fair’ share not evenly distributed: upper end (reflecting historical responsibility criteria) are outliers.
***
Under the Climate Change Act (2008), the Committee is required to advise the Government, by the end of 2015, on the level of the UK’s fifth carbon budget (the limit on the amount of greenhouse gases that can be emitted by the UK between 2028 and 2032).
This report has examined the scientific and international circumstances we are required to consider under the Climate Change Act when advising the Government and Parliament on carbon budgets.
The final advice on the fifth carbon budget must take into account other criteria in the Act, including: the impact of the budget on the economy, the government’s fiscal position, affordability of energy for households, security of supply, the devolved administrations and the competitiveness of businesses. The budget must also be on a path to the UK’s 2050 target of at least an 80% reduction in emissions below 1990 levels.
We will deliver our fifth carbon budget recommendation, reflecting the full set of criteria, in a report to be published towards the end of November. This will set out our assessment of the cost-effective path for UK emissions to the 2050 target and the appropriate level of the fifth carbon budget.
__________________________________________________________________
68

Committee on Climate Change 7 Holbein Place London SW1W 8NR
www.theccc.org.uk
@theCCCuk