the seafood industry in alaska’s economy€¦ · · 2011-02-222011 report sponsored by the...
TRANSCRIPT

- In 2009, Dutch Harbor-Unalaska was the leading U.S. port in quantity of commercial fishery landings, and the second U.S. port in value of commercial fishery landings (NMFS 2010a)
- Dutch Harbor-Unalaska ranked second (after New Bedford, MA) with a harvest value of $159.7 million dollars; Kodiak was ranked third at $103.8 million, and Naknek-King Salmon ranked fourth at $76.1 million dollars (NMFS 2010a).
- The seafood industry, through direct, indirect and induced effects, contributed a total of $4.6 billion to Alaska's economic output in 2009.
THE SEAFOOD INDUSTRY IN ALASKA’S ECONOMY
2011 Executive Summary Update- Alaska led all states in terms of both volume and ex-vessel value of commercial fisheries landings in 2009, with a total of 1.84 million metric tons (MT) worth 1.3 billion dollars (NMFS 2010a).
- National harvest volume in 2009 was 3,568,599 MT (NMFS 2010a).
- In the list of top 50 U.S. ports based on volume for - 2009, Alaska had 11 including Dutch Harbor-Unalaska (1st); Kodiak (4th); Naknek-King Salmon (11th); Sitka (14th); Ketchikan (15th); Petersburg (18th); Cordova (21st); Seward (26th); Homer (36); Juneau (41st); Kenai (50th) (NMFS 2010a).
- In the list of top 50 U.S. ports based on ex-vessel value for 2009, Alaska had 10; 8 of them were in the top 20. These ports include Dutch Harbor-Unalaska (2nd); Kodiak (3rd); Naknek-King Salmon (4th); Sitka (5th); Homer (12th); Seward (17th); Ketchikan (18th); Cordova (19th) (NMFS 2010a). Three other Alaska ports, Akutan, King Cove and Sand Point, would also make the top 20 were it not for confidentiality requirements that prevent release of data for ports with fewer than three processors.
Prepared by
THE SEAFOOD INDUSTRY IN
MARINE CONSERVATION ALLIANCE
Photo courtesy of ASMI
As a major player in global markets, Alaska’s seafood industry is an economic engine for both the state and the nation. This publication updates "The Seafood Industry in Alaska’s Economy", first published in 2009. It shows that the seafood industry continues to be the largest private sector employer in the state.
Importance of Alaska to the Global Seafood Market
- If Alaska were a nation it would have placed 14th among seafood producing countries in 2008 (NMFS 2010b and FAO 2010).
- Alaska landings of global groundfish species groups (including cod, pollock, hake and haddock) and flatfish accounted for 18 percent of the world harvest of these species groups in 2008 (Hiatt, et al. 2010 and FAO 2010).
- In 2008 about 35 percent of the world capture produc-tion of species in the “salmon, trout, smelt” group occurred in Alaskan waters (Hiatt, et al. 2010 and FAO 2010).
- Alaska accounted for 95 percent of total U.S. pacific salmon landings in 2009 (NMFS 2010a).
- The 2010 salmon season was one of the best on record with almost 170 million fish harvested in Alaska, the 11th highest number since statehood. Preliminary 2010 estimates show that the salmon harvest generated $533.9 million, the highest ex-vessel value in eighteen years (since 1992) (ADF&G 2010).
- In 2009, $1.6 billion dollars worth of seafood was exported directly from Alaska to destinations such as Japan, China, South Korea, Canada, and Europe (Office of the Governor of the State of Alaska 2009, NOAA 2010a).
- In 2009 Japan was the leading direct importer of Alaska fish and fisheries products (by value) followed by China, South Korea, Germany, the Netherlands and Canada (NOAA 2010a).
Importance of Alaska Seafood to the U.S.
- In 2009, Alaska accounted for over 52 percent of the volume of the commercial seafood harvested in the United States (NMFS 2010a).
- Alaska as a single state led all other multi-state regions in the U.S. in terms of ex-vessel value with over 34 percent of the U.S. total (NMFS 2010a).
- The five New England States combined for a distant second with 20 percent, followed by the five states on the Gulf of Mexico with 16 percent (NMFS 2010a).
- Alaska's pollock fishery is the largest in the U.S., account-ing for 24 percent of total U.S. fisheries landings (NMFS 2010a).
- In 2009, 26 percent of total U.S. crab catches were king and snow (tanner) crab, and they accounted for 35 percent of total U.S. crab value (NMFS 2010a). King and snow crab come entirely from Alaska.
- Dutch Harbor-Unalaska holds the record for catch volume with 911.3 million pounds landed in 2006 (NMFS 2010a).
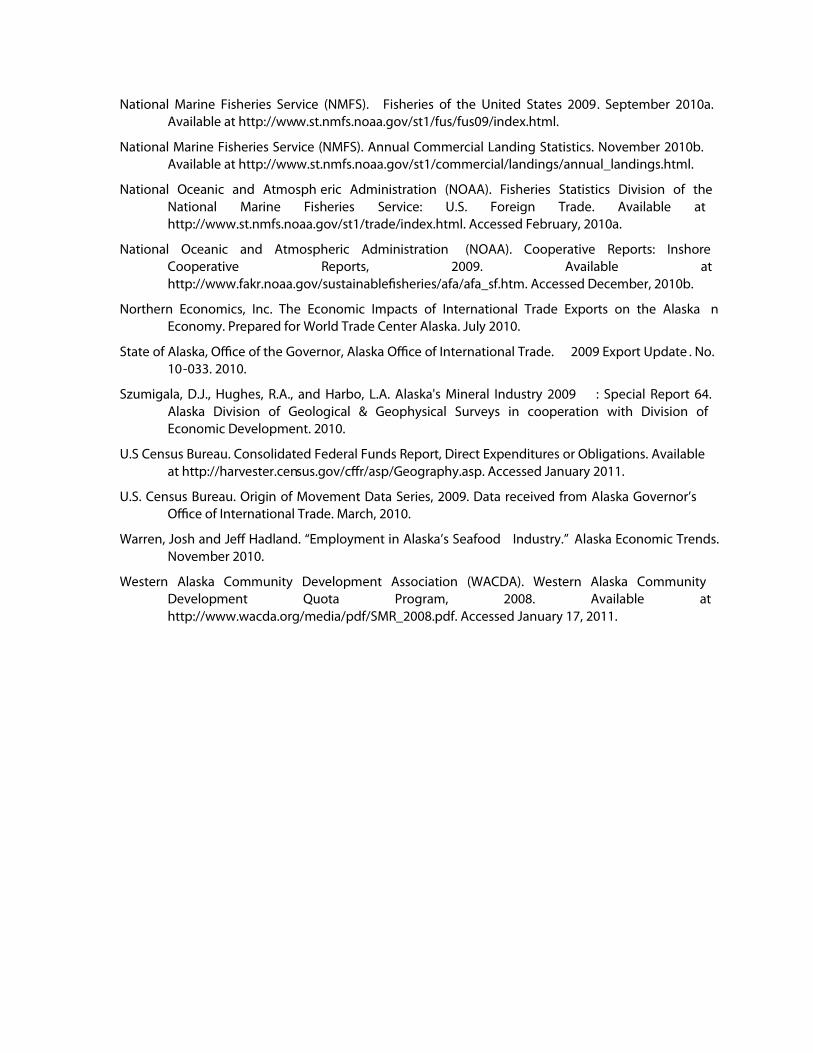
- Alaska landings of Pacific Sea Herring accounted for 98 percent of the Pacific coast with 87 million pounds valued at over $29.3 million (NMFS 2010a).Photo Courtesy of PSPA
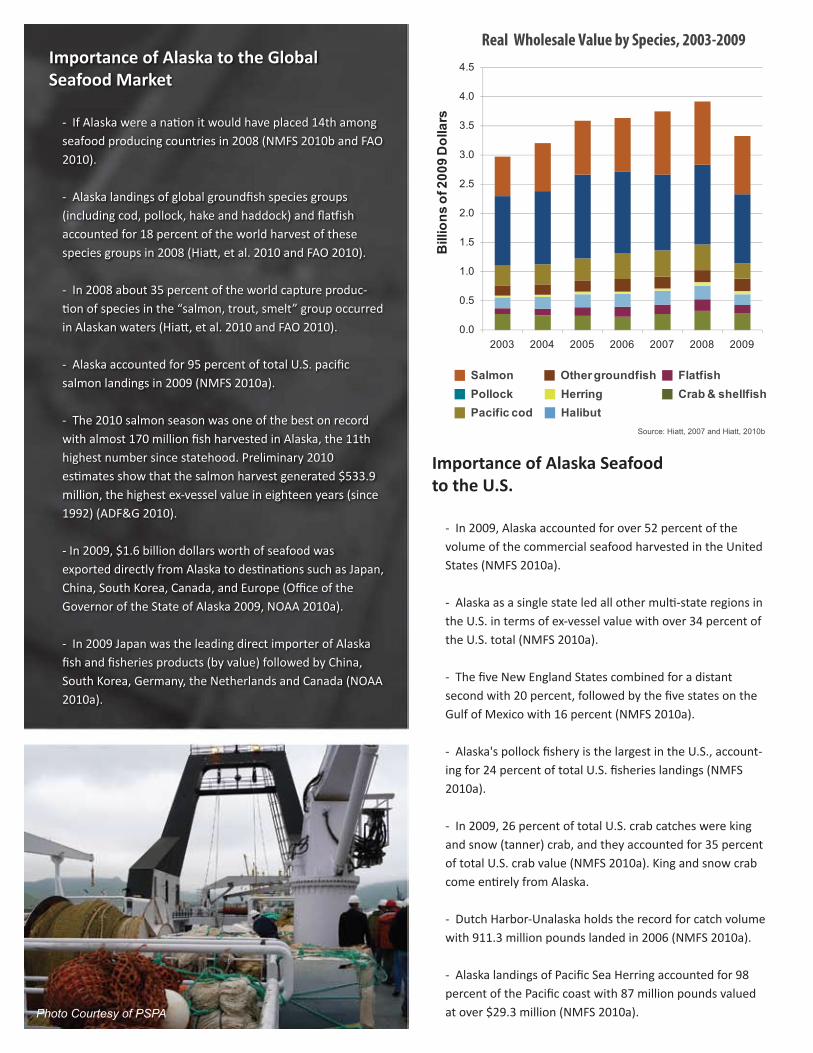
Real Wholesale Value by Species, 2003-2009
Source: Hiatt, 2007 and Hiatt, 2010b
Salmon
Pollock
Pacific cod
Other groundfish
Herring
Halibut
Flatfish
Crab & shellfish
0.0
0.5
1.0
1.5
2.0
2.5
3.0
3.5
4.0
4.5
2003 2004 2005 2006 2007 2008 2009
Bill
ion
s o
f 20
09
Do
llars

Importance of Alaska Seafood to Alaska
- In 2009 total estimated ex-vessel value of Alaska’s commer-cial harvest was $1.3 billion (NMFS 2010a).
- The additional value added by Alaska's seafood processing sector brought the first wholesale value of Alaska's commercial seafood industry to over $3.3 billion in 2009 (Hiatt et al. 2010).
- It is estimated that the seafood industry's $3.3 billion in wholesale value generated an additional $1.3 billion in indirect and induced economic output for a total contribution of $4.6 billion to Alaska's economic output (NEI using Hiatt 2010b, NOAA 2010b, Mothership Fleet Cooperative 2010 and IMPLAN 2009 data).
- The seafood industry also generated more than 80,800 direct, indirect, and induced jobs and $1.45 billion in direct, indirect and induced payments to labor and income (NEI using Hiatt 2010b, NOAA 2010b, Mothership Fleet Cooperative 2010 and IMPLAN 2009 data).
- In 2009 the wholesale value generated by the seafood industry represented over 10 percent of the $34 billion basic sector activity in Alaska’s economy (Hiatt 2010b, Office of the Governor of the State of Alaska 2009, U.S. Census Bureau 2010 & 2011, ADOR 2011, McDowell 2010, and Szumigala 2010). The basic sector, because it brings money into the state from outside, is the driving force behind all economic activity in the state.
- The seafood industry ranks third in importance behind the North Slope oil and gas industry and federal government in terms of generating basic economic activity in Alaska (NEI using ADOLWD 2010 and ADOLWD 2011a).
- Alaska’s seafood industry generated about $79 million in state taxes and fees, in addition to local fish taxes in fiscal year 2009 (ADOR 2009; ADCCED 2011).
- Seafood was Alaska’s leading export in 2009 and accounted for 50 percent of total direct exports—nearly double the value of the second highest export sector (minerals at 26 percent), (U.S. Census Bureau 2010). Total Alaskan seafood exports were even greater; a large portion of Alaskan seafood is exported internationally from packaging and storage facilities in Wash-ington.
- In 2009, seafood processing accounted for about 95 percent of all food manufacturing jobs in Alaska, and 71 percent of total manufacturing jobs (ADOLWD 2010 and ADOLWD 2011b).
- With an estimated harvesting and processing workforce of 70,548, the seafood industry employs more workers than any other non-government industry sector in Alaska, including oil and gas and mining combined. The trade, transportation and utilities sector follows with a workforce of 63,300 (ADOLWD 2010, ADOLWD 2011a and Warren 2010).
- With the concentration of major fishing ports in the Aleutian and Pribilof Islands region, seafood processing accounted for 58 percent of all private sector payments to labor in the Aleutian West Census Area in 2009 (ADOLWD 2011b).
- The seafood processing industry is estimated to have accounted for 35 percent of private-sector payments to labor in Kodiak in 2009 (ADOLWD 2011b).
- The Western Alaska Community Development Quota (CDQ) program, which allocates a portion of the Bering Sea catch for coastal communities to invest in economic development, generates millions of dollars each year. In 2008, the CDQ entities collectively generated more than $180 million in revenue (WACDA 2008).
- The CDQ Program augments the important role of the seafood industry in Western Alaska. Sixty-five Bering Sea communities participate in the CDQ program (WACDA 2008).
- From 1992 through 2008 the CDQ Program generated over $240 million in wages, payments to fishers, and scholarships and training benefits (WACDA 2008).
- In 2008 CDQ entities provided wage and salary jobs to more than 1,600 individuals, and the combined payroll for the year exceeded $22.3 million (WACDA 2008).
- The value of the six CDQ groups' assets increased from about $13.3 million in 1992 to over $559 million in 2009 (WACDA 2008).
Photo courtesy of Ron Clarke

2011 report sponsored by the Marine Conservation Alliance
This is a 2011 update of the Executive Summary from the 2009 report “The Seafood Industry in Alaska’s Economy”. This report, as well as the 2011 update with full references is available at www.marineconservationalliance.org.
431 N. Franklin St. Ste 305 Juneau, AK 99801 | phone 907. 523.0731 | www.marineconservationalliance.org
Also follow ‘SeaAlliance’ on:
Table 1. Seafood Industry Employment by Region, 2009
Summary of Workers Harvesting Processing Total
Aleutian and Pribilof Islands 5,309 6,276 11,585
Bristol Bay 9,385 4,522 13,907
Kodiak 3,664 2,934 6,598
Northern 627 68 695
Southcentral 8,071 3,491 11,562
Southeast 10,150 4,886 15,036
Yukon Delta 2,986 831 3,817
At-Sea 1,732 5,616 7,348
Total 41,924 28,624 70,548
Source: Northern Economics, Inc. and ADOLWD, 2010.
Table 2. Estimated Seafood Ex-vessel Volume and Value by Region, 2009
Region Harvest Weight (1,000 MT) Ex-Vessel Value ($ Millions)
Aleutian and Pribilof Islands 497.2 393.7
Bristol Bay 86.6 119.0
Kodiak 157.2 129.8
Northwest/Arctic/Yukon-Kuskokwim 3.9 6.7
Southcentral 77.8 177.0
Southeast 134.4 209.8
At-Sea 883.0 307.9
Total 1,840.0 1,343.8
Source: Estimated by Northern Economics using NMFS (2010a), Hiatt (2010a) and Hiatt (2010b).
Table 3. Estimated Seafood Wholesale Volume and Value by Region, 2009
Region Product Weight (1,000 MT) Wholesale Value ($ Millions)
Aleutian and Pribilof Islands 180.9 735.8
Bristol Bay 48.6 250.2
Kodiak 72.9 261.1
Northwest/Arctic/Yukon-Kuskokwim 2.3 15.9
Southcentral 45.4 289.3
Southeast 81.1 374.2
At-Sea 457.0 1,396.3
Total 888.1 3,322.9
Source: Hiatt, 2010b

References Alaska Department of Commerce, Community and Economic Development ( ADCCED). 2009 Alaska
Economic Performance Rep ort. February 2011.
Alaska Department of Fish and Game (ADF&G). ADF&G Press Release: ADF&G Releases 2010 Salmon Season Summary. Press Release No. 10 -28. November 8, 2010.
Alaska Department of Labor and Workforce Development (ADOLWD), Research and Analysis Section; U.S. Department of Labor, Bureau of Labor Statistics. Current Employment Statistics, 2009 . Available at http://laborstats.alaska.gov. Accessed January 2011a.
Alaska Department of Labor and Workforce Development (ADOLWD), Research and Analysis Section; U.S. Department of Labor, Bureau of Labor Statistics. Quarterly Census of Employment and Wages, 2009 (revised August 2, 2010). Available at http://laborstats.alaska.gov. Accessed January 2011b.
Alaska Department of Labor and Workforce Development (ADO LWD), Research and Analysis Section. State of Alaska Seafood Employment Estimates, 2003 -2009. Available at http://laborstats.alaska.gov/?PAGEID=67&SUBID=300. Accessed December 2010.
Alaska Department of Labor and Workforce Development (ADOLWD), Research an d Analysis Section. Alaska Local and Regional Information (ALARI). Available at http://labor.alaska.gov/research/alari/home.htm. Accessed January 2011.
Alaska Department of Revenue (ADOR) , Tax D ivision. Annual Report, 2009. Available at www.tax.alaska.gov.
Alaska Department of Revenue (ADOR), Permanent Fund Dividend Division. 2009 Annual Report. Available at http://www.pfd.state.ak.us/forms/AnnualReports/2009AnnualReport.pdf. Accessed January 2011.
“Final Report of the Mothership Fleet Cooperative, 2009.” Presented to the North Paci�c Fishery Management Council. January 28, 2010.
Food and Agriculture Organization of the United Nations (FAO). FishStat Plus. Available at http://www.fao.org/�shery/statistics/software/�shstat/en. Global Datasets, Capture Production Data thru 2008. Released February 2010.
O�ce of the Governor of the State of Alaska and the Department of Commerce, Community and Economic Development. Alaska Economic Performance Report 2008. 2009. Available at http://www.commerce.state.ak.us/oed/.
Hiatt, Terry, et al. Stock Assessment and Fishery Evaluation Report for the Ground�sh Fisheries of the Gulf of Alaska and Bering Sea/Aleutian Islands Area: Economic Status of the Ground�sh Fisheries O� Alaska, 2009. September 14, 2010a. Available at http://www.afsc.noaa.gov/refm/docs/2010/economic.pdf.
Hiatt, Terry. NMFS, Alaska Fisheries Science Center. Fisheries ex -vessel and wholesale values by region, prepared at request of Northern Economics, Inc. November 17, 2010b.
Hiatt, Terry. NMFS, Alaska Fisheries Science Center. Fisheries ex -vessel and wholesale values by region, prepared at request of Northern Economics, Inc. 2007.
McDowell Group. Economic Impact of Alaska’s Visitor Industry. Prepared for the State of Alaska, Department of Commerce, Community, and Economic Development. March 2010.
National Marine Fisheries Service (NMFS). Fisheries of the United States 2009. September 2010a. Available at http://www.st.nmfs.noaa.gov/st1/fus/fus09/index.html.
National Marine Fisheries Service (NMFS). Annual Commercial Landing Statistics. November 2010b. Available at http://www.st.nmfs.noaa.gov/st1/commercial/landings/annual_landings.html.
National Oceanic and Atmosph eric Administration (NOAA). Fisheries Statistics Division of the National Marine Fisheries Service: U.S. Foreign Trade. Available at http://www.st.nmfs.noaa.gov/st1/trade/index.html. Accessed February, 2010a.
National Oceanic and Atmospheric Administration (NOAA). Cooperative Reports: Inshore Cooperative Reports, 2009. Available at http://www.fakr.noaa.gov/sustainable�sheries/afa/afa_sf.htm. Accessed December, 2010b.
Northern Economics, Inc. The Economic Impacts of International Trade Exports on the Alaska n Economy. Prepared for World Trade Center Alaska. July 2010.
State of Alaska, O�ce of the Governor, Alaska O�ce of International Trade. 2009 Export Update . No. 10-033. 2010.
Szumigala, D.J., Hughes, R.A., and Harbo, L.A. Alaska's Mineral Industry 2009 : Special Report 64. Alaska Division of Geological & Geophysical Surveys in cooperation with Division of Economic Development. 2010.
U.S Census Bureau. Consolidated Federal Funds Report, Direct Expenditures or Obligations. Available at http://harvester.census.gov/c�r/asp/Geography.asp. Accessed January 2011.
U.S. Census Bureau. Origin of Movement Data Series, 2009. Data received from Alaska Governor’s O�ce of International Trade. March, 2010.
Warren, Josh and Je� Hadland. “Employment in Alaska’s Seafood Industry.” Alaska Economic Trends. November 2010.
Western Alaska Community Development Association (WACDA). Western Alaska Community Development Quota Program, 2008. Available at http://www.wacda.org/media/pdf/SMR_2008.pdf. Accessed January 17, 2011.