the second law of thermodynamics - uscibooks.com · chapter 4 the second law of thermodynamics as...
TRANSCRIPT
CH AP T ER 4The Second Law of Thermodynamics
As we saw in Chapter 3, the first law of thermodynamics specifies that energy can beneither created nor destroyed, but flows from one part of the universe to another or isconverted from one form into another. The total amount of energy in the universeremains constant. Despite its immense value in the study of the energetics of chemicalreactions, the first law does have a major limitation: it cannot predict the directionof change. It helps us to do the bookkeeping of energy balance, such as the energyinput, heat released, work done, and so forth, but it says nothing about whether aparticular process can indeed occur. For this kind of information we must turn to thesecond law of thermodynamics.
In this chapter we introduce a new thermodynamic function, called entropy (S),which is central to both the second law and the third law of thermodynamics. Weshall see that changes in entropy, DS, provide the necessary criterion for predictingthe direction of any process. To help us focus on the system and on specific practicalconditions, we shall develop a function that forms the basis of chemical thermody-namics: Gibbs energy (G).
4.1 Spontaneous Processes
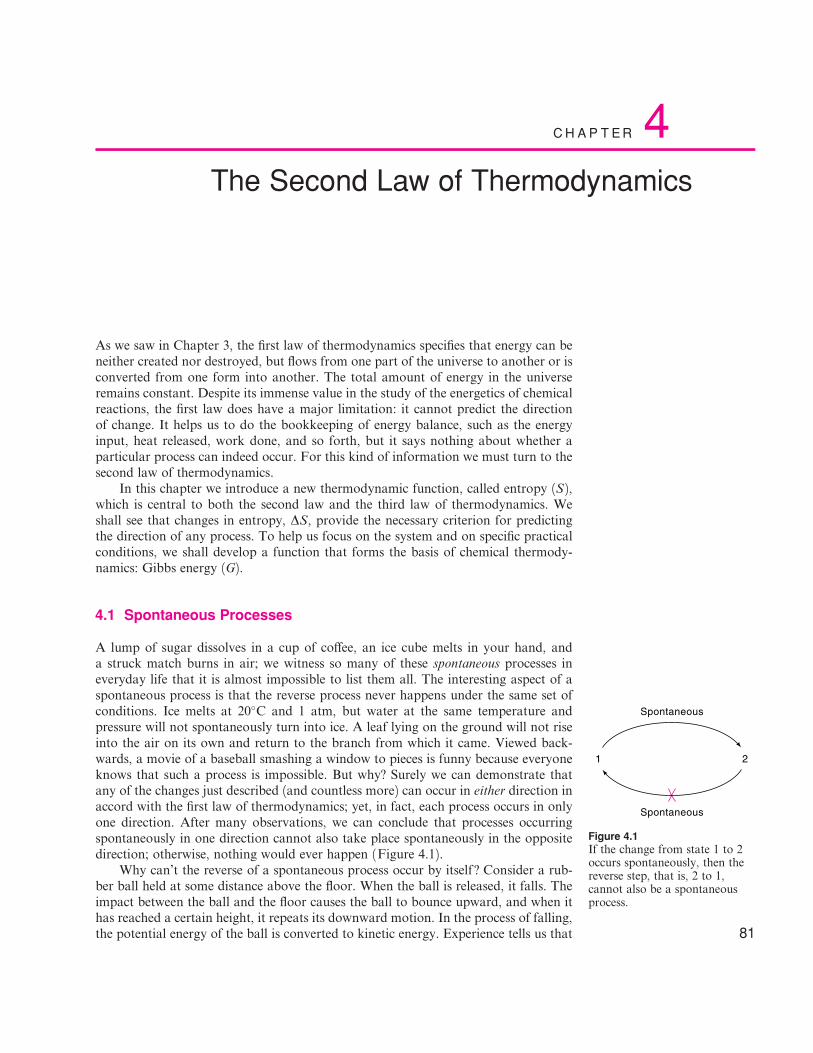
A lump of sugar dissolves in a cup of co¤ee, an ice cube melts in your hand, anda struck match burns in air; we witness so many of these spontaneous processes ineveryday life that it is almost impossible to list them all. The interesting aspect of aspontaneous process is that the reverse process never happens under the same set ofconditions. Ice melts at 20�C and 1 atm, but water at the same temperature andpressure will not spontaneously turn into ice. A leaf lying on the ground will not riseinto the air on its own and return to the branch from which it came. Viewed back-wards, a movie of a baseball smashing a window to pieces is funny because everyoneknows that such a process is impossible. But why? Surely we can demonstrate thatany of the changes just described (and countless more) can occur in either direction inaccord with the first law of thermodynamics; yet, in fact, each process occurs in onlyone direction. After many observations, we can conclude that processes occurringspontaneously in one direction cannot also take place spontaneously in the oppositedirection; otherwise, nothing would ever happen (Figure 4.1).
Why can’t the reverse of a spontaneous process occur by itself ? Consider a rub-ber ball held at some distance above the floor. When the ball is released, it falls. Theimpact between the ball and the floor causes the ball to bounce upward, and when ithas reached a certain height, it repeats its downward motion. In the process of falling,the potential energy of the ball is converted to kinetic energy. Experience tells us that 81
1 2
Spontaneous
Spontaneous
Figure 4.1If the change from state 1 to 2occurs spontaneously, then thereverse step, that is, 2 to 1,cannot also be a spontaneousprocess.

after every bounce, the ball does not rise quite as high as before. The reason is thatthe collision between the ball and the floor is inelastic, so that upon each impact someof the ball’s kinetic energy is dissipated among the molecules in the floor. After eachbounce, the floor becomes a little bit hotter.* This intake of energy increases therotational and vibrational motions of the molecules in the floor (Figure 4.2a). Even-tually, the ball comes to a complete rest because its kinetic energy is totally lost to thefloor. To describe this process in another way, we say that the original potential en-ergy of the ball, through its conversion to kinetic energy, is degraded into heat.
Now let us consider what would be necessary for the reverse process to occur onits own; that is, a ball sitting on the floor spontaneously rises to a certain height in theair by absorbing heat from the floor. Such a process will not violate the first law. Ifthe mass of the ball is m, and the height above the floor to which it rises is h, we have
energy extracted from the floor ¼ mgh
where g is acceleration due to gravity. The thermal energy of the floor is randommolecular motion. To impart an amount of energy large enough to raise the ballfrom the floor, most of the molecules would have to line up under the ball and vibratein phase with one another, as shown in Figure 4.2b. At the instant the ball leaves thefloor, all the atoms in these molecules must be moving upward for proper energytransfer. It is conceivable for 2 million molecules to execute this kind of synchronizedmotion, but because of the magnitude of energy transfer, the number of moleculesinvolved would have to be on the order of Avogadro’s number, or 6� 1023. Giventhe random nature of molecular motion, this is such an improbable event that it isvirtually impossible. Indeed, no one has ever witnessed the spontaneous rising of aball from the floor, and we can safely conclude that no one ever will.
Thinking about the improbability of a ball spontaneously rising upward from thefloor helps us understand the nature of many spontaneous processes. Consider thefamiliar example of a gas in a cylinder fitted with a movable piston. If the pressure ofthe gas is greater than the external pressure, then the gas will expand until the inter-nal and external pressures are equal. This is a spontaneous process. What wouldit take for the gas to contract spontaneously? Most of the gas molecules would haveto move away from the piston and toward other parts of the cylinder at the same
*Actually, the temperatures of the ball and of the surrounding air also rise slightly after eachimpact. But here, we are concerned only with what happens to the floor.
(a) (b)
Figure 4.2(a) A spontaneous process. A falling ball strikes the floor and loses some of its kinetic energyto the molecules in the floor. As a result, the ball does not bounce quite as high and the floorheats up a little. The length of arrows indicates the amplitude of molecular vibration. (b) Animpossible event. A ball resting on the floor cannot spontaneously rise into the air byabsorbing thermal energy from the floor.
82 Chapter 4: The Second Law of Thermodynamics

time. Now, at any given moment many molecules are indeed doing this, but we willnever find 6� 1023 molecules engaged in unidirectional motion because moleculartranslational motion is totally random. By the same token, a metal bar at a uniformtemperature will not suddenly become hotter at one end and colder at the other. Toestablish this temperature gradient, the thermal motion resulting from collisions be-tween randomly vibrating atoms would have to decrease at one end and rise at theother—a highly improbable event.
Let us look at this problem from a di¤erent angle and ask what changes accom-pany a spontaneous process. Logically, we can assume that all spontaneous processesoccur in such a way as to decrease the energy of the system. This assumption helps usexplain why things fall downward, why springs unwind, and so forth. But a change ofenergy alone is not enough to predict whether a process will be spontaneous. Forexample, in Chapter 3, we saw that the expansion of an ideal gas against a vacuumdoes not result in a change in its internal energy. Yet the process is spontaneous.When ice melts spontaneously at 20�C to form water, the internal energy of the sys-tem actually increases. In fact, many endothermic physical and chemical processesare spontaneous. If energy change cannot be used to indicate the direction of aspontaneous process, then we need another thermodynamic function to help us. Thisfunction turns out to be entropy (S).
4.2 Entropy
Our discussion of spontaneous processes is based on macroscopic events. In trying tounderstand spontaneous processes, we should focus our attention on the statistical
behavior of a very large number of molecules, not on the motion of just a few ofthem. In this section, we derive a statistical definition of entropy and then define en-tropy in terms of thermodynamic quantities.
Statistical Definition of Entropy
For a cylinder containing helium atoms, depicted in Figure 4.3, the probabilityof finding any one He atom in V2, the entire volume of the cylinder, is 1, because allHe atoms are known to be inside the cylinder. On the other hand, the probability offinding a helium atom in half of the volume of the cylinder, V1, is only 1
2 . If thenumber of He atoms is increased to 2, the probability of finding both of them in V2 isstill 1, but that of finding both of them in V1 becomes 1
2
� �12
� �, or 1
4 .* Because 14 is an
appreciable quantity, finding both He atoms in the same region at a given time wouldnot be surprising. We can see, however, that as the number of He atoms increases,
Put in perspective, this proba-bility is less than that for theproduction of Shakespeare’scomplete works 15 quadrilliontimes in succession without asingle error by a tribe of wildmonkeys randomly poundingon computer keyboards.
Volume V2Volume V1
Figure 4.3Schematic diagram showing N molecules occupying volumes V1 and V2 of a container.
* The probability of both events occurring is a product of the probabilities of two independentevents. We assume that the He gas behaves ideally so that the presence of one He atom in V1 doesnot a¤ect the presence of another He atom in the same volume in any way.
4.2 Entropy 83

the probability of finding all of them in V1 becomes progressively smaller:
W ¼ 12
� �12
� �12
� �� � � � � �
¼ 12
� �Nwhere N is the total number of atoms present. If N ¼ 100, we have
W ¼ 12
� �100 ¼ 8� 10�31
If N is of the order of 6� 1023, the probability becomes 12
� �6�1023
, a quantity so smallthat for all practical purposes it can be regarded as zero. From the results of thesesimple calculations come a most important message. If initially we had compressedall the He atoms into V1 and allowed the gas to expand on its own, we would findthat eventually the atoms would be evenly distributed over the entire volume, V2,because this situation corresponds to the most probable state. Thus, the directionof spontaneous change is from a situation in which the gas is in V1 to one in whichit is in V2, or from a state with low probability of occurring to one of maximumprobability.
Now that we know how to predict the direction of a spontaneous change in termsof probabilities of the initial and final states, it may seem appropriate to treat entropyas being directly proportional to probability as S ¼ kBW , where kB is a proportion-ality constant. But this expression is invalid for the following reason. Entropy, like Uand H, is an extensive property. Consequently, doubling the number of moleculeswould lead to a twofold increase in the entropy of the system. As we just saw, how-ever, probability is proportional to the volume raised to the number of molecules,that is, W mVN .* Therefore, changing from one to two molecules gives us W 2.Thus, the increases in entropy (from S to 2S) and probability (from W to W 2) arenot related to each other as predicted by the simple equation given above. A way outof this dilemma is to express entropy as a natural logarithmic function of probabilityas follows:
S ¼ kB lnW (4.1)
This equation tells us that as W increases to W 2, S increases to 2S becauselnW 2 ¼ 2 lnW . Equation 4.1 is known as the Boltzmann equation, and kB is theBoltzmann constant, given by 1:381� 10�23 J K�1. Because the quantity lnW isdimensionless, the units of entropy are therefore J K�1.
Equation 4.1 enables us to calculate changes in entropy when a system changesfrom an initial state, 1, to a final state, 2. The entropies of the system in these twostates are given by
S1 ¼ kB lnW1
S2 ¼ kB lnW2
Because entropy is a state function (it depends only on the probability of a stateoccurring and not on the manner in which the state is created), the change in entropy,DS, for the 1 ! 2 process is
* Because W mV , we have W ¼ CV , where C is a proportionality constant. Referring to thesituation shown in Figure 4.3, this constant is given by 1=V2. Thus, the probability of finding a Heatom in volume V1 is given by W ¼ ð1=V2ÞðV1Þ ¼ ðV1=V2Þ ¼ 1
2
� �, because V1 ¼ V2=2. In general,
the probability of finding N particles in volume V is given by the product of the individual proba-bilities; that is, W ¼ ðCVÞN , so W mV N .
Ludwig Boltzmann’s grave-stone in Vienna, Austria isinscribed with his famousequation. (Photo courtesy ofJohn Simon)
84 Chapter 4: The Second Law of Thermodynamics

DS ¼ S2 � S1 ¼ kB lnW2
W1ð4:2Þ
Equation 4.2 can be used to calculate the entropy change when an ideal gasexpands isothermally from V1 to V2. As we saw earlier, for N molecules, the proba-bilities W1 and W2 are related to the volumes V1 and V2 as follows:
W1 ¼ ðCV1ÞN
W2 ¼ ðCV2ÞN
Substituting these relations in Equation 4.2, we obtain
DS ¼ kB lnðCV2ÞN
ðCV1ÞN¼ kB ln
V2
V1
� �N
The Boltzmann constant kB is given by R=NA, where R is the gas constant and NA isthe Avogadro constant. Therefore, we write
DS ¼ N
NAR ln
V2
V1¼ nR ln
V2
V1(4.3)
where n is the number of moles of the gas present. Remember that Equation 4.3 holdsonly for an isothermal expansion because the entropy of a system is also a¤ected bychanges in temperature. Furthermore, we do not have to specify the manner in whichthe expansion was brought about (that is, reversible or irreversible), because S is astate function.
Example 4.1
Calculate the entropy change when 2.0 moles of an ideal gas are allowed to expandisothermally from an initial volume of 1.5 L to 2.4 L. Estimate the probability that thegas will contract spontaneously from the final volume to the initial one.
A N S W E R
From Equation 4.3, we write
DS ¼ ð2:0 molÞð8:314 J K�1 mol�1Þ ln 2:4 L
1:5 L
¼ 7:8 J K�1
To estimate the probability for spontaneous contraction, we note that this process mustbe accompanied by a decrease in entropy equal to �7:8 J K�1. Because the process isnow defined as 2 ! 1, we have, from Equation 4.2,
DS ¼ kB lnW1
W2
�7:8 J K�1 ¼ ð1:381� 10�23 J K�1Þ lnW1
W2
lnW1
W2¼ �5:7� 1023
4.2 Entropy 85

or
W1
W2¼ e�5:7�1023
This exceedingly small ratio means that the probability of state 1 occurring is so muchsmaller than that of state 2 that there is virtually no possibility for the process to occurby itself. This result does not mean, of course, that the gas cannot be compressed from2.4 L to 1.5 L, but it must be done with the aid of an external force.
Thermodynamic Definition of Entropy
Equation 4.1 is a statistical formulation of entropy; defining entropy in terms ofprobability provides us with a molecular interpretation. In general, however, thisequation is not used for calculating changes in entropy. Calculating the value of Wfor complex systems, those in which chemical reactions occur, for example, is toodi‰cult. Entropy changes can be conveniently measured from changes of other ther-modynamic quantities, such as DH. In Section 3.5, we saw that the heat absorbed byan ideal gas in an isothermal, reversible expansion is given by
qrev ¼ �wrev
qrev ¼ nRT lnV2
V1
or
qrev
T¼ nR ln
V2
V1
Because the right side of the equation above is equal to DS (see Equation 4.3), wehave
DS ¼ qrev
T(4.4)
In words, Equation 4.4 says that the entropy change of a system in a reversible pro-cess is given by the heat absorbed divided by the temperature at which the processoccurs. For an infinitesimal process, we can write
dS ¼ dqrev
T(4.5)
Both Equations 4.4 and 4.5 are the thermodynamic definition of entropy. Althoughthese equations were derived for the expansion of gases, they are applicable to anytype of process at constant temperature. Note that the definition holds only for areversible process, as the subscript rev indicates. Although S is a path-independentstate function, q is not, so we must specify the reversible path in defining entropy. Ifthe expansion were irreversible, then the work done by the gas on the surroundingswould be less, and so would be the heat absorbed by the gas from the surroundings;that is, qirrev < qrev. Although the entropy change would be the same (that is,DSrev ¼ DSirrev ¼ DS), we would have DS > qirrev=T . We shall return to this point inthe next section.
86 Chapter 4: The Second Law of Thermodynamics
The Carnot Heat Engine and Thermodynamic Efficiency
A heat engine converts heat to mechanical work. Heat engines play an essentialrole in our technological society; they include the now almost obsolete steam loco-motives, steam turbines that generate electricity, and the internal combustion enginesin automobiles. In 1824 a French engineer named Sadi Carnot (1796–1832) presentedan analysis of the e‰ciency of heat engines, which laid the foundation of the secondlaw of thermodynamics. The Carnot heat engine is an idealized model for the oper-ation of any heat engine. For our purpose, it can be represented by an ideal gas in acylinder fitted with a movable, frictionless piston that allows P–V work to be doneon and by the gas.
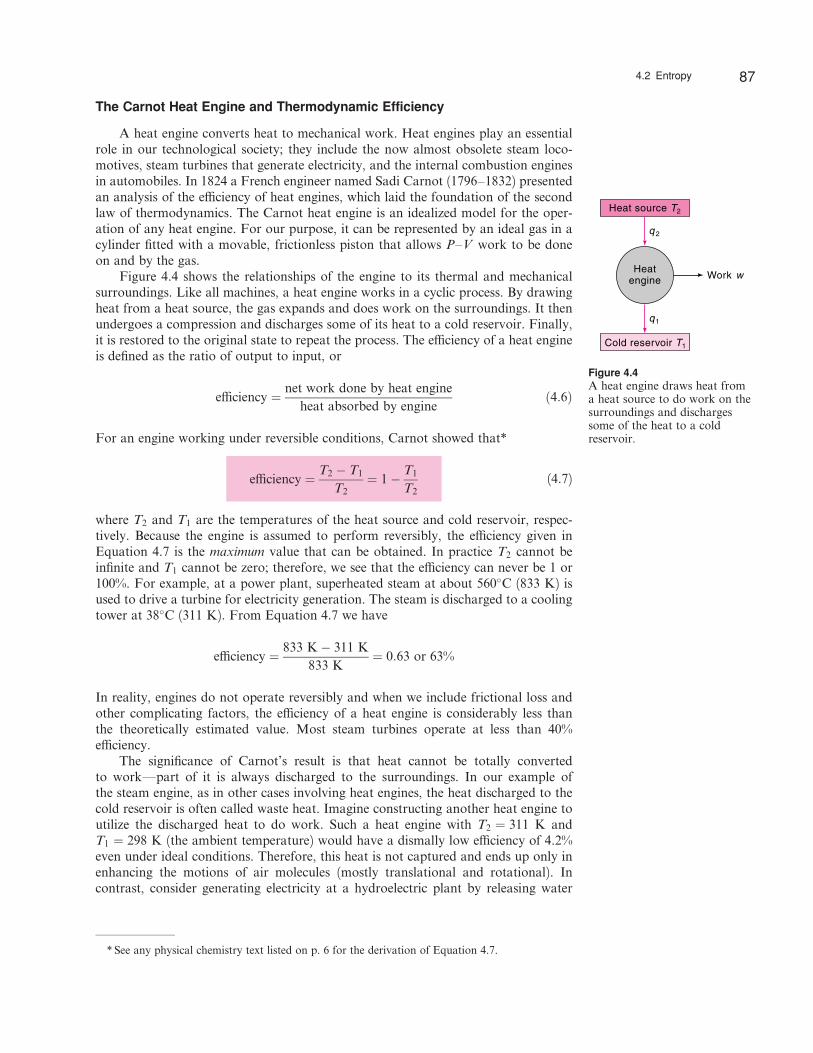
Figure 4.4 shows the relationships of the engine to its thermal and mechanicalsurroundings. Like all machines, a heat engine works in a cyclic process. By drawingheat from a heat source, the gas expands and does work on the surroundings. It thenundergoes a compression and discharges some of its heat to a cold reservoir. Finally,it is restored to the original state to repeat the process. The e‰ciency of a heat engineis defined as the ratio of output to input, or
e‰ciency ¼ net work done by heat engine
heat absorbed by engineð4:6Þ
For an engine working under reversible conditions, Carnot showed that*
e‰ciency ¼ T2 � T1
T2¼ 1� T1
T2(4.7)
where T2 and T1 are the temperatures of the heat source and cold reservoir, respec-tively. Because the engine is assumed to perform reversibly, the e‰ciency given inEquation 4.7 is the maximum value that can be obtained. In practice T2 cannot beinfinite and T1 cannot be zero; therefore, we see that the e‰ciency can never be 1 or100%. For example, at a power plant, superheated steam at about 560�C (833 K) isused to drive a turbine for electricity generation. The steam is discharged to a coolingtower at 38�C (311 K). From Equation 4.7 we have
e‰ciency ¼ 833 K� 311 K
833 K¼ 0:63 or 63%
In reality, engines do not operate reversibly and when we include frictional loss andother complicating factors, the e‰ciency of a heat engine is considerably less thanthe theoretically estimated value. Most steam turbines operate at less than 40%e‰ciency.
The significance of Carnot’s result is that heat cannot be totally convertedto work—part of it is always discharged to the surroundings. In our example ofthe steam engine, as in other cases involving heat engines, the heat discharged to thecold reservoir is often called waste heat. Imagine constructing another heat engine toutilize the discharged heat to do work. Such a heat engine with T2 ¼ 311 K andT1 ¼ 298 K (the ambient temperature) would have a dismally low e‰ciency of 4.2%even under ideal conditions. Therefore, this heat is not captured and ends up only inenhancing the motions of air molecules (mostly translational and rotational). Incontrast, consider generating electricity at a hydroelectric plant by releasing water
* See any physical chemistry text listed on p. 6 for the derivation of Equation 4.7.
Heat source T2
Cold reservoir T1
Work wHeat
engine
q1
q 2
Figure 4.4A heat engine draws heat froma heat source to do work on thesurroundings and dischargessome of the heat to a coldreservoir.
4.2 Entropy 87

from a dam. In principle, all the gravitational potential energy of water can be con-verted to mechanical work (that is, to drive a turbine) because this process does notinvolve heat and is therefore not subject to the thermodynamic limitations in energyconversion. Compared to other forms of energy, heat is low grade. Alternately, wesay that energy is degraded when it is converted to heat.
This discussion of thermodynamic e‰ciency helps us understand the nature ofmany chemical and biological processes. In photosynthesis, for example, plants cap-ture the radiant energy from the sun to make complex molecules for growth andfunction. To do so, plants have evolved molecules like chlorophyll that can absorbconcentrated photon energy in the visible region to do chemical work. But if the high-energy portion of the radiation is allowed to degrade to heat, it will be too dispersedto be of any use. The e‰ciency of a hypothetical engine based on heated leaves as theheat source would be too low for any meaningful biosynthesis.
4.3 The Second Law of Thermodynamics
So far, our discussion of entropy changes has focused on the system. For a properunderstanding of entropy, we must also examine what happens to the surroundings.Because of its size and the amount of material it contains, the surroundings can bethought of as an infinitely large reservoir. Therefore, the exchange of heat and workbetween a system and its surroundings alters the properties of the surroundings byonly an infinitesimal amount. Because infinitesimal changes are characteristic of re-versible processes, it follows that any process has the same e¤ect on the surroundingsas a reversible process. Thus, regardless of whether a process is reversible or irre-versible with respect to the system, we can write the heat change in the surroundingsas
ðdqsurrÞrev ¼ ðdqsurrÞirrev ¼ dqsurr
For this reason, we shall not bother to specify the path for dqsurr. The change in en-tropy of the surroundings is
dSsurr ¼dqsurr
Tsurr
and for a finite isothermal process—that is, for a process that can be studied in thelaboratory,
DSsurr ¼qsurr
Tsurr
Returning to the isothermal expansion of an ideal gas, we saw earlier that theheat absorbed from the surroundings during a reversible process is nRTsys lnðV2=V1Þ,where Tsys is the temperature of the system. Because the system is at thermal equi-librium with its surroundings throughout the process, Tsys ¼ Tsurr ¼ T . The heat lostby the surroundings to the system is therefore �nRT lnðV2=V1Þ, and the corre-sponding change in entropy is
DSsurr ¼qsurr
T
88 Chapter 4: The Second Law of Thermodynamics

The total change in the entropy of the universe (system plus surroundings), DSuniv, isgiven by
DSuniv ¼ DSsys þ DSsurr
¼ qsys
Tþ qsurr
T
¼ nRT lnðV2=V1ÞT
þ ½�nRT lnðV2=V1Þ�T
¼ 0
Thus, for a reversible process, the total change in the entropy of the universe is equalto zero.
Now let us consider what happens if the expansion is irreversible. In the extremecase, we can assume that the gas is expanding against a vacuum. Again, the changein the entropy of the system is given by DSsys ¼ nR lnðV2=V1Þ because S is a statefunction. Because no work is done in this process, however, no heat is exchangedbetween the system and the surroundings. Therefore, we have qsurr ¼ 0 andDSsurr ¼ 0. The change in the entropy of the universe is now given by
DSuniv ¼ DSsys þ DSsurr
¼ nR lnðV2=V1Þ > 0
Combining these two expressions for DSuniv, we obtain
DSuniv ¼ DSsys þ DSsurr b 0 (4.8)
where the equality sign applies to a reversible process and the greater-than (>) signapplies to an irreversible (that is, spontaneous) process. Equation 4.8 is the mathe-matical statement of the second law of thermodynamics. In words, the second law maybe stated as follows: The entropy of an isolated system increases in an irreversible
process and remains unchanged in a reversible process. It can never decrease. Thus,either DSsys or DSsurr can be a negative quantity for a particular process, but theirsum can never be less than zero.
Example 4.2
A quantity of 0.50 mole of an ideal gas at 20�C expands isothermally against a constantpressure of 2.0 atm from 1.0 L to 5.0 L. Calculate the values of DSsys;DSsurr, and DSuniv.
A N S W E R
From the initial conditions, we can show that the pressure of the gas is 12 atm. First wecalculate the value of DSsys. Noting that the process is isothermal and DSsys is the samewhether the process is reversible or irreversible, we write, from Equation 4.3,
DSsys ¼ nR lnV2
V1
¼ ð0:50 molÞð8:314 J K�1 mol�1Þ ln 5:0 L
1:0 L
¼ 6:7 J K�1
Just thinking about entropyincreases its value in the uni-verse.
4.3 The Second Law of Thermodynamics 89

To calculate the value of DSsurr, we first determine the work done in the irreversiblegas expansion
w ¼ �PDV
¼ �ð2:0 atmÞð5:0� 1:0Þ L¼ �8:0 L atm
¼ �810 J ð1 L atm ¼ 101:3 JÞ
Because DU ¼ 0, q ¼ �w ¼ þ810 J. The heat lost by the surroundings must then be�810 J. The change in entropy of the surroundings is given by
DSsurr ¼qsurr
T
¼ �810 J
293 K
¼ �2:8 J K�1
Finally, from Equation 4.8,
DSuniv ¼ 6:7 J K�1 � 2:8 J K�1
¼ 3:9 J K�1
C O M M E N T
The result shows that the process is spontaneous, which is what we would expect giventhe initial pressure of the gas.
4.4 Entropy Changes
Having learned the statistical and thermodynamic definitions of entropy and exam-ined the second law of thermodynamics, we are now ready to study how variousprocesses a¤ect the entropy of the system. We have already seen that the entropychange for the reversible, isothermal expansion of an ideal gas is given bynR lnðV2=V1Þ. In this section, we shall consider several other examples of entropychanges.
Entropy Change Due to Mixing of Ideal Gases
Figure 4.5 shows a container in which nA moles of ideal gas A at T ;P, and VA
are separated by a partition from nB moles of ideal gas B at T ;P, and VB. When thepartition is removed, the gases mix spontaneously and the entropy of the systemincreases. To calculate the entropy of mixing, DmixS, we can treat the process as twoseparate, isothermal gas expansions.
For gas A DSA ¼ nAR lnVA þ VB
VA
For gas B DSB ¼ nBR lnVA þ VB
VB
90 Chapter 4: The Second Law of Thermodynamics

Therefore,
DmixS ¼ DSA þ DSB ¼ nAR lnVA þ VB
VAþ nBR ln
VA þ VB
VB
According to Avogadro’s law, volume is directly proportional to the number ofmoles of the gas at constant T and P, and so the above equation can be written as
DmixS ¼ nAR lnnA þ nB
nAþ nBR ln
nA þ nB
nB
¼ �nAR lnnA
nA þ nB� nBR ln
nB
nA þ nB
¼ �nAR ln xA � nBR ln xB
DmixS ¼ �RðnA ln xA þ nB ln xBÞ (4.9)
where xA and xB are the mole fractions of A and B, respectively. Because x < 1, itfollows that ln x < 0 and that the right side of Equation 4.9 is a positive quantity,which is consistent with the spontaneous nature of the process.*
Entropy Change Due to Phase Transitions
The melting of ice is a familiar phase change. At 0�C and 1 atm, ice and waterare in equilibrium. Under these conditions, heat is absorbed reversibly by the iceduring the melting process. Furthermore, because this is a constant-pressure process,the heat absorbed is equal to the enthalpy change of the system, so that qrev ¼ DfusH,where DfusH is called the heat or enthalpy of fusion. Note that because H is a statefunction, it is no longer necessary to specify the path, and the melting process neednot be carried out reversibly. The entropy of fusion, DfusS, is given by
DfusS ¼ DfusH
Tf(4.10)
*Because A and B are ideal gases, there are no intermolecular forces between the molecules, so noheat change results from the mixing. Consequently, the change in entropy of the surroundings iszero, and the direction of the process depends solely on the change in entropy of the system.
Equations 4.10 and 4.11 holdfor an isothermal process.
P,T P,T P,T
n nA nB V VA VBnA,VA nB,VB
Figure 4.5The mixing of two ideal gases at the same temperature and pressure leads to an increase inentropy.
4.4 Entropy Changes 91

where Tf is the fusion or melting point (273 K for ice). Similarly, we can write theentropy of vaporization, DvapS, as
DvapS ¼ DvapH
Tb
(4.11)
where DvapH and Tb are the enthalpy of vaporization and boiling point of the liquid,respectively.
Entropy Change Due to Heating
When the temperature of a system is raised from T1 to T2, its entropy alsoincreases. We can calculate this entropy increase as follows. Let S1 and S2 be theentropies of the system in states 1 and 2 (characterized by T1 and T2). If heat istransferred reversibly to the system, then the increase in entropy for an infinitesimalamount of heat transfer is given by Equation 4.5:
dS ¼ dqrev
T
The entropy at T2 is given by
S2 ¼ S1 þðT2
T1
dqrev
T
If we define this to be a constant-pressure process, as is usually the case, thendqrev ¼ dH, so that
S2 ¼ S1 þðT2
T1
dH
T
From Equation 3.19, we have dH ¼ CP dT , and so we can write
S2 ¼ S1 þðT2
T1
CP
TdT ¼ S1 þ
ðT2
T1
CP d lnT ð4:12Þ
If the temperature range is small, we can assume that CP is independent of tempera-ture. Then Equation 4.12 becomes
S2 ¼ S1 þ CP lnT2
T1ð4:13Þ
and the increase in entropy, DS, as a result of heating is
DS ¼ S2 � S1 ¼ CP lnT2
T1
DS ¼ nCP lnT2
T1(4.14)
Remember thatÐ dxx
¼Ðd ln x.
92 Chapter 4: The Second Law of Thermodynamics

Example 4.3
At constant pressure, 200 g of water is heated from 10�C to 20�C. Calculate the increasein entropy for this process. The molar heat capacity of water at constant pressure is75.3 J K�1 mol�1.
A N S W E R
The number of moles of water present is 200 g/18.02 g mol�1 ¼ 11:1 mol. The increasein entropy, according to Equation 4.14, is given by
DS ¼ ð11:1 molÞð75:3 J K�1 mol�1Þ ln 293 K
283 K
¼ 29:0 J K�1
C O M M E N T
For this calculation, we have assumed that CP is independent of temperature and thatwater does not expand when heated, so that no work is done.
Suppose that the heating of water in Example 4.3 had been carried out irrevers-ibly (as is the case in practice), say with a Bunsen burner. What would be the increasein entropy? We note that regardless of the path, the initial and final states are thesame; that is, 200 g of water heated from 10�C to 20�C. Therefore, the integral on theright side of Equation 4.12 gives DS for the irreversible heating. This conclusion fol-lows from the fact that DS depends only on T1 and T2 and not on the path. Thus, DSfor this process is 29.0 J K�1, whether the heating is done reversibly or irreversibly.
Example 4.4
Supercooled water is liquid water that has been cooled below its normal freezing point.This state is thermodynamically unstable and tends to freeze into ice spontaneously.Suppose we have 2.0 moles of supercooled water turning into ice at �10�C and 1.0 atm.Calculate the values of DSsys;DSsurr, and DSuniv for this process. The CP values of waterand ice for the temperature range between 0 and �10�C are 75.3 J K�1 mol�1 and37.7 J K�1 mol�1, respectively, and the molar heat of fusion of water is 6.01 kJ mol�1.
A N S W E R
First, we note that a change in phase is reversible only at the temperature at which thetwo phases are at equilibrium. Because supercooled water at �10�C and ice at �10�Care not at equilibrium, the freezing process is not reversible. To calculate the value ofDSsys, we devise a series of reversible steps by which supercooled water at �10�C isconverted to ice at �10�C (Figure 4.6).
Figure 4.6The spontaneous freezing of the supercooled water (thick arrow)at �10�C can be broken down into three reversible paths(1, 2, and 3).
4.4 Entropy Changes 93

Step 1. Reversible heating of supercooled water at �10�C to 0�C:
H2OðlÞ�10�C
! H2OðlÞ0�C
From Equation 4.14,
DS1 ¼ ð2:0 molÞð75:3 J K�1 mol�1Þ ln 273 K
263 K
¼ 5:6 J K�1
Step 2. Water freezes into ice at 0�C:
H2OðlÞ0�C
! H2OðsÞ0�C
According to Equation 4.10, the molar entropy of fusion is given by
DfusS ¼ DfusH
Tf
So, for the freezing of 2.0 moles of water we reverse the sign of DfusH and write
DS2 ¼ ð2:0 molÞ�6:01� 103 J mol�1
273 K
¼ �44:0 J K�1
Step 3. Reversible cooling of ice from 0�C to �10�C:
H2OðsÞ0�C
! H2OðsÞ�10�C
Again from Equation 4.14,
DS3 ¼ ð2:0 molÞð37:7 J K�1 mol�1Þ ln 263 K
273 K
¼ �2:8 J K�1
Finally,
DSsys ¼ DS1 þ DS2 þ DS3
¼ ð5:6� 44:0� 2:8Þ J K�1
¼ �41:2 J K�1
To calculate the value of DSsurr, we first determine the heat change in thesurroundings for each of the above steps.
Step 1. Heat gained by the supercooled water equals heat lost by the surroundings,given by
ðqsurrÞ1 ¼ �nCPDT
¼ �ð2:0 molÞð75:3 J K�1 mol�1Þð10 KÞ¼ �1:5� 103 J
Freezing is an exo-thermic process.
94 Chapter 4: The Second Law of Thermodynamics

Step 2. When the water freezes at 0�C, heat is given o¤ to the surroundings:
ðqsurrÞ2 ¼ ð2:0 molÞð6010 J mol�1Þ¼ 1:2� 104 J
Step 3. Cooling ice from 0�C to �10�C releases heat to the surroundings equal to
ðqsurrÞ3 ¼ ð2:0 molÞð37:7 J K�1 mol�1Þð10 KÞ¼ 754 J
The total heat change is given by
ðqsurrÞtotal ¼ ð�1:5� 103 þ 1:2� 104 þ 754Þ J¼ 1:1� 104 J
and the change in entropy at �10�C is
DSsurr ¼1:1� 104 J
263 K
¼ 41:8 J K�1
Finally,
DSuniv ¼ DSsys þ DSsurr
¼ �41:2 J K�1 þ 41:8 J K�1
¼ 0:6 J K�1
C O M M E N T
The result ðDSuniv > 0Þ confirms the statement that supercooled water is unstable andwill spontaneously freeze on standing. Note that in this process, the entropy of thesystem decreases because water is converted to ice. However, the heat released to thesurroundings results in an increase in the value of DSsurr that is greater (in magnitude)than DSsys, so the DSuniv value is positive.
4.5 The Third Law of Thermodynamics
In thermodynamics, we are normally interested only in changes in properties, such asDU and DH. Although we have no way of measuring the absolute values of internalenergy and enthalpy, we can find the absolute entropy of a substance. As written,Equation 4.12 enables us to measure the change in entropy over a suitable tempera-ture range between T1 and T2. Suppose we set the lower temperature to absolute zero(that is, T1 ¼ 0 K), and call the upper temperature T . Equation 4.12 now becomes
DS ¼ ST � S0 ¼ðT0
CP
TdT (4.15)
Because entropy is an extensive property, its value at any temperature T is equal tothe sum of the contributions from 0 K to the specified temperature. We can measureheat capacity as a function of temperature and calculate entropy changes, including
4.5 The Third Law of Thermodynamics 95
phase transitions, if any, to evaluate the integral in Equation 4.15. This approachpresents two obstacles, however. First, what is the entropy of a substance at absolutezero; that is, what is S0? Second, how do we account for the part of the contributionto the total entropy that lies between absolute zero and the lowest temperature atwhich measurements are feasible?
According to the Boltzmann equation (Equation 4.1), entropy is related to theprobability of a certain state occurring. We can also use W to denote the number ofmicrostates of a macroscopic system. The meaning of microstate in this context canbe illustrated by a hypothetical, perfect crystalline substance with no impurities orcrystal defects. Such a crystal can have only one particular arrangement of atoms ormolecules (that is, only one microstate). Consequently, W ¼ 1 and
S ¼ kB lnW ¼ kB ln 1 ¼ 0
This principle is known as the third law of thermodynamics, which states that everysubstance has a finite positive entropy, but at the absolute zero of temperature the en-
tropy may become zero, and it does in the case of a pure, perfect crystalline substance.Mathematically, the third law can be expressed as
LimT!0 K
S ¼ 0 ðperfect crystalline substanceÞ
At temperatures above absolute zero, thermal motion contributes to the entropy ofthe substance so that its entropy is no longer zero, even if it is pure and remainsperfectly crystalline. The significance of the third law is that it enables us to calculatethe absolute values of entropies, discussed below.
Third-Law or Absolute Entropies
The third law of thermodynamics enables us to measure the entropy of a sub-stance at temperature T . For a perfect crystalline substance, S0 ¼ 0, so Equation 4.15becomes
ST ¼ðT0
CP
TdT ¼
ðT0
CP d lnT ð4:16Þ
Now we can measure the heat capacity over the desired temperature range. For verylow temperatures (a15 K), for which such measurements are di‰cult to carry out,we can use Debye’s theory (after the Dutch–American physicist Peter Debye, 1884–1966) of heat capacity:
CP ¼ aT 3 ð4:17Þ
where a is a constant for a given substance. The entropy change over this smalltemperature range is
DS ¼ðT0
aT 3
TdT ¼
ðT0
aT 2 dT
Note that Equation 4.17 is applicable only near absolute zero. In applying Equation4.16, we must recall that it holds only for a perfectly ordered substance at 0 K. Figure4.7 shows a plot of S� versus temperature for substances in general, where the su-perscript denotes the standard state.
Contributions to S due tophase transitions must also beincluded in Equation 4.16.
96 Chapter 4: The Second Law of Thermodynamics

Entropy values calculated by using Equation 4.16 are called third-law or abso-lute entropies because these values are not based on some reference state. Table 4.1lists the absolute standard molar entropy values of a number of common elementsand compounds at 1 bar and 298 K. More data are given in Appendix 2. Note thatbecause these are absolute values, we omit the D sign and the subscript f for S�, butwe retain them for the molar standard enthalpies of formation ðDfH
�Þ.
Entropy of Chemical Reactions
We are now ready to calculate the entropy change that occurs in a chemical re-action. As for the enthalpy of reaction (see Equation 3.32), the change in entropy forthe hypothetical reaction
aAþ bB ! cCþ dD
Figure 4.7The increase in entropy of a perfect crystalline substancefrom absolute zero to its gaseous state at some temperature.Note the contributions to the S� value due to phase transitions(melting and boiling).
Table 4.1Standard Molar Entropies at 298 K and 1 Bar for Some Inorganic and OrganicSubstances
Substance S�=J �K�1 �mol�1 Substance S�=J �K�1 �mol�1
C(graphite) 5.7 CH4ðgÞ 186.2
C(diamond) 2.4 C2H6ðgÞ 229.5
COðgÞ 197.9 C3H8ðgÞ 269.9
CO2ðgÞ 213.6 C2H2ðgÞ 200.8
HFðgÞ 173.5 C2H4ðgÞ 219.5
HClðgÞ 186.5 C6H6ðlÞ 172.8
HBrðgÞ 198.7 CH3OHðlÞ 126.8
HIðgÞ 206.3 C2H5OHðlÞ 161.0
H2OðgÞ 188.7 CH3CHOðlÞ 160.2
H2OðlÞ 69.9 HCOOHðlÞ 129.0
NH3ðgÞ 192.5 CH3COOHðlÞ 159.8
NOðgÞ 210.6 C6H12O6ðsÞ 210.3
NO2ðgÞ 240.5 C12H22O11ðsÞ 360.2
N2O4ðgÞ 304.3
N2OðgÞ 220.0
O2ðgÞ 205.0
O3ðgÞ 237.7
SO2ðgÞ 248.5
For convenience, we shalloften omit ‘‘absolute’’ in refer-ring to the standard molar en-tropy values.
4.5 The Third Law of Thermodynamics 97

is given by the equation
DrS� ¼ cS�ðCÞ þ dS�ðDÞ � aS�ðAÞ � bS�ðBÞ
DrS� ¼ SnS�ðproductsÞ � SnS�ðreactantsÞ (4.18)
where n represents the stoichiometric coe‰cient.
Example 4.5
Calculate DSsys;DSsurr, and DSuniv for the synthesis of ammonia at 25�C:
N2ðgÞ þ 3H2ðgÞ ! 2NH3ðgÞ DrH� ¼ �92:6 kJ mol�1
A N S W E R
First we calculate DSsys. Using Equation 4.18 and the data in Appendix 2, we write
DSsys ¼ 2S�ðNH3Þ � ½S�ðN2Þ þ 3S�ðH2Þ�¼ ð2Þð192:5 J K�1 mol�1Þ � ½191:6 J K�1 mol�1 þ ð3Þð130:6 J K�1 mol�1Þ�¼ �198:4 J K�1 mol�1
To calculate DSsurr, we note that the system is in thermal equilibrium with thesurroundings. Because DHsurr ¼ �DHsys, DSsurr is given by
DSsurr ¼DHsurr
T
¼ �ð�92:6� 1000Þ J mol�1
298 K¼ 311 J K�1 mol�1
The change in entropy for the universe is
DSuniv ¼ DSsys þ DSsurr
¼ �198 J K�1 mol�1 þ 311 J K�1 mol�1
¼ 113 J K�1 mol�1
C O M M E N T
Because the DSuniv value is positive, we predict that the reaction is spontaneous at 25�C.Recall that just because a reaction is spontaneous does not mean that it will occur at anobservable rate. The synthesis of ammonia is, in fact, extremely slow at roomtemperature because it has a large activation energy. Thermodynamics can tell uswhether a reaction will occur spontaneously under specific conditions, but it does not sayhow fast it will occur. Reaction rates are the subject of chemical kinetics (Chapter 9).
The Meaning of Entropy
At this point we have defined entropy statistically and thermodynamically. Withthe third law of thermodynamics it is possible to determine the absolute entropy ofsubstances. We have seen some examples of entropy changes in physical processesand chemical reactions. But what is entropy, really?
98 Chapter 4: The Second Law of Thermodynamics

Frequently entropy is described as a measure of disorder or randomness. Thehigher the disorder, the greater the entropy of the system. While useful, these termsmust be used with caution because they are subjective concepts.* On the other hand,relating entropy to probability makes more sense because probability is a quantita-tive concept. Earlier we saw how gas expansion was viewed in terms of probability.In a spontaneous process, a system goes from a less probable state to a more pro-bable one. The corresponding change in entropy is calculated using the Boltzmannequation (Equation 4.1). The quantity W was identified with probability but in gen-eral it should be interpreted as the number of microscopic states or microstates thatcorresponds to a given macrostate.
To clarify the di¤erence between microstate and macrostate, consider a systemcomprising three identical, noninteracting molecules distributed over energy levelsand the total energy of the system is restricted to three units. How many di¤erentways can this distribution be accomplished? Although the molecules are identical,they can be distinguished from one another by their locations (for example, if theyoccupy di¤erent lattice points in a crystal). We see that there are ten ways (tenmicrostates) to distribute the molecules that make up three distinct distributions
(three macrostates), designated I, II, and III, as shown in Figure 4.8. Not all themacrostates are equally probable—macrostate II is six times more probable as I andtwice as probable as III. Based on this analysis, we conclude that the probability ofoccurence of a particular distribution (state) depends on the number of ways (micro-states) in which the distribution can be achieved. Three molecules do not constitute amacroscopic system, but as the number of molecules increases (and hence also thetotal energy of the system), we find that there will be one macrostate with many moremicrostates than the other distributions. When the number approaches Avogadro’snumber, say, the most probable macrostate will have such an overwhelming numberof microstates compared with all other macrostates that we will always find the sys-tem in this macrostate (Figure 4.9).
From this discussion we can say the following about entropy. Entropy is relatedto the distribution or spread of energy among the available molecular energy levels.At thermal equilibrium we always find the system in the most probable macrostate,which has the largest number of microstates and the most probable distribution of
* See D. F. Styer, Am. J. Phys. 68, 1090 (2000) and F. L. Lambert, J. Chem. Educ. 79, 187 (2002).
En
erg
y1
0
2
3
I II III
abc
bc ac ab
a cb
a a b c cb
aab c c b
aab cc b
WI 1 WII 6 WIII 3
Figure 4.8Arrangement of three molecules among energy levels with a total energy of three units.
Macrostate
Nu
mb
er
of
mic
rost
ate
s
Figure 4.9For an Avogadro’s number ofmolecules, the most probablemacrostate has an overwhelming-ly large number of microstatescompared to other macrostates.
4.5 The Third Law of Thermodynamics 99

energy. The greater the number of energy levels that have significant occupation, thelarger the entropy. It follows, therefore, that the entropy of a system is a maximum atequilibrium because W itself is a maximum. Equation 4.1 is not used to calculateentropy, however, because in general we do not know what W is. As mentionedearlier, entropy values are usually determined by calorimetric methods. Nevertheless,the molecular interpretation enables us to gain a better understanding of the natureof entropy and its changes. We consider a few examples below.
Isothermal Gas Expansion. In an expansion, the gas molecules move in a largervolume. As we shall see in Chapter 11 (p. aaa), the translational kinetic energy of amolecule is quantized and the energy of any particular level is inversely proportionalto the dimension of the container. It follows, therefore, that in the larger volume thelevels become more closely spaced and hence more accessible for distributing energy.Consequently, more energy levels will be occupied, resulting in an increased numberof microstates corresponding to the most probable macrostate and hence an increasein entropy.
Isothermal Mixing of Gases. The mixing of two gases at constant temperature can betreated as two separate gas expansions. Again, we predict an increase in entropy.
Heating. When the temperature of a substance is raised, the energy input is used topromote the molecular motions (translational, rotational, and vibrational) from thelow-lying levels to higher ones. The result is an increase in the occupancy among themolecular energy levels and hence the number of microstates. Consequently, therewill be an increase in entropy. This is what happens for heating at constant volume. Ifheating is carried out at constant pressure, there will be an additional contribution toentropy due to expansion. The di¤erence between constant volume and constantpressure conditions is significant only if the substance is a gas.
Phase Transitions. In a solid the atoms or molecules are confined to fixed positionsand the number of microstates is small. Upon melting, these atoms or molecules canoccupy many more positions as they move away from the lattice points. Conse-quently, the number of microstates increases because there are now many more waysto arrange the particles. Therefore, we predict this ‘‘order ! disorder’’ phase transi-tion to result in an increase in entropy because the number of microstates hasincreased. Similarly, we predict the vaporization process will also lead to an increasein the entropy of the system. The increase will be considerably greater than that formelting, however, because molecules in the gas phase occupy much more space andtherefore there are far more microstates than in the liquid phase.
Chemical Reactions. Referring to Example 4.5, we see that the synthesis of ammoniafrom nitrogen and hydrogen results in a net loss of two moles of gases per reactionunit. The decrease in molecular motions is reflected in fewer microstates so we wouldexpect to see a decrease in the entropy of the system. Because the reaction is exo-thermic, the heat released energizes the motions of the surrounding air molecules.The increase in the microstates of the air molecules leads to an increase in the entropyof the surroundings, which outweighs the decrease in the entropy of the system so thereaction is spontaneous. Keep in mind that prediction of entropy changes becomesless certain for reactions involving condensed phases or in cases where there are nochanges in the number of gaseous components.
100 Chapter 4: The Second Law of Thermodynamics

4.6 Gibbs Energy
With the first law of thermodynamics to take care of energy balance and the secondlaw to help us decide which processes can occur spontaneously, we might reasonablyexpect that we have enough thermodynamic quantities to deal with any situation.Although this expectation is true in principle, in practice, the equations we havederived so far are not the most convenient to apply. For example, to use the secondlaw (Equation 4.8), we must calculate the entropy change in both the system and thesurroundings. Because we are generally interested only in what happens in the systemand are not concerned with events in the surroundings, it would be simpler if wecould establish criteria for equilibrium and spontaneity in terms of the change in acertain thermodynamic function of the system and not of the entire universe, as forDSuniv.
Consider a system in thermal equilibrium with its surroundings at temperatureT . A process occurring in the system results in the transfer of an infinitesimal amountof heat, dq, from the system to the surroundings. Thus, we have �dqsys ¼ dqsurr. Thetotal change in entropy, according to Equation 4.8, is
dSuniv ¼ dSsys þ dSsurr b 0
¼ dSsys þdqsurr
Tb 0
¼ dSsys �dqsys
Tb 0
Note that every quantity on the right side of the above equation refers to the system.If the process takes place at constant pressure, then dqsys ¼ dHsys, or
dSsys �dHsys
Tb 0
Multiplying the equation above by �T , we obtain
dHsys � T dSsys a 0
We now define a function, called Gibbs energy* (after the American physicist JosiahWillard Gibbs, 1839–1903), G, as
G ¼ H � TS (4.19)
From Equation 4.19, we see that because H;T , and S are all state functions, G is alsoa state function. Further, like enthalpy, G has the units of energy.
At constant temperature, the change in the Gibbs energy of the system in aninfinitesimal process is given by
dGsys ¼ dHsys � T dSsys
The reversal of the inequalitysign follows from the fact thatif x > 0 then �x < 0.
*Gibbs energy was previously called Gibbs free energy or just free energy. However, IUPAC (theInternational Union of Pure and Applied Chemistry) has recommended that the free be dropped.The same recommendation applies to Helmholtz energy, to be discussed shortly.
4.6 Gibbs Energy 101

We can apply dGsys as a criterion for equilibrium and spontaneity as follows:
dGsys a 0 (4.20)
where the < sign denotes a spontaneous process and the equality sign denotes equi-librium at constant temperature and pressure.
Unless otherwise indicated, from now on we shall consider only the system in ourdiscussion of Gibbs energy changes. For this reason, the subscript sys will be omittedfor simplicity. For a finite isothermal process 1 ! 2, the change of Gibbs energy isgiven by
DG ¼ DH � TDS (4.21)
and the conditions of equilibrium and spontaneity at constant temperature andpressure are given by
DG ¼ G2 � G1 ¼ 0 system at equilibrium
DG ¼ G2 � G1 < 0 spontaneous process from 1 to 2
If DG is negative, the process is said to be exergonic (from the Greek word for ‘‘workproducing’’); if positive, the process is endergonic (work consuming). Note that pres-sure must be constant to set q ¼ DH, and temperature must be constant to deriveEquation 4.21. In general, we can replace q with DH only if pressure is constantthroughout the process. Because G is a state function, however, DG is independent ofpath. Therefore, Equation 4.21 applies to any process as long as the temperature andpressure are the same in the initial and final states.
Gibbs energy is useful because it incorporates both enthalpy and entropy. Insome reactions, the enthalpy and entropy contributions reinforce each other. Forexample, if DH is negative (an exothermic reaction) and DS is positive, thenðDH � TDSÞ or DG is a negative quantity, and the process is favored from left toright. In other reactions, enthalpy and entropy may work against each other; that is,DH and ð�TDSÞ have di¤erent signs. In such cases, the sign of DG is determined bythe magnitudes of DH and TDS. If jDHjg jTDSj, then the reaction is said to beenthalpy-driven because the sign of DG is predominantly determined by DH. Con-versely, if jTDSjg jDHj, then the process is entropy-driven. Table 4.2 shows howpositive and negative values of DH and DS a¤ect DG at di¤erent temperatures.
A similar thermodynamic function can be derived for processes in which thetemperature and volume are kept constant. Helmholtz energy (after the Germanphysiologist and physicist Hermann Ludwig Helmholtz, 1821–1894), A, is defined as
A ¼ U � TS (4.22)
where all the terms refer to the system. Like G;A is a state function and has the unitsof energy. Following the same procedure described above for Gibbs energy, we canshow that at constant temperature and volume, the criteria for equilibrium andspontaneity are given by
dAsys a 0 (4.23)
Omitting the subscript for system, we have, for a finite process at constant tempera-ture,
DA ¼ DU � TDS (4.24)
Constant-volume processes areless common in biological sys-tems.
102 Chapter 4: The Second Law of Thermodynamics

The Meaning of Gibbs Energy
Equation 4.20 provides us with an extremely useful criterion for dealing with thedirection of spontaneous changes and the nature of chemical and physical equilibria.In addition, it also enables us to determine the amount of work that can be done in agiven process.
To show the relationship between the change in Gibbs energy and work, we startwith the definition of G:
G ¼ H � TS
For an infinitesimal process,
dG ¼ dH � T dS � S dT
Now, because
H ¼ U þ PV
dH ¼ dU þ PdV þ V dP
According to the first law of thermodynamics,
dU ¼ dqþ dw
and
dU ¼ dq� PdV
For a reversible process,
dqrev ¼ T dS
Table 4.2Factors Affecting DG of a Reactiona
DH DS DG Example
þ þ Positive at low temperatures; negativeat high temperatures. Reactionspontaneous in the forward directionat high temperatures and spontaneousin the reverse direction at lowtemperatures.
2HgOðsÞ ! 2HgðlÞ þO2ðgÞ
þ � Positive at all temperatures. Reactionspontaneous in the reverse directionat all temperatures.
3O2ðgÞ ! 2O3ðgÞ
� þ Negative at all temperatures. Reactionspontaneous in the forward directionat all temperatures.
2H2O2ðlÞ ! 2H2OðlÞ þO2ðgÞ
� � Negative at low temperatures; positiveat high temperatures. Reactionspontaneous at low temperatures;tends to reverse at high temperatures.
NH3ðgÞ þHClðgÞ ! NH4ClðsÞ
aAssuming both DH and DS are independent of temperature.
4.6 Gibbs Energy 103

so that
dU ¼ T dS � PdV (4.25)
and
dH ¼ ðT dS � PdVÞ þ PdV þ V dP
¼ T dS þ V dP
Finally, we have
dG ¼ ðT dS þ V dPÞ � T dS � S dT
dG ¼ V dP� S dT (4.26)
Equation 4.25 incorporates the first and second laws, whereas Equation 4.26 showshow G depends on pressure and temperature. Both are important, fundamentalequations of thermodynamics.
Equation 4.26 holds for a process in which only expansion work occurs. If, inaddition to expansion work, another type of work is done, we must take that intoaccount. For example, for a redox reaction in an electrochemical cell that generateselectrons and does electrical work ðwelÞ, Equation 4.25 is modified to be
dU ¼ T dS � PdV þ dwel
and therefore
dG ¼ V dP� S dT þ dwel
where the subscript el denotes electrical. At constant P and T , we have
dG ¼ dwel; rev
and for a finite change
DG ¼ wel; rev ¼ wel;max (4.27)
This derivation shows that DG is the maximum nonexpansion work we can obtain fora process at constant P and T . We shall make use of Equation 4.27 when we discusselectrochemistry in Chapter 7.
Example 4.6
In a fuel cell, natural gases such as methane undergo the same redox reaction as in thecombustion process to produce carbon dioxide and water and generate electricity (seeSection 7.4). Calculate the maximum electrical work that can be obtained from 1 moleof methane at 25�C.
A N S W E R
The reaction is
104 Chapter 4: The Second Law of Thermodynamics

CH4ðgÞ þ 2O2ðgÞ ! CO2ðgÞ þ 2H2OðlÞ
From the DfH� and S� values in Appendix 2, we find that DrH ¼ �890:3 kJ mol�1 and
DrS ¼ �242:8 J K�1 mol�1. Therefore, from Equation 4.21
DrG ¼ �890:3 kJ mol�1 � 298 K�242:8 J K�1 mol�1
1000 J=kJ
!
¼ �818:0 kJ mol�1
From Equation 4.27 we write
wel;max ¼ �818:0 kJ mol�1
Thus, the maximum electrical work the system can do on the surroundings is equal to818.0 kJ per mole of CH4 reacted.
C O M M E N T
Two points of interest: First, because the reaction results in a decrease in entropy, theelectrical work done is less than the heat generated. Second, if the enthalpy ofcombustion were used to do work in a heat engine, then the e‰ciency of the heat-to-work conversion would be limited by Equation 4.7. In principle, 100% of the Gibbsenergy released in a fuel cell can be converted to work because the cell is not a heatengine and therefore is not governed by the second law restrictions.
4.7 Standard Molar Gibbs Energy of Formation (DfG˚)
As for enthalpy, we cannot measure the absolute value of Gibbs G�energies, and sofor convenience, we assign a value of zero to the standard molar Gibbs energy offormation of an element in its most stable allotropic form at 1 bar and 298 K. Againusing the combustion of graphite as an example (see Section 3.6):
CðgraphiteÞ þO2ðgÞ ! CO2ðgÞ
If the reaction is carried out with reactants at 1 bar being converted to products at1 bar, then the standard Gibbs energy change, DrG
�, for the reaction is
DrG� ¼ DfG
�ðCO2Þ � DfG�ðgraphiteÞ � DfG
�ðO2Þ
¼ DfG�ðCO2Þ
or
DfG�ðCO2Þ ¼ DrG
�
because the DfG� values for both graphite and O2 are zero. To determine the value of
DrG�, we use Equation 4.21
DrG� ¼ DrH
� � TDrS�
In Chapter 3 (p. aa), we saw that DrH� ¼ �393:5 kJ mol�1. To find the value of
4.7 Standard Molar Gibbs Energy of Formation (DfG˚) 105

DrS�, we use Equation 4.18 and the data in Appendix 2:
DrS� ¼ S�ðCO2Þ � S�ðgraphiteÞ � S�ðO2Þ
¼ ð213:6� 5:7� 205:0Þ J K�1 mol�1
¼ 2:9 J K�1 mol�1
Thus,
DrG� ¼ �393:5 kJ mol�1 � 298 K
2:9 J K�1 mol�1
1000 J=kJ
!
¼ �394:4 kJ mol�1
Finally, we arrive at the result:
DfG�ðCO2Þ ¼ �394:4 kJ mol�1
In this manner, we can determine the DfG� values of most substances. Table 4.3 lists
the DfG� values for a number of common inorganic and organic substances (a more
extensive listing is given in Appendix 2).In general, DrG
� for a reaction of the type
aAþ bB ! cCþ dD
is given by
DrG� ¼ cDfG
�ðCÞ þ dDfG�ðDÞ � aDfG
�ðAÞ � bDfG�ðBÞ
DrG� ¼ SnDfG
�ðproductsÞ � SnDfG�ðreactantsÞ (4.28)
Table 4.3Standard Molar Gibbs Energies of Formation at 1 Bar and 298 K for SomeInorganic and Organic Substances
Substance DfG�=kJ �mol�1 Substance DfG
�=kJ �mol�1
C(graphite) 0 CH4ðgÞ �50.79
C(diamond) 2.87 C2H6ðgÞ �32.9
COðgÞ �137.3 C3H8ðgÞ �23.49
CO2ðgÞ �394.4 C2H2ðgÞ 209.2
HFðgÞ �270.7 C2H4ðgÞ 68.12
HClðgÞ �95.3 C6H6ðlÞ 124.5
HBrðgÞ �53.45 CH3OHðlÞ �166.3
HIðgÞ 1.7 C2H5OHðlÞ �174.2
H2OðgÞ �228.6 CH3CHOðlÞ �128.1
H2OðlÞ �237.2 HCOOHðlÞ �361.4
NH3ðgÞ �16.6 CH3COOHðlÞ �389.9
NOðgÞ 86.7 C6H12O6ðsÞ �910.6
NO2ðgÞ 51.84 C12H22O11ðsÞ �1544.3
N2O4ðgÞ 98.29
N2OðgÞ 103.6
O3ðgÞ 163.4
SO2ðgÞ �300.4
SO3ðgÞ �370.4
106 Chapter 4: The Second Law of Thermodynamics

where n is the stoichiometric coe‰cient. In later chapters, we shall see that DrG� can
also be obtained from the equilibrium constant and electrochemical measurements.Because the Gibbs energy change is made up of two parts—enthalpy and tem-
perature times entropy—comparing their contributions to DrG� in a process is in-
structive. Consider the combustions of methane and glucose:
CH4ðgÞ þ 2O2ðgÞ ! CO2ðgÞ þ 2H2OðlÞ
C6H12O6ðsÞ þ 6O2ðgÞ ! 6CO2ðgÞ þ 6H2OðlÞ
Following the same procedure as that used for the combustion of graphite to formcarbon dioxide shown above, we obtain the following data:
C6H12O6
CH4
DrH� ¼ �2801:3 kJ mol�1
DrH� ¼ �890:3 kJ mol�1
�TDrS� ¼ �77:7 kJ mol�1
�TDrS� ¼ 72:3 kJ mol�1
DrG� ¼ �2879:0 kJ mol�1
DrG� ¼ �818:0 kJ mol�1
Figure 4.10 compares the changes for each reaction on a vector diagram.
4.8 Dependence of Gibbs Energy on Temperature and Pressure
Because Gibbs energy plays such a central role in chemical thermodynamics, under-standing its properties is important. Equation 4.26 shows that it is a function of bothpressure and temperature. Here, we shall see how the value of G changes with each ofthese variables and derive expressions for DG for a particular process under theseconditions.
Dependence of G on Temperature
We start with Equation 4.26:
dG ¼ V dP� S dT
At constant pressure, this equation becomes
dG ¼ �S dT
Figure 4.10Vector diagrams show the changes of DrH
�;�TDrS�, and DrG
� at 298 K for the combustionof (a) glucose and (b) methane.
4.8 Dependence of Gibbs Energy on Temperature and Pressure 107

so that the variation of G with respect to T at constant pressure is given by
qG
qT
� �P
¼ �S ð4:29Þ
Equation 4.19 now becomes
G ¼ H þ TqG
qT
� �P
Dividing the above equation by T 2 and rearranging, we obtain
� G
T 2þ 1
T
qG
qT
� �P
¼ � H
T 2
The left side of the above equation is the partial derivative of G=T with respect to T ;that is,
qG
T
� �qT
24
35P¼ � G
T 2þ 1
T
qG
qT
� �P
Therefore,
qG
T
� �qT
24
35P¼ � H
T 2ð4:30Þ
Equation 4.30 is known as the Gibbs–Helmholtz equation. When applied to a finiteprocess, G and H become DG and DH so that the equation becomes
qDG
T
� �qT
24
35P¼ �DH
T 2(4.31)
Equation 4.31 is important because it relates the temperature dependence of theGibbs energy change, and hence the position of equilibrium, to the enthalpy change.We shall return to this equation in Chapter 6.
Dependence of G on Pressure
To see how the Gibbs energy depends on pressure, we again employ Equation4.26. At constant temperature,
dG ¼ V dP
or
qG
qP
� �T
¼ V ð4:32Þ
108 Chapter 4: The Second Law of Thermodynamics

Because volume must be a positive quantity, Equation 4.32 says that the Gibbsenergy of a system always increases with pressure at constant temperature. We areinterested in how the value of G increases when the pressure of the system increasesfrom P1 to P2. We can write the change in G;DG, as the system goes from state 1 tostate 2 as
DG ¼ð21
dG ¼ G2 � G1 ¼ðP2
P1
V dP
For an ideal gas, V ¼ nRT=P, so that
DG ¼ G2 � G1 ¼ðP2
P1
nRT
PdP
DG ¼ nRT lnP2
P1(4.33)
If we set P1 ¼ 1 bar (the standard state), we can replace G1 with the symbol for thestandard state, G�;G2 by G, and P2 by P. Equation 4.33 now becomes
G ¼ G� þ nRT lnP
1 bar
Expressed in molar quantities,
G ¼ G� þ RT lnP
1 bar(4.34)
where G depends on both temperature and pressure, and G� is a function of temper-ature only. Equation 4.34 relates the molar Gibbs energy of an ideal gas to its pres-sure. Later, we shall see a similar equation relating the Gibbs energy of a substance toits concentration in a mixture.
Example 4.7
A 0.590-mol sample of an ideal gas initially at 300 K and 1.50 bar is compressedisothermally to a final pressure of 6.90 bar. Calculate the change in Gibbs energy for thisprocess.
A N S W E R
From Equation 4.33, we write
P1 ¼ 1:50 bar P2 ¼ 6:90 bar
so that
DG ¼ ð0:590 molÞð8:314 J K�1 mol�1Þð300 KÞ ln 6:90 bar
1:50 bar
¼ 2:25� 103 J
4.8 Dependence of Gibbs Energy on Temperature and Pressure 109

Thus far, we have focused on gases in discussing the dependence of G on pres-sure. Because the volume of a liquid or a solid is practically independent of appliedpressure, we write
G2 � G1 ¼ðP2
P1
V dP
¼ VðP2 � P1Þ ¼ VDP
or
G2 ¼ G1 þ VDP
The volume, V , is treated as a constant and may be taken outside the integral. Ingeneral, the Gibbs energies of liquids and solids are much less dependent on pressureso that the variation of G with P can be ignored, except when dealing with geologicalprocesses in Earth’s interior or specially created high-pressure conditions in the lab-oratory.
4.9 Phase Equilibria
In this section, we shall see how Gibbs energy can be applied to the study of phaseequilibria. A phase is a homogeneous part of a system that is in contact with otherparts of the system but separated from them by a well-defined boundary. Examples ofphase equilibria are physical processes such as freezing and boiling. In Chapter 6, weshall apply Gibbs energy to the study of chemical equilibria. Our discussion here isrestricted to one-component systems.
Consider that at some temperature and pressure, two phases, say solid and liq-uid, of a one-component system are in equilibrium. How do we formulate this con-dition? We might be tempted to equate the Gibbs energies as follows:
Gsolid ¼ Gliquid
But this formulation will not hold, for it is possible to have a small ice cube floatingin an ocean of water at 0�C, and yet the Gibbs energy of water is much larger thanthat of the ice cube. Instead, we must insist that the Gibbs energy per mole (or themolar Gibbs energy) of the substance, an intensive property, be the same in bothphases at equilibrium because intensive quantities are independent of the amountpresent:
Gsolid ¼ G liquid
If external conditions (temperature or pressure) were altered so that Gsolid > G liquid,then some solid would melt because
DG ¼ G liquid � Gsolid < 0
On the other hand, if Gsolid < G liquid, then some liquid would freeze spontaneously.Next, let us see how the molar Gibbs energies of solid, liquid, and vapor depend
on temperature and pressure. Equation 4.29 expressed in molar quantities becomes
qG
qT
� �P
¼ �S
110 Chapter 4: The Second Law of Thermodynamics

Because the entropy of a substance in any phase is always positive, a plot of G versusT at constant pressure gives us a line with a negative slope. For the three phases of asingle substance, we have*
qGsolid
qT
� �P
¼ �SsolidqG liquid
qT
� �P
¼ �SliquidqGvap
qT
� �P
¼ �Svap
At any temperature, the molar entropies of a substance decrease in the order
Svap gSliquid > Ssolid
These di¤erences are reflected in the slopes of lines shown in Figure 4.11. At hightemperatures, the vapor phase is the most stable, because it has the lowest molarGibbs energy. As temperature decreases, however, liquid becomes the stable phase,and finally, at even lower temperatures, solid becomes the most stable phase. Theintercept between the vapor and liquid lines is the point at which these two phases arein equilibrium—that is, Gvap ¼ G liquid. The corresponding temperature is Tb, theboiling point. Similarly, solid and liquid coexist in equilibrium at the temperature Tf ,the melting (or fusion) point.
How does an increase in pressure a¤ect the phase equilibria? In the previoussection, we saw that the Gibbs energy of a substance always increases with pressure(see Equation 4.32). Further, for a given change in pressure, the increase is greatestfor vapors, much less for liquids and solids. This result follows from Equation 4.32,expressed in molar quantities:
qG
qP
� �T
¼ V
The molar volume of a vapor is normally about a thousand times greater than thatfor a liquid or a solid.
Figure 4.12 shows the increases in the value of G for the three phases as thepressure increases from P1 to P2. We see that both Tf and Tb shift to higher values,but the shift in Tb is greater because of the larger increase in the value of G for the
*Although we use the terms gas and vapor interchangeably, strictly speaking, there is a di¤erence.A gas is a substance that is normally in the gaseous state at ordinary temperatures and pressures; avapor is the gaseous form of any substance that is a liquid or a solid at normal temperatures andpressures. Thus, at 25�C and 1 atm, we speak of water vapor and oxygen gas.
S
LV
Tf Tb
T
GFigure 4.11Dependence of molar Gibbs energy on temperature for the gas,liquid, and solid phases of a substance at constant pressure.The phase with the lowest G is the most stable phase at thattemperature. The intercept of the gas and liquid lines gives theboiling point (Tb) and that between the liquid and solid linesgives the melting point (Tf ).
4.9 Phase Equilibria 111

vapor. Thus, in general, an increase in external pressure will raise both the meltingpoint and boiling point of a substance. Although not shown in Figure 4.12, the re-verse also holds true; that is, decreasing the pressure will lower both the melting pointand boiling point. Keep in mind that our conclusion about the e¤ect of pressure onmelting point is based on the assumption that the molar volume of liquid is greaterthan that of solid. This assumption is true of most, but not all, substances. A keyexception is water. The molar volume of ice is actually greater than that of liquidwater, accounting for the fact that ice floats on water. For water, then, an increase inpressure will lower the melting point. More will be said about this property of waterlater.
The Clapeyron and the Clausius–Clapeyron Equations
We shall now derive some useful, general relations for the quantitative under-standing of phase equilibria. Consider a substance that exists in two phases, a and b.The condition for equilibrium at constant temperature and pressure is that
Ga ¼ Gb
so that
dGa ¼ dGb
To establish the relationship of dT to dP in the change that links these two phases,we have, from Equation 4.26,
dGa ¼ Va dP� Sa dT ¼ dGb ¼ Vb dP� Sb dT
ðSb � SaÞdT ¼ ðVb � VaÞdP
or
dP
dT¼ DS
DV
where DV and DS are the change in molar volume and molar entropies for the a ! b
Figure 4.12Pressure dependence of molar Gibbs energy. For the majorityof substances (water being the important exception), an increasein pressure leads to an increase in both the melting point andthe boiling point. (Here we have P2 > P1.)
112 Chapter 4: The Second Law of Thermodynamics

phase transition, respectively. Because DS ¼ DH=T at equilibrium, the above equa-tion becomes
dP
dT¼ DH
TDV(4.35)
where T is the phase transition temperature (it may be the melting point or the boil-ing point or any other temperature at which the two phases can coexist in equilib-rium). Equation 4.35 is known as the Clapeyron equation (after the French engineerBenoit-Paul-Emile Clapeyron, 1799–1864). This simple expression gives us the ratioof the change in pressure to the change in temperature in terms of some readilymeasurable quantities, such as molar volume and molar enthalpy change for theprocess. It applies to fusion, vaporization, and sublimation, as well as to equilibriabetween two allotropic forms, such as graphite and diamond.
The Clapeyron equation can be expressed in a convenient approximate formfor vaporization and sublimation equilibria. In these cases, the molar volume of thevapor is so much greater than that for the condensed phase, we can write
DvapV ¼ Vvap � VcondensedAVvap
Further, if we assume ideal-gas behavior, then
DvapVAVvap ¼RT
P
Substitution for DvapV in Equation 4.35 yields
dP
dT¼ PDvapH
RT 2
or
dP
P¼ d lnP ¼ DvapH dT
RT 2ð4:36Þ
Equation 4.36 is known as the Clausius–Clapeyron equation (after Clapeyron andthe German physicist Rudolf Julius Clausius, 1822–1888). Integrating Equation 4.36between limits of P1;T1 and P2;T2, we obtain
ðP2
P1
d lnP ¼ lnP2
P1¼ DvapH
R
ðT2
T1
dT
T 2¼ �DvapH
R
1
T2� 1
T1
� �
or
lnP2
P1¼ DvapH
R
ðT2 � T1ÞT1T2
(4.37)
We assume that DvapH is independent of temperature. If we had carried out an in-definite integral (integration without the limits), we could express lnP as a function oftemperature as follows:
lnP ¼ �DvapH
RTþ constant (4.38)
4.9 Phase Equilibria 113

Thus, a plot of lnP versus 1=T gives a straight line whose slope (which is negative) isequal to �DvapH=R.
Example 4.8
The following data show the variation of the vapor pressure of water as a function oftemperature:
P=mmHg 17:54 31:82 55:32 92:51 149:38 233:7
t=�C 20 30 40 50 60 70
Determine the molar enthalpy of vaporization for water.
A N S W E R
We need Equation 4.38. The first step is to convert the data into a suitable form forplotting:
lnP 2:865 3:460 4:013 4:527 5:007 5:454
K=T 3:41� 10�3 3:30� 10�3 3:19� 10�3 3:10� 10�3 3:00� 10�3 2:92� 10�3
103 K=T 3:41 3:30 3:19 3:10 3:00 2:92
Figure 4.13 shows the plot of lnP versus 1=T . From the measured slope, we have
�5090 K ¼ �DvapH
R
or
DvapH ¼ ð8:314 J K�1 mol�1Þð5090 KÞ
¼ 42:3 kJ mol�1
22.8 2.9 3.0 3.1 3.2 3.3 3.4
3
4
5
6
ln P Slope 5090 K
103K T
Figure 4.13Plot of lnP versus 1=T to deter-mine DvapH of water. Note thatthe same slope is obtainedwhether we express the pressureas mmHg or atm.
114 Chapter 4: The Second Law of Thermodynamics

C O M M E N T
The molar heat of vaporization for water measured at its normal boiling point is 40.79kJ mol�1. Because DvapH does depend on temperature to a certain extent, however, ourgraphically determined value is taken to be the average value between 20�C and 80�C.
Phase Diagrams
At this point, we are ready to examine the phase equilibria of some familiarsystems. The conditions at which a system exists as a solid, liquid, or vapor are con-veniently summarized in a phase diagram, which is a plot of pressure versus temper-ature. We shall consider the phase equilibria of water and carbon dioxide.
Water. Figure 4.14 shows the phase diagram of water, where S, L, and V representregions in which only one phase (solid, liquid, or vapor) can exist. Along any onecurve, however, the two corresponding phases can coexist. The slope of any curve isgiven by dP=dT . For example, the curve separating regions L and V shows how thevapor pressure of water varies with respect to temperature. At 373.15 K, its vaporpressure is 1 atm, and these conditions mark the normal boiling point of water. Notethat the L–V curve stops abruptly at the critical point, beyond which the liquid phasecannot exist. The normal freezing point of water (or melting point of ice) is similarlydefined by the S–L curve at 1 atm, which is 273.15 K. Finally, all three phases cancoexist at only one point called the triple point; for water, the triple point is atT ¼ 273:16 K and P ¼ 0:006 atm.
Example 4.9
Calculate the slope of the S–L curve at 273.15 K in atm K�1, given that DfusH ¼ 6:01kJ mol�1, VL ¼ 0:0180 L mol�1, and VS ¼ 0:0196 L mol�1.
A N S W E R
We need the Clapeyron equation (Equation 4.35):
dP
dT¼ DfusH
TfDfusV
x
Triple point
S
L
V
T
P
273.15 K
1 atm
0.006 atm
273.16 K 373.15 K
Figure 4.14Phase diagram of water. Note that the solid–liquid curvehas a negative slope. The liquid–vapor curve stops at x,the critical point (647.6 K and 219.5 atm).
4.9 Phase Equilibria 115
Using the conversion factor 1 J ¼ 9:87� 10�3 L atm, we obtain
dP
dT¼ ð6010 J mol�1Þð9:87� 10�3 L atm J�1Þ
ð273:15 KÞð0:0180� 0:0196Þ L mol�1
¼ �136 atm K�1
C O M M E N T
(1) Because the molar volume of liquid water is smaller than that for ice, the slope isnegative, as shown in Figure 4.14. Furthermore, because the quantity ðVL � VSÞ issmall, the slope is also quite steep. (2) An interesting result is obtained by calculating thequantity dT=dP, which gives the change (decrease) in melting point as a function ofpressure. We find that dT=dP ¼ �7:35� 10�3 K atm�1, which means that the meltingpoint of ice decreases by 7:35� 10�3 K whenever the pressure increases by 1 atm. Thise¤ect helps make ice skating possible. The weight of a skater exerts considerablepressure on the ice (of the order of 500 atm) because of the small area of the blades. Asice melts, the film of water formed between skates and ice acts as a lubricant to facilitatemovement over the ice. However, more detailed studies indicate that the frictional heatgenerated between the skates and ice is the main reason for ice melting.
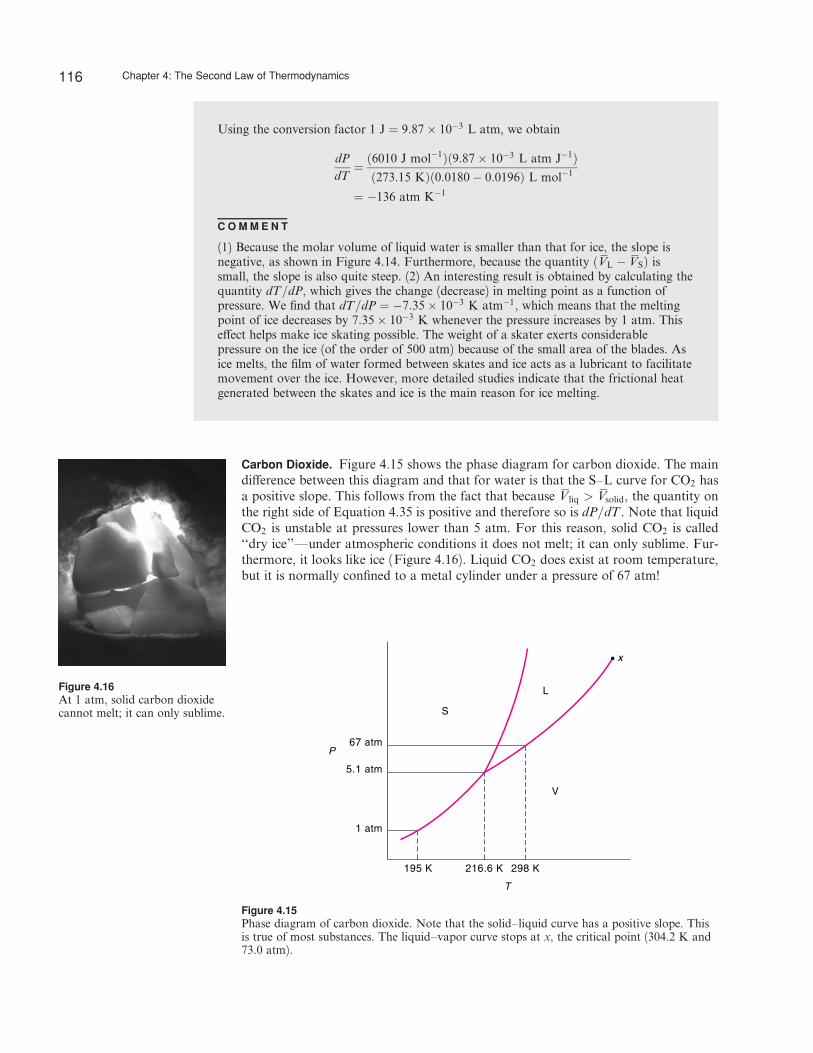
Carbon Dioxide. Figure 4.15 shows the phase diagram for carbon dioxide. The maindi¤erence between this diagram and that for water is that the S–L curve for CO2 hasa positive slope. This follows from the fact that because Vliq > Vsolid, the quantity onthe right side of Equation 4.35 is positive and therefore so is dP=dT . Note that liquidCO2 is unstable at pressures lower than 5 atm. For this reason, solid CO2 is called‘‘dry ice’’—under atmospheric conditions it does not melt; it can only sublime. Fur-thermore, it looks like ice (Figure 4.16). Liquid CO2 does exist at room temperature,but it is normally confined to a metal cylinder under a pressure of 67 atm!
x
S
L
V
T
P
195 K 216.6 K 298 K
67 atm
5.1 atm
1 atm
Figure 4.15Phase diagram of carbon dioxide. Note that the solid–liquid curve has a positive slope. Thisis true of most substances. The liquid–vapor curve stops at x, the critical point (304.2 K and73.0 atm).
Figure 4.16At 1 atm, solid carbon dioxidecannot melt; it can only sublime.
116 Chapter 4: The Second Law of Thermodynamics

The Phase Rule
To conclude our discussion of phase equilibria, let us consider a useful rule thatwas derived by Gibbs*:
f ¼ c� pþ 2 (4.39)
where c is the number of components and p is the number of phases present in asystem. The degree of freedom, f , gives the number of intensive variables (pressure,temperature, and composition) that can be changed independently without disturbingthe number of phases in equilibrium. For example, in a single-component, single-phase system (c ¼ 1, p ¼ 1), say, a gas in a container, the pressure and temperatureof the gas may be changed independently without changing the number of phases, sof ¼ 2, or the system has two degrees of freedom.
Now let us apply the phase rule to water ðc ¼ 1Þ. Figure 4.14 shows that in thepure phase region (S, L, or V) we have p ¼ 1 and f ¼ 2, meaning that the pressurecan be varied independently of temperature (two degrees of freedom). Along each ofthe S–L, L–V, or S–V boundaries, however, p ¼ 2, and f ¼ 1. Thus, for every valueof P, there can be only one specific value of T and vice versa (one degree of freedom).Finally, at the triple point, p ¼ 3 and f ¼ 0 (no degree of freedom). Under theseconditions, the system is totally fixed, and no variation of either the pressure or thetemperature is possible. Such a system is said to be invariant and is represented by apoint in a plot of pressure versus temperature.
4.10 Thermodynamics of Rubber Elasticity
In this section we shall see an application of thermodynamics functions to a systemother than gases—the familiar rubber band.
Natural rubber is poly-cis-isoprene and has the following repeating monomericunit:
H
CH2
C C
CH2
CH3
n
where n is in the hundreds. The characteristic property of rubber is its elasticity. Itcan be stretched up to 10 times its length, and, if released, will return to its originalsize. This behavior is due to the flexibility of rubber’s long-chain molecules. In thebulk state, rubber is a tangle of polymeric chains, and if the external force is strongenough, individual chains will slip past one another, causing the rubber to lose mostof its elasticity. In 1839, the American chemist Charles Goodyear (1800–1860)discovered that natural rubber could be cross-linked with sulfur to prevent chainslippage in a process called vulcanization. As Figure 4.17 shows, rubber in theunstretched state has many possible conformations and hence a greater entropy thanthe stretched state, which has relatively few conformations and a lower entropy.
When a rubber band is stretched elastically by a force, f , the work done, dw, isgiven by two terms:
dw ¼ f dl � PdV ð4:40Þ
The di¤erence in signs betweenf dl and PdV arises becausewhereas a positive dV denoteswork done by the system, apositive dl denotes work doneon the system.
*For derivation of the phase rule, see the physical chemistry texts listed on p. 6.
4.10 Thermodynamics of Rubber Elasticity 117

The first term is force times the extension. The second term is small, however, andcan usually be ignored. (The rubber band becomes thinner when stretched, but it alsogets longer so that the change in volume, dV , is negligible.) If the rubber band isstretched slowly, the restoring force is equal to the applied force at every stage and wecan therefore assume the process to be reversible and write
dwrev ¼ f dl ð4:41Þ
Treating this as a constant volume and temperature process, we start with the defi-nition of Helmholtz energy (Equation 4.22). For an infinitesimal change, the equa-tion takes the form
dA ¼ dU � T dS ð4:42Þ
For a reversible process, dqrev ¼ T dS so that Equation 4.42 becomes
dA ¼ dU � dqrev
From the first law of thermodynamics, dU ¼ dqrev þ dwrev, so that
dA ¼ dqrev þ dwrev � dqrev
¼ dwrev ð4:43Þ
Combining Equations 4.41 and 4.43 we write
dA ¼ f dl ð4:44Þ
We can now express the restoring force in terms of the Helmholtz energy as
f ¼ qA
ql
� �T
ð4:45Þ
From Equation 4.22,
A ¼ U � TS
we find the variation of A with extension l at constant temperature to be
qA
ql
� �T
¼ qU
ql
� �T
� TqS
ql
� �T
ð4:46Þ
Figure 4.17Unstretched rubber (left) has many more conformations than stretched rubber (right). Thelong chains of vulcanized rubber molecules are held together by sulfur linkages to preventslippage.
118 Chapter 4: The Second Law of Thermodynamics

Substituting Equation 4.46 into 4.45 we obtain
f ¼ qU
ql
� �T
� TqS
ql
� �T
ð4:47Þ
Equation 4.47 shows that there are two contributions to the restoring force—onefrom energy change with extension and the other from entropy change.
The restoring force of a stretched rubber band can be readily measured.* Figure4.18 shows a plot of the restoring force as a function of temperature. Note that theline has a positive slope, which means that ðqS=qlÞT is negative. This is consistentwith the notion that the polymer molecules become less tangled (fewer microstates) inthe stretched state, leading to a decrease in entropy. Experimental results also showthat the ðqU=qlÞT term (the intercept on the y axis) is 5–10 times smaller than theðqS=qlÞT term. The reason is that intermolecular forces between hydrocarbon mole-cules are relatively small so that the internal energy of the rubber band does not varyappreciably with extension. Therefore, the predominant contribution to the restoringforce is entropy, not energy. When a stretched rubber band snaps back to its originalposition, the process is largely driven by an increase in entropy!
Finally, it is interesting to note the analogy between the stretching of a rubberband and the compression of a gas. If the rubber and the gas behave ideally, then
qU
ql
� �T
¼ 0 ðrubberÞ andqU
qV
� �T
¼ 0 ðgasÞ
Ideal behavior for rubber means that intermolecular forces are independent of con-formations, whereas no intermolecular forces are present in an ideal gas. Similarly,the entropy of a rubber band decreases on stretching at constant temperature just asthe entropy of a gas decreases when it is compressed isothermally.
Suggestions for Further Reading
Books
Atkins, P. W. The Second Law, Scientific American Books,New York, 1984.
Bent, H. A. The Second Law, Oxford University Press,New York, 1965.
Edsall, J. T. and H. Gutfreund, Biothermodynamics, JohnWiley & Sons, New York, 1983.
Klotz, I. M. and R. M. Rosenberg, Chemical Thermo-
dynamics: Basic Theory and Methods, 6th ed., JohnWiley & Sons, New York, 2000.
McQuarrie, D. A. and J. D. Simon, Molecular Thermo-
dynamics, University Science Books, Sausalito, CA,1999.
Rock, P. A. Chemical Thermodynamics, University ScienceBooks, Sausalito, CA, 1983.
von Baeyer, H. C. Warmth Disperses and Time Passes,Random House, New York, 1998.
Articles
Entropy and the Second Law of Thermodynamics
‘‘The Second Law of Thermodynamics,’’ H. A. Bent, J.Chem. Educ. 39, 491 (1962).
‘‘States, Indistinguishability, and the Formula S ¼ k lnWin Thermodynamics,’’ J. Braunstein, J. Chem. Educ.
46, 719 (1969).‘‘Temperature-Entropy Diagrams,’’ A. Wood, J. Chem.
Educ. 47, 285 (1970).‘‘The Arrow of Time,’’ D. Layzer, Sci. Am. December
1975.‘‘Negative Absolute Temperature,’’ W. G. Proctor, Sci.
Am. August 1978.‘‘Reversibility and Returnability,’’ J. A. Campbell, J.
Chem. Educ. 57, 345 (1980).‘‘Heat-Fall and Entropy,’’ J. P. Lowe, J. Chem. Educ. 59,
353 (1982).
f
T
T
∂U∂
SlopeT
∂S∂
Figure 4.18Plot of restoring force in arubber band versus temperature.
* See J. P. Byrne, J. Chem. Educ. 71, 531 (1994).
4.10 Thermodynamics of Rubber Elasticity 119

‘‘Entropy and Unavailable Energy,’’ J. N. Spencer andE. S. Holmboe, J. Chem. Educ. 60, 1018 (1983).
‘‘A Simple Method for Showing that Entropy is aFunction of State,’’ P. Djurdjevic and I. Gutman, J.Chem. Educ. 65, 399 (1985).
‘‘Entropy: Conceptual Disorder,’’ J. P. Lowe, J. Chem.
Educ. 65, 403 (1988).‘‘Entropy Analyses of Four Familiar Processes,’’ N. C.
Craig, J. Chem. Educ. 65, 760 (1988).‘‘Order and Disorder and Entropies of Fusion,’’ D. F. R.
Gilson, J. Chem. Educ. 69, 23 (1992).‘‘Periodic Trends for the Entropy of Elements,’’ T. Thoms,
J. Chem. Educ. 72, 16 (1995).‘‘Thermodynamics and Spontaneity,’’ R. S. Ochs, J. Chem.
Educ. 73, 952 (1996).‘‘Entropy Diagrams,’’ N. C. Craig, J. Chem. Educ. 73, 716
(1996).‘‘Shu¿ed Cards, Messy Desks, and Disorderly Dorm
Rooms—Examples of Entropy Increase? Nonsense!’’F. L. Lambert, J. Chem. Educ. 76, 1385 (1999).
‘‘Entropy, Disorder, and Freezing,’’ B. B. Laird, J. Chem.
Educ. 76, 1388 (1999).‘‘Inside into Entropy,’’ D. F. Styer, Am. J. Phys. 68, 1090
(2000).‘‘Stories to Make Thermodynamics and Related Subjects
More Palatable,’’ L. S. Bartell, J. Chem. Educ. 78,1059 (2001).
‘‘Entropy Explained: The Origin of Some Simple Trends,’’L. A. Watson and O. Eisenstein, J. Chem. Educ. 79,1269 (2002).
The Third Law of Thermodynamics
‘‘Ice,’’ L. K. Runnels, Sci. Am. December 1966.‘‘The Third Law of Thermodynamics and the Residual
Entropy of Ice,’’ M. M. Julian, F. H. Stillinger, andR. R. Festa, J. Chem. Educ. 60, 65 (1983).
Phase Equilibria
‘‘The Triple Point of Water,’’ F. L. Swinton, J. Chem.
Educ. 44, 541 (1967).‘‘Reappearing Phases,’’ J. Walker and C. A. Vanse, Sci.
Am. May 1987.‘‘Subtleties of Phenomena Involving Ice-Water Equilibria,’’
L. F. Loucks, J. Chem. Educ. 63, 115 (1986). Also seeJ. Chem. Educ. 65, 186 (1988).
‘‘Supercritical Phase Transitions at Very High Pressure,’’K. M. Scholsky, J. Chem. Educ. 66, 989 (1989).
‘‘The Direct Relation Between Altitude and BoilingPoint,’’ B. L. Earl, J. Chem. Educ. 67, 45 (1990).
‘‘Phase Diagrams of One-Component Systems,’’ G. D.Peckham and I. J. McNaught, J. Chem. Educ. 70, 560(1993).
‘‘Melting Below Zero,’’ J. S. Wettlaufer and J. G. Dash,Sci. Am. February 2000.
General
‘‘The Synthesis of Diamond,’’ H. Hall, J. Chem. Educ. 38,484 (1961).
‘‘Chance,’’ A. J. Ayer, Sci. Am. October 1965.‘‘The Use and Misuse of the Laws of Thermodynamics,’’
M. L. McGlashan, J. Chem. Educ. 43, 226 (1966).‘‘Maxwell’s Demon,’’ W. Ehrenberg, Sci. Am. November
1967.‘‘The Scope and Limitations of Thermodynamics,’’ K. G.
Denbigh, Chem. Brit. 4, 339 (1968).‘‘Thermodynamics of Hard Molecules,’’ L. K. Runnels, J.
Chem. Educ. 47, 742 (1970).‘‘The Thermodynamic Transformation of Organic
Chemistry,’’ D. E. Stull, Am. Sci. 54, 734 (1971).‘‘Introduction to the Thermodynamics of Biopolymer
Growth,’’ C. Kittel, Am. J. Phys. 40, 60 (1972).‘‘High Pressure Synthetic Chemistry,’’ A. P. Hagen, J.
Chem. Educ. 55, 620 (1978).‘‘Conversion of Standard Thermodynamic Data to the
New Standard-State Pressure,’’ R. D. Freeman, J.Chem. Educ. 62, 681 (1985).
‘‘Student Misconceptions in Thermodynamics,’’ M. F.Granville, J. Chem. Educ. 62, 847 (1985).
‘‘Demons, Engines, and the Second Law,’’ C. H. Bennett,Sci. Am. November 1987.
‘‘The True Meaning of Isothermal,’’ D. Fain, J. Chem.
Educ. 65, 187 (1988).‘‘The Conversion of Chemical Energy,’’ D. J. Wink, J.
Chem. Educ. 69, 109 (1992).‘‘The Thermodynamics of Home-Made Ice Cream,’’ D. L.
Gibbon, K. Kennedy, N. Reading, and M. Quierox,J. Chem. Educ. 69, 658 (1992).
‘‘The Gibbs Function Controversy,’’ S. E. Wood and R. B.Battino, J. Chem. Educ. 73, 408 (1996).
‘‘How Thermodynamic Data and Equilibrium ConstantsChanged When the Standard-State Pressure Became1 Bar,’’ R. S. Treptow, J. Chem. Educ. 76, 212 (1999).
120 Chapter 4: The Second Law of Thermodynamics

Problems
The Second Law of Thermodynamics and EntropyChanges
4.1 Comment on the statement: ‘‘Even thinking aboutentropy increases its value in the universe.’’
4.2 One of the many statements of the second law ofthermodynamics is: Heat cannot flow from a colderbody to a warmer one without external aid. Assumetwo systems, 1 and 2, at T1 and T2 ðT2 > T1Þ. Showthat if a quantity of heat q did flow spontaneously from1 to 2, the process would result in a decrease in entropyof the universe. (You may assume that the heat flowsvery slowly so that the process can be regarded as re-versible. Assume also that the loss of heat by system 1and the gain of heat by system 2 do not a¤ect T1 andT2.)
4.3 A ship sailing in the Indian Ocean takes the warmersurface water at 32�C to run a heat engine that powersthe ship and discharges the used water back to the sur-face of the sea. Does this scheme violate the second lawof thermodynamics? If so, what change would youimplement to make it work?
4.4 Molecules of a gas at any temperature T above theabsolute zero are in constant motion. Does this ‘‘perpet-ual motion’’ violate the laws of thermodynamics?
4.5 According to the second law of thermodynamics,the entropy of an irreversible process in an isolated sys-tem must always increase. On the other hand, it is wellknown that the entropy of living systems remains small.(For example, the synthesis of highly complex proteinmolecules from individual amino acids is a process thatleads to a decrease in entropy.) Is the second law invalidfor living systems? Explain.
4.6 On a hot summer day, a person tries to cool himselfby opening the door of a refrigerator. Is this a wiseaction, thermodynamically speaking?
4.7 The molar heat of vaporization of ethanol is 39.3kJ mol�1, and the boiling point of ethanol is 78:3�C.Calculate the value of DvapS for the vaporization of0.50 mole of ethanol.
4.8 Calculate the values of DU ;DH, and DS for the fol-lowing process:
1 mole of liquid water 1 mole of steamat 25�C and 1 atm
!at 100�C and 1 atm
The molar heat of vaporization of water at 373 K is40.79 kJ mol�1, and the molar heat capacity of water is75.3 J K�1 mol�1. Assume the molar heat capacity tobe temperature independent and ideal-gas behavior.
4.9 Calculate the value of DS in heating 3.5 moles of amonatomic ideal gas from 50�C to 77�C at constantpressure.
4.10 A quantity of 6.0 moles of an ideal gas is revers-ibly heated at constant volume from 17�C to 35�C. Cal-
culate the entropy change. What would be the value ofDS if the heating were carried out irreversibly?
4.11 One mole of an ideal gas is first, heated at con-stant pressure from T to 3T and second, cooled back toT at constant volume. (a) Derive an expression for DSfor the overall process. (b) Show that the overall processis equivalent to an isothermal expansion of the gas at Tfrom V to 3V , where V is the original volume. (c) Showthat the value of DS for the process in (a) is the same asthat in (b).
4.12 A quantity of 35.0 g of water at 25:0�C (called A)is mixed with 160.0 g of water at 86:0�C (called B).(a) Calculate the final temperature of the system,assuming that the mixing is carried out adiabatically.(b) Calculate the entropy change of A, B, and the entiresystem.
4.13 The heat capacity of chlorine gas is given by
CP ¼ ð31:0þ 0:008TÞ J K�1 mol�1
Calculate the entropy change when 2 moles of gas areheated from 300 K to 400 K at constant pressure.
4.14 A sample of neon (Ne) gas initially at 20�C and1.0 atm is expanded from 1.2 L to 2.6 L and simulta-neously heated to 40�C. Calculate the entropy changefor the process.
4.15 One of the early experiments in the developmentof the atomic bomb was to demonstrate that 235U andnot 238U is the fissionable isotope. A mass spectrometerwas employed to separate 235UF6 from
238UF6. Calcu-late the value of DS for the separation of 100 mg of themixture of gas, given that the natural abundances of235U and 238U are 0.72% and 99.28%, respectively, andthat of 19F is 100%.
4.16 One mole of an ideal gas at 298 K expands iso-thermally from 1.0 L to 2.0 L (a) reversibly and(b) against a constant external pressure of 12.2 atm.Calculate the values of DSsys;DSsurr, and DSuniv in bothcases. Are your results consistent with the nature of theprocesses?
4.17 The absolute molar entropies of O2 and N2 are205 J K�1 mol�1 and 192 J K�1 mol�1, respectively, at25�C. What is the entropy of a mixture made up of 2.4moles of O2 and 9.2 moles of N2 at the same tempera-ture and pressure?
4.18 A quantity of 0.54 mole of steam initially at 350�Cand 2.4 atm undergoes a cyclic process for whichq ¼ �74 J. Calculate the value of DS for the process.
4.19 Predict whether the entropy change is positive ornegative for each of the following reactions at 298 K:
(a) 4FeðsÞ þ 3O2ðgÞ ! 2Fe2O3ðsÞ(b) OðgÞ þOðgÞ ! O2ðgÞ(c) NH4ClðsÞ ! NH3ðgÞ þHClðgÞ(d) H2ðgÞ þ Cl2ðgÞ ! 2HClðgÞ
Problems 121

4.20 Use the data in Appendix 2 to calculate the valuesof DrS
� of the reactions listed in the previous problem.
4.21 A quantity of 0.35 mole of an ideal gas initially at15:6�C is expanded from 1.2 L to 7.4 L. Calculate thevalues of w; q;DU , and DS if the process is carried out(a) isothermally and reversibly, and (b) isothermally andirreversibly against an external pressure of 1.0 atm.
4.22 One mole of an ideal gas is isothermally expandedfrom 5.0 L to 10 L at 300 K. Compare the entropychanges for the system, surroundings, and the universeif the process is carried out (a) reversibly, and (b) irre-versibly against an external pressure of 2.0 atm.
4.23 The heat capacity of hydrogen may be representedby
CP ¼ ð1:554þ 0:0022TÞ J K�1 mol�1
Calculate the entropy changes for the system, surround-ings, and the universe for the (a) reversible heating, and(b) irreversible heating of 1.0 mole of hydrogen from300 K to 600 K. [Hint: In (b), assume the surroundingsto be at 600 K.]
4.24 Consider the reaction
N2ðgÞ þO2ðgÞ ! NOðgÞ
Calculate the values of DrS� for the reaction mixture,
surroundings, and the universe at 298 K. Why is yourresult reassuring to Earth’s inhabitants?
The Third Law of Thermodynamics
4.25 The DfH� values can be negative, zero, or posi-
tive, but the S� values can be only zero or positive.Explain.
4.26 Choose the substance with the greater molarentropy in each of the following pairs: (a) H2OðlÞ,H2OðgÞ, (b) NaClðsÞ, CaCl2ðsÞ, (c) N2 (0.1 atm), N2
(1 atm), (d) C (diamond), C (graphite), (e) O2ðgÞ, O3ðgÞ,(f ) ethanol (C2H5OH), dimethly ether (C2H6O),(g) N2O4ðgÞ, 2NO2ðgÞ, and (h) FeðsÞ at 298 K, FeðsÞ at398 K. (Unless otherwise stated, assume the tempera-ture is 298 K.)
4.27 Explain why the value of S� (graphite) is greaterthan that of S� (diamond) at 298 K (see Appendix 2).Would this inequality hold at 0 K?
Gibbs Energy
4.28 A quantity of 0.35 mole of an ideal gas initially at15:6�C is expanded from 1.2 L to 7.4 L. Calculate thevalues of w; q;DU ;DH;DS, and DG if the process iscarried out (a) isothermally and reversibly, and (b) iso-thermally and irreversibly against an external pressureof 1.0 atm.
4.29 At one time, the domestic gas used for cooking,called ‘‘water gas,’’ was prepared as follows:
H2OðgÞ þ CðgraphiteÞ ! COðgÞ þH2ðgÞ
From the thermodynamic quantities listed in Appendix2, predict at what temperature the reaction will favorthe formation of products. Assume DrH
� and DrS� are
temperature independent.
4.30 Use the values listed in Appendix 2 to calculatethe value of DrG
� for the following alcohol fermenta-tion:
a-d-glucoseðaqÞ ! 2C2H5OHðlÞ þ 2CO2ðgÞ
ðDfG�½a-d-glucose(aq)] ¼ �914:5 kJ mol�1)
4.31 As an approximation, we can assume that proteinsexist either in the native (or physiologically functioning)state or the denatured state. The standard molarenthalpy and entropy of the denaturation of a certainprotein are 512 kJ mol�1 and 1.60 kJ K�1 mol�1, re-spectively. Comment on the signs and magnitudes ofthese quantities, and calculate the temperature at whichthe denaturation becomes spontaneous.
4.32 Certain bacteria in the soil obtain the necessaryenergy for growth by oxidizing nitrite to nitrate:
2NO�2 ðaqÞ þO2ðgÞ ! 2NO�
3 ðaqÞ
Given that the standard Gibbs energies of formation ofNO�
2 and NO�3 are �34:6 kJ mol�1 and �110:5
kJ mol�1, respectively, calculate the amount of Gibbsenergy released when 1 mole of NO�
2 is oxidized to 1mole of NO�
3 .
4.33 Consider the synthesis of urea according to theequation
CO2ðgÞ þ 2NH3ðgÞ ! ðNH2Þ2COðsÞ þH2OðlÞ
From the data listed in Appendix 2, calculate the valueof DrG
� for the reaction at 298 K. Assuming ideal-gasbehavior, calculate the value of DrG for the reaction ata pressure of 10.0 bar. The DfG
� of urea is �197:15kJ mol�1.
4.34 This problem involves the synthesis of diamondfrom graphite:
CðgraphiteÞ ! CðdiamondÞ
(a) Calculate the values of DrH� and DrS
� for the reac-tion. Will the conversion be favored at 25�C or anyother temperature? (b) From density measurements, themolar volume of graphite is found to be 2.1 cm3 greaterthan that of diamond. Can the conversion of graphiteto diamond be brought about at 25�C by applyingpressure on graphite? If so, estimate the pressure atwhich the process becomes spontaneous. [Hint: Start-ing from Equation 4.32, derive the equationDG ¼ ðVdiamond � VgraphiteÞDP for a constant-
122 Chapter 4: The Second Law of Thermodynamics

temperature process. Next, calculate the DP value thatwould lead to the necessary decrease in Gibbs energy.]
4.35 A student placed 1 g of each of three compoundsA, B, and C in a container and found that no changehad occurred after one week. O¤er possible explana-tions for the lack of reaction. Assume that A, B, and Care totally miscible liquids.
4.36 Predict the signs of DH;DS, and DG of the systemfor the following processes at 1 atm: (a) ammonia meltsat �60�C, (b) ammonia melts at �77:7�C, and (c) am-monia melts at �100�C. (The normal melting point ofammonia is �77:7�C.)
4.37 Crystallization of sodium acetate from a super-saturated solution occurs spontaneously. What can youdeduce about the signs of DS and DH?
4.38 A student looked up the DfG�;DfH
�, and S�
values for CO2 in Appendix 2. Plugging these valuesinto Equation 4.21, he found that DfG
� 0DfH� � TS�
at 298 K. What is wrong with his approach?
4.39 A certain reaction is spontaneous at 72�C. Ifthe enthalpy change for the reaction is 19 kJ, what isthe minimum value of DrS (in joules per kelvin) for thereaction?
4.40 A certain reaction is known to have a DrG� value
of �122 kJ. Will the reaction necessarily occur if thereactants are mixed together?
Phase Equilibria
4.41 The vapor pressure of mercury at various temper-atures has been determined as follows:
T/K P/mmHg
323 0.0127
353 0.0888
393.5 0.7457
413 1.845
433 4.189
Calculate the value of DvapH for mercury.
4.42 The pressure exerted on ice by a 60.0-kg skater isabout 300 atm. Calculate the depression in freezingpoint. The molar volumes are VL ¼ 0:0180 L mol�1 andVS ¼ 0:0196 L mol�1.
4.43 Use the phase diagram of water (Figure 4.14) topredict the direction for the following changes: (a) atthe triple point of water, temperature is lowered at con-stant pressure, and (b) somewhere along the S–L curveof water, pressure is increased at constant temperature.
4.44 Use the phase diagram of water (Figure 4.14) topredict the dependence of the freezing and boilingpoints of water on pressure.
4.45 Consider the following system at equilibrium
CaCO3ðsÞ Ð CaOðsÞ þ CO2ðgÞ
How many phases are present?
4.46 Below is a rough sketch of the phase diagram ofcarbon. (a) How many triple points are there, and whatare the phases that can coexist at each triple point?(b) Which has a higher density, graphite or diamond?(c) Synthetic diamond can be made from graphite.Using the phase diagram, how would you go aboutmaking diamond?
4.47 What is wrong with the following phase diagramfor a one-component system?
4.48 The plot in Figure 4.13 is no longer linear at hightemperatures. Explain.
4.49 Pike’s Peak in Colorado is approximately 4,300 mabove sea level ð0�CÞ. What is the boiling point ofwater at the summit? (Hint: See Problem 2.87. Themolar mass of air is 29.0 g mol�1, and DvapH for wateris 40.79 kJ mol�1.)
4.50 The normal boiling point of ethanol is 78:3�C, andits molar enthalpy of vaporization is 39.3 kJ mol�1.What is its vapor pressure at 30�C?
Additional Problems
4.51 Entropy has sometimes been described at ‘‘time’sarrow’’ because it is the property that determines theforward direction of time. Explain.
4.52 State the condition(s) under which the followingequations can be applied: (a) DS ¼ DH=T , (b) S0 ¼ 0,(c) dS ¼ CP dT=T , and (d) dS ¼ dq=T .
4.53 Without referring to any table, predict whether theentropy change is positive, nearly zero, or negative foreach of the following reactions:
(a) N2ðgÞ þO2ðgÞ ! 2NOðgÞ
Problems 123

(b) 2MgðsÞ þO2ðgÞ ! 2MgOðsÞ(c) 2H2O2ðlÞ ! 2H2OðlÞ þO2ðgÞ(d) H2ðgÞ þ CO2ðgÞ ! H2OðgÞ þ COðgÞ4.54 Calculate the entropy change when neon at 25�Cand 1.0 atm in a container of volume 0.780 L is allowedto expand to 1.25 L and is simultaneously heated to85�C. Assume ideal behavior. (Hint: Because S is astate function, you can first calculate the value of DSfor expansion and then calculate the value of DS forheating at constant final volume.)
4.55 Photosynthesis makes use of photons of visiblelight to bring about chemical changes. Explain whyheat energy in the form of infrared photons is ine¤ectivefor photosynthesis.
4.56 One mole of an ideal monatomic gas is com-pressed from 2.0 atm to 6.0 atm while being cooledfrom 400 K to 300 K. Calculate the values of DU ;DH,and DS for the process.
4.57 The three laws of thermodynamics are sometimesstated colloquially as follows: First law: You cannot getsomething for nothing; Second law: The best you cando is break even; Third law: You cannot break even.Provide a scientific basis for each of these statements.(Hint: One consequence of the third law is that it is im-possible to attain the absolute zero of temperature.)
4.58 Use the following data to determine the normalboiling point, in kelvins, of mercury. What assumptionsmust you make to do the calculation?
HgðlÞ: DfH� ¼ 0 ðby definitionÞ
S� ¼ 77:4 J K�1 mol�1
HgðgÞ: DfH� ¼ 60:78 kJ mol�1
S� ¼ 174:7 J K�1 mol�1
4.59 Trouton’s rule states that the ratio of the molarenthalpy of vaporization of a liquid to its boiling pointin kelvins is approximately 90 J K�1 mol�1. (a) Use thefollowing data to show that this is the case and explainwhy Trouton’s rule holds true.
tbp/�C DvapH/kJ �mol�1
Benzene 80.1 31.0
Hexane 68.7 30.8
Mercury 357 59.0
Toluene 110.6 35.2
(b) Trouton’s rule does not hold for ethanol(tbp ¼ 78:3�C, DvapH ¼ 39:3 kJ mol�1) and water(tbp ¼ 100�C, DvapH ¼ 40:79 kJ mol�1). Explain.(c) The ratio in (a) is considerably smaller for liquidHF. Why?
4.60 Give a detailed example of each of the following,with an explanation: (a) a thermodynamically spontane-ous process; (b) a process that would violate the first
law of thermodynamics; (c) a process that would violatethe second law of thermodynamics; (d) an irreversibleprocess; and (e) an equilibrium process.
4.61 In the reversible adiabatic expansion of an idealgas, there are two contributions to entropy changes: theexpansion of the gas and the cooling of the gas. Showthat these two contributions are equal in magnitude butopposite in sign. Show also that for an irreversible adia-batic gas expansion, these two contributions are nolonger equal in magnitude. Predict the sign of DS.
4.62 Superheated water is water heated above 100�Cwithout boiling. As for supercooled water (see Example4.4), superheated water is thermodynamically unstable.Calculate the values of DSsys;DSsurr, and DSuniv when1.5 moles of superheated water at 110�C and 1.0 atmare converted to steam at the same temperature andpressure. (The molar enthalpy of vaporization of wateris 40.79 kJ mol�1, and the molar heat capacities ofwater and steam in the temperature range 100–110�Care 75.5 J K�1 mol�1 and 34.4 J K�1 mol�1, respec-tively.)
4.63 Toluene (C7H8) has a dipole moment, whereasbenzene (C6H6) is nonpolar:
Explain why, contrary to our expectation, benzenemelts at a much higher temperature than toluene. Whyis the boiling point of toluene higher than that of ben-zene?
4.64 Give the conditions under which each of thefollowing equations may be applied: (a) dAa 0 (forequilibrium and spontaneity), (b) dGa 0 (for equilib-
rium and spontaneity), (c) lnP2
P1¼ DH
R
ðT2 � T1ÞT1T2
, and
(d) DG ¼ nRT lnP2
P1.
4.65 When ammonium nitrate is dissolved in water, thesolution becomes colder. What conclusion can youdraw about DS� for the process?
4.66 Protein molecules are polypeptide chains made upof amino acids. In their physiologically functioning ornative state, these chains fold in a unique manner suchthat the nonpolar groups of the amino acids are usuallyburied in the interior region of the proteins, where thereis little or no contact with water. When a protein dena-tures, the chain unfolds so that these nonpolar groupsare exposed to water. A useful estimate of the changesof the thermodynamic quantities as a result of denatura-tion is to consider the transfer of a hydrocarbon such asmethane (a nonpolar substance) from an inert solvent
124 Chapter 4: The Second Law of Thermodynamics

(such as benzene or carbon tetrachloride) to the aque-ous environment:
(a) CH4(inert solvent) ! CH4ðgÞ(b) CH4ðgÞ ! CH4ðaqÞIf the values of DH� and DG� are approximately 2.0kJ mol�1 and �14:5 kJ mol�1, respectively, for (a) and�13:5 kJ mol�1 and 26.5 kJ mol�1, respectively, for (b),calculate the values of DH� and DG� for the transfer of1 mole of CH4 according to the equation
CH4ðinert solventÞ ! CH4ðaqÞ
Comment on your results. Assume T ¼ 298 K.
4.67 Find a rubber band that is about 0.5 cm wide.Quickly stretch the rubber band and then press itagainst your lips. You will feel a slight warming e¤ect.Next, reverse the process. Stretch a rubber band andhold it in position for a few seconds. Then quickly re-lease the tension and press the rubber band against yourlips. This time you will feel a slight cooling e¤ect. Pres-ent a thermodynamic analysis of this behavior.
4.68 A rubber band under tension will contract whenheated. Explain.
4.69 Hydrogenation reactions are facilitated by the useof a transition metal catalyst, such as Ni or Pt. Predictthe signs of DrH;DrS, and DrG when hydrogen gas isadsorbed onto the surface of nickel metal.
4.70 A sample of supercooled water freezes at �10�C.What are the signs of DH;DS, and DG for this process?All the changes refer to the system.
4.71 The boiling point of benzene is 80:1�C. Estimate(a) its DvapH value and (b) its vapor pressure at 74�C.(Hint: See Problem 4.59.)
4.72 A chemist has synthesized a hydrocarbon com-pound (CxHy). Briefly describe what measurements areneeded to determine the values of DfH
�;S�, and DfG�
of the compound.
4.73 A closed, 7.8-L flask contains 1.0 g of water. Atwhat temperature will half of the water be in the vaporphase? (Hint: Look up the vapor pressures of water inthe inside back cover.)
4.74 A person heated water in a closed bottle in a mi-crowave oven for tea. After removing the bottle fromthe oven, she added a tea bag to the hot water. To hersurprise, the water started to boil violently. Explainwhat happened.
4.75 Consider the reversible, isothermal compression of0.45 mole of helium gas from 0.50 atm and 22 L to 1.0atm at 25�C. (a) Calculate the values of w;DU ;DH;DS,and DG for the process. (b) Can you use the sign of DGto predict whether the process is spontaneous? Explain.(c) What is the maximum work that can be done for thecompression process? Assume ideal-gas behavior.
4.76 The molar entropy of argon (Ar) is given by
S� ¼ ð36:4þ 20:8 lnTÞ J K�1 mol�1
Calculate the change in Gibbs energy when 1.0 mole ofAr is heated at constant pressure from 20�C to 60�C.(Hint: Use the relation
Ðln x dx ¼ x ln x� x.)
4.77 In Section 4.2 we saw that the probability of find-ing all 100 helium atoms in half of the cylinder is8� 10�31 (see Figure 4.3). Assuming that the age of theuniverse is 13 billion years, calculate the time in secondsduring which this event can be observed.
4.78 Comment on the analogy sometimes used to relatea student’s dormitory room becoming disorderly anduntidy to an increase in entropy.
4.79 Use Equation 4.1 to account for the fact that car-bon monoxide has a residual entropy (that is, an en-tropy at absolute zero) of 4.2 J K�1 mol�1.
4.80 In a DSC experiment (see p. aaa), the meltingtemperature (Tm) of a certain protein is found to be46�C and the enthalpy of denaturation is 382 kJ mol�1.Estimate the entropy of denaturation assuming thatthe denaturation is a two-state process; that is, nativeprotein Ð denatured protein. The single polypeptideprotein chain has 122 amino acids. Calculate the en-tropy of denaturation per amino acid. Comment onyour result.
Problems 125
