the shape of things to come - oliverwyman.com shape of things to come this report examines the...
TRANSCRIPT
Oliver Wyman is a global leader in management consulting that combines deep industry knowledge with specialized expertise in strategy, operations, risk management, and organization transformation.
For more information please contact the marketing department by email at [email protected] or by phone at one of the following locations:
AmericAS
+1 212 541 8100
emeA
+44 20 7333 8333
ASiA PAciFic
+65 6510 9700
copyright © 2013 Oliver Wyman
All rights reserved. This report may not be reproduced or redistributed, in whole or in part, without the written permission of Oliver Wyman and Oliver Wyman accepts no liability whatsoever for the actions of third parties in this respect.
The information and opinions in this report were prepared by Oliver Wyman. This report is not investment advice and should not be relied on for such advice or as a substitute for consultation with professional accountants, tax, legal or financial advisors. Oliver Wyman has made every effort to use reliable, up-to-date and comprehensive information and analysis, but all information is provided without warranty of any kind, express or implied. Oliver Wyman disclaims any responsibility to update the information or conclusions in this report. Oliver Wyman accepts no liability for any loss arising from any action taken or refrained from as a result of information contained in this report or any reports or sources of information referred to herein, or for any consequential, special or similar damages even if advised of the possibility of such damages. The report is not an offer to buy or sell securities or a solicitation of an offer to buy or sell securities. This report may not be sold without the written consent of Oliver Wyman.
www.oliverwyman.com
The ShAPe OF ThingS TO cOmeWhAT recenT hiSTOry TellS uS AbOuT The FuTure OF eurOPeAn bAnking

THE SHAPE OF THINGS TO COME 2
INTRODUCTION 4
1. INDUSTRY CONTEXT: THE GREAT SURVIVAL 71.1. SURPRISING RESILIENCE 7
1.2. GROUNDS FOR CONCERN 14
2. RETURNS, LEADERS AND LAGGARDS 182.1. THE COLLAPSE IN ROE 18
2.2. A CAUTIOUS OUTLOOK 20
2.3. SOVEREIGN INFLUENCE – THERE’S NO PLACE LIKE HOME 23
2.4. DELEVERAGING AND DECOUPLING 27
3. THE CHALLENGES FOR BANKS 303.1. A BOND OR EQUITY STRATEGY 30
3.2. GETTING DELEVERAGING AND DECOUPLING RIGHT 32
3.3. CHANNELLING INVESTMENT 34
CONTENTS

THE SHAPE OF THINGS TO COMEThis report examines the recent history of the European banking industry and attempts to outline some of the salient dynamics underway. These include the changes to the competitive landscape, the role of shadow banking, the relationship between banks and governments, the returns delivered to shareholders, and the agenda for senior industry executives. Anchored in a hard analytical and shareholder value lens, we try to extrapolate what we do and do not know about the shape of the industry emerging. Our key projections:
1. New competitive structures slow to emerge … but setting down long term roots … and capital formation in danger of drifting out of the core banking sector
Unexpectedly, change to the competitive environment has been slow. The crisis and subsequent response have actually reinforced barriers to entry. However, new competitors, small today, are beginning to accumulate and incumbents would be wise not to discount the medium term threat. More dramatically, significant equity value is being created at the periphery of the industry by non-banks delivering infrastructure and information based services. Banks need to wake up quickly to this trend to avoid significant transfer of value outside the traditional banking ambit.
2. Increasing role of non-banks in financing … and opportunities for some banks in making it happen
The risk to banks of large scale disintermediation has been exaggerated. If anything, banks now need to push for more disintermediation to overcome their own balance sheet constraints, by accelerating the deepening of bond markets and bringing more investors into loan markets. Banks that can learn to partner effectively with non-bank lenders will generate disproportionate
value from the growth of the ‘direct’ credit markets.
3. Deleveraging likely to accelerate … but remain more limited than many think
Asset disposals to date have been very low, principally due to public funding support, a bank-heavy credit intermediation market structure, the need for net interest margin to cover operating costs and a lack of appetite to take capital write-downs associated with asset sales. We anticipate these factors will continue to drag on restructuring. Nevertheless, balance sheet restructuring will accelerate, driven by a potentially very significant inflection point created by the Asset Quality Review (AQR), the focus by regulators on Capital Requirements Directive (CRD) IV leverage ratios and by investors increasingly pricing leverage into valuations. We also predict substantial technical optimisation of banks’ balance sheets to take place in the coming twelve months.
4. Smooth withdrawal of public capital and funding … decoupling to gather pace
European Central Bank (ECB) funding has peaked and governments are beginning to plan for share sales. As banks’ solvency is improved by the introduction of capital buffers and leverage ratios, the decoupling of sovereign and bank risk should accelerate, somewhat offsetting the slow progress of a Europe-wide resolution authority and the lack of clarity around resolution and ‘ring-fencing’. We do not underestimate the risk of discontinuities in funding markets, enhanced by recent loading of government debt on banks’ balance sheets. However, the balance of information points to a base case of orderly, if very gradual, decoupling. Banks will face strategic choices about how aggressively to use the decoupling levers at their disposal.

5. Improving returns and valuation … but
only for some
Returns are at historic lows, with further
downward pressure from regulatory change
to come. These returns are highly correlated
with country, driven by factors such as funding
costs, GDP growth and non-performing loan
(NPL) ratios. Valuation has taken a similar
path, overwhelmingly driven by country and
sovereign. However, as NPLs begin to normalise
and the decoupling of sovereign and bank risk
progresses, there will be more opportunity for
idiosyncratic bank strategies to affect returns and
valuations. Capitalisation and cost management
will be key. Well-capitalised banks will be able
to make targeted strategic choices to optimise
their portfolios, while effective cost reduction
will deliver higher returns in the low-growth
environment. As a result we expect to see greater
divergence of performance and reward as bank
strategies reassert their significance. The logic
of technology-led consolidation will become
powerful, but concerns over creating larger
banks will deter M&A. A European stability
mechanism and single supervisor may change
this and put medium-sized deals in developed
Europe back on the agenda further down the line.
6. ‘Utility’ banking increasingly attractive … though there will be rewards for the few
who can grow earnings power
We take a different view to much of the negative
commentary about regulators forcing banks to
become utilities. If delivering stable earnings
with a predictable risk profile, drawing out core
market operating profits and returning excess
capital through a high dividend policy is a
utility, then for many banks this will become an
attractive vision to embrace, and will be rewarded
by investors looking for bond-like returns.
That said, we anticipate a handful of banks
will push for more equity-like earnings growth
and, if successful, will be rewarded with higher
valuations. We see grounds for caution for the
many banks implicitly following a hybrid strategy,
such as a convertible bond strategy or a bond
strategy juiced with some yield enhancement.
7. Sharper operating models will emerge …
partnerships and outsourcing key
The battleground for much of the industry will
be cost effectiveness. Costs have risen across
the big incumbents by an average of €3.5BN
each since 2006, despite waves of attempted
cost reduction. More radical thinking has to take
root, built on bigger spend, channelling more
technology-focused capex and accelerating
branch consolidation to generate substantial
and sustainable returns. In particular, we expect
supply chains to emerge where much more of
the cost base of the industry is sourced from
utilities or third party specialists. New entrants
and emerging markets players could appear as
the early winners here.
8. Better customer service … at least for those
willing to pay
Most European banks have been forced to
concentrate on their home markets. As the
need to squeeze out gains from market share
increases and conduct regulation stamps out the
scope to exploit price elasticity, the focus on the
customer experience has become paramount.
We see senior banking executives obsessing, as
never before, about how to make the customer
experience more satisfying and hassle-free.
The flipside is in more sophisticated use of
segmentation, giving higher levels of service
only to those able and willing to pay for it.
INTRODUCTIONThe financial crisis of 2008 has been followed by
a long economic downturn and a sovereign debt
crisis in the Eurozone. You might expect European
banking to have undergone tumultuous change:
declining revenues, swathes of bank failures,
consolidation and a significant shift of market
share to non-Europeans, new entrants and
non-bank competitors.
Such expectations have been thoroughly
confounded. Industry revenues have rebounded
and stabilised well above their 2008 low. Although
RoEs have declined sharply, only a handful of
small European banks have been wound up.
Bank balance sheets have remained the same
size they were pre-crisis and the competitive
landscape has not materially changed.
Neither non-Europeans nor new entrants have
significantly dented market share. And, while
there has been some shift of lending towards
capital markets, disintermediation and the growth
of so-called shadow banking has been muted.
Of course, there are grounds for concern – the
most obvious being the role of government
intervention in creating this remarkable
stability. Otherwise-insolvent banks have been
recapitalised and the monetary policies of the
ECB and national central banks have allowed
banks to fund themselves at low cost. However,
while the risk of ‘zombie banks’ is real and credit
extension is still sluggish, in the larger non-
peripheral European economies dependence on
governmental support is declining. Especially for
the larger banks, private funding is now easier
to find. Banks are rebalancing their government
bond portfolios and governments are increasingly
thinking about withdrawing their capital.
Nevertheless, banks’ fortunes remain tightly
bound to their home countries in two ways.
First, the RoEs of banks from the same country
have converged as country-specific factors
such as GDP growth, funding costs and NPL
rates have driven returns. Only a handful of
banks have bucked this trend and delivered
noticeably better returns through strategic
portfolio selection, better footprint or strong
execution. Second, idiosyncratic differences
of strategy and execution are making little
difference to market valuations. Investors need
very strong evidence to materially distinguish
valuations for banks in the same country.
This will not go on forever. As regulatory reform
settles and NPLs start to normalise, decoupling
is likely to gather pace, putting more emphasis
on bank-specific factors in driving returns.
We already see evidence of investors starting
to take more notice of certain factors, such
as leverage and dividend policy, in valuation.
Sooner or later individual performance will
reassert itself in returns and this will be reflected
in market valuations.
European banks will have to contend with three
main challenges in 2014. The first challenge
is strategy selection, where banks have two
broad options. One is a bond-like strategy,
where maximum dividend capital is returned
to shareholders and the business model is
designed to deliver revenue that grows at
roughly the same rate as GDP within a ‘safe zone’
of core markets. The other option is an equity-
like strategy, positioning for more growth and
earnings upside by investing in new industry
sub-sectors, client segments or markets, or in
emerging markets simply targeting the white
space for growth. We raise concerns about the
wisdom of various ‘hybrid’ strategies we see in
the market today.
The second challenge is getting deleveraging and
decoupling right. Whilst limited deleveraging
has been seen to date, and there will continue to
be drags on balance sheet restructuring, we do
anticipate some modest acceleration as new CRD
IV leverage targets and the AQR start to impact
banks. The withdrawal of liquidity support and
the introduction of regional stability mechanisms,
resolution authorities and insurance schemes
will also naturally encourage decoupling of banks
from their sovereigns. Getting the capital plan
right, managing regulatory balkanisation, timing
the disposal of assets to free up capital for growth
and determining how far to pursue measures
such as issuing bail-in capital and restructuring
legal entities will be a difficult balancing act for
most CFOs. Some banks will be able to exploit the
opportunity to pick up assets at knock-down prices.
The third challenge is effectively channelling
enough investment into new technology
and operating models to deliver radical cost
reductions while improving the way customers
are served. As of today, we still see too many
banks planning against short payback horizons,
making incremental changes to cost structures
and continuing to play by yesterday’s rules
on customer propositions, when more radical
action is required.
We discuss these challenges in Section 3 of this
report. In Section 1 we describe the current
condition of the European banking industry
and in Section 2 we look at what is determining
the fortunes of leaders and laggards. As our
analysis shows, the idea that European banking
is in terminal decline is wrong. The sector has
proved surprisingly resilient. But the focus
needs to shift beyond ensuring its salvation
to discerning its future direction. Senior
executives, whose attention has been directed
toward regulatory compliance, must return to
the question of strategy.
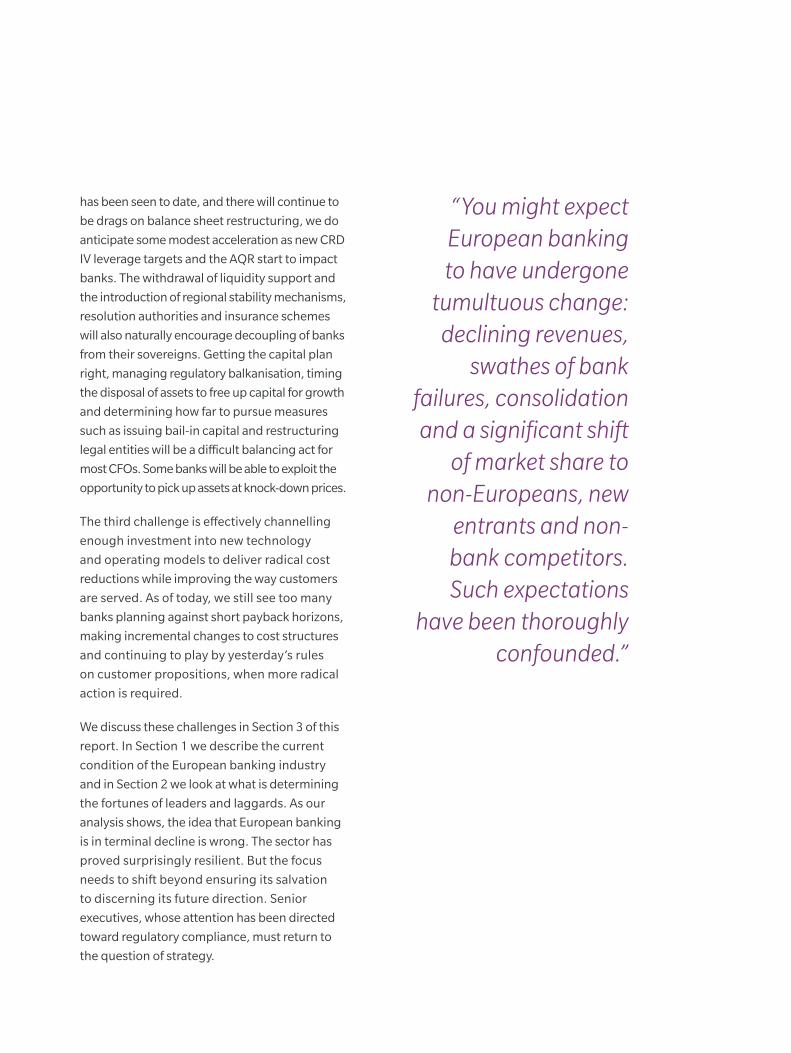
“You might expect European banking to have undergone
tumultuous change: declining revenues,
swathes of bank failures, consolidation and a significant shift
of market share to non-Europeans, new
entrants and non-bank competitors. Such expectations
have been thoroughly confounded.”

THE SHAPE OF THINGS TO COME
6 Copyright © 2013 Oliver Wyman
NOTES:Europe: Throughout the report, unless explicitly stated
otherwise, ‘Europe’ includes countries in the EU28
(excluding Cyprus and Malta), Switzerland, Norway,
Russia and Turkey.
Corporate and Institutional Banking (CIB): Includes
products and services offered to mid-cap (annual
turnover ≥€25MM) and large corporate clients across
capital markets, investment banking, lending and
transaction banking.
Retail and Business Banking (RBB): Includes all
products and services related to retail customers (with
a net worth <€1MM excluding primary residence)
and small and mid-sized corporates (annual turnover
<€25MM), excluding bancassurance and distribution
fees for asset management.
Wealth and Asset Management (WAM): Includes private
banking services offered to high net worth segment
(defined as individuals with a net worth ≥€1MM
excluding primary residence) and asset management
for institutions.
Insurance: Includes both life and non-life insurance
products (inclusive of bancassurance) offered to
households and institutions. For insurance companies,
revenues have been estimated as follows to allow for
like-for-like comparison with banking revenue: Life
insurance revenues = Profit before tax + administration
and acquisition cost, Non-life insurance revenues =
Gross written premiums (net of reinsurance) – claims +
investment income.
Sample: The sample of banks used within this report
consisted of 100 European banks selected based on
total revenue size and to provide a sufficient number of
banks within each assessed region. For each separate
analysis the greatest number of banks possible has
been used, based on the availability of data. Sample is
available on request.
THE SHAPE OF THINGS TO COME
Copyright © 2013 Oliver Wyman 7
1. INDUSTRY CONTEXT: THE GREAT SURVIVAL
1.1. SURPRISING RESILIENCE
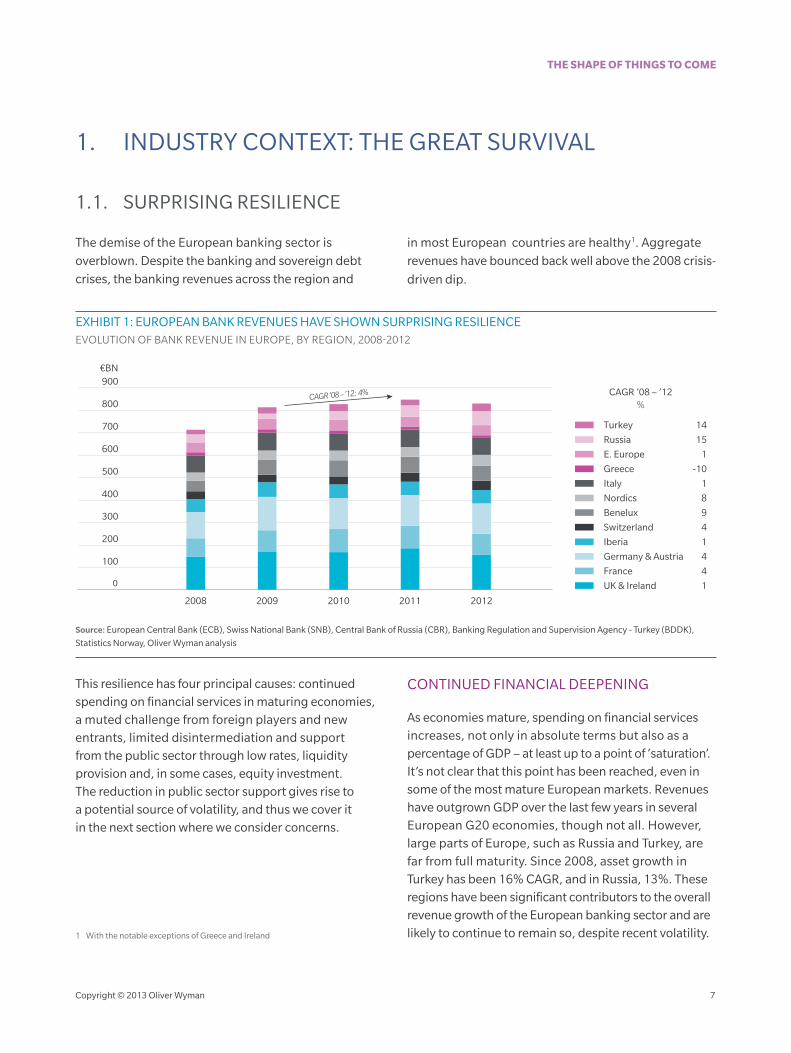
The demise of the European banking sector is
overblown. Despite the banking and sovereign debt
crises, the banking revenues across the region and
in most European countries are healthy1. Aggregate
revenues have bounced back well above the 2008 crisis-
driven dip.
EXHIBIT 1: EUROPEAN BANK REVENUES HAVE SHOWN SURPRISING RESILIENCEEVOLUTION OF BANK REVENUE IN EUROPE, BY REGION, 2008-2012
CAGR ’08 – ’12: 4%
€BN
500
600
300
400
200
100
700
800
2008 2009 2010 2011 2012
900
0 UK & Ireland 1
France 4
Germany & Austria 4
Iberia 1
Switzerland 4
Benelux 9
Nordics 8
Italy 1
Greece -10
E. Europe 1
Russia 15
CAGR ’08 – ’12%
Turkey 14
Source: European Central Bank (ECB), Swiss National Bank (SNB), Central Bank of Russia (CBR), Banking Regulation and Supervision Agency - Turkey (BDDK),
Statistics Norway, Oliver Wyman analysis
This resilience has four principal causes: continued spending on financial services in maturing economies, a muted challenge from foreign players and new entrants, limited disintermediation and support from the public sector through low rates, liquidity provision and, in some cases, equity investment. The reduction in public sector support gives rise to a potential source of volatility, and thus we cover it in the next section where we consider concerns.
CONTINUED FINANCIAL DEEPENING
As economies mature, spending on financial services increases, not only in absolute terms but also as a percentage of GDP – at least up to a point of ‘saturation’. It’s not clear that this point has been reached, even in some of the most mature European markets. Revenues have outgrown GDP over the last few years in several European G20 economies, though not all. However, large parts of Europe, such as Russia and Turkey, are far from full maturity. Since 2008, asset growth in Turkey has been 16% CAGR, and in Russia, 13%. These regions have been significant contributors to the overall revenue growth of the European banking sector and are likely to continue to remain so, despite recent volatility.1 With the notable exceptions of Greece and Ireland
THE SHAPE OF THINGS TO COME
8 Copyright © 2013 Oliver Wyman
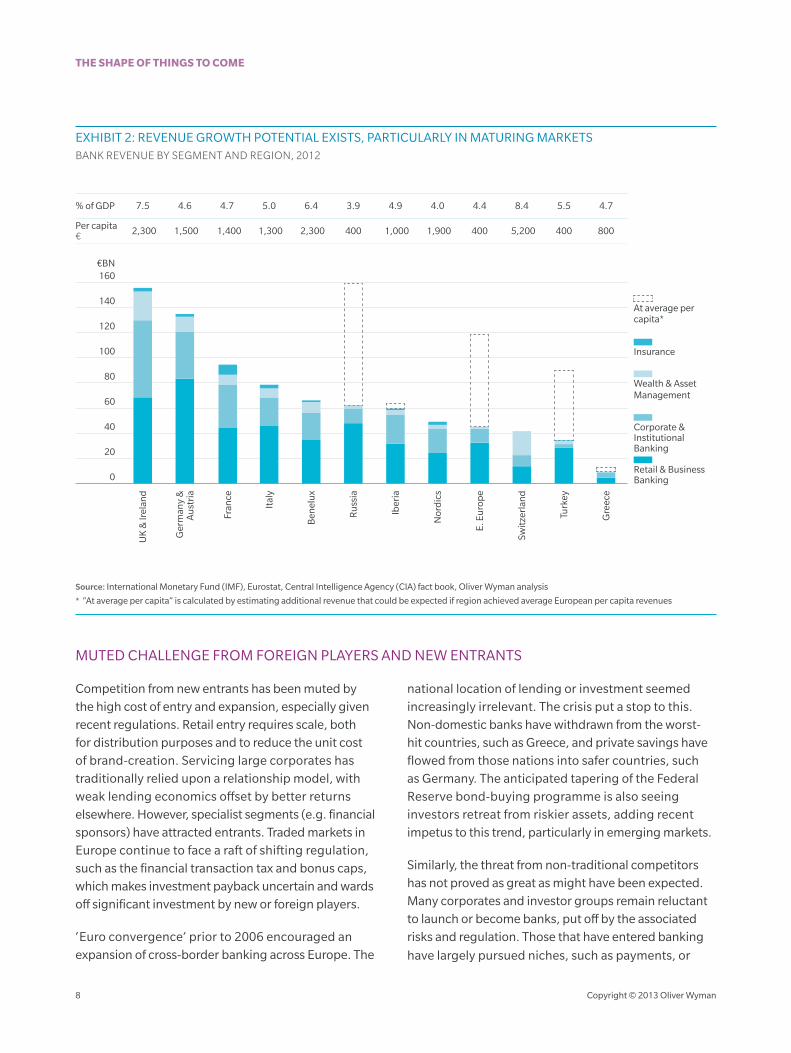
EXHIBIT 2: REVENUE GROWTH POTENTIAL EXISTS, PARTICULARLY IN MATURING MARKETSBANK REVENUE BY SEGMENT AND REGION, 2012
60
80
40
120
100
140
160
20
0
€BN
Corporate & Institutional Banking
Retail & Business Banking
Wealth & Asset Management
Insurance
At average per capita*
Fran
ce
UK
& Ir
elan
d
Ben
elu
x
Ger
man
y &
Au
stri
a
Ital
y
Ru
ssia
Nor
dic
s
Swit
zerl
and
Gre
ece
Iber
ia
E. E
uro
pe
Turk
ey
2,300 1,500 1,400 1,300 2,300 400 1,9001,000 400 5,200 400 800Per capita€
7.5 4.6 4.7 5.0 6.4 3.9 4.04.9 4.4 8.4 5.5 4.7% of GDP
Source: International Monetary Fund (IMF), Eurostat, Central Intelligence Agency (CIA) fact book, Oliver Wyman analysis
* “At average per capita” is calculated by estimating additional revenue that could be expected if region achieved average European per capita revenues
MUTED CHALLENGE FROM FOREIGN PLAYERS AND NEW ENTRANTS
Competition from new entrants has been muted by the high cost of entry and expansion, especially given recent regulations. Retail entry requires scale, both for distribution purposes and to reduce the unit cost of brand-creation. Servicing large corporates has traditionally relied upon a relationship model, with weak lending economics offset by better returns elsewhere. However, specialist segments (e.g. financial sponsors) have attracted entrants. Traded markets in Europe continue to face a raft of shifting regulation, such as the financial transaction tax and bonus caps, which makes investment payback uncertain and wards off significant investment by new or foreign players.
‘Euro convergence’ prior to 2006 encouraged an expansion of cross-border banking across Europe. The
national location of lending or investment seemed increasingly irrelevant. The crisis put a stop to this. Non-domestic banks have withdrawn from the worst-hit countries, such as Greece, and private savings have flowed from those nations into safer countries, such as Germany. The anticipated tapering of the Federal Reserve bond-buying programme is also seeing investors retreat from riskier assets, adding recent impetus to this trend, particularly in emerging markets.
Similarly, the threat from non-traditional competitors has not proved as great as might have been expected. Many corporates and investor groups remain reluctant to launch or become banks, put off by the associated risks and regulation. Those that have entered banking
have largely pursued niches, such as payments, or
THE SHAPE OF THINGS TO COME
Copyright © 2013 Oliver Wyman 9
entered via partnerships with banks and insurers.
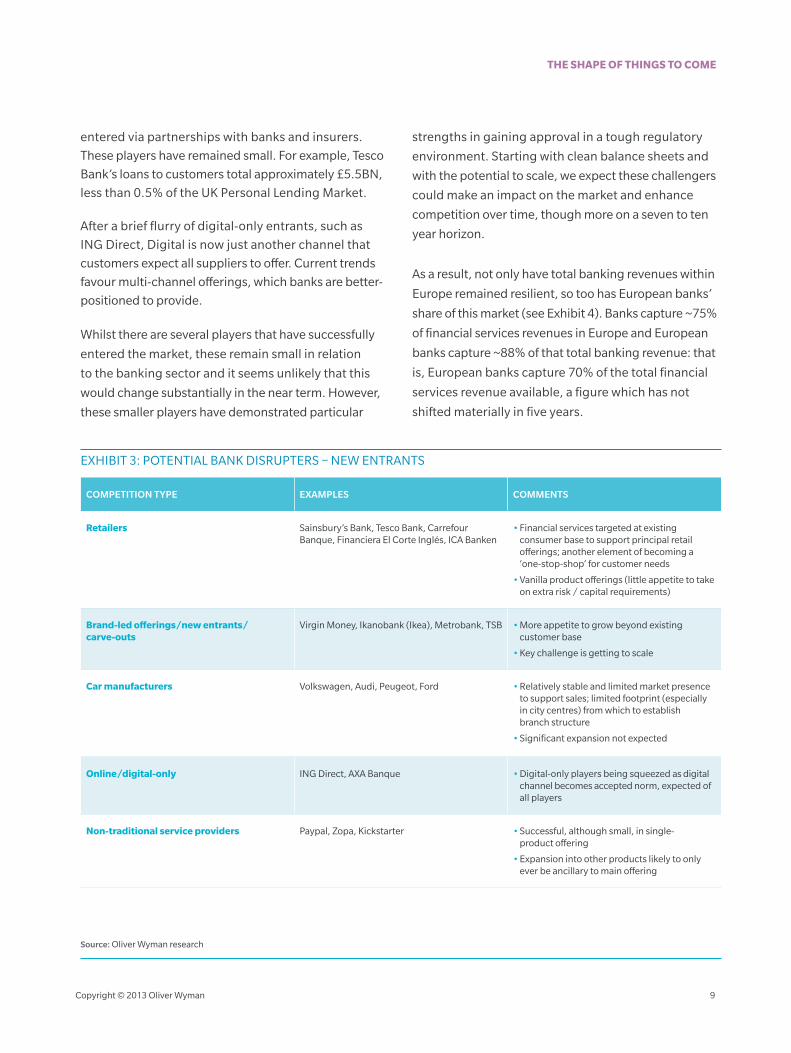
These players have remained small. For example, Tesco
Bank’s loans to customers total approximately £5.5BN,
less than 0.5% of the UK Personal Lending Market.
After a brief flurry of digital-only entrants, such as
ING Direct, Digital is now just another channel that
customers expect all suppliers to offer. Current trends
favour multi-channel offerings, which banks are better-
positioned to provide.
Whilst there are several players that have successfully
entered the market, these remain small in relation
to the banking sector and it seems unlikely that this
would change substantially in the near term. However,
these smaller players have demonstrated particular
strengths in gaining approval in a tough regulatory
environment. Starting with clean balance sheets and
with the potential to scale, we expect these challengers
could make an impact on the market and enhance
competition over time, though more on a seven to ten
year horizon.
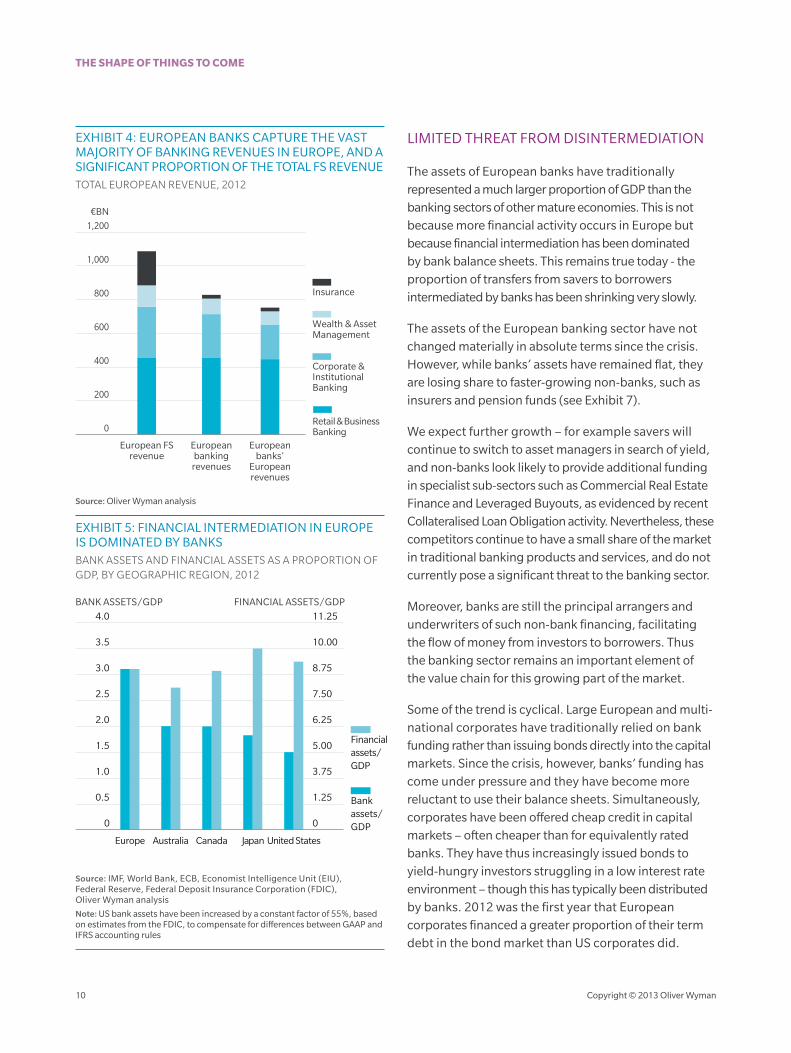
As a result, not only have total banking revenues within
Europe remained resilient, so too has European banks’
share of this market (see Exhibit 4). Banks capture ~75%
of financial services revenues in Europe and European
banks capture ~88% of that total banking revenue: that
is, European banks capture 70% of the total financial
services revenue available, a figure which has not
shifted materially in five years.
EXHIBIT 3: POTENTIAL BANK DISRUPTERS – NEW ENTRANTS
COMPETITION TYPE EXAMPLES COMMENTS
Retailers Sainsbury’s Bank, Tesco Bank, Carrefour Banque, Financiera El Corte Inglés, ICA Banken
•Financial services targeted at existing consumer base to support principal retail offerings; another element of becoming a ‘one-stop-shop’ for customer needs
•Vanilla product offerings (little appetite to take on extra risk / capital requirements)
Brand-led offerings/new entrants/carve-outs
Virgin Money, Ikanobank (Ikea), Metrobank, TSB •More appetite to grow beyond existing customer base
•Key challenge is getting to scale
Car manufacturers Volkswagen, Audi, Peugeot, Ford •Relatively stable and limited market presence to support sales; limited footprint (especially in city centres) from which to establish branch structure
•Significant expansion not expected
Online/digital-only ING Direct, AXA Banque •Digital-only players being squeezed as digital channel becomes accepted norm, expected of all players
Non-traditional service providers Paypal, Zopa, Kickstarter •Successful, although small, in single-product offering
•Expansion into other products likely to only ever be ancillary to main offering
Source: Oliver Wyman research
THE SHAPE OF THINGS TO COME
10 Copyright © 2013 Oliver Wyman
EXHIBIT 4: EUROPEAN BANKS CAPTURE THE VAST MAJORITY OF BANKING REVENUES IN EUROPE, AND A SIGNIFICANT PROPORTION OF THE TOTAL FS REVENUETOTAL EUROPEAN REVENUE, 2012
1,000
400
200
600
800
European FSrevenue
Europeanbanking
revenues
Europeanbanks'
Europeanrevenues
1,200
€BN
Retail & BusinessBanking
Corporate &InstitutionalBanking
Wealth & Asset Management
Insurance
0
Source: Oliver Wyman analysis
EXHIBIT 5: FINANCIAL INTERMEDIATION IN EUROPE IS DOMINATED BY BANKSBANK ASSETS AND FINANCIAL ASSETS AS A PROPORTION OF GDP, BY GEOGRAPHIC REGION, 2012
BANK ASSETS/GDP FINANCIAL ASSETS/GDP
2.5 7.50
3.5 10.00
2.0 6.25
1.5 5.00
3.0 8.75
1.0 3.75
0.5 1.25
Europe Australia Canada Japan United States
4.0 11.25
00
Bank assets/GDP
Financialassets/GDP
Source: IMF, World Bank, ECB, Economist Intelligence Unit (EIU), Federal Reserve, Federal Deposit Insurance Corporation (FDIC), Oliver Wyman analysis
Note: US bank assets have been increased by a constant factor of 55%, based on estimates from the FDIC, to compensate for differences between GAAP and IFRS accounting rules
LIMITED THREAT FROM DISINTERMEDIATION
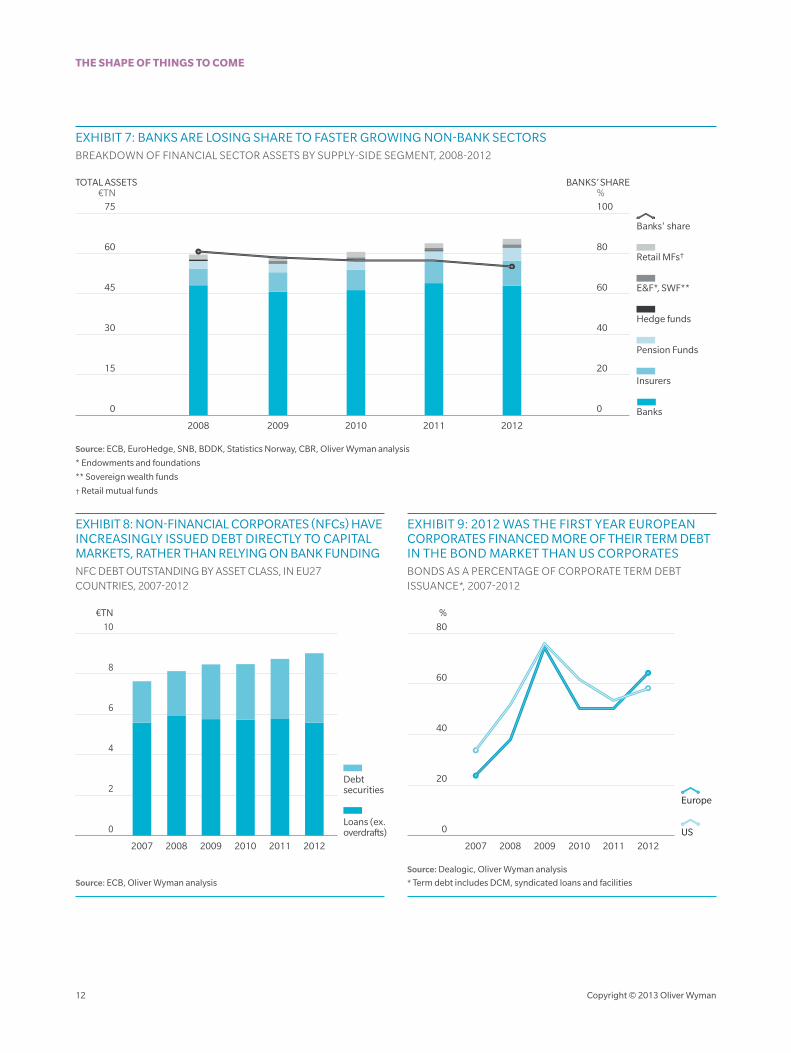
The assets of European banks have traditionally represented a much larger proportion of GDP than the banking sectors of other mature economies. This is not because more financial activity occurs in Europe but because financial intermediation has been dominated by bank balance sheets. This remains true today - the proportion of transfers from savers to borrowers intermediated by banks has been shrinking very slowly.
The assets of the European banking sector have not changed materially in absolute terms since the crisis. However, while banks’ assets have remained flat, they are losing share to faster-growing non-banks, such as insurers and pension funds (see Exhibit 7).
We expect further growth – for example savers will continue to switch to asset managers in search of yield, and non-banks look likely to provide additional funding in specialist sub-sectors such as Commercial Real Estate Finance and Leveraged Buyouts, as evidenced by recent Collateralised Loan Obligation activity. Nevertheless, these competitors continue to have a small share of the market in traditional banking products and services, and do not currently pose a significant threat to the banking sector.
Moreover, banks are still the principal arrangers and underwriters of such non-bank financing, facilitating the flow of money from investors to borrowers. Thus the banking sector remains an important element of the value chain for this growing part of the market.
Some of the trend is cyclical. Large European and multi-national corporates have traditionally relied on bank funding rather than issuing bonds directly into the capital markets. Since the crisis, however, banks’ funding has come under pressure and they have become more reluctant to use their balance sheets. Simultaneously, corporates have been offered cheap credit in capital markets – often cheaper than for equivalently rated banks. They have thus increasingly issued bonds to yield-hungry investors struggling in a low interest rate environment – though this has typically been distributed by banks. 2012 was the first year that European corporates financed a greater proportion of their term debt in the bond market than US corporates did.
THE SHAPE OF THINGS TO COME
Copyright © 2013 Oliver Wyman 11
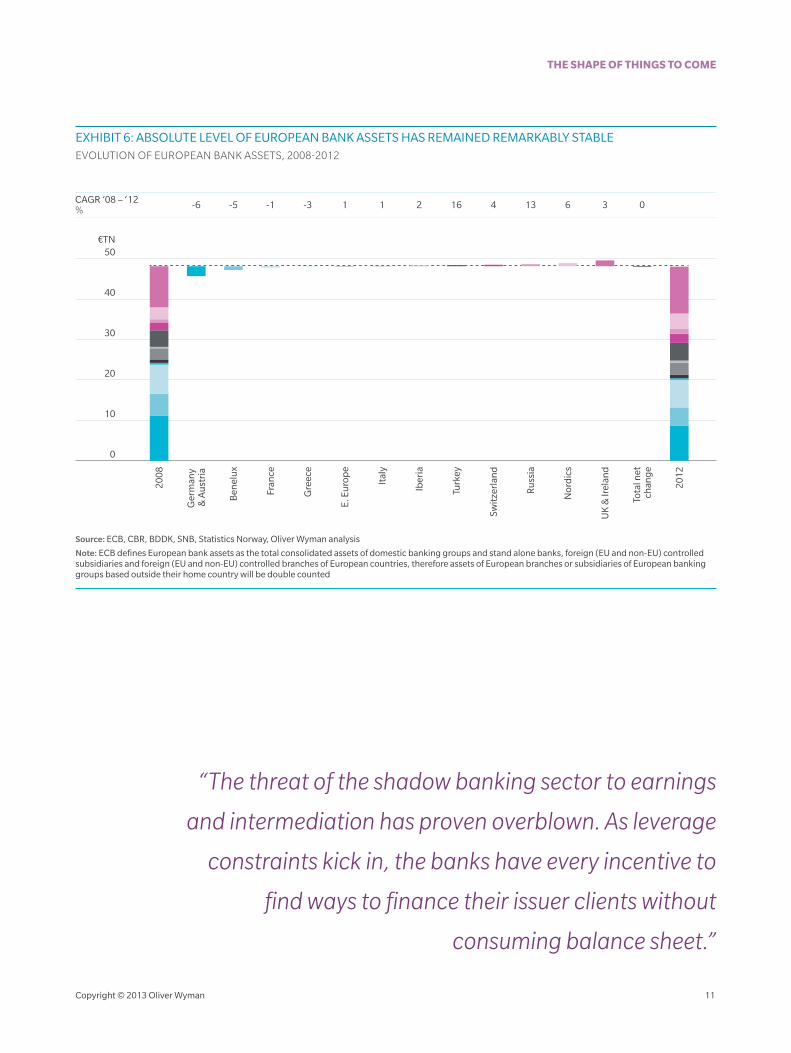
EXHIBIT 6: ABSOLUTE LEVEL OF EUROPEAN BANK ASSETS HAS REMAINED REMARKABLY STABLEEVOLUTION OF EUROPEAN BANK ASSETS, 2008-2012
30
40
20
10
0
50€TN
2008
2012
Ger
man
y &
Au
stri
a-6
Ben
elu
x
-5
Fran
ce
-1
Gre
ece
-3
E. E
uro
pe
1
Ital
y
1
Iber
ia
16
Turk
ey
2
Swit
zerl
and
4
Ru
ssia
13
Nor
dic
s
6
UK
& Ir
elan
d
3
Tota
l net
chan
ge
0CAGR ’08 – ‘12%
Source: ECB, CBR, BDDK, SNB, Statistics Norway, Oliver Wyman analysis
Note: ECB defines European bank assets as the total consolidated assets of domestic banking groups and stand alone banks, foreign (EU and non-EU) controlled subsidiaries and foreign (EU and non-EU) controlled branches of European countries, therefore assets of European branches or subsidiaries of European banking groups based outside their home country will be double counted
“The threat of the shadow banking sector to earnings
and intermediation has proven overblown. As leverage
constraints kick in, the banks have every incentive to
find ways to finance their issuer clients without
consuming balance sheet.”
THE SHAPE OF THINGS TO COME
12 Copyright © 2013 Oliver Wyman
EXHIBIT 7: BANKS ARE LOSING SHARE TO FASTER GROWING NON-BANK SECTORSBREAKDOWN OF FINANCIAL SECTOR ASSETS BY SUPPLY-SIDE SEGMENT, 2008-2012
30 40
15 20
45 60
60 80
2008 2009 2010 2011 2012
00
75 100
TOTAL ASSETS €TN
BANKS’ SHARE%
Banks
Insurers
Pension Funds
Hedge funds
E&F*, SWF**
Retail MFs†
Banks' share
Source: ECB, EuroHedge, SNB, BDDK, Statistics Norway, CBR, Oliver Wyman analysis
* Endowments and foundations
** Sovereign wealth funds
† Retail mutual funds
EXHIBIT 8: NON-FINANCIAL CORPORATES (NFCs) HAVE INCREASINGLY ISSUED DEBT DIRECTLY TO CAPITAL MARKETS, RATHER THAN RELYING ON BANK FUNDINGNFC DEBT OUTSTANDING BY ASSET CLASS, IN EU27 COUNTRIES, 2007-2012
4
2
6
8
2007 2009 2010 20112008 2012
10
€TN
0Loans (ex.overdrafts)
Debtsecurities
Source: ECB, Oliver Wyman analysis
EXHIBIT 9: 2012 WAS THE FIRST YEAR EUROPEAN CORPORATES FINANCED MORE OF THEIR TERM DEBT IN THE BOND MARKET THAN US CORPORATESBONDS AS A PERCENTAGE OF CORPORATE TERM DEBT ISSUANCE*, 2007-2012
20
0
80
60
40
2007 2008 2009 2010 2011 2012
%
US
Europe
Source: Dealogic, Oliver Wyman analysis
* Term debt includes DCM, syndicated loans and facilities
THE SHAPE OF THINGS TO COME
Copyright © 2013 Oliver Wyman 13
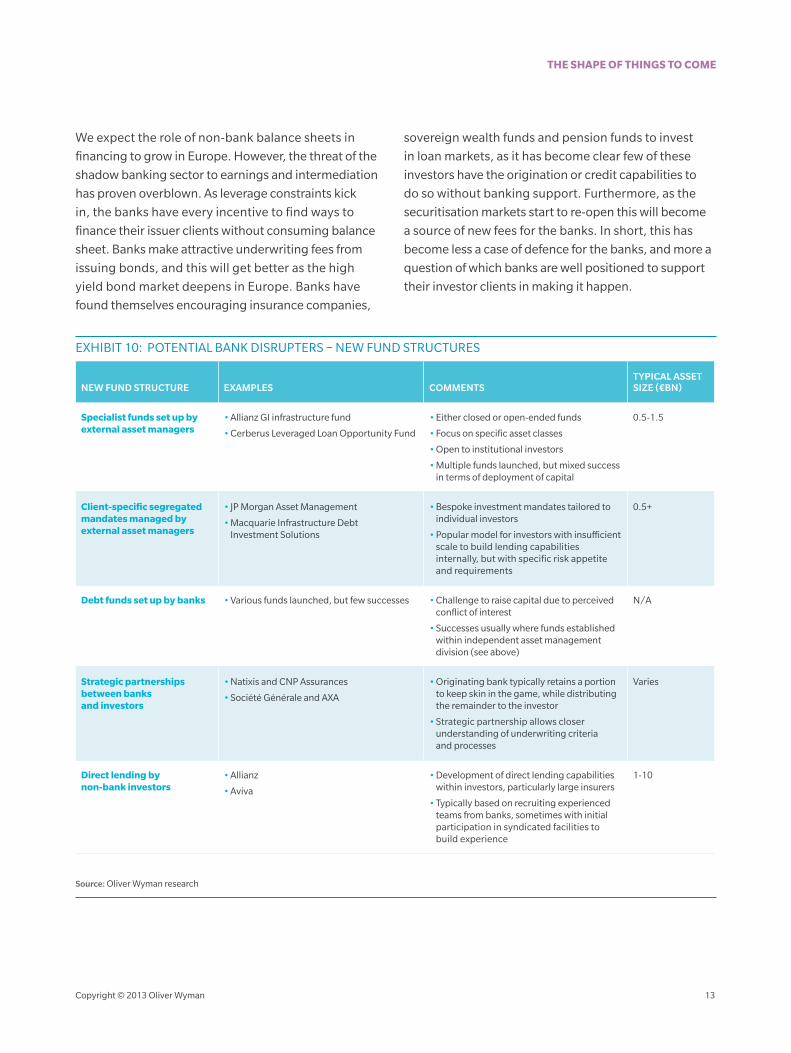
We expect the role of non-bank balance sheets in
financing to grow in Europe. However, the threat of the
shadow banking sector to earnings and intermediation
has proven overblown. As leverage constraints kick
in, the banks have every incentive to find ways to
finance their issuer clients without consuming balance
sheet. Banks make attractive underwriting fees from
issuing bonds, and this will get better as the high
yield bond market deepens in Europe. Banks have
found themselves encouraging insurance companies,
sovereign wealth funds and pension funds to invest
in loan markets, as it has become clear few of these
investors have the origination or credit capabilities to
do so without banking support. Furthermore, as the
securitisation markets start to re-open this will become
a source of new fees for the banks. In short, this has
become less a case of defence for the banks, and more a
question of which banks are well positioned to support
their investor clients in making it happen.
EXHIBIT 10: POTENTIAL BANK DISRUPTERS – NEW FUND STRUCTURES
NEW FUND STRUCTURE EXAMPLES COMMENTSTYPICAL ASSET SIZE (€BN)
Specialist funds set up by external asset managers
•Allianz GI infrastructure fund
•Cerberus Leveraged Loan Opportunity Fund
•Either closed or open-ended funds
•Focus on specific asset classes
•Open to institutional investors
•Multiple funds launched, but mixed success in terms of deployment of capital
0.5-1.5
Client-specific segregated mandates managed by external asset managers
• JP Morgan Asset Management
•Macquarie Infrastructure Debt Investment Solutions
•Bespoke investment mandates tailored to individual investors
•Popular model for investors with insufficient scale to build lending capabilities internally, but with specific risk appetite and requirements
0.5+
Debt funds set up by banks •Various funds launched, but few successes •Challenge to raise capital due to perceived conflict of interest
•Successes usually where funds established within independent asset management division (see above)
N/A
Strategic partnerships between banks and investors
•Natixis and CNP Assurances
•Société Générale and AXA
•Originating bank typically retains a portion to keep skin in the game, while distributing the remainder to the investor
•Strategic partnership allows closer understanding of underwriting criteria and processes
Varies
Direct lending by non-bank investors
•Allianz
•Aviva
•Development of direct lending capabilities within investors, particularly large insurers
•Typically based on recruiting experienced teams from banks, sometimes with initial participation in syndicated facilities to build experience
1-10
Source: Oliver Wyman research
THE SHAPE OF THINGS TO COME
14 Copyright © 2013 Oliver Wyman
1.2. GROUNDS FOR CONCERN
Although banking revenues have been remarkably
resilient since 2008, there are causes for concern. Chief
amongst these are dependence on the state, reduced
access to attractive markets and a shift in value to areas
not traditionally within the ambit of banks.
DEPENDENCE ON THE STATE
State injections of tax-funded capital, intended to
avert economic calamity by ensuring that banks could
continue to play their role intermediating credit flows,
have provided vital support to banks in recent years. We
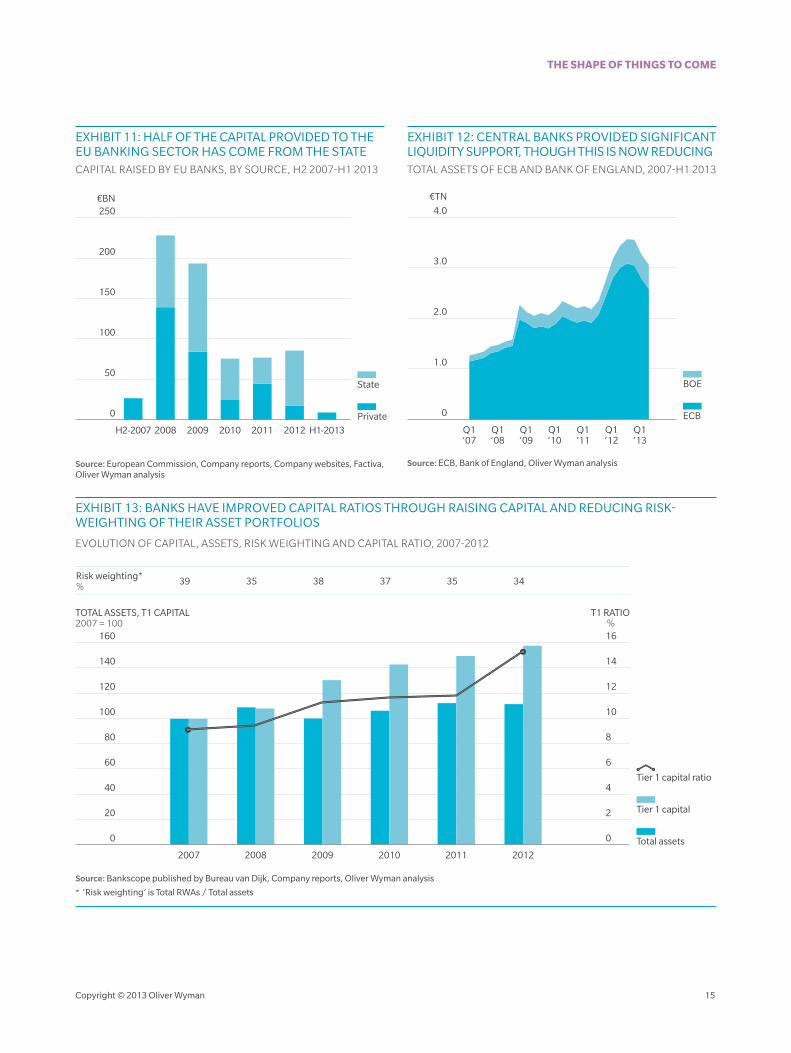
calculate that since 2007 European banks have raised
€700BN of capital, of which €350BN has come from
the public sector. While maintaining critical solvency,
this has also prompted some banks to hold assets they
would otherwise have been forced to sell.
Banks have also taken steps to reduce the risk-weighting
of their asset portfolios. As a result, the assets of our
sample of banks actually increased over the period. For
many banks, this would have been impossible without
the state support they received.
In fact, total state support approved for the EU financial
sector since the Lehman default totals more than €5TN,
equivalent to 40% of GDP. Of this, €1.5TN had been used
by the end of 2011, with guarantees forming the largest
part of this aid. While these guarantees revitalised bond
markets, enabling banks to issue bonds and raise funds,
they also led to sovereign stress (especially in Ireland)
and helped create a sovereign-bank feedback loop,
which still plagues the market, and which we examine
further in the next section.
Most European governments have no desire to be long-
term investors in the sector. However, they have so far
been unable to exit because most banks are in no position
to repay their state investors and RoEs are generally
below the level at which governments could regain their
investment. Thus, only about 10% of the original capital
injected has been repaid, meaning that total public sector
ownership of European banks now stands at 17% of total
equity2 . While there is some fresh activity in this space,
such as the recent announcements regarding Lloyds
Banking Group, there remains a long way to go.
By comparison, the US Federal government injected
$250BN3 of capital into its banks through the
Troubled Asset Relief Program (TARP), which at its
height amounted to 17% of total equity, an equivalent
proportion to Europe today. Almost all of this has
been repaid, however, so that the outstanding TARP
capital now amounts to 1% of total US bank equity. The
relative health of the US banking system, with early and
aggressive write-downs, is an interesting counterpoint
to the European system and one that policy makers
should constantly challenge themselves against.
Beyond capital support, there has been extensive
monetary and funding support. Central bank balance
sheets exploded over the last four years as asset
purchase schemes, Quantitative Easing (QE) and
collateral windows were used to restore confidence and
keep interbank markets functioning. Although these
balance sheets have now begun to shrink, central banks
remain committed to providing liquidity to the debt
markets. The support provided by central banks has
contributed to favourable funding conditions for banks;
the withdrawal process will be difficult to manage and
will likely take significant time. Nevertheless, the process
has started and we remain hopeful it can continue
without severe discontinuities.
2 It should be noted that not all of the principal injected is expected to be repaid due to insolvencies
3 Source: SIGTARP Quarterly Report to Congress, July 24th 2013
THE SHAPE OF THINGS TO COME
Copyright © 2013 Oliver Wyman 15
EXHIBIT 11: HALF OF THE CAPITAL PROVIDED TO THE EU BANKING SECTOR HAS COME FROM THE STATECAPITAL RAISED BY EU BANKS, BY SOURCE, H2 2007-H1 2013
100
50
150
200
H2-2007 2008 2009 2010 2011 2012 H1-2013
0
250€BN
Private
State
Source: European Commission, Company reports, Company websites, Factiva, Oliver Wyman analysis
EXHIBIT 12: CENTRAL BANKS PROVIDED SIGNIFICANT LIQUIDITY SUPPORT, THOUGH THIS IS NOW REDUCINGTOTAL ASSETS OF ECB AND BANK OF ENGLAND, 2007-H1 2013
0 ECB
BOE
2.0
1.0
3.0
4.0
€TN
Q1‘07
Q1‘08
Q1‘09
Q1’11
Q1‘10
Q1‘12
Q1‘13
Source: ECB, Bank of England, Oliver Wyman analysis
EXHIBIT 13: BANKS HAVE IMPROVED CAPITAL RATIOS THROUGH RAISING CAPITAL AND REDUCING RISK-WEIGHTING OF THEIR ASSET PORTFOLIOS
EVOLUTION OF CAPITAL, ASSETS, RISK WEIGHTING AND CAPITAL RATIO, 2007-2012
80 8
120 12
100 10
60 6
40 4
20 2
140 14
2007 2008 2009 2010 20122011
00
160 16
TOTAL ASSETS, T1 CAPITAL2007 = 100
T1 RATIO%
Total assets
Tier 1 capital
Tier 1 capital ratio
39 35 38 37 35 34Risk weighting*%
Source: Bankscope published by Bureau van Dijk, Company reports, Oliver Wyman analysis
* ‘Risk weighting’ is Total RWAs / Total assets
THE SHAPE OF THINGS TO COME
16 Copyright © 2013 Oliver Wyman
BALKANISATION IS PUTTING PRESSURE ON BANKS TO PULL OUT OF POTENTIALLY ATTRACTIVE MARKETS AND BUSINESS LINES
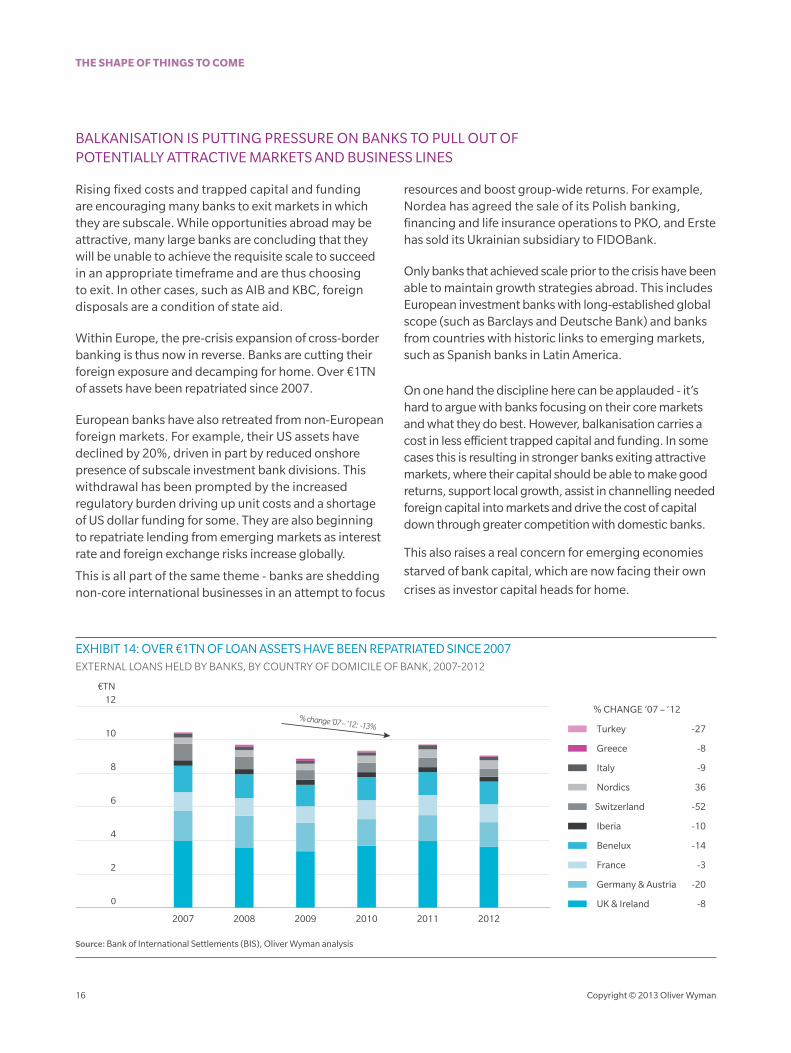
Rising fixed costs and trapped capital and funding are encouraging many banks to exit markets in which they are subscale. While opportunities abroad may be attractive, many large banks are concluding that they will be unable to achieve the requisite scale to succeed in an appropriate timeframe and are thus choosing to exit. In other cases, such as AIB and KBC, foreign disposals are a condition of state aid.
Within Europe, the pre-crisis expansion of cross-border banking is thus now in reverse. Banks are cutting their foreign exposure and decamping for home. Over €1TN of assets have been repatriated since 2007.
European banks have also retreated from non-European foreign markets. For example, their US assets have declined by 20%, driven in part by reduced onshore presence of subscale investment bank divisions. This withdrawal has been prompted by the increased regulatory burden driving up unit costs and a shortage of US dollar funding for some. They are also beginning to repatriate lending from emerging markets as interest rate and foreign exchange risks increase globally.
This is all part of the same theme - banks are shedding non-core international businesses in an attempt to focus
resources and boost group-wide returns. For example, Nordea has agreed the sale of its Polish banking, financing and life insurance operations to PKO, and Erste has sold its Ukrainian subsidiary to FIDOBank.
Only banks that achieved scale prior to the crisis have been able to maintain growth strategies abroad. This includes European investment banks with long-established global scope (such as Barclays and Deutsche Bank) and banks from countries with historic links to emerging markets, such as Spanish banks in Latin America.
On one hand the discipline here can be applauded - it’s hard to argue with banks focusing on their core markets and what they do best. However, balkanisation carries a cost in less efficient trapped capital and funding. In some cases this is resulting in stronger banks exiting attractive markets, where their capital should be able to make good returns, support local growth, assist in channelling needed foreign capital into markets and drive the cost of capital down through greater competition with domestic banks.
This also raises a real concern for emerging economies
starved of bank capital, which are now facing their own
crises as investor capital heads for home.
EXHIBIT 14: OVER €1TN OF LOAN ASSETS HAVE BEEN REPATRIATED SINCE 2007EXTERNAL LOANS HELD BY BANKS, BY COUNTRY OF DOMICILE OF BANK, 2007-2012
€TN
6
8
2
4
10
2007 2008 2009 2010 2011 2012
12
0
% CHANGE ’07 – ‘12
UK & Ireland -8
Germany & Austria -20
France -3
Benelux -14
Iberia -10
Switzerland -52
Nordics 36
Italy -9
Greece -8
Turkey -27% change ’07 – ’12: -13%
Source: Bank of International Settlements (BIS), Oliver Wyman analysis
THE SHAPE OF THINGS TO COME
Copyright © 2013 Oliver Wyman 17
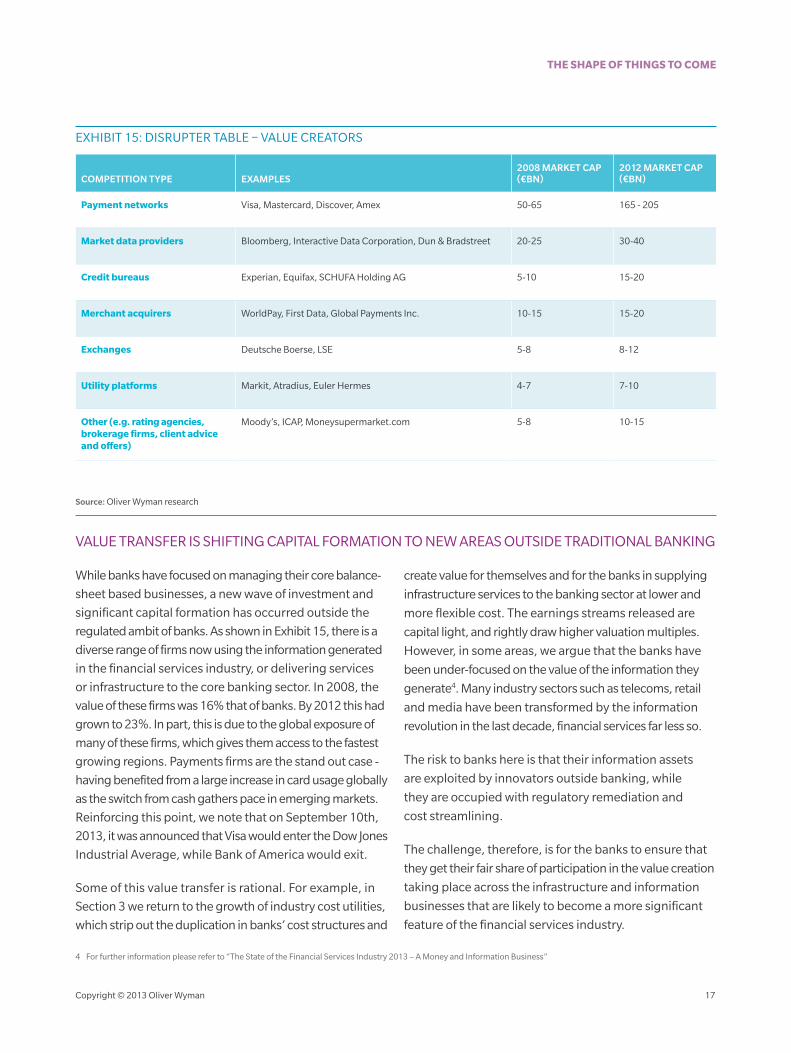
EXHIBIT 15: DISRUPTER TABLE – VALUE CREATORS
COMPETITION TYPE EXAMPLES2008 MARKET CAP (€BN)
2012 MARKET CAP (€BN)
Payment networks Visa, Mastercard, Discover, Amex 50-65 165 - 205
Market data providers Bloomberg, Interactive Data Corporation, Dun & Bradstreet 20-25 30-40
Credit bureaus Experian, Equifax, SCHUFA Holding AG 5-10 15-20
Merchant acquirers WorldPay, First Data, Global Payments Inc. 10-15 15-20
Exchanges Deutsche Boerse, LSE 5-8 8-12
Utility platforms Markit, Atradius, Euler Hermes 4-7 7-10
Other (e.g. rating agencies, brokerage firms, client advice and offers)
Moody’s, ICAP, Moneysupermarket.com 5-8 10-15
Source: Oliver Wyman research
VALUE TRANSFER IS SHIFTING CAPITAL FORMATION TO NEW AREAS OUTSIDE TRADITIONAL BANKING
While banks have focused on managing their core balance-
sheet based businesses, a new wave of investment and
significant capital formation has occurred outside the
regulated ambit of banks. As shown in Exhibit 15, there is a
diverse range of firms now using the information generated
in the financial services industry, or delivering services
or infrastructure to the core banking sector. In 2008, the
value of these firms was 16% that of banks. By 2012 this had
grown to 23%. In part, this is due to the global exposure of
many of these firms, which gives them access to the fastest
growing regions. Payments firms are the stand out case -
having benefited from a large increase in card usage globally
as the switch from cash gathers pace in emerging markets.
Reinforcing this point, we note that on September 10th,
2013, it was announced that Visa would enter the Dow Jones
Industrial Average, while Bank of America would exit.
Some of this value transfer is rational. For example, in
Section 3 we return to the growth of industry cost utilities,
which strip out the duplication in banks’ cost structures and
create value for themselves and for the banks in supplying
infrastructure services to the banking sector at lower and
more flexible cost. The earnings streams released are
capital light, and rightly draw higher valuation multiples.
However, in some areas, we argue that the banks have
been under-focused on the value of the information they
generate4. Many industry sectors such as telecoms, retail
and media have been transformed by the information
revolution in the last decade, financial services far less so.
The risk to banks here is that their information assets
are exploited by innovators outside banking, while
they are occupied with regulatory remediation and
cost streamlining.
The challenge, therefore, is for the banks to ensure that
they get their fair share of participation in the value creation
taking place across the infrastructure and information
businesses that are likely to become a more significant
feature of the financial services industry.
4 For further information please refer to “The State of the Financial Services Industry 2013 – A Money and Information Business”
THE SHAPE OF THINGS TO COME
18 Copyright © 2013 Oliver Wyman
2. RETURNS, LEADERS AND LAGGARDS
2.1. THE COLLAPSE IN ROE
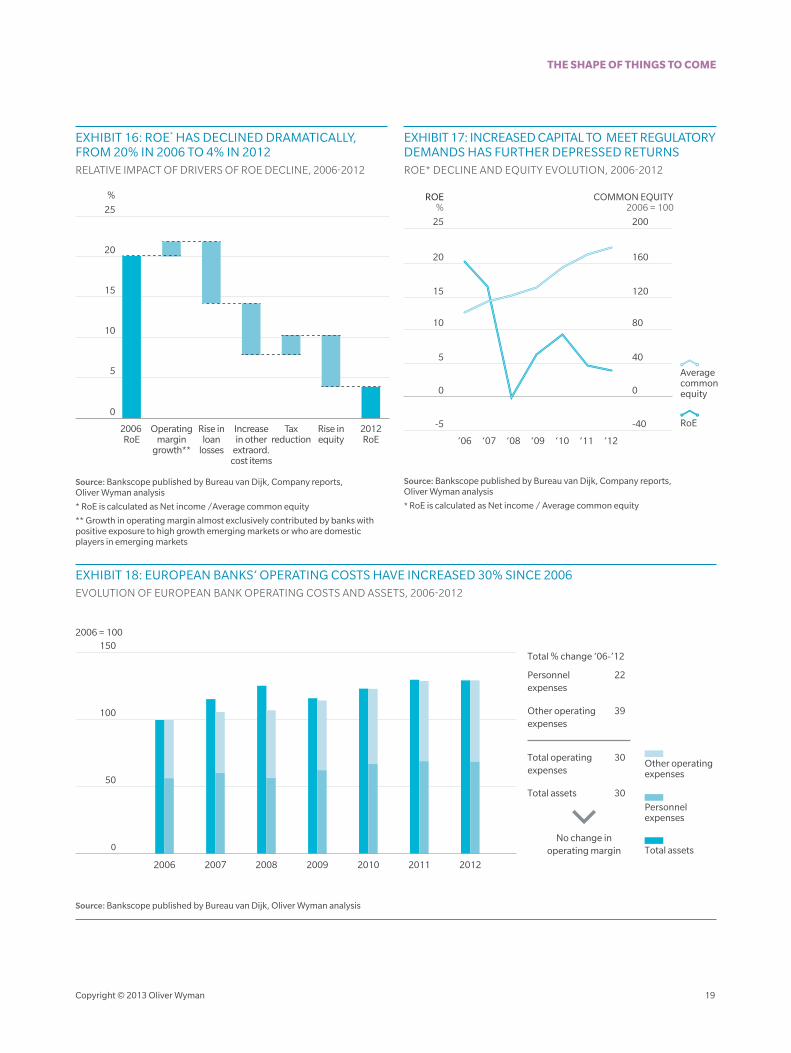
Returns for European banks have collapsed, from highs
of ~20% in 2006 to ~4% in 2012. This is a result of large
provisions for NPLs, a flood of other extraordinary
charges (primarily for restructuring and conduct-related
fines), significantly increased equity-to-asset ratios and
insufficient reduction of operating costs.
The small growth of aggregate industry operating profits has been contributed almost exclusively by banks with positive exposure to high growth emerging markets or who are domestic players in emerging markets, in particular Russia and Turkey.
The cost base of the larger industry players has risen 30% in absolute terms since 2006, equivalent to a CAGR of 4% over the period. For the top 20 European banks the average increase in cost base was €3.5BN or 28%; for the top 50 banks the average increase was almost €2BN or 30%.
This is not because banks have been ignoring costs. On the contrary, most banks are on their second or third round of cost cutting. But the results have disappointed. This is partly because the rise in regulatory and compliance costs has swamped reductions and partly because many of the programmes have targeted tactical headcount reduction (which is quick and cheap) rather than longer term platform overhaul, which is costly and often takes more than three years to repay. Alas, tactical cost reductions are rarely sustainable and the rise in compliance spend is here to stay. As a result, operating costs have remained stubbornly high.
While operating margins have been stable, provisions have been anything but. Provisions for NPLs have significantly reduced earnings, almost quadrupling since 2006. The largest 20 banks in Europe posted provisions of just over €1BN each in 2006 and close to €4.5BN each
in 2012. At the same time, other so called one-off costs have proved enduring, with restructuring costs and industry fines contributing significantly over the period. The combination of provisions for NPLs and these other extraordinary cost items has increased 17x since 2006.
Finally, the increased capital required to satisfy
regulatory demands has further depressed returns.
Common equity in the sector has increased by 75%
in the last six years, on more or less static revenue.
“Returns for European banks have collapsed,
from highs of ~20% in 2006 to ~4% in
2012. This is a result of large provisions
for NPLs, a flood of other extraordinary
charges, significantly increased equity-
to-asset ratios and insufficient reduction of
operating costs.”
THE SHAPE OF THINGS TO COME
Copyright © 2013 Oliver Wyman 19
EXHIBIT 16: ROE* HAS DECLINED DRAMATICALLY, FROM 20% IN 2006 TO 4% IN 2012RELATIVE IMPACT OF DRIVERS OF ROE DECLINE, 2006-2012
15
10
5
20
0
25
%
2006 RoE
Operatingmargin
growth**
Rise inloan
losses
Increasein other
extraord.cost items
Taxreduction
Rise inequity
2012RoE
Source: Bankscope published by Bureau van Dijk, Company reports, Oliver Wyman analysis
* RoE is calculated as Net income /Average common equity
** Growth in operating margin almost exclusively contributed by banks with positive exposure to high growth emerging markets or who are domestic players in emerging markets
EXHIBIT 17: INCREASED CAPITAL TO MEET REGULATORY DEMANDS HAS FURTHER DEPRESSED RETURNSROE* DECLINE AND EQUITY EVOLUTION, 2006-2012
10
5
15
20
-5
0
25
RoE
ROE%
80
40
120
160
-40
0
200
COMMON EQUITY 2006 = 100
‘06 ‘07 ‘08 ‘09 ‘10 ‘11 ‘12
Averagecommonequity
Source: Bankscope published by Bureau van Dijk, Company reports, Oliver Wyman analysis
* RoE is calculated as Net income / Average common equity
EXHIBIT 18: EUROPEAN BANKS’ OPERATING COSTS HAVE INCREASED 30% SINCE 2006 EVOLUTION OF EUROPEAN BANK OPERATING COSTS AND ASSETS, 2006-2012
2006 = 100
50
100
150
2006 2007 2008 2009 2010 2011 2012
0
Total % change ’06-’12
No change inoperating margin
Total assets 30
Total operatingexpenses
30
Other operatingexpenses
39
Personnelexpenses
22
Total assets
Personnelexpenses
Other operating expenses
Source: Bankscope published by Bureau van Dijk, Oliver Wyman analysis
THE SHAPE OF THINGS TO COME
20 Copyright © 2013 Oliver Wyman
2.2. A CAUTIOUS OUTLOOK
Looking ahead, we expect the continued implementation
of new regulation to drag further on returns. However,
we anticipate three positive tailwinds from normalisation
in NPLs, reduction in extraordinary items and improved
capital management. Effective cost management, which
has proved challenging to date, will be a drag for some,
but those that can make it work will see the benefits in
their returns.
The total cost of the regulatory programme is not yet
fully visible in current returns. With implementation
extending to 2018 (and beyond), this will lead to a
further drag on returns over the coming years. We
expect this drag from five principal sources: the final
implementation of increased capital requirements,
‘ring-fencing’ and resolution plans (which will increase
funding costs), the financial transaction tax in the
Eurozone, conduct policy implementation (which
will increase costs and reduce revenues) and the full
go-live on central counterparty clearing (which will
reduce revenues from market-making). There remain
uncertainties on most of these issues, but we estimate
that they will suppress returns by a further 2%-4% over
the coming period.
The outlook for NPLs and their impact on returns is more
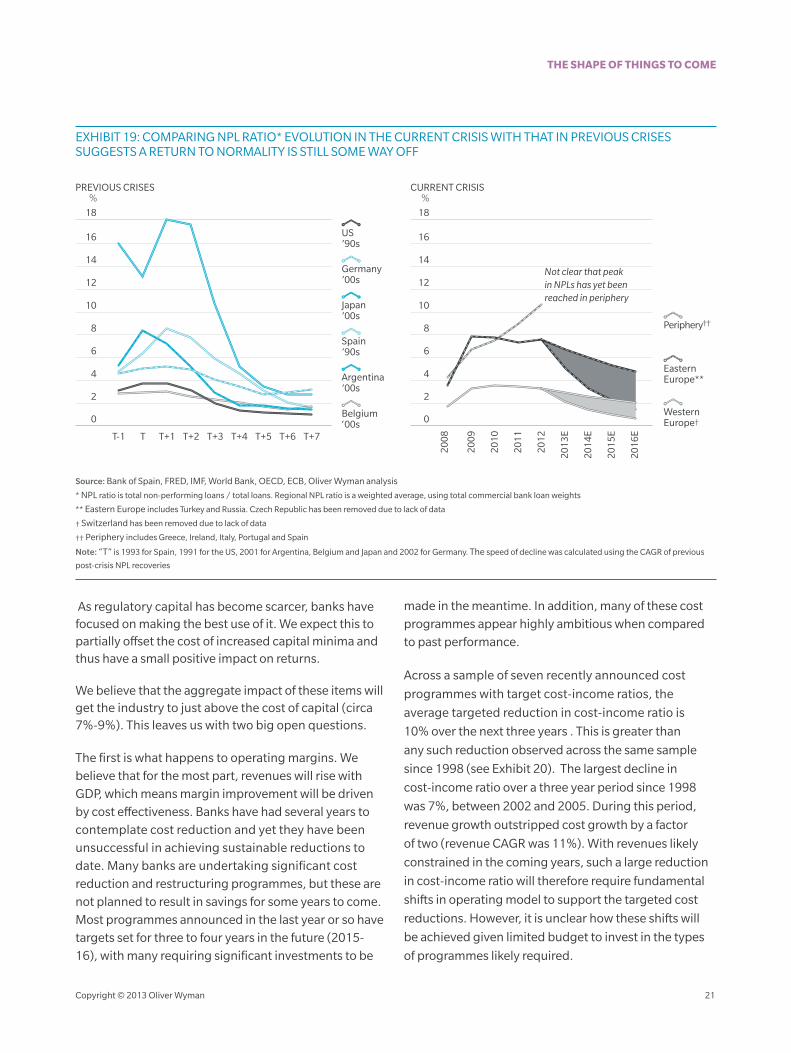
positive, though improvement will be gradual.
Outside-in NPL estimation is hard – and no two crises
are the same. However, using prior crises as a ready
reckoner suggests it will be some time before NPL
levels normalise. Assuming Western European NPLs
have peaked, history suggests a further one to four
years before NPL levels normalise. However, NPL levels
at banks in Western Europe over the first half of 2013
suggest the time to recovery could be even longer. In
Eastern Europe, again assuming the peak has been
reached (given that GDP has returned to pre-crisis
levels), recovery may not come until after 2018. In the
periphery5 it does not appear that the peak has yet been
reached. Given the height NPLs have already reached in
these countries, a return to normality must be some way
off. The timing will depend on the successful resolution
of the European crisis, which will allow economic
stabilisation and a sustainable recovery.
A gradual improvement in NPLs feeds directly into bank
returns. We estimate that, for every 50bps reduction
in NPLs, RoE improves by 1%-1.5%, implying a full
normalisation of NPLs in Europe could translate into 4%-
6% sustainable improvement in returns.
Reductions in other extraordinary items also translate
directly into returns. They have cost the largest 20
banks in Europe €1BN per bank per year on average
over the last three years. We expect the existing issues,
such as derivatives and insurance mis-selling and index
manipulation, to continue to drag for at least one or
two years. But if the industry can reduce the frequency
of such events to pre-crisis levels (a big if), this would
translate into a 2%-3% benefit to returns.
“Looking ahead, we expect the continued
implementation of new regulation to drag
further on returns. However, we anticipate three positive tailwinds
from normalisation in NPLs, reduction
in extraordinary items and improved
capital management.”5 Periphery includes Greece, Ireland, Italy, Portugal and Spain
THE SHAPE OF THINGS TO COME
Copyright © 2013 Oliver Wyman 21
EXHIBIT 19: COMPARING NPL RATIO* EVOLUTION IN THE CURRENT CRISIS WITH THAT IN PREVIOUS CRISES SUGGESTS A RETURN TO NORMALITY IS STILL SOME WAY OFF
PREVIOUS CRISES %
18
T+2T-1 T T+1 T+3 T+4 T+5 T+6 T+7
16
14
12
10
2
4
6
8
0
2008
2009
2010
2011
2012
2013
E
2014
E
2016
E
2015
E
18
16
14
12
10
2
4
6
8
0
CURRENT CRISIS %
Not clear that peak in NPLs has yet beenreached in periphery
Argentina’00s
Spain’90s
Japan’00s
Germany’00s
US’90s
WesternEurope†
EasternEurope**
Periphery††
Belgium‘00s
Source: Bank of Spain, FRED, IMF, World Bank, OECD, ECB, Oliver Wyman analysis
* NPL ratio is total non-performing loans / total loans. Regional NPL ratio is a weighted average, using total commercial bank loan weights
** Eastern Europe includes Turkey and Russia. Czech Republic has been removed due to lack of data
† Switzerland has been removed due to lack of data
†† Periphery includes Greece, Ireland, Italy, Portugal and Spain
Note: “T” is 1993 for Spain, 1991 for the US, 2001 for Argentina, Belgium and Japan and 2002 for Germany. The speed of decline was calculated using the CAGR of previous
post-crisis NPL recoveries
As regulatory capital has become scarcer, banks have focused on making the best use of it. We expect this to partially offset the cost of increased capital minima and thus have a small positive impact on returns.
We believe that the aggregate impact of these items will get the industry to just above the cost of capital (circa 7%-9%). This leaves us with two big open questions.
The first is what happens to operating margins. We
believe that for the most part, revenues will rise with
GDP, which means margin improvement will be driven
by cost effectiveness. Banks have had several years to
contemplate cost reduction and yet they have been
unsuccessful in achieving sustainable reductions to
date. Many banks are undertaking significant cost
reduction and restructuring programmes, but these are
not planned to result in savings for some years to come.
Most programmes announced in the last year or so have
targets set for three to four years in the future (2015-
16), with many requiring significant investments to be
made in the meantime. In addition, many of these cost
programmes appear highly ambitious when compared
to past performance.
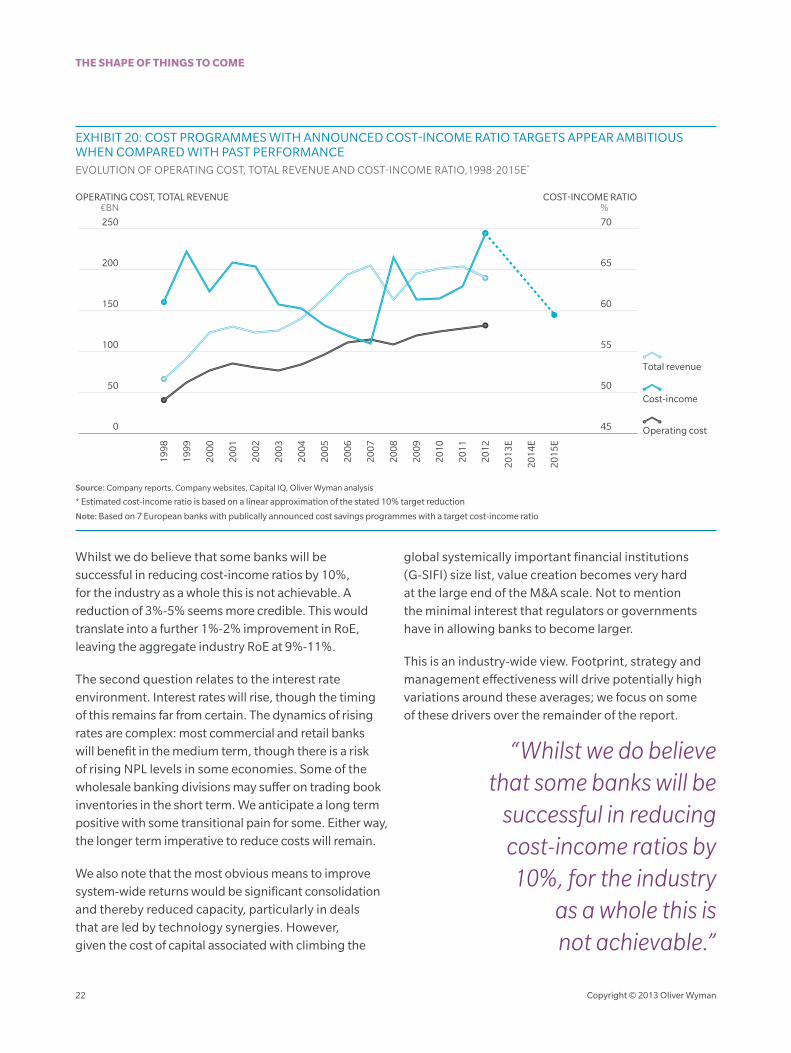
Across a sample of seven recently announced cost
programmes with target cost-income ratios, the
average targeted reduction in cost-income ratio is
10% over the next three years . This is greater than
any such reduction observed across the same sample
since 1998 (see Exhibit 20). The largest decline in
cost-income ratio over a three year period since 1998
was 7%, between 2002 and 2005. During this period,
revenue growth outstripped cost growth by a factor
of two (revenue CAGR was 11%). With revenues likely
constrained in the coming years, such a large reduction
in cost-income ratio will therefore require fundamental
shifts in operating model to support the targeted cost
reductions. However, it is unclear how these shifts will
be achieved given limited budget to invest in the types
of programmes likely required.
THE SHAPE OF THINGS TO COME
22 Copyright © 2013 Oliver Wyman
EXHIBIT 20: COST PROGRAMMES WITH ANNOUNCED COST-INCOME RATIO TARGETS APPEAR AMBITIOUS WHEN COMPARED WITH PAST PERFORMANCEEVOLUTION OF OPERATING COST, TOTAL REVENUE AND COST-INCOME RATIO,1998-2015E*
OPERATING COST, TOTAL REVENUE €BN
COST-INCOME RATIO %
200 65
150 60
100 55
50 50
250 70
0 45
1998
1999
2000
2001
2002
2003
2004
2005
2006
2007
2009
2010
2011
2013
E
2014
E
2008
2012
2015
E
Total revenue
Operating cost
Cost-income
Source: Company reports, Company websites, Capital IQ, Oliver Wyman analysis
* Estimated cost-income ratio is based on a linear approximation of the stated 10% target reduction
Note: Based on 7 European banks with publically announced cost savings programmes with a target cost-income ratio
Whilst we do believe that some banks will be successful in reducing cost-income ratios by 10%, for the industry as a whole this is not achievable. A reduction of 3%-5% seems more credible. This would translate into a further 1%-2% improvement in RoE, leaving the aggregate industry RoE at 9%-11%.
The second question relates to the interest rate environment. Interest rates will rise, though the timing of this remains far from certain. The dynamics of rising rates are complex: most commercial and retail banks will benefit in the medium term, though there is a risk of rising NPL levels in some economies. Some of the wholesale banking divisions may suffer on trading book inventories in the short term. We anticipate a long term positive with some transitional pain for some. Either way, the longer term imperative to reduce costs will remain.
We also note that the most obvious means to improve system-wide returns would be significant consolidation and thereby reduced capacity, particularly in deals that are led by technology synergies. However, given the cost of capital associated with climbing the
global systemically important financial institutions (G-SIFI) size list, value creation becomes very hard at the large end of the M&A scale. Not to mention the minimal interest that regulators or governments have in allowing banks to become larger.
This is an industry-wide view. Footprint, strategy and management effectiveness will drive potentially high variations around these averages; we focus on some of these drivers over the remainder of the report.
“Whilst we do believe that some banks will be
successful in reducing cost-income ratios by 10%, for the industry
as a whole this is not achievable.”
THE SHAPE OF THINGS TO COME
Copyright © 2013 Oliver Wyman 23
2.3. SOVEREIGN INFLUENCE – THERE’S NO PLACE LIKE HOME
TIGHTENED SHACKLES ON PERFORMANCE
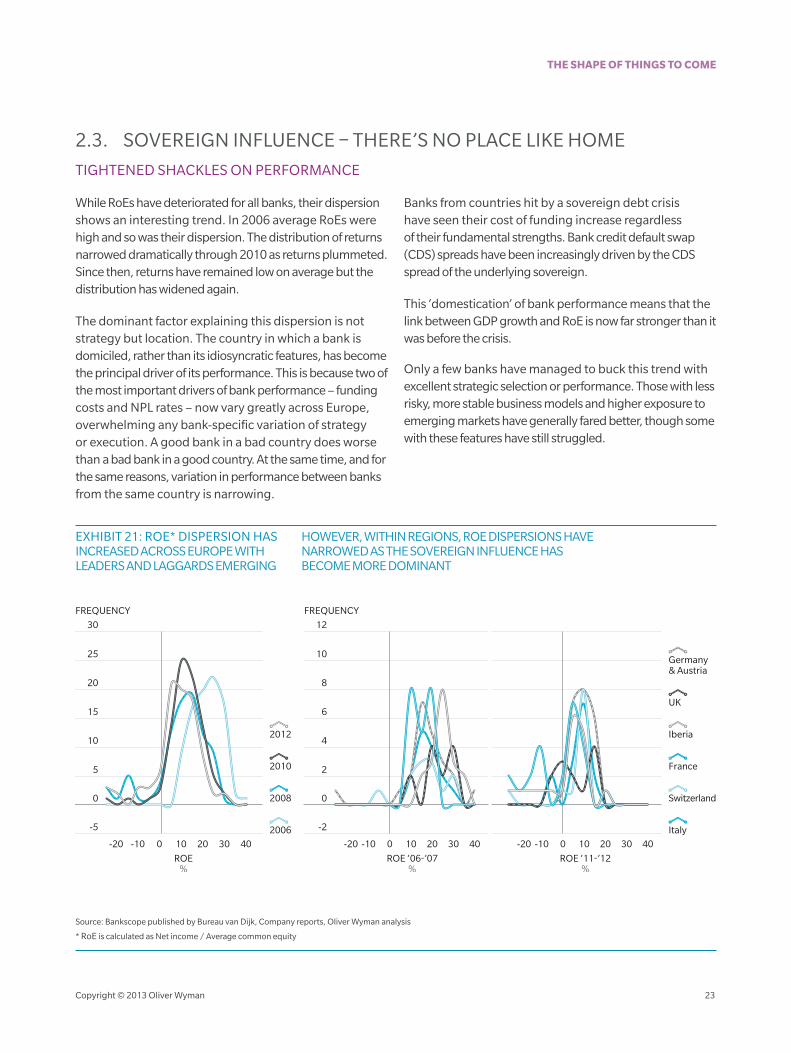
While RoEs have deteriorated for all banks, their dispersion shows an interesting trend. In 2006 average RoEs were high and so was their dispersion. The distribution of returns narrowed dramatically through 2010 as returns plummeted. Since then, returns have remained low on average but the distribution has widened again.
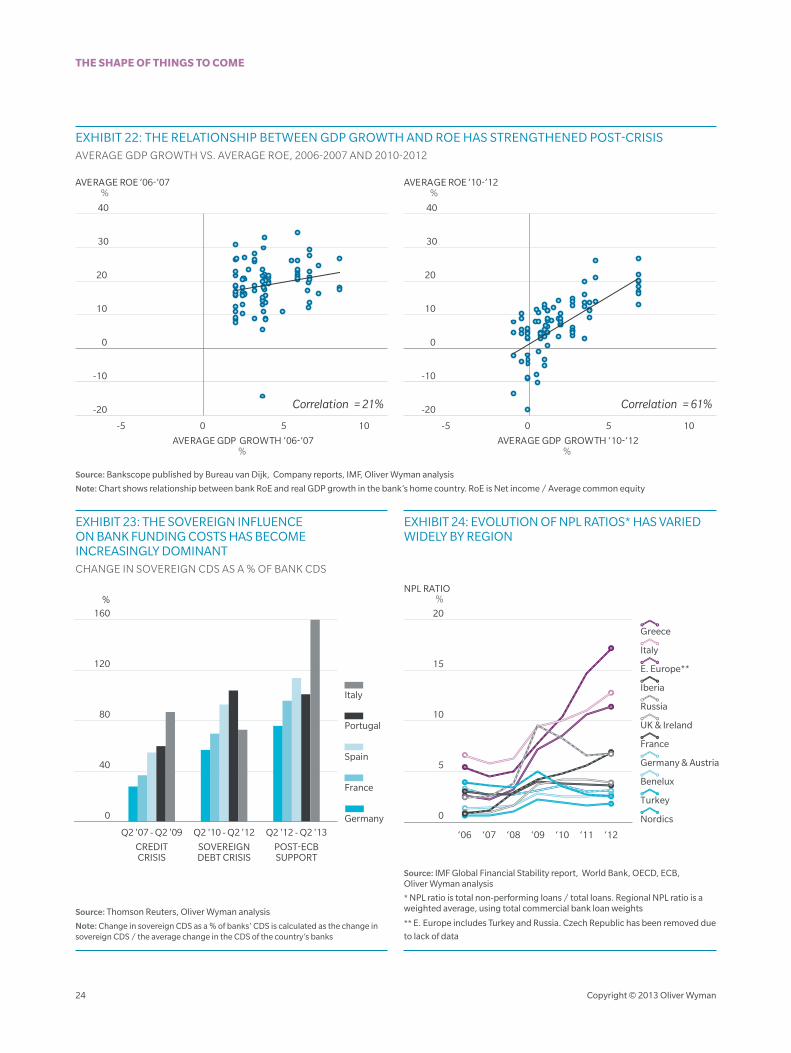
The dominant factor explaining this dispersion is not strategy but location. The country in which a bank is domiciled, rather than its idiosyncratic features, has become the principal driver of its performance. This is because two of the most important drivers of bank performance – funding costs and NPL rates – now vary greatly across Europe, overwhelming any bank-specific variation of strategy or execution. A good bank in a bad country does worse than a bad bank in a good country. At the same time, and for the same reasons, variation in performance between banks from the same country is narrowing.
Banks from countries hit by a sovereign debt crisis have seen their cost of funding increase regardless of their fundamental strengths. Bank credit default swap (CDS) spreads have been increasingly driven by the CDS spread of the underlying sovereign.
This ‘domestication’ of bank performance means that the link between GDP growth and RoE is now far stronger than it was before the crisis.
Only a few banks have managed to buck this trend with excellent strategic selection or performance. Those with less risky, more stable business models and higher exposure to emerging markets have generally fared better, though some with these features have still struggled.
EXHIBIT 21: ROE* DISPERSION HAS
ROE%
20-10 0 10 30 40-20
-5
30
25
0
20
10
5
15
FREQUENCY
ROE ‘06-’07%
20-10 0 10 30 40-20
-2
12
10
0
8
4
2
6
FREQUENCY
ROE ‘11-’12%
20-10 0 10 30 40-20
Italy
Switzerland
France
Iberia
2006
2008
2010
2012
UK
Germany & Austria
Source: Bankscope published by Bureau van Dijk, Company reports, Oliver Wyman analysis
* RoE is calculated as Net income / Average common equity
HOWEVER, WITHIN REGIONS, ROE DISPERSIONS HAVE NARROWED AS THE SOVEREIGN INFLUENCE HAS BECOME MORE DOMINANT
INCREASED ACROSS EUROPE WITH LEADERS AND LAGGARDS EMERGING
THE SHAPE OF THINGS TO COME
24 Copyright © 2013 Oliver Wyman
EXHIBIT 22: THE RELATIONSHIP BETWEEN GDP GROWTH AND ROE HAS STRENGTHENED POST-CRISISAVERAGE GDP GROWTH VS. AVERAGE ROE, 2006-2007 AND 2010-2012
10
0
30
20
-10
-20
40
10
0
30
20
-20
40
-10
1050-5
AVERAGE GDP GROWTH ‘10-’12%
Correlation = 21%
1050-5
Correlation = 61%
AVERAGE GDP GROWTH ‘06-’07%
AVERAGE ROE ’06-’07 %
AVERAGE ROE ’10-’12 %
Source: Bankscope published by Bureau van Dijk, Company reports, IMF, Oliver Wyman analysis
Note: Chart shows relationship between bank RoE and real GDP growth in the bank’s home country. RoE is Net income / Average common equity
EXHIBIT 23: THE SOVEREIGN INFLUENCE ON BANK FUNDING COSTS HAS BECOME INCREASINGLY DOMINANTCHANGE IN SOVEREIGN CDS AS A % OF BANK CDS
40
80
120
160%
Germany
France
Spain
Portugal
Italy
Q2 '10 - Q2 '12
SOVEREIGNDEBT CRISIS
Q2 '12 - Q2 '13
POST-ECBSUPPORT
Q2 '07 - Q2 '09
CREDITCRISIS
0
Source: Thomson Reuters, Oliver Wyman analysis
Note: Change in sovereign CDS as a % of banks’ CDS is calculated as the change in sovereign CDS / the average change in the CDS of the country’s banks
EXHIBIT 24: EVOLUTION OF NPL RATIOS* HAS VARIED WIDELY BY REGION
NPL RATIO %
20
0
15
10
5
Nordics
France
UK & Ireland
E. Europe**
Italy
Turkey
Iberia
Russia
Greece
Benelux
Germany & Austria
‘06 ‘07 ‘08 ‘10 ‘11‘09 ‘12
Source: IMF Global Financial Stability report, World Bank, OECD, ECB, Oliver Wyman analysis
* NPL ratio is total non-performing loans / total loans. Regional NPL ratio is a weighted average, using total commercial bank loan weights
** E. Europe includes Turkey and Russia. Czech Republic has been removed due
to lack of data
THE SHAPE OF THINGS TO COME
Copyright © 2013 Oliver Wyman 25
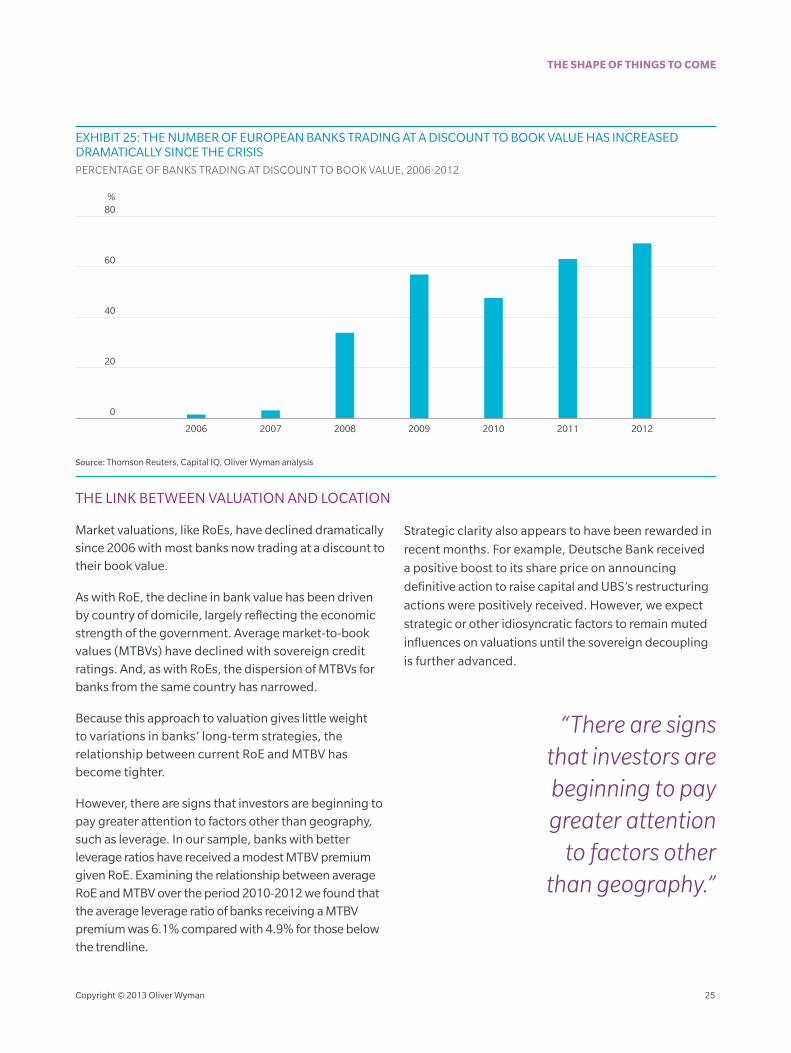
EXHIBIT 25: THE NUMBER OF EUROPEAN BANKS TRADING AT A DISCOUNT TO BOOK VALUE HAS INCREASED DRAMATICALLY SINCE THE CRISIS PERCENTAGE OF BANKS TRADING AT DISCOUNT TO BOOK VALUE, 2006-2012
40
60
20
80%
2006 2007 2008 2009 2010 2011 2012
0
Source: Thomson Reuters, Capital IQ, Oliver Wyman analysis
THE LINK BETWEEN VALUATION AND LOCATION
Market valuations, like RoEs, have declined dramatically since 2006 with most banks now trading at a discount to their book value.
As with RoE, the decline in bank value has been driven by country of domicile, largely reflecting the economic strength of the government. Average market-to-book values (MTBVs) have declined with sovereign credit ratings. And, as with RoEs, the dispersion of MTBVs for banks from the same country has narrowed.
Because this approach to valuation gives little weight to variations in banks’ long-term strategies, the relationship between current RoE and MTBV has become tighter.
However, there are signs that investors are beginning to pay greater attention to factors other than geography, such as leverage. In our sample, banks with better leverage ratios have received a modest MTBV premium given RoE. Examining the relationship between average RoE and MTBV over the period 2010-2012 we found that the average leverage ratio of banks receiving a MTBV premium was 6.1% compared with 4.9% for those below the trendline.
Strategic clarity also appears to have been rewarded in
recent months. For example, Deutsche Bank received
a positive boost to its share price on announcing
definitive action to raise capital and UBS’s restructuring
actions were positively received. However, we expect
strategic or other idiosyncratic factors to remain muted
influences on valuations until the sovereign decoupling
is further advanced.
“There are signs that investors are beginning to pay greater attention
to factors other than geography.”
THE SHAPE OF THINGS TO COME
26 Copyright © 2013 Oliver Wyman
EXHIBIT 26: DIVERGENCE IN MARKET-TO-BOOK VALUES (MTBVS) HAS DECREASED WITHIN NATIONS AS THE STRENGTH OF THE SOVEREIGN HAS BECOME THE DOMINANT FACTOR EVOLUTION OF BANK MTBV INTERQUARTILE RANGE, BY REGION, 2007-2012
2007 2008 2010 20112009 2012
0.6
0.4
0.2
0.0
1.4
1.2
1.0
0.8
4-QUARTER ROLLING AVERAGE
France
Germany & Austria
Iberia
Italy
Nordics
Switzerland
Turkey
UK & Ireland
Europe
Source: Thomson Reuters, Capital IQ, Oliver Wyman analysis
EXHIBIT 27: THE RELATIONSHIP BETWEEN ROE* AND MTBV HAS STRENGTHENEDROE AND MTBV DEVIATION FROM MEAN, PRE- AND POST-CRISIS
210-1-2-3
ROE DEVIATION FROM MEAN ’10-‘12
Correlation = 43%
210-1-2-3
Correlation = 73%
ROE DEVIATION FROM MEAN ’06-’07
MTBV DEVIATION FROM MEAN ’06-’07 MTBV DEVIATION FROM MEAN ’10-‘12
1
-1
0
2
-2
3
1
-1
0
2
-2
3
Source: Bankscope published by Bureau van Dijk, Capital IQ, Company reports, Thomson Reuters, Oliver Wyman analysis
* RoE is calculated as Net income / Average common equity

THE SHAPE OF THINGS TO COME
Copyright © 2013 Oliver Wyman 27
2.4. DELEVERAGING AND DECOUPLING
WHAT NEXT ON THE DELEVERAGE STAND-OFF?
We noted in Section 1 that the banking sector’s balance
sheet remained largely undiminished over the last five
years, and potential buyers of bank assets have been
serially disappointed by the lack of opportunities. A
stand-off has set in, where few sellers are willing to part
with assets at the prices on offer.
The most obvious explanation for this is the liquidity
provided by central banks, coupled with incentives
to buy domestic government bonds and to lend to
other domestic borrowers. Additionally, the European
credit intermediation market structure remains
widely dominated by banks, leaving limited room
for deleveraging levels comparable to US standards.
Yet banks have two further reasons to avoid asset
reduction. First, as fixed costs have proved difficult to
bring down, banks have been very reluctant to lose
assets that generate net interest margin to help cover
costs. Second, tightly capitalised banks have been
reluctant to incur accounting losses through asset
disposals, preferring to work them out over time. We
believe these conditions will continue to impact the
scale of asset reductions in the deleverage programme
in Europe. However, we anticipate that the stand-off
will relax and we are likely to see a significant increase
in balance sheet restructuring, driven by two factors.
The first factor is the new regulatory focus on CRD IV
leverage ratio. Many banks in Europe have become
highly leveraged. Using published figures for core tier 1
equity and total IFRS assets to calculate a proxy for the
CRD IV leverage ratio across our sample of banks, reveals
that a small but significant proportion of European
banks do not satisfy the proposed 3% minimum leverage
ratio, even on this basis.
The second factor is the impending Eurozone AQR, which
may also accelerate deleveraging, particularly in the most
challenged economies. Spain presents an interesting case
study in this regard. The transparency and confidence
introduced by a rigorous stress test carried out in 2012
has resulted in a wave of asset sales, restructuring and
consolidation that is rapidly putting the banking sector
on a more stable footing.
“The banking sector’s balance sheet has remained largely undiminished over the last five years. A stand-off has set in, where
few sellers are willing to part with assets at the prices on offer.”
THE SHAPE OF THINGS TO COME
28 Copyright © 2013 Oliver Wyman
THE DECOUPLING QUANDARY
The high degree of sovereign influence on returns
and valuations raises important questions around
decoupling. By decoupling we mean the scope for the
performance, risk profile and valuation of the banks to
separate from their sovereign, and indeed vice versa.
Banks and governments have a number of inherent
links. Banks have been large beneficiaries of the
significant government liquidity and equity injections.
Government balance sheets are now directly exposed
to the performance of the banking sector through these
injections. In addition, the broader economy is reliant on
a functioning banking system to support growth, which
in turn impacts government deficit positions. Both now
seek to decouple their fortunes. Much of this is in the
hands of the public sector. First, through central banks
managing an orderly withdrawal of public funding and
capital and tapering of QE, though these will be highly
challenging tasks. Second, through the establishment
of the much discussed European stability mechanisms,
resolution authorities and insurance schemes.
However, the banks have levers too, which we expect
to come more forcefully into play. The ramp up of bail-in
programmes, finalisation of Recovery & Resolution
plans and push to get ahead of the regulatory agenda
on legal entity structure are all tasks we see as having a
material impact on decoupling and therefore on each
bank’s ability to drive more idiosyncratic performance
and valuation.
Naturally the banks that have led on these initiatives
have been those for whom decoupling offers the
greatest immediate upside - typically those either in
economies with outsized banking sectors relative to
GDP (where regulators have been keen to encourage
decoupling), or where banking stability outstrips
sovereign stability, limiting the costs of the move. At
the other end of the spectrum, pressure to push the
decoupling agenda has been lower for struggling banks.
Currently the linkage is very much two-way. Many
banks own big government bond portfolios as part of
their liquid asset buffers and more generally on the
balance sheet. This connection further strengthens the
sovereign/bank credit feedback loop. The purchase of
these bonds by domestic banks has been crucial to the
sovereign’s ability to refinance itself.
Decoupling is likely to gather pace – as more banks
loosen the sovereign ties pressure will mount on the
slower movers. Laggards will start to bump up against
the timetable for finalisation of resolution plans and, in
some jurisdictions, the deadlines for ring-fencing.
The decoupling agenda is complex and will remain
opaque and political. Nevertheless, it is a key strategic
theme across the industry.
“The decoupling agenda is complex and will
remain opaque and political. Nevertheless, it
is a key strategic theme across the industry.”

THE SHAPE OF THINGS TO COME
Copyright © 2013 Oliver Wyman 29
EXHIBIT 28: TIMEFRAME FOR IMPLEMENTATION OF RECOVERY AND RESOLUTION DIRECTIVE (RRD) AND BASEL III REQUIREMENTS
2013 2014 2015 2016 2017 2018 2019
Recovery and Resolution Directive (RRD)
•By end 2013: Major EU cross-border banks to provide recovery plans
•By 31st Dec: Member States required to transpose RRD requirements into national law (with the exception of the bail-in tool)
•Bail-in tool implemented
BA
SE
L II
I SE
LEC
T R
EQ
UIR
EM
EN
TS
Capital levels
•Start of phase-in of higher capital requirements
•Higher minimum capital requirements fully imple- mented (excluding conservation buffer)
•Start of phase-in of gradual conservation buffer (0.625% rising to 2.5% by 2019)
•Conservation buffer fully implemented (2.5%)
Leverage ratio
•Start of test period; supervisory tracking but not disclosed or mandatory
•Public disclosure begins, but ratio not yet mandatory
•End of test period; final adjustments to ratio based on test phases
•Ratio becomes mandatory reporting requirement
Liquidity coverage ratio (LCR)
• (Observation period began in 2011)
• Introduced as standard at 60%, increasing by 10% each year until 2019
•LCR set at 100%
•Mandatory reporting
Net Stable Funding Ratio (NSFR)
• (Observation period began in 2012)
• Introduced as standard
Sources: BIS, Oliver Wyman research
Note: Timeline is not comprehensive of all regulatory requirements to be introduced, but is intended to highlight those which will potentially have greatest impact
on reducing sovereign-bank coupling. All dates are 1st Jan, unless otherwise stated
THE SHAPE OF THINGS TO COME
30 Copyright © 2013 Oliver Wyman
3. THE CHALLENGES FOR BANKS
Banks face three key challenges moving forward:
1. Choosing between a bond-like or an equity-like strategy
2. Getting deleveraging and decoupling right
3. Channelling investment
3.1. A BOND OR EQUITY STRATEGY
The outlook across Europe is challenging for bank CEOs.
Although economic conditions are beginning to improve
and the drag from loan losses and other extraordinary
items should reduce, continued implementation of
regulation and a weakened economy will continue to
test bank management for some years to come.
In this context, bank CEOs should choose between a
conservative and a risky strategy. They can hunker down
in home markets and focus on delivering operating
efficiencies and gaining market share. This strategy will
deliver low and stable, bond-like returns. Alternatively,
they can take a more buccaneering approach, investing
in new markets to deliver earnings growth. This will
deliver more volatile, equity-like returns.
The bond-like strategy involves reducing risk weighted
assets (RWAs) to cut capital requirements, cleaning up
the balance sheet, managing NPLs well, creating a leaner
bank and cutting regulatory jurisdictions. The benefits
should be largely distributed to shareholders through a
significant dividend programme. Revenue growth will
be unlikely to outstrip GDP growth, but the operating
efficiencies, transparency of earnings drivers and regular
dividend payouts will be positively valued by the markets.
Sentiment is warming to this strategy. Dividend
announcements in recent months (positive or negative)
have had a more material effect on share prices than
might have been expected. To some extent this strategy
represents a move ‘back to the future’, as banks aspire to
provide an attractive home for low-risk capital searching
for reliable dividends.
The term ‘utility’ in banking has been used with
largely derogatory tones, a clipping of banks’ wings
by regulators and governments. However, if what we
describe as a bond-like strategy is close to a utility
bank, then this arguably provides a clear, attractive and
laudable strategy and one which the market will reward
if successfully executed.
An equity-like strategy involves investing capital to support growth and increase earnings potential, extending services to new segments or new countries, or moving into ancillary lines of business. It rests on convincing shareholders that significant earnings should be retained and re-invested.
Most banks will think of themselves as doing something in-between – a hybrid of some sort. For example, delivering operational efficiency ‘at home’ while investing selectively to build growth in new areas – like a bond with some yield enhancement. Alternatively, they may adopt a ‘convertible bond’ strategy. That is, they may aim to follow the bond strategy by focusing on efficiency in core activities for one or two years until capital is less constrained (perhaps on account of retained earnings), at which point they will begin to invest in earnest in growth opportunities.
We advocate care with these hybrid strategies. Banks risk getting caught between two stools. A bond-like strategy that doesn’t have adequate retained capital to deliver dividends, or continues to deliver negative unexpected news to the market, is likely to be received badly by investors. That may not matter much if the bank is state-owned, but it pushes re-privatisation
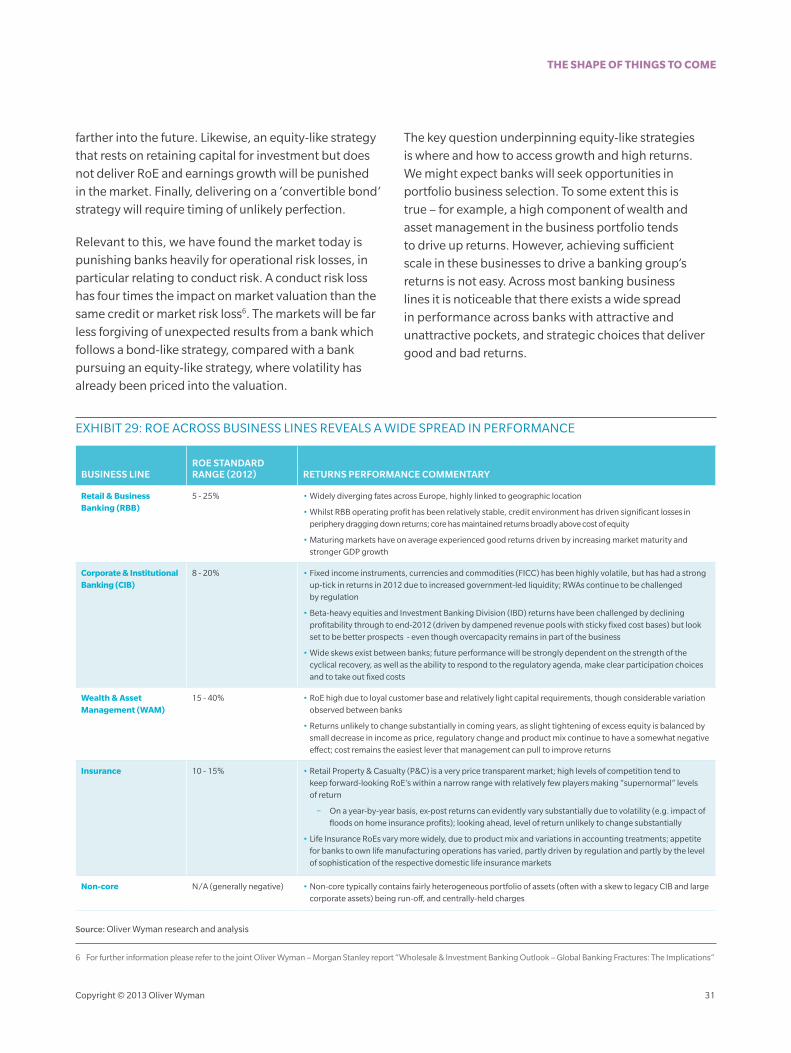
THE SHAPE OF THINGS TO COME
Copyright © 2013 Oliver Wyman 31
farther into the future. Likewise, an equity-like strategy that rests on retaining capital for investment but does not deliver RoE and earnings growth will be punished in the market. Finally, delivering on a ‘convertible bond’ strategy will require timing of unlikely perfection.
Relevant to this, we have found the market today is punishing banks heavily for operational risk losses, in particular relating to conduct risk. A conduct risk loss has four times the impact on market valuation than the same credit or market risk loss6. The markets will be far less forgiving of unexpected results from a bank which follows a bond-like strategy, compared with a bank pursuing an equity-like strategy, where volatility has already been priced into the valuation.
The key question underpinning equity-like strategies is where and how to access growth and high returns. We might expect banks will seek opportunities in portfolio business selection. To some extent this is true – for example, a high component of wealth and asset management in the business portfolio tends to drive up returns. However, achieving sufficient scale in these businesses to drive a banking group’s returns is not easy. Across most banking business lines it is noticeable that there exists a wide spread in performance across banks with attractive and unattractive pockets, and strategic choices that deliver good and bad returns.
EXHIBIT 29: ROE ACROSS BUSINESS LINES REVEALS A WIDE SPREAD IN PERFORMANCE
BUSINESS LINEROE STANDARD RANGE (2012) RETURNS PERFORMANCE COMMENTARY
Retail & Business Banking (RBB)
5 - 25% • Widely diverging fates across Europe, highly linked to geographic location
• Whilst RBB operating profit has been relatively stable, credit environment has driven significant losses in periphery dragging down returns; core has maintained returns broadly above cost of equity
• Maturing markets have on average experienced good returns driven by increasing market maturity and stronger GDP growth
Corporate & Institutional Banking (CIB)
8 - 20% • Fixed income instruments, currencies and commodities (FICC) has been highly volatile, but has had a strong up-tick in returns in 2012 due to increased government-led liquidity; RWAs continue to be challenged by regulation
• Beta-heavy equities and Investment Banking Division (IBD) returns have been challenged by declining profitability through to end-2012 (driven by dampened revenue pools with sticky fixed cost bases) but look set to be better prospects - even though overcapacity remains in part of the business
• Wide skews exist between banks; future performance will be strongly dependent on the strength of the cyclical recovery, as well as the ability to respond to the regulatory agenda, make clear participation choices and to take out fixed costs
Wealth & Asset Management (WAM)
15 - 40% • RoE high due to loyal customer base and relatively light capital requirements, though considerable variation observed between banks
• Returns unlikely to change substantially in coming years, as slight tightening of excess equity is balanced by small decrease in income as price, regulatory change and product mix continue to have a somewhat negative effect; cost remains the easiest lever that management can pull to improve returns
Insurance 10 - 15% • Retail Property & Casualty (P&C) is a very price transparent market; high levels of competition tend to keep forward-looking RoE’s within a narrow range with relatively few players making “supernormal” levels of return
− On a year-by-year basis, ex-post returns can evidently vary substantially due to volatility (e.g. impact of floods on home insurance profits); looking ahead, level of return unlikely to change substantially
• Life Insurance RoEs vary more widely, due to product mix and variations in accounting treatments; appetite for banks to own life manufacturing operations has varied, partly driven by regulation and partly by the level of sophistication of the respective domestic life insurance markets
Non-core N/A (generally negative) • Non-core typically contains fairly heterogeneous portfolio of assets (often with a skew to legacy CIB and large corporate assets) being run-off, and centrally-held charges
Source: Oliver Wyman research and analysis
6 For further information please refer to the joint Oliver Wyman – Morgan Stanley report “Wholesale & Investment Banking Outlook – Global Banking Fractures: The Implications”

THE SHAPE OF THINGS TO COME
32 Copyright © 2013 Oliver Wyman
By the same token, emerging markets no longer present
the golden opportunity to boost returns they once did.
As shown in Exhibit 30, returns have been dramatically
higher in emerging Europe than in developed Europe
(19% RoE vs. 2% RoE in 2012). However, valuations
reflect this, making further forays expensive. Coupled
with this, recent volatility in some of these markets has
raised warning signals that growth in these markets is
not necessarily just a one way bet. In fact, conditions
raise the question of whether international banks
may start to divest and monetise emerging markets
banking businesses. Banks in emerging markets need
to stay focused on operational excellence to continue to
deliver high returns to justify their ratings. Where banks
can’t do this there may be selective opportunities to
consolidate domestically.
Tapping growth will not be easy over the next cycle. Euro convergence, globalisation, demographic shifts, financial deepening in emerging markets and deregulation were some of the macro dynamics that drove above sector growth for some banks over the last 15 years. In a world of highly constrained capex, successful equity-strategy banks will need sharp insights on the big themes in which to invest over coming years.
3.2. GETTING DELEVERAGING AND DECOUPLING RIGHT
Deleveraging and decoupling will provide significant
challenges. If you dig below the stability of the sector-
wide balance sheet, significant changes in balance
sheet size can be seen at individual banks. Some of the
best-capitalised banks have seized the opportunity to
increase their assets, mainly in the form of loans. At
the same time, some of the less well capitalised banks
have been forced to reduce in size, mainly by shedding
trading securities positions.
EXHIBIT 30: BANKS IN EMERGING* EUROPEAN MARKETS ACHIEVED SIGNIFICANTLY HIGHER ROE** AND MTBV
THAN THEIR COUNTERPARTS IN DEVELOPED MARKETS IN 2012
10
5
20
15
0.6
0.4
0.2
1.0
1.2
0.8
1.4
Developed EmergingDeveloped Emerging
WEIGHTED AVERAGE ROE %
WEIGHTED AVERAGE MTBV
0 0
Source: Bankscope published by Bureau van Dijk, Capital IQ, Company reports, Oliver Wyman analysis
* Eastern Europe, Turkey and Russia are considered emerging economies
** RoE is calculated as Net income / Average common equity
Note: Weighted average calculated using average common equity weights
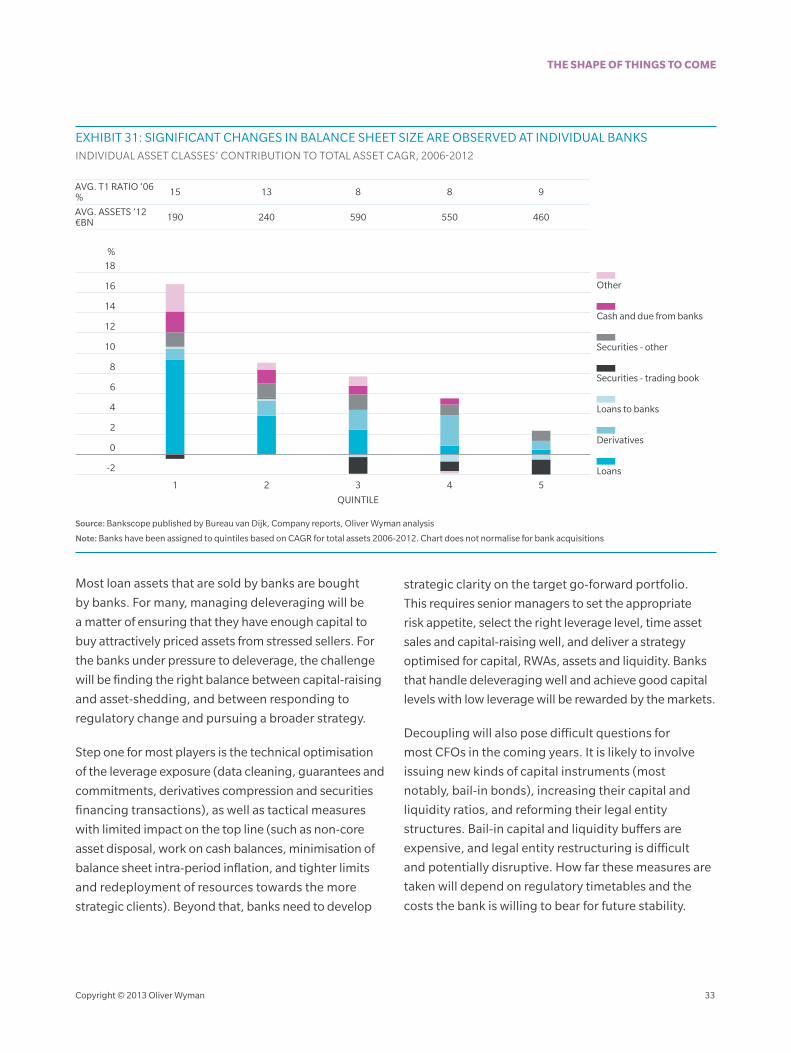
THE SHAPE OF THINGS TO COME
Copyright © 2013 Oliver Wyman 33
EXHIBIT 31: SIGNIFICANT CHANGES IN BALANCE SHEET SIZE ARE OBSERVED AT INDIVIDUAL BANKSINDIVIDUAL ASSET CLASSES’ CONTRIBUTION TO TOTAL ASSET CAGR, 2006-2012
10
14
12
6
8
4
2
-2
18
16
AVG. ASSETS ’12€BN
AVG. T1 RATIO ‘06%
Loans
Derivatives
Loans to banks
Securities - trading book
Securities - other
Cash and due from banks
Other
5
460
9
1
190
15
2
240
13
3
590
8
4
550
8
%
QUINTILE
0
Source: Bankscope published by Bureau van Dijk, Company reports, Oliver Wyman analysis
Note: Banks have been assigned to quintiles based on CAGR for total assets 2006-2012. Chart does not normalise for bank acquisitions
Most loan assets that are sold by banks are bought
by banks. For many, managing deleveraging will be
a matter of ensuring that they have enough capital to
buy attractively priced assets from stressed sellers. For
the banks under pressure to deleverage, the challenge
will be finding the right balance between capital-raising
and asset-shedding, and between responding to
regulatory change and pursuing a broader strategy.
Step one for most players is the technical optimisation
of the leverage exposure (data cleaning, guarantees and
commitments, derivatives compression and securities
financing transactions), as well as tactical measures
with limited impact on the top line (such as non-core
asset disposal, work on cash balances, minimisation of
balance sheet intra-period inflation, and tighter limits
and redeployment of resources towards the more
strategic clients). Beyond that, banks need to develop
strategic clarity on the target go-forward portfolio.
This requires senior managers to set the appropriate
risk appetite, select the right leverage level, time asset
sales and capital-raising well, and deliver a strategy
optimised for capital, RWAs, assets and liquidity. Banks
that handle deleveraging well and achieve good capital
levels with low leverage will be rewarded by the markets.
Decoupling will also pose difficult questions for
most CFOs in the coming years. It is likely to involve
issuing new kinds of capital instruments (most
notably, bail-in bonds), increasing their capital and
liquidity ratios, and reforming their legal entity
structures. Bail-in capital and liquidity buffers are
expensive, and legal entity restructuring is difficult
and potentially disruptive. How far these measures are
taken will depend on regulatory timetables and the
costs the bank is willing to bear for future stability.
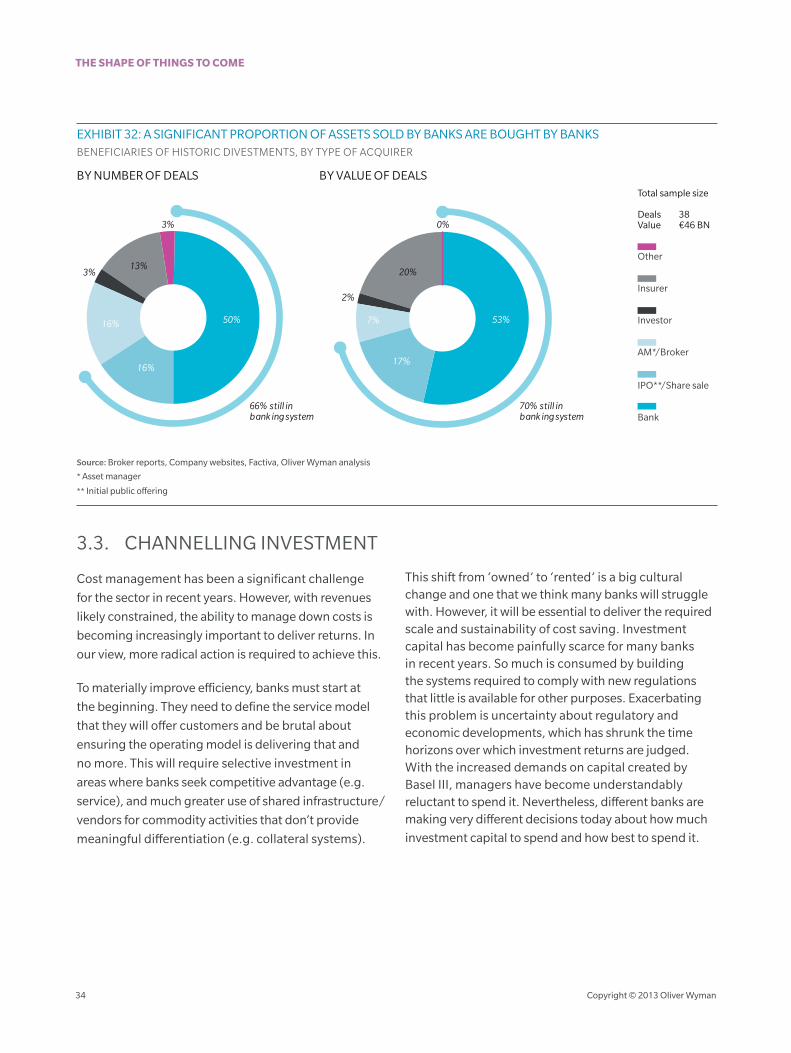
THE SHAPE OF THINGS TO COME
34 Copyright © 2013 Oliver Wyman
EXHIBIT 32: A SIGNIFICANT PROPORTION OF ASSETS SOLD BY BANKS ARE BOUGHT BY BANKSBENEFICIARIES OF HISTORIC DIVESTMENTS, BY TYPE OF ACQUIRER
66% still inbank ing system
70% still inbank ing system
BY VALUE OF DEALSBY NUMBER OF DEALS
50% 53%
20%13%
17%16%
16% 7%
2%
3%
3% 0%
Total sample size
Deals 38Value €46 BN
Bank
IPO**/Share sale
AM*/Broker
Investor
Insurer
Other
Source: Broker reports, Company websites, Factiva, Oliver Wyman analysis
* Asset manager
** Initial public offering
3.3. CHANNELLING INVESTMENT
Cost management has been a significant challenge
for the sector in recent years. However, with revenues
likely constrained, the ability to manage down costs is
becoming increasingly important to deliver returns. In
our view, more radical action is required to achieve this.
To materially improve efficiency, banks must start at
the beginning. They need to define the service model
that they will offer customers and be brutal about
ensuring the operating model is delivering that and
no more. This will require selective investment in
areas where banks seek competitive advantage (e.g.
service), and much greater use of shared infrastructure/
vendors for commodity activities that don’t provide
meaningful differentiation (e.g. collateral systems).
This shift from ‘owned’ to ‘rented’ is a big cultural change and one that we think many banks will struggle with. However, it will be essential to deliver the required scale and sustainability of cost saving. Investment capital has become painfully scarce for many banks in recent years. So much is consumed by building the systems required to comply with new regulations that little is available for other purposes. Exacerbating this problem is uncertainty about regulatory and economic developments, which has shrunk the time horizons over which investment returns are judged. With the increased demands on capital created by Basel III, managers have become understandably reluctant to spend it. Nevertheless, different banks are making very different decisions today about how much
investment capital to spend and how best to spend it.

THE SHAPE OF THINGS TO COME
Copyright © 2013 Oliver Wyman 35
EXHIBIT 33: STRATEGIC SOURCING EXAMPLES
TREND DESCRIPTION EXAMPLE PLAYERS
Increased capabilities of technology vendors
• Increasing scope and vendor capabilities across capital markets driving:
− Consolidation of IT service provider base front-to-back within a given business where achievable
− Alleviated pressure for application rationalisation
− Increased outsourcing of application hosting to third parties
•Murex, Calypso, Sophis
•Fidessa
•Sungard
Asset monetisation opportunities
• Increased vendor investment interest in capital markets back office assets
•Divestiture of offshore captives where challenges such as subscale operations and high attrition rates make them unviable
•Limited opportunity timeframe as vendors seek to acquire critical mass and early mover advantages
•Cognizant, Tata Consulting Services (TCS), Accenture
Emergence of the utility •Active discussions between banks, industry bodies and vendors across activities to create back office utilities
•Embryonic offerings but moving fast and clear advantages for early movers
•Scope focus to date on data heavy capabilities (e.g. reference data, reconciliation, KYC) and post trade activities (clearing, collateral management)
•Banks/custodians: BNY Mellon, State Street, JP Morgan
•Central Securities Depositories: Euroclear
•Vendors: Syntel, Mahindra Satyam, Broadridge
Capital Markets Business Process Outsourcing (BPO) maturing
•Finance services BPO sector growing at CAGR of 4.6% to $1.6BN in 2016
•Trend of combined IT Outsourcing (ITO) and BPO deals to leverage additional value
•Widening scope of BPO activities (e.g. to change activities, full post-trade processing work streams, HR)
•Accenture, IBM, Capco, Broadridge, Genpact, TCS
Third party bank solutions •Banks/brokers with mature capabilities in post-trade activities white-labelling service to smaller/less advanced brokers (e.g. client clearing)
•Some white-labelling of front office capabilities (e.g. market access, trading platforms, client portals)
• JP Morgan, Deutsche Bank, Goldman Sachs, Morgan Stanley, Barclays
Joint ventures ( JVs) for middle office/back office services
•Explore JVs with other banks, vendors and private equity firms for servicing carve outs
•Leverage strengths of all parties/drive out cost efficiencies
•Scope across middle and back office functions (e.g. across trade processing, reference data management)
•Numerous banks in discussions (confidential
Source: Oliver Wyman research and analysis
Much of the investment is coming from high-
return emerging markets banks – they will need to
demonstrate skill in investment that many European
banks lacked in the pre-2006 boom period. As core
Europe starts to pull away, the option to invest is
becoming available to the banks in these geographies
as well and, as a result, banks are beginning to
diverge in their strategic flexibility. We are already
beginning to see examples such as UniCredit and
IBM announcing a joint venture to offer cloud
computing and infrastructure provision to other
Financial Institutions as part of outsourcing the IT
estate and Société Générale outsourcing post-trade
processing activities to Accenture / Broadridge.
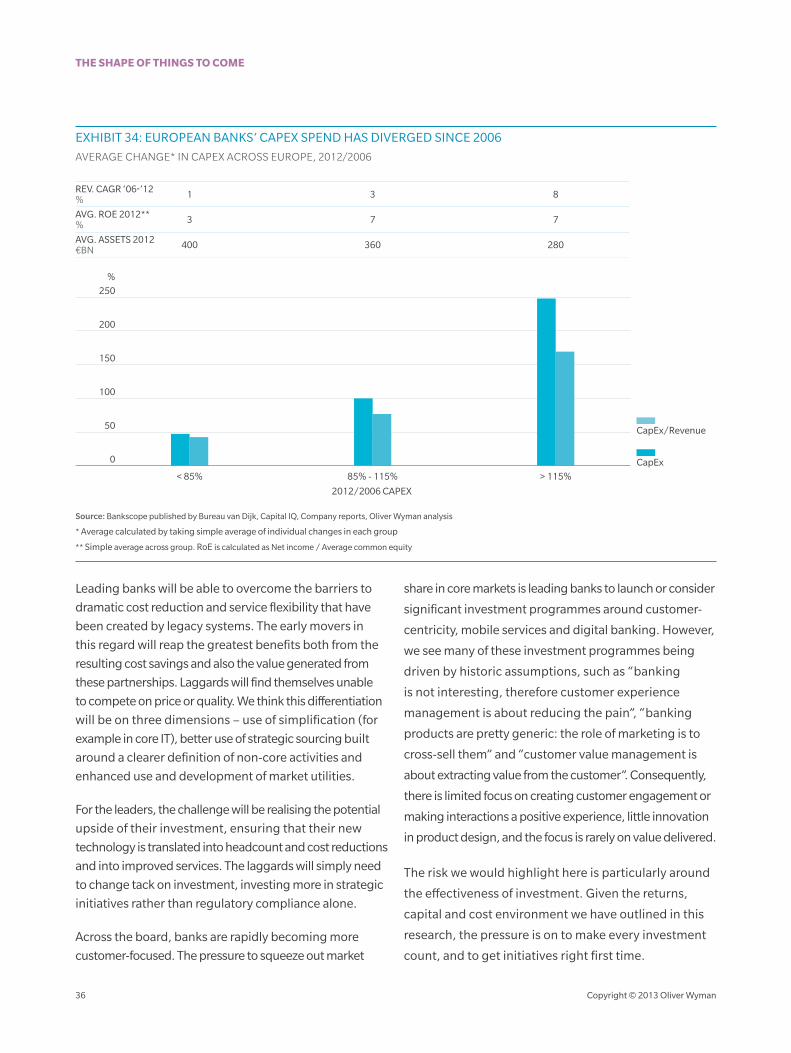
THE SHAPE OF THINGS TO COME
36 Copyright © 2013 Oliver Wyman
EXHIBIT 34: EUROPEAN BANKS’ CAPEX SPEND HAS DIVERGED SINCE 2006
AVERAGE CHANGE* IN CAPEX ACROSS EUROPE, 2012/2006
200
150
100
250
50
AVG. ASSETS 2012 €BN
AVG. ROE 2012**%
CapEx
CapEx/Revenue
> 115%
280
7
< 85%
400
3
85% - 115%
360
7
REV. CAGR ‘06-’12% 81 3
%
2012/2006 CAPEX
0
Source: Bankscope published by Bureau van Dijk, Capital IQ, Company reports, Oliver Wyman analysis
* Average calculated by taking simple average of individual changes in each group
** Simple average across group. RoE is calculated as Net income / Average common equity
Leading banks will be able to overcome the barriers to
dramatic cost reduction and service flexibility that have
been created by legacy systems. The early movers in
this regard will reap the greatest benefits both from the
resulting cost savings and also the value generated from
these partnerships. Laggards will find themselves unable
to compete on price or quality. We think this differentiation
will be on three dimensions – use of simplification (for
example in core IT), better use of strategic sourcing built
around a clearer definition of non-core activities and
enhanced use and development of market utilities.
For the leaders, the challenge will be realising the potential
upside of their investment, ensuring that their new
technology is translated into headcount and cost reductions
and into improved services. The laggards will simply need
to change tack on investment, investing more in strategic
initiatives rather than regulatory compliance alone.
Across the board, banks are rapidly becoming more
customer-focused. The pressure to squeeze out market
share in core markets is leading banks to launch or consider
significant investment programmes around customer-
centricity, mobile services and digital banking. However,
we see many of these investment programmes being
driven by historic assumptions, such as “banking
is not interesting, therefore customer experience
management is about reducing the pain”, “banking
products are pretty generic: the role of marketing is to
cross-sell them” and “customer value management is
about extracting value from the customer”. Consequently,
there is limited focus on creating customer engagement or
making interactions a positive experience, little innovation
in product design, and the focus is rarely on value delivered.
The risk we would highlight here is particularly around
the effectiveness of investment. Given the returns,
capital and cost environment we have outlined in this
research, the pressure is on to make every investment
count, and to get initiatives right first time.

Copyright © 2013 Oliver Wyman 37
THE SHAPE OF THINGS TO COME
The European banking sector has confounded expectations in weathering the crisis; however,
banks still face significant challenges. Executive teams will have to remain focused on the
onerous task of navigating deleverage and other regulatory change, cost management,
sovereign decoupling and the competitive threats circling the industry. Nevertheless, banks
are becoming more investable as the path to better returns becomes clearer.
The winners are likely to be more heterogeneous than today as bank strategy, performance
and investment decisions reassert themselves in returns and valuation.
We remain acutely aware of the limitations inherent in prediction. However, we have looked
to recent history in order to frame some of the known unknowns and to draw out a better
understanding of the shape of things to come.

The ideas in this report reflect many contributions from across Oliver Wyman. The primary authors were Ted Moynihan, Matthew Sebag-
Montefiore, Elinor Turner and Antoine Weckx, supported by William Gilbert, Elisa Haining and Shashank Khare. The authors drew on the
contributions of many partners across the firm, but in particular wish to acknowledge the help of Serge Gwynne, Christoph Knoess, Alan
McIntyre, John Romeo, Sumit Sahni, Nick Studer, John Whitworth, Johaan Wiggins and Barrie Wilkinson.

Oliver Wyman is a global leader in management consulting that combines deep industry knowledge with specialized expertise in strategy, operations, risk management, and organization transformation.
For more information please contact the marketing department by email at [email protected] or by phone at one of the following locations:
AmericAS
+1 212 541 8100
emeA
+44 20 7333 8333
ASiA PAciFic
+65 6510 9700
copyright © 2013 Oliver Wyman
All rights reserved. This report may not be reproduced or redistributed, in whole or in part, without the written permission of Oliver Wyman and Oliver Wyman accepts no liability whatsoever for the actions of third parties in this respect.
The information and opinions in this report were prepared by Oliver Wyman. This report is not investment advice and should not be relied on for such advice or as a substitute for consultation with professional accountants, tax, legal or financial advisors. Oliver Wyman has made every effort to use reliable, up-to-date and comprehensive information and analysis, but all information is provided without warranty of any kind, express or implied. Oliver Wyman disclaims any responsibility to update the information or conclusions in this report. Oliver Wyman accepts no liability for any loss arising from any action taken or refrained from as a result of information contained in this report or any reports or sources of information referred to herein, or for any consequential, special or similar damages even if advised of the possibility of such damages. The report is not an offer to buy or sell securities or a solicitation of an offer to buy or sell securities. This report may not be sold without the written consent of Oliver Wyman.
www.oliverwyman.com
The ShAPe OF ThingS TO cOmeWhAT recenT hiSTOry TellS uS AbOuT The FuTure OF eurOPeAn bAnking