the shelf-edge reefs of davis and cane bays, northwestern .... croix/salt_river173.pdf · 167 the...
TRANSCRIPT

The Shelf-Edge Reefs of Davis and Cane Bays, Northwestern St. Croix, U.S.V.I.
Dennis Hubbard
West Indies Laboratory
Converted to digital format by Thomas F. Barry (NOAA/RSMAS) in 2004. Copy available at the NOAA Miami Regional Library. Minor editorial changes may have been made.

167
The Shelf-Edge Reefs of Davis and Cane Bays,Northwestern St. Croix, U.S.V.I.
Dennis K. Hubbard
West Indies Laboratory
INTRODUCTION
Along its westernmost reaches, the north shore of St. Croix is characterized by a narrow (100-500 m) insular shelf. The coast is divided into several bays named after the old sugar-cane estates of the 18th and 19th centuries (e.g. Cane Bay, Davis Bay and Annaly Bay). The westernmost section of the shelf (near Hams Bluff) is characterized by steep slopes almost constantly swept by heavy wave action. This area is accessible only by boat on calm days, and visiting this area is logistically very difficult. The following descriptions are limited to the more easterly areas at Cane Bay and Davis Bay (Fig. 1; referred to collectively in the following descriptions as Cane Bay).
Cane Bay has been a site of intense investigation by WIL since the early 1970's. The general accessibility of this area has made it a favorite site for local divers and snorkelers as well. The following descriptions provide information about the general character of the shelf margin at Cane Bay. They also attempt to summarize our state of knowledge concerning geologic history and process in the area.
GENERAL BATHYMETRIC CHARACTER
A series of bathymetric profiles across the shelf at Cane Bay are provided in Figure 2. In general, the shelf is approximately 300-400 m wide. There are no emergent barrier reefs like those occurring along the eastern end of
Figure 1. Map showing the character of the shelf at Cane Bay. The locations of Cane Bay, Davis Bay, Anally Bay and Hams Bay. Transect and core locations discussed in the text are also shown.

168
the island. While the reefs at Cane Bay fit no classification, they are probably most accurately termed "fringing reefs". The character of the upper shelf varies along the length of the embayment, and the shelf break occurs variably between 25 and 80 m. Below the shelf break, the profile drops steeply, often vertically, to depths exceeding 1000 m. Beyond that, the island slope continues to abyssal depths of 4500 m (Fig. 3) at an average slope of nearly 30 degrees.
In general, the shelf narrows and steepens gradually toward the west. One exception occurs along the "North Star" section of the embayment (Fig. 1). In this area, a marked indentation occurs, and is probably related to a large-scale slump in the shelf margin.
Reef Zones Reef-zonation patterns are variable along the length
of Cane Bay, but can be generally divided into two types: Type I: Eastern Cane Bay - Along the eastern 500 m
of the embayment, the shelf is subdivided into 4 zones (nearshore pavement; shallow reef; sand flat-slope; deep reef; Fig. 4). These were originally described in Sadd (1980) and Hubbard et al. (1981). An inner, subtidal pavement extends from shore to a depth of approximately 5 m. Benthic cover in this zone is typically low and is dominated by algae (Table 1). Scattered colonies of Acropora sp. and various head corals can be found, but do not form "reefs" (i.e. bioherms).
The sea urchin Diadems antillarum was abundant on this pavement until their Caribbean-wide die-off in 1985. Up until that time, much of the hard substrate and encrusting red-algal colonies exhibited radial scrapes and scratches reflecting feeding by the urchin. The "mushroom" shape of many older coral heads reflects grazing around their bases by Diadema. Sadd (1980) proposed that locally on this hardground, Diadema was removing substrate faster than the resident corals were producing it.
At a depth of approximately 5 m, a poorly defined shallow reef zone begins (Fig. 4). The dominant corals in this zone are M. annularis, Diploria sp., Agaricia spp., Siderastrea radians and Porites sp. Relief does not exceed 2 m, although weakly developed reef channels can be
Figure 2. Generalized bathymetric profiles across the shelf at Cane bay. The locations of the profiles are shown on Figure 1.
Figure 3. Seismic profile across the Anegada Trough. The profile extends roughly north-south from Cane Bay. Note the very steep nature of the slope fronting St. Croix. Note also the greater input of sediment from the leeward platform margins to the north.
seen. The en-echelon spurs and grooves are oriented normal to the shoreline and incoming waves, allowing efficient water circulation around the corals and other animals, at the same time protecting them from the most destructive wave energy (Roberts et al., 1977). This orientation also facilitates wave-induced sediment transport through the reef.
Between depths of 8 and 20 m, the bottom is dominated by a broad, (ca. 80 m) sandy zone. The inner 50 m of this zone consists of a gently sloping (<10 degrees) sand flat. Beyond that, slope angles increase rather abruptly to greater than 20 degrees. In general, the bottom is devoid of all except occasional coral colonies (M. annularis, Siderastrea sp., Agaricia sp., Diploria sp.; Table 1) growing on isolated blocks, presumably moved down from the shallow reef. During fair weather, filamentous algae and diatomaceous mats trap and bind the surficial sediments. These delicate structures are broken down by even small storm waves, however. After episodes of long-period (ca. 8-10 sec.) swell, the sand flat and slope are covered with oscillatory ripples. Bioturbation is active in this zone. Burrowing by the sand tilefish (Malacanthus plumieri) and grazing by goatfish (Mullidae) constantly rework the bottom. Mounds from burrowing shrimp (Calianassa spp.) and

169
Table 1. Benthic cover of eastern Cane Bay. From Sadd (1980).
Hard Shallow Sand Flat Deep Substrate ground Reef /Slope Reef Sand 14 55 85 30 Dead coral* 74 24 7 40 Montastrea. sp. 2 5 2 5 Agaricia sp. 1 3 1 9 P. porites 1 1 3 P. astreoides 1 1 3 S. siderea - 2 5 S. radians 1 3 Diploria sp. 2 4 2 A. cervicornis - 1 1 other corals** 2 2 Halimeda - -Millepora 2 1
Total Coral 10 20 7 29 non-calcifiers† 1 2 1
*Usually covered by algae (corallines and turfs).
**Colpophyllia, Dichocoenia, Eusmilia, Helioseris, Madracis, Meandrina, Mussa, Mycetophyllia, Scolymia, Stephanocoenia.
†ascidians, Briarium, gorgonians, sponges (mostly Verongia and Xestospongia) and tunicates.
polychaete worms are common. Also abundant is the "garden eel", Chilorhinus svensonii.
At a depth of about 20 m, a deeper reef starts as a series of large, buttress-like pinnacles (Fig. 4). Their upper surface is horizontal to gently seaward-dipping. Below 20 m, the bottom drops precipitously. The front of the deep reef is typically near-vertical or, in some cases, overhanging.
Coral cover on the reef promontories is generally high (ca. 30%) near the break in slope, and drops off with depth. Near the top of the slope, somewhat flattened hemispheres of M. annularis dominate, but give way to platier morphs at depth (including Agaricia spp.). The most common corals in this zone are species of Agaricia, Montastrea, Porites and Siderastrea (Table 1).
The reef promontories are separated by sand channels 2-3 m wide (Figs. 4 and 5a). Surficial sediments are comprised of medium sand derived from the biological breakdown of the reef. Shrimp mounds in the channels are asymmetrical (Fig. 5b), reflecting downslope sediment transport. Several centimeters below the sediment surface, loose or weakly cemented rubble from dead A. cervicornis commonly occurs.
These channels serve as short-term repositories for sediment produced by bioerosion (Hubbard, 1986; Hubbard et al., in press). During major storms, sediment
transport increases dramatically (Hubbard et al., 1981; Sadd, 1984). Sadd (1984) proposed that hurricane-induced sediment transport through these channels was necessary to remove excess detritus which would impede reef development. A later, more-quantitative budget by Hubbard et al. (in press) implies, however, that regularly passing tropical storms (wind speed < 75 mph) can flush enough sediment through these channels to offset the production of excess sediment by bioerosion.
By a depth of 60 m, coral abundance is very low. Benthic cover shifts to antipatharians ("black coral"), gorgonians, sclerosponges (especially the nodular orange Ceratoporella nicholsoni) and coralline algae. The pronounced channels broaden into gentler swales, and sediment moving down the island face gradually becomes less and less confined. Following storms, scattered corals, sponges and other normally clean surfaces are blanketed with fine-grained sediment transported from the reef above.
Type II: Western Cane Bay (Davis Bay) - To the west, the reef becomes more continuous (Fig. 6). The inner hardground seen to the east persists over most of the embayment. Occasionally the nearshore zone is occupied by a narrow (10-20 m) band of sand that moves on and off the beach seasonally. In areas of rocky substrate, coral cover is typically low. Scattered colonies of live and dead A. palmata do occur, but at no location do they form in aggregations that could be described as biohermal. Gorgonians, zoanthids (especially Palythoa caribbea), Millepora sp. and encrusting foraminifera (Homotrema rubrum and Gypsina) comprise the principal fauna of this zone. Flora consistently outnumber fauna, typically reaching abundances from 65 to 90% (V. I. Marine Advisors, 1986; Bioimpact, 1986). Table 2 provides a partial list of floral species found along the inshore pavement.
The nearshore pavement continues offshore for a distance of 50-75 m. Opposite the Carambola Hotel, at a
Figure 4. Stylized cross section across the shelf in eastern Cane Bay. The inner pavement area extends beyond the far end of the profile. After Sadd (1980).

170
Figure 5. A . Typical channel separating adjacent reef promontories in the deep forereef at Cane Bay. Note diver in background for scale. Depth is approximately 25 m. B. Asymmetrical sediment mounds related to bioturbation by Callianassa in a sloping channel. C . The shelf edge in Davis Bay. Note the flattened to weakly mounded colonies of Montastrea sp. and Agaricia sp. Below this area, the profile steepens. D . View up a sand channel in the upper forereef at Davis Bay. The channel isabout 1.5 m across. Depth is 15 m.
depth of 4-5 m, the pavement grades into a gorgoniandominated community. Coral cover is sparse, and consists of scattered live and dead colonies of A. palmata and isolated heads of sediment-tolerant corals, especially S. siderea. This zone is under the influence of almost constant and vigorous wave action.
The shelf-edge reef along most of western Cane Bay starts 100-150 m offshore, away from the impact of terrestrial sedimentation. The reef can be divided into three zones: 1) an inner reef terrace, 2) the shelf-break and 3) the reef slope. Along the Carambola transect (CB-04; Fig. 1), the inner reef terrace starts approximately 130 m from shore in 5 m of water. The bottom slopes gradually seaward (2-3 degrees) along the entire width of this zone. Scattered patches of mostly A. cervicornis and P. porites (1-2 m on a side) and knobby morphs of M. annularis occur in the shallower areas of this zone, giving way to small pinnacles (up to 5 m across and 1-2 m high) with a more diverse cover at a depth of about 6-8 m.
At a depth of 8-10 m, the shelf steepens noticeably. Flattened hemispheres of M. annularis and S. siderea dominate the coral cover (Fig. 5c), which reaches maximum abundance (occasionally over 50%) and diversity in this area (Fig. 7). Well-developed reef channels occur in this area (Fig. 5d). Spacing on the channels averages around 15 m, and vertical relief can reach a maximum of 7 m near the shelf break. Sediment in the channels is primarily fine sand derived from bioerosion within the reef.
Below a depth of 12 m, the reef face descends at slopes averaging 30 degrees. Along many parts of the shelf, this slope can be nearly vertical. Below a depth of about 15 m, coral cover is dominated by flattened Agaricia sp. which forms plates that hug the substrate. Other important corals along the reef wall include M. annularis, and M. cavernosa (plus Porites sp. along transect CB-03). Relief in the channels gradually decreases with water depth; along the Carambola transect,

171
Table 2 . Floral list for the nearshore pavements at Cane Bay. Data from V.1. Marine Advisors, 1986 .
Caulerpa racemosa Corallina cubensis Gracilaria sp. Bryothamnion Caulerpa cupressoides Dictyopteris membranacea Jania rubens Caulerpa sertularioides Dictyosphearia sp. Laurencia sp. Ceramium sp. Chaetomorpha sp.
Dictyota sp. encrusting corallines*
Liagora sp. Neomeris annulata
Cladophora sp. Enteromorpha flexuosa Padina sp.
sp. Dasya sp. Halimeda opuntia
Cladophoropsis sp. Galaxaura sp. Codium sp. Gelidium sp.
*primarily Porolithon, Neogoniolithon and Lithophyllum.
the reef promontories end gradually at a water depth of about 40 m. Below this, isolated small blocks from the reef are scattered across the lower slope (Fig. 6a), presumably moving gradually toward deeper water.
GENERAL TRENDS IN BOTTOM COVER
Benthic cover has been quantitatively determined along three transects at the eastern end of the bay. A partial species list of corals is provided in Table 3. Along the easternmost transect (CB-01; Fig. 1), Sadd (1980) summarized the benthic cover by the zones shown on Figure 4 (Table 1). Along the other two transects (CB-02 and CB-03; Fig. 1) coral cover was determined by the chain-census method of Loya (1972). Results are summarized in Figure 7.
Along the eastern reaches of the bay, there are two distinct reefal zones separated by an 80-m sand flat-slope (Fig. 4). Coral cover is highest (29%) near the shelf break in the deep reef (Table 1). In the shallow reef, closer to shore, coral cover is 20%. The most important corals are species of Agaricia, Montastrea and Siderastrea.
Along the transects to the west (CB-01 and CB-03; Fig. 1), benthic cover is more continuous. In general, coral cover increases steadily toward the shelf edge (Fig. 7). Along both transects, the greatest coral abundance (51% on transect CB-02; 35% on CB-03) occurs at the break in slope between the shelf and the deep forereef. This pattern is related to two factors. First, shelf-edge corals are further removed from the influences of terrigenous sedimentation than colonies occurring nearer to the beach. Second, the shelf break is characterized by active circulation as waves from the open ocean first encounter shallow water. This vigorous water motion (Fig. 8), combines with a nearby slope that facilitates sediment removal, resulting in an environment more conducive to coral recruitment and survival.
CORAL GROWTH AT CANE BAY
Hubbard and Scaturo (1985) measured growth rates in eight species of coral from Cane Bay. The data for M. annularis are summarized in Figure 9. Data for the other seven species are summarized in. Table 4. The M. annularis growth data show a consistent trend along
Udotea sp. unnamed algal turf
transects 1-3. Above 12 m, coral growth generally ranges from 0.7-0.9 cm/yr. Below 18-20 m, rates fall to approximately 0.2 cm/yr. In general, the decline in growth rate with increasing water depth is a response to the attenuation of light with depth. As light decreases, photosynthates from symbiotic algae within the corals provide progressively less fuel for metabolism, and the ability of the animals to secrete skeletal material drops accordingly.
Along all three transects, the drop in growth rate occurs near the shelf break, implying substrate slope as a possible control of coral-growth rate. Along a fourth transect, where slope remains constant over the entire depth range of sampling, the abrupt drop in coral-growth rate still occurs between 10 and 20 m water depth. Therefore, it is unlikely that bottom slope plays a major role in controlling growth-rate patterns in M. annularis.
Growth rates for the other corals were generally below that of M. annularis and did not show a marked change with depth. Correspondingly, these corals are more limited in their depth ranges than is the case for M. annularis. Because M. annularis can grow in nearly every reef environment, it is probably the most important frame-builder in modern Caribbean reefs. While Acropora palmata is capable of much higher rates of carbonate production, its confinement to shallow, exposed environments limits its importance primarily to reef-crest facies, which occupy only a portion of the entire reef profile.
The success of M. annularis across nearly the entire depth range of all reef corals is in large part related to its morphologic plasticity. In very shallow water, where sediment scour can limit the survivorship of juvenile corals, M. annularis often assumes a columnar shape, maximizing growth in the vertical direction. At intermediate depths (5-20 m), colony morphology is approximately hemispherical, maximizing the surface area-to-volume ratio of the coral. At greater depths, a more flattened shape places most of the coral polyps (and their photo-receptive zooxanthellae) along the upper surface of the colony where light intensity is greatest. Porites astreoides exhibits a similar plasticity, although it does not extend into very shallow water as a column, and its lower depth limit is truncated above that of M. annularis.
172
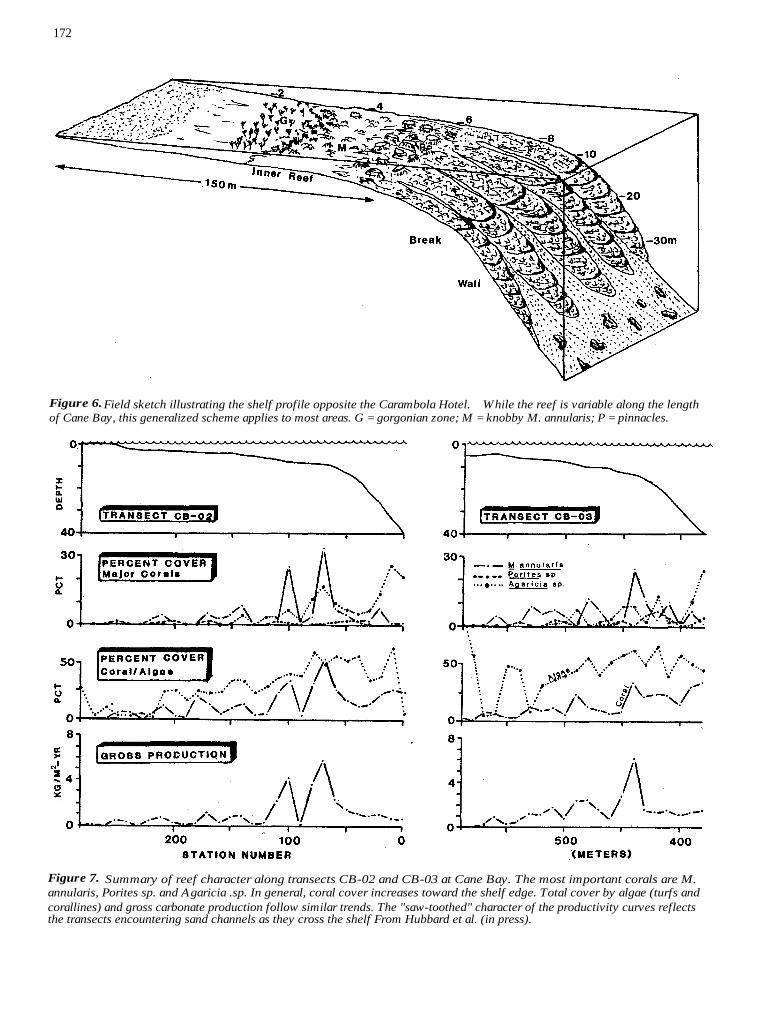
Figure 6. Field sketch illustrating the shelf profile opposite the Carambola Hotel. While the reef is variable along the length of Cane Bay, this generalized scheme applies to most areas. G = gorgonian zone; M = knobby M. annularis; P = pinnacles.
Figure 7. Summary of reef character along transects CB-02 and CB-03 at Cane Bay. The most important corals are M. annularis, Porites sp. and Agaricia .sp. In general, coral cover increases toward the shelf edge. Total cover by algae (turfs and corallines) and gross carbonate production follow similar trends. The "saw-toothed" character of the productivity curves reflects the transects encountering sand channels as they cross the shelf From Hubbard et al. (in press).

173
Table 3. Partial species list for corals found at Cane Bay. Based on personal observation, data from Sadd (1980), Hubbard et al. (in press) and a species list provided by Dr. Judith Lang.
Acropora cervicornis Acropora palmata Eusmilia fastigiata Porites astreoides Agaricia agaricites Helioseris cucullata Porites porites Agaricia grahamae Isophyllia sinuosa Porites divaricata Agaricia lamarki Madracis decactis Scolymia cubensis
Agaricia undata Meandrina meandrites Scolymia lacera Colpophyllia ratans Dendrogyra cylindrus Dichocoenia stellaris
Montastrea annularis Montastrea cavernosa Massa angulosa
Siderastrea radians Siderastrea siderea Stephanocoenia micheli
Dichocoenia stokesii Mycetophyllia aliciae
Diploria strigosa Mycetophyllia lamarcki
Diploria labrynthiformis Mycetophyllia ferox
CARBONATE PRODUCTION AT CANE BAY
Hubbard et al. (in press) used the above data on coral growth and benthic cover to compute the total carbonate production along this shelf. They found that while coral-growth rates were higher in shallow water, this was offset by the tendency for benthic cover to be greater near the shelf break. Thus, carbonate production generally increases with water depth down to a depth of 10-15 m. Beyond that, production rate drops off in a pattern parallelling the growth rates for M. annularis (Fig. 7). The average carbonate-production rate for Cane Bay is 1.15 kg/m2-yr. This corresponds to an accretion rate of 0.66 m/1000 yrs of solid reefal material (i.e. no sediment or voids).
REEF ACCRETION AT CANE BAY
The accretionary history of this shelf is recorded in eight vertical cores recovered from along two transects (see Fig. 1 for location). Core logs are given as Figure 10. Data on core recovery are summarized in Table 5.
Core recovery - Recovery of solid material ranged from 11% in Core CB-06 to 54% in core CB-05 (Average = 41%). The remainder of the cores consisted of 40% sediment and 19% open voids. In applying these figures to ancient reefs it should be recognized that over half of the reef fabric at Cane Bay is detrital in nature. Of the recognizable coral, only a portion can be clearly demonstrated to be in place.
Accretion within an individual core is not a continuous process, but rather is characterized by episodes of coral growth separated by intervals of sediment or open void. With the exception of a widespread depositional hiatus and specific episodes of slumping discussed below, this pattern is not felt to reflect large-scale discontinuities in reef accretion, but rather spatial variability (i.e. patchiness) in the reef cover. As the positions of live coral shift through time, any given location on the reef
will alternately accrete by coral growth and remain static or be reduced by bioerosion during intervening periods.
Core description - Intervals that do contain recognizable coral generally show good preservation. Levels of secondary reworking are low compared to those reported by Hubbard et al. (1985, 1986) for nearby Salt River submarine canyon. Coralline algae rarely occur within the cores despite their prominance on the present reef surface. This likely reflects a near balance between growth of corallines and predation by grazing herbivores (Steneck and Adey, 1976).
The dominant burrowing infauna include the boring sponge Cliona, along with subordinate numbers of worms and molluscs (Fig. 1 la-d). There is no apparent pattern to the degree of reworking with water depth, but coral recovery improves decidedly in the upper two meters of the cores from the shelf top. With the exception of cores CB-02 and CB-05, the reef is dominated by loose rubble near the base of the recovered section.
The ubiquitous submarine cements reported in other modern reef environments (Land and Goreau, 1970; James and Ginsburg; 1979) are conspicuously absent. This is
Figure 8 . Diagram illustrating the distribution of total physical energy across the insular shelf at Grand Cayman Island. Current action near the shelf break results in energy levels similar to those produced by breaking waves in shallower water (after Roberts et al., 1977).

174
particularly surprising given the likelihood of active water circulation through this exposed margin. Where found, secondary cements are limited to thin whiskers or radiating needles on the interiors of coral calices (Fig. 11e), and detrital infills bound by Mg-calcite(?) cement (Fig. l le and f).
History of reef development - The first well-preserved reefs at Cane Bay colonized the shelf prior to 5000 ybp (Fig. 12). Along the western transect (CB-03), Acropora palmata grew in 5 - 10 m of water. A recent, undated core located 50 m landward of Core CB-03 indicates that this fringing reef extended closer to the shoreline at that time. To the east (transect CB-02), a reef dominated by Montastrea annularis formed in slightly shallower water, but further from shore. Today, the slightly more-protected nature of eastern Cane Bay results in higher levels of terrestrial sedimentation. If this were true in the past, it would probably have deterred the development of A. palmata, which has no effective means of sediment removal.
Along both transects, there is a hiatus in the shelf-top cores separating these initial reefs from an overlying one dominated by M. annularis and other head corals. Along the eastern transect, the earlier reef was buried by rubble probably generated from a reef that formed landward as sea level rose. Despite the fact that no such rubble interval was encountered to the west, the possible impact of a shallower reef cannot be discounted. Along the eastern transect, the new episode of reef building began at about 2500 ybp. To the west, a precise date of recolonization cannot be determined, but may have occurred as late as 1100 ybp. The significance of this break is not fully understood; it is discussed in Hubbard et al. (in press). Near the shelf edge (Cores 1 and 5) accretion has been relatively continuous over the past 2,000-3,000 years.
Figure 9. Summary of coral-growth data for M. annularis at Cane Bay. The curves at the upper left are from profiles where a marked break in slope corresponds to the rapid decrease in coral- growth rate. The diagram at the upper right compares a summary curve for the three transects to one derived from a profile where no slope break occurred. The curve at the lower left combines data from all four transects.
Table 4. Growth rates for seven species of corals sampled from Cane Bay. Data from Hubbard and Scaturo (1985).
Water Growth Coral Depth (m) Rate (cm-yr)
Agaricia agaricites 12.2 0.16 ± 0.02 Agaricia agaricites 18.3 0.16 ± 0.02 Diploria labrinth{formis 6.1 0.34 ± 0.05 Diploria labrinthiformis 18.3 0.29 ± 0.04 Diploria labrinthiformis 18.3 0.36 ± 0.07 Diploria labrinthiformis 30.5 0.46 ± 0.09 Montastrea cavernosa 12.2 0.45 ± 0.08 Montastrea cavernosa 17.0 0.32 ± 0.08 Montastrea cavernosa 18.3 0.37 ± 0.07 Montastrea cavernosa 18.3 0.31 ± 0.04 Montastrea cavernosa 24.4 0.29 ± 0.04 Pontes astreoides 12.2 0.31 ± 0.05 Pontes astreoides 18.3 0.29 ± 0.05 Pontes astreoides 18.3 0.23 ± 0.03 Pontes astreoides 24.4 0.19 ± 0.04 Siderastrea siderea 6.1 0.30 ± 0.03 Siderastrea siderea 6.1 0.31 ± 0.03 Siderastrea siderea 12.2 0.26 ± 0.03 Siderastrea siderea 18.3 0.25 ± 0.05 Siderastrea siderea 24.4 0.23 ± 0.04 Siderastrea siderea 39.7 0.16 ± 0.03 Siderastrea siderea 39.7 0.14 ± 0.02 Spephanocoenia sp. 30.5 0.18 ± 0.03
Coral diversity is greatest in these cores, as is the case on the present-day shelf margin. The cores are dominated by 10-20 cm segments of well-preserved corals separated by decimeter-scale voids and sediment-filled intervals. The accretion rate of the reef is much less than the growth rates of the corals contained within it.
The alternation between active "framework" and sediment may explain the generally good preservation of the corals in these cores. The surfaces of the samples show evidence of encrustation and bioerosion, the latter usually extending only a short distance into the coral. This could reflect short intervals of coral growth interrupted by rapid burial and longer periods of non-production as coral growth temporarily shifted to another site on the reef surface.
Along the reef front, cores from the steep slope reflect processes of slumping and rapid sedimentation. Intervals of recovered coral are typically smaller than in the shelf-top cores, although preservation is still good within the corals that do occur. Sediment-filled intervals representing channels and infilled cavities are much more common. In core CB-02, the radiocarbon dates do not follow an orderly progression, likely reflecting sections of the reef falling from above. During the past 2000 years, the rate of accretion on the reef face has gradually increased while aggradation on the shelf top has slowed (Fig. 13), largely the result of slumping from the upper

175
Table 5. Summary of core data. Cores are located in Figure 1.
MAX LENGTH(m) RECOV* ACCR (a/h) CORE AGE(a) total last(h) (m) (%) VOID(m) SEDS(m) (m-1000) CB-1 2210 3.26 1.95 1.69 52 0.57 1.00 0.88 CB-2 2530 4.10 4.10 1.69 41 1.09 1.32 1.62 CB-3 5360 2.21 0.78 1.00 45 0.20 1.01 0.15 CB-4 5580 8.39 5.79 2.28 27 0.42 5.69 1.04 CB-5 3250 3.82 3.82 2.05 54 1.33 0.44 1.18 CB-6 1760 7.44 2.82 0.81 11 1.09 5.54 1.60 CB-7 1100 1.87 1.87 0.40 21 0.00 1.47 1.70 Average 41 0.73**
total = length of entire core (% RECOV based on this value). last = length to deepest dated sample (ACCR based on this value).
* "RECOV", "VOID" and "SEDS" are lengths over the entire core; "ACCR" is based on the interval between the reef surface and the deepest dated sample.
**This average is derived from Hubbard et al. (in press). It is a weighted average based on the accretion rate from each core and the area of the reef area from which it was taken (i.e. a weighted average; cannot be simply deriv ed by adding individual accretion rates and dividing by 7; for details, see Hubbard et al., in press).
Figure 10. Generalized core logs from Cane Bay. The left-hand column of each log shows the interpreted position of recovered samples. The center column is a lithologic interpretation. The graph on the right shows the percentages of original coral material remaining in each recovered piece.

176
Figure Il . Examples of the internal character of the reef at Cane Bay. A. M. annularis bored by molluscs (M), worms (w). and Cliona (C). Core sample CB4-5. B . Multiple generations of cemented sediments (S). The lighter cements are younger. Core sample CBI-18. C. A. palmata bored by Cliona (C) and worms (W). Core sample CB4-24. D . Fresh (sample CB4-8, top) and bioeroded (sample CB6.10, bottom) M. annularis. Note the annual (?) banding in the top sample, probably accentuated by endolithic algae. Most of the galleries in the lower sample were made by boring sponges. E . Photomicrograph of cement (lighter) and sedimentary (dark) in/ills of a sample of M. annularis. Note the radiating fabric at center. F. Geopetal infill of a
. small mollusc boring (?) by detrital sediment. Field of view in both E and F is approximately 5 mm
reef margin as the steepening slope became progressively The secondary reworking of the reef, combined with more unstable. The result is a pattern of deposition the importance of bioeroded sediment reincorporated in the controlled as much by secondary processes of reworking reef interior, has resulted in the deposition of an active as by initial patterns of calcification. At nearby Salt reef core that would be difficult to distinguish from what River, these processes have been largely responsible for has been typically interpreted as a detrital facies in the 26 m of lateral accretion in water depths of 30m (Hubbard past. While the patterns seen at Cane Bay (and Salt et al., 1986). River) do not represent universal models, and biological

177
Figure 12. History of reef accretion at Cane Bay as revealed in cores. To the east (CB-02), a reef dominated by head corals had established by 5500 ybp. To the west (CB-03), A. palmata dominated at the same time. An accretionary hiatus occurred until 1,000-2,000 ybp along both profiles. Since that time, the present reef community has developed.
processes certainly cannot be ignored, the importance of secondary reworking and the ability of deeper-reef environments to contribute significantly to the depositional record should be kept in mind when examining any ancient reef sequence.
DIVE LOGISTICS
Two diving excursions are described below. Together these two transects embrace most of the variability that occurs along the embayment. A short swim along the surface will allow general examination of the reef zonation before diving. Much of the zonation discussed above can be seen by snorkeling if the water is clear. On rough days, however, reduced visibility makes diving with SCUBA necessary. While diving from a boat will
simplify logistics, the following sites have been chosen because of their accessibility from the beach.
You should plan to make detailed observations along your transect. Your depth gauge will provide an accurate measure of where you are vertically. You should practice estimating distances underwater. With a little practice, you can measure distance in "flipper-kicks", much like a measured pace on land. A compass is a useful item both for general navigation in flatter zones and measuring orientations of important features underwater. An under-water slate or special paper for underwater use is very useful for recording your observations and measurements. Half a dozen pre-numbered bags are also useful for collecting sediments for more detailed description back in the lab.

178
Figure 13. Block diagrams illustrating the accretionary history of the Cane Bay shelf edge. Between 3,000 ybp and 1,000 ybp the shelf edge gradually steepened. As it did, lateral progradation and vertical accretion were accelerated (first in core CB-03, and later in core CB-02; see curves to the right) as blocks started to fall off the unstable reef face.
The sample dive profile for each locality assumes a maximum depth of 30 m (100'). Remember that, for purposes of diving safety, the profiles should be examined from deep-to-shallow. Many of the important features of each transect can be examined without descending below 18 m (60'), so your excursion can intersect the dive plans given below at that depth if you wish.
Cane Bay Beach - The eastern transect (CB-01; Fig. 4) can easily be reached from the public beach at the eastern end of Cane Bay. Easy access to the water is afforded by a boat ramp placed there in 1986. The recommended transect is located directly off from the center of the beach. On most days, the upper portions of the deep reef and wall can be seen from the surface. The contact between the sand slope and deep reef provides a reliable reference for beginning the dive. Careful descent at this point will start the dive in approximately 20 m of water.
Some time should be spent examining the large-scale morphology of this section of reef by swimming away from the reef face into the open water column. The buttress-like promontories and intervening sand channels dominate the landscape. Closer inspection will reveal the flattened nature of the coral colonies at this depth. What is the reason for this flattening? Do you notice any differences in the orientations of the platey M. annularis and Agaricia sp? Explain these differences. Where in this zone does the greatest coral cover occur? You might also gently disrupt an area in a sand channel and watch the motion of the sediment as it moves downslope. What happens? Also note the general character of the sediment. It should feel sticky. Why? What is the general size and sorting of this material. Identify as many of the coarser constituents as you can.
If you have gone as deep as 30 m, your time along the deep-reef wall should not exceed 10 minutes. Otherwise, you can spend a bit more time looking around
the tops of the buttresses at 20 m. Moving landward onto the sand slope, you should encounter a generally featureless bottom with scattered blocks from the shallow reef. Note as many examples of bioturbation as you can find-observe. Moving into the upper portion of this zone, you will notice an abrupt change in slope. If you have approached the area very carefully, you may see fields of the garden eel, Chilorhinus svensonii. Can you propose any reasons for the presence of this sandy zone? How about for the change in slope? Note the character of the sediment in this zone. Is it any different from what you examined in the deep-reef channels?
At the top of the sand slope, you will encounter the shallow reef. Water depth should be about 5-7 m. If your dive started at 30 m, time spent in this zone will add a measure of safety against decompression sickness. Estimate the benthic cover and note the major components. Observe the. weakly developed spur-and-groove topography that has developed in this area. How did it form? What is the orientation of the channels? What controls the orientation? The spacing? Examine the sediment in the channels. Compare it to what you found in the two deeper zones.
From this point shoreward, bottom cover drops dramatically. The inner profile is dominated by a limestone pavement that forms a ridge just off the beach. Coral cover is limited to a few standing, but dead, colonies of A. palmata and low heads of sediment-tolerant corals (especially S. siderea). Wave action almost always sweeps this area. Why is coral cover low? How is the sediment here different from what you have seen already?
Carambola Beach - This transect is located at the western end of the embayment. Access to the profile is from the private beach fronting the Carambola Hotel. A legally dedicated public access is maintained near the main hotel parking lot at the east end of the beach. The transect shown in Figure 6 is located opposite the western

179
end of the beach. As was the case in eastern Cane Bay, this transect should be examined starting at its deeper end. A short 150-m swim from shore will place you over the dropoff at the shelf edge. The top of the shelf break occurs at 12-15 m (ca. 45') and provides an excellent point to start the dive.
A short swim down the reef front will take you to a depth of 30 m where the overall morphology of the deep-reef wall can be observed. A brief swim out and away from -the reef face provides an excellent vantage point. Note the alternating reef promontories and channels. What is their general morphology; spacing, relief? How are they different from the features seen at the eastern end of the bay? What factors control the abrupt change in slope near the top of the wall? A look down will afford an excellent view of the numerous small blocks that have broken away from the reef face. What is their origin? What is their likely fate. Swimming closer to the wall, you should examine the nature of the coral cover. What are the major benthic organisms in this zone? Also, examine the sediment in the channels. Compare it to what you saw to the east.
Moving up one of the channels to the shelf break will bring you into the zone of maximum coral cover. Estimate the total cover along your transect. Why is the cover so high here? What are the major species? Have they changed from the reef wall? Compare the sediment here to what you looked at along the reef face.
From the shelf edge, slowly work your way toward shore. Note the changes in benthic cover as you progress into shallower water. Note any changes in water motion or quality. You will pass out of the channels at a depth of about 6 m and into a more chaotic zone of small, coral-covered pinnacles. Moving toward shore, the dominant benthic zones include a) knobby M. annularis, 2) poritescervicornis, c) gorgonians and d) sand-bare pavement. What factors are controlling this zonation? What affects has the Carambola Hotel likely had on the reefs of this area? What will future development likely do?
REFERENCES CITED
Bioimpact, 1986, Report to Carambola Hotel on inshore benthic communities of Davis Bay, St. Croix, U.S.V.I.
Hubbard, D.K., Burke, R.B., and Gill, I.P., 1985, Accretion in deep shelf-edge reefs, St. Croix, U.S.V.I., in Crevello, P.D., and Harris, P.M., eds., Deep Water Carbonates, SEPM Core Workshop 6:491-527.
Hubbard, D.K., Burke, R.B., and Gill, I.P., 1986, Styles of reef accretion along a steep, shelf-edge reef, St.
Croix, U.S. Virgin Islands, J. Sedim. Petrol. 56:848-861.
Hubbard, D.K., Miller, A.I., and Scaturo, D., in press, Production and cycling of calcium carbonate in a shelf-edge reef system (St. Croix, U.S. Virgin Islands): applications to the nature of reef systems in the fossil record, J. Sedim. Petrology.
Hubbard, D.K., Sadd, J.L., Miller, A.I., Gill, I.P., and Dill, R.F., 1981, The production, transportation and deposition of carbonate sediments on the insular shelf of St. Croix, U.S. Virgin Islands, Tech Rept. No MG-1, West Indies Laboratory, St. Croix, USVI, 145 p.
Hubbard, D.K., and Scaturo, D., 1985, Growth rates for seven scleractinean corals at Cane Bay, St. Croix, U.S.V.I., Bull. Mar. Sci. 36:325-338.
James, N.P., and Ginsburg, R.N., 1979, The seaward margin of Belize barrier and atoll reefs, IAS Spec. Publ. No. 3, Blackwell Scientific Publ., England, 119 p.
Land, L.S., and Goreau, T.F., 1970, Submarine lithification of Jamaican reefs, J. Sedim. Petrol. 40:457-462
Loya, Y., 1972, Community structure and species diversity of hermatypic corals at Eliat, Red Sea, Mar. Biol. 13:100-123.
Roberts, H.H., Murray, S.P., and Suhayda, J.N., 1977, Physical processes in a fore-reef environment, Proc. Third Intl. Coral Reef symp. 2:507-515.
Sadd, J.L., 1980, Sediment transport in a fringing reef, Cane Bay, St. Croix, U.S.V.I., Unpubl. MS Thesis, Dept. of Geology, Univ. of Texas, Austin, TX, 117 p.
Sadd, J.L., 1984, Sediment transport and CaCO 3 budget on a fringing reef, Cane Bay, St. Croix, U.S. Virgin Islands, Bull. Mar. Sci. 35:221-238.
Steneck, R.S., and Adey, W.H., 1976, The role of environment in control of morphology in Lithophyllum congestum, a Caribbean reef ridge builder, Botanica Marina 19:197-215.
V.I. Marine Advisors, 1986, Report to the Office of Coastal Zone Management, U.S. Virgin Islands on the Environmental Impact of Rock Removal at Davis Bay, St. Croix, U.S. Virgin Islands.