the short mood and feelings questionnaire … menninger department of psychiatry and behavioral...
TRANSCRIPT

Journal of Abnormal Child Psychology, Vol. 34, No. 3, June 2006, pp. 379–391 ( C© 2006)DOI: 10.1007/s10802-006-9027-x
The Short Mood and Feelings Questionnaire (SMFQ):A Unidimensional Item Response Theory and CategoricalData Factor Analysis of Self-Report Ratings froma Community Sample of 7-through 11-Year-Old Children
Carla Sharp,1,4 Ian M. Goodyer,2 and Tim J. Croudace3
Received February 24, 2004; revision received May 10, 2005; accepted September 13, 2005Published online: 29 April 2006
Item response theory (IRT) and categorical data factor analysis (CDFA) are complementary methodsfor the analysis of the psychometric properties of psychiatric measures that purport to measurelatent constructs. These methods have been applied to relatively few child and adolescent measures.We provide the first combined IRT and CDFA analysis of a clinical measure (the Short Mood andFeelings Questionnaire—SMFQ) in a community sample of 7-through 11-year-old children. Bothlatent variable models supported the internal construct validity of a single underlying continuumof severity of depressive symptoms. SMFQ items discriminated well at the more severe end of thedepressive latent trait. Item performance was not affected by age, although age correlated significantlywith latent SMFQ scores suggesting that symptom severity increased within the age period of 7–11.These results extend existing psychometric studies of the SMFQ and confirm its scaling propertiesas a potential dimensional measure of symptom severity of childhood depression in communitysamples.
KEY WORDS: Screening; childhood depression; SMFQ; item response theory; categorical data factor analysis.
Over the last 40 years, the methods used to evaluatethe psychometric basis of ability tests, health care sur-veys, and multi-item screening instruments has changeddramatically. Whilst the methodology of classical testtheory (CTT) has served test development well, item re-sponse/latent trait theory (IRT) approaches have becomemore mainstream as the technical basis for measurementtheory, test construction and scale evaluation (Embretson& Reise, 2000). Although moves towards adoption ofmore appropriate, non-linear and categorical data factoranalysis (CDFA) models have been most apparent in ed-
1 Menninger Department of Psychiatry and Behavioral Sciences, BaylorCollege of Medicine, Houston, Texas.
2 Developmental Psychiatry Section, University of Cambridge,Cambridge, UK.
3 Department of Psychiatry, University of Cambridge, Cambridge, UK.4 Address all correspondence to Carla Sharp, Menninger Depart-
ment of Psychiatry and Behavioral Sciences, Baylor Collegeof Medicine, 1 Baylor Plaza, Houston, Texas 77030; e-mail:[email protected].
ucational settings, in the last two decades such methodshave begun to be applied in clinical testing of adults. Thishas been evidenced by psychometric studies publishedin, for example, Psychological Assessment and Psycho-logical Methods (e.g. Angold, Erkanli, Silberg, Eaves, &Costello, 2002; Cooke & Michie, 1997; Lambert et al.,2003; Patton, Carlin, Shao, Hibbert, & Bowes, 1997;Santor, Ramsay, & Zuroff, 1994). Currently there arevery few reports that have applied such methodologiesin samples of young children (Cheong & Raudenbush,2000).
One reason for the under-exploitation of suchmethodologies may be because researchers have not beenintroduced to the potential and practicalities of thesemethods (Rouse, Finger, & Butcher, 1999) and are there-fore unaware of the advantages they offer over conven-tional (CTT) methods (van der Linden & Hambleton,1997). Although CTT is often included in the curricu-lum of both clinical and applied psychologists, IRT israrely taught, and has had less coverage in mainstream
379
0091-0627/06/0600-0379/0 C© 2006 Springer Science+Business Media, Inc.

380 Sharp, Goodyer, and Croudace
psychology journals (Embretson & Reise, 2000). We pro-vide an application of IRT and categorical data factoranalysis (CDFA) methods to a commonly used self-reportmeasure of depressive symptoms in children, the ShortMood and Feelings Questionnaire (SMFQ; Angold et al.,1995). As such, the aim of this paper was to scrutinizethe internal construct validity of the SMFQ. To this end,we used latent variable models implemented with both anIRT and appropriate factor analysis framework (CDFA).Within a latent variable framework, internal constructvalidity refers to an understanding of the psychometricperformance of items in relation to an underlying (la-tent) construct of interest. Here the latent variable wasa continuum of severity derived from self-reported de-pressive symptoms in 7–11-year-old children. This latentvariable was psychometrically derived, and was not val-idated through an external criterion measure of depres-sion; hence our results pertain only to internal constructvalidity.
The Mood and Feelings Questionnaire (MFQ), longform, was developed as a screening tool for detectingclinically meaningful signs and symptoms of depressivedisorders in children and adolescents (6–17 years of age)by self-report (Angold et al., 1995; Costello & Angold,1988). MFQ items were designed to cover DSM diag-nostic criteria for major depressive disorder (APA, 1994).Over the past decade, the long form consisting of 33 itemshas been used extensively in both epidemiological andclinical research (Costello et al., 1996a, 1996b; Goodyer,Herbert, Tamplin, & Altham, 2000; Kent, Vostanis, &Feehan, 1997; Park, Goodyer, & Teasdale, 2002; Wood,Kroll, Moore, & Harrington, 1995). Criterion-related va-lidity (ability to predict clinical diagnosis) has been es-tablished for the long form (Wood et al., 1995).
A short form consisting of 13 items (SMFQ) wassubsequently derived for which criterion validity has alsobeen shown (Angold et al., 1995; Kent et al., 1997; Thapar& McGuffin, 1998). Table I presents details of studies thathave used the self-report version of both the long and shortform of the MFQ and summarizes the validity issues ad-dressed. Although these studies are universally supportiveof the internal construct validity of the SMFQ, most sam-ples were from clinic or specially selected populations.Currently, there is no published study on the internal con-struct validity of the short version in a community sam-ple of primary school-aged children. Establishing internalconstruct validity in 7–11-year-old children is essential ifthe SMFQ is to be recommended as a self-report screeningmeasure of severity of depression in community samplesof children.
Most existing studies, as summarized in Table I, haveapplied statistical procedures based on CTT, linear factor
analysis or principal components. Such methods are notoptimal for the discrete/categorical nature of the MFQresponses (Angold et al., 2002) for several reasons. Tradi-tional methods, such as principal components analysis,assume that item responses are on a continuous met-ric, yet, psychopathology ratings are recorded using dis-crete categories in most community studies to date. Usu-ally, the commonest (modal) response on SMFQ itemsis zero, representing absence of symptoms. Even whenratings are collected on graded scales, response distribu-tions are usually heavily skewed. Failure to treat symp-tom ratings as categorical data in factor analysis modelshas two consequences: (1) in multi-dimensional analy-sis the true factor structure may be severely distorted,and (2) in unidimensional models factor loadings may bebiased and resultant (weighted) scores estimated incor-rectly. When applying linear models to binary (0,1) data,predictions are made that are not within the plausiblerange (<0 or >1) (McDonald, 1999). This is obviouslyhighly undesirable when relatively rare symptoms are be-ing modelled. The limitations of linear models in thesesituations are well known to statisticians and methodol-ogists, but are frequently ignored by applied researchers.Only in limited circumstances will linear methods ap-proximate a more appropriate model (Shrout & Parides,1992).
Although CTT and IRT/CDFA both assume that vari-ation in the observed responses to items of a test can beexplained by one or more continuous unobserved latenttraits, the way IRT/CDFA models the relation betweenobserved item-responses and the latent trait is different.Instead of summarizing the psychometric properties ofa scale with omnibus statistics (such as item-total cor-relations or Cronbach alpha), thereby averaging acrosslevels of individual variation (Santor et al., 1994), IRT ap-proaches model how the probability of responding to anitem—here this is equivalent to endorsing a symptom—varies as a function of the location along a latent con-tinuum or dimension of variation (Santor et al., 1994).IRT methods do not use summary statistics that apply togroups of individuals, such as correlations, but can definea model for the individual response patterns that comprisethe raw data. Because item response patterns can be mod-elled directly within an IRT framework, no information inthe data is lost.
A mathematical equation—a probability model, sim-ilar to that used in logistic or probit regression—is used todescribe the non-linear relation between an item-responseand the value (severity) on the latent trait. This relationcan be represented graphically by a plot that is knownas an item characteristic curve (ICC) or item responsefunction (IRF). The ICC offers a graphical profile of item

An IRT and CDFA Analysis of the SMFQ 381
Table I. Summary of Validity Characteristics of Studies that Used the Self-report Versions of the MFQ Long and Short Forms
Author and date Samples Age N SexType of validity
assessed Analytic strategy Results
Wood et al. (1995) 104 consecutivereferrals tooutpatientpsychiatric clinic
10–19 43 boys61 girls
Criterion validity forlong form, using theK-SADS as criterion
ROC analyses Sensitivity 0.78
Specificity 0.78Angold et al. (1995) 48 consecutive
referrals tooutpatientpsychiatric clinic
6–17 33 boys15 girls
Internal consistency,content andcriterion-relatedvalidity for SMFQ,using the DISC ascriterion
Principle componentanalysis
Cronbach’s alpha
Unidimensional factorstructure (acceptablemodel fit statistics)
Cronbach’s alpha 0.85
125 referrals to apediatric clinic
6–11 54 boys71 girls
Maximum likelihoodlogistic regression
ROC analyses
High ORs forpredictingpsychiatricdiagnosis
Sensitivity 0.60Specificity 0.85
Messer et al. (1995) 1502 high riskcommunity children
6–13 Boys only Internal consistency CFA using LISREL VII Unidimensionalstructure of SMFQconfirmed: GFI andAGFI indices high(>0.97); RMSR low(>0.08); χ2/dfindices all <3
Kent et al. (1997) 114 consecutiveattendees at fourclinics
7–17 56 boys57 girls
Criterion validity forlong and SMFQ,using the K-SADSas criterion
Correlational analysesROC analyses
Sensitivity 0.59Specificity 0.89
Thapar andMcGuffin (1998)
411 twins 11–16 99 boy pairs123 girl pairs94 mixed pairs
Criterion validity forSMFQ, using theCAPA as criterion
Correlational analysesROC analyses
Sensitivity 0.75Specificity 0.74
Note. Criterion validity here refers to the SMFQ’s ability to detect major depressive episode in study samples with an acceptable degree of sensitivity andspecificity. Internal consistency refers to the underlying factor structure of the SMFQ, notably whether it can be demonstrated to be a unidimensionalscale. The current study did not aim to examine criterion validity but only internal consistency.
effectiveness, which is more informative than traditionalmeasures of item performance (Santor et al., 1994). Fora detailed discussion of the distinction between CTT andIRT approaches and the benefits of using the latter, seeEmbretson and Reise (2000).
More detailed information on the effective measure-ment range of individual items and scales is especiallyimportant for psychopathology measurement in develop-mental epidemiology studies. Epidemiological evidencehas suggested that symptom profiles may differ with agefor reasons that are not fully understood. Weiss and Gar-ber (2003) outlined several ways in which developmentaldifferences may impact on the phenomenology of depres-sion over the course of childhood and adolescence. From
a psychometric perspective, it may be, for instance, thatcertain items are not appropriate for certain age groups,or that the symptoms (defined by the wording of ques-tionnaire items) are not a feature of a particular disorderin that age group. As the current study demonstrated (seesection on differential item function—DIF), IRT providesthe opportunity to distinguish between bias at the levelof the item (i.e. the item does not accurately probe forthe symptom for a particular age group) and bias at thelevel of the latent trait (i.e. the disorder does not expressitself through a particular symptom in a particular agegroup).
To our knowledge, only one study to date hasadopted an appropriate categorical factor analysis
382 Sharp, Goodyer, and Croudace
approach to SMFQ data (Angold et al., 2002). Angoldet al. (2002) reported CDFA solutions estimated us-ing weighted least squares estimation methods in Mplussoftware. Their study confirmed the SMFQ’s unidimen-sional structure (single factor) in two samples: First,the Great Smoky Mountains Study comprised 9-, 11-and 13-year-olds. This sample of n = 1441 represented25% of the highest scorers on the Child BehaviourChecklist out of a community-based sample of n = 4500,i.e. a “high-risk” sample. Similar results were foundin a second sample from a family study of n = 1412twins.
Confirming the unidimensional factor structure of theSMFQ with non-linear factor analytic techniques (Angoldet al., 2002) was an important first step in examining thepsychometric properties of the SMFQ from a latent traitmodelling perspective. However, no information was pre-sented on the effective measurement range of the SMFQ.This is more easily summarised using graphical represen-tations of the model from an IRT perspective, i.e. the testcharacteristic curve (TCC). We repeated and extended themethods used by Angold et al. and offer more graphic rep-resentations of the latent variable modelling. In addition,we provide the first IRT/CDFA modelling of SMFQ datain a community sample of younger children (including 7-and 8-year-olds).
Given concerns that there might be item bias withrespect to age (with different thresholds for response foryounger and older children), we further extended An-gold’s approach by testing for item bias (DIF) using amultiple indicator multiple cause (MIMIC) modelling ap-proach (Gallo, Anthony, & Muthen, 1994). Item bias ispresent when individuals with the same score on the psy-chometrically derived latent trait are more or less likelyto endorse an item. MIMIC modelling investigates itembias through an extension of the CDFA factor analysismodel to include covariates, both of the latent trait, and ofthe items. In testing for age invariance of item thresholds,the estimates of interest are the direct effects (regressionsof) item responses on age as a covariate after adjustmentfor the effect of age on the latent trait score. Given thatprevalence rates of depression increase with age in ado-lescence (Goodyer & Sharp, 2005; Hankin et al., 1998),we expected this might also be the case for this age group.We therefore anticipated finding an age difference in latenttrait scores, indicating more psychopathology in the olderchildren (10- and 11-year-olds), but no evidence of itembias for any of the SMFQ items. We were able to test forthe effect of age, because unlike previously reported stud-ies, our sample comprised a cohort of younger children(7–11-year-olds) recruited and assessed in an elementaryschool setting.
METHOD
Participants
Parents of 2950, 7- to 11-year-old children (primaryschool years 3–6) of 16 primary schools from a mixedcatchment of rural and urban areas in Cambridgeshire,England were asked to participate. Response rates forindividual schools ranged from 14 to 40% resulting in20% of the children taking part in the study (n = 659; 319boys and 340 girls).
There are four possible reasons to explain the lowresponse rate. First, the ethics approval requirements pro-hibit researchers from gaining access to names and ad-dresses of parents in the community. Invitation letters toparticipate in the study were therefore handed out to chil-dren at school to take home to their parents. It is possiblethat many invitation letters did not make it home in the firstplace. Second, ethics in the UK require positive consent.The effort of actually completing and returning a con-sent form to indicate positive consent may be too muchto ask of some parents in the community. Third, limitedresources precluded payment to children for their partic-ipation. Instead, children were given a sticker and wereentered into a school raffle drawing for their participation.Fourth, it is possible that parents feel more protective ofchildren in the below-11 age range compared with ado-lescents, where the response rate for community studiesusing a school-based ascertainment procedure in the UKis typically 50% (Goodyer et al., 2000).
All children had an estimated IQ above 80. The meanestimated IQ for the sample was 104 (SD = 14) and themean age was 9 years, 5 months (SD = 12 months). Theethnic distribution in the sample was in line with regionalstatistics (Office of National Statistics, 2001) for easternEngland (97% white, 2% of middle-eastern origin, 0.5%black and 0.5% Asian). Two procedures were employedto determine participation bias. First, permission was ob-tained for teachers of one of the schools to complete ascreening measure of common emotional and behaviourproblems, the Strengths and Difficulties Questionnaire(Goodman, 1997, 2001; Goodman, Ford, Simmons, Gat-ward, & Meltzer, 2000) on all the children in the school.Children who completed the SMFQ were compared withthose who did not for their ratings on the SDQ. Indepen-dent sample t-tests revealed no evidence of any differencesbetween the participants (n = 61) and non-participants(n = 232) when the five sub-scales of the SDQ (hyperac-tivity, emotional symptoms, conduct problems, peer prob-lems, prosocial behaviour) were compared. Comparisonof sociodemographic characteristics also revealed no dif-ference between participants and non-participants.
An IRT and CDFA Analysis of the SMFQ 383
Measures and Procedure
Short Mood and Feelings Questionnaire(Angold et al., 1995)
Our primary measure was the self-report SMFQwhich comprises 13 items with a common response for-mat: 0, never; 1, sometimes; 2, always. The SMFQ wasadministered individually at the same time as all the othermeasures. Due to concerns raised regarding the readingand understanding ability of younger children (Messeret al., 1995; Thapar & McGuffin, 1998), teachers wereconsulted as to the level of understanding for the 7-year-olds (youngest cohort), and it was decided that questionswould be read aloud to this group (8%). As in previ-ous studies that have used the SMFQ with younger chil-dren (Angold et al., 1995), the answers recorded were theparticipants’ self-reports and not the examiners’ opinionsabout them. Children in higher grades were invited to askfor help, if needed. However, none of the children in thehigh grades did so.
IQ
A shortened version (Vocabulary and Block Designsubtests only) of the Wechsler Intelligence Scale for Chil-dren III (Wechsler, 1992), was used to estimate overall IQin the sample. Sattler’s (1988) guidelines were used foradministration and scoring.
Psychopathology
To assess response bias, teachers completed theStrengths and Difficulties Questionnaire (SDQ; Good-man, 1997, 2001; Goodman et al., 2000). The SDQ wasspecifically designed to screen for psychiatric disorders incommunity samples and was shown to identify individualswith psychiatric diagnosis with a specificity (the propor-tion of people without disease who have a negative testresult) of 94.6% (95% CI 94.1–95.1%) and a sensitivity of63.3% (59.7–66.9%) (Goodman et al., 2000). Sensitivity(the proportion of people with disease who have a positivetest result) for the SDQ has been demonstrated to be es-pecially good for (70–90%) for identification of conduct,oppositional disorders and hyperactivity disorders.
Data Analytic Strategy
Combining CDFA with IRT
Our primary data analytic strategy was to apply twotypes of latent variable measurement models to the data:
Categorical data factor analysis and item response (la-tent trait) theory (IRT). In the literature, applications ofCDFA methodology often report only numerical results,whereas applications of related IRT models summarisetheir findings graphically. We wished to exploit both rep-resentations and therefore applied software for estimatingboth types of models.
Background to Statistical Models
Introductory, technical and statistical accounts ofthe family of the models that comprise the IRT andCDFA approach are presented elsewhere (Baker, 2001;Duncan-Jones, Grayson, & Moran, 1986; Lord, 1980;Lord & Novick, 1968; van der Linden & Hambleton,1997). Bartholomew and Knott (1999) and McDonald(1999) provide excellent accounts of relations betweenthese models and more traditional models.
Briefly, CDFA is an extension of the linear factoranalysis model intended for dimension reduction and scal-ing of multiple binary or ordinal items. We consider onlythe probit-probit factor model of Muthen (1984, 1989).The model provides regression estimates of factor scoreswhich are location values for latent trait scores along thesingle dimension of depression severity.
IRT analysis allows for detailed examination of theproperties of individual items by determining item char-acteristic curves. ICCs characterize the interaction of aperson with an item and plot the probability of a response(endorsing a symptom) given the level of the underlyingcharacteristic measured by the “test” (Cooke & Michie,1997)—in this case the severity of self-reported depressivesymptoms. ICCs are defined in terms of two parametersthat govern the shape and position of the S-shaped curves.In educational testing settings where IRT models weredeveloped, the first parameter, a, is referred to as the item“discrimination” and governs the steepness of the slopeof the ICC at the inflexion point of the S-shaped curve.A lower a-value is associated with a more gradual slope.Items with low slope estimates provide information overa wider range of latent trait values. Items with highera-values have steeper curves and therefore discriminatemore finely, but over a smaller range of latent trait values.The second parameter, b, relates to the prevalence of theitem (here the proportion of the sample that endorse eachSMFQ symptom). In educational settings, it is referredto as the “difficulty” parameter since there it is related tothe difficulty of the test item. The b-parameter is relatedto the point on the trait dimension at which a respondenthas a 50% probability of endorsing the item. In clinicaland epidemiological studies, this parameter is referred to

384 Sharp, Goodyer, and Croudace
as “commonality,” since it relates to the prevalence ofthe symptoms. If the b-value is low, it indicates that theitem/symptom is frequently endorsed even among low-trait individuals. In contrast, high values indicate that theitem/symptom is likely to be endorsed only among high-trait individuals (e.g. severely depressed).
Graphical Representation of ScalePerformance from IRT
The test information function (TIF) is a particularlyuseful output of an IRT analysis. The TIF profiles vari-ations in the precision of measurement of the latent traitscores over the full range of estimated values (latent traitscores). The TIF provides a compelling graphical assess-ment of the effective measurement range of the SMFQinstrument. Reports of CDFA analyses do not usuallyprovide any information on the range over which reli-able (accurate) scores are estimated for individuals, onlyreliability at an aggregate level (for a sample group).
Software for Model Estimation
For the CDFA, we implemented Muthen’s ro-bust weighted least squares estimation approach us-ing Mplus software (see Flora & Curran, 2004). Forthe IRT analyses, we implemented marginal maxi-mum likelihood (MML) estimation of the two pa-rameter logit-probit IRT model (Albanese & Knott,1990; Bartholomew, 1987; Bartholomew & Knott, 1999;Bartholomew, Steele, Moustaki, & Gabraith, 2002) inTWOMISS. TWOMISS estimates model parameters forthe logit-probit model by a maximum likelihood proce-dure using a modified expectation-maximisation (EM)algorithm.
MIMIC Modelling to Test for Differences in Item CDFAIntercepts (thresholds) by Age
In order to explore the impact of age on item re-sponses, we used the MIMIC modelling approach of Galloet al. (1994). This extends the categorical data factormodel to include a covariate. MIMIC modelling enabledus to test the hypotheses of a linear association of latenttrait scores with age (as a continuous measure), but no im-pact of age on the SMFQ item intercepts (thresholds). Thepresence of the latter would indicate differential item func-tion with respect to age. We tested DIF for each SMFQitem (one at a time) by freely estimating the correlation ofthe latent factor with age, and also estimating the impact
of age on the location of the threshold term in the itemresponse model.
RESULTS
Descriptive Statistics
All participants who completed the SMFQ answeredall questions because questionnaires were individually ad-ministered and checked before they were returned. Therewere 10 children who did not want to complete the ques-tionnaire. Children were not required to give a reasonfor non-participation. Full questionnaire data were there-fore available for 649 children. There were no missingdata.
The SMFQ is a 13-item measure to which each re-sponse can be 2, 1 or 0. We recoded all responses tobinary format (0/1) because the low frequency (<5%) of2 scores meant that very little information would be lostin grouping these with 1 responses (options were recodedin the following way: 0 = 0 and 1, 2 = 1). Another advan-tage of recoding to binary responses (collapsing the twohighest response categories) is that it provides a generallymore parsimonious model, and simplifies the reportingof our IRT analysis of a candidate childhood depressionscreening tool.
A 2 × 2 comparison (7-year-olds versus older ×score of 0 versus 1 on the SMFQ) on each item showedno significant differences between 7-year-olds (to whomquestions were read out) and the rest of the children. Chil-dren 8 years and older did not display difficulty complet-ing the questionnaires by themselves. In addition, age didnot correlate with SMFQ total scores, although a signifi-cant relationship was found for SMFQ total scores and IQ(r = −0.17; p < 0.01).
Table II shows the prevalence of binary recodeditem responses to each item: Five items were endorsedby 15% or more of the sample (item numbers: 4, rest-less; 7, poor concentration; 3, tired; 10, felt lonely; 12,never be as good); five items were endorsed by fewerthan 10% (item numbers: 2, not enjoy anything; 6, crieda lot; 9, bad person; 11, unloved; 13, did everythingwrong).
Confirmatory Factor Analysis in Mplus Usingthe Probit-Probit Model (Muthen, 1984, 1989)
First we summarize the results in terms of the lambdaand tau parameters from the confirmatory categoricaldata factor analysis model. Then, we discuss indica-tions of model fit [chi-square, root mean square error of

An IRT and CDFA Analysis of the SMFQ 385
Table II. Item Endorsement in Terms of the Proportion of the Sample that Endorsed Each Individual Item, TetrachoricCorrelations Between Items, and Proportion of the Sample that Endorsed Pairs of Items
Item % 1 2 3 4 5 6 7 8 9 10 11 12 13
1 0.107 0.023 0.043 0.045 0.036 0.028 0.049 0.036 0.028 0.049 0.032 0.043 0.0282 0.094 0.331 0.036 0.029 0.031 0.022 0.046 0.032 0.011 0.034 0.017 0.037 0.0203 0.176 0.412 0.356 0.065 0.040 0.037 0.063 0.042 0.020 0.049 0.039 0.056 0.0394 0.275 0.233 0.060 0.181 0.054 0.036 0.091 0.059 0.029 0.060 0.045 0.062 0.0425 0.114 0.474 0.448 0.335 0.315 0.031 0.049 0.054 0.025 0.059 0.039 0.062 0.0326 0.090 0.439 0.362 0.403 0.188 0.468 0.031 0.031 0.019 0.040 0.022 0.032 0.0287 0.178 0.490 0.510 0.401 0.430 0.456 0.299 0.056 0.036 0.065 0.042 0.068 0.0488 0.114 0.474 0.473 0.357 0.373 0.686 0.468 0.531 0.028 0.051 0.032 0.054 0.0369 0.060 0.589 0.209 0.258 0.286 0.507 0.447 0.565 0.567 0.031 0.023 0.028 0.019
10 0.164 0.523 0.361 0.284 0.175 0.599 0.478 0.455 0.509 0.509 0.048 0.057 0.03111 0.088 0.525 0.261 0.435 0.341 0.594 0.386 0.478 0.500 0.557 0.593 0.043 0.02312 0.151 0.474 0.440 0.037 0.239 0.662 0.388 0.526 0.578 0.477 0.449 0.559 0.04313 0.077 0.495 0.380 0.497 0.370 0.551 0.554 0.628 0.600 0.493 0.397 0.470 0.618
Note. Column 1 (item) refers to the 13 SMFQ items. Column 2 (%) refers to proportion of the sample that endorsed eachitem (responded 1or 2 rather than 0). The lower left triangle denotes the tetrachoric correlations between items. The upperright triangle denotes the proportion of the sample that endorsed both items. Item labels, 1: Miserable/unhappy; 2: Notenjoy anything; 3: Tired; 4: Restless; 5: No good anymore; 6: Cried a lot; 7: Poor concentration; 8: Hated self; 9: Badperson; 10: Felt lonely; 11: Unloved; 12: Never as good; 13: Everything wrong.
approximation (RMSEA) and standardised root meansquare residuals (SRMR)].
Inspection of the factor loadings (column 3—lamdavalues) for the full sample shows high values for all items.Items 2, 3, 4 and 6 had the lowest factor loadings. The vari-ance in item responses not explained by the single latentfactor is quantified by the residual variances in column 4.Clearly these are quite substantial in magnitude for items2, 3, 4 and 6. The standard errors (not shown) for theseitems were also larger than for other items. Overall themagnitude of most of the loadings is consistent with thehypothesis underpinning our use of a single latent vari-able, that is, that the SMFQ items are relatively sensitive(discriminating) indicators of an underlying continuum ofdepression.
Tests of Model Fit
All indices of model fit (chi-square, RMSEA andSRMR) supported the adequacy of a single latent vari-able model. The comparative fit index (CFI) (0.992) andTucker Lewis Index (TLI) (0.994) were both high andclose to 1; the root mean square error of approximationwas low (<0.06) (RMSEA = 0.018). The standardizedroot mean square residual (0.063); the weighted root meansquare residual were also low (0.833). There was lit-tle scope for model fit improvement by increasing thenumber of factors, and little justification in terms of ourstudy aims (full results available on request from firstauthor).
Full Information Item Factor Analysis Using theLogit-Probit Model (Bartholomew & Knott, 1999)
Pattern Frequencies
We first considered pattern frequencies for all re-sponse patterns for the binary recoded data. Under thefull information approach, all information from the multi-way cross-tabulation of all item responses is used. Thus,there are 132 possible response patterns for which fre-quencies may be reported. In most samples with morethan six items, many possible patterns will not be observed(since sample size is usually much less than the numberof itemsnumber of response categories). Only with shorter instru-ments is it possible to display all pattern frequencies (i.e.for scales with 5 or 6 binary items). For a 13-item ques-tionnaire and a sample of n = 659 like the current study, 10pages of response patterns were returned. Space does notpermit a full report of all response frequencies. Thus, onlythe most common patterns will be commented upon here.A full listing of response frequencies is available fromthe first author (CS). The three most common responsespatterns are reported here.
Unsurprisingly, given the nature of the sample, themost common pattern was the absence of all morbid-ity [0000000000000] with a frequency of n = 267 (41%).This represents the modal pattern of children in the samplewho had none of the 13 indicators of depression.
The second most common pattern was[0100000000000] with a frequency of 63 (10%)

386 Sharp, Goodyer, and Croudace
indicating endorsement of only one item, item 2 (didnot enjoy anything). The only other two-digit patternfrequency was 23 (3%) for the pattern [0001110000000]indicating endorsement of items 4 (restless), 5 (no goodanymore) and 6 (cried a lot). This is the modal responsefor those children in the sample who had any symptoms(at least one item endorsed).
Parameter Estimates
Table III reports parameter estimates fromTWOMISS for the maximum likelihood factor analysisunder the Bartholomew and Knott (logit-probit) model.Here, the IRT factor analysis model is parameterised dif-ferently, using alpha 0 for item intercepts and alpha 1 foritem slopes, but gives rise to very similar S-shapes for theitem characteristic curves (see later).
The final column of Table III reports a transfor-mation of the alpha 0 parameter showing the proba-bility of endorsing an item for an individual at the
Table III. Corresponding Categorical Data Factor Analysis Resultsfrom Bartholomew and Knott’s (1999) Logit-Probit Item Response
Function Model
ItemCommonality
αi0 (SD)Discrimination
αi1 (SD)
Symptomendorsement
probability formedian
individual, π i0
1. Miserable 3.12 (0.29) 1.80 (0.28) 0.042. Not enjoy 2.82 (0.231) 1.25 (0.23) 0.053. Tired 1.88 (0.152) 1.10 (0.17) 0.134. Restless 1.08 (0.105) 0.75 (0.13) 0.255. Felt no good 3.68 (0.432) 2.49 (0.40) 0.026. Cried a lot 3.09 (0.274) 1.49 (0.26) 0.047. Poor
concentration2.42 (0.246) 1.93 (0.27) 0.08
8. Hated self 3.64 (0.441) 2.44 (0.41) 0.029. Bad person 4.30 (0.541) 2.15 (0.43) 0.01
10. Felt lonely 2.39 (0.223) 1.71 (0.24) 0.0811. Unloved 3.80 (0.476) 2.19 (0.42) 0.0212. Never be as
good2.79 (0.275) 2.05 (0.28) 0.05
13. Everythingwrong
4.28 (0.545) 2.44 (0.46) 0.01
Note. Under the logit-probit model, the alphai0 (αi0) parameter in col-umn 2 relates to the location on the x-axis of the inflexion point ofthe item response function curve. Alphai1 (αi1) relates to the steep-ness of the slope of each ICC. Column 3 (π i0), is a transforma-tion of the αi0 parameter which denotes the probability of endors-ing each SMFQ item for an individual with a latent trait score ofzero, i.e. at the median/mean/modal value on the latent trait. The pa-rameters have been estimated using full information marginal max-imum likelihood estimation (modified EM algorithm) in TWOMISSsoftware.
median value on the latent trait. Here, these values rangefrom lower to upper limits. So far we have focussedon the numerical results of the IRT and CDFA mod-els. Next we consider the graphical representations thatfurther facilitate the interpretation of these parameterestimates.
Graphic Representation of Testand Item Performance
Test Information Function (TIF)
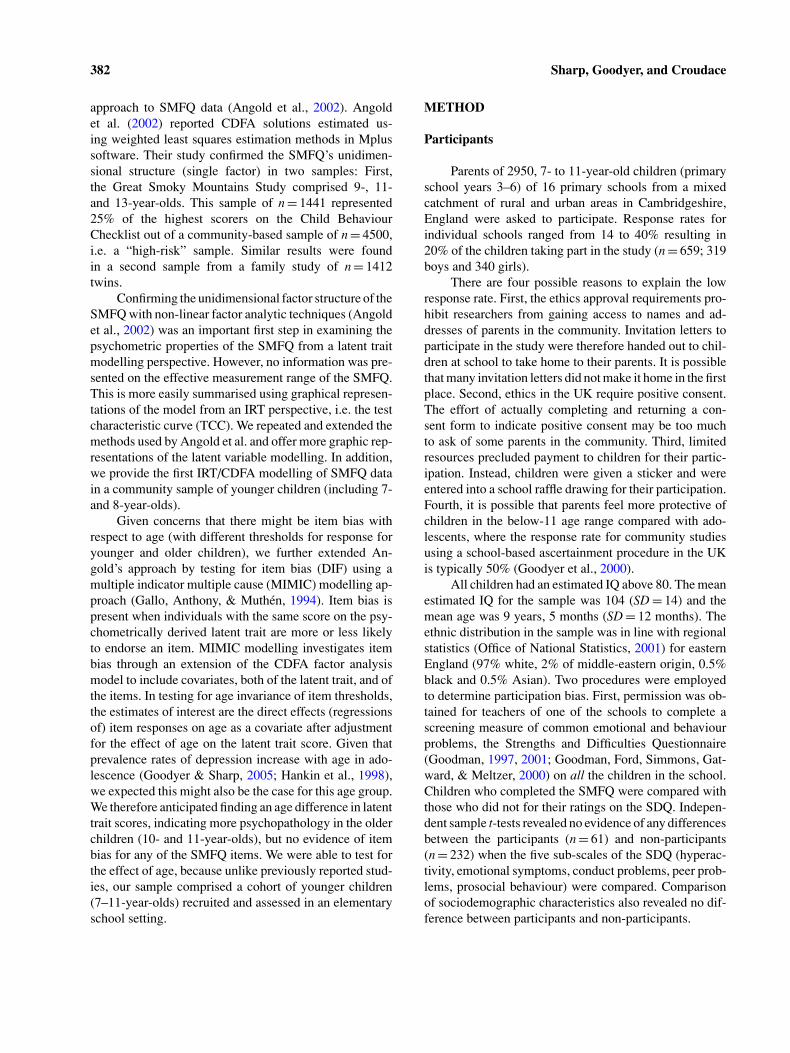
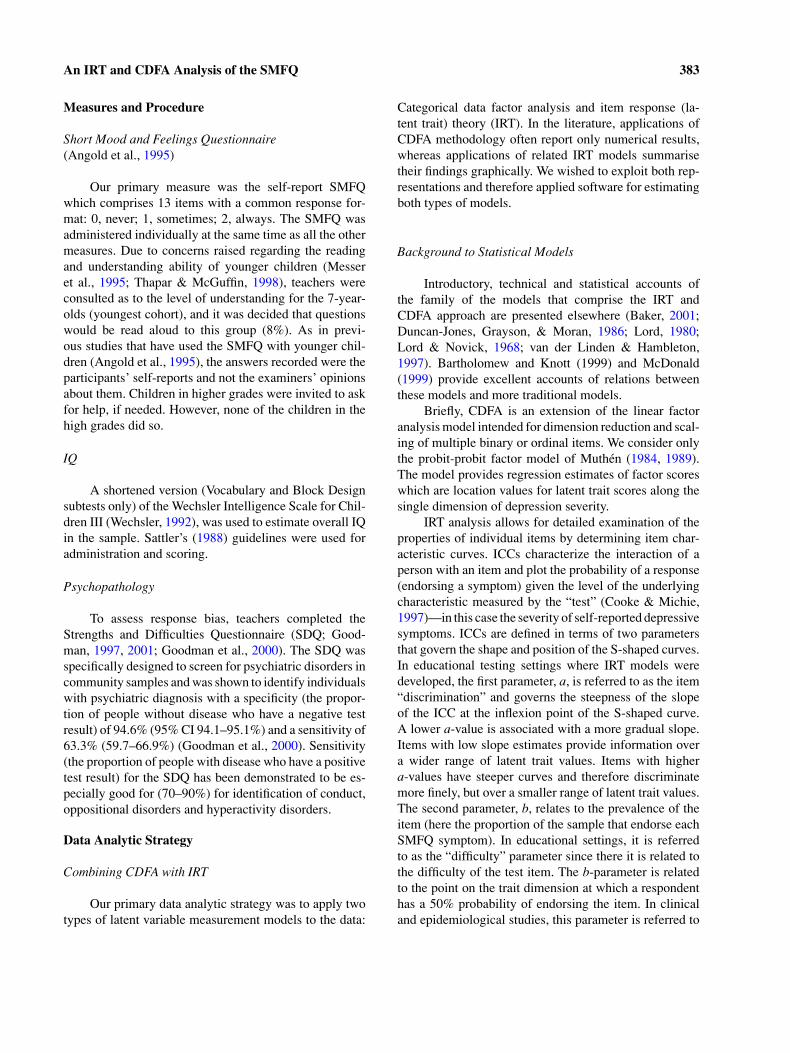
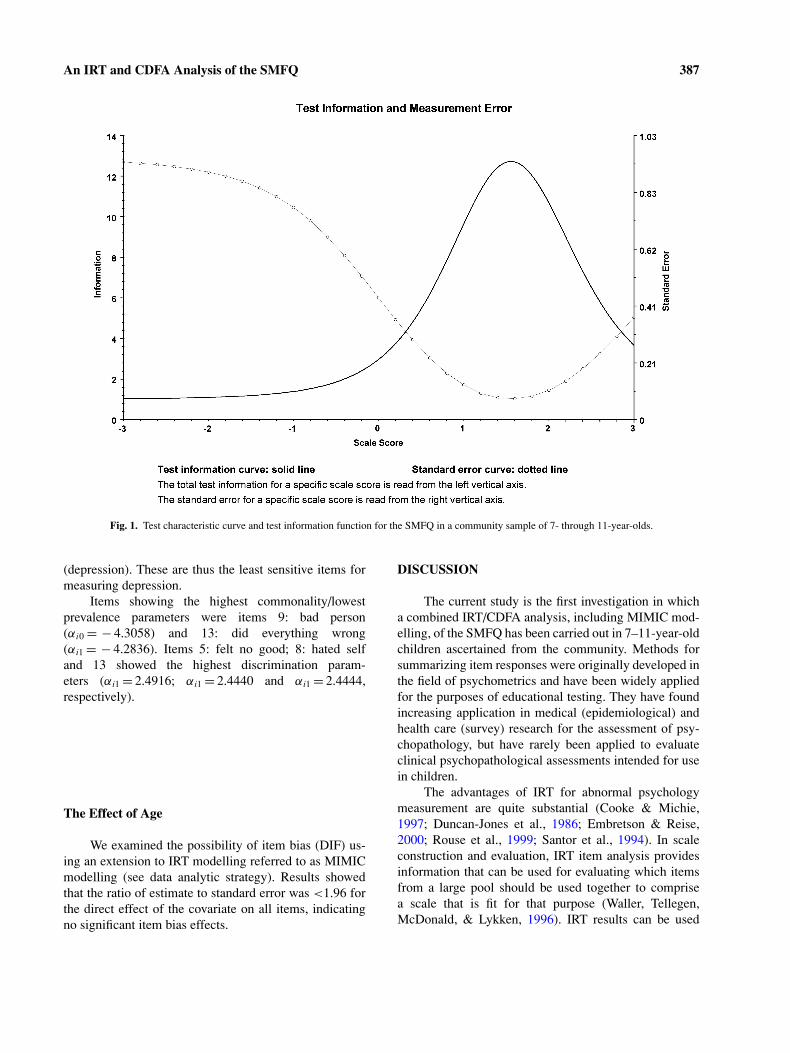
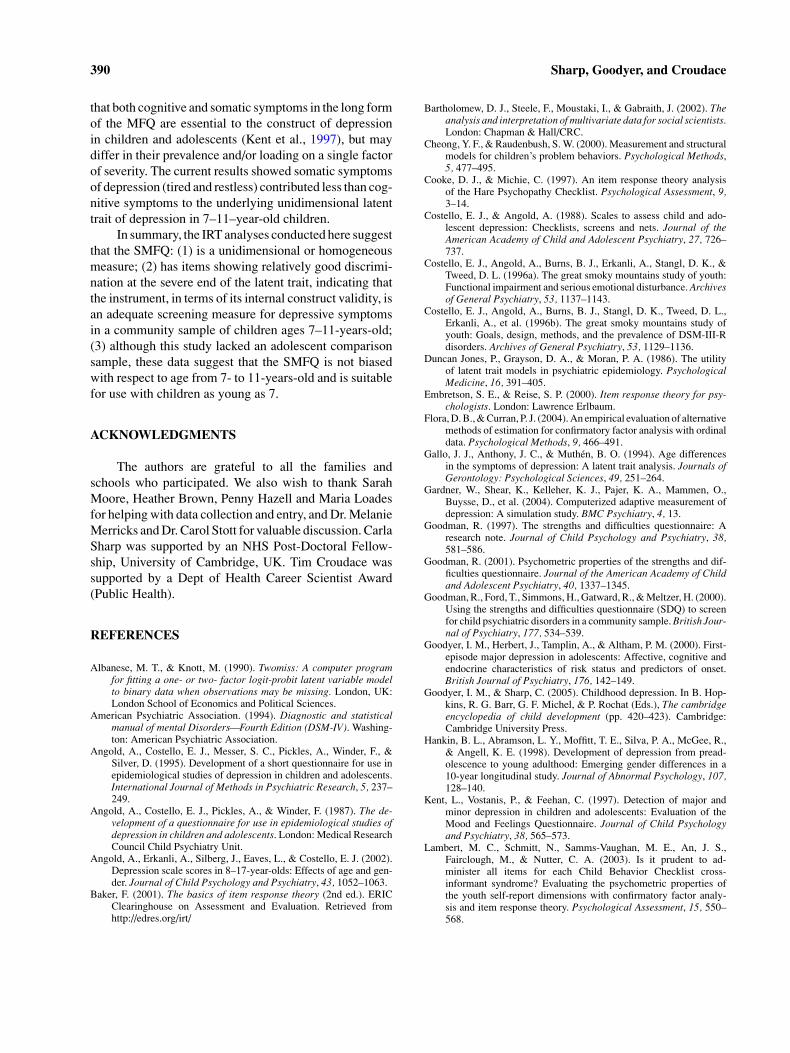
We first report a graphic representation of the psy-chometric performance of the test as a whole (Fig. 1)—theTIF. The TIF is derived from the inverse of the posteriorstandard deviation of the latent trait estimates, when thefactor scores (or latent traits estimates) are estimated usingBayesian (EAP) estimation. The TIF plots a function ofthe standard error. Taking the reciprocal of variance orstandard deviation provides a humped plot with highervalues indicating regions of precise measurement (smallstandard errors, relative to other regions)—this is “test in-formation.” As expected, the curve dips sharply at the endpoints where the SMFQ items provide little information.Figure 1 clearly shows that the most information (andtherefore highest precision of measurement) is providedby the SMFQ around 1.5 standard deviations above themean (0) on the latent trait.
Item Characteristic Curves (ICCs)
In Fig. 2, we represent the model results in terms ofICCs or “tracelines” in which the impact of the two IRTparameters are easily visible in relation to each other foreach individual item. ICCs are S-shaped functions, plottedas a function of latent trait depression scores.
All items function at more or less the same level onthe latent trait. Importantly, all items are located towardsthe more severe end—to the right of the figures. BothFigs. 1 and 2 suggest that a child located between 1 and 2standard deviations above (worse) the population mean onthe latent trait would have a 50% probability of endorsingthe SMFQ items. We can also see that for a child at themean (or median) latent trait value (0) the probability ofendorsing any item is very low. This is also reflected inthe entries in the last column of Table IV.
Although items 3 (tired) and 4 (restless) (top righttwo ICCs in Fig. 2) also function at the severe end of thelatent trait, they show more shallow slopes. This indicateslower discriminating power with respect to the latent trait
An IRT and CDFA Analysis of the SMFQ 387
Fig. 1. Test characteristic curve and test information function for the SMFQ in a community sample of 7- through 11-year-olds.
(depression). These are thus the least sensitive items formeasuring depression.
Items showing the highest commonality/lowestprevalence parameters were items 9: bad person(αi0 = − 4.3058) and 13: did everything wrong(αi1 = − 4.2836). Items 5: felt no good; 8: hated selfand 13 showed the highest discrimination param-eters (αi1 = 2.4916; αi1 = 2.4440 and αi1 = 2.4444,respectively).
The Effect of Age
We examined the possibility of item bias (DIF) us-ing an extension to IRT modelling referred to as MIMICmodelling (see data analytic strategy). Results showedthat the ratio of estimate to standard error was <1.96 forthe direct effect of the covariate on all items, indicatingno significant item bias effects.
DISCUSSION
The current study is the first investigation in whicha combined IRT/CDFA analysis, including MIMIC mod-elling, of the SMFQ has been carried out in 7–11-year-oldchildren ascertained from the community. Methods forsummarizing item responses were originally developed inthe field of psychometrics and have been widely appliedfor the purposes of educational testing. They have foundincreasing application in medical (epidemiological) andhealth care (survey) research for the assessment of psy-chopathology, but have rarely been applied to evaluateclinical psychopathological assessments intended for usein children.
The advantages of IRT for abnormal psychologymeasurement are quite substantial (Cooke & Michie,1997; Duncan-Jones et al., 1986; Embretson & Reise,2000; Rouse et al., 1999; Santor et al., 1994). In scaleconstruction and evaluation, IRT item analysis providesinformation that can be used for evaluating which itemsfrom a large pool should be used together to comprisea scale that is fit for that purpose (Waller, Tellegen,McDonald, & Lykken, 1996). IRT results can be used

388 Sharp, Goodyer, and Croudace
Fig. 2. Item characteristic curves for the 13 items of the SMFQ. Items 1–13 (panelled from left to right,first item top left). Notes: Axis labels removed for clarity of presentation. The x-axis is the estimatedlatent trait score which is distributed as a standard normal distribution; The x-axis ranges from − 3to + 3. The y-axis is the probability that the SMFQ symptom is endorsed; the y-axis ranges from aminimum value of 0 to maximum value of 1.
Table IV. Confirmatory Factor Analyses using Mplus that Gives IRT Results for Categorical Response SMFQ Items (Binary Recoded)
CDFA IRT
Item Threshold (tau) Loading (lambda)Residual variance
(1 − lambda2)Z test for loading
(estimate/SE)Discrimination
parameter aIntercept
parameter b
1. Miserable 1.24 0.68 0.53 12.96 1.05 1.742. Not enjoy 1.31 0.54 0.70 8.19 0.76 2.223. Tired 0.93 0.53 0.71 9.21 0.68 1.664. Restless 0.59 0.40 0.83 6.79 0.48 1.355. Felt no good 1.20 0.79 0.36 19.74 1.42 1.506. Cried a lot 1.34 0.60 0.63 9.73 0.89 2.067. Poor
concentration0.92 0.72 0.48 15.16 1.13 1.26
8. Hated self 1.20 0.77 0.39 18.97 1.39 1.519. Bad person 1.55 0.70 0.50 12.43 1.22 2.04
10. Felt lonely 0.97 0.67 0.53 14.14 1.00 1.4111. Unloved 1.35 0.72 0.47 15.07 1.26 1.7612. Never be as good 1.03 0.74 0.44 17.45 1.18 1.3713. Everything wrong 1.42 0.77 0.40 15.99 1.38 1.79
Notes. Parameters (loadings/lambda and thresnolds/tau) estimated using robust weighted least squares estimation (weighted lease squaresestimation with mean– and variance-adjusted chi-square test statistic). Model fit under WLSMV: Chi-square value under robust WLS (meanand variance adjusted) = 55.197, df = 46; p = 0.16; Comparative Fit Index = 0.992; Tucker Lewis Index = 0.994; Root mean square errorof approximation = 0.018; Weighted root mean square residual = 0.833. Tau: Mplus thresholds; Lambda: Mplus factor loadings; IRT a-parameter: Discrimination parameter from response function parameterisation of CDFA, related to the factor loading (lambda); IRT Intercept(b-parameter): x-axis value where p(item) = 0.5 in Fig. 2; CDFA denotes parameters from ‘underlying variable parameterisation of the twoparameter probit-probit IRT model; IRT denotes parameters under response function parameterisation of the two parameter probit-probit IRTmodel.

An IRT and CDFA Analysis of the SMFQ 389
to estimate a person’s trait level (latent trait score), whichmay be more accurate than summing unweighted indi-vidual item scores and can be calculated when there arepartially missing data. IRT results are useful for deter-mining whether the items included in a candidate scaleexhibit differential item functioning for two populations(Cooke & Michie, 1997; Rouse et al., 1999). This par-ticular advantage may be especially relevant in studieswhere developmental differences in the phenomenologyof depression are the focus of interest (see Weiss & Gar-ber, 2003 for a review of such studies). Lastly, using IRTtechnologies, there is potential for a clinical scale to besubstantially shortened through the adoption of an adap-tive testing approach (Gardner et al., 2004). With adaptivetesting (computerised adaptive testing—CAT) a softwareprogram uses IRT parameters to select items in a sequencethat optimally gain information on the severity score foreach respondent, by tailoring questions to the likely levelof the individual’s score. In summary, latent trait mod-elling techniques (like IRT and CDFA) provide a closerapproximation of the structural model underpinning psy-chiatric data than traditional linear methods (Cooke &Michie, 1997), thereby giving a better representation ofempirical data and ultimately uncovering new aspects ofa familiar instrument (Duncan-Jones et al., 1986).
By applying an IRT/CDFA approach we demon-strated, in line with Angold et al.’s findings (2002), thatthe SMFQ measures a unidimensional construct of de-pressive symptoms. Other studies have testified to theexternal validity of the SMFQ (see Table I). Based onthese studies, and the face validity of SMFQ items, weassumed the latent trait underlying SMFQ items to bethat of depression. However, in the absence of externalvalidity data we cannot conclude definitively that theconstruct we studied was in fact depression. Notwith-standing this limitation, the current results support theSMFQ as a highly homogenous/unidimensional measure.Homogeneity/unidimensionality of a measure maximizesthe ability to discriminate between diagnostically distinctgroups (Costello & Angold, 1988) and thus speaks to thevalidity of the measure.
High correlations between SMFQ items in this sam-ple suggest good internal consistency for the scale inyounger children. Factor loadings for all SMFQ itemswere high, indicating that the items were highly discrim-inating with respect to the latent trait. Item distributionalong the latent trait continuum was also consistent withthe goals of the instrument to be used for screening pur-poses. All items were found to function at the severeend of the latent trait, with none being useful to mea-sure individuals at the 50th percentile in the population(mean, median—the midpoint of the latent trait). Accord-
ing to these results, the SMFQ may not be appropriatefor use in community studies where the interest lies invariation in average (mental) health, because this wouldrequire items to be more widely distributed across therange of the latent trait. As such, the SMFQ may be moreappropriate for detecting children ages 7–11 who arelikely to report high levels of depressive symptoms at thetime of measurement. Despite the low response rate in thecurrent study, which may affect the generalizability of ourfindings, the current study indicates with more appropri-ate statistical modelling techniques that the SMFQ doeswhat it was designed to do (Angold, Costello, Pickles, &Winder, 1987).
An interesting next step would be to carry out IRTanalyses of the SMFQ in a clinical sample with a currentdiagnosis of depression. This should yield a similar pat-tern of item loadings but the score distributions would beskewed toward the depressed end of the latent trait. In oursample, most children endorsed zero scores on the SMFQ,which is what is expected for community samples.
Our analyses showed that two items function a lit-tle differently than the others (3: tired and 4: restless).These items were characterised by ICCs that exhibitedshallower slopes and leftmost thresholds. They thereforeoffer almost no discriminating power at the most severeend of the depressive latent trait but would contribute tothe discrimination of individuals with lower scores. Thisdoes not, however, provide a strong case for shorteningthe SMFQ any further. Although these items exhibitedshallower slopes and lower thresholds in comparison withother items, their psychometric properties are not suffi-ciently different from the other items to exclude them.In contrast, items 8: hated self and 13: did everythingwrong showed most discriminating power, whilst items9: bad person and 13: did everything wrong functionedat the most severe end of the latent trait. This suggestthat these questions may be the most useful to ask if aclinician or researcher is interested in identifying a childwith depression with expediency.
The information gained from these analyses regard-ing individual item performance is also of theoretical andsubstantive interest. Items 3: tired and 4: restless whichdid not load as highly (but still sufficiently to retain them)on to the latent trait can be seen as less central to the traitfor children ages 7–11 compared with items 8: hated self,9: bad person, 11: unloved, 12: never be as good and 13:did everything wrong that load highly. Within this agerange, cognitive symptoms of depression such as items 8,9, 11 and 12 show higher factor loadings, and thereforemore discriminatory power at the severe end of the latenttrait compared with “somatic” symptoms like items 3 and4. These results are in line with previous research showing
390 Sharp, Goodyer, and Croudace
that both cognitive and somatic symptoms in the long formof the MFQ are essential to the construct of depressionin children and adolescents (Kent et al., 1997), but maydiffer in their prevalence and/or loading on a single factorof severity. The current results showed somatic symptomsof depression (tired and restless) contributed less than cog-nitive symptoms to the underlying unidimensional latenttrait of depression in 7–11–year-old children.
In summary, the IRT analyses conducted here suggestthat the SMFQ: (1) is a unidimensional or homogeneousmeasure; (2) has items showing relatively good discrimi-nation at the severe end of the latent trait, indicating thatthe instrument, in terms of its internal construct validity, isan adequate screening measure for depressive symptomsin a community sample of children ages 7–11-years-old;(3) although this study lacked an adolescent comparisonsample, these data suggest that the SMFQ is not biasedwith respect to age from 7- to 11-years-old and is suitablefor use with children as young as 7.
ACKNOWLEDGMENTS
The authors are grateful to all the families andschools who participated. We also wish to thank SarahMoore, Heather Brown, Penny Hazell and Maria Loadesfor helping with data collection and entry, and Dr. MelanieMerricks and Dr. Carol Stott for valuable discussion. CarlaSharp was supported by an NHS Post-Doctoral Fellow-ship, University of Cambridge, UK. Tim Croudace wassupported by a Dept of Health Career Scientist Award(Public Health).
REFERENCES
Albanese, M. T., & Knott, M. (1990). Twomiss: A computer programfor fitting a one- or two- factor logit-probit latent variable modelto binary data when observations may be missing. London, UK:London School of Economics and Political Sciences.
American Psychiatric Association. (1994). Diagnostic and statisticalmanual of mental Disorders—Fourth Edition (DSM-IV). Washing-ton: American Psychiatric Association.
Angold, A., Costello, E. J., Messer, S. C., Pickles, A., Winder, F., &Silver, D. (1995). Development of a short questionnaire for use inepidemiological studies of depression in children and adolescents.International Journal of Methods in Psychiatric Research, 5, 237–249.
Angold, A., Costello, E. J., Pickles, A., & Winder, F. (1987). The de-velopment of a questionnaire for use in epidemiological studies ofdepression in children and adolescents. London: Medical ResearchCouncil Child Psychiatry Unit.
Angold, A., Erkanli, A., Silberg, J., Eaves, L., & Costello, E. J. (2002).Depression scale scores in 8–17-year-olds: Effects of age and gen-der. Journal of Child Psychology and Psychiatry, 43, 1052–1063.
Baker, F. (2001). The basics of item response theory (2nd ed.). ERICClearinghouse on Assessment and Evaluation. Retrieved fromhttp://edres.org/irt/
Bartholomew, D. J., Steele, F., Moustaki, I., & Gabraith, J. (2002). Theanalysis and interpretation of multivariate data for social scientists.London: Chapman & Hall/CRC.
Cheong, Y. F., & Raudenbush, S. W. (2000). Measurement and structuralmodels for children’s problem behaviors. Psychological Methods,5, 477–495.
Cooke, D. J., & Michie, C. (1997). An item response theory analysisof the Hare Psychopathy Checklist. Psychological Assessment, 9,3–14.
Costello, E. J., & Angold, A. (1988). Scales to assess child and ado-lescent depression: Checklists, screens and nets. Journal of theAmerican Academy of Child and Adolescent Psychiatry, 27, 726–737.
Costello, E. J., Angold, A., Burns, B. J., Erkanli, A., Stangl, D. K., &Tweed, D. L. (1996a). The great smoky mountains study of youth:Functional impairment and serious emotional disturbance. Archivesof General Psychiatry, 53, 1137–1143.
Costello, E. J., Angold, A., Burns, B. J., Stangl, D. K., Tweed, D. L.,Erkanli, A., et al. (1996b). The great smoky mountains study ofyouth: Goals, design, methods, and the prevalence of DSM-III-Rdisorders. Archives of General Psychiatry, 53, 1129–1136.
Duncan Jones, P., Grayson, D. A., & Moran, P. A. (1986). The utilityof latent trait models in psychiatric epidemiology. PsychologicalMedicine, 16, 391–405.
Embretson, S. E., & Reise, S. P. (2000). Item response theory for psy-chologists. London: Lawrence Erlbaum.
Flora, D. B., & Curran, P. J. (2004). An empirical evaluation of alternativemethods of estimation for confirmatory factor analysis with ordinaldata. Psychological Methods, 9, 466–491.
Gallo, J. J., Anthony, J. C., & Muthen, B. O. (1994). Age differencesin the symptoms of depression: A latent trait analysis. Journals ofGerontology: Psychological Sciences, 49, 251–264.
Gardner, W., Shear, K., Kelleher, K. J., Pajer, K. A., Mammen, O.,Buysse, D., et al. (2004). Computerized adaptive measurement ofdepression: A simulation study. BMC Psychiatry, 4, 13.
Goodman, R. (1997). The strengths and difficulties questionnaire: Aresearch note. Journal of Child Psychology and Psychiatry, 38,581–586.
Goodman, R. (2001). Psychometric properties of the strengths and dif-ficulties questionnaire. Journal of the American Academy of Childand Adolescent Psychiatry, 40, 1337–1345.
Goodman, R., Ford, T., Simmons, H., Gatward, R., & Meltzer, H. (2000).Using the strengths and difficulties questionnaire (SDQ) to screenfor child psychiatric disorders in a community sample. British Jour-nal of Psychiatry, 177, 534–539.
Goodyer, I. M., Herbert, J., Tamplin, A., & Altham, P. M. (2000). First-episode major depression in adolescents: Affective, cognitive andendocrine characteristics of risk status and predictors of onset.British Journal of Psychiatry, 176, 142–149.
Goodyer, I. M., & Sharp, C. (2005). Childhood depression. In B. Hop-kins, R. G. Barr, G. F. Michel, & P. Rochat (Eds.), The cambridgeencyclopedia of child development (pp. 420–423). Cambridge:Cambridge University Press.
Hankin, B. L., Abramson, L. Y., Moffitt, T. E., Silva, P. A., McGee, R.,& Angell, K. E. (1998). Development of depression from pread-olescence to young adulthood: Emerging gender differences in a10-year longitudinal study. Journal of Abnormal Psychology, 107,128–140.
Kent, L., Vostanis, P., & Feehan, C. (1997). Detection of major andminor depression in children and adolescents: Evaluation of theMood and Feelings Questionnaire. Journal of Child Psychologyand Psychiatry, 38, 565–573.
Lambert, M. C., Schmitt, N., Samms-Vaughan, M. E., An, J. S.,Fairclough, M., & Nutter, C. A. (2003). Is it prudent to ad-minister all items for each Child Behavior Checklist cross-informant syndrome? Evaluating the psychometric properties ofthe youth self-report dimensions with confirmatory factor analy-sis and item response theory. Psychological Assessment, 15, 550–568.
An IRT and CDFA Analysis of the SMFQ 391
Lord, F. M. (1980). Applications of item response theory to practicaltesting problems. Mahwah, NJ: Erlbaum.
Lord, F. M., & Novick, M. R. (Eds.). (1968). Statistical theories ofmental test scores. Reading, MA: Addison-Wesley.
McDonald, R. P. (1999). Test theory: A unified treatment. Mahwah, NJ:LEA.
Messer, S. C., Angold, A., Costello, E. J., Loeber, R., Van Kammen, W.,& Stouthamer-Loeber, M. (1995). Development of a short question-naire for use in epidemiological studies of depression in childrenand adolescents: Factor composition and structure across develop-ment. International Journal of Methods in Psychiatric Research, 5,251–262.
Muthen, B. (1984). A general structural equation model with dichoto-mous, ordered categorical, and continuous latent variable indica-tors. Psychometrika, 49, 115–132.
Muthen, B. (1989). Multiple-group structural modelling with non-normal continuous variables. British Journal of Mathematical andStatistical Psychology, 42, 55–62.
Office of National Statistics. (2001). Retrieved fromhttp://www.statistics.gov.uk/
Park, R. J., Goodyer, I. M., & Teasdale, J. D. (2002). Cate-goric overgeneral autobiographical memory in adolescents withmajor depressive disorder. Psychological Medicine, 32, 267–276.
Patton, G. C., Carlin, J. B., Shao, Q., Hibbert, M. E., & Bowes, G.(1997). Adolescent dieting: Healthy weight control or borderlineeating disorder? Journal of Child Psychology and Psychiatry, 38,299–306.
Rouse, S. V., Finger, M. S., & Butcher, J. N. (1999). Advances in clinicalpersonality measurement: An item response theory analysis of theMMPI-2 PSY-5 scales. Journal of Personality Assessment, 72, 282–307.
Santor, D. A., Ramsay, J. O., & Zuroff, D. C. (1994). Nonparametricitem analyses of the Beck Depression Inventory: Evaluating genderitem bias and response option weights. Psychological Assessment,6, 255–270.
Sattler, J. M. (1988). Assessment of children. San Diego, CA: Sattler.Shrout, P. E., & Parides, M. (1992). Conventional factor analysis as
an approximation to latent trait models for dichotomous data. In-ternational Journal of Methods in Psychiatric Research, 2, 55–65.
Takane, Y., & de Leeuw, J. (1987). On the relationship between itemresponse theory and factor analysis of discretized variables. Psy-chometrika, 52, 393–408.
Thapar, A., & McGuffin, P. (1998). Validity of the shortened Mood andFeelings Questionnaire in a community sample of children andadolescents: A preliminary research note. Psychiatry Research, 81,259–268.
van der Linden, W. J., & Hambleton, R. K. (1997). Handbook of modernitem response theory. New York: Springer-Verlag.
Waller, N. G., Tellegen, A., McDonald, R. P., & Lykken, D.T. (1996). Exploring nonlinear models in personality as-sessment: Development and preliminary validation of a neg-ative emotionality scale. Journal of Personality, 64, 545–576.
Wechsler, D. (1992). Wechsler intelligence scale for children (3rd UKed.). London: Psychological Corporation.
Weiss, B., & Garber, J. (2003). Developmental differences in the phe-nomenology of depression. Development and Psychopathology, 15,403–430.
Wood, A., Kroll, L., Moore, A., & Harrington, R. (1995). Propertiesof the Mood and Feelings Questionnaire in adolescent psychiatricoutpatients: A research note. Journal of Child Psychology and Psy-chiatry, 36, 327–334.