the significance of sustainable breeding and …orgprints.org/16860/1/thesis_garmo_nvh.pdfthe...
TRANSCRIPT

The Significance of Sustainable Breeding and
Management Programs on Reproductive Performance in Norwegian Red Cows
Randi Therese Garmo
Thesis for the degree of PhD
Norwegian School of Veterinary Science Oslo 2009
© Randi Therese Garmo, 2010 Series of dissertations submitted to the Norwegian School of Veterinary Science No.67 ISSN 1890-0364 ISBN 978-82-7725-179-0 All rights reserved. No part of this publication may be reproduced or transmitted, in any form or by any means, without permission. Cover: Unipub AS Printed in Norway: AiT e-dit AS, Oslo, 2010. Produced in co-operation with Unipub AS. The thesis is produced by Unipub AS merely in connection with the thesis defence. Kindly direct all inquiries regarding the thesis to the copyright holder or the unit which grants the doctorate. Unipub AS is owned by The University Foundation for Student Life (SiO)

The Significance of Sustainable Breeding and
Management Programs on Reproductive Performance in Norwegian Red Cows
Randi Therese Garmo
Thesis for the degree of PhD
Contributors:
Norwegian School of Veterinary Science Department of Production Animal Clinical Sciences
The National Veterinary Institute
Geno, Breeding and AI association
Bioforsk Økologisk


1
CONTENTS
ACKNOWLEDGEMENTS--------------------------------------------------------------------------- 3
LIST OF ABBREVIATIONS ------------------------------------------------------------------------ 5
LIST OF PAPERS-------------------------------------------------------------------------------------- 6
SUMMARY ---------------------------------------------------------------------------------------------- 7
SAMANDRAG ------------------------------------------------------------------------------------------ 9
INTRODUCTION -------------------------------------------------------------------------------------11
The Norwegian Red breed ------------------------------------------------------------------------------------------------- 11 Selection of sires ---------------------------------------------------------------------------------------------------------- 13 Traits in the total merit index ------------------------------------------------------------------------------------------- 13
Reproductive physiology in dairy cows --------------------------------------------------------------------------------- 15
Decreased pregnancy rate ------------------------------------------------------------------------------------------------- 16
Pregnancy diagnosis by rectal palpation and PAG ------------------------------------------------------------------- 17
Female Fertility traits ------------------------------------------------------------------------------------------------------ 17
Reproductive performance, milk yield, and energy balance-------------------------------------------------------- 17
Progesterone profiles post partum and reproductive performance ----------------------------------------------- 18
Sustainability and reproductive performance ------------------------------------------------------------------------- 19
OBJECTIVES FOR THE STUDY -----------------------------------------------------------------20
MATERIALS AND METHODS--------------------------------------------------------------------21
Study designs and study populations ------------------------------------------------------------------------------------ 21
Statistical analysis ----------------------------------------------------------------------------------------------------------- 22 Paper I---------------------------------------------------------------------------------------------------------------------- 23 Paper II -------------------------------------------------------------------------------------------------------------------- 23 Paper III ------------------------------------------------------------------------------------------------------------------- 23 Paper IV-------------------------------------------------------------------------------------------------------------------- 23
Laboratory analysis --------------------------------------------------------------------------------------------------------- 24 Progesterone analysis ---------------------------------------------------------------------------------------------------- 24 PAG analysis -------------------------------------------------------------------------------------------------------------- 24 Bacteriological analysis of milk samples------------------------------------------------------------------------------ 24
Energy Requirements------------------------------------------------------------------------------------------------------- 25
Selection lines and breeding values -------------------------------------------------------------------------------------- 25
2
LMP cows ------------------------------------------------------------------------------------------------------------------ 25 HMP cows ----------------------------------------------------------------------------------------------------------------- 25 HI cows--------------------------------------------------------------------------------------------------------------------- 25
Definitions of C-LA, Luteal Phase, Inter-ovulatory Interval, DOV, and PCL ---------------------------------- 25 C-LA ------------------------------------------------------------------------------------------------------------------------ 25 Luteal phase --------------------------------------------------------------------------------------------------------------- 26 Inter ovulatory interval -------------------------------------------------------------------------------------------------- 26 Delayed ovulation--------------------------------------------------------------------------------------------------------- 26 Persistent corpus luteum ------------------------------------------------------------------------------------------------ 26
Examples of progesterone profiles --------------------------------------------------------------------------------------- 27
MAIN RESULTS --------------------------------------------------------------------------------------30
DISCUSSION-------------------------------------------------------------------------------------------32
Differences in C-LA between selection lines --------------------------------------------------------------------------- 32
Milk yield, EB and reproductive performance in Norwegian Red ------------------------------------------------ 33
Associations between C-LA and PCL ----------------------------------------------------------------------------------- 35
Cows and management factors related to PCL------------------------------------------------------------------------ 35
Occurrence of PCL and pregnancy rate -------------------------------------------------------------------------------- 36
Selection traits for fertility included in breeding programs--------------------------------------------------------- 36
The occurrence of DOV ---------------------------------------------------------------------------------------------------- 38
Season of AI ------------------------------------------------------------------------------------------------------------------ 38
Threshold values for progesterone level -------------------------------------------------------------------------------- 38
Pregnancy diagnosis by rectal palpation and PAG ------------------------------------------------------------------- 39
CONCLUSIONS ---------------------------------------------------------------------------------------40
BIBLIOGRAPHY -------------------------------------------------------------------------------------42
----------------
Papers I to IV
3
ACKNOWLEDGEMENTS
There are some people I would like to thank for their help and support during the preparation
of my PhD thesis. It has been hard work and sometimes I have thought it would never end.
Firstly, I would like to acknowledge my main supervisor Professor Olav Reksen for his
excellent support and enthusiasm throughout the project, his help with statistical analysis and
for helping me to achieve a high standard in my finished papers. Olav has also given me the
opportunity to develop professionally as a veterinary practitioner. I have learnt a lot, and have
really enjoyed working with him.
I would also like to thank my co-supervisor Professor Steinar Waage for his excellent help in
the conventional-organic project with study design, statistical analysis, and critical comments
in the preparation of the manuscript.
The National Veterinary Institute gave financial support to the conventional-orgainc
study in the form of free analysis of milk samples, and I would like to thank Ståle Sviland,
Bjørg Kvitle and the rest of the staff at the laboratory for their expert analysis of the quarter
milk samples. Thanks also to all organic and conventional farmers for their willingness to
participate in this study and co-author Britt Henriksen at Bioforsk økologisk for selection of
organic farmers and help in the writing process.
I would also like to thank Geno Breeding and AI association for planning and financial
support in the study of pregnancy rate in Norwegian Red cows. Special thanks to Arne Ola
Refsdal in Geno and Professor Knut Karlberg for the design and planning of the study and for
their excellent help during the writing process of the article. The staff at the hormone
laboratory did an excellent job analyzing the milk and blood samples. I would also like to
thank all AI technicians and veterinarians in Oppland and Hedmark in addition to my
colleagues at the Ambulatory clinic here at NVH for their willingness to collect samples from
the cows.
I would also like to thank my co-authors for access to data collected in the trials in the
herd at the Norwegian University of Life Sciences. These are: Håvard Steinshamn, Øystein
Havrevoll, Erling Thuen, Egil Presteløkken, Åshild Randby, Erik Ropstad, Margrete Eknæs,
and Adam Martin. Besides being my patient office mate and good discussion partner, Adam
has also helped me a lot with the language used in this thesis.
I started this project period as a research scholar at UC Davis and I would like to thank
David Herd, Tom B. Farver, and Mark Thurmond for good teaching in statistics,
epidemiology, and scientific writing.


5
LIST OF ABBREVIATIONS
AI: Artificial Insemination
C-LA: Commencement of Luteal Activity
CFAI: Interval from Calving to First Artificial Insemination
CLAI: Interval from Calving to Last Artificial Insemination
DMI: Dry Matter Intake
DOV: Delayed Ovulation
EB: Energy Balance
FUM: Norwegian Feeding value per Unit of Milk
GEE: General Estimating Equation
HMP: High Milk Production (Paper II)
HI: High Index (Paper II)
IGF-1: Insulin like Growth Factor type 1
LH: Luteinizing Hormone
LMP: Low Milk Production (Paper II)
lnWIM: Natural logarithm of Weeks In Milk
LS-means: Least Square-means
NDHRS: Norwegian Dairy Herd Recording System
PAG: Pregnancy Associated Glycoproteins
PCL: Persistent Corpus Luteum (yellow body)
SCC: Somatic Cell Count
SD: Standard Deviation
WIM: Weeks In Milk
6
LIST OF PAPERS
The thesis is based on the following four papers, which will be referred to by their Roman
numerals.
Paper I: R. T. Garmo, A.O. Refsdal, K.Karlberg, E.Ropstad, A.Waldmann, J.F. Beckers, and
O. Reksen.
Pregnancy Incidence in Norwegian Red Cows Using Nonreturn to Estrus, Rectal
Palpation, Pregnancy Associated Glycoproteins and Progesterone.
J. Dairy Sci. 2008. 91:3025-3033.
Paper II: R. T. Garmo, E.Ropstad, Ø. Havrevoll, E. Thuen, H. Steinshamn, A.Waldmann,
and O. Reksen.
Commencement of Luteal Activity in Three Different Selection Lines for Milk Yield and
Fertility in Norwegian Red Cows.
J. Dairy Sci. 2009. 92:2159-2165.
Paper III: R. T. Garmo, A. D. Martin, E. Thuen, Ø. Havrevoll, H. Steinshamn, E.
Prestløkken, Å. Randby, M. Eknæs, A. Waldmann, and O. Reksen. 2009.
Characterization of Progesterone Profiles in fall-calving Norwegian Red Cows
J. Dairy Sci. 2009. 92:4919-4928.
Paper IV: R. T. Garmo, S. Waage, B. I. F. Henriksen, S. Sviland, O. Østerås, and O.
Reksen. 2009.
Reproductive Performance, Udder Health, and Antibiotic Resistance in Mastitis
Bacteria isolated from Norwegian Red Cows in Conventional and Organic Farming.
Submitted to Acta Vet Scand.
7
SUMMARY
The breeding program for the Norwegian Red breed over the last 35 years has
included fertility, health and functional traits in addition to milk yield and other production
traits. Currently, the demands placed on individual cows are increasing particularly in regards
to milk yield, dry matter intake, fertility, and longevity. The overall goal for the four studies
included in this thesis was to assess the reproductive performance in modern Norwegian Red
cows.
In the first field study, the 60 d non return rate, pregnancy incidence, calving rate and
differences between non return rate and pregnancy incidence following first artificial
insemination (AI) were investigated. None of the animals were treated with reproductive
hormones prior to AI. The proportion of cows not returning to estrus was 72.5%, the
pregnancy incidence 6 wk after AI was 63.7%, and the calving rate was 57.2%. The
difference between non return rate and pregnancy incidence was higher for older cows
compared with younger cows and heifers. Parity number did not affect the likelihood of
pregnancy when heifers were excluded from the analysis, but heifers had higher pregnancy
incidence than cows. The interval to first AI was not associated with pregnancy incidence,
which could be due to a relatively long voluntary waiting period (85.3 d). Milk yield was also
not associated with the pregnancy incidence. The moderate milk yield in Norwegian Red
cows and inclusion of non return rate as a fertility trait in the Norwegian breeding program
over the past 35 years are probably important reasons for such good reproductive performance
as seen in this study.
Multiple ovarian cycles before first AI after calving have shown to reduce the number
of AI per pregnancy. Hence, early reestablishment of ovarian activity and onset of luteal
activity that usually occurs 4-5 d after first ovulation post partum are important factors for
good reproductive performance in dairy cows. Consequently, in some countries recent
attention has focused on breeding for early onset of luteal activity. Onset of luteal activity
after calving and relationships with the occurrence of persistent corpus luteum (yellow body)
and delayed ovulation were evaluated in clinical trials conducted in the dairy herd at the
Norwegian University of Life Sciences. The onset of luteal activity after calving was
investigated in cows selected for low milk yield, high milk yield, or the combination of high
milk yield and fertility. Cows selected for high milk yield produced more, and had a longer
interval to onset of luteal activity than cows selected for low milk yield. Whereas, time to
onset of luteal activity in cows that had been selected for both milk yield and fertility was
between the two other selection lines. Consequently, the increase in the interval from calving

8
to onset of luteal activity by selection for high milk yield can be reduced, at least partially, by
inclusion of fertility in the breeding program. The energy balance after calving was negatively
related to onset of luteal activity, but could not explain the whole difference between the
selection lines. Hence, the impairment in reproductive efficiency following selection for high
milk yield must be attributable also to factors other than negative energy balance caused by
high milk production. Further research is necessary to investigate which factors other than
negative energy balance affect the phenotypic difference in days to onset of luteal activity
between cows selected for low or high milk production. The occurrence of a persistent corpus
luteum and delayed ovulation after calving was lower in the study population of Norwegian
Reds than reported for most other dairy populations. Cows experiencing a persistent corpus
luteum after calving had shorter intervals from calving to onset of luteal activity. Hence, the
inclusion of onset of luteal activity as the only fertility trait in a breeding program may be
unwise because of the increased risk of the occurrence of a persistent corpus luteum, rather
than continuous cyclic activity, in animals that resume luteal activity too quickly after
calving. The occurrence of a persistent corpus luteum was not related to the pregnancy rate
after first AI, but cows experiencing a persistent corpus luteum were more likely to be
inseminated during the luteal phase. The likelihood of AI during the luteal phase was higher
in the study population than in the general population of Norwegian Red. This may, at least
partly, explain why the occurrence of persistent corpus luteum was associated with the
likelihood of AI during the luteal phase.
When reproductive performance and udder health were compared in conventional and
organic dairy farming systems, the interval from calving to first AI was shorter in
conventional cows, although no differences were seen in the interval from calving to last AI
or the calving interval. Conventionally managed cows were younger, milked more, and
received more concentrates than organic cows. Organic cows had lower milk somatic cell
count than conventional cows. This difference between the management systems persisted
after adjustment for age and milk yield in the statistical models. Higher levels of concentrates
are now fed in organic dairying than a decade ago. This is probably an important factor for the
higher reproductive efficiency seen today in organic farms compared with previous studies.
Consequently, the Norwegian Red is shown to be a sustainable breed that adapts well to both
conventional and more extensive production systems, such as organic farming.

9
SAMANDRAG
Fruktbarheit, helse og brukseigenskapar har vore inkludert i avlsprogrammet for Norsk
Rødt Fe (NRF) dei siste 35 åra. I dagens mjølkeproduksjon har krava for den individuelle kua
med hensyn på mjølkeproduksjon, fôrinntak og fertilitet auka. Det overordna målet for dei
fire studiane i denne avhandlinga var å vurdere fertiliteten til dagens NRF-kyr som eit resultat
av eit bærekraftig avlsprogram.
I det første feltstudien undersøkte vi 60 d ikkje omløpsprosent, drektigheitsprosent og
kalvingsprosent etter første inseminasjon (AI) hjå kyr og kviger som ikkje var hormonelt
behandla føreåt med tanke på å framkalle brunst. Ikkje omløpsprosenten var 72.5%, medan
drektigheitsprosent 6 veker etter AI og kavlingsprosenten var 63.7% og 57.2%. Differansen
mellom ikkje omløpsprosent og drektigheitsprosent var større hos eldre kyr samanlikna med
dei yngre og kviger. Det var ikkje samanheng mellom laktasjonsnummer og drektigheit når
kvigene ikkje var inkludert i analysane, men kvigene hadde høgare drektigheitsprosent.
Sannsynlegheita for drektigheit etter første AI var ikkje assosiert med tid frå kalving til AI,
noko som kan skuldast ei forholdsvis langt intervall frå kalving til første AI (85,3 d). Heller
ikkje mjølkeytelse var sett i samanheng med drektigheit på første AI. Den forholdsvise
moderate mjølkeproduksjonen og avl for fruktbarheit dei siste 35 åra er sannsynlegvis dei
viktigaste grunnane for såpass god fertilitet hjå NRF-kyr.
Det er vist at fleire brunstar før første AI, reduserer antalet AI pr drektigheit slik at
tidleg igangsetting av ovarieaktivitet (eggstokkfunksjon) etter kalving er viktig for god
fruktbarheit. Dette har ført til avl for tidleg igangsetting av ovarieaktivitet i enkelte land.
Igangsetting av ovarieaktivitet og førekomst av persisterande corpora lutea (gule legemer) og
forsinka eggløsing blei studert i besetninga på UMB ved hjelp av progesteronmåling i mjølk.
Igangsetting av ovarieaktivitet blei studert hos kyr i tre grupper avla for låg
mjølkeproduksjon, høg mjølkeproduksjon eller kombinasjonen av høg produksjon og
fruktbarheit som er represententative for dagens populasjon av NRF-kyr. Kyr avla for høg
produksjon mjølka meir og hadde lenger tid til igangsetting av ovarieaktvitet enn kyr avla for
låg produksjon, medan kyrne som var avla både for mjølk og fruktbarheit låg mellom dei to
andre gruppene. Energibalansen etter kalving virka negativt inn på igangsetting av
ovarieaktivitet, men kunne ikkje forklare heile differansen mellom avlsgruppene og
igangsetting av ovarieaktivitet etter kalving. Det er altså andre faktorar som virkar inn på
ovarieaktiviteten til stades, men desse blei ikkje studert i dette forsøket. Auka intervall frå
kalving til igangsetting av ovarieaktvitet ved avl for høgare mjølkeproduksjon kan bli redusert
ved å inkludere fertilitet i avlsprogrammet.

10
Førekomsten av persisterande corpora lutea og forsinka ovulasjonar (eggløsing) var
lågare hjå NRF-kyr samanlikna med det fleste andre populasjonar av mjølkekyr. Kyr med eit
persisterande corpus luteum etter kalving hadde tidligare igangsetting av ovarieaktivitet. Det
er difor grunn til å vere oppmerksam på å unngå avl for tidleg igangsetting av ovarieaktivitet
som einaste mål for fruktbarheit i eit avlsprogram pga større risiko for utvikling av
persisterande corpus luteum framfor kontinuerleg syklisk aktivitet. Kyr med eit persisterande
corpus luteum etter kalving hadde ikkje lågare sannsynlegheit for å bli drektig på først AI,
men sannsynlegheiten for AI i midtsyklus var større for desse kyrne. Ei mogeleg forklaring til
det siste kan vere at andelen kyr inseminert i midtsyklus i studiepoulasjonen var høgare enn i
NRF-populasjonen generelt.
Når vi samanlikna fruktbarheit og jurhelse i økologisk og konvensjonell produksjon
såg vi at dei konvensjonelle kyrne blei inseminert tidlegare, medan det ikkje var nokon
forskjell mellom tid til siste AI eller kalvingsintervall. Dei konvensjonelle kyrne var yngre,
mjølka meir, og blei fôra med meir kraftfôr enn dei økologiske. Økologiske kyr hadde lågare
celletal enn dei konvensjonelle kyrne. Celletalet var også lågare for dei økologiske kyrne når
vi hadde justert for alder og produksjon i dei statistiske modellane. Høgare kraftfôrandel til
økologiske kyr er sannsynlegvis ein viktig faktor for betre fruktbarheit i økologisk landbruk i
dag samanlikna med situasjonen for 10 år sidan. Det kan seiast at NRF er ei bærekraftig rase
som tilpassar seg dei krava som blir sett i både konvensjonell og økologisk produksjon.

11
INTRODUCTION
Since the 1970s, milk yield per cow in the dairy industry has increased rapidly because
of intense genetic selection, improved management and better nutrition (Lucy, 2001).
Economic considerations have been the main driving force behind increased genetic selection
for milk yield (VanRaden, 2004). In recent decades, there has been a worldwide decline in the
reproductive performance of dairy cows. Potential factors, such as increased milk production
and associated negative energy balance, larger herd size and higher inbreeding percentages,
have been suggested as reasons for infertility in dairy cows (Lucy, 2001; Butler, 1998).
Reproductive performance of dairy cows is shown to influence the profitability of the herd
(Louca and Legates, 1968; Gröhn and Rajala-Schultz, 2000; VanRaden, 2004). Poor fertility
increases the insemination costs and involuntary culling rate, reduces the percentage of cows
in peak lactation and hence the milk yield, such that the herd’s profitability decreases (Louca
and Legates, 1968).
The Norwegian Red breed
There have been several studies conducted to investigate the relationship between
mastitis resistance and selection lines for milk yield in Norwegian Red cows (Heringstad et
al., 2003; 2007; 2008). However, there have been no investigations into the relationships
between selection lines and fertility in the breed although reproductive efficiency has been
included in the breeding program in the last 35 years.
Currently, 95% of 265,000 dairy cows in Norway are Norwegian Reds or Norwegian
Red crossbreds (Geno, 2009a). The average 305-d milk yield per cow year (1 cow year = 365
d for a cow in the herd during one year) has increased from 6,190 kg in 2002 to 6,921 kg in
2008 (TINE Rådgiving, 2009). Over the same time period average herd size has increased
from 15.3 to 19.8 cow years. In 2007-2008, 314,541 heifers and cows were presented for first
AI (Geno, 2009b).
There has been a long tradition of cooperation between the Norwegian breeding and
AI association, Geno, and the Norwegian Dairy Herd Recording System (NDHRS). Both
Geno and the NDHRS are cooperatives owned, and managed, by 13,200 and 11,794
Norwegian dairy farmers, respectively (Geno, 2009b; TINE Rådgiving, 2009). All of these
herds are included in the Norwegian Red breeding program managed by Geno. The NDHRS
has operated in Norway since 1975. Data for inseminations are routinely reported to Geno by
veterinarians and AI technicians and transferred to the NDHRS. Data from individual health
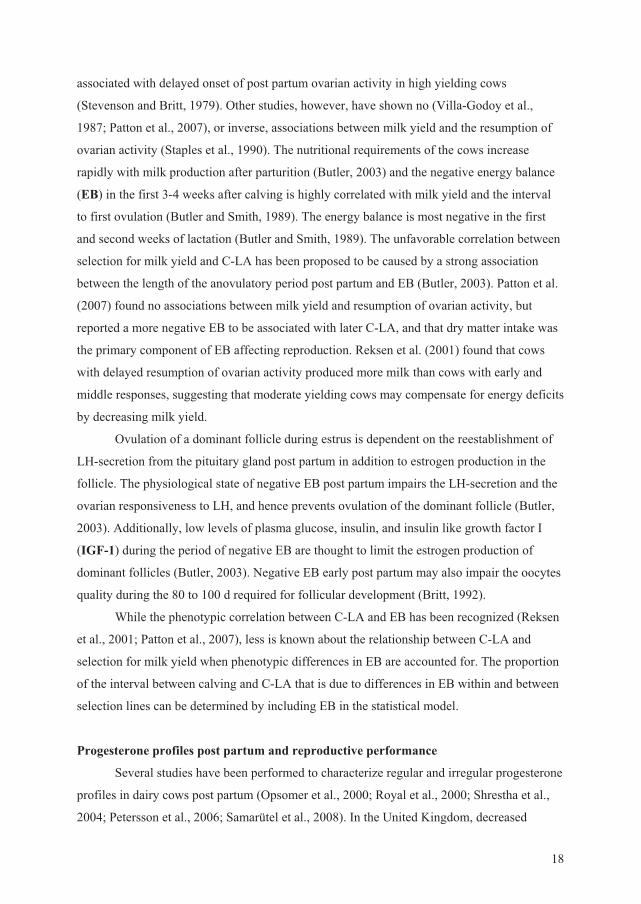
records (Figure 1), milk analyses, and AI are recorded on an individual basis, together with

12
Figu
re 1
. Exa
mpl
e of
indi
vidu
al h
ealth
reco
rd fo
r dai
ry c
ows (
onlin
e ve
rsio
n) in
the
Nor
weg
ian
Cat
tle H
ealth
Rec
ordi
ng S
yste
m.
Hel
seko
rt ku
ku n
r 08
35
Fylk
eK
omm
une
Gar
d
Prod
usen
t-
num
mer
xx
xx
xx
xx
Sjuk
dom
sreg
istr
erin
g
Føds
el/fr
uktb
arhe
t Pr
oduk
sjon
ssju
kdom
mer
Klin
isk
mas
titt
Føre
s av
eier
/røk
ter
Kal
ving
Tilb
ake-
hold
t
ette
r-
byrd
326
Bør
-
bete
n-
nels
e
333
Egg-
stok
k-
cyst
er
334
Bru
nst/
omlø
p
331,
340,
341
Mjø
lke-
febe
r
386
Ket
ose
385
Indi
-
gest
ion
260
Spen
e-
skad
er
306
Alv
orlig
/
mod
erat
303
Mild
304
And
re sj
uk-
dom
mer
og
fore
bygg
ende
beha
ndlin
g
(se
kode
lista
)
Type
beha
nd-
ling
Reg
istre
rt
av v
eter
i-
nær n
r/
andr
e
For H
usdy
r-
kont
rolle
n
Innr
app.
År
Dat
o D
ato
Dat
o D
ato
Dat
o K
ode
Dat
o D
ato
Dat
o D
ato
Dat
o D
ato
Dat
o K
ode
Kod
e M
erkn
. om
sym
pt.,
beha
ndl.
m.v
.Num
mer
D
ato
2004
18.
09
2005
12.
10
2006
20.
10
2007
28.
10
03
.03
2
53
10
10.1
0.08
07
.07
262
9
5310
10
.10.
08
Føds
elså
r og
dat
o 01
.10.
2002
K
uas n
r og
nav
n 08
35
Slak
ta/s
jøld
au/m
ista
/sol
gt ti
l liv
dat
o ...
......
......
......
. Å
rsak
.....
......
......
.....

13
calving information, milk yield records, culling information etc. recorded by the farmers. All
diseases and most of the health registrations are made by veterinarians, although in recent
years courses have been offered for dairy producers to assist them in making some additional
health recordings.
Selection of sires
Approximately 330 bull calves are selected from ordinary herds annually, on the basis
of predicted breeding values, for testing at the Geno Performance Test Station (Geno, 2009c).
The bull calves are evaluated for inclusion into the breeding program on the basis of growth
rate, temperament and confirmation parameters in addition to libido and sperm quality.
Approximately 130 of these performance tested bulls are selected for semen production and
progeny testing. To ensure that these young sires (test bulls) produce enough offspring
(daughters) for progeny testing, Geno stipulates that they are used for a minimum of 40% of
the AI in each herd. The total merit index for the sires is calculated on the performance of
about 250 to 300 daughters. The total merit index has a range from -30 to + 30 with an
average value of 0. The 10 to 12 best test bulls are selected as elite bulls based on the progeny
test results and individual evaluation. In 2008, the effective population size of the Norwegian
Red was 173, inbreeding rate per generation 0.29%, and inbreeding increase per year was
0.06%. The kinship for the elite bull is weighted by 30% in the selection index (Geno, 2009d).
Traits in the total merit index
Currently, 10 traits are included in the total merit index. The following traits (and
relative weights) were included in the breeding program in 2008: milk yield (24%), mastitis
resistance (22%), fertility (15%), udder (15%), bone confirmation (6%), growth rate (9%),
temperament (4%), other diseases: (milk fever, ketosis, retained placenta (3%)), calving ease
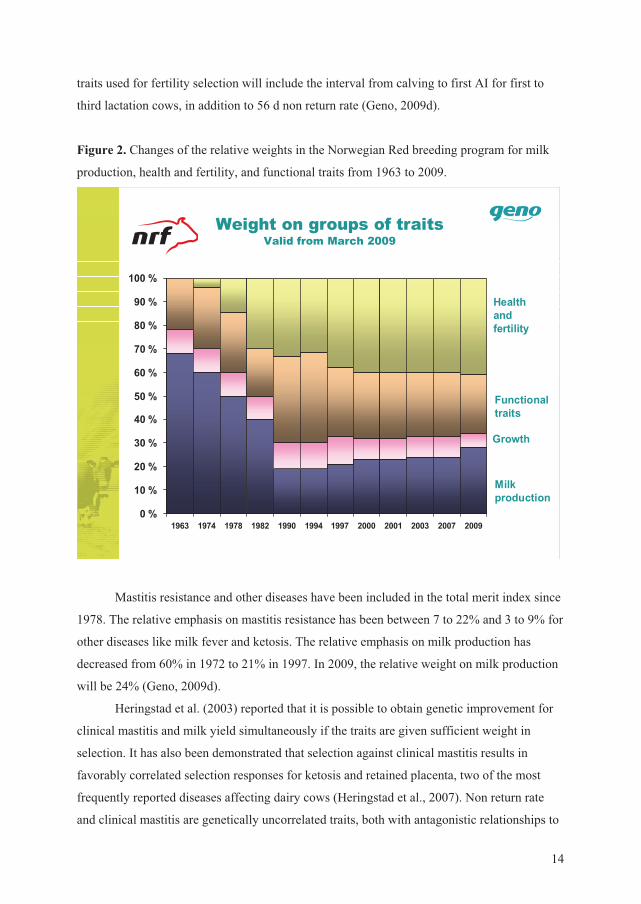
(1%), and still birth (1%) (Geno, 2009d). Changes of the relative weight in the breeding
program for milk production, fertility and health, and functional traits from 1963 to 2009 are
given in Figure 2.
Female fertility has been included in the total merit index of the Norwegian Red since
1972 (Andersen-Ranberg et al., 2005). The relative emphasis on fertility has been 8 to 15%
throughout this period. From 2009 the emphasis on fertility will increase to 18%. Historically,
the trait used in selection was the 56 d non return rate of virgin heifers. Since 2002, a
combination of 56 d non return rate in heifers and first-lactation cows has been used.
Andersen-Ranberg et al. (2005) reported that selection for non return rate has stabilized the
non return rate in first lactation cows, but concurrently there has been an undesirable increase
in the interval from calving to first AI for first parity cows (Refsdal, 2007). From 2009, the
14
traits used for fertility selection will include the interval from calving to first AI for first to
third lactation cows, in addition to 56 d non return rate (Geno, 2009d).
Figure 2. Changes of the relative weights in the Norwegian Red breeding program for milk
production, health and fertility, and functional traits from 1963 to 2009.
0 %
10 %
20 %
30 %
40 %
50 %
60 %
70 %
80 %
90 %
100 %
1963 1974 1978 1982 1990 1994 1997 2000 2001 2003 2007 2009
Weight on groups of traitsValid from March 2009
Healthandfertility
Functionaltraits
Growth
Milkproduction
Mastitis resistance and other diseases have been included in the total merit index since
1978. The relative emphasis on mastitis resistance has been between 7 to 22% and 3 to 9% for
other diseases like milk fever and ketosis. The relative emphasis on milk production has
decreased from 60% in 1972 to 21% in 1997. In 2009, the relative weight on milk production
will be 24% (Geno, 2009d).
Heringstad et al. (2003) reported that it is possible to obtain genetic improvement for
clinical mastitis and milk yield simultaneously if the traits are given sufficient weight in
selection. It has also been demonstrated that selection against clinical mastitis results in
favorably correlated selection responses for ketosis and retained placenta, two of the most
frequently reported diseases affecting dairy cows (Heringstad et al., 2007). Non return rate
and clinical mastitis are genetically uncorrelated traits, both with antagonistic relationships to

15
milk yield, such that the traits should be included in a breeding program to avoid genetic
decline due to selection for increased milk yield (Heringstad et al., 2006).
Reproductive physiology in dairy cows
The mean normal length of the estrous cycle in cows is 21 d with a range of 17 to 24 d
(Senger, 2003), whereas the mean duration of estrus is 15 h with a range of 6 to 24 h. The
ovulation occurs in late estrus. Fonseca et al. (1983) measured the first cycle post partum to
be to 17.1 d, and 21.4 d for consecutive cycles. Royal et al. (2000) reported increased length
of estrous cycle from 18.9 d in the 1970s to 22.5 d in the 1990s.
The estrous cycle can be divided into the follicular phase and the luteal phase. The
follicular phase is dominated by estrogen produced in the ovarian follicles, whereas the luteal
phase that starts after ovulation is dominated by progesterone produced by the corpus luteum.
Usually, commencement of luteal activity (C-LA) occurs approximately 4 to 5 d after first
ovulation post partum, but luteinization of non ovulating follicles can also lead to
progesterone production (Corah et al., 1974). In most studies investigating C-LA and
progesterone profiles in dairy cows, C-LA is defined to occur when progesterone
concentration in plasma or milk exceeds a threshold value. The luteal phase ends with
luteolysis (regression of corpus luteum) and decreasing progesterone levels. Luteolysis is
induced by PGF2� produced in the endometrium and stimulated by the release of oxytocin
from the ovaries and posterior pituitary gland that acts on oxytocin receptors in the
endometrium. The precise luteolytic mechanism is not fully understood. The follicular phase
commences after the luteolysis. The negative feedback by progesterone on the hypothalamus
is removed and gonadotropin releasing hormone is released such that the level of follicle
stimulating hormone and luteinizing hormone (LH) from the anterior pituitary gland is
increasing, promoting follicular development and production of estrogen in the follicles.
There are two or three major phases of growth of large follicles during the estrous cycle and
the ovulatory follicle is selected approximately 3 d before ovulation (Webb et al., 1999).
When the estrogen levels in the dominant follicle peak, the preovulatory LH-surge occurs
causing the dominant follicle to ovulate. The ovulation occurs 24 to 30 hours after the LH-
surge. In cows, the follicular phase typically lasts for about 4 d, whereas the length of the
luteal phase is about 17 d.
16
Establishment of pregnancy depends on the endocrine communication system between
the embryo and mother. The blastocyst produces bovine Interferon �, a protein that acts on the
endometrium to inhibit production of oxytocin receptors, such that oxytocin cannot stimulate
PGF2� synthesis and luteolysis (Whates and Lamming, 1995). Sufficient progesterone
production in the corpus luteum after fertilization is essential for embryonic development
(Mann and Lamming, 1999). The gestation period is approximately 281 d, and the
maintenance of pregnancy in cows is dependent on progesterone produced in the corpus
luteum and placenta during the whole gestation period.
Decreased pregnancy rate
Traditionally, one calf a year has been the target for good reproductive performance in
dairy cows (Louca and Legates, 1968; Call and Stevenson 1985). To achieve this goal, and to
avoid decreased production and increased culling rate, the cow has to be pregnant within 90 d
after parturition. A decreased pregnancy rate in cows has been reported worldwide (Lucy,
2001). The pregnancy rate to first AI has decreased from 65% in 1951 to 40% in 1996 in New
York dairy cows (Butler, 1998) and in 2001 the pregnancy to first AI in US Holstein was at
an all time low of 27% (Norman et al., 2009). Since 2002, the pregnancy rate in US Holsteins
has stopped declining, and started to improve. In the United Kingdom, the pregnancy to first
AI declined from 55.6% to 39.7% between 1975 and 1998 (Royal et al., 2000). To improve
fertility in dairy cows, several estrous cycle management systems, involving use of
reproductive hormones and timed AI, have been developed (Thatcher et al., 2006). There are
few recent studies in which cows were inseminated at spontaneously occurring estrus (Bleach
et al., 2004; Andersson et al., 2006; Cairoli et al., 2006) compared with the large number
involving induced estrus and timed AI (Lopes-Gatius et al., 2004; Dalton et al., 2005;
Howard et al., 2006). The pregnancy rate for timed AI after hormonal induction of estrus is
generally lower than AI to a spontaneous occurring estrus, but offer acceptable pregnancy
rates without estrus detection in herds with poor breeding management routines (Lucy, 2001).
Non return rate has been regarded as a reasonably accurate indicator of reproductive
performance, but it is biased by variation in breeding management and culling practices as
well as parity, season of AI, and semen collection (Haugan et al., 2005; Refsdal, 2007).
Because only 50% of the cows are pregnancy diagnosed (Reksen et al., 1999a), a reliable
estimate of the pregnancy incidence in the Norwegian Red is not available. Internationally,
there is increasing interest in importing Norwegian Red semen (Geno, 2009d). Thus, more
17
accurate information about pregnancy incidence and calving rate is required. Additionally, the
difference between non return rate and pregnancy incidence may vary between cow parities
and should, therefore, be investigated.
Pregnancy diagnosis by rectal palpation and PAG
Pregnancy diagnosis by rectal palpation is the most common way to assess pregnancy.
But, pregnancy associated glycoproteins (PAG) measured in plasma from around Week 3 of
pregnancy can also be used for the same purpose (Zoli et al., 1992). Pregnancy associated
glycoproteins constitute a large family of glycoproteins specifically expressed in the outer
epithelial cell layer (trophectoderm or chorion) of the placenta (Xie et al., 1997). Plasma PAG
concentrations are useful for pregnancy diagnosis 28 d after AI, provided that the time
interval between calving and AI is at least 60 d (Haugejorden et al., 2006).
Female Fertility traits
The importance of including fertility related traits in the selection indices has been
stressed (Royal et al., 2002; Philipsson and Lindhé, 2003; Chagas et al., 2007), because
unfavorable genetic correlations exist between milk yield and reproductive performance
(Veerkamp et al., 2001; Royal et al., 2002; Pryce et al., 2004). Currently, female fertility is
included in the selection indices of several countries (VanRaden, 2004; Miglior et al., 2005).
Fertility traits can be divided into traditional fertility traits and endocrine fertility traits (Royal
et al., 2000). Traditional fertility traits, such as calving interval, days to first service, 56 d non
return rate, and number of inseminations per conception, have very low heritability (Pryce et
al., 1997; Wall et al., 2003; Jamrozik et al., 2005), whereas endocrine fertility traits, which
include C-LA, length of first luteal phase, and occurrence of persistent corpus luteum, have
moderate heritability (Darwash et al., 1997b; Royal et al., 2002; Petersson et al., 2007). Cows
with early C-LA after calving have an increased probability for a short interval from calving
to first AI, shorter interval to conception, and higher conception rate such that selection for
shorter interval to C-LA has been proposed as a feasible approach to improving fertility
(Darwash et al., 1997a; 1997b).
Reproductive performance, milk yield, and energy balance
Multiple ovarian cycles before first AI reduce the number of AI’s per conception
(Thatcher and Wilcox, 1973; Darwash et al., 1997a), hence early C-LA is an important
constituent of good reproductive performance in dairy cows. High milk yield has been
18
associated with delayed onset of post partum ovarian activity in high yielding cows
(Stevenson and Britt, 1979). Other studies, however, have shown no (Villa-Godoy et al.,
1987; Patton et al., 2007), or inverse, associations between milk yield and the resumption of
ovarian activity (Staples et al., 1990). The nutritional requirements of the cows increase
rapidly with milk production after parturition (Butler, 2003) and the negative energy balance
(EB) in the first 3-4 weeks after calving is highly correlated with milk yield and the interval
to first ovulation (Butler and Smith, 1989). The energy balance is most negative in the first
and second weeks of lactation (Butler and Smith, 1989). The unfavorable correlation between
selection for milk yield and C-LA has been proposed to be caused by a strong association
between the length of the anovulatory period post partum and EB (Butler, 2003). Patton et al.
(2007) found no associations between milk yield and resumption of ovarian activity, but
reported a more negative EB to be associated with later C-LA, and that dry matter intake was
the primary component of EB affecting reproduction. Reksen et al. (2001) found that cows
with delayed resumption of ovarian activity produced more milk than cows with early and
middle responses, suggesting that moderate yielding cows may compensate for energy deficits
by decreasing milk yield.
Ovulation of a dominant follicle during estrus is dependent on the reestablishment of
LH-secretion from the pituitary gland post partum in addition to estrogen production in the
follicle. The physiological state of negative EB post partum impairs the LH-secretion and the
ovarian responsiveness to LH, and hence prevents ovulation of the dominant follicle (Butler,
2003). Additionally, low levels of plasma glucose, insulin, and insulin like growth factor I
(IGF-1) during the period of negative EB are thought to limit the estrogen production of
dominant follicles (Butler, 2003). Negative EB early post partum may also impair the oocytes
quality during the 80 to 100 d required for follicular development (Britt, 1992).
While the phenotypic correlation between C-LA and EB has been recognized (Reksen
et al., 2001; Patton et al., 2007), less is known about the relationship between C-LA and
selection for milk yield when phenotypic differences in EB are accounted for. The proportion
of the interval between calving and C-LA that is due to differences in EB within and between
selection lines can be determined by including EB in the statistical model.
Progesterone profiles post partum and reproductive performance
Several studies have been performed to characterize regular and irregular progesterone
profiles in dairy cows post partum (Opsomer et al., 2000; Royal et al., 2000; Shrestha et al.,
2004; Petersson et al., 2006; Samarütel et al., 2008). In the United Kingdom, decreased

19
pregnancy rate from 1975 to 1998 has been associated with an increased proportion of
atypical progesterone profiles (Royal et al., 2000). Cows with early C-LA have increased
probability for early AI, shorter interval to conception, and higher conception rate (Darwash
et al., 1997a). However, it has been reported that early C-LA is a risk factor for irregular
luteal cyclicity in the form of a persistent corpus luteum (PCL) in the Holstein (Opsomer et
al., 2000; Royal et al., 2002; Petersson et al., 2007), and that PCL is associated with a
decrease in pregnancy to first AI (Royal et al., 2000; Shrestha et al., 2004). Hence, the
relationship between time to C-LA, occurrence of PCL and relationship between PCL and
pregnancy should be investigated in the Norwegian Red.
Sustainability and reproductive performance
Organic agriculture is defined as a holistic production management system which
promotes and enhances ecosystem health, including biological cycles and soil biological
activity. The primary goal for organic agriculture is to optimize the health and productivity of
inter-dependent communities of soil life, plants, animals and people (FAO and WHO, 2008).
Because the breeding program for the Norwegian Red has taken into consideration
fertility, health and functional traits for a long period of time, the breed may be regarded as
suitable for organic farming. During the last ten years, three Norwegian studies have been
conducted to investigate differences in reproductive performance and herd health (Reksen et
al., 1999b; Hardeng and Edge, 2001; Valle et al., 2007) between conventional and organic
farming. Reksen et al. (1999b) found lower milk yield and impaired reproductive performance
in organic cows, probably due to limited energy intake. Calving season was also different
between the management systems. Hardeng and Edge (2001) reported less disease treatment
against mastitis, ketosis, and milk fever in organic herds, and no difference in somatic cell
count between organic and conventional herds. Valle et al. (2007) reported lower incidence of
acute mastitis in organic herds, which could partly be explained by the lower production level
on organic farms. Hence, differences in reproductive performance and udder health in organic
and conventional farming need to be further elucidated.

20
OBJECTIVES FOR THE STUDY
1. Estimate of overall and parity specific 60 d non return rate, pregnancy incidence and
calving rate to first AI after spontaneous estrus in Norwegian Red cows (Paper I).
2. Assess the relationship between pregnancy and management factors at herd or cow
level (Paper I).
3. Compare the accuracy of pregnancy detection by rectal palpation with PAG analysis
supported by progesterone measurements (Paper I).
4. Quantify the differences in C-LA, milk yield, and EB between selection lines for low
milk yield, high milk yield and high index for both milk yield and fertility. Further, to
assess how much of the differences in C-LA could be accounted for by the phenotypic
differences in EB (Paper II).
5. Quantify the occurrence of typical and atypical progesterone profiles in Norwegian
Red cows (Paper III).
6. Assess the relationship between time to C-LA and the occurrence of PCL and to
investigate cow and management specific factors related to the occurrence of PCL
(Paper III).
7. Investigate differences in reproductive performance and udder health of Norwegian
Red cows in conventional and organic farming (Paper IV).

21
MATERIALS AND METHODS
Study designs and study populations
All herds in the field studies described in Papers I and IV in addition to the herd used
in Papers II and III were members of the NDHRS, such that information about calving date,
AI date, AI personnel, age at AI, parity, bimonthly somatic cell count, monthly milk yield,
monthly concentrate allocation, disease treatment, culling date, culling reason, herd size, herd
characteristics, and pedigree could be retrieved from the NDHRS files.
The study described in Paper I was a longitudinal field study conducted from October
2004 to October 2005. There were 19 AI technicians and veterinarians in eastern Norway
(Oppland, Hedmark, and Akershus) that participated in the study. The technicians and
veterinarians were selected for inclusion on the basis of location within a short geographical
distance from the Norwegian School of Veterinary Science and Geno. The study included 829
heifers and cows from 308 herds.
The studies described in Papers II and III were conducted as clinical trials in the
dairy herd at the Norwegian University of Life Sciences. The cows were managed in three
feeding trials designed to assess the effects of different levels of concentrate and different
qualities of roughage on milk yield, energy balance, and reproductive performance. In Paper
II, milk samples for progesterone measurements were obtained in 268 lactations from 147
cows during the period from 1994 to 2001. In Paper III, milk samples for progesterone
measurements were obtained in 502 lactations from 302 cows during the periods from 1994 to
2001 and from 2005 to 2008.
The study described in Paper IV was a prospective cohort study conducted in 25
conventional and 24 organic herds. The conventional herds were selected to be similar to the
organic herds according to the following criteria: localized in the same county or dairy
district, similar herd size (± five cow-years), and same barn type (free stall or tied stall). For
the investigation of differences in reproductive performance (calving interval, interval from
calving to first AI and last AI) between the management systems, 3209 lactations from 2093
cows were included in the analyses. At the herd visits in 2006, quarter milk was sampled from
1010 cows (523 conventional and 487 organic) for bacteriological examination. Data from the
herds and individual animals were obtained from the NDHRS from 2005 through 2007.

22
Statistical analysis
Statistical analyses were performed using SAS, version 9.1 (SAS Institute, Cary, NC)
and SPSS, version 15.0 (SPSS Inc., Chicago, IL).
Table1. Overview of statistical analysis used in Papers I through IV. Main Model Program Paper Outcome Type of
outcome variable
Cluster (random effects)
Correlation structure
Logistic regression
SPSS Paper I Pregnancy to first AI (1 or 0)
Dichotomous (1/0)
--- ---
General estimating equation (GEE)
SAS, Proc Genmod
Paper I Likelihood of pregnancy (1 or 0)
Dichotomous (1/0)
Herd (cows within herd)
Exchangeable symmetry
Mixed linear models
SAS, Proc Mixed
Paper II EB Milk yield Interval to C-LA
Continuous Repeated within cows, random within concentrate allocation
Compound symmetry
Mixed linear models
SPSS Paper III Interval to C-LA Continuous Repeated within cows, random within concentrate allocation
Compound symmetry
General estimating equation (GEE)
SPSS Paper III Persistent CL, Pregnancy to first AI, First AI in luteal phase
Dichotomous (1/0)
Repeated within cows
Exchangeable symmetry
Mixed linear models
SPSS Paper IV CFAI, CLAI, Calving interval
Continuous Repeated within cow
Compound symmetry
Mixed linear models
SPSS Paper IV Test-day milk yield, Somatic cell count Concentrate allocation
Continuous Repeated within lactation
First order autoregressive
Generalized linear models
SPSS Paper IV Mastitis bacteria Dichotomous (1/0)
--- ---
Mixed linear model analyses with repeated measures within cows were performed in
Papers II, III, and IV, and repeated measures within lactation in Paper IV (Table 1). Herd
was entered as a random effect in the mixed models in Paper I, whereas concentrate
allocation was entered as a random effect in the mixed models in Papers II and III. Multiple
comparison adjustment for the pair wise difference in least square means was performed
using the Bonferroni option. The outcome variables days to C-LA (Papers II and III), the
interval from calving to first AI (CFAI) and last AI (CLAI) (Paper IV), and somatic cell
count (SCC) (Paper IV) were transformed by their natural logarithm to obtain approximate
normality of residuals. The statistical models were evaluated according to the diagnostics
23
described for linear and logistic regression by Dohoo et al. (2003). Statistical significance was
considered at P < 0.05 for all analyses.
Paper I
The outcome variable, likelihood of pregnancy, was tested against the following
explanatory variables both in the univariate logistic regression models and GEE analyses:
milk yield, heifer’s age, CFAI, parity, season, double AI, housing, personnel performing AI,
and herd size. The univariate analyses were performed both simultaneously for all parities and
separately for cows and heifers.
Paper II
1) The outcome variables, EB and milk yield for each of the 12 first weeks post partum, were
tested against the selection lines for low milk yield (LMP), high milk yield (HMP), high
index for milk yield and fertility (HI), using mixed linear models.
2) The outcome variable, days to C-LA, was tested against the following explanatory
variables: selection lines for milk yield, parity and EB using mixed linear models.
Paper III
1) The outcome variable, days to C-LA, was tested against the following explanatory
variables: milk yield, parity, year, housing, disease treatment before C-LA, and occurrence of
PCL, using mixed linear models.
2) The outcome variable, PCL, was tested against the following explanatory variables; milk
yield, concentrate allocation, year, parity, housing, DOV, and disease treatment before C-LA,
using the GEE approach.
3) The GEE approach was also used to test the outcome variables likelihood of pregnancy to
first AI and likelihood of first AI during the luteal phase against the explanatory variable PCL
(PCL type I, type II or the combination).
Paper IV
1) The three outcome variables CFAI, CLAI and calving interval were tested against the
explanatory variables management, parity, milk yield, barn type, and season, using mixed
linear models. The effect of breeding management (natural mating or AI) on calving interval
was also assessed. The outcome variables were also assessed with the interactions
management system by parity, parity by season, management system by season, barn type by
season, barn type by management system, and barn type by parity.
2) Lactation curves for test-day milk yield, test-day SCC and test-day concentrate allocation
were constructed. The lactation curves were expressed through inclusion of weeks in milk
(WIM) and the natural logarithm of WIM (lnWIM) as described by Wood (1967) and
24
Reksen et al. (2007; 2008). The explanatory variables management system and parity were
included in the respective models. In addition, test-day milk yield was included in the model
expressing the lactation curve for the natural logarithm of SCC. Interactions considered as
biologically important such as WIM by management system, WIM by parity, lnWIM by
management system, and lnWIM by parity were included in the respective models.
3) The relationship between milk samples positive for mastitis bacteria at the herd visit and
the explanatory variables management system, milk yield, and parity were tested using
multiple linear regression. Intra-mammary infection was considered to be present when an
udder pathogen was isolated from at least one quarter.
For all multivariable tests in Papers I to IV the backward elimination procedure was
employed. Explanatory variables with P > 0.05 were omitted from the models.
Laboratory analysis
Progesterone analysis
Milk samples for progesterone analysis were obtained in a representative manner
during the milking in the trials conducted at the Norwegian University of Life Sciences
(Papers II and III). In Paper I milk was collected on the day of AI and 21 d after AI by the
veterinarian, AI technicians, or the farmers. In Paper II milk samples for progesterone
analysis were collected three times a week (Monday, Wednesday, and Friday), and in Paper
III two (Monday and Friday) or three (Monday, Wednesday, and Friday) times a week.
Progesterone concentrations in whole milk were measured by an enzyme immunoassay
(Waldmann, 1993), modified by using the second antibody coating technique.
PAG analysis
Blood samples for PAG (Paper I) were collected approximately six weeks after AI, if
the animal did not return to estrus. A heterologous double antibody radioimmunoassay,
modified from the method previously described by Zoli et al. (1992), was used to determine
PAG concentrations in the plasma of cows.
Bacteriological analysis of milk samples
The quarter milk samples were analyzed for growth of microorganisms (Paper IV) in
accordance with the official procedure in Norway which is based on the International Dairy
Federation guidelines (International Dairy Federation, 1981; 1987).
25
Energy Requirements
Dry matter intake (DMI) (Paper II) was calculated as dry matter offered, minus dry
matter refused, on three consecutive days in a week. Energy content in dry matter and energy
requirements were calculated according to the Norwegian feeding value per unit of milk
(FUM) system (Ekern, 1991), in which 1 FUM is equal to 6.9 MJ net energy lactation for
milk production. Energy intake was calculated as FUM intake = DMI x food FUM
concentration. Energy requirements are dependent upon maintenance, growth and milk
production according to the following formula (Van Der Honing and Alderman, 1988):
Energy requirements = FUM maintenance + FUM milk + FUM growth
Energy balance in FUM was estimated as the difference between energy intake and energy
requirements for maintenance, growth in first lactation cows, and milk production.
Selection lines and breeding values
LMP cows
Cows in the LMP selection line were bred to a group of 11 sires that were progeny
tested in 1978 and 1979 with estimated breeding values of 92.0 (SD ± 3.7) for milk yield and
102.0 (SD ± 10.6) for fertility.
HMP cows
The HMP cows were sired by the three to four highest ranking proven sires (total 22
sires) for milk production from the most recent group of progeny tested Norwegian Red sires
each year. The estimated breeding values for the sires were 111.7 (SD ± 4.1) for milk yield
and 102.4 (SD ± 8.3) for fertility.
HI cows
The HI cows were sired by the progeny tested, top-ranked Norwegian Red bulls (elite
bulls), both before commencement of the study and until the end of study in 2001. The
estimated breeding values for the sires were 109.0 (SD ± 5.6) for milk yield and 102.9 (SD ±
6.9) for fertility.
Definitions of C-LA, Luteal Phase, Inter-ovulatory Interval, DOV, and PCL
C-LA
The interval from calving to C-LA (Papers II and III) was defined as the first day of
the two consecutive measurements of milk progesterone concentration � 3ng/mL (Royal et
al., 2000: Petersson et al., 2007) not earlier than 10 d after calving.
26
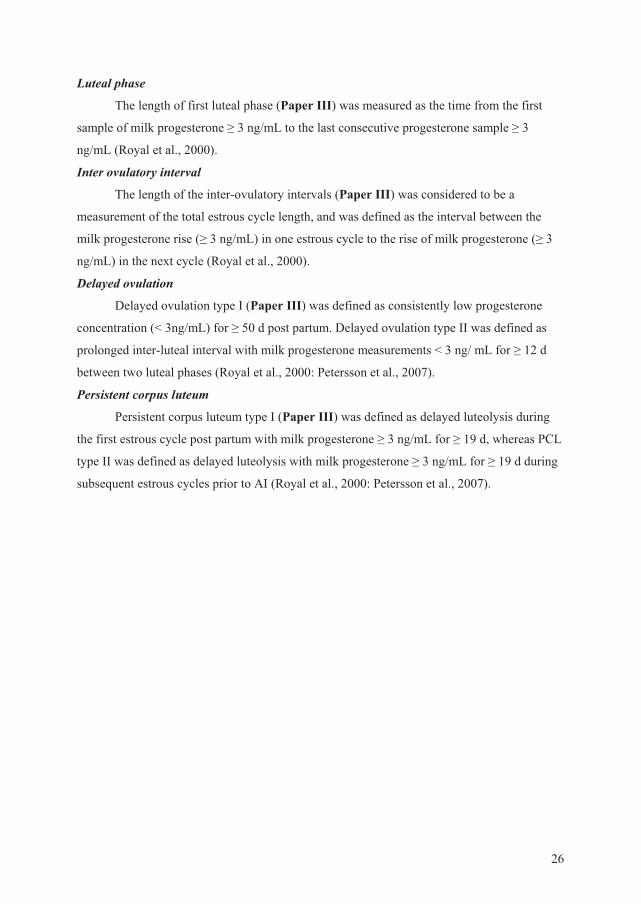
Luteal phase
The length of first luteal phase (Paper III) was measured as the time from the first
sample of milk progesterone � 3 ng/mL to the last consecutive progesterone sample � 3
ng/mL (Royal et al., 2000).
Inter ovulatory interval
The length of the inter-ovulatory intervals (Paper III) was considered to be a
measurement of the total estrous cycle length, and was defined as the interval between the
milk progesterone rise (� 3 ng/mL) in one estrous cycle to the rise of milk progesterone (� 3
ng/mL) in the next cycle (Royal et al., 2000).
Delayed ovulation
Delayed ovulation type I (Paper III) was defined as consistently low progesterone
concentration (< 3ng/mL) for � 50 d post partum. Delayed ovulation type II was defined as
prolonged inter-luteal interval with milk progesterone measurements < 3 ng/ mL for � 12 d
between two luteal phases (Royal et al., 2000: Petersson et al., 2007).
Persistent corpus luteum
Persistent corpus luteum type I (Paper III) was defined as delayed luteolysis during
the first estrous cycle post partum with milk progesterone � 3 ng/mL for � 19 d, whereas PCL
type II was defined as delayed luteolysis with milk progesterone � 3 ng/mL for � 19 d during
subsequent estrous cycles prior to AI (Royal et al., 2000: Petersson et al., 2007).
27
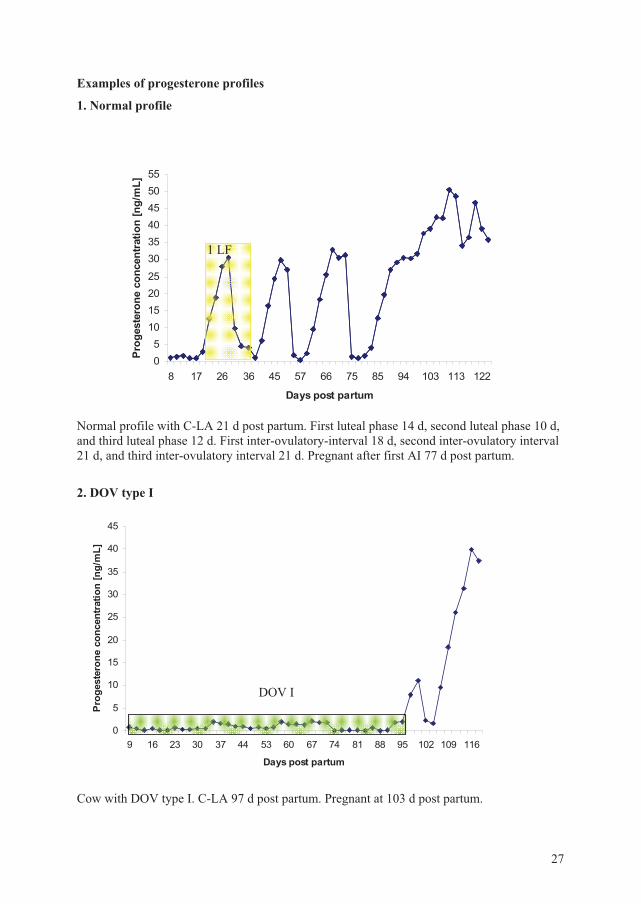
Examples of progesterone profiles
1. Normal profile
05
10152025
303540455055
8 17 26 36 45 57 66 75 85 94 103 113 122
Days post partum
Prog
este
rone
con
cent
ratio
n [n
g/m
L]
Normal profile with C-LA 21 d post partum. First luteal phase 14 d, second luteal phase 10 d, and third luteal phase 12 d. First inter-ovulatory-interval 18 d, second inter-ovulatory interval 21 d, and third inter-ovulatory interval 21 d. Pregnant after first AI 77 d post partum.
2. DOV type I
0
5
10
15
20
25
30
35
40
45
9 16 23 30 37 44 53 60 67 74 81 88 95 102 109 116
Days post partum
Prog
este
rone
con
cent
ratio
n [n
g/m
L]
Cow with DOV type I. C-LA 97 d post partum. Pregnant at 103 d post partum.
DOV I
1 LF
28
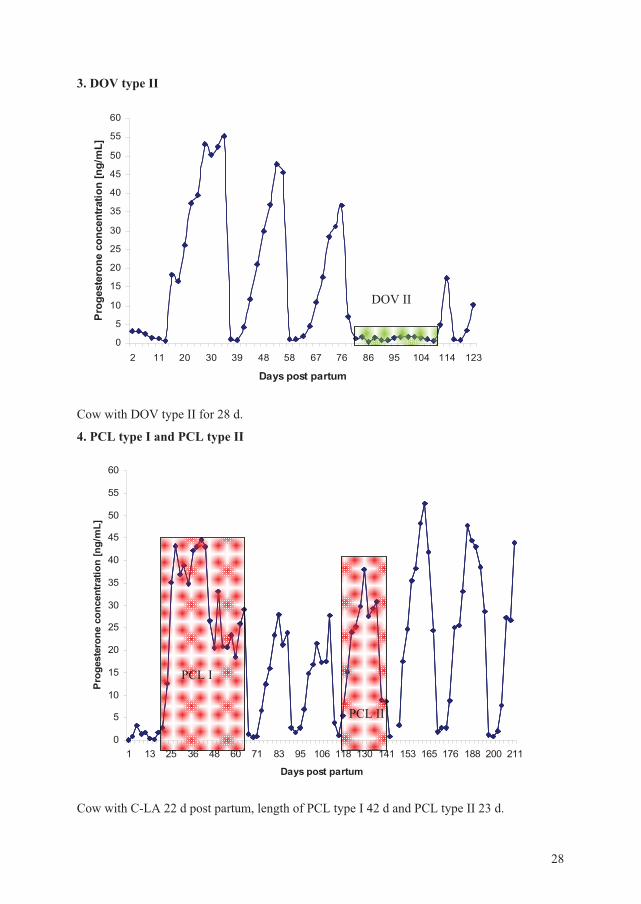
3. DOV type II
0
5
10
15
20
25
30
35
40
45
50
55
60
2 11 20 30 39 48 58 67 76 86 95 104 114 123
Days post partum
Pro
gest
eron
e co
ncen
tratio
n [n
g/m
L]
Cow with DOV type II for 28 d.
4. PCL type I and PCL type II
0
5
10
15
20
25
30
35
40
45
50
55
60
1 13 25 36 48 60 71 83 95 106 118 130 141 153 165 176 188 200 211
Days post partum
Pro
gest
eron
e co
ncen
trat
ion
[ng/
mL]
Cow with C-LA 22 d post partum, length of PCL type I 42 d and PCL type II 23 d.
DOV II
PCL I
PCL II

29
5. DOV type I and PCL type II
0
5
10
15
20
25
30
35
40
45
9 18 27 37 46 58 69 79 88 97 107 116 125
Days post partum
Pro
gest
eron
e co
ncen
trat
ion
[ng/
mL]
Cow with both DOV type I and PCL type I. The interval to C-LA was 107 d and the PCL type
I lasted for 21 d.
PCL II
DOV I
30
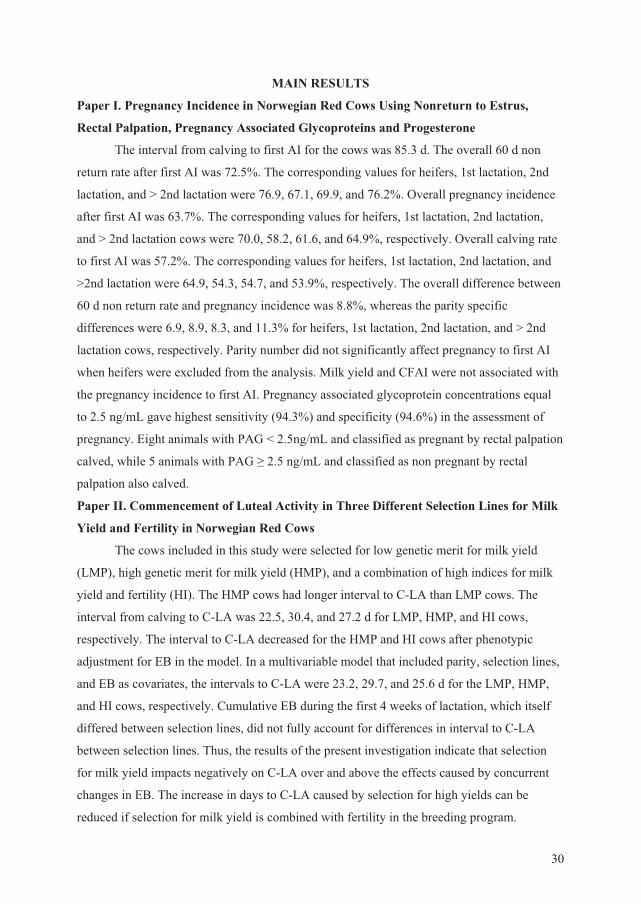
MAIN RESULTS
Paper I. Pregnancy Incidence in Norwegian Red Cows Using Nonreturn to Estrus,
Rectal Palpation, Pregnancy Associated Glycoproteins and Progesterone
The interval from calving to first AI for the cows was 85.3 d. The overall 60 d non
return rate after first AI was 72.5%. The corresponding values for heifers, 1st lactation, 2nd
lactation, and > 2nd lactation were 76.9, 67.1, 69.9, and 76.2%. Overall pregnancy incidence
after first AI was 63.7%. The corresponding values for heifers, 1st lactation, 2nd lactation,
and > 2nd lactation cows were 70.0, 58.2, 61.6, and 64.9%, respectively. Overall calving rate
to first AI was 57.2%. The corresponding values for heifers, 1st lactation, 2nd lactation, and
>2nd lactation were 64.9, 54.3, 54.7, and 53.9%, respectively. The overall difference between
60 d non return rate and pregnancy incidence was 8.8%, whereas the parity specific
differences were 6.9, 8.9, 8.3, and 11.3% for heifers, 1st lactation, 2nd lactation, and > 2nd
lactation cows, respectively. Parity number did not significantly affect pregnancy to first AI
when heifers were excluded from the analysis. Milk yield and CFAI were not associated with
the pregnancy incidence to first AI. Pregnancy associated glycoprotein concentrations equal
to 2.5 ng/mL gave highest sensitivity (94.3%) and specificity (94.6%) in the assessment of
pregnancy. Eight animals with PAG < 2.5ng/mL and classified as pregnant by rectal palpation
calved, while 5 animals with PAG � 2.5 ng/mL and classified as non pregnant by rectal
palpation also calved.
Paper II. Commencement of Luteal Activity in Three Different Selection Lines for Milk
Yield and Fertility in Norwegian Red Cows
The cows included in this study were selected for low genetic merit for milk yield
(LMP), high genetic merit for milk yield (HMP), and a combination of high indices for milk
yield and fertility (HI). The HMP cows had longer interval to C-LA than LMP cows. The
interval from calving to C-LA was 22.5, 30.4, and 27.2 d for LMP, HMP, and HI cows,
respectively. The interval to C-LA decreased for the HMP and HI cows after phenotypic
adjustment for EB in the model. In a multivariable model that included parity, selection lines,
and EB as covariates, the intervals to C-LA were 23.2, 29.7, and 25.6 d for the LMP, HMP,
and HI cows, respectively. Cumulative EB during the first 4 weeks of lactation, which itself
differed between selection lines, did not fully account for differences in interval to C-LA
between selection lines. Thus, the results of the present investigation indicate that selection
for milk yield impacts negatively on C-LA over and above the effects caused by concurrent
changes in EB. The increase in days to C-LA caused by selection for high yields can be
reduced if selection for milk yield is combined with fertility in the breeding program.
31
Paper III. Characterization of Progesterone Profiles in fall-calving Norwegian Red
Cows
Progesterone profiles in Norwegian Red cows were categorized, and associations
between the occurrence of irregularities in the profiles and C-LA were investigated. Delayed
ovulation type I was present in 14.7%, DOV type II in 2.8%, PCL type I in 6.7%, and PCL
type II in 3.3% of the profiles. The occurrence of DOV and PCL in Norwegian Red cows was
lower than reported in most other dairy populations. Onset of luteal activity was related to
milk yield, parity, and PCL. Cows experiencing a PCL had shorter interval to C-LA post
partum. The LS-mean for the interval to C-LA was 24.2 d when PCL type I and II were
present, and 29.5 d when PCL type I and II were absent. The likelihood of pregnancy to first
service was not affected in cows with a history of PCL when AI was carried out at
progesterone concentrations < 3 ng/ml (i.e. during estrus); however, cows that had
experienced PCL were more likely to be inseminated during a luteal phase. The frequency of
puerperal problems was low and the likelihood of PCL was not associated with disease
treatment before C-LA.
Paper IV: Reproductive Performance, Udder Health, and Antibiotic Resistance in
Mastitis Bacteria isolated from Norwegian Red in Conventional and Organic Farming.
Reproductive performance, udder health, and antibiotic resistance in udder pathogens
in conventional and organic farming were investigated. The interval from calving to first AI
was shorter in conventional cows (LS-means: 75.0 vs 77.7 d), whereas there was no
difference in the interval to last AI and calving interval between conventional and organic
cows. Natural mating was more common in organic farming. The conventional cows yielded
more and received more concentrates than organic cows during the whole lactation. There
were fewer > 2nd parity cows in conventional farming. The average annual forage:
concentrate ratio was 75:25 and 63:37 for organic and conventional herds, respectively.
Although adjusted for milk yield and parity, somatic cell count was lower in organic cows
than conventional cows. There were a higher proportion of dry quarters at the herd visit in
organic herds. There was no difference between conventional and organic cows in quarter
samples positive for mastitis bacteria from the herd visit. Milk yield and parity were
associated with the likelihood of at least one quarter positive for mastitis bacteria
(subclinically infected).
32
DISCUSSION
In Paper I, the pregnancy incidence, non return rate and calving rate in Norwegian
dairy cows were investigated. The results showed that the reproductive efficiency in
Norwegian Red cows is high compared with previous and comparable studies in dairy cattle
(Bleach et al., 2004; Andersson et al., 2006; Cairoli et al., 2006), and superior compared with
AI after induced estrus or timed AI (Lopez-Gatius et al., 2004; Dalton et al., 2005; Howard et
al., 2006). Even though the animals included in the study were not selected randomly, the
cows included in the study may be considered as representative for Norwegian Red cows.
This is supported by similar 60 d non return rates in the current study (71.8%) and the average
60 d non return rate in Norwegian Red cows for the same period (72.7%) (Refsdal, 2007). In
Paper I, 3.6% of the animals were culled due to low fertility � 290 d after first AI. In Paper
IV, the overall culling rate was slightly higher in conventional herds compared with organic
herds.
Differences in C-LA between selection lines
To our knowledge, the experiment in Paper II is the first to evaluate and compare C-
LA in cows selected for low milk yield, high milk yield, or the combination of high indices
for milk yield and fertility. In previous experiments (Westwood et al., 2000; Gutierrez et al.,
2006) and population studies (Royal et al., 2000) of differences in reproductive performance
between cows with high and low genetic merit for milk yield, contemporary sires with
breeding indices for high and low milk yield have been used. By managing the cows in a
single herd, phenotypic variation resulting from different management and feeding practices
was minimized. The estimated breeding value for fertility was similar for the sires used on the
HMP (102.4) and HI (102.9) cows (Paper II). However, after adjustment for the phenotypic
differences in EB, there was still a difference in days to C-LA of 6.5 and 2.4 d for the HMP
and HI cows, respectively, compared with the LMP cows. Hence, the reduction in
reproductive efficiency following selection for high milk yield must also be attributable to
other factors than negative EB because of high milk production.
It has been shown that cows with a high genetic merit for milk yield mobilize more
body tissue in early lactation than cows with average merit for milk yield on a genetic (Pryce
et al., 2001), and phenotypic level (Westwood et al., 2000; Pryce et al., 2001). The heritability
for body condition score (BCS) is high (0.38) (Veerkamp et al., 2001), and there is a strong
and negative genetic correlation between BCS and milk yield (Veerkamp et al., 2001; Wall et
al., 2003) which may lead to greater negative EB and reduction of fertility in cows selected

33
for high milk yield. Westwood et al. (2000) reported that mean BCS and pattern of BCS
changes differed between high and low yielding cows because high genetic merit cows
mobilized more body tissue in early lactation than cows with a lower production potential.
Fall et al. (2008) and Reksen et al. (2001) have previously reported that organic cows and
moderate yielding cows adjust milk production according to energy intake.
Previous phenotypic studies reported that cows with higher plasma concentrations of
IGF-1 had an increased likelihood of a shorter interval to C-LA, whereas plasma
concentrations of insulin, glucose, non-esterified fatty acids, and beta-hydroxybutyrate were
not associated with C-LA (Patton et al., 2007). Westwood et al. (2000) reported higher
concentrations of growth hormone in cows with high genetic merit for milk yield, whereas
Gutierrez et al. (2006) found higher concentrations of growth hormone and beta-
hydroxybutyrate, and lower concentrations of insulin, glucose, and IGF-1, in cows with high
genetic merit for milk yield. Hayhurst et al. (2007) reported that the amounts of free fatty
acids and glucose in male calves were moderately heritable and could be used to enhance
selection for improved female fertility. Calves that mobilized large amounts of free fatty acids
tended to have female offspring with reduced fertility. Thus, selection for milk yield could
lead to lower levels of IGF-1, more body tissue mobilized and hence higher level of free fatty
acids leading to reduced fertility such that the interval from calving to C-LA is increasing.
It should be emphasized that further research is necessary to investigate which factors
other than negative EB affect the phenotypic difference in days to C-LA between cows
selected for low or high milk production.
Milk yield, EB, and reproductive performance in Norwegian Red
The Norwegian Red is characterized as a moderate yielding breed with an average
305-days milk yield of 6,921 kg in 2008 (TINE Rådgiving, 2009). The genetic potential for
milk yield in the breed has probably not been fully exploited because of constraints on milk
production due to quota regulations and political framework present in Norway (Refsdal,
2007; Steine et. al., 2008). The lack of association between milk yield and the likelihood of
pregnancy (Paper I) could be because of moderate milk yield combined with selection for
fertility, health and functional traits in the breeding program.
The cows selected for high milk yield (Paper II) had a longer interval from calving to
C-LA than cows selected for low milk yield, whereas the interval to C-LA was intermediary
in cows selected for both yield and fertility. The present thesis also show that less selection
pressure for milk yield and more weight on fertility in a breeding program does not
34
necessarily reduce milk yield substantially, despite the fact that an increase in C-LA per unit
of predicted transmitting ability for milk yield is expected in high producing cows (Royal et
al., 2002). There was a strong association between C-LA and EB in the models with and
without selection lines included. The interval to C-LA was reduced for the HMP and HI cows
after adjustment for phenotypic differences in EB. This is in agreement with the unfavorable
genetic correlations between milk yield and fertility reported in previous studies both at a
phenotypic level (Gutierrez et al., 2006; Patton et al, 2007), and a genetic level (Veerkamp et
al., 2001; Royal et al., 2002; Pryce et al., 2004), because the degree of negative EB stems
from the milk yield in early lactation and hence influences the interval to C-LA.
The organic cows (Paper IV) were older, milked less, had lower SCC, and were fed
less concentrate than conventional cows during the whole lactation period. The CFAI interval
was shorter in conventionally managed cows, whereas there were no differences in calving
interval, days open, or CLAI between the management systems. Reksen et al., (1999b) found
lower milk yield and impaired reproductive performance, due to limited energy intake, in
Norwegian organic cows. At that time, the energy requirement provided by concentrate for
most organic herds was 20% because a maximum of 20% of the feed could be non organic in
origin and the production of organic grain was limited. Currently, 60% of the energy fed on a
daily basis in organic farming should be roughage (Mattilsynet, 2007). The average annual
forage: concentrate ratio was 75:25 in organic herds and 63:37 in conventional herds. Reksen
et al. (2001) reported that Norwegian Red cows were able to maintain ovarian activity by
decreasing milk yield when the forage to concentrate ratio was 75:25 or lower. Milk yield was
not associated with any of the fertility parameters investigated in the study. This could be
because organic cows decreased milk yield according to their energy intake and compensated
for the energy deficit post partum by reducing milk yield and minimizing the deleterious
effects of negative energy balance on reproductive performance (Paper IV). Hence, the
suggestions presented by Reksen et al. (1999b) that the level of concentrate fed should be
increased to ensure optimal feeding of the cows in accordance with their individual needs is
supported. The ability to reduce production in the current lactation without compromising
reproductive performance means that the breed is adaptable to extensive production systems
like organic farming.

35
Associations between C-LA and PCL
In Paper II, it was concluded that the increase in the interval from calving to C-LA by
selection for high milk yield can be reduced by inclusion of fertility traits in the breeding
program. Selection for shorter intervals to C-LA, which has a moderate heritability, may be a
feasible approach to improving fertility (Darwash et al., 1997b). However, despite obtaining a
shorter interval to C-LA by the inclusion of fertility as non return rate in the breeding
program, inclusion of C-LA as the only fertility trait may be unwise because of the increased
risk of a PCL rather than continuous cyclical activity after early C-LA (Opsomer et al., 2000;
Royal et al., 2002; Petersson et al., 2007).
The interval from calving to C-LA was associated with the occurrence of PCL (Paper
III) in the present study. Heritability for early C-LA is reported to be 0.16 to 0.21 (Darwash et
al., 1997b; Royal et al., 2002; Petersson et al., 2007). Breeding for increased fertility is based
on traditional fertility traits such as non return rate, calving interval, CFAI, and number of
inseminations per conception, which have heritabilities that range between 0.02 and 0.04
(Pryce et al., 1997; Wall et al., 2003; Jamrozik et al., 2005). The interval to C-LA was
approximately 5 d shorter in cows that subsequently experienced a PCL, which demonstrates
the importance of elucidating the potential negative side effects of breeding for early C-LA.
Cows and management factors related to PCL
The occurrence of PCL (Paper III) was generally low in the Norwegian Red
compared with studies performed with other dairy breeds (Opsomer et al., 1998; Royal et al.,
2000; Shrestha et al., 2004; Samarütel et al., 2008). Whether this is related to the inclusion of
female fertility in the breeding program since 1972 is unknown (Andersen-Ranberg et al.,
2005; Steine et al., 2008).
No associations could be found between the occurrences of PCL and milk yield,
concentrate allocation, parity, year of trial, or disease before C-LA or DOV (Paper III).
Windig et al. (2008) could not find an association between prolonged luteal activity and milk
production. Whereas Pollott and Coffey (2008) reported a higher than expected number of
PCL type II in cows fed high levels of concentrate, while genetic line did not affect the
occurrence of PCL type I or type II. Opsomer et al. (2000) reported parity to be a risk factor
for prolonged luteal phases, and the most important risks for delayed luteolysis were early C-
LA, occurrence of metritis, retained placenta, calving problems, and abnormal vaginal
discharge. Petersson et al. (2006) also reported endometritis to be a risk factor for PCL. The
low occurrence of PCL (Paper III) may partly be explained by the very low number of
36
puerperal problems in the study population. The incidence rates per 100 cow-years in 2005
were 1.2, 3.1, 0.2, and 0.9 for dystocia, retained placenta, abortion, and metritis/endometritis,
vaginitis and salphangitis, respectively (Østerås et al., 2007). The incidence rates per 100
dairy cow years treated for reproductive disorders were 1.71, 0.59, 1.12, 1.01, and 0.20 for
anestrus, estrus synchronization, cystic ovaries, silent estrus, and silent repeated breeding,
respectively (Østerås et al., 2007).
Occurrence of PCL and pregnancy rate
A previous episode of PCL (Paper III) was not associated with the likelihood of
pregnancy to first AI in cows that were inseminated while having low progesterone levels.
The latter contrasts with both Royal et al. (2000) who reported PCL to be associated with a
decrease in pregnancy to first AI, and Shrestha et al. (2004) who reported lower pregnancy
rate within 100 DIM. Cows in our study that experienced a PCL were more likely to be
inseminated during the luteal phase, which may explain the results obtained in previous
studies of associations between pregnancy rate and PCL by Royal et al. (2000) and Shrestha
et al. (2004).
In the field study in Paper I, AI during the luteal phase was performed in 4.9% of the
cows, which supports Andresen and Onstad (1979) and Grimard et al. (2006) who reported
4.4% and 5.0% AI in the luteal phase, respectively. Cairoli et al. (2006) found that 10.2% of
the cows showing spontaneous estrus were inseminated at high progesterone concentrations.
In Paper III, first AI was performed during the luteal phase in 12.4% of the lactations. Thus,
the likelihood of AI during the luteal phase was higher in the population studied for Paper III
than in the general population. This may also, at least partly, explain why the occurrence of a
PCL was associated with the likelihood of AI during the luteal phase.
Selection traits for fertility included in breeding programs
Petersson et al. (2007) suggested using C-LA instead of CFAI in the selection index
because there is only a delay of 4 to 5 d between C-LA and first ovulation post partum, and
both factors are determined by individual physiology whereas CFAI interval is affected by
management factors. As reported in Paper III, cows experiencing a PCL had shorter interval
to C-LA. So far the trait for fertility selection in Norwegian Red has been non return rate.
From 2009, CFAI will also be included in the selection index (Geno, 2009d). The CFAI
interval has increased in Norwegian Red which could be due to longer voluntary waiting
periods, but also may be the result of changes in estrus detection routines (Refsdal, 2007). The
37
CFAI in Paper I was longer than reported by Royal et al. (2000), but shorter than reported by
Norman et al. (2009) in US Holsteins of 92 d in 1996, decreasing to 85 d in 2007.
C-LA and other endocrine fertility traits, e.g. length of first luteal phase or occurrence
of PCL, in the selection index may have higher heritabilities than traditional fertility traits, but
selection for these traits would exclude ordinary dairy herds from the breeding program. The
breeding work in the Norwegian Red has so far been based on data reported to NDHRS from
ordinary herds. Data for the recording of endocrine fertility traits have been based on
progesterone measurement which would be extremely difficult to collect from ordinary herds.
Hence, the sustainability of the breed may be reduced, because herds selected for inclusion in
the breeding program could be biased and not representative of the population as a whole.
Furthermore, the risk of inbreeding may increase because effective breeding population size
would be reduced.
The use of non return rate as an indication of pregnancy overestimates pregnancy
incidence. In Paper I the difference between 60 d non return rate and pregnancy incidence
was 6.9% for virgin heifers and 11.3% for > 2nd lactation cows. Hence, the non return rate
was subjected to more bias in older cows than in heifers. It is important to be aware of this
difference when future breeding indices are based on non return rate of both heifers and older
cows. A likely explanation of this bias is that older cows are more likely to be culled if non
pregnant after first AI. However, culling of older cows (> 2nd parity) before 60 d after first AI
was not an important reason for lower pregnancy incidence in Paper I. Only seven animals
were culled prior to 60 d after first AI, and four of these animals were older cows.
The proportion of pregnant animals may vary with number of days from AI to
pregnancy examination; this could be due both to the accuracy of pregnancy examination and
to fetal mortality. In Norway, the calculation of non return rate after first AI includes all AI
performed in heifers and cows. Reksen et al. (1999a) reported that approximately 50% of
Norwegian Red cows were pregnancy diagnosed, and that cows presented for pregnancy
diagnosis were less likely to be pregnant than herd mates. Thus, if pregnancy diagnosis is
used as a fertility measure in the calculation of the breeding index, care must be taken to
avoid selection bias (Dohoo et al., 2003). In the future, pregnancy incidence in Norwegian
Red cows may be approximated from the parity specific differences between non return rate
and pregnancy incidence (Paper I).

38
The occurrence of DOV
Delayed ovulation type I was present in 14.7% of the profiles in Paper III, which is
lower than in some previous studies of Holstein cows and Swedish Red and Whites (Opsomer
et al., 1998; Petersson et al., 2006; Samarütel et al., 2008) and higher than reported by Shresta
et al. (2004) and Royal et al. (2000). The incidence of 2.8% for DOV type II agrees with
previous studies in Holstein cows (Opsomer et al., 1998; Shrestha et al., 2004; Samarütel et
al., 2008), but the incidence is lower than reported by Royal et al. (2000) and Petersson et al.
(2006).
Season of AI
A previous study showed good reproductive efficiency in spring calving organic cows
whereas calving during the fall resulted in impaired reproductive performance (Reksen et al.,
1999b). In Paper IV, there was no difference between season of AI and the two types of
farming. First AI was performed during the summer season (April-September) in 58.4% of
conventional and 56.3% of the organic farms, which contrasts with the findings of Reksen et
al. (1999b) where 52% of the organic cows and 36% of the conventional cows were bred
during summer. Season was not associated with interval to first AI or last AI in the models.
In Paper I, season for AI was almost significantly associated with pregnancy rate in cows. If
more animals had been included in the study, we would probably have predicted a significant
association between season and pregnancy rate. An earlier study found lower calving rate for
cows inseminated during December to March, compared with cows inseminated during the
rest of the year (Haugan et al., 2005).
Threshold values for progesterone level
Different threshold values for progesterone have been used both to indicate onset of
estrus and to assess onset of luteal activity. Darwash et al. (1997a), Royal et al. (2000), and
Petersson et al. (2007) defined C-LA as the occurrence of two or more consecutive milk
progesterone concentrations � 3ng/mL in whole milk. Shresta et al. (2004) defined C-LA as
two consecutive skimmed milk samples � 1ng/mL, Samarütel et al. (2008) defined C-LA as
the first day with progesterone concentration � 5ng/mL in pooled quarter milk samples, and
Opsomer et al. (1998; 2000) defined C-LA as first rise in milk progesterone � 15 ng/mL in
milk fat. Opsomer et al. (1998; 2000) and Shresta et al. (2004) collected milk twice weekly,
whereas Darwash et al. (1997a), Royal et al. (2000), Petersson et al. (2007) and Samartüel et
al. (2008) collected milk thrice weekly. In Paper III, milk for progesterone analysis was

39
collected twice weekly in 25.2% (127/502) of the profiles, and thrice weekly in the remaining
lactations.
The procedure for analyses of progesterone content in whole milk, described by
Waldmann et al. (1993; 1999), was used during a period of 14 years (Papers I, II, and III).
The milk samples were obtained in a representative sample during the milking in the
experiments conducted at the Norwegian University of Life Sciences (Papers II and III) and
by the farmer or veterinarian/AI technicians in the field study conducted in Paper I. The
progesterone concentration can vary with fat content in the milk and the concentration is
highest in residual milk because of higher fat level. Hence, in Paper I the progesterone
content in milk could increase artificially if residual milk was collected from the cow, which
could explain why the lowest progesterone level in pregnant cows was 7 ng/mL.
Pregnancy diagnosis by rectal palpation and PAG
Pregnancy associated glycoprotein concentrations equal to 2.5 ng/mL (six weeks after
AI) gave the greatest sensitivity (94.3%) and specificity (94.6%) in the assessment of
pregnancy (Paper I). Sampling for PAG and rectal palpation for pregnancy were both
conducted at the same time, and should express pregnancy or non pregnancy independently of
each other. The use of rectal palpation for pregnancy diagnosis is valuable, provided that the
veterinarians possess the necessary diagnostic skills.

40
CONCLUSIONS
1) A pregnancy incidence of 63.7% and a calving rate of 57.2% must be regarded as
representing a high reproductive efficiency in Norwegian Red cows. For further
estimation of pregnancy incidence from non return rate it is important to be aware of
differences in non return rate and pregnancy incidence between heifers and older
cows. This difference should also be considered when the non return rate in cows is
used for the calculation of breeding indices.
2) Lactation number did not affect pregnancy incidence when heifers were excluded from
the analysis, but heifers had a higher pregnancy incidence than cows. The interval to
first AI was not associated with pregnancy incidence in the current study, possibly due
to a relatively long voluntary waiting period. Milk yield was also not associated with
the pregnancy incidence.
3) A PAG value of 2.5 ng/mL in plasma six weeks after AI optimized the sensitivity
(94.3%) and specificity (94.6%) in the assessment of pregnancy.
4) The cows selected for low milk yield (LMP) had a shorter interval to C-LA and had
lower milk yield than the cows selected for high milk yield (HMP) and cows selected
for high milk yield and fertility (HI). The interval to C-LA for the HMP and HI cows
decreased after adjustment for EB. The EB, which itself differed between selection
lines, did not explain the whole difference in the interval to C-LA between the
selection lines. Selection for milk yield negatively affects C-LA over and above the
effects caused by changes in EB. The increase in days to C-LA caused by selection for
high milk yield can be reduced if selection for milk yield is combined with fertility in
the breeding program.
5) The occurrence of DOV and PCL in Norwegian Red cows was generally low
compared with most other dairy populations.
6) Cows experiencing a PCL had shorter interval to C-LA. The occurrence of PCL did
not affect the pregnancy to first AI when AI was performed at low progesterone
concentrations, but cows with a PCL were more likely to be inseminated during the
luteal phase. The likelihood of AI during the luteal phase was higher in the study
41
population than in the general population of Norwegian Red. This may, at least partly,
explain why the occurrence of persistent corpus luteum was associated with the
likelihood of AI during the luteal phase.
7) The interval to first AI was shorter in conventionally, as opposed to organically
managed, cows, whereas there were no differences in the interval to last AI and
calving interval between the two management systems. The cows were older in
organic farming. Conventional cows yielded more, had higher SCC, and received
more concentrates than organic cows. Higher level of concentrate fed to organic cows
in recent years is probably an important factor for the higher reproductive efficiency
than ten years ago.
The studies showed that the reproductive performance in Norwegian Red cows is relatively
high. Inclusion of fertility in the breeding program is probably an important reason for such
high fertility. The Norwegian Red is a sustainable breed that adapts well to both intensive and
more extensive production systems like organic production.

42
BIBLIOGRAPHY
Andersen-Ranberg, I. M., G. Klemetsdal, B. Heringstad, and T. Steine. 2005. Heritabilities,
genetic correlations, and genetic change for female fertility and protein yield in
Norwegian dairy cattle. J. Dairy Sci. 88:348-355.
Andersson, M., J. Taponen, M. Kommeri, and M. Dahlbom. 2006. Pregnancy rates in
lactating Holstein-Friesian cows after artificial insemination with sexed sperm.
Reprod. Domest. Anim. 41:95-97.
Andresen, Ø. and O. Onstad. 1979. Brunstkontroll og drektighetskontroll hos ku ved hjelp av
progesteronbestemmelse i melk (Estrus detection and pregnancy testing in the cow
using the milk progesterone test). Nor. Vet. Tidsskr. 91:411-421.
Bleach, E.C.L.B., R.G. Glencross, and P.G. Knight. 2004. Association between ovarian
follicle development and pregnancy rates in dairy cows undergoing spontaneous
oestrous cycles. Reproduction 127:621-629.
Britt, J. H. 1992. Influence of nutrition and weight loss on reproduction and early embryonic
death in cattle. In: Proceedings of the XVII World Buiatrics Congress, p 143-149.
Butler, W. R. and R. D. Smith. 1989. Interrelationships between energy balance and
postpartum reproductive function in dairy cattle. J. Dairy Sci. 72:767-783.
Butler, W.R. 1998. Effect of protein nutrition on ovarian and uterine physiology in dairy
cattle. J. Dairy Sci. 81:2533-2539.
Butler, W. R. 2003. Energy balance relationships with follicular development, ovulation and
fertility in postpartum dairy cows. Livest. Prod. Sci. 83:211-218.
Cairoli, F., A. Mollo, M. C. Veronesi, B. Renaville, M. Faustini, and M. Battocchio. 2006.
Comparison between cloprostenol-induced and spontaneous oestrus fertility in dairy
cows. Reprod. Dom. Anim. 41:175-179.
Call, E.P and J.S. Stevenson. 1985. Dairy cattle reproductive management. J. Dariy Sci.
68:2799-2805.
43
Chagas, L. M., J. J. Bass, D. Blache, C. R. Burke, J. K. Kay, D. R. Lindsay, M. C. Lucy, G. B.
Martin, S. Meier, F. M. Rhodes, J. R. Roche, W. W. Thatcher, and R. Webb. 2007.
Invited Review: New perspectives on the roles of nutrition and metabolic priorities in
the subfertility of high - producing dairy cows. J. Dairy Sci. 90:4022-4032.
Corah, L. R., A. P. Quaely, T. G. Dunn, and C. C. Kaltenba. 1974. Prepartum and postpartum
levels of progesterone and estradiol in beef heifers fed two levels of energy. J. Anim.
Sci. 39: 380-385.
Dalton, J. C., R. Manzo, A. Ahmadzadeh, B. Shafii, W. J. Price, and J. M. DeJarnette. 2005.
Short Communication: Conception rates following detection of estrus and timed AI in
dairy cows synchronized using GnRH and PGF2�. J. Dairy Sci. 88:4313-4316.
Darwash, A. O., G. E. Lamming, and J. A. Woolliams. 1997a. The phenotypic association
between the interval to past-partum ovulation and traditional measures of fertility in
dairy cattle. Anim. Sci. 65:9-16.
Darwash, A. O., G. E. Lamming, and J. A. Woolliams. 1997b. Estimation of genetic variation
in the interval from calving to postpartum ovulation of dairy cows. J. Dairy Sci.
80:1227-1234.
Dohoo, I.R., W. Martin, and H. Stryhn. 2003. Veterinary epidemiologic research.
Transcontinental, Charlottetown.
Ekern, A. 1991. Nytt system for energivurdering av fôr til drøvtyggere. (A new system of
energy evaluation of food for ruminants). Norsk Landbruksforskning. 5:273-277.
Fall, N., Y. T. Grohn, K. Forslund, B. Essen-Gustafsson, R. Niskanen, and U. Emanuelson.
2008. An observational study on early-lactation metabolic profiles in Swedish
organically and conventionally managed dairy cows. J. Dairy Sci. 91:3983-3992.
FAO and WHO. 2008. Codex Alimentarius Guidelines for Organic Food. Guidelines for the
production, processing, labeling, and marketing of organically produced foods.
http://www.codexalimentarius.net/download/standards/360/CXG_032e.pdf
Accessed August, 18, 2009.
44
Fonseca, F.A., J. H. Britt, B. T. McDaniel, J. C. Wilk, and A. H. Rakes. 1983. Reproductive
traits of Holsteins and Jerseys. Effects of age, milk yield, and clinical abnormalities on
involution of cervix and uterus, ovulation, estrous cycles, detection of estrus,
conception rate, and days open. J. Dairy Sci. 66:1128-1147.
Geno. 2009a. http://www.geno.no/NRF/. Accessed August 30, 2009 (In Norwegian).
Geno. 2009b. Statistikk 08. Geno, Hamar, Norway (In Norwegian).
Geno. 2009c. http://www.geno.no/NRF/Avl/Avlstiltakene/
Accessed August 30, 2009 (In Norwegian).
Geno. 2009d. Årsmelding 2008. Geno, Hamar, Norway (In Norwegian).
Grimard, B., S. Freret, A. Chevallier, A. Pinto, C. Ponsart, and P. Humblot. 2006. Genetic and
environmental factors influencing first service conception rate and late
embryonic/foetal mortality in low fertility dairy herds. Anim. Reprod. Sci. 91:31-44.
Gröhn, Y. T. and P. J. Rajala-Schultz. 2000. Epidemiology of reproductive performance in
dairy cows. Anim. Reprod. Sci. 60-61:605-614.
Gutierrez, C. G., J. G. Gong, T. A. Bramley, and R. Webb. 2006. Selection on predicted
breeding value for milk production delays ovulation independently of changes in
follicular development, milk production and body weight. Anim. Reprod. Sci. 95:193-
205.
Hardeng, F. and V. L. Edge. 2001. Mastitis, ketosis, and milk fever in 31 organic and 93
conventional Norwegian dairy herds. J. Dairy Sci. 84:2673-2679.
Haugan, T., O. Reksen, Y. T. Gröhn, E. Kommisrud, E. Ropstad, and E. Sehested. 2005.
Seasonal effects of semen collection and artificial insemination on dairy cow
conception. Anim. Reprod. Sci. 90:57-71.
Haugejorden, G., S. Waage, E. Dahl, K. Karlberg, J. F. Beckers, and E. Ropstad. 2006.
Pregnancy associated glycoproteins (PAG) in postpartum cows, ewes, goats and their
offspring. Theriogenology 66:1976-1984.
45
Hayhurst, C., M. K. Sørensen, M. D. Royal, and P. Løvendahl. 2007. Metabolic regulation in
Danish bull calves and the relationship to the fertility of their female offspring. J.
Dairy Sci. 90:3909-3916.
Heringstad, B., G. Klemetsdal, and T. Steine. 2003. Selection responses for clinical mastitis
and protein yield in two Norwegian dairy cattle selection experiments. J. Dairy Sci.
86:2990-2999.
Heringstad, B., I. M. Andersen-Ranberg, Y. M. Chang, and D. Gianola. 2006. Short
Communication: Genetic analysis of nonreturn rate and mastitis in first-lactation
Norwegian Red cows. J. Dairy Sci. 89:4420-4423.
Heringstad, B., G. Klemetsdal, and T. Steine. 2007. Selection responses for disease resistance
in two selection experiments with Norwegian Red cows. J. Dairy Sci. 90:2419-2426.
Heringstad, B., E. Sehested, and T. Steine. 2008. Short communication: Correlated selection
responses in somatic cell count form selection against clinical mastitis. J. Dairy Sci.
91:4437-4439.
Howard, J. M., R. Manzo, J. C. Dalton, F. Frago, and A. Ahmadzadeh. 2006. Conception
rates and serum progesterone concentration in dairy cattle administered gonadotropin
releasing hormone 5 days after artificial insemination. Anim. Reprod. Sci. 95:224-233.
International Dairy Federation. 1981. Laboratory methods for use in mastitis work. IDF Bull.
132 Int. Dairy Fed., Brussels.
International Dairy Federation. 1987. Bovine Mastitis. Definitions and guidelines for
diagnosis. IDF Bull. 211 Int. Dairy Fed., Brussels.
Jamrozik, J., J. Fatehi, G. J. Kistemaker, and L. R. Schaeffer. 2005. Estimates of genetic
parameters for Canadian Holstein female reproduction traits. J. Dairy Sci. 88:2199-
2208.
Lopez-Gatius, F. K. Murugavel, P. Santolaria, M. Lopez-Bejar, and J. L. Yaniz. 2004.
Pregnancy rate after timed artificial insemination in early post-partum dairy cows after
ovsynch or specific synchronization Protocols. J. Vet. Med. A Physiol. Pathol. Clin.
Med. 51:33-38.

46
Louca, A and J. E. Legates. 1968. Production losses in dairy cattle due to days open. J. Dairy.
Sci. 51:573-583.
Lucy, M. C. 2001. Reproductive loss in high-producing dairy cattle: where will it end? J.
Dairy Sci. 84:1277-1293.
Mann, G. E and G. E. Lamming. 1999. The influence of progesterone during early pregnancy
in cattle. Reprod. Dom. Anim. 34:269-274.
Miglior, F., B. L. Muir, and B. J. Muir, and J. Van Doormal. 2005. Selection indices in
Holstein cattle of various countries. J. Dairy Sci. 88:1255-1263.
Mattilsynet. 2007. Veileder til forskrift om økologisk produksjon og marking av økologiske
landbruksprodukter og næringsmidler, av oktober 2005. nr 1103.
http://www.mattilsynet.no/regelverk/veiledere/okologisk/veiledere_til_forskrift_om__
kologisk_produksjon_og_merking_av_landbruksprodukter_og_n_ringsmidler_28156
Accessed August 30, 2009 (In Norwegian).
Norman, H. D., J. R. Wright, S. M. Hubbard, R. H. Miller, and J. L. Hutchison. 2009.
Reproductive status of Holstein and Jersey cows in the United States. J. Dairy Sci.
92:3517-3528.
Opsomer, G., M. Coryn, H. Deluyker, and de Kruif A. 1998. An analysis of ovarian
dysfunction in high yielding dairy cows after calving based on progesterone profiles.
Reprod. Dom. Anim. 33:193-204.
Opsomer, G., Y. T. Grohn, J. Hertl, M. Coryn, H. Deluyker, and A. de Kruif. 2000. Risk
factors for post partum ovarian dysfunction in high producing dairy cows in Belgium:
A field study. Theriogenology. 53:841-857.
Østerås, O., H. Solbu, A. O. Refsdal, T. Roalkvam, O. Filseth, and A. Minsaas. 2007. Results
and evaluation of thirty years of health recordings in the Norwegian dairy cattle
population. J. Dairy Sci. 90:4483-4497.
Patton, J., D. A. Kenny, S. McNamara, J. F. Mee, F. P. O'Mara, M. G. Diskin, and J. J.
Murphy. 2007. Relationships among milk production, energy balance, plasma
analytes, and reproduction in Holstein-Friesian cows. J. Dairy Sci. 90:649-658.
47
Petersson, K. J., H. Gustafsson, E. Strandberg, and B. Berglund. 2006. Atypical progesterone
profiles and fertility in Swedish dairy cows. J. Dairy Sci. 89:2529-2538.
Petersson, K. J., B. Berglund, E. Strandberg, H. Gustafsson, A. P. F. Flint, J. A. Woolliams,
and M. D. Royal. 2007. Genetic analysis of postpartum measures of luteal activity in
dairy cows. J. Dairy Sci. 90:427-434.
Philipsson, J. and B. Lindhé. 2003. Experiences of including reproduction and health traits in
Scandinavian dairy cattle breeding programmes. Livest. Prod. Sci. 83:99-112.
Pollott, G. E. and M. P. Coffey. 2008. The effect of genetic merit and production system on
dairy cow fertility, measured using progesterone profiles and on-farm recording. J.
Dairy Sci. 91:3649-3660.
Pryce, J. E, R. F.Veerkamp, R. Thompson, W. G. Hill, and G. Simm. 1997. Genetic aspects of
common health disorders and measures of fertility in Holstein Friesian dairy cattle.
Anim. Sci. 65:353-360.
Pryce, J. E., M. P. Coffey, and G. Simm. 2001. The relationship between body condition
score and reproductive performance. J. Dairy Sci: 1508-1515.
Pryce, J. E., M. D. Royal, P. C. Garnsworthy, and I. L. Mao. 2004. Fertility in the high-
producing dairy cow. Livest. Prod. Sci. 86:125-135.
Refsdal, A. 2007. Reproductive performance of Norwegian cattle from 1985 to 2005: trends
and seasonality. Acta Vet. Scand. 49:5.
Reksen, O., A. Tverdal, J. R. Lang-Ree, E. Glattre, and E. Ropstad. 1999a. Reproduction
management of tethered cows on Norwegian dairy farms. Anim. Reprod. Sci. 57:141 -
151.
Reksen, O., A. Tverdal, and E. Ropstad. 1999b. A comparative study of reproductive
performance in organic and conventional dairy husbandry. J. Dairy Sci. 82:2605-2610.
Reksen, O., Y. T. Gröhn, O. S. Havrevoll, T. Bolstad, A. Waldmann, and E. Ropstad. 2001.
Influence of concentrate allocation and energy balance on postpartum ovarian activity
in Norwegian cattle. J. Dairy Sci. 84:1060-1068.

48
Reksen, O., L. Sølverød, and O. Østerås. 2007. Relationships between milk culture results and
milk yield in Norwegian dairy cattle. J. Dairy Sci. 90:4670-4678.
Reksen, O., L. Sølverød, and O. Østerås. 2008. Relationships between milk culture results and
composite milk somatic cell counts in Norwegian dairy cattle. J. Dairy Sci. 91:3102-
3113.
Royal, M. D., A. O. Darwash, A. P. F. Flint, R. Webb, J. A. Woolliams, and G. E. Lamming.
2000. Declining fertility in dairy cattle: changes in traditional and endocrine
parameters of fertility. Anim. Sci. 70:487-501.
Royal, M. D., A. P. F. Flint, and J. A. Woolliams. 2002. Genetic and phenotypic relationships
among endocrine and traditional fertility traits and production traits in Holstein-
Friesian dairy cows. J. Dairy Sci. 85:958-967.
Samarütel, J., K. Ling, A. Waldmann, H. Jaakson, T. Kaart, and A. Leesmäe. 2008. Field trial
on progesterone cycles, metabolic profiles, body condition score and their relation to
fertility in Estonian Holstein dairy cows. Reprod. Dom. Anim. 43:457-463.
Senger, P. L. 2003. Pathways to pregnancy and parturition. 2nd ed. Current Conceptions
Pullman, WA.
Shrestha, H. K., T. Nakao, T. Suzuki, T. Higaki, and M. Akita. 2004. Effects of abnormal
ovarian cycles during pre-service period postpartum on subsequent reproductive
performance of high-producing Holstein cows. Theriogenology 61:1559-1571.
Staples, C. R., W. W. Thatcher, and J. H. Clark. 1990. Relationship between ovarian activity
and energy status during the early postpartum period of high producing dairy cows. J.
Dairy Sci. 73:938-947.
Steine, G., D. Kristofersson, and A. G. Guttormsen. 2008. Economic evaluation of the
breeding goal for Norwegian Red dairy cattle. J. Dairy Sci. 91:418-426.
Stevenson, J. H. and J. H. Britt. 1979. Relationships among luteinizing hormone, estradiol,
progesterone, glucocorticoids, milk yield, body weight and postpartum ovarian
activity in Holstein cows. J. Anim. Sci. 48:570-577.
49
Thatcher, W. W. and C. J. Wilcox. 1973. Postpartum estrus as an indicator of reproductive
status in the dairy cow. J. Dairy Sci. 56:608-610.
Thatcher, W. W., T. R. Bilby, J. A. Bartolome, F. Silvestre, C. R. Staples, and J. E. P. Santos.
2006. Strategies for improving fertility in the modern dairy cow. Theriogenology
65:30-44.
TINE Rådgiving. 2009. Statistikksamling 2008. TINE, Ås, Norway (In Norwegian).
Valle, P. S, G. Lien, O. Flaten, M. Koesling, and M. Ebbesvik. 2007. Herd health and health
management in organic versus conventional dairy herds in Norway. Livest. Sci.
112:123-132.
Van Der Honing, Y. and G. Alderman. 1988. Feed evaluation systems and requirements. 2.
Ruminants. Livest. Prod. Sci. 19:217-278.
VanRaden, P. M. 2004. Selection on net merit to improve lifetime profit. J Dairy. Sci.
87:3125-3131.
Veerkamp, R. F., E. P. C. Koenen, G. De Jong. 2001. Genetic correlations among body
condition score, yield, and fertility in first-parity cows estimated by random regression
models. J. Dairy Sci. 84:2327-2335.
Villa-Godoy, A., T. L. Hughes, R. S. Emery, L. T. Chapin, and R. L. Fogwell. 1987.
Association between energy balance and luteal function in lactating dairy cows. J.
Dairy Sci. 71:1063-1072.
Waldmann, A. 1993. Enzyme immunoassay (EIA) for milk progesterone using a monoclonal
antibody. Anim. Reprod. Sci. 34:19-30.
Waldmann, A. 1999. Monoclonal antibodies to progesterone: characterization and selection
for enzyme immunoassay in bovine milk. Hybridoma 18:289 - 296.
Wall, E., S. Brotherstone, J. A. Woolliams, G. Banos, and M. P. Coffey. 2003. Genetic
evaluation of fertility using direct and correlated traits. J. Dairy Sci. 86:4093-4102.
Wathes, D.C and Lamming, G.E. 1995. The oxytocin receptor, luteolysis and the maintenance
of pregnancy. J. Reprod. Fertil. Suppl. 49:53-67.

50
Webb, R., B.K Campell, H.A Garverick, J.G Gong, C.G Gutierrez, and D.G Armstrong. 1999.
Molecular mechanisms regulating follicular recruitment and selection. J.
Reprod. Fertil. Suppl. 53:33-48.
Westwood, C. T., I. J. Lean, J. K. Garvin, and P. C. Wynn. 2000. Effects of genetic merit and
varying dietary protein degradability on lactating dairy cows. J. Dairy Sci. 83:2926-
2940.
Windig, J. J., B. Beerda, and R. F. Veerkamp. 2008. Relationship between milk progesterone
profiles and genetic merit for milk production, milking frequency, and feeding
regimen in dairy cattle. J. Dairy Sci. 91:2874-2884.
Wood, P. D. P. 1967. Algebraic model of the lactation curve in cattle. Nature. 216:164-165.
Xie S., J.Green, J.B. Bixby, B. Szafranska, J.C. DeMartini, S. Hecht, and RM Roberts. 1997.
The diversity and evolutionary relationships of the pregnancy-associated
glycoproteins, an aspartic proteinase subfamily consisting of many trophoblast-
expressed genes. Proc. Natl. Acad. Sci. USA. 94:12809-12816.
Zoli, A. P., L. A. Guilbault, P. Delahaut, W. B. Ortiz, and J. F. Beckers. 1992.
Radioimmunoassay of a bovine pregnancy-associated glycoprotein in serum: Its
application for pregnancy diagnosis. Biol. Reprod. 46:83-92.

I

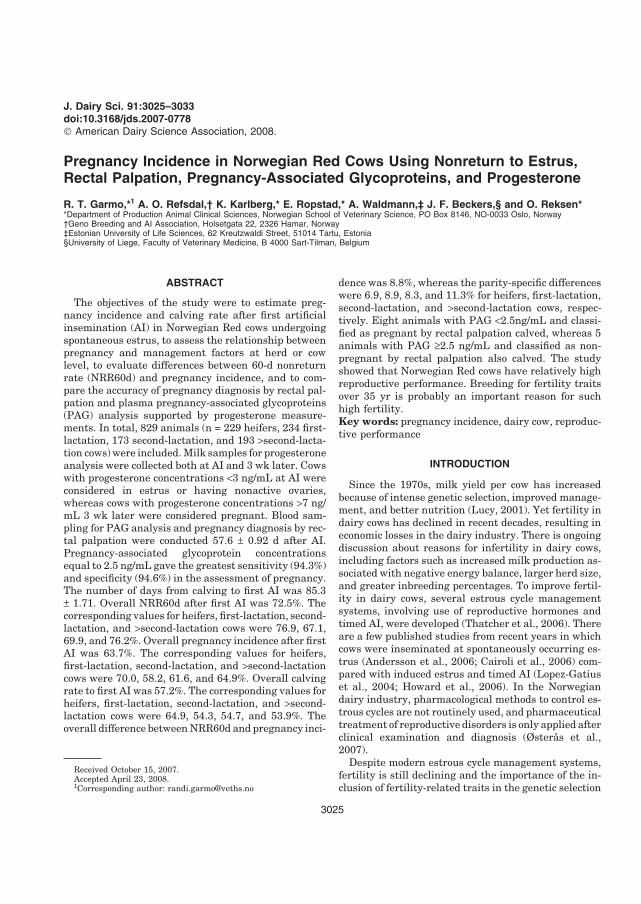
J. Dairy Sci. 91:3025–3033doi:10.3168/jds.2007-0778© American Dairy Science Association, 2008.
Pregnancy Incidence in Norwegian Red Cows Using Nonreturn to Estrus,Rectal Palpation, Pregnancy-Associated Glycoproteins, and Progesterone
R. T. Garmo,*1 A. O. Refsdal,† K. Karlberg,* E. Ropstad,* A. Waldmann,‡ J. F. Beckers,§ and O. Reksen**Department of Production Animal Clinical Sciences, Norwegian School of Veterinary Science, PO Box 8146, NO-0033 Oslo, Norway†Geno Breeding and AI Association, Holsetgata 22, 2326 Hamar, Norway‡Estonian University of Life Sciences, 62 Kreutzwaldi Street, 51014 Tartu, Estonia§University of Liege, Faculty of Veterinary Medicine, B 4000 Sart-Tilman, Belgium
ABSTRACT
The objectives of the study were to estimate preg-nancy incidence and calving rate after first artificialinsemination (AI) in Norwegian Red cows undergoingspontaneous estrus, to assess the relationship betweenpregnancy and management factors at herd or cowlevel, to evaluate differences between 60-d nonreturnrate (NRR60d) and pregnancy incidence, and to com-pare the accuracy of pregnancy diagnosis by rectal pal-pation and plasma pregnancy-associated glycoproteins(PAG) analysis supported by progesterone measure-ments. In total, 829 animals (n = 229 heifers, 234 first-lactation, 173 second-lactation, and 193 >second-lacta-tion cows) were included. Milk samples for progesteroneanalysis were collected both at AI and 3 wk later. Cowswith progesterone concentrations <3 ng/mL at AI wereconsidered in estrus or having nonactive ovaries,whereas cows with progesterone concentrations >7 ng/mL 3 wk later were considered pregnant. Blood sam-pling for PAG analysis and pregnancy diagnosis by rec-tal palpation were conducted 57.6 ± 0.92 d after AI.Pregnancy-associated glycoprotein concentrationsequal to 2.5 ng/mL gave the greatest sensitivity (94.3%)and specificity (94.6%) in the assessment of pregnancy.The number of days from calving to first AI was 85.3± 1.71. Overall NRR60d after first AI was 72.5%. Thecorresponding values for heifers, first-lactation, second-lactation, and >second-lactation cows were 76.9, 67.1,69.9, and 76.2%. Overall pregnancy incidence after firstAI was 63.7%. The corresponding values for heifers,first-lactation, second-lactation, and >second-lactationcows were 70.0, 58.2, 61.6, and 64.9%. Overall calvingrate to first AI was 57.2%. The corresponding values forheifers, first-lactation, second-lactation, and >second-lactation cows were 64.9, 54.3, 54.7, and 53.9%. Theoverall difference between NRR60d and pregnancy inci-
Received October 15, 2007.Accepted April 23, 2008.1Corresponding author: [email protected]
3025
dence was 8.8%, whereas the parity-specific differenceswere 6.9, 8.9, 8.3, and 11.3% for heifers, first-lactation,second-lactation, and >second-lactation cows, respec-tively. Eight animals with PAG <2.5ng/mL and classi-fied as pregnant by rectal palpation calved, whereas 5animals with PAG ≥2.5 ng/mL and classified as non-pregnant by rectal palpation also calved. The studyshowed that Norwegian Red cows have relatively highreproductive performance. Breeding for fertility traitsover 35 yr is probably an important reason for suchhigh fertility.Key words: pregnancy incidence, dairy cow, reproduc-tive performance
INTRODUCTION
Since the 1970s, milk yield per cow has increasedbecause of intense genetic selection, improved manage-ment, and better nutrition (Lucy, 2001). Yet fertility indairy cows has declined in recent decades, resulting ineconomic losses in the dairy industry. There is ongoingdiscussion about reasons for infertility in dairy cows,including factors such as increased milk production as-sociated with negative energy balance, larger herd size,and greater inbreeding percentages. To improve fertil-ity in dairy cows, several estrous cycle managementsystems, involving use of reproductive hormones andtimed AI, were developed (Thatcher et al., 2006). Thereare a few published studies from recent years in whichcows were inseminated at spontaneously occurring es-trus (Andersson et al., 2006; Cairoli et al., 2006) com-pared with induced estrus and timed AI (Lopez-Gatiuset al., 2004; Howard et al., 2006). In the Norwegiandairy industry, pharmacological methods to control es-trous cycles are not routinely used, and pharmaceuticaltreatment of reproductive disorders is only applied afterclinical examination and diagnosis (Østeras et al.,2007).
Despite modern estrous cycle management systems,fertility is still declining and the importance of the in-clusion of fertility-related traits in the genetic selection
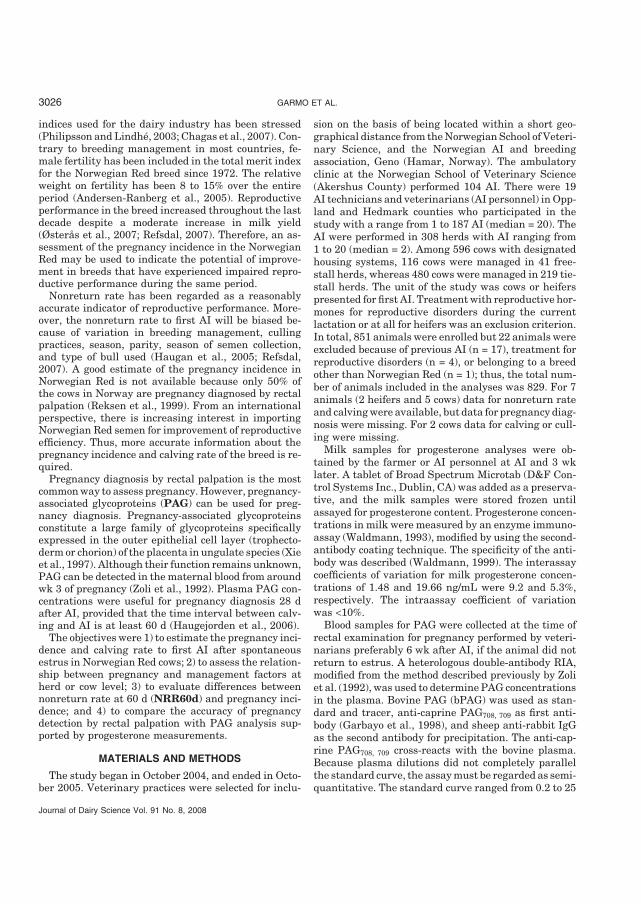
GARMO ET AL.3026
indices used for the dairy industry has been stressed(Philipsson and Lindhe, 2003; Chagas et al., 2007). Con-trary to breeding management in most countries, fe-male fertility has been included in the total merit indexfor the Norwegian Red breed since 1972. The relativeweight on fertility has been 8 to 15% over the entireperiod (Andersen-Ranberg et al., 2005). Reproductiveperformance in the breed increased throughout the lastdecade despite a moderate increase in milk yield(Østeras et al., 2007; Refsdal, 2007). Therefore, an as-sessment of the pregnancy incidence in the NorwegianRed may be used to indicate the potential of improve-ment in breeds that have experienced impaired repro-ductive performance during the same period.
Nonreturn rate has been regarded as a reasonablyaccurate indicator of reproductive performance. More-over, the nonreturn rate to first AI will be biased be-cause of variation in breeding management, cullingpractices, season, parity, season of semen collection,and type of bull used (Haugan et al., 2005; Refsdal,2007). A good estimate of the pregnancy incidence inNorwegian Red is not available because only 50% ofthe cows in Norway are pregnancy diagnosed by rectalpalpation (Reksen et al., 1999). From an internationalperspective, there is increasing interest in importingNorwegian Red semen for improvement of reproductiveefficiency. Thus, more accurate information about thepregnancy incidence and calving rate of the breed is re-quired.
Pregnancy diagnosis by rectal palpation is the mostcommon way to assess pregnancy. However, pregnancy-associated glycoproteins (PAG) can be used for preg-nancy diagnosis. Pregnancy-associated glycoproteinsconstitute a large family of glycoproteins specificallyexpressed in the outer epithelial cell layer (trophecto-derm or chorion) of the placenta in ungulate species (Xieet al., 1997). Although their function remains unknown,PAG can be detected in the maternal blood from aroundwk 3 of pregnancy (Zoli et al., 1992). Plasma PAG con-centrations were useful for pregnancy diagnosis 28 dafter AI, provided that the time interval between calv-ing and AI is at least 60 d (Haugejorden et al., 2006).
The objectives were 1) to estimate the pregnancy inci-dence and calving rate to first AI after spontaneousestrus in Norwegian Red cows; 2) to assess the relation-ship between pregnancy and management factors atherd or cow level; 3) to evaluate differences betweennonreturn rate at 60 d (NRR60d) and pregnancy inci-dence; and 4) to compare the accuracy of pregnancydetection by rectal palpation with PAG analysis sup-ported by progesterone measurements.
MATERIALS AND METHODS
The study began in October 2004, and ended in Octo-ber 2005. Veterinary practices were selected for inclu-
Journal of Dairy Science Vol. 91 No. 8, 2008
sion on the basis of being located within a short geo-graphical distance from the Norwegian School of Veteri-nary Science, and the Norwegian AI and breedingassociation, Geno (Hamar, Norway). The ambulatoryclinic at the Norwegian School of Veterinary Science(Akershus County) performed 104 AI. There were 19AI technicians and veterinarians (AI personnel) in Opp-land and Hedmark counties who participated in thestudy with a range from 1 to 187 AI (median = 20). TheAI were performed in 308 herds with AI ranging from1 to 20 (median = 2). Among 596 cows with designatedhousing systems, 116 cows were managed in 41 free-stall herds, whereas 480 cows were managed in 219 tie-stall herds. The unit of the study was cows or heiferspresented for first AI. Treatment with reproductive hor-mones for reproductive disorders during the currentlactation or at all for heifers was an exclusion criterion.In total, 851 animals were enrolled but 22 animals wereexcluded because of previous AI (n = 17), treatment forreproductive disorders (n = 4), or belonging to a breedother than Norwegian Red (n = 1); thus, the total num-ber of animals included in the analyses was 829. For 7animals (2 heifers and 5 cows) data for nonreturn rateand calving were available, but data for pregnancy diag-nosis were missing. For 2 cows data for calving or cull-ing were missing.
Milk samples for progesterone analyses were ob-tained by the farmer or AI personnel at AI and 3 wklater. A tablet of Broad Spectrum Microtab (D&F Con-trol Systems Inc., Dublin, CA) was added as a preserva-tive, and the milk samples were stored frozen untilassayed for progesterone content. Progesterone concen-trations in milk were measured by an enzyme immuno-assay (Waldmann, 1993), modified by using the second-antibody coating technique. The specificity of the anti-body was described (Waldmann, 1999). The interassaycoefficients of variation for milk progesterone concen-trations of 1.48 and 19.66 ng/mL were 9.2 and 5.3%,respectively. The intraassay coefficient of variationwas <10%.
Blood samples for PAG were collected at the time ofrectal examination for pregnancy performed by veteri-narians preferably 6 wk after AI, if the animal did notreturn to estrus. A heterologous double-antibody RIA,modified from the method described previously by Zoliet al. (1992), was used to determine PAG concentrationsin the plasma. Bovine PAG (bPAG) was used as stan-dard and tracer, anti-caprine PAG708, 709 as first anti-body (Garbayo et al., 1998), and sheep anti-rabbit IgGas the second antibody for precipitation. The anti-cap-rine PAG708, 709 cross-reacts with the bovine plasma.Because plasma dilutions did not completely parallelthe standard curve, the assay must be regarded as semi-quantitative. The standard curve ranged from 0.2 to 25

PREGNANCY INCIDENCE IN NORWEGIAN RED 3027
ng of bPAG equivalents/mL. To minimize nonspecificinterferences, zero plasma was added to all standardtubes. Samples and standards were incubated with an-tibody overnight at room temperature, and labeledbPAG (33,333 dpm) was added the following day andincubated for a further 4 h at room temperature. Sheepanti-rabbit IgG was added, and free and bound fractionswere separated by centrifugation (3,400 × g for 15 min).The precipitates were counted in a Wizard GammaCounter (Wallac, Turku, Finland). Interassay coeffi-cients of variation were 11.6% (2.59 ng of bPAG equiva-lents/mL) and 5.0% (10.27 ng of bPAG equivalents/mL),respectively. Assay sensitivity was 0.80 ng of bPAGequivalents/mL.
Data on previous calving date, date of AI, date of newAI, date for next calving, use of double AI (new AIwithin 0 to 3 d), parity, the milk yield measure within43 d after AI, heifers’ age at AI, AI personnel, herd size,culling date, and reasons for culling were obtained fromthe National Dairy Herd Recording System (NDHRS)files (Tine BA, As, Norway).
Determination of Pregnancy Incidence
The most reliable standard for pregnant animals wasconsidered to be animals calving after first AI (n = 473of 827 animals). Among animals that calved, the criteriaused to determine whether the pregnancy was becauseof the reported AI were either a gestation period of <295d without a recording on new AI, or return to estrus18 to 24 d after first AI. For animals with a gestationperiod >290 d, the identity of the sire and the bull usedat AI was controlled using the NDHRS files.
For cows with uncertain pregnancy status that didnot calve within the defined gestation period, rectalpalpation and progesterone measurements were con-sidered in addition to PAG analysis. By including thesecriteria to determine pregnancy, the numbers of preg-nant animals increased by 51; thus, the total numberof pregnant animals was 524.
Analysis of Milk Progesterone. A progesteroneconcentration of 7 ng/mL was chosen as the thresholdvalue for the indication of pregnancy 3 wk after firstAI. This threshold value was based on the lowest milkprogesterone values observed in pregnant animals ofthe current study. Milk progesterone concentrations 3wk after AI in 4 pregnant cows that calved 280, 282,278, and 280 d after first AI were 7.1, 8.0, 9.4, and 9.8ng/mL, respectively. A threshold value of milk proges-terone ≥3 ng/mL (Royal et al., 2000; Petersson et al.,2007) indicated luteal activity. Thus, to be compatiblewith pregnancy, milk progesterone concentrations atAI needed to be <3 ng/mL, and >7 ng/mL at the secondmilk sample obtained 3 wk later. Progesterone concen-
Journal of Dairy Science Vol. 91 No. 8, 2008
tration ≥3 ng/mL in the first milk sample was indicativeof AI in diestrus.
Analysis of PAG. The PAG value for determinationof pregnancy was interpolated to an estimated PAGvalue at d 42 for all cows. The natural logarithm ofPAG was used for the estimation, and regressed againstdays from AI to blood sampling. The coefficient β =0.01978 was used to obtain the changes in PAG perday. The adjusted 42-d PAG value for the pregnantanimals that delivered a calf (n = 473) was used tocreate a sensitivity curve for PAG. Animals whose bloodwas analyzed for PAG concentrations but were deter-mined nonpregnant (n = 37) were used to create a speci-ficity curve for PAG. Animals used to create a specificitycurve had progesterone concentrations <3 ng/ml at AIand ≤7 ng/mL 3 wk after AI or PAG value <0.5 ng/mLor both in addition to being evaluated nonpregnant byrectal palpation.
Rectal Palpation. Local veterinarians were in-structed to perform pregnancy examinations approxi-mately 6 wk after AI by rectal palpation simultaneouslywith blood sampling for animals believed pregnant be-cause of nonreturn to estrus or rebreeding.
Pregnancy Diagnosis by PAG and Rectal Palpation
Only cows that calved after first AI (n = 473) wereused to determine the accuracy of pregnancy diagnosisby rectal palpation and by PAG analysis. Fourteen ofthese animals had no measurements for PAG, and 2had no records of pregnancy examination; all 16 ani-mals were excluded from the evaluation of the accuracyof pregnancy diagnosis by rectal palpation and PAGanalysis.
Statistical Analyses
The calculation of NRR60d, pregnancy incidence, andcalving rate was performed separately for all AI and forsingle AI only. The relationships between the outcomepregnant or nonpregnant and the predictor variableswere tested both univariately using ordinary logisticregression in SPSS (SPSS Inc., 2004), and in multivari-able analysis using a general estimating equation(GEE) approach with the GENMOD procedure in SAS(Stokes et al., 1995).
The following variables were included when the like-lihood of pregnancy (1 or 0) was evaluated in the univar-iate logistic regression model: milk yield at the DIMclosest to AI (milk yield), heifers’ age at AI, days fromcalving to first AI (CFI), lactation number (heifer, 1, 2,>2), season (Jan to March, April to June, July to Sep,and Oct to Dec), double AI, housing (tie stall, free stall),personnel performing AI, and herd size. Personnel per-

GARMO ET AL.3028
forming <30 AI were categorized into one group,whereas personnel performing ≥30 AI were included assingle levels in the model. Herd size was categorizedinto 3 equally sized groups: 5.7 to 15.3, 15.4 to 21.3,and 21.4 to 134.5 cow-years.
The univariate analyses were performed both simul-taneously for all parities and separately for cows andheifers. Animals calving during January, February,and March; animals with a single AI during estrus;herd size from 5.7 to 15.3 cow-years; personnel per-forming <30 AI; and heifers were the designated com-parison groups and were assigned the zero value of anodds ratio = 1.
When the association between likelihood of preg-nancy and milk yield was assessed, CFI was includedin the model to adjust for changes in milk yield by DIM.Variables in the univariate analyses with a P ≤ 0.20(overall Wald statistics) were included in the multivari-able model and the backward selection procedure wasapplied. The variable with the greatest P-value wasomitted and only predictor variables with a P ≤ 0.20from the type 3 score statistics in the GEE analysisremained in the model. The following predictor vari-ables remained in the model when the likelihood ofpregnancy in all animals was assessed: lactation num-ber, double AI (1 or 0), and AI personnel. None of thepredictor variables remained in the heifer model. Thefollowing predictor variables remained in the modelwhen the likelihood of pregnancy in cows was assessed:season, double AI (1 or 0), and CFI. Cows were nestedwithin herd, which was accounted for by using a com-pound symmetry (exchangeable) correlation structure(Stokes et al., 1995). Confounding was assessed by com-
Table 1. Overall and parity-specific 60-d nonreturn rate, pregnancy incidence at 6 wk, and calving rate inNorwegian Red cows after first AI1
Nonreturn rate Pregnancy incidence Calving rate
Group n/n % n/n % n/n %
All 601/829 72.5 524/8222 63.7 473/8272 57.2Heifers 176/229 76.9 159/227 70.0 148/228 64.9Cows 425/600 70.8 365/595 61.3 325/599 54.3
1st lactation 157/234 67.1 135/232 58.2 127/234 54.32nd lactation 121/173 69.9 106/172 61.6 94/172 54.7>2nd lactation 147/193 76.2 124/191 64.9 104/193 53.9
Single AI onlyAll 532/741 71.8 462/7342 62.9 416/7392 56.3Heifers 155/205 75.6 143/203 70.4 133/204 65.2Cows 377/536 70.3 319/531 60.1 283/535 52.9
1st lactation 139/208 66.8 118/206 57.3 111/208 53.42nd lactation 106/156 67.9 92/155 59.4 81/155 52.3>2nd lactation 132/172 76.7 109/170 64.1 91/172 52.9
1Results are reported separately for all animals, including those that received double AI (new AI within0 to 3 d, n = 829), and for animals that received only 1 AI (n = 741).
2The different numbers of observations for nonreturn rate, pregnancy incidence, and calving rate arebecause of missing data for pregnancy diagnosis at 6 wk for 7 animals, and missing data on calving dateor culling date for 2 animals.
Journal of Dairy Science Vol. 91 No. 8, 2008
paring crude and adjusted parameter estimates. If theestimates varied >10%, confounding was regarded aspresent (Dohoo et al., 2003).
RESULTS
The distribution of AI (n = 829) by parity for heifers,first-lactation, second-lactation, and >second-lactationcows is in Table 1. The overall average CFI intervalwas 85.3 d (SD ± 41.9). The corresponding values were84.4 ± 38.1, 86.8 ± 52.0, and 84.9 ± 35.8 d for first-lactation, second-lactation, and >second-lactation cows,respectively. The proportion of double AI was evenlydistributed by parity: heifers 10.5%, first lactation11.1%, second lactation 9.8%, and >second lactation10.9%. The number of days from first AI to blood sam-pling for PAG analysis and rectal palpation was 57.6 ±22.2 d (n = 584). Low progesterone concentration (<3ng/mL) was present in 95.1% (520/547) of the cows atfirst AI, whereas progesterone concentration ≥3 ng/mLwas detected in 4.9% (27/547) of the cows.
Nonreturn Rate, Pregnancy Incidence,and Calving Rate
Parity-specific NRR60d, pregnancy incidence, andcalving rate, including double AI, are in Table 1.Thedifference between NRR60d and pregnancy incidencewas 8.8%. The parity-specific differences betweenNRR60d and pregnancy incidence were 6.9, 8.9, 8.3,and 11.3% for heifers, first-lactation, second-lactation,and >second-lactation cows, respectively. The preg-nancy incidence was 10.3% greater in heifers compared
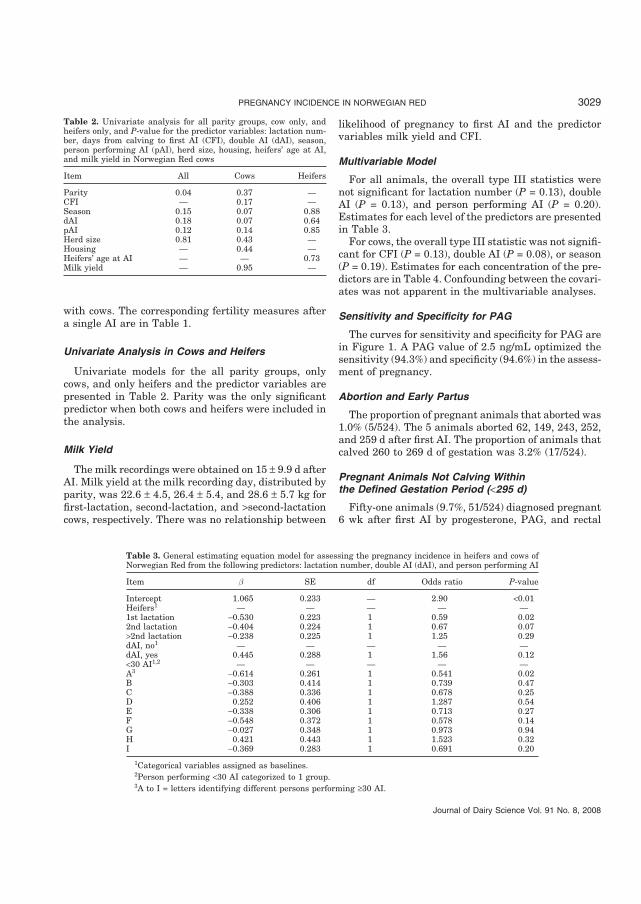
PREGNANCY INCIDENCE IN NORWEGIAN RED 3029
Table 2. Univariate analysis for all parity groups, cow only, andheifers only, and P-value for the predictor variables: lactation num-ber, days from calving to first AI (CFI), double AI (dAI), season,person performing AI (pAI), herd size, housing, heifers’ age at AI,and milk yield in Norwegian Red cows
Item All Cows Heifers
Parity 0.04 0.37 —CFI — 0.17 —Season 0.15 0.07 0.88dAI 0.18 0.07 0.64pAI 0.12 0.14 0.85Herd size 0.81 0.43 —Housing — 0.44 —Heifers’ age at AI — — 0.73Milk yield — 0.95 —
with cows. The corresponding fertility measures aftera single AI are in Table 1.
Univariate Analysis in Cows and Heifers
Univariate models for the all parity groups, onlycows, and only heifers and the predictor variables arepresented in Table 2. Parity was the only significantpredictor when both cows and heifers were included inthe analysis.
Milk Yield
The milk recordings were obtained on 15 ± 9.9 d afterAI. Milk yield at the milk recording day, distributed byparity, was 22.6 ± 4.5, 26.4 ± 5.4, and 28.6 ± 5.7 kg forfirst-lactation, second-lactation, and >second-lactationcows, respectively. There was no relationship between
Table 3. General estimating equation model for assessing the pregnancy incidence in heifers and cows ofNorwegian Red from the following predictors: lactation number, double AI (dAI), and person performing AI
Item β SE df Odds ratio P-value
Intercept 1.065 0.233 — 2.90 <0.01Heifers1 — — — — —1st lactation −0.530 0.223 1 0.59 0.022nd lactation −0.404 0.224 1 0.67 0.07>2nd lactation −0.238 0.225 1 1.25 0.29dAI, no1 — — — — —dAI, yes 0.445 0.288 1 1.56 0.12<30 AI1,2 — — — — —A3 −0.614 0.261 1 0.541 0.02B −0.303 0.414 1 0.739 0.47C −0.388 0.336 1 0.678 0.25D 0.252 0.406 1 1.287 0.54E −0.338 0.306 1 0.713 0.27F −0.548 0.372 1 0.578 0.14G −0.027 0.348 1 0.973 0.94H 0.421 0.443 1 1.523 0.32I −0.369 0.283 1 0.691 0.20
1Categorical variables assigned as baselines.2Person performing <30 AI categorized to 1 group.3A to I = letters identifying different persons performing ≥30 AI.
Journal of Dairy Science Vol. 91 No. 8, 2008
likelihood of pregnancy to first AI and the predictorvariables milk yield and CFI.
Multivariable Model
For all animals, the overall type III statistics werenot significant for lactation number (P = 0.13), doubleAI (P = 0.13), and person performing AI (P = 0.20).Estimates for each level of the predictors are presentedin Table 3.
For cows, the overall type III statistic was not signifi-cant for CFI (P = 0.13), double AI (P = 0.08), or season(P = 0.19). Estimates for each concentration of the pre-dictors are in Table 4. Confounding between the covari-ates was not apparent in the multivariable analyses.
Sensitivity and Specificity for PAG
The curves for sensitivity and specificity for PAG arein Figure 1. A PAG value of 2.5 ng/mL optimized thesensitivity (94.3%) and specificity (94.6%) in the assess-ment of pregnancy.
Abortion and Early Partus
The proportion of pregnant animals that aborted was1.0% (5/524). The 5 animals aborted 62, 149, 243, 252,and 259 d after first AI. The proportion of animals thatcalved 260 to 269 d of gestation was 3.2% (17/524).
Pregnant Animals Not Calving Withinthe Defined Gestation Period (<295 d)
Fifty-one animals (9.7%, 51/524) diagnosed pregnant6 wk after first AI by progesterone, PAG, and rectal

GARMO ET AL.3030
Table 4. General estimating equation model for assessing the pregnancy incidence in Norwegian Red cowsfrom the following predictors: days from calving to first AI (CFI), double AI (dAI), and season
Item β SE df Odds ratio P-value
Intercept −0.185 0.274 — 0.83 0.50CFI 0.003 0.002 1 1.00 0.17dAI, no1 — — — — —dAI, yes 0.537 0.317 1 1.71 0.09Season, Jan–March1 — — — — —Season, Oct–Dec 0.383 0.240 1 1.47 0.11Season, Apr–June 0.320 0.270 1 1.38 0.23Season, July–Sep 0.534 0.241 1 1.71 0.03
1Categorical variables assigned as baselines.
palpation did not deliver a calf after the current AI.Eleven were presented for a new AI, 12 animals weresold as milking cows, and 2 cows died. Culling reasonsfor the 12 animals were low fertility (n = 3) and otherreasons (n = 9). Four animals aborted or calved 62 to252 d of gestation, whereas 2 animals calved 296 and297 d of gestation. Five animals were still alive 295 dafter AI without a calving or a new recorded AI. Noinformation was available regarding the last 3 animals.
Low Fertility as a Culling Reason
In the present study, 3.6% (30/829) of the animalswere culled because of low fertility ≤290 d after firstAI. Nine animals were not presented for a new AI, and
Figure 1. Sensitivity (n = 473; �) and specificity (n = 37; ▲) for the determination of pregnancy by measurement of pregnancy-associatedglycoproteins (PAG) in Norwegian Red cows.
Journal of Dairy Science Vol. 91 No. 8, 2008
3 were retrospectively diagnosed as pregnant. Twenty-one animals were presented for a new AI.
Pregnancy Diagnosis by PAG and Rectal Palpation
Among 457 animals that calved after first AI andthat had complete records regarding both PAG mea-surements and rectal pregnancy diagnosis, 444 had aPAG value >2.5 ng/mL and were classified pregnant byveterinarians. Eight animals with PAG ≤2.5 ng/mL thatwere classified as pregnant by veterinarians calved be-tween 270 and 287 d after first AI, whereas no animalsthat calved with PAG ≤2.5 ng/mL were classified asnonpregnant by veterinarians. Five animals classified

PREGNANCY INCIDENCE IN NORWEGIAN RED 3031
as nonpregnant by veterinarians had a PAG value >2.5ng/mL and calved after first AI.
DISCUSSION
A nonreturn rate of 71.8% at 60 d, a pregnancy inci-dence of 62.9% at 6 wk, and a calving rate of 56.3% aftera single AI (Table 1) must be considered as indicatorsof high reproductive efficiency in Norwegian Red cowscompared with previous and comparable studies indairy cattle (Andersson et al., 2006; Cairoli et al., 2006),and superior compared with AI after induced estrus ortimed AI (Lopez-Gatius et al., 2004; Howard et al.,2006). When cows subjected to double AI were excluded,the average NRR60d in Norwegian Red cows for 2005was 72.7% (Refsdal, 2007), and the percentage of returnrates within 0 to 3 d post-AI (double AI) was 12%. Thesefindings are well supported with those obtained in thepresent study.
Different threshold values for progesterone havebeen used both to indicate onset of estrus and to assessonset of luteal activity. Roelofs et al. (2006) reportedmilk progesterone concentrations <2 ng/mL before ovu-lation. Milk progesterone concentrations ≥3 ng/mL wereused as threshold value for luteal activity (Royal et al.,2000; Petersson et al., 2007). Accordingly, milk proges-terone concentration <3 ng/mL was used to determinethat a cow was not in the luteal phase of the estrouscycle at AI in the present study. Thus, milk progester-one was only used to determine pregnancy in additionto pregnancy diagnosis by PAG or manual rectal pal-pation.
The observed increase in NRR60d from 68.1% in 1985to 72.7% in 2005 for Norwegian Red cows (Refsdal,2007) may be biased because of decreased ability offarmers to identify and rebreed nonpregnant animals,which corresponds well with an increase in herd sizeduring the period (Østeras et al., 2007). It may be be-cause of increased emphasis on fertility and health inthe breeding strategy. Female fertility has been in-cluded in the total merit index since 1972 with relativeweight on fertility between 8 and 15% (Andersen-Ranb-erg et al., 2005). When the fertility index was calcu-lated, the nonreturn rate at 56 d in heifers was weightedby 67%, whereas first-lactation cows were weighted by33% (Geno Breeding and AI Association, 2007). In otherNordic countries, nonreturn rate after 56 d in heifersand cows, CFI, days from first AI to last AI, and daysopen are commonly used for female fertility traits evalu-ation of bulls (Interbull, 2007).
Overall, NRR60d overestimated the pregnancy inci-dence by approximately 9%. In heifers, the differencebetween NRR60d and pregnancy incidence was 6.9%,whereas the same estimate for >second-lactation cows
Journal of Dairy Science Vol. 91 No. 8, 2008
was 11.3%. This demonstrates that the nonreturn ratewas subjected to more bias in older cows than amongheifers. But culling of older cows before 60 d after AIwas not an important reason for the lower pregnancyincidence; only 7 animals in the study group were culledbefore 60 d after first AI, and of these 7 animals, 4 were>second-lactation cows. The likely explanation of thisbias is that the farmer presents an older cow for AI andwhen the cow returns to estrus the farmer decides tocull her at the end of lactation rather than performinga new AI. Consequently, NRR60d overestimates thepregnancy incidence.
The pregnancy incidence may vary with number ofdays from AI to pregnancy examination; this could bedue both to the accuracy of pregnancy examination andto fetal mortality. In Norway, calculation of nonreturnrate after first AI includes all AI performed in heifersand cows. Reksen et al. (1999) reported that approxi-mately 50% of Norwegian Red cows were pregnancydiagnosed, and that cows presented for pregnancy diag-nosis were less likely pregnant than herd mates. Thus,if pregnancy diagnosis is used as a fertility measure inthe calculation of the breeding index, care must betaken to avoid selection bias (Dohoo et al., 2003). Inthe future, pregnancy incidence in Norwegian Red cowsmay be approximated from the parity-specific differ-ences between nonreturn rate and pregnancy incidence.
Lactation number was a significant predictor of thelikelihood of pregnancy when all parity categories wereincluded in the analyses, but when heifers were ex-cluded from the analysis, lactation number did not af-fect the pregnancy incidence. It is known that reproduc-tive performance in heifers is better than in cows, be-cause of milk production and the risk of a prolongedperiod of negative energy balance leading to delayedovarian activity (Butler and Smith, 1989).
The interval from calving to first AI, which was 84.4,86.6, and 84.9 d for first-lactation, second-lactation, and>second-lactation cows, respectively, was not associ-ated with pregnancy incidence. The explanation for thiscould be a relatively long voluntary waiting period be-fore first AI. The CFI interval in the present study waslonger than that reported by Royal et al. (2000) in whichthe CFI interval increased from 74.0 d in the 1970sto 77.6 d in the 1990s. The average CFI interval inNorwegian Red cows increased from 79 d in 1990 to 86d in 2005 (Refsdal, 2007).
In addition to an increased weight on fertility in selec-tion, the lack of association between milk yield anddays from calving to AI on the likelihood of pregnancycould be because of the moderate milk yield in the Nor-wegian Red cows, which was 6,605 kg/cow-year in 2005(Østeras et al., 2007). Yet the genetic potential for highmilk yield in Norwegian Red is not fully exploited be-
GARMO ET AL.3032
cause of the political framework present in Norway,which affects price mechanisms and feeding regimenssuch that milk yields remain moderate (Refsdal, 2007).
In the present study, AI in the luteal phase was per-formed in 4.9% of the cows, which supports Andresenand Onstad (1979) and Grimard et al. (2006) who re-ported 4.4 and 5.0% AI in the luteal phase, respectively.Cairoli et al. (2006) found that 10.2% of the cows show-ing spontaneous estrus were inseminated at high pro-gesterone concentrations.
Sampling for PAG and rectal palpation for pregnancywas conducted at the same time, and both should ex-press pregnancy or nonpregnancy independently ofeach other. Haugejorden et al. (2006) recommendedthat for cows inseminated n days before 60 d postpar-tum, pregnancy diagnosis by PAG be carried out at 28+ (n × 0.5) d of pregnancy. Using this formula, in thecurrent study, PAG analysis was conducted in 6 ani-mals before the recommended day of gestation. But inthese animals, PAG values were >7 ng/mL, and addi-tionally they were confirmed as pregnant by rectal pal-pation.
CONCLUSIONS
In conclusion, Norwegian Red cows have a relativelyhigh reproductive performance, and the study popula-tion was probably representative of the population ofNorwegian Red cows. Breeding for fertility traits overthe last 35 yr is likely an important factor contributingto such high fertility. For further estimation of the preg-nancy incidence from nonreturn rate, it is important tobe aware of differences in nonreturn rate and pregnancyincidence between younger and older cows. The studyshowed that the use of rectal palpation for pregnancydiagnosis is valuable, provided that veterinarians pos-sess the necessary diagnostic skills.
ACKNOWLEDGMENTS
The authors would like to express their appreciationto the Norwegian Breeding and AI association, Geno,for their support. We would like to thank the veterinari-ans and AI technicians for their valuable field work,and the staff at the hormone laboratory for analyzingmilk and blood samples. Support for the preparationof the anti-progesterone monoclonal antibody and theprogesterone peroxidase conjugate was provided by theEstonian Science Foundation Grant 6065.
REFERENCES
Andersen-Ranberg, I. M., G. Klemetsdal, B. Heringstad, and T.Steine. 2005. Heritabilities, genetic correlations, and geneticchange for female fertility and protein yield in Norwegian dairycattle. J. Dairy Sci. 88:348–355.
Journal of Dairy Science Vol. 91 No. 8, 2008
Andersson, M., J. Taponen, M. Kommeri, and M. Dahlbom. 2006.Pregnancy rates in lactating Holstein-Friesian cows after artifi-cial insemination with sexed sperm. Reprod. Domest. Anim.41:95–97.
Andresen, Ø., and O. Onstad. 1979. Brunstkontroll og drektighet-skontroll hos ku ved hjelp av progesteronbestemmelse i melk(Estrus detection and pregnancy testing in the cow using the milkprogesterone test). Nord. Vet. Tidsskr. 91:411–421.
Butler, W. R., and R. D. Smith. 1989. Interrelationships betweenenergy balance and postpartum reproductive function in dairycattle. J. Dairy Sci. 72:767–783.
Cairoli, F., A. Mollo, M. C. Veronesi, B. Renaville, M. Faustini, andM. Battocchio. 2006. Comparison between cloprostenol-inducedand spontaneous oestrus fertility in dairy cows. Reprod. Domest.Anim. 41:175–179.
Chagas, L. M., J. J. Bass, D. Blache, C. R. Burke, J. K. Kay, D. R.Lindsay, M. C. Lucy, G. B. Martin, S. Meier, F. M. Rhodes, J. R.Roche, W. W. Thatcher, and R. Webb. 2007. Invited Review: Newperspectives on the roles of nutrition and metabolic prioritiesin the subfertility of high-producing dairy cows. J. Dairy Sci.90:4022–4032.
Dohoo, I. R., W. Martin, and H. Stryhn. 2003. Veterinary epidemio-logic research. Transcontinental, Charlottetown, Prince EdwardIsland, Canada.
Garbayo, J. M., B. Remy, J. L. Alabart, J. Folch, R. Wattiez, P.Falmagne, and J. F. Beckers. 1998. Isolation and partial charac-terization of a pregnancy-associated glycoprotein family from thegoat placenta. Biol. Reprod. 58:109–115.
Geno Breeding and AI Association. 2007. Avkomsgransking, egen-skaper, fruktbarhet (In Norwegian). http://www.geno.no/geno-nett/presentasjonsdel/GENO/avl/default.asp?menyvalg_id=311.Accessed April 16, 2008.
Grimard, B., S. Freret, A. Chevallier, A. Pinto, C. Ponsart, and P.Humblot. 2006. Genetic and environmental factors influencingfirst service conception rate and late embryonic/foetal mortalityin low fertility dairy herds. Anim. Reprod. Sci. 91:31–44.
Haugan, T., O. Reksen, Y. T. Grohn, E. Kommisrud, E. Ropstad,and E. Sehested. 2005. Seasonal effects of semen collection andartificial insemination on dairy cow conception. Anim. Reprod.Sci. 90:57–71.
Haugejorden, G., S. Waage, E. Dahl, K. Karlberg, J. F. Beckers, andE. Ropstad. 2006. Pregnancy associated glycoproteins (PAG) inpostpartum cows, ewes, goats and their offspring. Theriogenology66:1976–1984.
Howard, J. M., R. Manzo, J. C. Dalton, F. Frago, and A. Ahmadzadeh.2006. Conception rates and serum progesterone concentration indairy cattle administered gonadotropin releasing hormone 5 daysafter artificial insemination. Anim. Reprod. Sci. 95:224–233.
Interbull. 2007. Interbull routine genetic evaluation for female fertil-ity traits.http://www-interbull.slu.se/Female_fert/ff-may07.html.Accessed April 16, 2008.
Lopez-Gatius, F., K. Murugavel, P. Santolaria, M. Lopez-Bejar, andJ. L. Yaniz. 2004. Pregnancy rate after timed artificial insemina-tion in early post-partum dairy cows after Ovsynch or specificsynchronization protocols. J. Vet. Med. A Physiol. Pathol. Clin.Med. 51:33–38.
Lucy, M. C. 2001. Reproductive loss in high-producing dairy cattle:Where will it end? J. Dairy Sci. 84:1277–1293.
Østeras, O., H. Solbu, A. O. Refsdal, T. Roalkvam, O. Filseth, andA. Minsaas. 2007. Results and evaluation of thirty years of healthrecordings in the Norwegian dairy cattle population. J. Dairy Sci.90:4483–4497.
Petersson, K. J., B. Berglund, E. Strandberg, H. Gustafsson, A. P.F. Flint, J. A. Woolliams, and M. D. Royal. 2007. Genetic analysisof postpartum measures of luteal activity in dairy cows. J. DairySci. 90:427–434.
Philipsson, J., and B. Lindhe. 2003. Experiences of including repro-duction and health traits in Scandinavian dairy cattle breedingprogrammes. Livest. Prod. Sci. 83:99–112.
Refsdal, A. O. 2007. Reproductive performance of Norwegian cattlefrom 1985 to 2005: Trends and seasonality. Acta Vet. Scand. 49:5.

PREGNANCY INCIDENCE IN NORWEGIAN RED 3033
Reksen, O., A. Tverdal, J. R. Lang-Ree, E. Glattre, and E. Ropstad.1999. Reproduction management of tethered cows on Norwegiandairy farms. Anim. Reprod. Sci. 57:141–151.
Roelofs, J. B., F. J. Van Eerdenburg, W. Hazeleger, N. M. Soede, andB. Kemp. 2006. Relationship between progesterone concentra-tions in milk and blood and time of ovulation in dairy cattle.Anim. Reprod. Sci. 91:337–343.
Royal, M. D., A. O. Darwash, A. P. F. Flint, R. Webb, J. A. Woolliams,and G. E. Lamming. 2000. Declining fertility in dairy cattle:Changes in traditional and endocrine parameters of fertility.Anim. Sci. 70:487–501.
SPSS Inc. 2004. SPSS Regression Models, 13.0. SPSS Inc., Chi-cago, IL.
Stokes, M. E., C. S. Davis, and G. G. Koch. 1995. Categorical dataanalysis using the SAS system. SAS Institute Inc., Cary, NC.
Journal of Dairy Science Vol. 91 No. 8, 2008
Thatcher, W. W., T. R. Bilby, J. A. Bartolome, F. Silvestre, C. R.Staples, and J. E. P. Santos. 2006. Strategies for improving fertil-ity in the modern dairy cow. Theriogenology 65:30–44.
Waldmann, A. 1993. Enzyme immunoassay (EIA) for milk progester-one using a monoclonal antibody. Anim. Reprod. Sci. 34:19–30.
Waldmann, A. 1999. Monoclonal antibodies to progesterone: Charac-terization and selection for enzyme immunoassay in bovine milk.Hybridoma 18:289–296.
Xie, S., J. Green, J. B. Bixby, B. Szafranska, J. C. DeMartini, S.Hecht, and R. M. Roberts. 1997. The diversity and evolutionaryrelationships of the pregnancy-associated glycoproteins, anaspartic proteinase subfamily consisting of many trophoblast-expressed genes. Proc. Natl. Acad. Sci. USA 94:12809–12816.
Zoli, A. P., L. A. Guilbault, P. Delahaut, W. B. Ortiz, and J. F. Beckers.1992. Radioimmunoassay of a bovine pregnancy-associated glyco-protein in serum: Its application for pregnancy diagnosis. Biol.Reprod. 46:83–92.


II

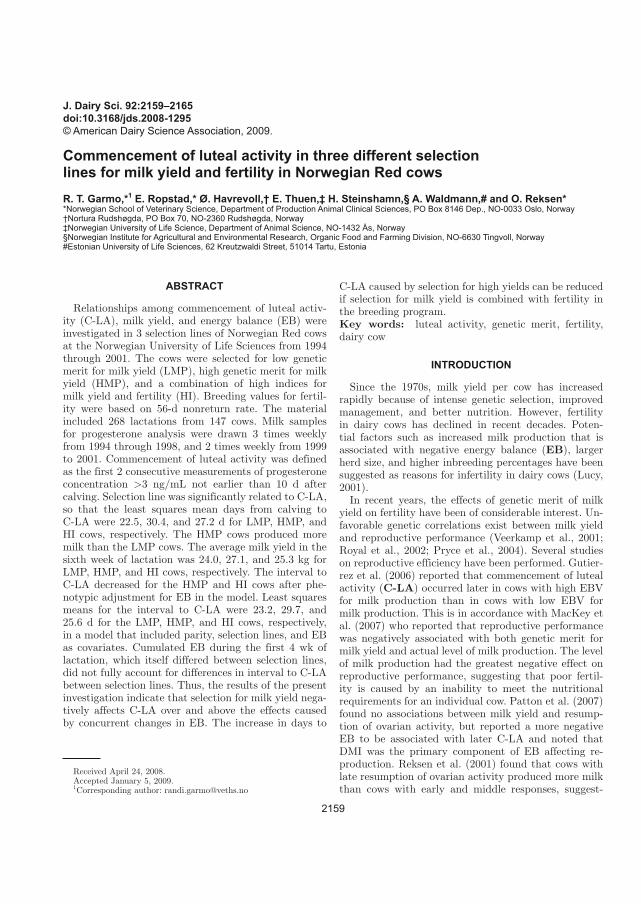
Commencement of luteal activity in three different selection lines for milk yield and fertility in Norwegian Red cowsR. T. Garmo,*1 E. Ropstad,* Ø. Havrevoll,† E. Thuen,‡ H. Steinshamn,§ A. Waldmann,# and O. Reksen**Norwegian School of Veterinary Science, Department of Production Animal Clinical Sciences, PO Box 8146 Dep., NO-0033 Oslo, Norway†Nortura Rudshøgda, PO Box 70, NO-2360 Rudshøgda, Norway‡Norwegian University of Life Science, Department of Animal Science, NO-1432 Ås, Norway§Norwegian Institute for Agricultural and Environmental Research, Organic Food and Farming Division, NO-6630 Tingvoll, Norway#Estonian University of Life Sciences, 62 Kreutzwaldi Street, 51014 Tartu, Estonia
ABSTRACT
Relationships among commencement of luteal activ-ity (C-LA), milk yield, and energy balance (EB) were investigated in 3 selection lines of Norwegian Red cows at the Norwegian University of Life Sciences from 1994 through 2001. The cows were selected for low genetic merit for milk yield (LMP), high genetic merit for milk yield (HMP), and a combination of high indices for milk yield and fertility (HI). Breeding values for fertil-ity were based on 56-d nonreturn rate. The material included 268 lactations from 147 cows. Milk samples for progesterone analysis were drawn 3 times weekly from 1994 through 1998, and 2 times weekly from 1999 to 2001. Commencement of luteal activity was defined as the first 2 consecutive measurements of progesterone concentration >3 ng/mL not earlier than 10 d after calving. Selection line was significantly related to C-LA, so that the least squares mean days from calving to C-LA were 22.5, 30.4, and 27.2 d for LMP, HMP, and HI cows, respectively. The HMP cows produced more milk than the LMP cows. The average milk yield in the sixth week of lactation was 24.0, 27.1, and 25.3 kg for LMP, HMP, and HI cows, respectively. The interval to C-LA decreased for the HMP and HI cows after phe-notypic adjustment for EB in the model. Least squares means for the interval to C-LA were 23.2, 29.7, and 25.6 d for the LMP, HMP, and HI cows, respectively, in a model that included parity, selection lines, and EB as covariates. Cumulated EB during the first 4 wk of lactation, which itself differed between selection lines, did not fully account for differences in interval to C-LA between selection lines. Thus, the results of the present investigation indicate that selection for milk yield nega-tively affects C-LA over and above the effects caused by concurrent changes in EB. The increase in days to
C-LA caused by selection for high yields can be reduced if selection for milk yield is combined with fertility in the breeding program.Key words: luteal activity, genetic merit, fertility, dairy cow
INTRODUCTION
Since the 1970s, milk yield per cow has increased rapidly because of intense genetic selection, improved management, and better nutrition. However, fertility in dairy cows has declined in recent decades. Poten-tial factors such as increased milk production that is associated with negative energy balance (EB), larger herd size, and higher inbreeding percentages have been suggested as reasons for infertility in dairy cows (Lucy, 2001).
In recent years, the effects of genetic merit of milk yield on fertility have been of considerable interest. Un-favorable genetic correlations exist between milk yield and reproductive performance (Veerkamp et al., 2001; Royal et al., 2002; Pryce et al., 2004). Several studies on reproductive efficiency have been performed. Gutier-rez et al. (2006) reported that commencement of luteal activity (C-LA) occurred later in cows with high EBV for milk production than in cows with low EBV for milk production. This is in accordance with MacKey et al. (2007) who reported that reproductive performance was negatively associated with both genetic merit for milk yield and actual level of milk production. The level of milk production had the greatest negative effect on reproductive performance, suggesting that poor fertil-ity is caused by an inability to meet the nutritional requirements for an individual cow. Patton et al. (2007) found no associations between milk yield and resump-tion of ovarian activity, but reported a more negative EB to be associated with later C-LA and noted that DMI was the primary component of EB affecting re-production. Reksen et al. (2001) found that cows with late resumption of ovarian activity produced more milk than cows with early and middle responses, suggest-
J. Dairy Sci. 92:2159–2165doi:10.3168/jds.2008-1295© American Dairy Science Association, 2009.
2159
Received April 24, 2008.Accepted January 5, 2009.1 Corresponding author: [email protected]
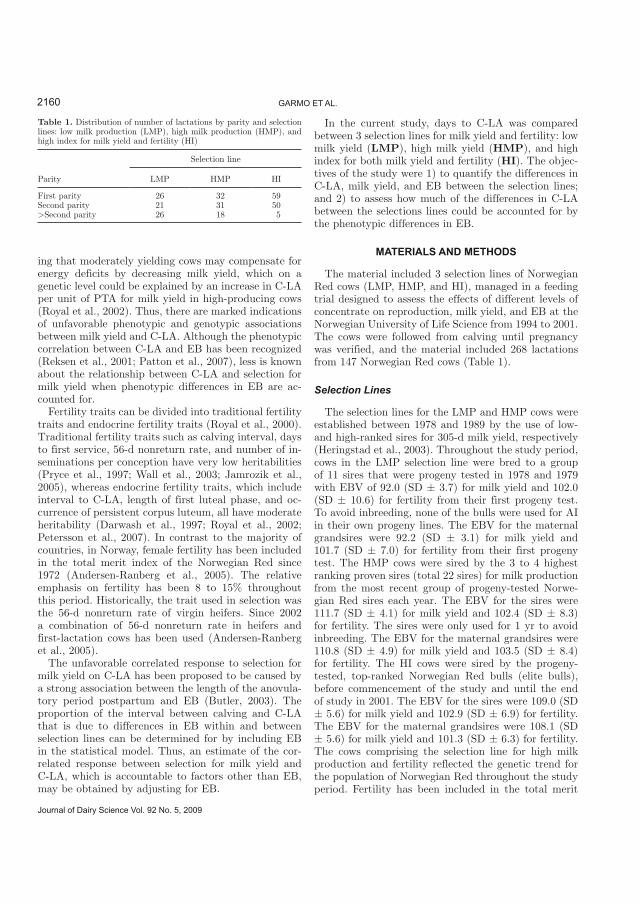
ing that moderately yielding cows may compensate for energy deficits by decreasing milk yield, which on a genetic level could be explained by an increase in C-LA per unit of PTA for milk yield in high-producing cows (Royal et al., 2002). Thus, there are marked indications of unfavorable phenotypic and genotypic associations between milk yield and C-LA. Although the phenotypic correlation between C-LA and EB has been recognized (Reksen et al., 2001; Patton et al., 2007), less is known about the relationship between C-LA and selection for milk yield when phenotypic differences in EB are ac-counted for.
Fertility traits can be divided into traditional fertility traits and endocrine fertility traits (Royal et al., 2000). Traditional fertility traits such as calving interval, days to first service, 56-d nonreturn rate, and number of in-seminations per conception have very low heritabilities (Pryce et al., 1997; Wall et al., 2003; Jamrozik et al., 2005), whereas endocrine fertility traits, which include interval to C-LA, length of first luteal phase, and oc-currence of persistent corpus luteum, all have moderate heritability (Darwash et al., 1997; Royal et al., 2002; Petersson et al., 2007). In contrast to the majority of countries, in Norway, female fertility has been included in the total merit index of the Norwegian Red since 1972 (Andersen-Ranberg et al., 2005). The relative emphasis on fertility has been 8 to 15% throughout this period. Historically, the trait used in selection was the 56-d nonreturn rate of virgin heifers. Since 2002 a combination of 56-d nonreturn rate in heifers and first-lactation cows has been used (Andersen-Ranberg et al., 2005).
The unfavorable correlated response to selection for milk yield on C-LA has been proposed to be caused by a strong association between the length of the anovula-tory period postpartum and EB (Butler, 2003). The proportion of the interval between calving and C-LA that is due to differences in EB within and between selection lines can be determined for by including EB in the statistical model. Thus, an estimate of the cor-related response between selection for milk yield and C-LA, which is accountable to factors other than EB, may be obtained by adjusting for EB.
In the current study, days to C-LA was compared between 3 selection lines for milk yield and fertility: low milk yield (LMP), high milk yield (HMP), and high index for both milk yield and fertility (HI). The objec-tives of the study were 1) to quantify the differences in C-LA, milk yield, and EB between the selection lines; and 2) to assess how much of the differences in C-LA between the selections lines could be accounted for by the phenotypic differences in EB.
MATERIALS AND METHODS
The material included 3 selection lines of Norwegian Red cows (LMP, HMP, and HI), managed in a feeding trial designed to assess the effects of different levels of concentrate on reproduction, milk yield, and EB at the Norwegian University of Life Science from 1994 to 2001. The cows were followed from calving until pregnancy was verified, and the material included 268 lactations from 147 Norwegian Red cows (Table 1).
Selection Lines
The selection lines for the LMP and HMP cows were established between 1978 and 1989 by the use of low- and high-ranked sires for 305-d milk yield, respectively (Heringstad et al., 2003). Throughout the study period, cows in the LMP selection line were bred to a group of 11 sires that were progeny tested in 1978 and 1979 with EBV of 92.0 (SD ± 3.7) for milk yield and 102.0 (SD ± 10.6) for fertility from their first progeny test. To avoid inbreeding, none of the bulls were used for AI in their own progeny lines. The EBV for the maternal grandsires were 92.2 (SD ± 3.1) for milk yield and 101.7 (SD ± 7.0) for fertility from their first progeny test. The HMP cows were sired by the 3 to 4 highest ranking proven sires (total 22 sires) for milk production from the most recent group of progeny-tested Norwe-gian Red sires each year. The EBV for the sires were 111.7 (SD ± 4.1) for milk yield and 102.4 (SD ± 8.3) for fertility. The sires were only used for 1 yr to avoid inbreeding. The EBV for the maternal grandsires were 110.8 (SD ± 4.9) for milk yield and 103.5 (SD ± 8.4) for fertility. The HI cows were sired by the progeny-tested, top-ranked Norwegian Red bulls (elite bulls), before commencement of the study and until the end of study in 2001. The EBV for the sires were 109.0 (SD ± 5.6) for milk yield and 102.9 (SD ± 6.9) for fertility. The EBV for the maternal grandsires were 108.1 (SD ± 5.6) for milk yield and 101.3 (SD ± 6.3) for fertility. The cows comprising the selection line for high milk production and fertility reflected the genetic trend for the population of Norwegian Red throughout the study period. Fertility has been included in the total merit
Journal of Dairy Science Vol. 92 No. 5, 2009
GARMO ET AL.2160
Table 1. Distribution of number of lactations by parity and selection lines: low milk production (LMP), high milk production (HMP), and high index for milk yield and fertility (HI)
Parity
Selection line
LMP HMP HI
First parity 26 32 59Second parity 21 31 50>Second parity 26 18 5
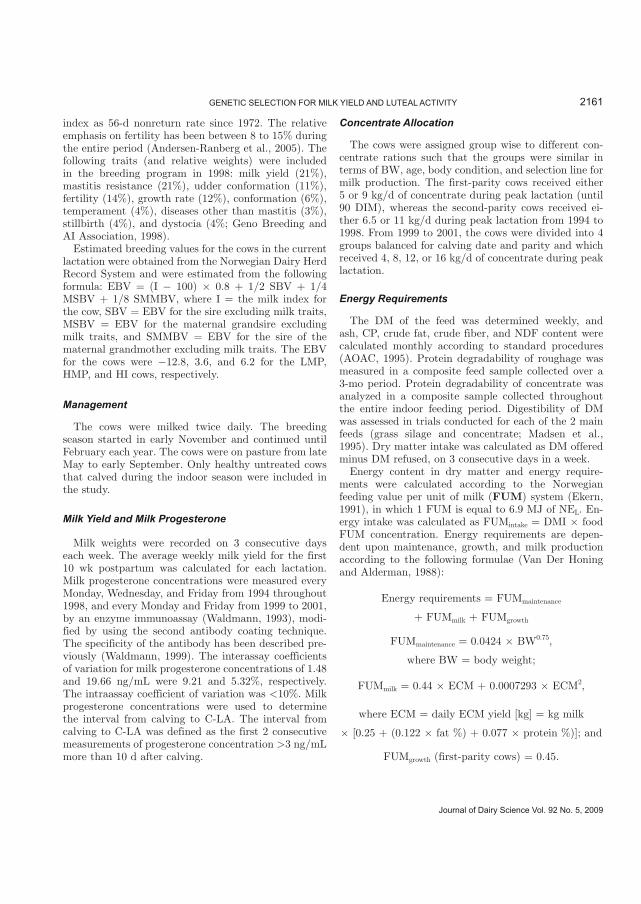
index as 56-d nonreturn rate since 1972. The relative emphasis on fertility has been between 8 to 15% during the entire period (Andersen-Ranberg et al., 2005). The following traits (and relative weights) were included in the breeding program in 1998: milk yield (21%), mastitis resistance (21%), udder conformation (11%), fertility (14%), growth rate (12%), conformation (6%), temperament (4%), diseases other than mastitis (3%), stillbirth (4%), and dystocia (4%; Geno Breeding and AI Association, 1998).
Estimated breeding values for the cows in the current lactation were obtained from the Norwegian Dairy Herd Record System and were estimated from the following formula: EBV = (I − 100) × 0.8 + 1/2 SBV + 1/4 MSBV + 1/8 SMMBV, where I = the milk index for the cow, SBV = EBV for the sire excluding milk traits, MSBV = EBV for the maternal grandsire excluding milk traits, and SMMBV = EBV for the sire of the maternal grandmother excluding milk traits. The EBV for the cows were −12.8, 3.6, and 6.2 for the LMP, HMP, and HI cows, respectively.
Management
The cows were milked twice daily. The breeding season started in early November and continued until February each year. The cows were on pasture from late May to early September. Only healthy untreated cows that calved during the indoor season were included in the study.
Milk Yield and Milk Progesterone
Milk weights were recorded on 3 consecutive days each week. The average weekly milk yield for the first 10 wk postpartum was calculated for each lactation. Milk progesterone concentrations were measured every Monday, Wednesday, and Friday from 1994 throughout 1998, and every Monday and Friday from 1999 to 2001, by an enzyme immunoassay (Waldmann, 1993), modi-fied by using the second antibody coating technique. The specificity of the antibody has been described pre-viously (Waldmann, 1999). The interassay coefficients of variation for milk progesterone concentrations of 1.48 and 19.66 ng/mL were 9.21 and 5.32%, respectively. The intraassay coefficient of variation was <10%. Milk progesterone concentrations were used to determine the interval from calving to C-LA. The interval from calving to C-LA was defined as the first 2 consecutive measurements of progesterone concentration >3 ng/mL more than 10 d after calving.
Concentrate Allocation
The cows were assigned group wise to different con-centrate rations such that the groups were similar in terms of BW, age, body condition, and selection line for milk production. The first-parity cows received either 5 or 9 kg/d of concentrate during peak lactation (until 90 DIM), whereas the second-parity cows received ei-ther 6.5 or 11 kg/d during peak lactation from 1994 to 1998. From 1999 to 2001, the cows were divided into 4 groups balanced for calving date and parity and which received 4, 8, 12, or 16 kg/d of concentrate during peak lactation.
Energy Requirements
The DM of the feed was determined weekly, and ash, CP, crude fat, crude fiber, and NDF content were calculated monthly according to standard procedures (AOAC, 1995). Protein degradability of roughage was measured in a composite feed sample collected over a 3-mo period. Protein degradability of concentrate was analyzed in a composite sample collected throughout the entire indoor feeding period. Digestibility of DM was assessed in trials conducted for each of the 2 main feeds (grass silage and concentrate; Madsen et al., 1995). Dry matter intake was calculated as DM offered minus DM refused, on 3 consecutive days in a week.
Energy content in dry matter and energy require-ments were calculated according to the Norwegian feeding value per unit of milk (FUM) system (Ekern, 1991), in which 1 FUM is equal to 6.9 MJ of NEL. En-ergy intake was calculated as FUMintake = DMI × food FUM concentration. Energy requirements are depen-dent upon maintenance, growth, and milk production according to the following formulae (Van Der Honing and Alderman, 1988):
Energy requirements = FUMmaintenance
+ FUMmilk + FUMgrowth
FUMmaintenance = 0.0424 × BW0.75,
where BW = body weight;
FUMmilk = 0.44 × ECM + 0.0007293 × ECM2,
where ECM = daily ECM yield [kg] = kg milk
× [0.25 + (0.122 × fat %) + 0.077 × protein %)]; and
FUMgrowth (first-parity cows) = 0.45.
2161GENETIC SELECTION FOR MILK YIELD AND LUTEAL ACTIVITY
Journal of Dairy Science Vol. 92 No. 5, 2009
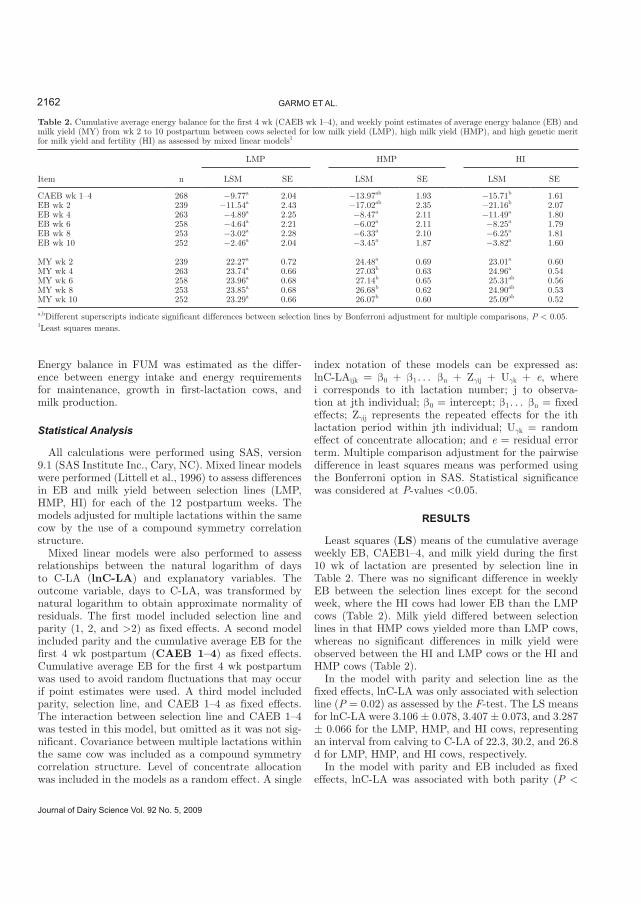
Energy balance in FUM was estimated as the differ-ence between energy intake and energy requirements for maintenance, growth in first-lactation cows, and milk production.
Statistical Analysis
All calculations were performed using SAS, version 9.1 (SAS Institute Inc., Cary, NC). Mixed linear models were performed (Littell et al., 1996) to assess differences in EB and milk yield between selection lines (LMP, HMP, HI) for each of the 12 postpartum weeks. The models adjusted for multiple lactations within the same cow by the use of a compound symmetry correlation structure.
Mixed linear models were also performed to assess relationships between the natural logarithm of days to C-LA (lnC-LA) and explanatory variables. The outcome variable, days to C-LA, was transformed by natural logarithm to obtain approximate normality of residuals. The first model included selection line and parity (1, 2, and >2) as fixed effects. A second model included parity and the cumulative average EB for the first 4 wk postpartum (CAEB 1–4) as fixed effects. Cumulative average EB for the first 4 wk postpartum was used to avoid random fluctuations that may occur if point estimates were used. A third model included parity, selection line, and CAEB 1–4 as fixed effects. The interaction between selection line and CAEB 1–4 was tested in this model, but omitted as it was not sig-nificant. Covariance between multiple lactations within the same cow was included as a compound symmetry correlation structure. Level of concentrate allocation was included in the models as a random effect. A single
index notation of these models can be expressed as: lnC-LAijk = β0 + β1… βn + Zγij + Uγk + e, where i corresponds to ith lactation number; j to observa-tion at jth individual; β0 = intercept; β1… βn = fixed effects; Zγij represents the repeated effects for the ith lactation period within jth individual; Uγk = random effect of concentrate allocation; and e = residual error term. Multiple comparison adjustment for the pairwise difference in least squares means was performed using the Bonferroni option in SAS. Statistical significance was considered at P-values <0.05.
RESULTS
Least squares (LS) means of the cumulative average weekly EB, CAEB1–4, and milk yield during the first 10 wk of lactation are presented by selection line in Table 2. There was no significant difference in weekly EB between the selection lines except for the second week, where the HI cows had lower EB than the LMP cows (Table 2). Milk yield differed between selection lines in that HMP cows yielded more than LMP cows, whereas no significant differences in milk yield were observed between the HI and LMP cows or the HI and HMP cows (Table 2).
In the model with parity and selection line as the fixed effects, lnC-LA was only associated with selection line (P = 0.02) as assessed by the F-test. The LS means for lnC-LA were 3.106 ± 0.078, 3.407 ± 0.073, and 3.287 ± 0.066 for the LMP, HMP, and HI cows, representing an interval from calving to C-LA of 22.3, 30.2, and 26.8 d for LMP, HMP, and HI cows, respectively.
In the model with parity and EB included as fixed effects, lnC-LA was associated with both parity (P <
Journal of Dairy Science Vol. 92 No. 5, 2009
GARMO ET AL.2162
Table 2. Cumulative average energy balance for the first 4 wk (CAEB wk 1–4), and weekly point estimates of average energy balance (EB) and milk yield (MY) from wk 2 to 10 postpartum between cows selected for low milk yield (LMP), high milk yield (HMP), and high genetic merit for milk yield and fertility (HI) as assessed by mixed linear models1
Item n
LMP HMP HI
LSM SE LSM SE LSM SE
CAEB wk 1–4 268 −9.77a 2.04 −13.97ab 1.93 −15.71b 1.61EB wk 2 239 −11.54a 2.43 −17.02ab 2.35 −21.16b 2.07EB wk 4 263 −4.89a 2.25 −8.47a 2.11 −11.49a 1.80EB wk 6 258 −4.64a 2.21 −6.02a 2.11 −8.25a 1.79EB wk 8 253 −3.02a 2.28 −6.33a 2.10 −6.25a 1.81EB wk 10 252 −2.46a 2.04 −3.45a 1.87 −3.82a 1.60
MY wk 2 239 22.27a 0.72 24.48a 0.69 23.01a 0.60MY wk 4 263 23.74a 0.66 27.03b 0.63 24.96a 0.54MY wk 6 258 23.96a 0.68 27.14b 0.65 25.31ab 0.56MY wk 8 253 23.85a 0.68 26.68b 0.62 24.90ab 0.53MY wk 10 252 23.29a 0.66 26.07b 0.60 25.09ab 0.52
a,bDifferent superscripts indicate significant differences between selection lines by Bonferroni adjustment for multiple comparisons, P < 0.05.1Least squares means.

0.01) and EB (P < 0.01). The LS means for lnC-LA were 3.402 ± 0.053, 3.205 ± 0.053, and 3.173 ± 0.081 for first parity, second parity, and >second parity, rep-resenting an interval from calving to C-LA of 30.0, 24.7, and 23.9 d for first parity, second parity, and >second parity, respectively. The estimate for EB in this model was −0.0098 ± 0.0019.
Associations between lnC-LA and the fixed effects selection line, parity, and EB in the third model are presented in Table 3. In this model, lnC-LA was associ-ated with parity (P < 0.01), selection line (P = 0.04), and EB (P < 0.01). The estimate for EB in this model was −0.0094 ± 0.0020. The LS means for days from calving to C-LA were 23.2, 29.7, and 25.6 d for the LMP, HMP, and HI cows, respectively, and 29.9, 24.5, and 24.0 d for first parity, second parity, and >second parity, respectively, when EB was included in the model in addition to parity and selection line.
The difference in C-LA between the HMP and LMP cows was 7.9 d when parity and selection line were in-cluded in the first model, but the difference between the HMP and LMP cows decreased to 6.5 d when phe-notypic differences in EB were accounted for in the model.
DISCUSSION
It has been emphasized that fertility should be in-cluded in breeding goals to reverse the trend of declin-ing fertility in dairy cows, because unfavorable genetic correlations exist between milk yield and reproductive performance (Veerkamp et al., 2001; Royal et al., 2002; Pryce et al., 2004). Currently, female fertility is included in selection indices in several other countries (VanRaden, 2004; Miglior et al., 2005). In the present study, cows selected for high milk yield had a longer in-
terval from calving to C-LA than cows selected for low milk yield, whereas the interval to C-LA was intermedi-ary in cows selected for both yield and fertility. Thus, less selection pressure for milk yield and more weight on fertility in a breeding program does not necessarily reduce milk yield substantially, despite the fact that an increase in C-LA per unit of PTA for milk yield is expected in high-producing cows (Royal et al., 2002).
There was a strong association between C-LA and EB that was of similar magnitude in the models with and without selection line included as a fixed effect. The interval to C-LA was reduced for the HMP and HI cows after adjustment for phenotypic differences in EB between the selection lines. This is in agreement with the unfavorable genetic correlations between milk yield and fertility reported in previous studies on both a phenotypic level (Gutierrez et al., 2006; Patton et al., 2007) and a genetic level (Veerkamp et al., 2001; Royal et al., 2002; Pryce et al., 2004), because the degree of negative EB stems from the milk yield in early lacta-tion and hence influences the interval to C-LA.
To our knowledge, the present study is the first to evaluate and compare C-LA in cows selected for low milk yield, high milk yield, or the combination of high indices for milk yield and fertility. By managing the cows in a single herd, phenotypic variation resulting from different management and feeding practices was minimized. Additionally, valuable information about the reproductive performance and milk production of Norwegian Red cows from the 3 different selection lines was obtained. The LMP cows may be used as a baseline, representing the phenotype between 1978 and 1979; HMP cows may be viewed as a phenotype representing reproductive performance and milk yield in Norwegian Red cows, in which selection has been more focused toward milk yield and less toward fertility and other functional traits; and the HI group can be considered as representative of current breeding objectives.
In previous experiments (Westwood et al., 2000; Gutierrez et al., 2006) and population studies (Royal et al., 2000) of differences in reproductive performance between cows with high and low genetic merit for milk yield, contemporary sires with breeding indices for high and low milk yield have been used. In the present study, sires of cows selected for low milk yield were dated back to progeny test results from 1978 and 1979, whereas the sires used for AI in cows selected for high milk yield were the 3 to 7 highest ranking proven sires for milk yield in the most recent group of progeny-tested Norwegian Red sires during each year of the study. Thus, cows expressing selection responses from 16 to 23 yr of breeding were housed and fed beside cows in which no selection responses could be expected since 1979, even though changes in gene frequency to some
2163GENETIC SELECTION FOR MILK YIELD AND LUTEAL ACTIVITY
Journal of Dairy Science Vol. 92 No. 5, 2009
Table 3. Associations between number of days to commencement of luteal activity (C-LA, natural logarithmic transformed) as assessed by a mixed linear model corrected for level of concentrate allocation as random effects variable and fixed effects variables; parity, selection lines for high (HMP), low (LMP) milk yield, and high genetic merit for milk yield and fertility (HI)
Item Least squares means SE Days to C-LA
Parity First parity 3.398a 0.052 29.9 Second parity 3.199b 0.054 24.5 >Second parity 3.178ab 0.081 24.0Selection line LMP 3.144a 0.074 23.2 HMP 3.390b 0.068 29.7 HI 3.241ab 0.063 25.6
a,bDifferent superscripts indicate significant differences between pari-ties or selection lines by Bonferroni adjustment for multiple compari-sons, P < 0.05.
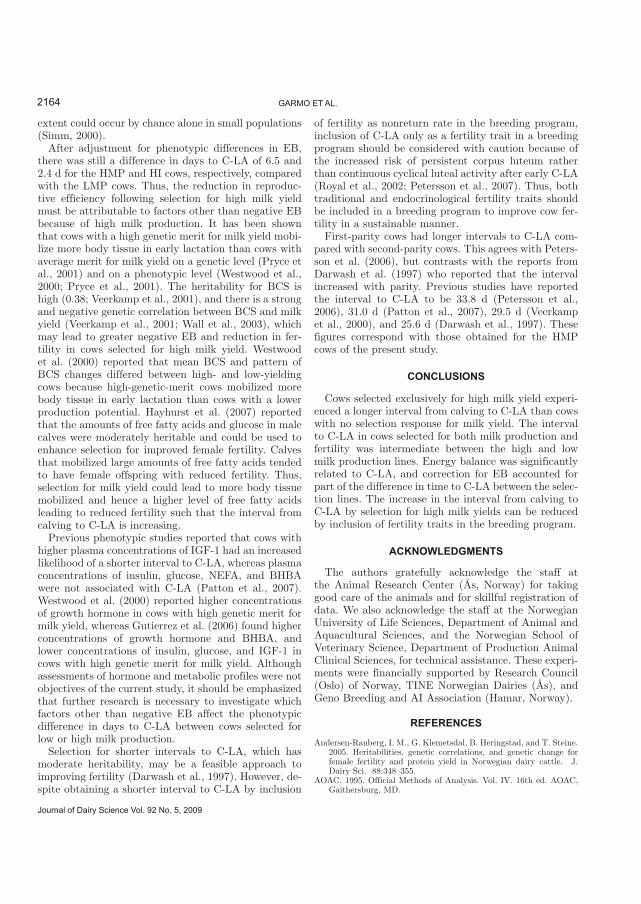
extent could occur by chance alone in small populations (Simm, 2000).
After adjustment for phenotypic differences in EB, there was still a difference in days to C-LA of 6.5 and 2.4 d for the HMP and HI cows, respectively, compared with the LMP cows. Thus, the reduction in reproduc-tive efficiency following selection for high milk yield must be attributable to factors other than negative EB because of high milk production. It has been shown that cows with a high genetic merit for milk yield mobi-lize more body tissue in early lactation than cows with average merit for milk yield on a genetic level (Pryce et al., 2001) and on a phenotypic level (Westwood et al., 2000; Pryce et al., 2001). The heritability for BCS is high (0.38; Veerkamp et al., 2001), and there is a strong and negative genetic correlation between BCS and milk yield (Veerkamp et al., 2001; Wall et al., 2003), which may lead to greater negative EB and reduction in fer-tility in cows selected for high milk yield. Westwood et al. (2000) reported that mean BCS and pattern of BCS changes differed between high- and low-yielding cows because high-genetic-merit cows mobilized more body tissue in early lactation than cows with a lower production potential. Hayhurst et al. (2007) reported that the amounts of free fatty acids and glucose in male calves were moderately heritable and could be used to enhance selection for improved female fertility. Calves that mobilized large amounts of free fatty acids tended to have female offspring with reduced fertility. Thus, selection for milk yield could lead to more body tissue mobilized and hence a higher level of free fatty acids leading to reduced fertility such that the interval from calving to C-LA is increasing.
Previous phenotypic studies reported that cows with higher plasma concentrations of IGF-1 had an increased likelihood of a shorter interval to C-LA, whereas plasma concentrations of insulin, glucose, NEFA, and BHBA were not associated with C-LA (Patton et al., 2007). Westwood et al. (2000) reported higher concentrations of growth hormone in cows with high genetic merit for milk yield, whereas Gutierrez et al. (2006) found higher concentrations of growth hormone and BHBA, and lower concentrations of insulin, glucose, and IGF-1 in cows with high genetic merit for milk yield. Although assessments of hormone and metabolic profiles were not objectives of the current study, it should be emphasized that further research is necessary to investigate which factors other than negative EB affect the phenotypic difference in days to C-LA between cows selected for low or high milk production.
Selection for shorter intervals to C-LA, which has moderate heritability, may be a feasible approach to improving fertility (Darwash et al., 1997). However, de-spite obtaining a shorter interval to C-LA by inclusion
of fertility as nonreturn rate in the breeding program, inclusion of C-LA only as a fertility trait in a breeding program should be considered with caution because of the increased risk of persistent corpus luteum rather than continuous cyclical luteal activity after early C-LA (Royal et al., 2002; Petersson et al., 2007). Thus, both traditional and endocrinological fertility traits should be included in a breeding program to improve cow fer-tility in a sustainable manner.
First-parity cows had longer intervals to C-LA com-pared with second-parity cows. This agrees with Peters-son et al. (2006), but contrasts with the reports from Darwash et al. (1997) who reported that the interval increased with parity. Previous studies have reported the interval to C-LA to be 33.8 d (Petersson et al., 2006), 31.0 d (Patton et al., 2007), 29.5 d (Veerkamp et al., 2000), and 25.6 d (Darwash et al., 1997). These figures correspond with those obtained for the HMP cows of the present study.
CONCLUSIONS
Cows selected exclusively for high milk yield experi-enced a longer interval from calving to C-LA than cows with no selection response for milk yield. The interval to C-LA in cows selected for both milk production and fertility was intermediate between the high and low milk production lines. Energy balance was significantly related to C-LA, and correction for EB accounted for part of the difference in time to C-LA between the selec-tion lines. The increase in the interval from calving to C-LA by selection for high milk yields can be reduced by inclusion of fertility traits in the breeding program.
ACKNOWLEDGMENTS
The authors gratefully acknowledge the staff at the Animal Research Center (Ås, Norway) for taking good care of the animals and for skillful registration of data. We also acknowledge the staff at the Norwegian University of Life Sciences, Department of Animal and Aquacultural Sciences, and the Norwegian School of Veterinary Science, Department of Production Animal Clinical Sciences, for technical assistance. These experi-ments were financially supported by Research Council (Oslo) of Norway, TINE Norwegian Dairies (Ås), and Geno Breeding and AI Association (Hamar, Norway).
REFERENCES
Andersen-Ranberg, I. M., G. Klemetsdal, B. Heringstad, and T. Steine. 2005. Heritabilities, genetic correlations, and genetic change for female fertility and protein yield in Norwegian dairy cattle. J. Dairy Sci. 88:348–355.
AOAC. 1995. Official Methods of Analysis. Vol. IV. 16th ed. AOAC, Gaithersburg, MD.
Journal of Dairy Science Vol. 92 No. 5, 2009
GARMO ET AL.2164

Butler, W. R. 2003. Energy balance relationships with follicular development, ovulation and fertility in postpartum dairy cows. Livest. Prod. Sci. 83:211–218.
Darwash, A. O., G. E. Lamming, and J. A. Woolliams. 1997. Estimation of genetic variation in the interval from calving to postpartum ovulation of dairy cows. J. Dairy Sci. 80:1227–1234.
Ekern, A. 1991. A new system of energy evaluation of food for ruminants. Norsk Landbruksforskning. 5:273–277.
Geno Breeding and AI Association. 1998. Annual report (In Norwegian). Geno Breeding and AI Association, Hamar, Norway.
Gutierrez, C. G., J. G. Gong, T. A. Bramley, and R. Webb. 2006. Selection on predicted breeding value for milk production delays ovulation independently of changes in follicular development, milk production and body weight. Anim. Reprod. Sci. 95:193–205.
Hayhurst, C., M. K. Sørensen, M. D. Royal, and P. Løvendahl. 2007. Metabolic regulation in Danish bull calves and the relationship to the fertility of their female offspring. J. Dairy Sci. 90:3909–3916.
Heringstad, B., G. Klemetsdal, and T. Steine. 2003. Selection responses for clinical mastitis and protein yield in two Norwegian dairy cattle selection experiments. J. Dairy Sci. 86:2990–2999.
Jamrozik, J., J. Fatehi, G. J. Kistemaker, and L. R. Schaeffer. 2005. Estimates of genetic parameters for Canadian Holstein female reproduction traits. J. Dairy Sci. 88:2199–2208.
Littell, R. C., G. A. Miliken, W. W. Stroup, and R. D. Wolfinger. 1996. SAS System for Mixed Models. SAS Institute Inc., Cary, NC.
Lucy, M. C. 2001. Reproductive loss in high-producing dairy cattle: Where will it end? J. Dairy Sci. 84:1277–1293.
MacKey, D. R., A. W. Gordon, M. A. McCoy, M. Verner, and C. S. Mayne. 2007. Associations between genetic merit for milk production and animal parameters and the fertility performance of dairy cows. Animal 1:29–43.
Madsen, J., T. Hvelpelund, M. R. Weisbjerg, J. Bertilson, I. Olsson, R. Spörndly, O. M. Harstad, H. Volden, M. Tuori, T. Varvikko, P. Huhtanen, and B. L. Olafsson. 1995. The AAT/PBV protein evaluation system for ruminants. A revision. Norw. J. Agric. Sci. (Suppl. 19).
Miglior, F., B. L. Muir, B. J. Muir, and J. Van Doormal. 2005. Selection indices in Holstein cattle of various countries. J. Dairy Sci. 88:1255–1263.
Patton, J., D. A. Kenny, S. McNamara, J. F. Mee, F. P. O’Mara, M. G. Diskin, and J. J. Murphy. 2007. Relationships among milk production, energy balance, plasma analytes, and reproduction in Holstein-Friesian cows. J. Dairy Sci. 90:649–658.
Petersson, K. J., B. Berglund, E. Strandberg, H. Gustafsson, A. P. F. Flint, J. A. Woolliams, and M. D. Royal. 2007. Genetic analysis of postpartum measures of luteal activity in dairy cows. J. Dairy Sci. 90:427–434.
Petersson, K. J., E. Strandberg, H. Gustafsson, and B. Berglund. 2006. Environmental effects on progesterone profile measures of dairy cow fertility. Anim. Reprod. Sci. 91:201–214.
Pryce, J. E., M. P. Coffey, and G. Simm. 2001. The relationship between body condition score and reproductive performance. J. Dairy Sci. 84:1508–1515.
Pryce, J. E., M. D. Royal, P. C. Garnsworthy, and I. L. Mao. 2004. Fertility in the high-producing dairy cow. Livest. Prod. Sci. 86:125–135.
Pryce, J. E., R. F. Veerkamp, R. Thompson, W. G. Hill, and G. Simm. 1997. Genetic aspects of common health disorders and measures of fertility in Holstein Friesian dairy cattle. Anim. Sci. 65:353–360.
Reksen, O., Y. T. Gröhn, O. S. Havrevoll, T. Bolstad, A. Waldmann, and E. Ropstad. 2001. Influence of concentrate allocation and energy balance on postpartum ovarian activity in Norwegian cattle. J. Dairy Sci. 84:1060–1068.
Royal, M. D., A. O. Darwash, A. P. F. Flint, R. Webb, J. A. Woolliams, and G. E. Lamming. 2000. Declining fertility in dairy cattle: changes in traditional and endocrine parameters of fertility. Anim. Sci. 70:487–501.
Royal, M. D., A. P. F. Flint, and J. A. Woolliams. 2002. Genetic and phenotypic relationships among endocrine and traditional fertility traits and production traits in Holstein-Friesian dairy cows. J. Dairy Sci. 85:958–967.
Simm, G. 2000. Genetic Improvement of Cattle and Sheep. 2nd ed. Farming Press, Tonbridge, UK.
Van Der Honing, Y., and G. Alderman. 1988. Feed evaluation systems and requirements. 2. Ruminants. Livest. Prod. Sci. 19:217–278.
VanRaden, P. M. 2004. Selection on net merit to improve lifetime profit. J. Dairy Sci. 87:3125–3131.
Veerkamp, R. F., E. P. C. Koenen, and G. De Jong. 2001. Genetic correlations among body condition score, yield, and fertility in first-parity cows estimated by random regression models. J. Dairy Sci. 84:2327–2335.
Veerkamp, R. F., J. K. Oldenbroek, H. J. Van Der Gaast, and J. H. J. Werf. 2000. Genetic correlation between days until start of luteal activity and milk yield, energy balance, and live weights. J. Dairy Sci. 83:577–583.
Waldmann, A. 1993. Enzyme immunoassay (EIA) for milk progesterone using a monoclonal antibody. Anim. Reprod. Sci. 34:19–30.
Waldmann, A. 1999. Monoclonal antibodies to progesterone: characterization and selection for enzyme immunoassay in bovine milk. Hybridoma 18:289–296.
Wall, E., S. Brotherstone, J. A. Woolliams, G. Banos, and M. P. Coffey. 2003. Genetic evaluation of fertility using direct and correlated traits. J. Dairy Sci. 86:4093–4102.
Westwood, C. T., I. J. Lean, J. K. Garvin, and P. C. Wynn. 2000. Effects of genetic merit and varying dietary protein degradability on lactating dairy cows. J. Dairy Sci. 83:2926–2940.
2165GENETIC SELECTION FOR MILK YIELD AND LUTEAL ACTIVITY
Journal of Dairy Science Vol. 92 No. 5, 2009


III


Characterization of progesterone profiles in fall-calving Norwegian Red cows R. T. Garmo ,*1 A. D. Martin ,* E. Thuen ,† Ø. Havrevoll ,‡ H. Steinshamn ,§ E. Prestløkken ,†# Å. Randby ,† M. Eknæs ,† A. Waldmann ,║ and O. Reksen * * Norwegian School of Veterinary Science, Department of Production Animal Clinical Sciences, PO Box 8146 Dep., NO-0033 Oslo, Norway † Norwegian University of Life Science, Department of Animal and Aquacultural Sciences, NO-1432 Ås, Norway ‡ Nortura Rudshøgda, PO Box 70, NO-2360 Rudshøgda, Norway § Norwegian Institute for Agricultural and Environmental Research, Organic Food and Farming Division, NO-6630 Tingvoll, Norway # Felleskjøpets Fôrutvikling, NO-7005 Trondheim, Norway ║Estonian University of Life Sciences, Institute of Veterinary Medicine and Animal Sciences, 62 Kreutzwaldi Street, 51014 Tartu, Estonia
ABSTRACT
Progesterone profiles in Norwegian Red cows were categorized, and associations between the occurrence of irregularities in the profiles and the commencement of luteal activity were investigated. The cows were man-aged in 3 feeding trials from 1994 to 2001 and from 2005 to 2008 at the Norwegian University of Life Sci-ences. The cows were followed from calving, and the milk samples collected represented 502 lactations from 302 cows. Milk samples for progesterone analysis were taken 3 times weekly from 1994 throughout 1998 and from 2005 to 2008 and 2 times weekly from 1999 to 2001. Commencement of luteal activity was defined as the first day of 2 consecutive measurements of proges-terone concentration ≥3 ng/mL not earlier than 10 d after calving. Delayed ovulation type I was defined as consistently low progesterone concentration, <3 ng/mL for ≥50 d postpartum. Delayed ovulation type II was defined as prolonged interluteal interval with milk pro-gesterone measurements <3 ng/mL for ≥12 d between 2 luteal phases. Persistent corpus luteum (PCL) type I was defined as delayed luteolysis with milk progesterone ≥3 ng/mL for ≥19 d during the first estrous cycle post-partum. Persistent corpus luteum type II was defined as delayed luteolysis with milk progesterone ≥3 ng/mL for ≥19 d during subsequent estrous cycles before first artificial insemination. Delayed ovulation type I was present in 14.7%, delayed ovulation type II in 2.8%, PCL type I in 6.7%, and PCL type II in 3.3% of the profiles. Commencement of luteal activity was related to milk yield, parity, PCL type I, and the summated occurrence of PCL type I and II. The least squares means for the interval to commencement of luteal ac-tivity were 24.2 d when PCL type I and II were present and 29.5 d when PCL type I and II were absent. The
likelihood of pregnancy to first service was not affected in cows with a history of PCL when artificial insemina-tion was carried out at progesterone concentrations <3 ng/mL (i.e., during estrus); however, cows that had experienced PCL were more likely to be inseminated during a luteal phase. The occurrence of delayed ovula-tion and PCL in Norwegian Red cows was less than that reported in most other dairy populations. Key words: progesterone profile , fertility , pregnancy , dairy cow
INTRODUCTION
The fertility of dairy cows has declined while milk yield has increased in recent decades (Lucy, 2001). The inclusion of fertility indices in dairy cattle breeding has been prioritized to avoid a further decline of fertility due to the unfavorable genetic correlations between milk yield and reproductive performance (Veerkamp et al., 2001; Royal et al., 2002; Pryce et al., 2004). In con-trast to the majority of countries, female fertility has been included in the total merit index in the Norwegian Red since 1972 (Andersen-Ranberg et al., 2005; Steine et al., 2008). The relative emphasis on fertility has been 8 to 15% throughout this period. The population-average pregnancy and calving percentage to first AI is estimated to be 61 and 54%, respectively, in this breed (Garmo et al., 2008).
Previous investigations of postpartum progesterone profiles in high-yielding Holstein cows reported the in-cidence of delayed first ovulation to be between 5.5 and 25.3%, cessation of ovarian activity between 3.3 and 12.9%, and persistent corpus luteum (PCL) between 7.3 and 35.2% (Opsomer et al., 2000; Royal et al., 2000; Shrestha et al., 2004; Petersson et al., 2006; Samarütel et al., 2008).
A previous study reported that cows with early com-mencement of luteal activity (C-LA) after calving have an increased probability for early AI, shorter interval to conception, and greater conception rate (Darwash et al., 1997a). However, it has also been reported that
J. Dairy Sci. 92 :4919–4928doi: 10.3168/jds.2009-2104 © American Dairy Science Association, 2009 .
4919
Received February 4, 2009. Accepted July 21, 2009. 1 Corresponding author: [email protected]

early C-LA is a risk factor for irregular luteal cyclicity in the form of PCL (Opsomer et al., 2000; Royal et al., 2002; Petersson et al., 2007) and that PCL is associated with a decrease in pregnancy to first AI (Royal et al., 2000; Shrestha et al., 2004). It has also been reported that delayed first ovulation and cessation of cyclical activity increase the calving interval (Petersson et al., 2006) and decrease the pregnancy to first AI (Royal et al., 2000).
Measurement of traditional fertility traits such as nonreturn rate and days to first AI (Garmo et al., 2008), as well as effect of selection for milk yield and fertility on the postpartum interval to C-LA, has been investigated previously in Norwegian Red cows (Garmo et al., 2009). Thus there has been no classification of progesterone patterns postpartum in the breed, and the relationship between the progesterone patterns, C-LA, and subsequent reproductive performance has not yet been investigated.
The objectives for the study were 1) to quantify the occurrence of typical and atypical progesterone profiles in Norwegian Red cows, 2) to assess the relationship between time to C-LA and the occurrence of PCL, and 3) to investigate cow- and management-specific factors related to the occurrence of PCL.
MATERIALS AND METHODS
The milk progesterone data set for the current study was derived from Norwegian Red cows managed in 3 feeding trials designed to assess the effects of different levels of concentrate and different quality of roughage on milk yield, energy balance, and reproduction at the Norwegian University of Life Sciences from 1994 to 2001 and from 2005 to 2008. Complete milk samples were obtained from 502 lactation periods. The distribution of lactations by parity was 180, 170, and 152 for first, second, and >second parity, respectively. The average 305-d milk yields for all lactations in the herd from 1998 to 2008 were 6,275, 7,144, and 7,733 kg for first, second, and >second lactation, respectively. The aver-age milk fat and milk protein in the bulk milk for 2007 were 4.08 and 3.32%, respectively. The herd consisted of 134 dairy cows in 2007.
Management
The cows were milked twice daily and housed in either the freestall or the tiestall barn. There were 495 lacta-tions with housing data: 344 lactations in the freestall barn and 151 in the tiestall barn. The breeding season started in November each year such that the voluntary waiting period varied between cows. The cows were on pasture from late May to early September each year.
Only cows that calved during the fall indoor season were included in the study. Skilled teaching veterinar-ians from the Ambulatory Practice at the Norwegian School of Veterinary Science performed all AI in the herd during the entire study period. Pregnancy was verified by rectal palpation by veterinarians approxi-mately 6 wk after AI. Cows that did not subsequently deliver a calf (n = 36) were regarded as pregnant to first AI if milk progesterone was <3 ng/mL at AI with a subsequent increase in progesterone content ≥3 ng/mL for at least 24 d after AI. The cows were not ex-posed to a synchronization program and did not receive any hormone treatment before C-LA. The frequencies of diagnosed reproductive disorders, clinical mastitis, and other diseases before C-LA are presented in Table 1. Estrus detection was performed daily by visual obser-vation in the morning, afternoon, and late evening. In addition, estrus observations were occasionally carried out during other routine work in the barn. All observa-tions were recorded on a designated 21-d calendar.
Feeding Protocol
The cows were assigned to different concentrate rations such that the groups were similar in terms of weight, age, and body condition at calving (Edmonson et al., 1989). There were 484 lactations with complete records on concentrate allocation. The distribution of concentrate allocation by parity during peak lactation is presented in Table 2. Cows were given ad libitum access to roughage. The distribution of the feedstuff in the herd in 2007 was 34% concentrate, 40% roughage, and 26% pasture.
Milk Yield and Milk Progesterone
The average weekly milk yield for the fourth week postpartum was calculated for 430 lactation periods. For an additional 54 lactations with missing records on weekly milk yield, records for monthly milk yield were obtained from the Norwegian Dairy Herd Record Sys-tem. The milk yield record closest to d 30 of lactation
Journal of Dairy Science Vol. 92 No. 10, 2009
GARMO ET AL.4920
Table 1. Frequency of reproductive and obstetrical conditions, mastitis, and other diseases before and after commencement of luteal activity (C-LA; n = 502)
ItemBefore C-LA
After C-LA
Reproductive and obstetrical conditions1 25 27Clinical mastitis 53 63Other diseases2 18 27
1Dystocia, retained placenta, metritis, vaginitis, cystic ovaries, abor-tion.2Laminitis, ketosis, indigestions, milk fever.

was used. Together, these 484 observations expressed the milk yield during the fourth week of lactation.
Milk progesterone concentrations were measured in a representative sample of whole milk collected during milking every Monday, Wednesday, and Friday from 1994 throughout 1998 (n = 232) and from 2005 to 2008 (n = 143) and every Monday and Friday from 1999 to 2001 (n = 127) by an enzyme immunoassay (Wald-mann, 1993) modified by using the second antibody coating technique. The specificity of the antibody has been described previously (Waldmann, 1999). The in-terassay coefficients of variation for milk progesterone concentrations of 1.48 and 19.66 ng/mL were 9.21 and 5.32%, respectively. The intraassay coefficient of varia-tion was less than 10%.
Definitions of DOV, C-LA, PCL, Luteal Phase, and Interovulatory Interval
Delayed ovulation (DOV) type I was defined as con-sistently low progesterone concentration (<3 ng/mL) for ≥50 d postpartum. Delayed ovulation type II was defined as prolonged interluteal interval with milk pro-gesterone measurements <3 ng/mL for ≥12 d between 2 luteal phases (Royal et al., 2000). There were 502 lactations with data for DOV type I or type II.
The interval from calving to C-LA was defined as the first day of the 2 consecutive measurements of milk pro-gesterone concentration ≥3 ng/mL (Royal et al., 2000) more than 10 d after calving. Of the 502 lactations, adequate data were available to identify C-LA in 497 lactations. The remaining 5 cows were removed from the herd before C-LA, and these cows had progesterone measurements until 56, 67, 100, 124, and 130 DIM.
Persistent corpus luteum type I, PCL type II, the length of the first luteal phase, and the first interovula-tory interval postpartum were measured according to the definitions by Royal et al. (2000). Persistent corpus luteum type I was defined as delayed luteolysis during the first estrous cycle postpartum with milk progester-one ≥3 ng/mL for ≥19 d, whereas PCL type II was defined as delayed luteolysis with milk progesterone ≥3 ng/mL for ≥19 d during subsequent estrous cycles before AI. The length of the first luteal phase was mea-sured as the time from the first sample of milk proges-
terone ≥3 ng/mL to the last consecutive progesterone sample ≥3 ng/mL (Royal et al., 2000). Among the 497 lactations that were available for the determination of C-LA, individual progesterone samples were missing for 8 lactation periods, and in 9 lactation periods, AI was performed at first estrus. Therefore, the length of the first luteal phase and PCL could be determined for 480 lactations. The same limitation also applies to the assessment of interovulatory intervals. In addition, one cow was culled after the first luteal phase but before the start of a new cycle, such that there were 479 lac-tations available for the calculation of interovulatory intervals. The length of the interovulatory intervals was considered to be a measurement of the total estrous cycle length and was defined as the interval between the milk progesterone rise (≥3 ng/mL) in one estrous cycle to the rise of milk progesterone (≥3 ng/mL) in the next cycle (Royal et al., 2000). The lengths of the luteal phases and interovulatory intervals were calcu-lated with and without profile abnormalities (DOV and PCL) included (Table 3).
Pregnancy to First AI Related to a Previous Episode of PCL
Of the 502 lactations included in the study, 476 were presented for AI after calving. Cows in which AI was performed in the luteal phase (n = 56) and one cow (n = 1) experiencing PCL after first AI were omitted. In addition, all profiles with abnormalities were excluded from the baseline control group, such that the occur-rence of PCL type I or the summated occurrence of PCL type I and II was compared with only normal progesterone profiles (n = 316).
AI During the Luteal Phase Related to a Previous Episode of PCL
The definition of first AI during a luteal phase was based on the progesterone measurements taken 2 or 3 times weekly. The exact determination of whether a cow was presented for first AI during the luteal phase was not possible in 26 cows because data on the pro-gesterone measurement within ±2 d to first AI were missing. These cows were omitted from the analysis. The progesterone measurement closest to AI was at the day for insemination for 37% of the cows, ±1 d for 54%, and ±2 d for 9% of the cows. In addition, the profiles were evaluated to confirm that these cows actu-ally were inseminated during the luteal phase. One cow that experienced PCL after first AI was also omitted. All profiles with abnormalities were excluded from the baseline control group in the analysis, such that the oc-currence of PCL type I, PCL type II, or the summated
4921PROGESTERONE PROFILES IN NORWEGIAN RED COWS
Journal of Dairy Science Vol. 92 No. 10, 2009
Table 2. Distribution of concentrate allocation (1 kg = 6.9 MJ) in peak lactation by parity from 1994 to 2008 (n = 484)
Concentrate (kg/d) First parity Second parity >Second parity
≤6 51 58 397–9 96 26 72≥10 24 79 39

occurrence of PCL type I and II was compared with only normal progesterone profiles (n = 335).
Statistical Analysis
Associations Between C-LA and PCL, Milk Yield, Parity, Housing, Year, and Disease Be-fore C-LA. Mixed linear models were performed using SPSS (SPSS Inc., 2006) to assess relationships between the natural logarithm of days to C-LA (lnC-LA) and the explanatory variables milk yield at the fourth week of lactation (MY), parity (first, second, >second), year of study (1994 to 1998, 1999 to 2001, and 2005 to 2007), housing (freestall or tiestall), disease treat-ment before C-LA (1/0), PCL type I (1/0), and the summated occurrence of PCL type I and II (1/0). The outcome variable days to C-LA was transformed by natural logarithm to obtain approximate normality of residuals. Explanatory variables associated with lnC-LA with P < 0.20 were included in an extended model. Level of concentrate was included in the model as a random effect. Covariance between multiple lactations within the same cow was accounted for by a compound symmetry correlation structure. Multiple comparison adjustment for the pairwise difference in least squares means (LS-means) was performed using the Bonfer-roni option in SPSS (SPSS Inc., 2006).
Associations Between PCL and MY, Concen-trate Allocation, Parity, Year, Housing, Disease Before C-LA, and DOV. The associations between the outcome PCL type I (1/0), PCL type II, or the
summated occurrence of PCL type I and II, and the explanatory variables were tested separately using a general estimating equation (GEE) approach in SPSS adjusted for multiple lactations within the same cow by the use of a compound symmetry correlation structure (SPSS Inc., 2006). The following variables were used when the likelihood of PCL in separate (univariate) models was evaluated: MY, concentrate allocation (≤6 kg, 7–9 kg, and ≥10 kg), parity (first, second, >second), year of study (1994 to 1998, 1999 to 2001, and 2005 to 2007), housing (freestall or tiestall), disease treatment before C-LA, and the summated occurrence of DOV type I and II (1/0). An extended model was not con-structed because year of trial was the only explanatory variable with P < 0.20.
Likelihood of Pregnancy to First AI Related to a Previous Episode of PCL. The associations between the likelihood of pregnancy to first AI (1/0) and the explanatory variables PCL type I, PCL type II, or the summated occurrence of PCL type I and II were tested separately using the GEE approach in SPSS (SPSS Inc., 2006). The associations were adjusted for multiple lactations within the same cow by the use of a compound symmetry correlation structure. The inter-val from calving to first AI was originally included in all models but omitted from the analyses because it was not associated with the outcome variable, pregnancy to first AI.
Likelihood of AI During the Luteal Phase Re-lated to a Previous Episode of PCL. The associa-tions between the likelihood of performing the first AI
Journal of Dairy Science Vol. 92 No. 10, 2009
GARMO ET AL.4922
Table 3. Number of lactations and means and 95% confidence intervals (CI) for the lengths of luteal phases and interovulatory intervals during the first 4 cycles postpartum in Norwegian Red cows presented with profile abnormalities (PCL1 and DOV2) included and excluded
Cycle no.
Luteal phase Interovulatory interval
n Mean 95% CI n Mean 95% CI
PCL and DOV included 1 4803 10.5a 9.7–11.3 4793 19.3a 18.4–20.2 2 376 12.5b 12.0–12.9 359 20.6b 20.3–21.0 3 261 12.4b 12.0–12.9 250 20.9b 20.4–21.3 4 153 12.5b 11.9–13.2 144 20.7b 20.1–21.3PCL and DOV excluded 1 3723 9.0a 8.5–9.4 3713 17.4a 16.9–18.0 2 300 12.3b 11.9–12.6 294 20.7b 20.3–21.1 3 210 11.9b 11.5–12.4 207 20.8b 20.3–21.2 4 124 12.2b 11.6–12.7 121 20.7b 20.1–21.4
a,bDifferent superscripts under luteal phase indicate significant differences between the lengths of the luteal phases based on the 95% CI. Different superscripts under interovulatory interval indicate significant differences between the interovulatory intervals based on the 95% CI.1PCL = persistent corpus luteum; PCL type I = delayed luteolysis with milk progesterone concentration ≥3 ng/mL for ≥19 d during the first estrous cycle postpartum; PCL type II = delayed luteolysis during estrous cycles after the first cycle postpartum.2DOV = delayed ovulation; DOV type I = prolonged anovulatory period with milk progesterone concentration <3 ng/mL for ≥50 d postpartum; DOV type II = prolonged interluteal interval with milk progesterone <3 ng/mL for ≥12 d between 2 luteal phases.3One cow was culled after first luteal phase but before start of a new estrous cycle.

during the luteal phase (progesterone concentration ≥3 ng/mL; 1/0) and the explanatory variables PCL type I, PCL type II, or the summated occurrence of PCL types I and II were tested separately using the GEE approach in SPSS (SPSS Inc., 2006). The associations were adjusted for multiple lactations within the same cow by the use of a compound symmetry correlation structure. Statistical significance was considered to be P < 0.05 for all analyses.
RESULTS
The overall average lnC-LA was 3.261 ± 0.025, rep-resenting an interval from calving to C-LA of 26.1 d. Average milk yields in the fourth week of lactation were 22.0, 27.2, and 30.1 kg for first, second, and >second parity, respectively.
Length of Luteal Phases and Interovulatory Intervals
Lengths of the first 4 luteal phases and interovula-tory intervals with PCL and DOV included and ex-cluded are presented in Table 3. Length of first luteal phase was shorter than the lengths of consecutive luteal phases. Length of first interovulatory interval, which is an estimate of estrous cycle length, was shorter in the first cycle compared with subsequent cycles.
Progesterone Profile Abnormalities
Delayed ovulation type I was present in 14.7% (74/502) of the lactations; n = 42, 22, and 10 in first, second, and >second parity, respectively. The length of DOV type I was 50 to 130 d, with a mean of 76.0 ± 2.4 d. Delayed ovulation type II was present in 2.8% (14/502) of the lactations; n = 5, 6, and 3 in first, second, and >second parity, respectively. The length of DOV type II was 12 to 101 d, with a mean of 30.9 ± 6.8 d. Five cows experienced both DOV type I and type II during the same lactation.
In total, PCL was present in 9.6% (46/480) of the lactations. Two cows experienced both types of PCL in the same lactation. Persistent corpus luteum type I was present in 6.7% (32/480) of lactations; n = 13, 9, and 10 for first, second, and >second parity, respectively. The length of PCL type I was 19 to 105 d, with a mean of 33.8 ± 3.2 d. Persistent corpus luteum type II was present in 3.3% (16/480) of lactations; n = 4, 4, and 8 for first, second, and >second parity, respectively. The length of PCL type II was 19 to 42 d, with a mean of 27.5 ± 2.2 d.
Three cows experienced both DOV type I and PCL type I during the same lactation, and one cow experi-enced both DOV type I and PCL type II during the same lactation.
Associations Between C-LA and MY, PCL, Parity, Year, Housing, and Disease Before C-LA
When the variable lnC-LA was tested against indi-vidual explanatory variables, P-values ≤0.20 (type III statistic) were calculated for MY (P = 0.03), parity (P < 0.01), housing (P < 0.01), the summated occurrence of PCL type I and II (P = 0.04), PCL type I (P = 0.08), and PCL type II (P = 0.18).
Associations between lnC-LA and the explanatory variables MY, parity, housing, and PCL (type I or the summated occurrence of PCL type I and II), when entered simultaneously in the extended mixed-model analysis, are presented in Table 4. In the type III sta-tistics F-test, lnC-LA was associated with MY (P < 0.01), parity (P < 0.01), housing (P = 0.01), and PCL type I (P = 0.01) or the summated occurrence of PCL type I and II (P = 0.02). In the model with PCL type I included as explanatory variable, the LS-means for lnC-LA were 3.141 ± 0.111 when PCL type I was pres-ent and 3.382 ± 0.065 when PCL type I was absent, representing an interval from calving to C-LA of 23.1 and 29.4 d, respectively. The LS-means for lnC-LA were 3.468 ± 0.090, 3.179 ± 0.085, and 3.137 ± 0.085, representing an interval from calving to C-LA of 32.1, 24.0, and 23.0 d for first, second, and >second parity, respectively. The LS-means for lnC-LA were 3.194 ± 0.079 (freestall) and 3.329 ± 0.087 (tiestall), represent-ing an interval from calving to C-LA of 24.4 and 27.9 d for freestall and tiestall, respectively.
In the model with the summated occurrence of PCL type I and II included as explanatory variable, the LS-means for lnC-LA were 3.187 ± 0.099 when PCL type I or II was present and 3.384 ± 0.065 when PCL type I or II was absent, representing an interval from calving to C-LA of 24.2 and 29.5 d, respectively. The LS-means for lnC-LA were 3.490 ± 0.087, 3.201 ± 0.080, and 3.165 ± 0.080 for first, second, and >second parity, representing an interval from calving to C-LA of 32.8, 24.6, and 23.7 d for first, second, and >second parity, respectively. The LS-means for lnC-LA were 3.216 ± 0.075 (freestall) and 3.355 ± 0.082 (tiestall), represent-ing an interval from calving to C-LA of 24.9 and 28.6 d for freestall and tiestall, respectively.
Associations Between the Likelihood of PCL and: MY, Concentrate Allocation, Parity, Year, Housing, DOV, and Disease Before C-LA
The separate GEE analyses on the relationships between the summated occurrence of PCL type I and II and the explanatory variables MY, concentrate al-location, parity, year, housing, the occurrence of DOV type I or II, and disease treatment before C-LA are pre-
4923PROGESTERONE PROFILES IN NORWEGIAN RED COWS
Journal of Dairy Science Vol. 92 No. 10, 2009

sented in Table 5. There were no associations between the summated occurrence of PCL type I and II and the predictors when assessed separately in the GEE analysis.
Likelihood of Pregnancy to First AI Related to a Previous Episode of PCL
Of 476 lactations presented for AI after calving, 256 (53.8%) resulted in pregnancy after first AI. Number of observations and odds ratios for pregnancy to first AI in cows that experienced PCL type I or the summated occurrence of PCL type I and II are presented in Table 6. There were no associations between the likelihood of pregnancy to first AI and a previous episode of PCL type I or the summated occurrence of PCL type I and II compared with cows with normal progesterone pro-files.
Likelihood of AI During the Luteal Phase Related to a Previous Episode of PCL
Overall, 12.4% (56/450) of the AI were performed dur-ing the luteal phase. Pregnancy to first AI was recorded to be 60.7% (239/394) in the 394 first AI performed when milk progesterone concentrations were known to be low. Associations between first AI during the luteal phase and the occurrence of PCL type I, PCL type II, or the summated occurrence of PCL types I and II are presented in Table 7. The likelihood of performing the first AI during the luteal phase was 6.8 times higher in cows with PCL type II and 3.2 times higher for the
summated occurrence of PCL type I and II compared with cows with normal progesterone profiles.
DISCUSSION
The feeding regimens and overall herd management employed in the current study reflect those commonly employed by Norwegian farmers. Thus, the results presented should give reliable information about luteal function in Norwegian Red cows. However, clinical tri-als differ from field environments, and this limitation should be taken into account when the findings of the study are interpreted.
The definitions of DOV and PCL and sample fre-quency in the current study are the same as used by Royal et al. (2000) and Petersson et al. (2007). In the studies conducted by Opsomer et al. (2000) and Shrest-ha et al. (2004), the definitions of DOV and PCL are slightly different but comparable with the definitions of the current study.
The occurrence of PCL was generally low in Nor-wegian Red compared with other dairy breeds studied (Opsomer et al., 1998; Royal et al., 2000; Shrestha et al., 2004; Samarütel et al., 2008). Whether this is related to the inclusion of female fertility in the breeding program since 1972 remains unknown (Andersen-Ranberg et al., 2005; Steine et al., 2008). However, population studies of reproductive performance in the breed have shown encouraging results (Garmo et al., 2008). The interval to C-LA and the effect of energy balance, parity, and genetic merit for milk yield and fertility in Norwegian Red cows has been described previously (Garmo et al.,
Journal of Dairy Science Vol. 92 No. 10, 2009
GARMO ET AL.4924
Table 4. Associations between number of days to commencement of luteal activity1 (natural logarithmic transformed) and the explanatory variables
Item
PCL type I2 PCL type I and II2
β SE P-value β SE P-value
First parity — — — — — —Second parity −0.290 0.060 <0.01 −0.289 0.060 <0.01>Second parity −0.331 0.072 <0.01 −0.325 0.072 <0.01PCL: no3 — — — — — —PCL: yes −0.241 0.093 0.01 −0.198 0.079 0.01Tiestall3 — — — — — —Freestall −0.136 0.05 0.01 −0.139 0.054 0.01MY 0.029 0.005 <0.01 0.029 0.005 <0.01Intercept 2.885 0.125 <0.01 2.893 0.125 <0.01
1Associations assessed in 2 separate multivariable mixed linear models corrected for level of concentrate al-location as random effect variable and adjusted for multiple lactations within the same cow by the use of a compound symmetry correlation matrix. Explanatory variables included in the models were parity, milk yield in the fourth week of lactation (MY), housing (freestall, tiestall), and persistent corpus luteum (PCL) type I or the summated occurrence of PCL type I and type II.2PCL type I = delayed luteolysis with milk progesterone concentration ≥3 ng/mL for ≥19 d during the first estrous cycle postpartum; PCL type II = delayed luteolysis during estrous cycles after the first cycle postpar-tum.3Categorical variables assigned as baselines.
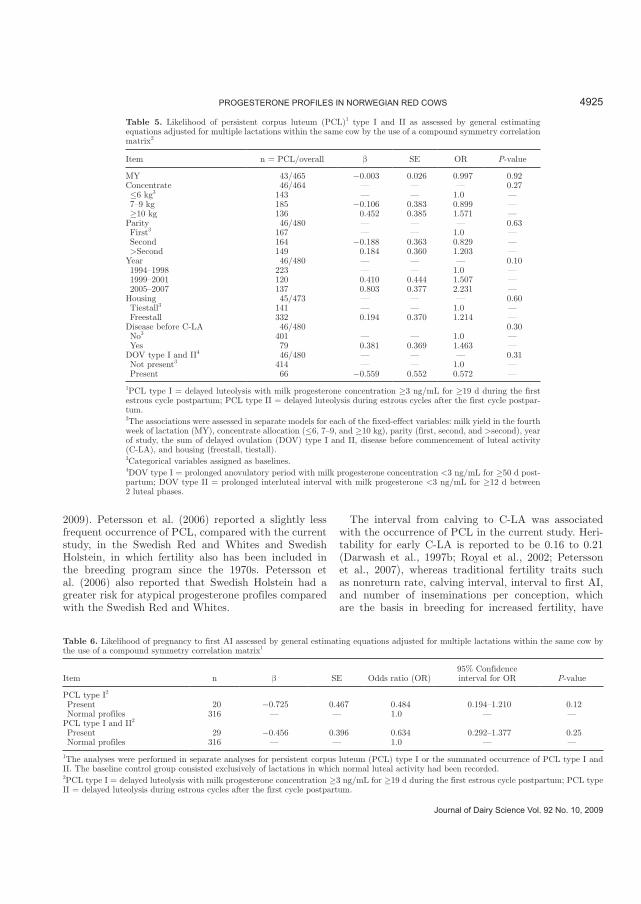
2009). Petersson et al. (2006) reported a slightly less frequent occurrence of PCL, compared with the current study, in the Swedish Red and Whites and Swedish Holstein, in which fertility also has been included in the breeding program since the 1970s. Petersson et al. (2006) also reported that Swedish Holstein had a greater risk for atypical progesterone profiles compared with the Swedish Red and Whites.
The interval from calving to C-LA was associated with the occurrence of PCL in the current study. Heri-tability for early C-LA is reported to be 0.16 to 0.21 (Darwash et al., 1997b; Royal et al., 2002; Petersson et al., 2007), whereas traditional fertility traits such as nonreturn rate, calving interval, interval to first AI, and number of inseminations per conception, which are the basis in breeding for increased fertility, have
4925PROGESTERONE PROFILES IN NORWEGIAN RED COWS
Journal of Dairy Science Vol. 92 No. 10, 2009
Table 5. Likelihood of persistent corpus luteum (PCL)1 type I and II as assessed by general estimating equations adjusted for multiple lactations within the same cow by the use of a compound symmetry correlation matrix2
Item n = PCL/overall β SE OR P-value
MY 43/465 −0.003 0.026 0.997 0.92Concentrate 46/464 — — — 0.27 ≤6 kg3 143 — — 1.0 — 7–9 kg 185 −0.106 0.383 0.899 — ≥10 kg 136 0.452 0.385 1.571 —Parity 46/480 — — — 0.63 First3 167 — — 1.0 — Second 164 −0.188 0.363 0.829 — >Second 149 0.184 0.360 1.203 —Year 46/480 — — — 0.10 1994–1998 223 — — 1.0 — 1999–2001 120 0.410 0.444 1.507 — 2005–2007 137 0.803 0.377 2.231 —Housing 45/473 — — — 0.60 Tiestall3 141 — — 1.0 — Freestall 332 0.194 0.370 1.214 —Disease before C-LA 46/480 0.30 No3 401 — — 1.0 — Yes 79 0.381 0.369 1.463 —DOV type I and II4 46/480 — — — 0.31 Not present3 414 — — 1.0 — Present 66 −0.559 0.552 0.572 —
1PCL type I = delayed luteolysis with milk progesterone concentration ≥3 ng/mL for ≥19 d during the first estrous cycle postpartum; PCL type II = delayed luteolysis during estrous cycles after the first cycle postpar-tum.2The associations were assessed in separate models for each of the fixed-effect variables: milk yield in the fourth week of lactation (MY), concentrate allocation (≤6, 7–9, and ≥10 kg), parity (first, second, and >second), year of study, the sum of delayed ovulation (DOV) type I and II, disease before commencement of luteal activity (C-LA), and housing (freestall, tiestall).3Categorical variables assigned as baselines.4DOV type I = prolonged anovulatory period with milk progesterone concentration <3 ng/mL for ≥50 d post-partum; DOV type II = prolonged interluteal interval with milk progesterone <3 ng/mL for ≥12 d between 2 luteal phases.
Table 6. Likelihood of pregnancy to first AI assessed by general estimating equations adjusted for multiple lactations within the same cow by the use of a compound symmetry correlation matrix1
Item n β SE Odds ratio (OR)95% Confidence interval for OR P-value
PCL type I2
Present 20 −0.725 0.467 0.484 0.194–1.210 0.12 Normal profiles 316 — — 1.0 — —PCL type I and II2
Present 29 −0.456 0.396 0.634 0.292–1.377 0.25 Normal profiles 316 — — 1.0 — —
1The analyses were performed in separate analyses for persistent corpus luteum (PCL) type I or the summated occurrence of PCL type I and II. The baseline control group consisted exclusively of lactations in which normal luteal activity had been recorded.2PCL type I = delayed luteolysis with milk progesterone concentration ≥3 ng/mL for ≥19 d during the first estrous cycle postpartum; PCL type II = delayed luteolysis during estrous cycles after the first cycle postpartum.

heritabilities from 0.018 to 0.040 (Pryce et al., 1997; Wall et al., 2003; Jamrozik et al., 2005). Selection for shorter intervals to C-LA, which has a moderate herita-bility, may be a feasible approach to improving fertility (Darwash et al., 1997b). However, inclusion of C-LA only as a fertility trait in a breeding program should be considered with caution because of the increased risk of PCL rather than continuous cyclical luteal activ-ity after early C-LA (Opsomer et al., 2000; Royal et al., 2002; Petersson et al., 2007). In the current study, the interval to C-LA was approximately 5 d shorter in cows that subsequently experienced PCL, which dem-onstrates the importance of elucidating the potential negative side effects of breeding for early C-LA.
A previous episode of PCL was not associated with the likelihood of pregnancy to first insemination in cows that were inseminated while having low proges-terone levels. The latter is in contrast with both Royal et al. (2000), who reported PCL to be associated with a decrease in pregnancy to first AI, and Shrestha et al. (2004), who reported a lower pregnancy rate within 100 DIM. However, cows experiencing PCL were more likely to be inseminated during the luteal phase, which might explain the results obtained in previous stud-ies of associations between pregnancy rate and PCL by Royal et al. (2000) and Shrestha et al. (2004). To our knowledge, the relationship between the increased likelihood of insemination during the luteal phase and the occurrence of PCL has not been reported before. The occurrence of PCL type II was highly significantly associated, whereas PCL type I showed a tendency to be associated with the likelihood of AI during the luteal phase. Cows that experienced PCL type II could have expressed signs of estrus during a previous cycle and, hence, presented for insemination at the expected time for the following estrus. Another reason could be altered behavior in these animals because of ovarian
pathology (Vanholder et al., 2006). First AI was per-formed during the luteal phase in 12.4% of the lacta-tions, which is greater than the population estimate of 4.4% (Andresen and Onstad, 1979) and 4.9% (Garmo et al., 2008) in Norwegian Red cows.
There were no associations between the occurrence of PCL and milk yield, concentrate allocation, parity, year of trial, disease before C-LA, or DOV. Windig et al. (2008) could not find an association between prolonged luteal activity and milk production. Pollott and Cof-fey (2008) reported a greater-than-expected number of PCL type II in cows fed high levels of concentrate, and genetic line did not affect the occurrence of PCL type I or type II. Parity was not associated with the oc-currence of PCL in the current study, which contrasts with Opsomer et al. (2000), who reported parity to be a risk factor for prolonged luteal phases. Opsomer et al. (2000) reported that the most important risks for delayed luteolysis were early C-LA, occurrence of metritis, retained placenta, calving problems, and ab-normal vaginal discharge. Petersson et al. (2006) also reported endometritis to be a risk factor for PCL. Thus, prolonged luteal phases could be the result of uterine problems rather than ovarian pathology. It has been suggested that ovulation before complete uterine invo-lution might increase the risk of developing pyometra (Opsomer et al., 2000). In the current study, the low occurrence of PCL could partly be explained by the very low number of puerperal problems in the cows included. This corresponds well with the population of Norwegian Red cows in which the incidence rates per 100 cow-years in 2005 were 1.2, 3.1, 0.2, and 0.9 for dystocia; retained placenta; abortion; and metritis, vaginitis or salphangitis, respectively (Østerås et al., 2007).
Delayed ovulation type I was present in 14.7% of the profiles, which was less than in some previous studies
Journal of Dairy Science Vol. 92 No. 10, 2009
GARMO ET AL.4926
Table 7. Likelihood of performing first AI during the luteal phase (progesterone ≥3 ng/mL) assessed by general estimating equation adjusted for multiple lactations within the same cow by the use of a compound symmetry correlation matrix1
Item n β SEOdds ratio
(OR)95% Confidence interval for OR P-value
PCL type I2
Present 25 0.915 0.512 2.498 0.916–6.811 0.07 Normal profiles 335 — — 1.0 — —PCL type II2
Present 11 1.921 0.627 6.826 1.996–23.349 <0.01 Normal profiles 335 — — 1.0 — —PCL type I and II2
Present 38 1.193 0.378 3.295 1.570–6.916 <0.01 Normal profiles 335 — — 1.0 — —
1The analyses were performed in separate analyses for persistent corpus luteum (PCL) type I, PCL type II, or the summated occurrence of PCL type I and II. The baseline control group consisted exclusively of lactations in which normal luteal activity had been recorded.2PCL type I = delayed luteolysis with milk progesterone concentration ≥3 ng/mL for ≥19 d during the first estrous cycle postpartum; PCL type II = delayed luteolysis during estrous cycles after the first cycle postpartum.

of Holstein cows in which DOV type I was reported to be 25.3% (Samarütel et al., 2008) and 20.5% (Opsomer et al., 1998), whereas an estimate of 15.6% was found in Swedish Holstein and Swedish Red and Whites (Pe-tersson et al., 2006). However, Shrestha et al. (2004) reported the proportion of DOV type I to be 13.2%, whereas Royal et al. (2000) reported 10.9 and 12.9% from 1975 to 1982 and from 1995 to 1998, respectively. In the current study, DOV type II occurred in only 2.8% of the profiles. The incidence agrees with previous studies in Holstein cows that reported the proportion of DOV type II to be 4.2 (Samarütel et al., 2008), 3.3 (Shrestha et al., 2004), and 3.0% (Opsomer et al., 1998) but is less than the DOV type II estimates of 12.9 and 6.6% reported by Royal et al. (2000) and Petersson et al. (2006), respectively.
Length of first luteal phases (10.5 d) agreed with Royal et al. (2000), who reported the length of first luteal phase to be 10.8 d in British Friesian from 1975 to 1982. The same study reported the length of first luteal phase to be 14.6 d from 1995 to 1998 after there had been a large breed substitution of British Friesian with North American Holstein and a significant increase in milk yield in the population.
Length of first interovulatory interval, a measure of the estrous cycle length, was 17.4 and 19.3 d when profiles with abnormalities were excluded and included, respectively. First interovulatory interval was shorter in the first cycle compared with consecutive cycles (20.6 to 20.7 d) in cows with normal profiles. Royal et al. (2000) reported increased length of first interovulatory interval from 18.9 d (1975 to 1982) to 22.5 d (1995 to 1998) when both normal and abnormal profiles were included. Fonseca et al. (1983) reported the length of the first estrous cycle to be 17.1 d and the length of the second estrous cycle to be 21.4 d in Holstein cows in North Carolina when only normal cows were included. Thus, the current length of the estrous cycles, with or without abnormalities, in Norwegian Red cows corre-sponds well with estrous cycle length observed in the Holstein breed 25 years ago. For future estimates of estrous cycle length, it is feasible to investigate cycle length with profile abnormalities included and exclud-ed. This would provide a more reliable assessment of whether the increased cycle length is due to PCL and DOV type II or other causes.
CONCLUSIONS
The occurrence of DOV and PCL in Norwegian Red cows in the current study is less frequent than that reported in most other dairy populations. Cows expe-riencing PCL had shorter interval to C-LA. The occur-rence of PCL did not affect pregnancy to first AI when
AI was performed at low progesterone concentrations, but cows with PCL were more likely to experience AI during a luteal phase.
ACKNOWLEDGMENTS
The authors gratefully acknowledge the staff at the Norwegian University of Life Sciences, Animal Produc-tion Experimental Center, Ås, for taking good care of the animals and for skillful registration of data. We also acknowledge the staff at the Norwegian University of Life Sciences, Department of Animal and Aquacultural Sciences, Ås, and the Norwegian School of Veterinary Science, Department of Production Animal Clinical Sciences, Oslo, for technical assistance. Support for the preparation of the antiprogesterone monoclonal antibody and the progesterone peroxidase conjugate was provided by the Estonian Science Foundation (Tal-linn). These experiments were financially supported by Research Council (Oslo) of Norway, TINE Norwegian Dairies (Ås), and GENO Breeding and AI Association (Hamar, Norway).
REFERENCES
Andersen-Ranberg, I. M., G. Klemetsdal, B. Heringstad, and T. Steine. 2005. Heritabilities, genetic correlations, and genetic change for female fertility and protein yield in Norwegian dairy cattle. J. Dairy Sci. 88:348–355.
Andresen, Ø., and O. Onstad. 1979. Brunstkontroll og drektighetskontroll hos ku ved hjelp av progesteronbestemmelse i melk (Estrus detection and pregnancy testing in the cow using the milk progesterone test). Nor. Vet. Tidsskr. 91:411–421.
Darwash, A. O., G. E. Lamming, and J. A. Woolliams. 1997a. The phenotypic association between the interval to past-partum ovulation and traditional measures of fertility in dairy cattle. Anim. Sci. 65:9–16.
Darwash, A. O., G. E. Lamming, and J. A. Woolliams. 1997b. Estimation of genetic variation in the interval from calving to postpartum ovulation of dairy cows. J. Dairy Sci. 80:1227–1234.
Edmonson, A. J., I. J. Lean, L. D. Weaver, T. Farver, and G. Webster. 1989. A body condition scoring chart for Holstein dairy cows. J. Dairy Sci. 72:68–78.
Fonseca, F. A., J. H. Britt, B. T. McDaniel, J. C. Wilk, and A. H. Rakes. 1983. Reproductive traits of Holsteins and Jerseys: Effects of age, milk yield, and clinical abnormalities on involution of cervix and uterus, ovulation, estrous cycles, detection of estrus, conception rate, and days open. J. Dairy Sci. 66:1128–1147.
Garmo, R. T., A. O. Refsdal, K. Karlberg, E. Ropstad, A. Waldmann, J. F. Beckers, and O. Reksen. 2008. Pregnancy incidence in Norwegian Red cows using nonreturn to estrus, rectal palpation, pregnancy-associated glycoproteins, and progesterone. J. Dairy Sci. 91:3025–3033.
Garmo, R. T., E. Ropstad, Ø. Havrevoll, E. Thuen, H. Steinshamn, A. Waldmann, and O. Reksen. 2009. Commencement of luteal activity in three different selection lines for milk yield and fertility in Norwegian Red cows. J. Dairy Sci. 92:2159–2165.
Jamrozik, J., J. Fatehi, G. J. Kistemaker, and L. R. Schaeffer. 2005. Estimates of genetic parameters for Canadian Holstein female reproduction traits. J. Dairy Sci. 88:2199–2208.
Lucy, M. C. 2001. Reproductive loss in high-producing dairy cattle: Where will it end? J. Dairy Sci. 84:1277–1293.
Opsomer, G., M. Coryn, H. Deluyker, and A. de Kruif. 1998. An analysis of ovarian dysfunction in high yielding dairy cows after
4927PROGESTERONE PROFILES IN NORWEGIAN RED COWS
Journal of Dairy Science Vol. 92 No. 10, 2009

calving based on progesterone profiles. Reprod. Domest. Anim. 33:193–204.
Opsomer, G., Y. T. Grohn, J. Hertl, M. Coryn, H. Deluyker, and A. de Kruif. 2000. Risk factors for post partum ovarian dysfunction in high producing dairy cows in Belgium: A field study. Theriogenology 53:841–857.
Østerås, O., H. Solbu, A. O. Refsdal, T. Roalkvam, O. Filseth, and A. Minsaas. 2007. Results and evaluation of thirty years of health recordings in the Norwegian dairy cattle population. J. Dairy Sci. 90:4483–4497.
Petersson, K. J., B. Berglund, E. Strandberg, H. Gustafsson, A. P. F. Flint, J. A. Woolliams, and M. D. Royal. 2007. Genetic analysis of postpartum measures of luteal activity in dairy cows. J. Dairy Sci. 90:427–434.
Petersson, K. J., H. Gustafsson, E. Strandberg, and B. Berglund. 2006. Atypical progesterone profiles and fertility in Swedish dairy cows. J. Dairy Sci. 89:2529–2538.
Pollott, G. E., and M. P. Coffey. 2008. The effect of genetic merit and production system on dairy cow fertility, measured using progesterone profiles and on-farm recording. J. Dairy Sci. 91:3649–3660.
Pryce, J. E., M. D. Royal, P. C. Garnsworthy, and I. L. Mao. 2004. Fertility in the high-producing dairy cow. Livest. Prod. Sci. 86:125–135.
Pryce, J. E., R. F. Veerkamp, R. Thompson, W. G. Hill, and G. Simm. 1997. Genetic aspects of common health disorders and measures of fertility in Holstein Friesian dairy cattle. Anim. Sci. 65:353–360.
Royal, M. D., A. O. Darwash, A. P. F. Flint, R. Webb, J. A. Woolliams, and G. E. Lamming. 2000. Declining fertility in dairy cattle: Changes in traditional and endocrine parameters of fertility. Anim. Sci. 70:487–501.
Royal, M. D., A. P. F. Flint, and J. A. Woolliams. 2002. Genetic and phenotypic relationships among endocrine and traditional fertility traits and production traits in Holstein-Friesian dairy cows. J. Dairy Sci. 85:958–967.
Samarütel, J., K. Ling, A. Waldmann, H. Jaakson, T. Kaart, and A. Leesmäe. 2008. Field trial on progesterone cycles, metabolic profiles, body condition score and their relation to fertility in Estonian Holstein dairy cows. Reprod. Domest. Anim. 43:457–463.
Shrestha, H. K., T. Nakao, T. Suzuki, T. Higaki, and M. Akita. 2004. Effects of abnormal ovarian cycles during pre-service period postpartum on subsequent reproductive performance of high-producing Holstein cows. Theriogenology 61:1559–1571.
SPSS Inc. 2006. SPSS Advanced Models15.0. SPSS Inc., Chicago, IL.Steine, G., D. Kristofersson, and A. G. Guttormsen. 2008. Economic
evaluation of the breeding goal for Norwegian Red dairy cattle. J. Dairy Sci. 91:418–426.
Vanholder, T., G. Opsomer, and A. de Kruif. 2006. Aetiology and pathogenesis of the cystic ovarian follicles in dairy cattle: A review. Reprod. Nutr. Dev. 46:105–119.
Veerkamp, R. F., E. P. C. Koenen, and G. De Jong. 2001. Genetic correlations among body condition score, yield, and fertility in first-parity cows estimated by random regression models. J. Dairy Sci. 84:2327–2335.
Waldmann, A. 1993. Enzyme immunoassay (EIA) for milk progesterone using a monoclonal antibody. Anim. Reprod. Sci. 34:19–30.
Waldmann, A. 1999. Monoclonal antibodies to progesterone: Characterization and selection for enzyme immunoassay in bovine milk. Hybridoma 18:289–296.
Wall, E., S. Brotherstone, J. A. Woolliams, G. Banos, and M. P. Coffey. 2003. Genetic evaluation of fertility using direct and correlated traits. J. Dairy Sci. 86:4093–4102.
Windig, J. J., B. Beerda, and R. F. Veerkamp. 2008. Relationship between milk progesterone profiles and genetic merit for milk production, milking frequency, and feeding regimen in dairy cattle. J. Dairy Sci. 91:2874–2884.
Journal of Dairy Science Vol. 92 No. 10, 2009
GARMO ET AL.4928

IV


1
Reproductive Performance, Udder Health, and Antibiotic Resistance in Mastitis
Bacteria isolated from Norwegian Red cows in Conventional and Organic Farming
R. T. Garmo* 1, S. Waage1, S. Sviland 2, B. I. F. Henriksen 3, O. Østerås1, and O.
Reksen1
1 Norwegian School of Veterinary Science, Department of Production Animal Clinical
Sciences, P.O. Box 8146 Dep., NO-0033 Oslo, Norway 2 National Veterinary Institute, NO- 0106 Oslo, Norway 3 Norwegian Institute for Agricultural and Environmental research, Organic Food and
Farming Division, NO-6630 Tingvoll, Norway
E-mail: Randi Therese Garmo- [email protected]; Steinar Waage-
[email protected]; Ståle Sviland- [email protected]; Britt. I. F. Henriksen-
[email protected]; Olav Østerås- [email protected]; Olav Reksen-
__________________________
* Corresponding author: Randi Therese Garmo, Department of Production Animal Clinical
Sciences, Norwegian School of Veterinary Science, P.O. Box 8146 Dep., NO-0033 Oslo,
Norway
Phone: + 47 22 96 45 00
Fax: + 47 22 59 70 83
E-mail: [email protected]
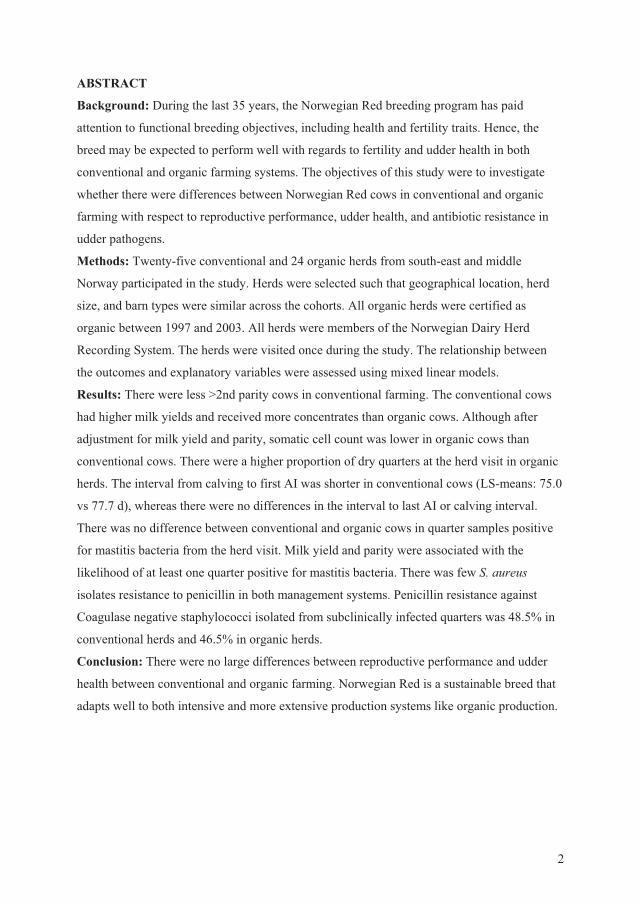
2
ABSTRACT
Background: During the last 35 years, the Norwegian Red breeding program has paid
attention to functional breeding objectives, including health and fertility traits. Hence, the
breed may be expected to perform well with regards to fertility and udder health in both
conventional and organic farming systems. The objectives of this study were to investigate
whether there were differences between Norwegian Red cows in conventional and organic
farming with respect to reproductive performance, udder health, and antibiotic resistance in
udder pathogens.
Methods: Twenty-five conventional and 24 organic herds from south-east and middle
Norway participated in the study. Herds were selected such that geographical location, herd
size, and barn types were similar across the cohorts. All organic herds were certified as
organic between 1997 and 2003. All herds were members of the Norwegian Dairy Herd
Recording System. The herds were visited once during the study. The relationship between
the outcomes and explanatory variables were assessed using mixed linear models.
Results: There were less >2nd parity cows in conventional farming. The conventional cows
had higher milk yields and received more concentrates than organic cows. Although after
adjustment for milk yield and parity, somatic cell count was lower in organic cows than
conventional cows. There were a higher proportion of dry quarters at the herd visit in organic
herds. The interval from calving to first AI was shorter in conventional cows (LS-means: 75.0
vs 77.7 d), whereas there were no differences in the interval to last AI or calving interval.
There was no difference between conventional and organic cows in quarter samples positive
for mastitis bacteria from the herd visit. Milk yield and parity were associated with the
likelihood of at least one quarter positive for mastitis bacteria. There was few S. aureus
isolates resistance to penicillin in both management systems. Penicillin resistance against
Coagulase negative staphylococci isolated from subclinically infected quarters was 48.5% in
conventional herds and 46.5% in organic herds.
Conclusion: There were no large differences between reproductive performance and udder
health between conventional and organic farming. Norwegian Red is a sustainable breed that
adapts well to both intensive and more extensive production systems like organic production.
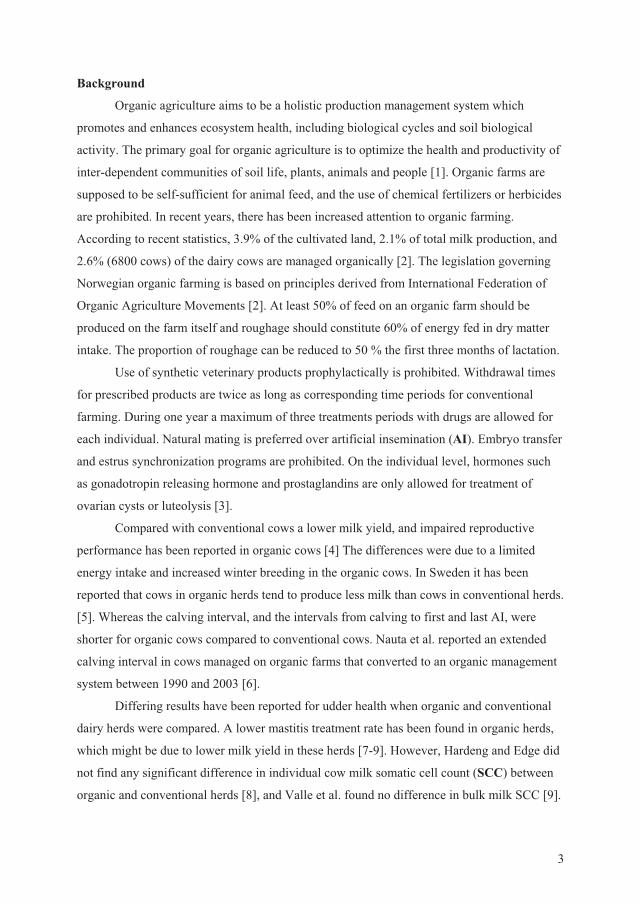
3
Background
Organic agriculture aims to be a holistic production management system which
promotes and enhances ecosystem health, including biological cycles and soil biological
activity. The primary goal for organic agriculture is to optimize the health and productivity of
inter-dependent communities of soil life, plants, animals and people [1]. Organic farms are
supposed to be self-sufficient for animal feed, and the use of chemical fertilizers or herbicides
are prohibited. In recent years, there has been increased attention to organic farming.
According to recent statistics, 3.9% of the cultivated land, 2.1% of total milk production, and
2.6% (6800 cows) of the dairy cows are managed organically [2]. The legislation governing
Norwegian organic farming is based on principles derived from International Federation of
Organic Agriculture Movements [2]. At least 50% of feed on an organic farm should be
produced on the farm itself and roughage should constitute 60% of energy fed in dry matter
intake. The proportion of roughage can be reduced to 50 % the first three months of lactation.
Use of synthetic veterinary products prophylactically is prohibited. Withdrawal times
for prescribed products are twice as long as corresponding time periods for conventional
farming. During one year a maximum of three treatments periods with drugs are allowed for
each individual. Natural mating is preferred over artificial insemination (AI). Embryo transfer
and estrus synchronization programs are prohibited. On the individual level, hormones such
as gonadotropin releasing hormone and prostaglandins are only allowed for treatment of
ovarian cysts or luteolysis [3].
Compared with conventional cows a lower milk yield, and impaired reproductive
performance has been reported in organic cows [4] The differences were due to a limited
energy intake and increased winter breeding in the organic cows. In Sweden it has been
reported that cows in organic herds tend to produce less milk than cows in conventional herds.
[5]. Whereas the calving interval, and the intervals from calving to first and last AI, were
shorter for organic cows compared to conventional cows. Nauta et al. reported an extended
calving interval in cows managed on organic farms that converted to an organic management
system between 1990 and 2003 [6].
Differing results have been reported for udder health when organic and conventional
dairy herds were compared. A lower mastitis treatment rate has been found in organic herds,
which might be due to lower milk yield in these herds [7-9]. However, Hardeng and Edge did
not find any significant difference in individual cow milk somatic cell count (SCC) between
organic and conventional herds [8], and Valle et al. found no difference in bulk milk SCC [9].

4
The lower treatment rate and, thus, reduced use of antibiotics, may reduce antibacterial
selection pressure. A few studies have been carried out comparing the occurrence of antibiotic
resistant udder pathogens in organic and conventional farming [10-12]. Roesch et al. reported
no difference in antibiotic resistance [12], Tikofsky et al. (2003) found good susceptibility to
the most commonly used antibiotics [10], and Sato et al. (2004) reported small differences
between conventional and organic farming [11].
The FAO has characterized the Norwegian Red as a sustainable breed [13]. From the
1970s the breeding program has included health, fertility and functional traits, along with the
production traits of milk yield and growth. Currently, 10 traits are included in the total merit
index. The following traits (and relative weights) were included in the breeding program in
2008; milk yield (24%), mastitis resistance (22%), milk fever, ketosis, and retained placenta
(2%), fertility (15%), udder (15%), leg confirmation (6%), growth rate (9%), temperament
(4%), calving ease (1%), and still birth (1%) [14].
The relationship between selection for milk yield and reproductive performance and
time to onset of luteal activity post partum has been investigated previously [15]. Cows
selected exclusively for high milk yield had a longer interval to the commencement of luteal
activity after calving than cows bred according to other breeding objectives. A prolonged
period of ovarian quiescence was found to be reduced if selection for milk yield was
combined with fertility in the breeding program. Rozzi et al. reported that organic farmers
emphasized functional traits rather than production traits in Holstein cows [16]. For
Norwegian Red cows, it is reported that it is possible to obtain genetic improvement for
clinical mastitis and milk yield simultaneously if the traits are given sufficient weight in
selection [17] and that selection against clinical mastitis is favorable correlated with selection
responses for ketosis and retained placenta [18]. Since the breeding program for the
Norwegian Red has paid attention to fertility, health and functional traits for a long period,
this breed may perform well with regards to fertility and udder health in both conventional
and organic farming systems.
The objectives of this study were to investigate whether there were differences
between Norwegian Red cows managed conventionally and organically with respect to
reproductive performance, udder health, and resistance against penicillin in udder pathogens.

5
Methods
Sampling of herds
The conventional and organic herds present in the selected cohort were registered in
the Norwegian Dairy Herd Recording System (NDHRS). The organic farms converted at
least four years before the start of the study. The organic herds were certified as organic
between 1997 and 2003. All organic herds in south east (n = 26) and middle Norway (n = 21),
excluding herds with less than nine cow-years (one cow-year = 365 d for a cow in the herd
during one year), received an invitation letter for participation in the study. Farmers were
requested to reply within one week to be included in the study. Those that did not were
contacted by telephone one week after the deadline. Thirty of the 47 farms contacted agreed
to participate in the study. Four of the thirty were excluded because they contained breeds
other than the Norwegian Red. A further herd was excluded as it was farmer cooperatively
and so had an elevated number of herdsmen. Another herd decided to not participate at the
start of the study.
Thirty eight owners of conventional herds located in the same geographical areas as
organic herds were asked to participate. Herds were selected to the organic farms according to
herd size (± five cow-years) and type of housing. Eleven farmers were not interested (mostly
due to the extra labor), one farmer planned cooperative farming, and one farmer planned
conversion to organic farming.
In total, 24 organic and 25 conventional herds were enrolled in the study. One organic
herd ended milk production during the study period. The distribution of geographical area,
herd size, and barn type is presented in Table 1. The veterinarians practicing on the selected
farms were informed about the study before it started, and were asked to collect quarter milk
samples and complete a standard form when treating cases of clinical mastitis in these herds.
Bacteriological examination of milk samples were performed free of charge for the farmer.
Herd visit
Each herd was visited once by the same researcher (first author) between February and
June in 2006. Quarter milk samples for bacteriological examination were collected aseptically
from 523 conventional and 487 organic lactating cows. Milk was collected aseptically from
all quarters of cows in lactation on the respective day of the herd visit. The California mastitis
test (CMT) was performed when the milk was sampled. The milk samples were refrigerated
immediately after sampling and subsequently frozen until they underwent laboratory
examination.
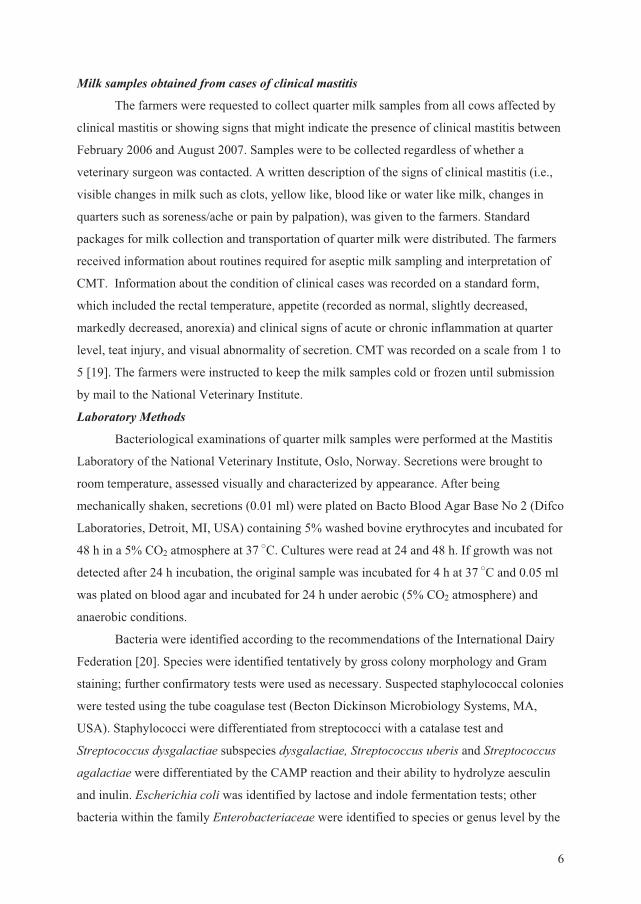
6
Milk samples obtained from cases of clinical mastitis
The farmers were requested to collect quarter milk samples from all cows affected by
clinical mastitis or showing signs that might indicate the presence of clinical mastitis between
February 2006 and August 2007. Samples were to be collected regardless of whether a
veterinary surgeon was contacted. A written description of the signs of clinical mastitis (i.e.,
visible changes in milk such as clots, yellow like, blood like or water like milk, changes in
quarters such as soreness/ache or pain by palpation), was given to the farmers. Standard
packages for milk collection and transportation of quarter milk were distributed. The farmers
received information about routines required for aseptic milk sampling and interpretation of
CMT. Information about the condition of clinical cases was recorded on a standard form,
which included the rectal temperature, appetite (recorded as normal, slightly decreased,
markedly decreased, anorexia) and clinical signs of acute or chronic inflammation at quarter
level, teat injury, and visual abnormality of secretion. CMT was recorded on a scale from 1 to
5 [19]. The farmers were instructed to keep the milk samples cold or frozen until submission
by mail to the National Veterinary Institute.
Laboratory Methods
Bacteriological examinations of quarter milk samples were performed at the Mastitis
Laboratory of the National Veterinary Institute, Oslo, Norway. Secretions were brought to
room temperature, assessed visually and characterized by appearance. After being
mechanically shaken, secretions (0.01 ml) were plated on Bacto Blood Agar Base No 2 (Difco
Laboratories, Detroit, MI, USA) containing 5% washed bovine erythrocytes and incubated for
48 h in a 5% CO2 atmosphere at 37 �C. Cultures were read at 24 and 48 h. If growth was not
detected after 24 h incubation, the original sample was incubated for 4 h at 37 �C and 0.05 ml
was plated on blood agar and incubated for 24 h under aerobic (5% CO2 atmosphere) and
anaerobic conditions.
Bacteria were identified according to the recommendations of the International Dairy
Federation [20]. Species were identified tentatively by gross colony morphology and Gram
staining; further confirmatory tests were used as necessary. Suspected staphylococcal colonies
were tested using the tube coagulase test (Becton Dickinson Microbiology Systems, MA,
USA). Staphylococci were differentiated from streptococci with a catalase test and
Streptococcus dysgalactiae subspecies dysgalactiae, Streptococcus uberis and Streptococcus
agalactiae were differentiated by the CAMP reaction and their ability to hydrolyze aesculin
and inulin. Escherichia coli was identified by lactose and indole fermentation tests; other
bacteria within the family Enterobacteriaceae were identified to species or genus level by the
7
API 20 E® identification system (bioMérieux, Marcy l’Etoile, France). Staphylococcal
isolates were tested for ß-lactamase activity by the cloverleaf method [21] using
Staphylococcus aureus ATCC 25923 as the indicator strain.
Individual and Herd data
Individual animal data for test-day milk yield, test-day SCC, and test-day concentrate
allocation (CA), calving date, the intervals from calving to first and last AI, and use of natural
mating or AI were obtained for all cows enrolled in NDHRS from 2005 throughout 2007 (n =
3209 lactations, 2093 cows). The calving interval was defined as time between two successive
calvings � 550 d, and days open were calculated as calving interval minus 281 d (expected
gestation period). The milk yield recording closest to 28 DIM (range 15 to 45 d, n = 845) was
used as an estimate for milk yield in the fourth week of lactation. Occurrence of clinical
mastitis from February 2006 to August 2007 that was treated and reported was obtained from
the NDHRS files. A new clinical mastitis treatment within 9 d after the initial treatment was
not considered to be a new case. Cases which had been treated for retained placenta and
reproductive disorders from 2005 throughout 2007 were obtained from the NDHRS files. The
average annual forage: concentrate ratio for the herds and culling rate (number of culled cows
per 100 cow-years) of cows in 2006 and 2007 was also obtained from the NDHRS files.
Statistical analyses
The unit of the study was lactation periods. Statistical significance was considered at P
� 0.05 for all analyses.
Chi-square tests. Pearson Chi-square tests were performed to assess the univariate
relationships between management systems and the following variables; parity distributions,
proportion of dry quarters, AI versus natural mating, season for first AI, proportion of milk
samples negative for pathogens, and proportion of milk samples from clinical mastitis
negative for pathogens.
Associations between reproductive performance and management system, milk yield,
season, parity, and AI versus natural mating. Mixed linear models [22] were performed
using SPSS 15.0 to separately assess the relationships between the three outcome variables;
interval from calving to first AI, interval from calving to last AI, and calving interval � 550 d
and the explanatory variables; management system, parity, milk yield in the fourth week of
lactation, barn type, and season for first AI. In addition, calving interval was also assessed
with AI versus natural mating. The interval from calving to first AI (lnCFAI) and the interval
from calving to last AI (lnCLAI) were transformed by natural logarithm to approximate
normality of the residuals. Explanatory variables with P � 0.20 in the separate analyses were

8
included in the final models together with the interactions terms; management system by
parity, parity by season, management system by season, barn type by season, barn type by
management system, barn type by parity. The backward elimination procedure was applied
for explanatory variables with P > 0.05 in the extended model. The covariance between
multiple measurements of lnCFAI, lnCLAI and calving interval was correlated, and the
models were adjusted for multiple lactations within the same cow by the use of a compound
symmetry correlation structure for repeated effects. Multiple comparison adjustment for the
pair wise difference in least square means (LS-means) was performed using the Bonferroni
option in SPSS.
Lactations curves for test-day milk yield, somatic cell count and concentrate allocation.
For construction of the lactation curves for the continuous variables; test-day milk
yield, test-day SCC and test-day CA multiple records on milk yield, SCC and CA were used
for each lactation. Test-day milk yield and CA was recorded monthly whereas SCC was
recorded bimonthly. Only recordings within 305 DIM were included in the analysis. Number
of lactations used to construct the lactation curves was 3088, 3096, and 3035 for test-day milk
yield, CA, and SCC, respectively. The outcome variable, SCC was transformed by natural
logarithm (lnSCC) to obtain approximate normality of residuals. Mixed linear models for
repeated outcomes were run using SPSS to assess the relationships between the outcome
variables (milk yield, lnSCC, and CA) and the explanatory variables. Subjects were lactation
within cows and week in milk were entered as repeated effect. Covariance between multiple
measurements of milk yield, lnSCC, and CA within lactations were correlated and accounted
for by the use of first order autoregressive correlation structure [23].
The lactation curves were expressed through inclusion of weeks in milk (WIM) and
the natural logarithm of WIM (lnWIM) as described by [24-26]. The explanatory variables
WIM and lnWIM were entered simultaneously in all models with test-day milk yield, lnSCC
or CA as outcome variables. The explanatory variables; management system (conventional or
organic) and parity (1st, 2nd, and > 2nd) were first assessed separately for each of the three
outcome variables (milk yield, lnSCC, and CA). Secondly, interaction terms considered as
biological important such as WIM by management, WIM by parity, lnWIM by management,
and lnWIM by parity were included in the respective models. Thirdly, also test-day milk yield
was included as an explanatory variable in a separate model expressing the lactation curve for
lnSCC. The final model for each of the three outcomes was constructed such that the
explanatory variables and their interactions terms with P � 0.20 when tested separately, were

9
included in an extended model. The backward elimination procedure was applied for the
explanatory variables and interaction terms with P > 0.05 in the extended model.
Associations between cows with milk samples positive for mastitis bacteria and
management system, milk yield, parity, and WIM. Intra-mammary infection was
considered to be present when an udder pathogen was isolated from at least one quarter.
Associations between the presence of intra-mammary infection (= 1) or not (= 0) at the herd
visit and the explanatory variables; management, milk yield in the fourth wk of lactation,
WIM, and parity were tested separately using generalized linear models with logit as link
function in SPSS. Explanatory variables with P � 0.20 when assessed separately and the
interaction terms; parity by WIM, parity by milk yield, and WIM by milk yield were included
in an extended model. The backward elimination procedure was applied for explanatory
variables with P > 0.05 in the extended model.
Results
Herd characteristics
The average herd size in 2006 was 23.8 (SD ± 11.8) and 23.0 (SD ± 11.5) cow-year
for the conventional and organic herds, respectively. Average milk yield per cow-year in 2006
was 7188 (SD ± 805) and 6155 kg (SD ± 963) for conventional and organic herds,
respectively. The distribution of parities for conventional and organic farming from 2005 to
2007 is presented in Table 1. There were more 1st parity and less > 2nd parity cows in
conventional compared to organic farming (P < 0.01). The culling rate for 2007 was 46.9/ 100
cow-year (95% CI: 35.0, 58.9) in conventional farming and 31.2/ 100 cow-year (95% CI:
25.3, 37.1) in organic farming. The average annual forage: concentrate ratio for conventional
herds was 63:37 (95% CI: 35.1, 39.5) and 75:25 (95% CI: 22.6, 28.3) for organic herds.
There were 47 cases of retained placenta recorded in the NDHRS files from
conventional herds, whereas there were 19 cases recorded from organic herds from 2005
throughout 2007. There were 148 cases of treatments for reproductive disorders (silent heat,
heat synchronization, metritis, endometritis, vaginitits, cystic ovaries, and repeated breeding)
in conventional herds during the same period, whereas the corresponding figures were 15 in
organic herds.
Descriptive reproductive parameters
There were 1548 and 1403 lactations with records on AI or natural mating as first
service for the conventional and organic herds, respectively. Natural mating was preferred as
first service in 2.8% (43/1548) of the conventional observations and in 13.8% (199/1403) of

10
the organic observations (P < 0.01). Natural mating was registered in six organic and six
conventional farms. There were two organic farms using mostly natural mating as first service
with 100% and 73.5% matings registered. For the conventional farms, natural mating as first
service was used in 5.4% to 33.3% of the cows.
There were no differences between conventional and organic cows in the overall
calving interval or in the calving interval when only cows presented for first AI were included
(Table 2). When only cows presented for natural mating as first service were included, the
organic cows had a shorter calving interval than conventional cows (355.9 versus 386.1 d).
There were no differences between days open, days to first AI, days to last AI between
conventional and organic cows (Table 2).
There was no difference between season for AI in conventional and organic farming.
First AI was performed during the summer season (April- September) in 58.4% (875/1498)
and 56.3% (675/1198) of the lactations in the conventional and organic farms, respectively.
Associations between interval to first AI and management, milk yield, parity barn type, and
season
When lnCFAI was assessed in separate models for each of the explanatory variables
separately, P-values � 0.20 were observed for management (P = 0.01), parity (P = 0.09), barn
type (P � 0.01), and season (P = 0.16). After the backwards selection procedure had been
applied, only management system and barn type remained in the model. None of the
interaction terms were associated with the lnCFAI. The results from the extended model are
presented in Table 3.
The LS-means for the interval to first AI were 75.0 d and 77.7 d for conventional and
organic cows, respectively. The LS-means for interval to first AI were 73.8 d and 78.9 d for
free stall and tie stall cows, respectively.
Associations between interval to last AI and management, milk yield, parity, and season
When lnCLAI was assessed in separate models for each of the explanatory variables,
P-values � 0.20 were observed only for parity (P < 0.01) and barn type (P < 0.01). After the
backwards selection procedure had been applied, both parity and barn type remained in the
model. None of the interaction terms were associated with lnCLAI. The results from the
extended model can be obtained in Table 3. The LS-means for the interval to last AI were
94.6, 88.7, and 91.8 d for 1st, 2nd, and > 2nd parity, respectively. The LS-means for the
interval to last AI were 87.3 and 96.3 d for free stall and tie stall cows, respectively.

11
Associations between calving interval and management, season, breeding management,
and parity
When calving interval was assessed in the separate models for each of the explanatory
variables, P-values � 0.20 were observed for breeding management (P < 0.01), parity (P =
0.09), barn type (P < 0.01), and season (P = 0.20). After the backwards selection procedure
was applied only barn type remained to be associated with the calving interval. None of the
interaction terms were associated with calving interval. The results from the extended model
can be obtained in Table 3. The LS-means for calving interval were 372.0 d and 382.3 d for
free stall and tie stall cows, respectively.
Test-day milk yield
All explanatory variables; WIM, lnWIM, management, parity, and interaction terms;
WIM by management system, WIM by parity, lnWIM by management system, and lnWIM by
parity were significantly associated (P < 0.01) with milk yield at the test day in the type III
statistics. Lactation curves for 1st and > 2nd parity cows in conventional and organic farming
are presented in Figure 1. The average 8 WIM yield for conventional cows were 23.8, 29.3,
and 32.3 kg for 1st, 2nd, and > 2nd lactation, respectively. The corresponding figures for
organic cows were 20.7, 26.2, and 29.3 kg.
Test-day concentrate allocation
All explanatory variables; WIM, lnWIM, management, parity, and interaction terms;
WIM by management system, WIM by parity, lnWIM by management system, and lnWIM by
parity were associated (P < 0.01) with concentrate allocation in the type III statistics.
Concentrate allocation curves for 1st and >2nd parity cows in conventional and organic
farming are presented in Figure 2. The average concentrate allocation 8 WIM for
conventional cows were 50.7, 60.2, and 63.6 MJ for 1st, 2nd, and >2nd lactation, respectively.
The corresponding figures for organic cows were 31.9, 41.4, and 44.7 MJ.
Test-day SCC
All explanatory variables; WIM, lnWIM, management, parity, and test-day milk yield,
but none of the interactions were associated (P < 0.01) with test-day lnSCC in the type III
statistics.
Curves for back-transformed SCC for 1st and >2nd parity cows in conventional and
organic farming are presented in Figure 3. The average SCC 8 WIM for conventional cows
were 79 400, 104 800, and 151 400 for 1st, 2nd, and >2nd lactation, respectively. The
corresponding figures for organic cows were 64 900, 85 700, and 123 700.

12
Herd milk samples
The percentage of dry quarters was 2.2% (43/1948) and 1.2% (26/2092) (P = 0.02) in
organic and conventional management, respectively. Number of quarter milk samples positive
for mastitis bacteria is presented in Table 4. There was no difference in the percentage of
quarter samples positive for mastitis bacteria between conventional and organic farming.
Independent of management, there were more quarter milk samples positive for mastitis
bacteria in cows > 2nd parity than in 1st and 2nd parity cows (P < 0.01).
Associations between cows with milk samples positive for mastitis bacteria and
management system, milk yield, WIM, and parity
When the likelihood of a positive diagnosis for mastitis bacteria (subclinically infected cows)
was assessed in separate models for each of the explanatory variables, P-values � 0.20 were
observed for milk yield in the 4th wk of lactation (P < 0.01), WIM (P = 0.03) and parity (P <
0.01).Multivariate associations between cows with milk samples positive for mastitis bacteria
and the explanatory variables are presented in Table 5. In the type III statistics F-test, both
parity (P = 0.01), milk yield (P = 0.03), and WIM (P = 0.05) were associated with the
likelihood of at least one quarter positive for mastitis bacteria. Management system was not
associated with bacteriological diagnosis when assessed separately, and hence not included in
the model.
Samples of cases from clinical mastitis
In the study period, a total of 332 cases with clinical mastitis (229 in conventional and
103 in organic herds) were recorded in 271 cows in 24 conventional and 19 organic herds in
the NDHRS-files. With the exception of three cases, all were treated by a veterinarian. In
total, there were collected 238 (144 conventional and 94 organic) samples of quarters with
clinical mastitis from 177 cows (107 conventional and 70 organic). Fifty-three quarter
samples were registered in the same cow at the same date, such that the number of cases of
clinical mastitis at the cow level was 185 (112 conventional and 73 organic) from 172 cows
(104 conventional and 68 organic). Quarter milk was collected from 48.9% (112/229) of the
cases of clinical mastitis cases in conventional herds and from 70.9% (73/103) of the cases in
organic herds. Twenty-one conventional herds and 19 organic herds submitted samples from
at least 1 cow with clinical mastitis.
The distribution of bacteria isolated from milk samples from quarters with clinical
signs of mastitis is presented in Table 6. There was a higher proportion (30.9% versus 18.1%)
of clinical mastitis cases where mastitis bacteria were not isolated on organic compared to
conventional farms (P = 0.02).

13
Antibiotic resistance in milk samples from the herd visit and samples from clinical mastitis
Of the staphylococci isolated from milk samples of subclinically infected quarters
collected during the routine visits to the conventional herds, 81 of the 167 isolates (48.5%) of
coagulase-negative staphylococci (CNS) and 6 of the 68 isolates (8.8%) of S. aureus were
resistant to penicillin. The corresponding findings in the organic herds were for CNS 93
penicillin-resistant isolates out of 200 (46.5%) and for S. aureus nine penicillin-resistant
isolates out of 64 (14.0%). Of the isolates from quarters with clinical mastitis, resistance to
penicillin was not found among the 59 S. aureus from conventional and organic herds.
Whereas one out of one of the CNS isolates from the organic herds, and three out of five of
the CNS isolates from conventional herds were penicillin-resistant.
Discussion
Previously, there have been separate Norwegian field studies comparing reproductive
performance [4] udder health [8], and herd health and management [9] in conventional and
organic dairying. The present study agrees with previous findings of higher parity distribution
and lower milk yield in organic cows [4; 8]. However, the present study does not support the
reported findings of impaired reproductive performance in organic herds [4] or the statement
of no differences in SCC [8] between the management systems.
Roesch et al. reported that lower milk yields in organic farms were due to individual
animal and farm level factors; such as udder health, breed, nutrition and management [27]. In
this study conventional herds were selected to the organic herds on the basis of geographical
location, housing system and herd size. Consequently, these potential confounders were
unlikely to have influenced the findings of the present study. Since the cows included in the
study were all Norwegian Reds, breed is not a potential confounder either. All organic herds
included in the study converted form 1997 to 2003. During this period the government
provided an economic incentive for conversion to organic farming. It may have been this,
rather than the idealism of farming in a sustainable manner, that stimulated conversion, as
described in Switzerland [28]. The governmental payment could have affected management
decisions more than the holistic view of organic production in the present study, which could
be interpolated to other Norwegian organic farmers converting to organic production after
1997.
The organic cows were fed less concentrate than conventional cows. Reksen et al.
reported that the energy provided by concentrate for most organic herds was 20%, because a
maximum of 20% of the feed could be non-organic in origin and production of organic grain
14
was limited [4]. The percentage of non-organic feed allowed to use on organic farms has
gradually been reduced. Since January 2008 no feed of non-organic origin has been allowed.
Currently, 60% of the energy fed on daily basis should be roughage [3]. Hence, today it is
possible to feed a higher amount of concentrate than the limit of 20% ten years ago. In 2007,
39.4% of the feed fed to Norwegian cows per cow-year was concentrate [29]. Valle et al.
reported that the percentage concentrate fed was 39.3% and 27.4% for conventional and
organic herds, respectively [9]. In the present study, the average annual forage: concentrate
ratio was 63:37 in conventional herds and 75:25 in organic herds. Previously, it has been
described that Norwegian Red cows are able to maintain ovarian activity by decreasing milk
yield when the forage to concentrate ratio was 75:25 or lower [30]. Fall et al. reported that
organic cows did not mobilize more body tissue than conventional cows, and that the organic
cows adjusted the milk production according to feed intake [31]. It could be that the organic
cows decreased milk yield according to feed intake and hence met the negative energy
balance post partum with lower milk yield rather than impaired reproductive performance
since milk yield was not associated with any of the fertility measurement investigated in the
present study. Hence, the suggestions presented by Reksen et al. are met and the breed seems
to adapt well in extensive production systems [30].
Natural mating as first service was more commonly used in organic than conventional
farming, which agrees with the findings reported by Reksen et al. [4]. The interval to first AI
was shorter for conventional cows, whereas there was no difference in calving interval, days
open, and interval to last AI between the management systems. Reksen et al. [4] and Valle et
al. [9] reported no difference in these reproduction measures except for a reduction in the
number of days open for organic cows [4], whereas Löf et al. [5] reported shorter calving
intervals and shorter interval to first and last AI in organic cows. Nauta et al. [6] found
extended calving interval in cows managed on farms that converted between 1990 and 2003.
Cows in free stall herds had shorter interval to first AI, last AI and calving interval in the
present study. Valde et al. [32] reported higher fertility status index in free stall herds
compared to tie stall herds. When cows only presented for natural mating were investigated,
organic cows had shorter calving interval and fewer days open than conventional cows which
could be explained by more complete systems with natural breeding as first service compared
to conventional farming. There were no difference between season for AI and the two types of
farming which contrasts with the findings of Reksen et al. where 52% of the organic cows and
36% of the conventional cows were bred during the summer [4].

15
Although adjusted for parity and milk yield, SCC was lower in organic cows during
the whole lactation period compared to conventional cows which contrasts with the findings
that no difference in SCC existed between the management systems [8; 33-34]. A Danish and
a Dutch study reported lower milk yield in long-standing organic farms compared to later
conversion and conventional farms, but the studies were conflicting regarding to SCC [6; 35].
A Swedish study found lower milk yield and lower proportion of cows with high SCC in
organic farming [36], whereas Valle et al. [9] found no differences in bulk milk SCC and
higher culling rate in conventional herds. In the present study, the culling rate was slightly
higher in the conventional herds which should give the opportunity to cull cows with high
SCC and hence potential to improve the udder health.
The percentage of dry quarters at the herd visits was higher in organic compared to
conventional farming which could have given lower measurements of SCC in organic herds.
Valle et al. reported a lower proportion of produced milk delivered to the dairy factory from
organic herds [9]. Hamilton et al. reported that organic farmers were more unlikely to use
veterinary treatment in cases of clinical mastitis [37]. In the present study, four organic
farmers always preferred veterinary treatment in cases of clinical mastitis, whereas 12
conventional farmers always called the veterinarian. In a previous study, it was reported that
conventional farmers on average called the veterinarian in 4.7 out of 10 mild mastitis cases,
whereas the corresponding figure was 2.0 for organic farmers [9]. In 2007, 16 of the 24
organic farms had reported data about (veterinary) treatment in cases of mastitis to the
NDHRS-files, whereas 22 of 25 conventional farms had reported cases of mastitis. Milk was
sampled in 48.9% of the clinical mastitis cases treated in conventional herds whereas the
corresponding figure was 70.9% in organic herds. The milk samples from cases with clinical
mastitis were sampled from cows in 21 conventional herds and 19 organic herds. The number
of samples submitted from farms varied considerably, especially for the conventional farmers
(1 to 23). This variation could be due to differing levels of motivation to improve the udder
health in each herd. Since the milk samples were analyzed for free, this could have been an
important factor for motivation to submit milk samples for at least the conventional farmers.
The proportion of milk samples positive for mastitis bacteria at the herd visit were not
associated with management. However, parity, stage of lactation, and milk yield were. There
was no difference between organic and conventional herds with respect to bacteriologically
positive milk samples at the herd visit. Coagulase-negative staphylococci were the bacteria
most frequently isolated from quarters in both conventional (8.1%) and organic (10.5%)
cows. This differs considerably from the reported frequency of 3.3% in a nationwide random

16
assignment survey [38]. The percentage of milk samples positive for Streptococcus
dysgalactiae at the herd visits was similar in the two management systems, and corresponds
well with the 1.2% of cows previously reported to be infected national [38]. The proportion of
S. aureus was similar in organic and conventional herds (3.3 and 3.4%), but lower than
previous reports of 8.2% [38]. For Streptococcus uberis, the percentage (0.6%) of organic
quarters infected corresponds with the report of Østerås et al. [38]. However the infection rate
in conventional herds was twice as high (1.2%) as the earlier report. The deviation of the
proportion of mastitis bacteria isolated in the present study compared to the study conducted
by Østerås et al. [38] could be due to the design of the studies. In the present study, all cows
in lactation in the herd were sampled, whereas the other study sampled every fifth cow from
every 50th herd during each quarter of the year [38]. Hence environmental factors in the
specific herd in the present study would have larger impact on the proportion of infected
quarters compared to the other study.
In the clinical mastitis cases, there were a higher proportion of bacteriological negative
milk samples from organic farms (30.9% versus 18.1%). The reason for this remains
unknown, but it could be possible that some of this quarters originally were infected by E.coli
which was not present at the time of milk sampling. Vaarst and Enevoldsen reported that
bacteriological negative mastitis showed strong similarities with clinical coliform mastitis,
and that 20% of the cases were bacteriological negative in a study of manifestation of clinical
mastitis in Danish organic herds [39]. In another Norwegian study, 12.5% of the cases of
clinical mastitis were bacteriological negative [40]. Staphylococcus aureus was the bacteria
most frequently isolated from quarter samples with signs of clinical mastitis in both
conventional (27.8%) and organic herds (20.2%), which is lower than previous reported in
heifers (pre partum to 14 d post partum) of 44.3% [41]. Whist et al. reported S. aureus to be
isolated in 47.4% of the cases with clinical mastitis in problem herds [40]. In the present
study, E. coli was the second most frequent reason for clinical mastitis in both conventional
(23.6%) and organic (19.1%) cows. The proportions in this study are higher than previous
reported of 6.4% [41] and 10.7% [40]. The frequency of Streptococcus dysgalactiae in
organic farming (17.0%) was close to previous studies with 18.2% [41] and 22.5% [40]. In
conventional farming, the percentage of Streptococcus dysgalactiae was only 11.1%. The
reason for such low proportion of Streptococcus dysgalactiae in conventional farming could
be due to higher motivation to improve udder health and more use of dry cow therapy
initiated by veterinarian than organic herds. The use of dry cow therapy was not investigated
in the present study.

17
Cases selected for antibiotic treatment are assessed by the veterinarian before
treatment. Benzyl penicillin and dihydrostreptomycin are the most common antibiotics used
for intramammary treatment [40]. Penicillin resistance against S. aureus was not found in the
cases of clinical mastitis. At the herd visit, penicillin resistance against S. aureus was found in
8.8% of the subclinically infected quarters in conventional farming and in 14.1% of
subclinically infected quarters in organic farming. Østerås et al. reported 11.4% resistance
against penicillin G for S. aureus in subclinically infected quarters [38]. Other studies
investigating antibiotic resistance between the two management systems reported no
difference in penicillin resistance between the two farming types [12; 42]. Tikofsky et al.
found that S. aureus in US organic farms were more susceptible to antibiotics than in
conventional farms, but also that S. aureus isolates in general showed good susceptibility
[10]. Since the choice of antibiotics and cases for treatment are very different in US and
Norway, comparisons between the countries are difficult. A study that investigated
antimicrobial susceptibility of S. aureus in bulk tank milk in organic and conventional farms
in Denmark and US, reported small differences between organic and conventional farms in
each country, but large differences between the respective agricultural systems [11].
Penicillin resistance against CNS isolated from subclinically infected quarters was
48.5% in conventional and 46.5% in organic herds. Østerås et al. reported that 36.1% of the
CNS isolates from subclinically infected quarters were penicillin resistant and that the
resistance was highest during late indoor season (April-May) [38]. This could explain the
higher percentage of penicillin resistance CNS in the present study, because most of the herd
visits took place in the spring and early summer (late March to late May) in both conventional
and organic herds.
Conclusion
The interval to first AI was shorter in conventional cows, whereas there were no
differences in the interval to last AI and calving interval between the two management
systems. The cows were older in organic farming. Conventional cows yielded more, had
higher SCC, and received more concentrates than organic cows. Higher level of concentrate
fed to organic cows in recent years is an important factor for higher reproductive efficiency
than ten years ago. The Norwegian Red is a sustainable breed that adapts well to both
intensive and more extensive systems like organic production.

18
Competing interests
The authors declare that they have no competing interests.
Author’s contributions
RTG contributed to design, planning and administration of the study, performed the
herd visits, collection, analysis, and interpretation of data, main author of the manuscript. SW
contributed to study concept and design, analysis and interpretation of data, critical revision
of the manuscript for important intellectual content. SS contributed in the udder health part
and analysis of milk samples, reviewing the manuscript with special emphasis on the udder
health part. BIFH contributed in the selection of organic herds, ensured correct information
about organic farming and regulations, and production of the manuscript. OØ contributed in
the planning of data needed for epidemiological analysis, collection of data from the
Norwegian Dairy Herd Recording System, input on epidemiological and statistical approach
in the manuscript. OR contributed in design, planning, analysis and interpretation of data,
critical revision and production of the manuscript.
All authors read and approved the final manuscript.
Acknowledgements
The authors gratefully thank the farmers for participation in the study and for their
cooperation and willingness to submit milk samples during the study period. We would also
like to thank the laboratory staff at the National Veterinary Institute. Access to production and
health data was given by The Norwegian Dairy Herd Recording System and The Norwegian
Cattle Health Services in agreement number 3/2005.

19
References
1. FAO and WHO: Codex Alimentarius guidelines for organic food.
[http://www.codexalimentarius.net/download/standards/360/CXG_032e.pdf]
Accessed August 20, 2009.
2. Norwegian Agricultural Authority (Statens landbruksforvaltning): Produksjon og
omsetning av økologiske landbruksvarer.
[http://www.slf.dep.no/iKnowBase/Content/10610/PRODUKSJON%20OG%20OMS
ETNING%20AV%20ØKOLOGISKE%20LANDBRUKSVARER%202008.PDF]
Accessed August 20, 2009.
3. Ministry of Agriculture and Food (Mattilsynet): Veileder til forskrift om økologisk
produksjon og merking av økologiske landbruksprodukter og næringsmidler, av
oktober 2005, nr 1103.
[http://www.mattilsynet.no/mattilsynet/multimedia/archive/00049/VEILEDER_B__Ut
fyllen_49674a.pdf]. Accessed August 20, 2009.
4. Reksen O, Tverdal A, Ropstad E: A comparative study of reproductive
performance in organic and conventional dairy husbandry. J Dairy Sci 1999, 82:
2605-2610.
5. Löf E, Gustafsson H, Emanuelson U: Associations between herd characteristics and
reproductive efficiency in dairy herds. J Dairy Sci 2007, 90:4897-4907.
6. Nauta WJ, Baars T, Bovenhuis H: Converting to organic dairy farming:
Consequences for production, somatic cell scores and calving interval of first
parity Holstein cows. Livest Sci 2006, 99:185-195.
7. Strøm T, Olesen I: Mjølkekvalitet, helse og holdbarhet på kyrne ved omlegging til
økologisk mjølkeproduksjon. 1997. Norsk Senter for økologisk landbruk. Tingvoll,
Norway.
8. Hardeng F, Edge VL: Mastitis, ketosis, and milk fever in 31 organic and 93
conventional Norwegian dairy herds. J Dairy Sci 2001, 84:2673-2679.

20
9. Valle PS, Lien G, Flaten O, Koesling M, Ebbesvik M: Herd health and health
management in organic versus conventional dairy herds in Norway. Livest Sci
2007, 112: 123-132.
10. Tikofsky LL, Barlow JW, Santisteban C, Schukken YH: A comparison of
antimicrobial susceptibility patterns for Staphylococcus aureus in organic and
conventional herds. Microbial Drug Resistance 2003, 9:39-45.
11. Sato K, Bennedsgaard TW, Bartlett PC, Erskine RJ, J. B. Kaneene JB: Comparison
of antimicrobial susceptibility of Staphylococcus aureus isolated form bulk tank
milk in organic and conventional dairy herds in Midtwestern United States and
Denmark. J Food Prot 2004, 67:1104-1110.
12. Roesch M, Perreten V, Doherr MG, Schaeren W, Schallibaum M, Blum JW:
Comparison of antibiotic resistance of udder pathogens in dairy cows kept on
organic and on conventional farms. J Dairy Sci 2006, 89: 989-997.
13. FAO: The state of the world's animal genetic resources for food and agriculture.
Food and agriculture organization of the United Nations. Rome, Italy; 2007.
14. Geno: Annual Report 2008. Hamar, Norway; 2009.
15. Garmo RT, Ropstad E, Havrevoll O, Thuen E, Steinshamn H, Waldmann A, Reksen
O: Commencement of luteal activity in three different selection lines for milk
yield and fertility in Norwegian red cows. J Dairy Sci 2009, 92:2159-2165.
16. Rozzi P, Miglior F, Hand KJ: A total merit selection index for Ontario organic
dairy farmers. J Dairy Sci 2007, 90:1584-1593.
17. Heringstad B, Klemetsdal G, Steine T: Selection responses for clinical mastitis and
protein yield in two Norwegian dairy cattle selection experiments. J Dairy Sci
2003, 86:2990-2999.
18. Heringstad B, Klemetsdal G, Steine T: Selection responses for disease resistance in
two selection experiments with Norwegian red cows. J Dairy Sci 2007, 90:2419-
2426.

21
19. Saloniemi, H: Use of somatic cell count in udder health work. In: The Bovine Udder
and Mastitis. Eds. Sandholm M, Honkanen-Buzalski T, Kaartinen L, Pyörälä S.
University of Helsinki, Helsinki; 1995: 105-110.
20. International Dairy Federation: Laboratory methods for use in mastitis work. IDF
Bull. 132 Int. Dairy Fed. Brussels, Belgium; 1981.
21. Jarløv JO, Rosdahl VT: Quantitative determination of beta-lactamase production
in Staphylococcus aureus strains compared to qualitative testing by a
microbiological clover leaf test, a chromogenic cephalosporin test and an
iodometric test. Acta Pathol. Microbiol. Immunol. Scand. [B] 1986, 94:415-421.
22. SPSS Inc: SPSS Advanced models 15.0. Chicago, IL, USA: SPSS Inc.; 2006.
23. Sawalha RM, Keown JF, Kachman SD, Van Vleck LD: Evaluation of autoregressive
covariance structures for test-day records of Holstein cows: Estimates of
parameters. J Dairy Sci 2005, 88:2632-2642.
24. Wood PDP: Algebraic model of the lactation curve in cattle. Nature 1967, 216:
164-165.
25. Reksen O, Sølverød L, Østerås O: Relationships between milk culture results and
milk yield in Norwegian dairy cattle. J Dairy Sci 2007, 90: 4670-4678.
26. Reksen O, Sølverød L, Østerås O: Relationships between milk culture results and
composite milk somatic cell counts in Norwegian dairy cattle. J Dairy Sci 2008,
91:3102-3113.
27. Roesch M, Doherr MG, Blum JW: Performance of dairy cows on Swiss farms with
organic and integrated production. J Dairy Sci 2005, 88:2462-2475.
28. Busato A, Trachsel P, Schällibaum M, Blum JW: Udder health and risk factors for
subclinical mastitis in organic dairy farms in Switzerland. Prev Vet Med 2000,
44:205-220.
29. TINE Rådgiving: Annual report: Statistikksamling 2008. Ås, Norway; 2009.

22
30. Reksen O, Gröhn YT, Havrevoll OS, Bolstad T, Waldmann A, Ropstad E: Influence
of concentrate allocation and energy balance on postpartum ovarian activity in
Norwegian cattle. J Dairy Sci 2001, 84:1060-1068.
31. Fall N, Gröhn YT, Forslund K, Essen-Gustafsson B, Niskanen R, Emanuelson U: An
observational study on early-lactation metabolic profiles in Swedish organically
and conventionally managed dairy cows. J Dairy Sci 2008, 91:3983-3992.
32. Valde JP, Hird DW, Thurmond, MC: Comparison of ketosis, clinical mastitis,
somatic cell count, and reproductive performance between free stall and tie stall
barns in Norwegian dairy herds with automatic feeding. Acta Vet Scand 1997,
38:181-192.
33. Sato K, Bartlett PC, Erskine RJ, Kaneene JB: A comparison of production and
management between Wisconsin organic and conventional dairy herds. Livest
Prod Sci 2005, 93:105-115.
34. Fall N, Emanuelson U, Martinsson K, Jonsson S: Udder health at a Swedish
research farm with both organic and conventional dairy cow management. Prev
Vet Med 2008, 83:186-195.
35. Bennedsgaard TW, Enevoldsen C, Thamsborg SM, Vaarst M: Effect of mastitis
treatment and somatic cell counts on milk yield in Danish organic dairy cows. J
Dairy Sci 2003, 86:3174-3183.
36. Hamilton C, Emanuelson U, Forslund K, Hansson I, Ekman T: Mastitis and related
management factors in certified organic dairy herds in Sweden. Acta Vet Scand
2006, 48:11.
37. Hamilton C, Forslund K, Hansson I, Emanuelson U, Ekman T: Health of cows, calves
and young stock on 26 organic dairy herds in Sweden. Vet Rec 2002, 150:503-508.
38. Østerås O, Sølverød L, Reksen O: Milk culture results in a large Norwegian
survey: Effects of season, parity, days in milk, resistance, and clustering. J Dairy
Sci 2006, 89:1010-1023.
23
39. Vaarst M, Enevoldsen C: Patterns of clinical mastitis manifestations in Danish
organic dairy herds. J Dairy Res 1997, 64:23-37.
40. Whist AC, Østerås O, Sølverød L: Clinical mastitis in Norwegian herds after a
combined selective dry-cow therapy and teat-dipping trial. J Dairy Sci 2006,
89:4649-4659.
41. Waage S, Mørk T, Røros A, Aasland D, Hunshamar A, Ødegaard SA: Bacteria
associated with clinical mastitis in dairy heifers. J Dairy Sci 1999, 82:712-719.
42. Bennedsgaard T, Thamsborg S, Aarestrup F, Enevoldsen C, Vaarst M, Christoffersen
A: Resistance to penicillin of Staphylococcus aureus isolates from cows with high
somatic cell counts in organic and conventional dairy herds in Denmark. Acta
Vet Scand 2006, 48:24.
24
Figure 1. Lactation curves for milk yield. Predicted test-day milk yield (kg/d) by WIM for
1st (organic�, conventional�) and > 2nd (organic, conventional�) parity cows in
conventional and organic farming.
Figure 2. Lactation curves for concentrate allocation. Concentrate allocation [MJ/d] by
WIM for 1st (organic�, conventional�) and > 2nd (organic, conventional�) parity cows in
conventional and organic farming.
Figure 3. Lactation curves for SCC. Test-day somatic cell count (SCC) by WIM for
1st (organic�, conventional�) and > 2nd (organic, conventional�) parity cows in
conventional and organic farming.
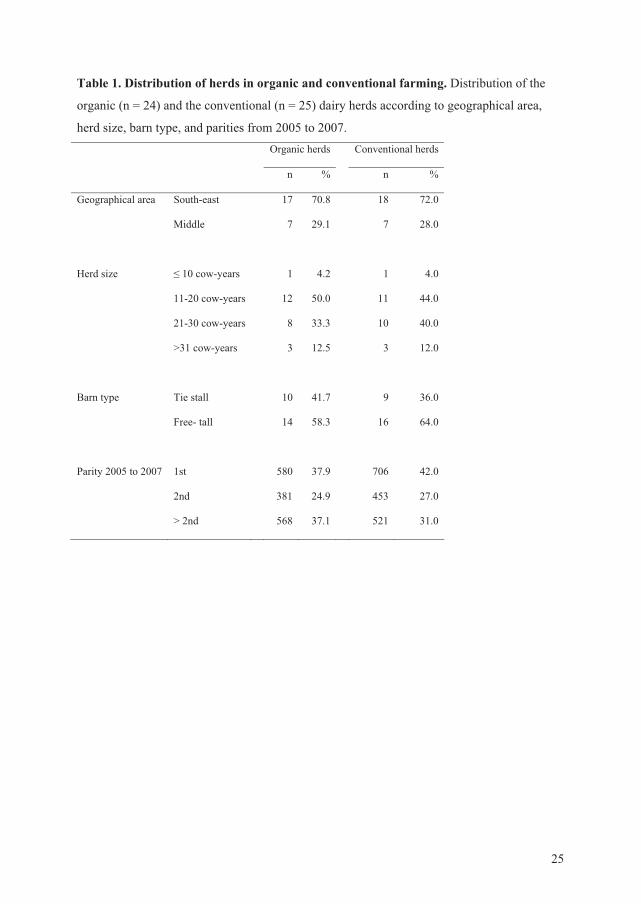
25
Table 1. Distribution of herds in organic and conventional farming. Distribution of the
organic (n = 24) and the conventional (n = 25) dairy herds according to geographical area,
herd size, barn type, and parities from 2005 to 2007. Organic herds Conventional herds
n % n %
Geographical area South-east 17 70.8 18 72.0
Middle 7 29.1 7 28.0
Herd size � 10 cow-years 1 4.2 1 4.0
11-20 cow-years 12 50.0 11 44.0
21-30 cow-years 8 33.3 10 40.0
>31 cow-years 3 12.5 3 12.0
Barn type Tie stall 10 41.7 9 36.0
Free- tall 14 58.3 16 64.0
Parity 2005 to 2007 1st 580 37.9 706 42.0
2nd 381 24.9 453 27.0
> 2nd 568 37.1 521 31.0

26
Table 2. Reproduction parameters. Calving interval (overall, AI only, natural mating only),
interval from calving to first AI (CFAI), interval from calving to last AI (CLAI), and number
of AI per observations in conventional and organic farming.
Conventional Organic
n mean 95 % CI n mean 95 % CI
Calving interval
Overall 1112 376.3 373.5, 379.0 1102 375.6 372.7, 378.5
Only AI 1074 1 375.8 373.0, 378.5 922 1 379.5 376.4, 382.6
Only natural mating 37 1 386.1a 372.4, 399.7 177 1 355.0 b 347.7, 362.4
Days open
Overall 1112 95.3 92.5, 98.0 1102 94.6 91.7, 97.5
Only AI 1074 1 94.8 92.0, 97.5 922 1 98.5 95.4, 101.6
Only natural mating 37 1 105.1 a 91.4,118.7 177 1 74.0 b 66.7, 81.4
CFAI 1505 79.5 77.8, 81.2 1204 82.0 80.2, 83.8
CLAI 1505 98.8 96.4, 101.2 1204 99.0 96.5, 101.5
1 For one conventional and three organic cows that calved data was missing for breeding
management and days open. a,b Different subscripts indicates significant differences between conventional and organic
farming by Bonferroni adjustment for multiple comparisons, P < 0.05

27
Table 3. Models for assessment of reproductive performance. Associations between
outcomes for reproductive performance; natural logarithm of the interval to first AI (lnCFAI),
natural logarithm of the interval to last AI (lnCLAI), and calving interval and the explanatory
variables; management, season, parity, and breeding management as assessed by mixed linear
models adjusted for multiple lactations within cow by the use of compound symmetry
correlation structure. SE 95% CI P Ls-means
lnCFAI (n = 2709)
Management Organic 1 - - - - 4.353 a
conventional -0.037 0.016 -0.068, -0.005 < 0.01 4.317 b
Barn type Tie stall - - - - 4.368 a
Free stall -0.066 0.017 -0.099, -0.032 < 0.01 4.302 b
Intercept 4.386 0.016 4.354, 4.418 < 0.01
lnCLAI (n = 2709)
Parity 1st parity 1 - - - - 4.550 a
2nd parity - 0.064 0.019 -0.102, - 0.026 < 0.01 4.485 b
> 2nd parity - 0.029 0.020 -0.068, 0.009 0.14 4.520 a,b
Barn type Tie stall - - - - 4.567 a
Free stall -0.098 0.019 -0.134, -0.061 < 0.01 4.469 b
Intercept 4.599 0.018 4.563, 4.634 < 0.01
Calving interval (n = 2195)
Barn type Tie stall - - - - 382.3 a
Free stall -10.31 2.211 -14.649, -5.974 < 0.01 372.0 b
Intercept 382.32 1.891 378.61, 386.04 < 0.01
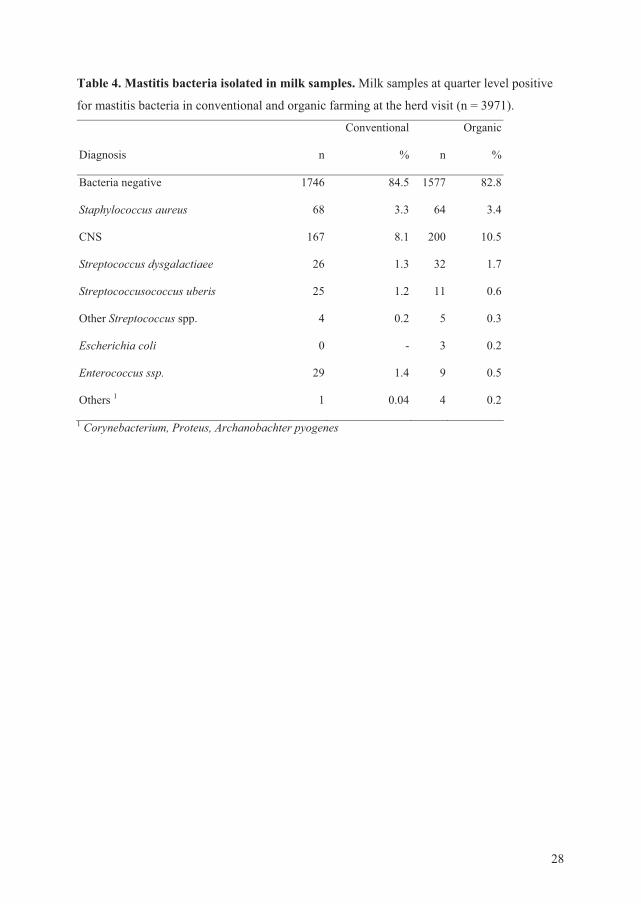
28
Table 4. Mastitis bacteria isolated in milk samples. Milk samples at quarter level positive
for mastitis bacteria in conventional and organic farming at the herd visit (n = 3971).
Conventional Organic
Diagnosis n % n %
Bacteria negative 1746 84.5 1577 82.8
Staphylococcus aureus 68 3.3 64 3.4
CNS 167 8.1 200 10.5
Streptococcus dysgalactiaee 26 1.3 32 1.7
Streptococcusococcus uberis 25 1.2 11 0.6
Other Streptococcus spp. 4 0.2 5 0.3
Escherichia coli 0 - 3 0.2
Enterococcus ssp. 29 1.4 9 0.5
Others 1 1 0.04 4 0.2
1 Corynebacterium, Proteus, Archanobachter pyogenes
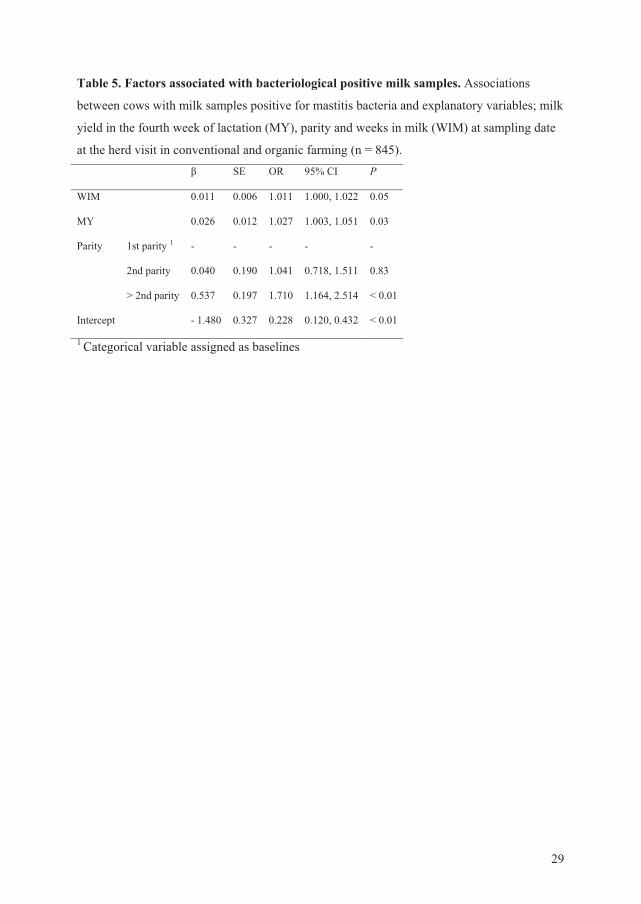
29
Table 5. Factors associated with bacteriological positive milk samples. Associations
between cows with milk samples positive for mastitis bacteria and explanatory variables; milk
yield in the fourth week of lactation (MY), parity and weeks in milk (WIM) at sampling date
at the herd visit in conventional and organic farming (n = 845). SE OR 95% CI P
WIM 0.011 0.006 1.011 1.000, 1.022 0.05
MY 0.026 0.012 1.027 1.003, 1.051 0.03
Parity 1st parity 1 - - - - -
2nd parity 0.040 0.190 1.041 0.718, 1.511 0.83
> 2nd parity 0.537 0.197 1.710 1.164, 2.514 < 0.01
Intercept - 1.480 0.327 0.228 0.120, 0.432 < 0.01
1 Categorical variable assigned as baselines
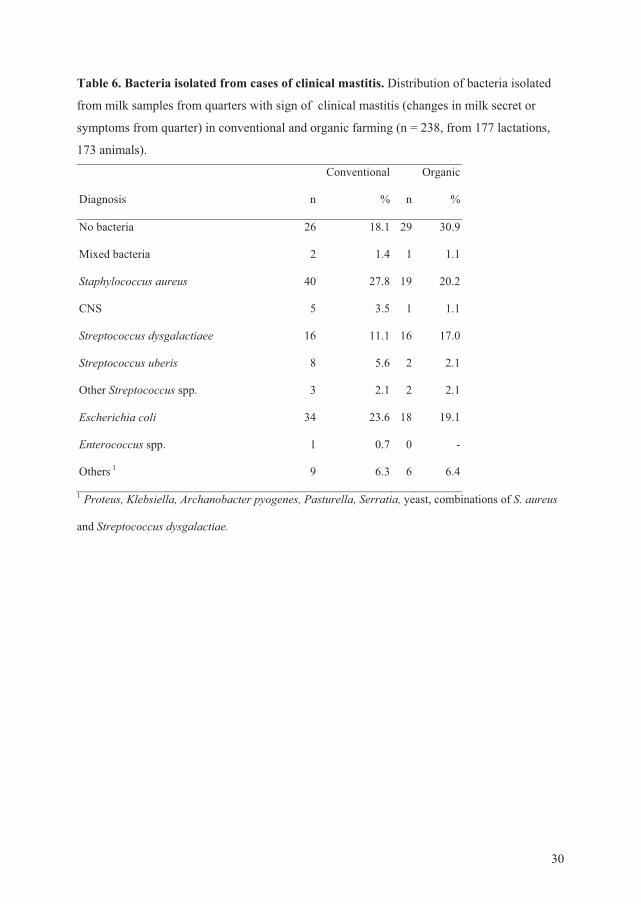
30
Table 6. Bacteria isolated from cases of clinical mastitis. Distribution of bacteria isolated
from milk samples from quarters with sign of clinical mastitis (changes in milk secret or
symptoms from quarter) in conventional and organic farming (n = 238, from 177 lactations,
173 animals).
Conventional Organic
Diagnosis n % n %
No bacteria 26 18.1 29 30.9
Mixed bacteria 2 1.4 1 1.1
Staphylococcus aureus 40 27.8 19 20.2
CNS 5 3.5 1 1.1
Streptococcus dysgalactiaee 16 11.1 16 17.0
Streptococcus uberis 8 5.6 2 2.1
Other Streptococcus spp. 3 2.1 2 2.1
Escherichia coli 34 23.6 18 19.1
Enterococcus spp. 1 0.7 0 -
Others 1 9 6.3 6 6.4
1 Proteus, Klebsiella, Archanobacter pyogenes, Pasturella, Serratia, yeast, combinations of S. aureus
and Streptococcus dysgalactiae.
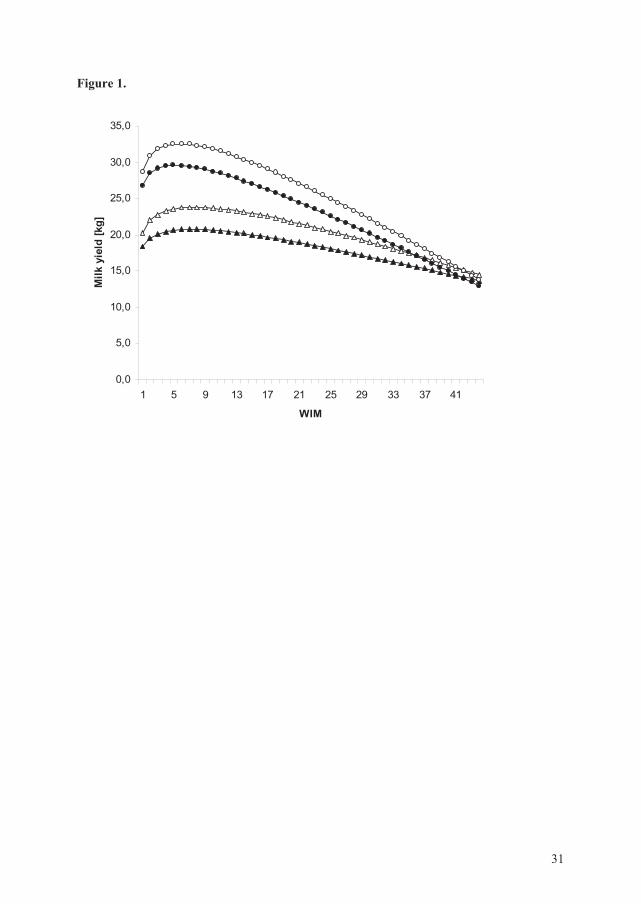
31
Figure 1.
0,0
5,0
10,0
15,0
20,0
25,0
30,0
35,0
1 5 9 13 17 21 25 29 33 37 41
WIM
Milk
yie
ld [k
g]
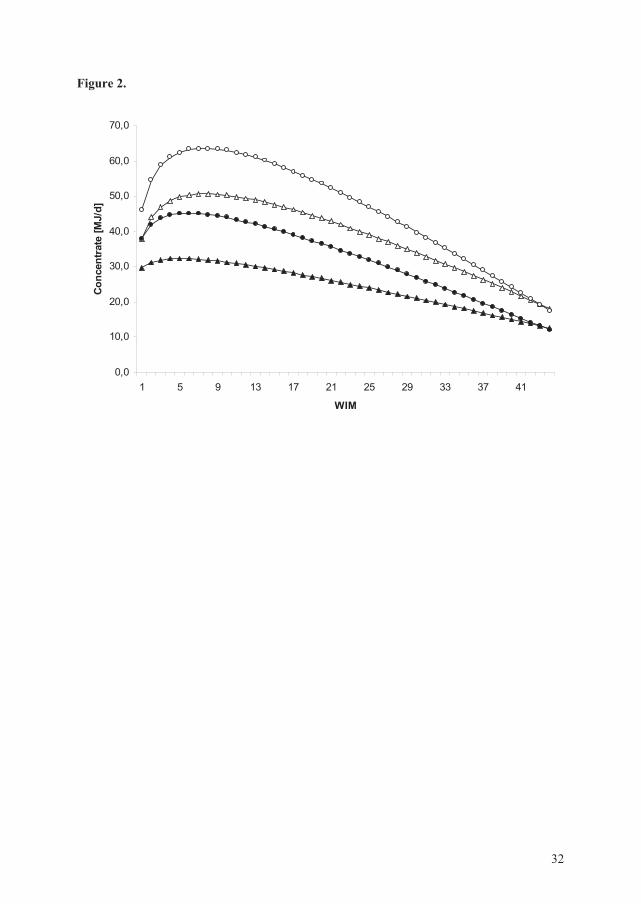
32
Figure 2.
0,0
10,0
20,0
30,0
40,0
50,0
60,0
70,0
1 5 9 13 17 21 25 29 33 37 41
WIM
Conc
entra
te [M
J/d]

33
Figure 3.
0
50
100
150
200
250
300
1 5 9 13 17 21 25 29 33 37 41
WIM
SCC
x 1
,000
