the skf · pdf fileharidwar, india. ahmedabad, india. 1. ... ~30% other (shop supplies and...
TRANSCRIPT

The SKF Group
SKF Investor Relations
April 2011

1SKF -
A truly global company
Established: 1907
Sales 2010: SEK 61,029 million
Employees: 44,742
Production sites: around 130 in 32 countries
SKF presence: in over 130 countries
Distributors/dealers: 15,000 locations
Global certificates:
ISO 14001OHSAS 18001 certification

2
Aerospace
Railway
Off-highway
Trucks
Two-wheeler and Electrical
General industry
Heavy industry
Special industrial equipment
Vehicle Service Market
Industrial distribution
Cars and light trucks
Commercial transport
Industrial business
Net sales by customer segment 2010
Energy
14%
5%
4%
3%
3%
13%
7%5%5%
12%
25%
4%
3
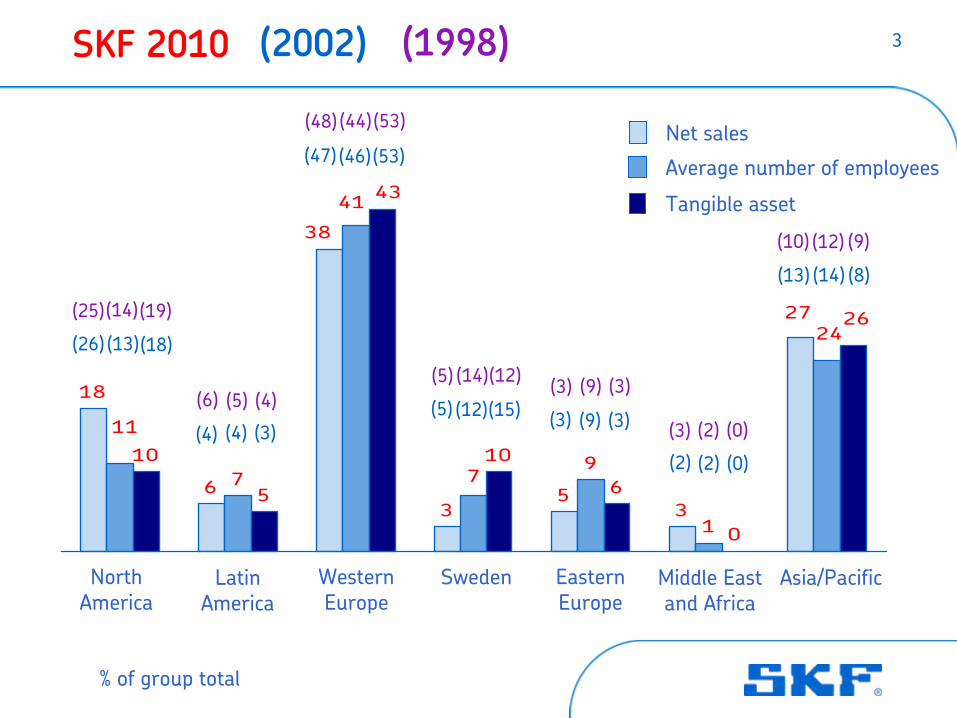
63
53
79
1
10
5
10
6
0
27
38
18
24
7
11
41
26
43
North America
Latin America
Western
Europe
Eastern Europe
Middle East and Africa
Asia/Pacific
Net sales
Average number of employees
Tangible asset
% of group total
SKF 2010
(18)
(8)(13)
(26) (13)
(14)
(2002) (1998)
(25)(14)(19)
(10) (12) (9)
Sweden
(4) (4) (3)(5) (12)(15) (3) (9) (3)
(2) (2) (0)
(47) (46) (53)
(6) (5) (4)(5) (14)(12) (3) (9) (3)
(3) (2) (0)
(48) (44) (53)

4
To equip the worldwith SKF knowledge
SKF Group Vision

5New facilities
opened
in 2010
3factories
9 Solution Factories
-
in total 17
Haridwar, India Ahmedabad, IndiaTver, Russia
1Global Technical
Centre in Shanghai

6
OpenedPlanned
Tianjin
TaiwanShanghai
Pune
Istanbul
JohannesburgBrasil
“IXION”
Colombia
Moscow
HoustonMonterreyMexico
Edmonton
Nordic (Gothenburg)
UK
Germany
Italy
France
17 SKF Solution Factories 2010
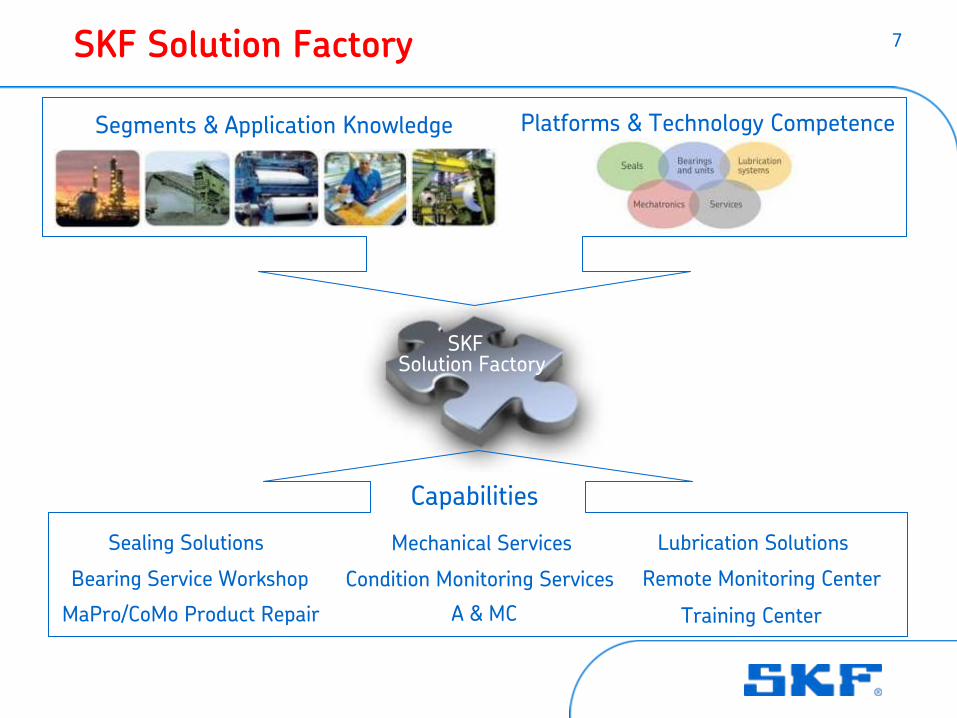
7SKF Solution Factory
Segments & Application Knowledge Platforms
& Technology
Competence
Capabilities
Sealing
Solutions Mechanical
Services Lubrication
Solutions
Training
Center
Bearing Service Workshop Condition
Monitoring
Services Remote
Monitoring
Center
MaPro/CoMo
Product
Repair A & MC
SKFSolution Factory

8LEED standard in new building constructions
SKF USA Inc. head office
New factories will be built according to the Leadership in Energy and Environmental Design (LEED) standard:
• Jinan, China (tapered roller bearings)• Dalian, China (mainly
medium-sized
bearings) • Mysore, India (seals)
SKF Jinan Factory, China
SKF Tver
Factory, Russia

9
New pitch bearingdesign with improvedcorrosion protection
DRTRB-unit “Nautilus”
with segmented cagefor minimized friction
New CRB-design withextra-high carrying capacityfor wind-gearboxes.
XL Hybrid bearingswith ceramic ballsfor superior insulation
SKF WindCon
3.0/WebconIntranet supervisedcondition monitoring
Automatic centralizedlubrication kits for reduced maintenance cost
SKF wind energy industry

10What is SKF knowledge?

11
Bearingsand units
SKF’s
platforms

12
Seals
SKF’s
platforms

13
Mechatronics
SKF’s
platforms

14SKF’s
platforms
Lubrication systems

15SKF’s
platforms
Services

16Acquisition
2003-2011 Identifying
gaps and opportunities
in all platforms
SealsBearingsand units
LubricationsystemsServices Mechatronics
Products
Technologies
Geographies
Segments
SNFA
(2006)
S2M
(2007)
QPM
(2008)
Economos
(2006)
Macrotech
(2006)
Macrotech
(2009)
Baker
(2007)
PMCI
(2007)
PB&A
(2006)
Monitek
(2006)
Safematic
(2006)
Vogel
(2004)
ALS
(2007)
Sommers
(2005)
ABBA
(2007)
Jaeger
(2005)
Peer
(2008)
GLO
(2008)
TCM (2003)
Scandrive
(2003)
Cirval
(2008)
Lincoln Industrial
(2010)

17
~20% Raw material (example: bars, tubes and rings)
~50% Components (example: forged and turned rings)
~30% Other (shop supplies and traded products etc.)
Cost split, % of total expenses (2010: SEK 52,438 m)
Employees
~35%
Other
~27%
Material
~34%
~4%
Depreciation & amortization

The SKF Group
Tom Johnstone, President and CEO
19 April 2011

19Key points, Q1 report
• Strong performance Operating profit:
SEK 2,504 m (1,702) Operating margin: 15.0% (11.8)Profit before tax: SEK 2,318 m (1,504)Cash flow: SEK 372 m (32)
• Strong organic sales growth in local currency:SKF Group: +21.4%Europe:
+22%
Industrial Division:
+20.8% North America:
+25%
Service Division:
+22.5% Asia:
+22%
Automotive Division:
+19.8%Latin America:
+18%
• Lincoln integration is going according to plan.
Outlook for Q2 for SKF Group• Demand
Significantly higher compared to Q2 2010Slightly higher sequentially compared to Q1 2011
• Manufacturing levelSignificantly higher year over yearRelatively unchanged compared to Q1 2011

20
New businesses:
•
SKF was
awarded
a contract, worth
around
SEK 500 million, with Goldwind
for SKF Nautilus
bearings
for their
new 2.5 MW direct
drive turbine.
•
SKF signed a three-year strategic partnership, worth SEK 335 million, with Sandvik
Mining and Construction.
•
SKF and Konkola
Copper Mines Plc in Zambia signed a three-year contract, worth USD 2 million, covering a Predictive Maintenance solution.
•
SKF
signed a strategic partnership agreement with CITIC Pacific Special Steel Co., Ltd, for cooperation in purchasing, new product and technology development and human resources development.
Highlights Q1 2011

21
•
SKF is building a new factory in Jinan, in the Shandong Province, China. The investment amounts to around SEK 590 million and the factory will initially employ about 500 people.
•
SKF signed an agreement to remain as the main partner to the Gothia
Cup for an additional three years. SKF will also continue to run the "Meet The World" qualifying tournaments held in around 20 countries globally.
Highlights Q1 2011
Jinan

22Divestments
2011
•
On 1 February 2011, the forging business OMVP, in Villar
Perosa, Italy to the German based company Neumayer
Tekfor
Holding GmbH. OMVP has about 550 employees and net sales of around EUR 100 million, mainly to SKF.
•
At the beginning of the second quarter the cage factory in Gothenburg to the Japanese component manufacturer Nakanishi Metal Works CO., Ltd. The factory has 130 employees and will continue to supply SKF.
SKF completed
two agreements in line with its strategy to divest non-core component manufacturing:

23Sales volume
-35-30-25-20-15-10-505
10152025
% change y-o-y
2009 2010 2011
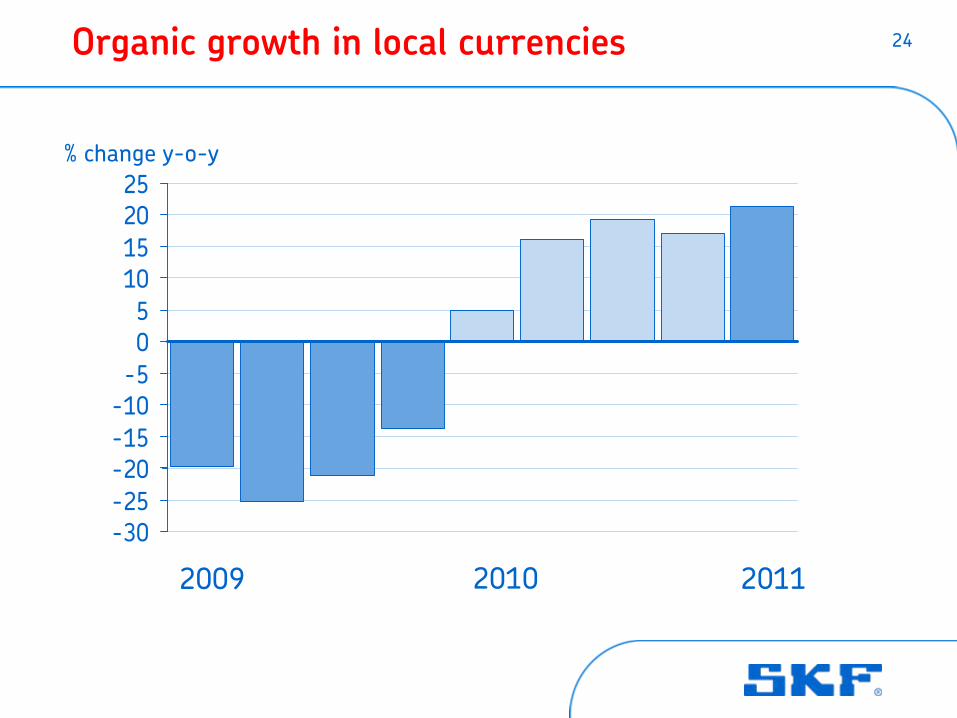
24Organic growth in local currencies
-30-25-20-15-10-505
10152025
% change y-o-y
2009 2010 2011

25
Europe
+22%
Asia/Pacific +22%
Latin America +18%
Middle East & Africa +4%
North America +25%
Growth
development
by geography Organic
growth
Q1 2011 vs Q1 2010

26
-20,0
14,2
21,4
1,0 0,05,0
-25-20-15-10-505
10152025
2009 2010 YTD March2011
Growth in local currency
% y-o-y
Acquisitions/DivestmentsOrganic growth
-19.0% 14.2% 26.4%
Long-term target: 8% per annum
Total growth

27Components in net sales
Q1 Q2 Q3 Q4 Q1 Q2 Q3 Q4 Q1
-26.9 -30.8 -24.9 -14.1 5.3 16.6 19.0 16.3 20.1
1.4 1.1 1.2 0.4 0.0 0.0 0.0 0.0 5.0
7.1 5.6 3.7 0.3 -0.3 -0.5 0.3 0.9 1.3
-18.4 -24.1 -20.0 -13.4 5.0 16.1 19.3 17.2 26.4
13.6 12.2 6.6 -1.4 -7.7 -5.2 -3.2 -6.2 -10.8
-4.8 -11.9 -13.4 -14.8 -2.7 10.9 16.1 11.0 15.6
Percent y-o-y
Volume
Structure
Price / Mix
Sales in local currency
Currency
Net sales
2009 2010 2011

28Operating profit
0200400600800
1 0001 2001 4001 6001 8002 0002 2002 4002 600
SEKm
2009
Restructuring
and one-time
items
2010 2011

29Operating margin
%
0
2
4
6
8
10
12
14
16
2009
Restructuring
and one-time
items
2010
Long-term target
level: 15%
2011

30Operating margin
0
2
4
6
8
10
12
14
16
2009 2010 YTD March2011
%
5.7
8.0*
Restructuring
and one-time
items
* Excluding
restructuring
and one-time
items
15.0
Long-term target
level: 15%
14.2*
13.8

31
-12-10
-8-6-4-202468
1012141618
Q1 Q2 Q3 Q4 Q1 Q2 Q3 Q4 Q1
Operating margin per division
IndustrialService
Automotive
%
Excluding one-off items
(eg. restructuring, impairments, capital gains)
2009 2010 2011

32
SEKm 2011 2010
Net sales 16,702 14,446
Operating profit 2,504 1,702
Operating margin, % 15.0 11.8
Operating margin excl. restructuring, % 15.0 12.4
Profit before taxes 2,318 1,504
Net profit 1,620 1,070
Basic earnings per share, SEK 3.44 2.27
Cash flow, after investments before financing 372 32
First quarter 2011
33
18
19
20
21
22
23
24
25
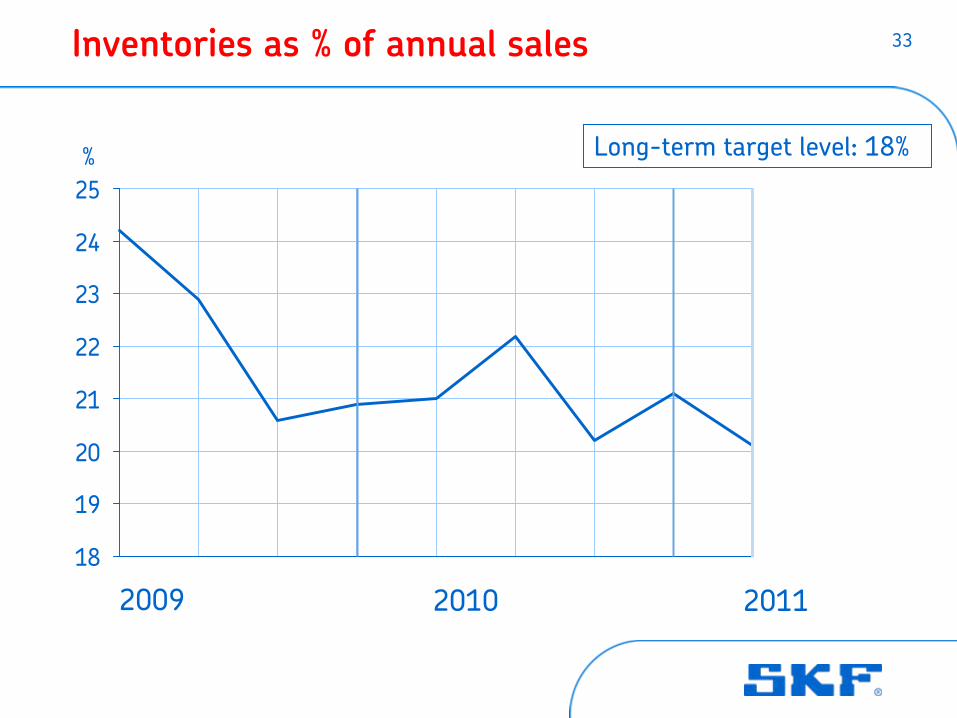
Inventories as % of annual sales
% Long-term target level: 18%
2009 2010 2011

34Cash flow, after investments before financing
-6 000-5 500-5 000-4 500-4 000-3 500-3 000-2 500-2 000-1 500-1 000
-5000
5001 0001 5002 0002 500SEKm
2009 2010
Cash out fromacquisitions (SEKm): 2009
2412010
6,799
2011

35Return on capital employed
0
5
10
15
20
25
30
2009 2010 YTD March 2011
ROCE: Operating profit plus interest income, as a percentage of twelve months average of total assets less the average of non-
interest bearing liabilities.
%
9.1
24.0
Long-term target: 27%
25.6

36Net debt (Short-term financial assets minus loans and post-employment benefits)
-18 000
-16 000
-14 000
-12 000
-10 000
-8 000
-6 000
-4 000
-2 000
0
SEKm AB SKF, dividend paid (SEKm):2009 Q2
1,5942010 Q2
1,594Proposal to the Board to be decided in April:2011 Q2
2,277
2009 2010
Cash out fromacquisitions (SEKm): 2009
2412010
6,799
2011

37
0
100
200
300
400
500
600
2011 2012 2013 2014 2015 2016
Debt structure
Maturity years, EURm
55
446
530
100100
•
Credit
facilities:
EUR 500 m 2014, whereof
EUR 400* m utilized
SEK 3,000 m 2017, unutilized
•
No financial
covenants
nor
material adverse
change
clause
400*
130
38March
2011: Outlook for the second quarter 2011
Demand compared to the second quarter last yearThe demand for SKF products and services is expected to be significantly higher for the Group and all geographical regions. It will be significantly
higher for Industrial Division and the Service Division and slightly higher for Automotive Division.
Demand compared to the first quarter 2011
The demand is expected to be slightly higher for the Group, higher in Asia and Latin America, slightly higher in North America and relatively unchanged in Europe. The Industrial Division and the Service Division are expected to be slightly higher and the Automotive Division relatively unchanged.
Manufacturing levelThe manufacturing level will be significantly higher year on year and relatively unchanged compared to the first quarter.
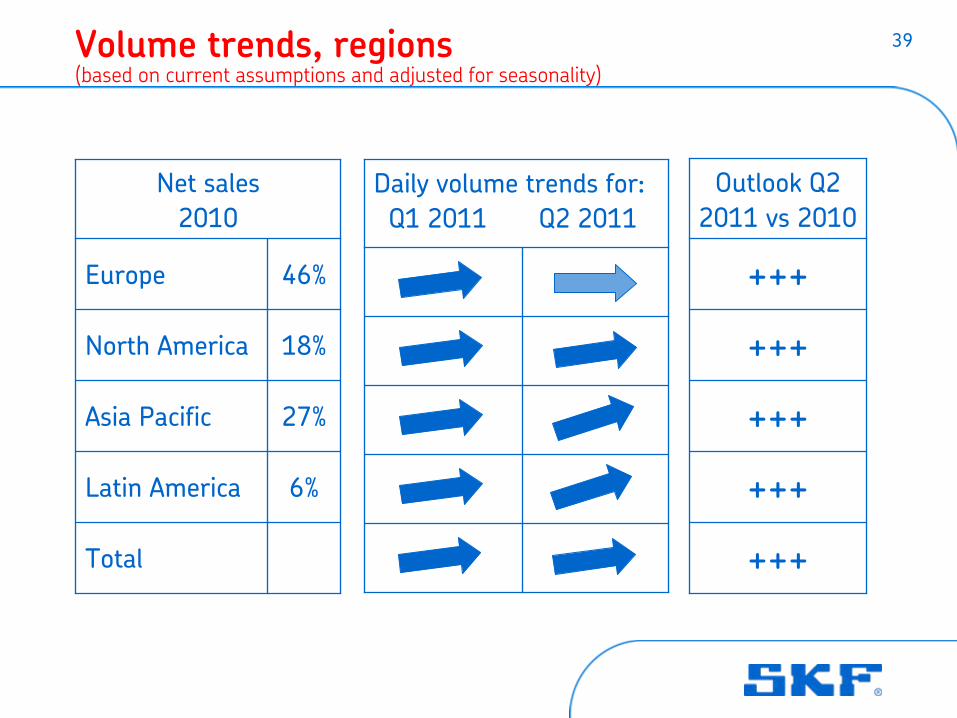
39Volume
trends, regions (based
on current
assumptions
and adjusted
for seasonality)
Daily volume
trends for: Q1 2011 Q2 2011
Net
sales2010
Europe 46%
North America 18%
Asia
Pacific 27%
Latin America 6%
Total
Outlook Q22011 vs 2010
+++
+++
+++
+++
+++

40Volume
trends, divisions (based
on current
assumptions
and adjusted
for seasonality)
Daily volume
trends for Q2 2011
Net
sales2010
Industrial 32%
Service 36%
Automotive 30%
Total
Outlook Q22011 vs 2010
+++
+++
+++
+++
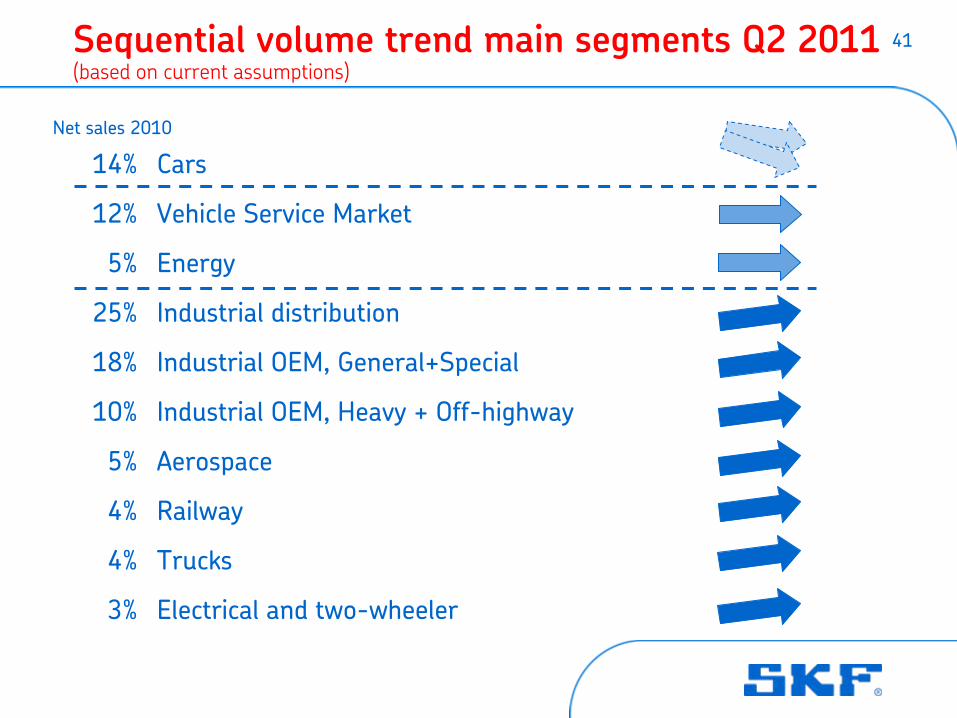
41
14%
12%
5%
25%
18%
10%
5%
4%
4%
3%
Cars
Vehicle
Service Market
Energy
Industrial distribution
Industrial OEM, General+Special
Industrial OEM, Heavy
+ Off-highway
Aerospace
Railway
Trucks
Electrical
and two-wheeler
Sequential
volume
trend main
segments Q2 2011 (based
on current
assumptions)
Net
sales
2010

42Guidance for the second quarter 2011
•
Tax level: around 30%
•
Financial net for the second quarter: Around SEK -175 m
•
Exchange rates on operating profit versus 2010 Q2: SEK -400 m
Full year: SEK -1.2 bn
•
Additions to PPE: Around SEK 2.3 bn
for 2011
Guidance is approximate and based on current assumptions and exchange rates.
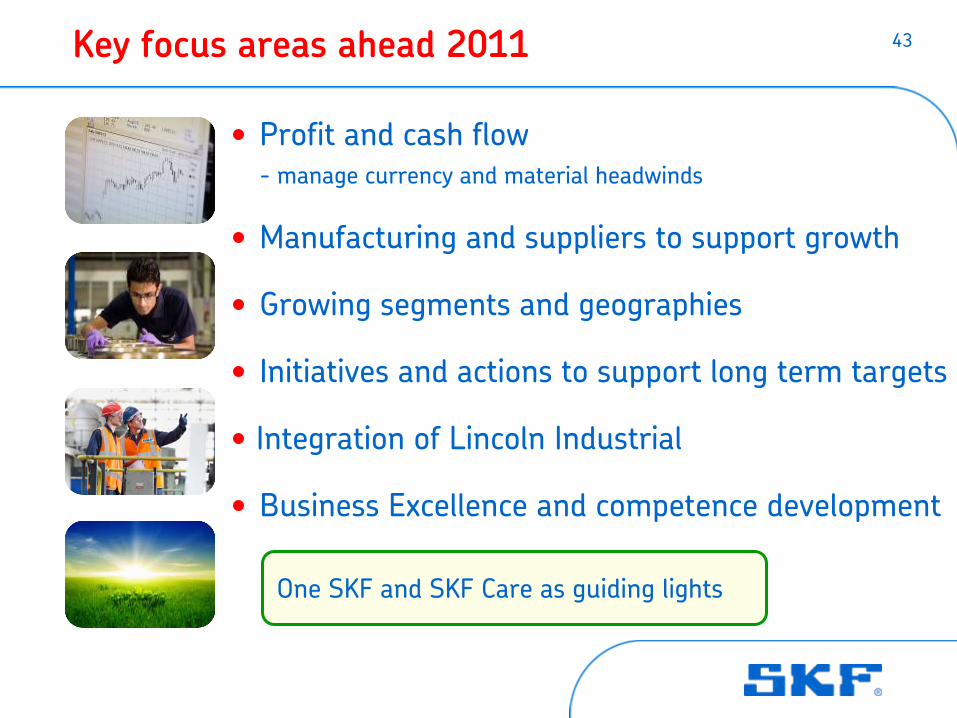
43Key focus areas ahead 2011
• Profit and cash flow-
manage currency and material headwinds
• Manufacturing and suppliers to support growth
• Growing segments and geographies
• Initiatives and actions to support long term targets
• Integration of Lincoln Industrial
• Business Excellence and competence development
One SKF and SKF Care as guiding lights

44Cautionary
statement
This presentation contains forward-looking statements that are based on the
current expectations of the management of SKF.
Although management believes that the expectations reflected in such forward-
looking statements are reasonable, no assurance can be given that such
expectations will prove to have been correct. Accordingly, results could differ
materially from those implied in the forward-looking statements as a result of,
among other factors, changes in economic, market and competitive
conditions,
changes in the regulatory environment and other government actions, fluctuations
in exchange rates and other factors mentioned in SKF's latest annual report
(available on www.skf.com) under the Administration Report; “Important factors
influencing the financial results", "Financial risks" and "Sensitivity analysis”.

45Welcome
to the IR website
–
www.skf.com
> Investors
Investor Relations function:Head:Marita
BjörkTel: +46 31 3371994Mobile: +46 705 181994E-mail: [email protected]
Investor Relations:Anna AlteTel: +46 31 3371988Mobile: +46 705 271988E-mail: [email protected]
Event coordinator and secretary:Monica SvenssonTel: +46 31 3372452Fax: +46 31 3371722E-mail: [email protected]

46