the skills needed to read and interpret maps are a part of visual literacy — a set of skills and...
TRANSCRIPT
Mapping SkillsFinding Your Location Throughout the World
Mr. KirbyWorld History
CHS
Every map serves a purpose. Every map has a story to tell.
Long Term Learning TargetsGeography 14.Create and use maps and other geographical representations to extrapolate and interpret geographic data.
Daily Supporting Learning Targets1. I can identify various FEATURES on a map and compare them to one
another on the map.2. I can describe the differences between maps and globes and explain
how they are made.
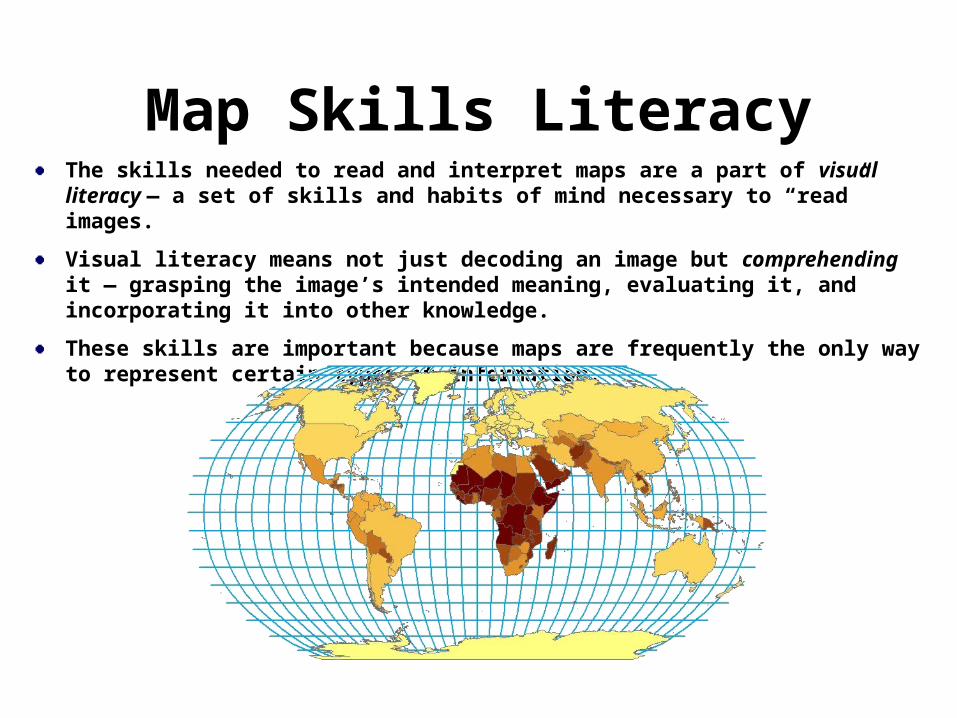
The skills needed to read and interpret maps are a part of visual literacy — a set of skills and habits of mind necessary to “read” images.
Visual literacy means not just decoding an image but comprehending it — grasping the image’s intended meaning, evaluating it, and incorporating it into other knowledge.
These skills are important because maps are frequently the only way to represent certain types of information.
Map Skills Literacy
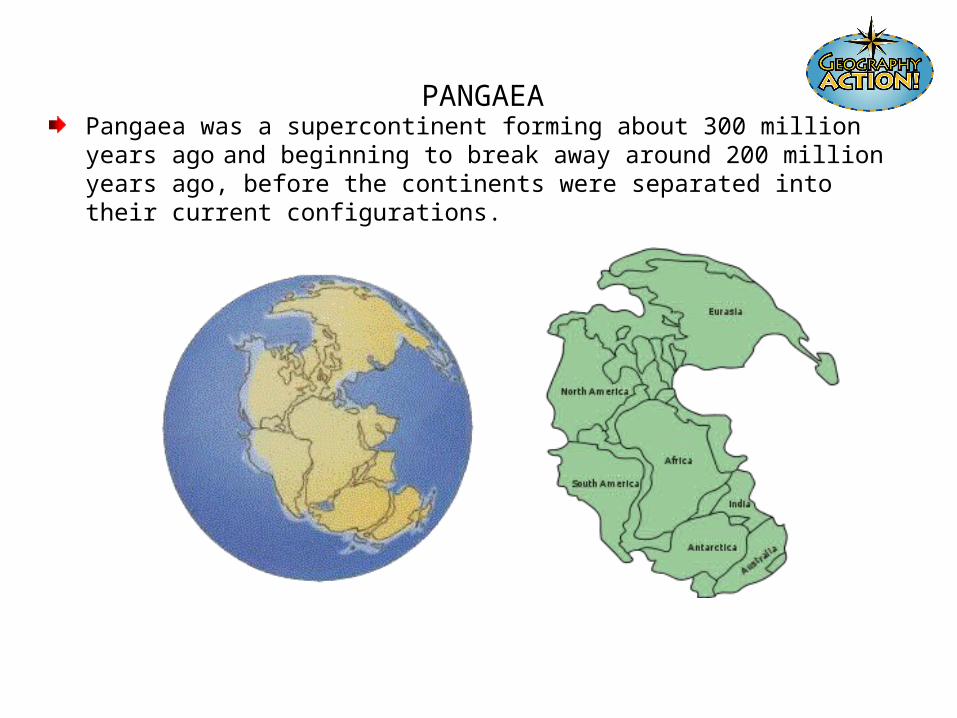
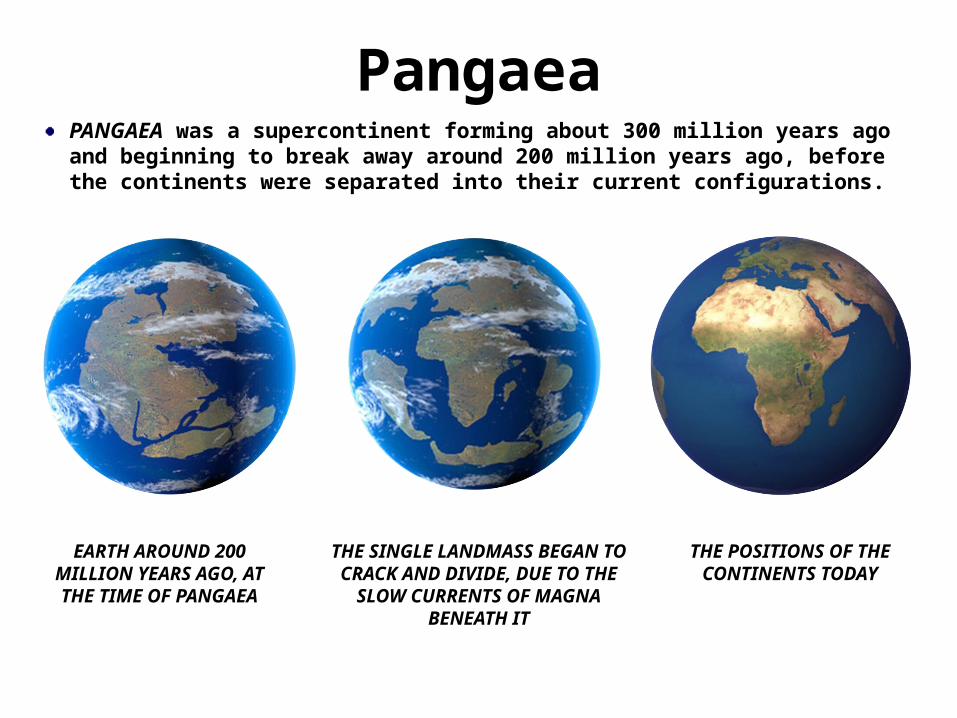
PANGAEAPangaea was a supercontinent forming about 300 million years ago and beginning to break away around 200 million years ago, before the continents were separated into their current configurations.
PANGAEA was a supercontinent forming about 300 million years ago
and beginning to break away around 200 million years ago, before the continents were separated into their current configurations.
Pangaea
THE POSITIONS OF THE CONTINENTS
TODAY
THE SINGLE LANDMASS BEGAN TO CRACK AND
DIVIDE, DUE TO THE SLOW CURRENTS OF MAGNA
BENEATH IT
EARTH AROUND 200 MILLION YEARS
AGO, AT THE TIME OF PANGAEA
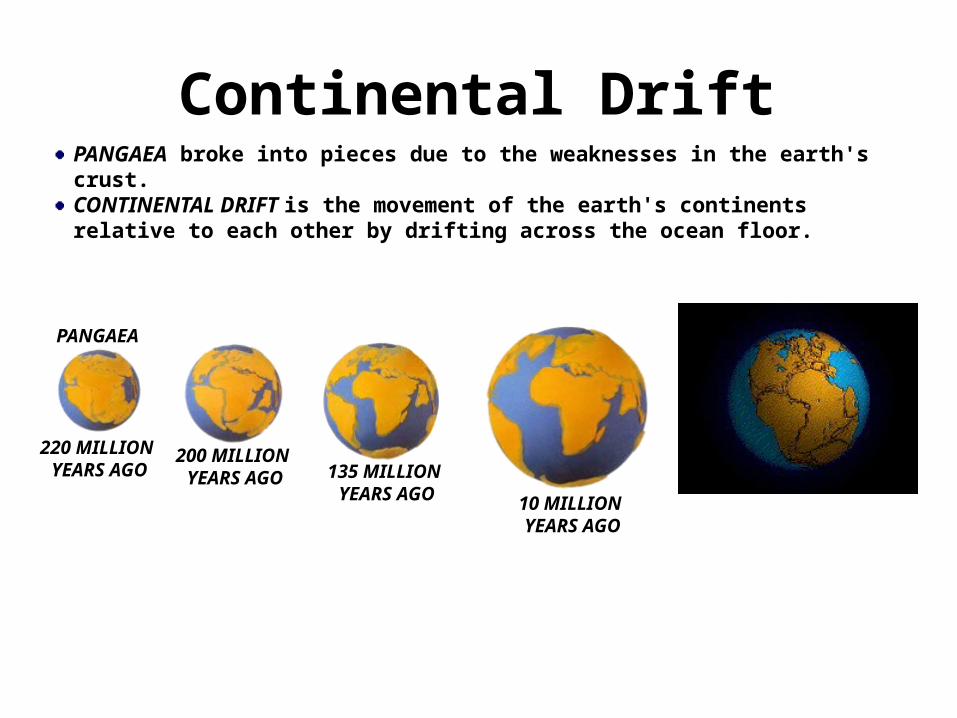
PANGAEA broke into pieces due to the weaknesses in the earth's crust. CONTINENTAL DRIFT is the movement of the earth's continents relative to each other by drifting across the ocean floor.
Continental Drift
220 MILLION YEARS AGO
200 MILLION YEARS AGO 135 MILLION
YEARS AGO 10 MILLION YEARS AGO
PANGAEA

The continents are in slow but constant motion, riding on top of pieces of Earth’s crust called TECTONIC PLATES.
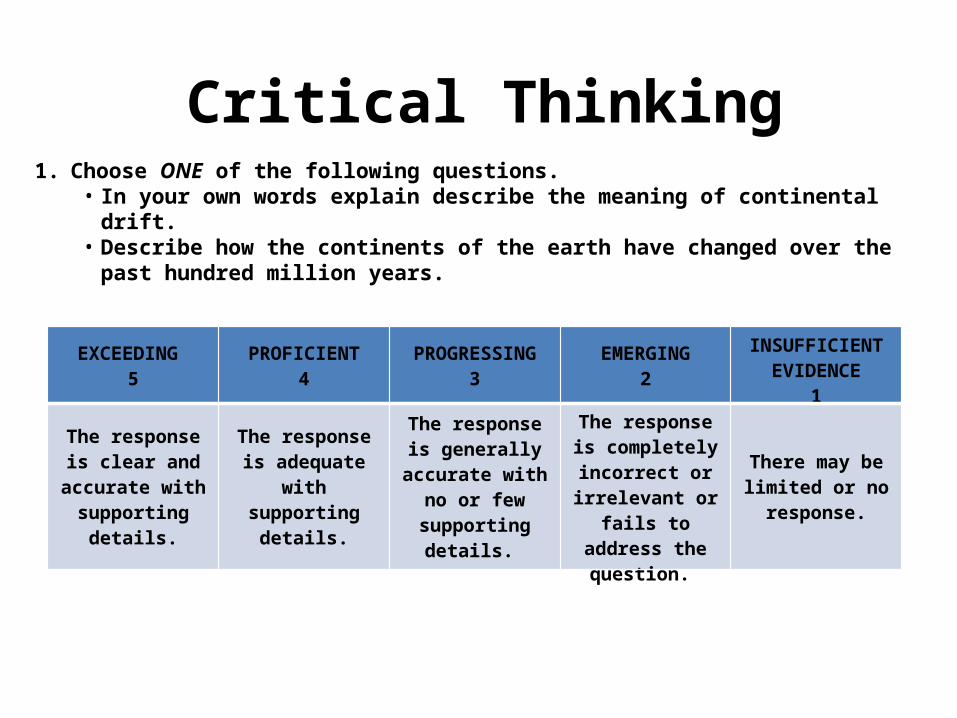
1. Choose ONE of the following questions.• In your own words explain describe the meaning of continental
drift.• Describe how the continents of the earth have changed over the
past hundred million years.
Critical Thinking
EXCEEDING 5
PROFICIENT4
PROGRESSING3
EMERGING2
INSUFFICIENT EVIDENCE
1
The response is clear and
accurate with supporting
details.
The response is adequate
with supporting
details.
The response is generally
accurate with no or few
supporting details.
The response is completely incorrect or irrelevant or
fails to address the question.
There may be limited or no
response.
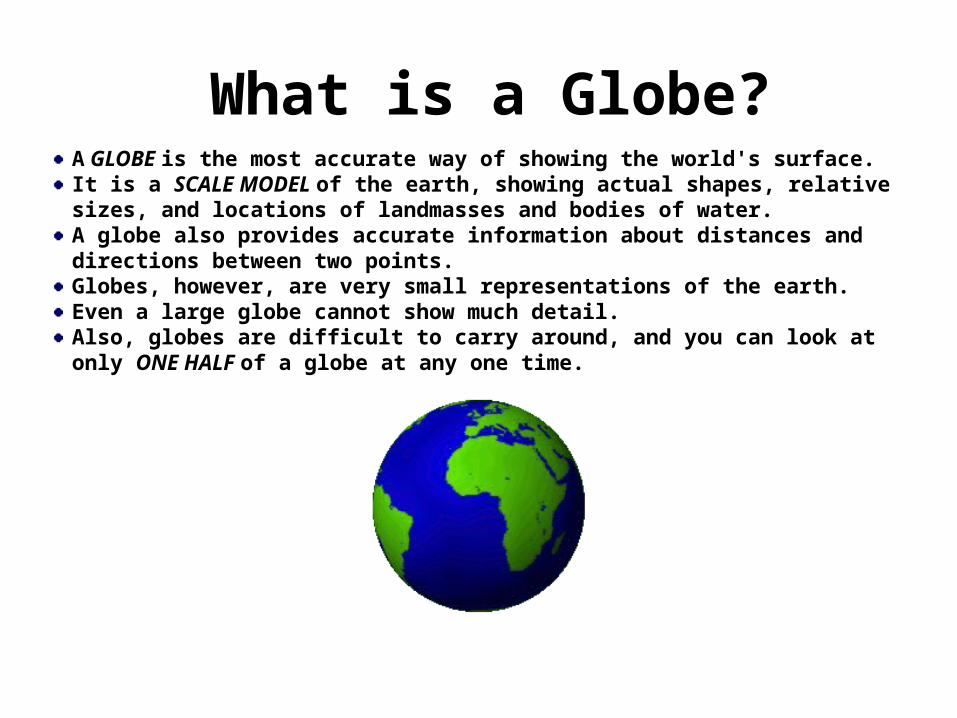
A GLOBE is the most accurate way of showing the world's surface.It is a SCALE MODEL of the earth, showing actual shapes, relative sizes, and locations of landmasses and bodies of water.A globe also provides accurate information about distances and directions between two points.Globes, however, are very small representations of the earth.Even a large globe cannot show much detail. Also, globes are difficult to carry around, and you can look at only ONE HALF of a globe at any one time.
What is a Globe?
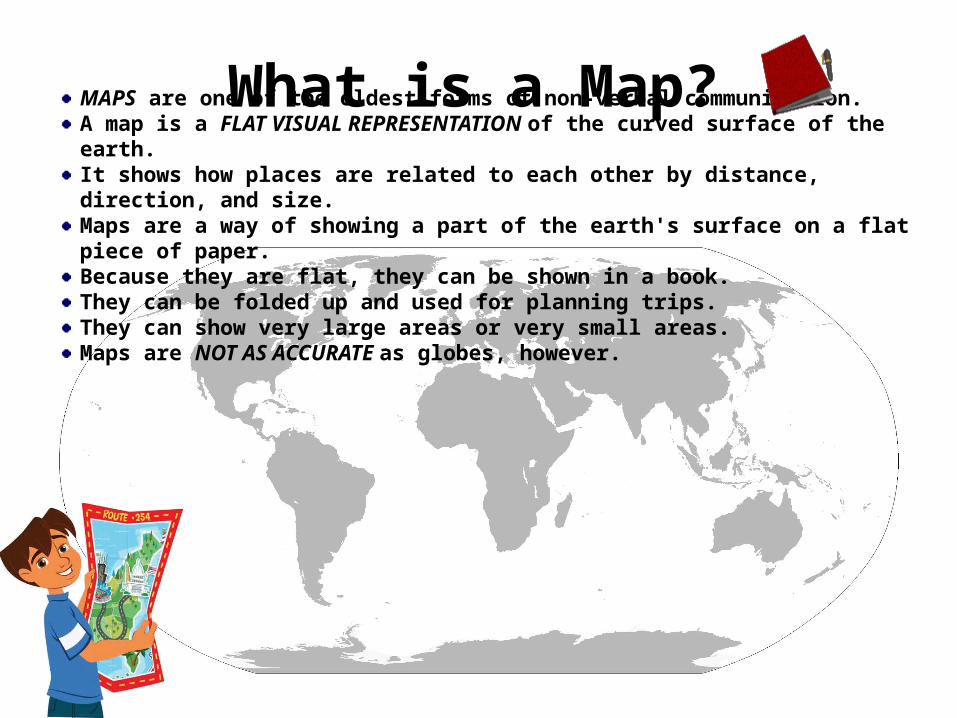
MAPS are one of the oldest forms of non-verbal communication.A map is a FLAT VISUAL REPRESENTATION of the curved surface of the earth.It shows how places are related to each other by distance, direction, and size. Maps are a way of showing a part of the earth's surface on a flat piece of paper.Because they are flat, they can be shown in a book. They can be folded up and used for planning trips. They can show very large areas or very small areas. Maps are NOT AS ACCURATE as globes, however.
What is a Map?
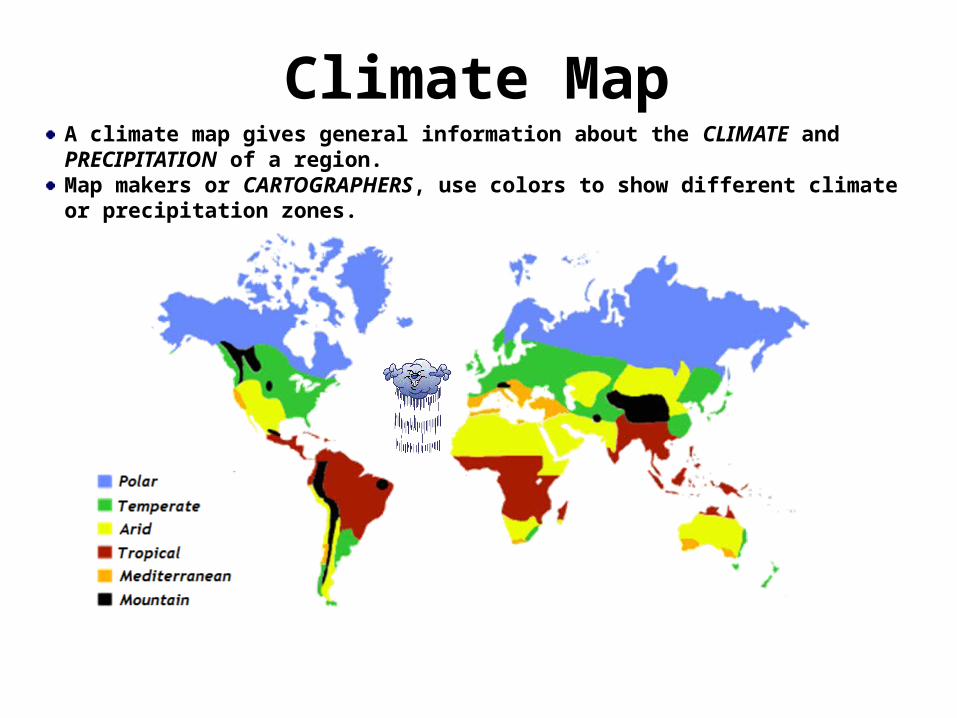
A climate map gives general information about the CLIMATE and PRECIPITATION of a region. Map makers or CARTOGRAPHERS, use colors to show different climate or precipitation zones.
Climate Map
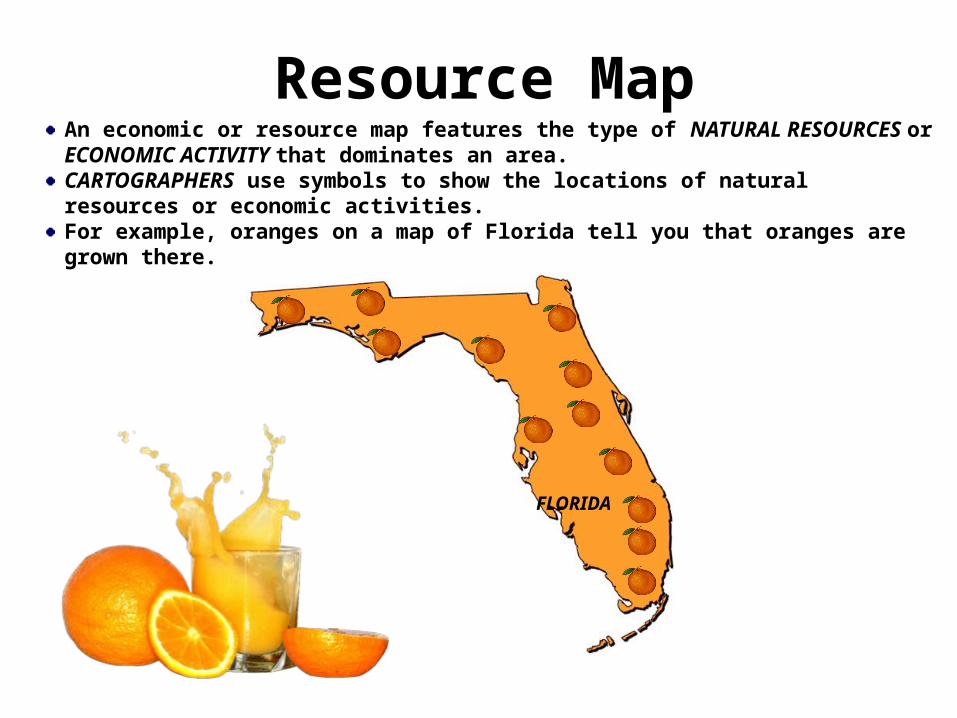
An economic or resource map features the type of NATURAL RESOURCES or ECONOMIC ACTIVITY that dominates an area. CARTOGRAPHERS use symbols to show the locations of natural resources or economic activities. For example, oranges on a map of Florida tell you that oranges are grown there.
Resource Map
FLORIDA
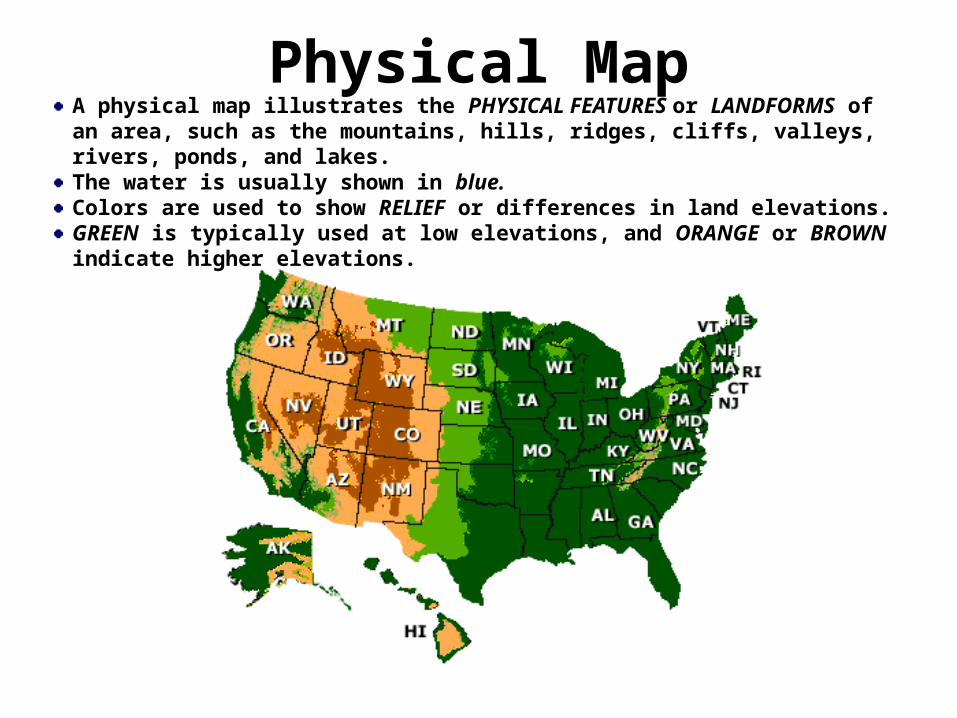
A physical map illustrates the PHYSICAL FEATURES or LANDFORMS of an area, such as the mountains, hills, ridges, cliffs, valleys, rivers, ponds, and lakes. The water is usually shown in blue.Colors are used to show RELIEF or differences in land elevations.GREEN is typically used at low elevations, and ORANGE or BROWN indicate higher elevations.
Physical Map
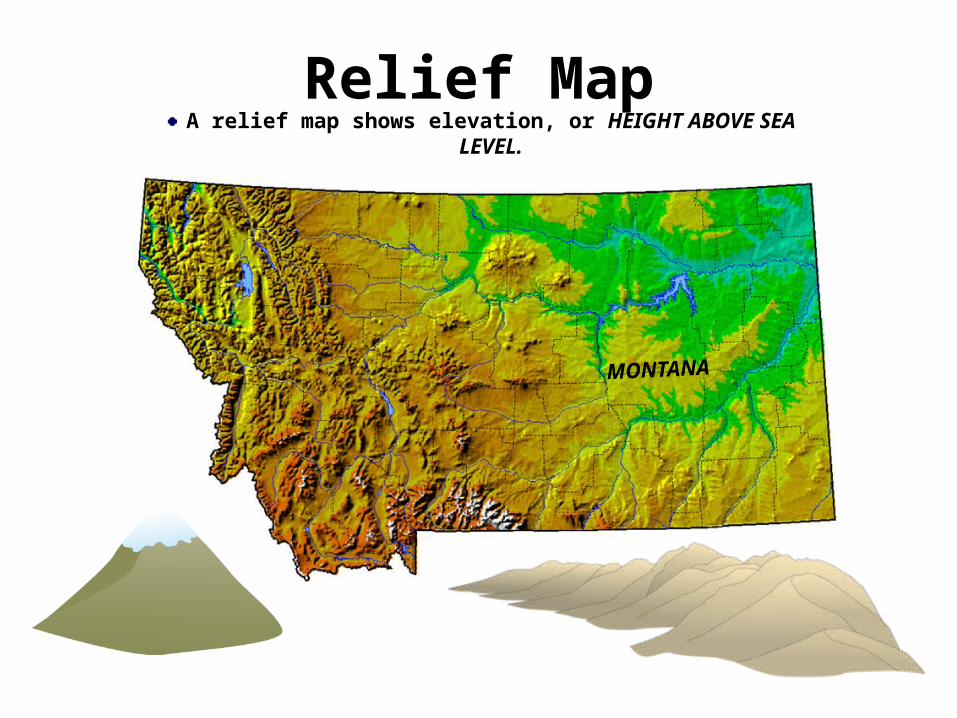
A relief map shows elevation, or HEIGHT ABOVE SEA LEVEL.
Relief Map
MONTANA

A political map does not show physical features. Instead, they indicate state and NATIONAL BOUNDARIES and capital and major cities.A CAPITAL CITY is usually marked with a STAR within a circle.
Political Map
BRAZILPERU
ARGENTINA
URUGUAY
ECUADOR
BOLIVIA
PARAGUAYCHILE
COLOMBIA
VENEZUELAGUYANA
SURINAME
FRENCH GUIANA
Brasilia
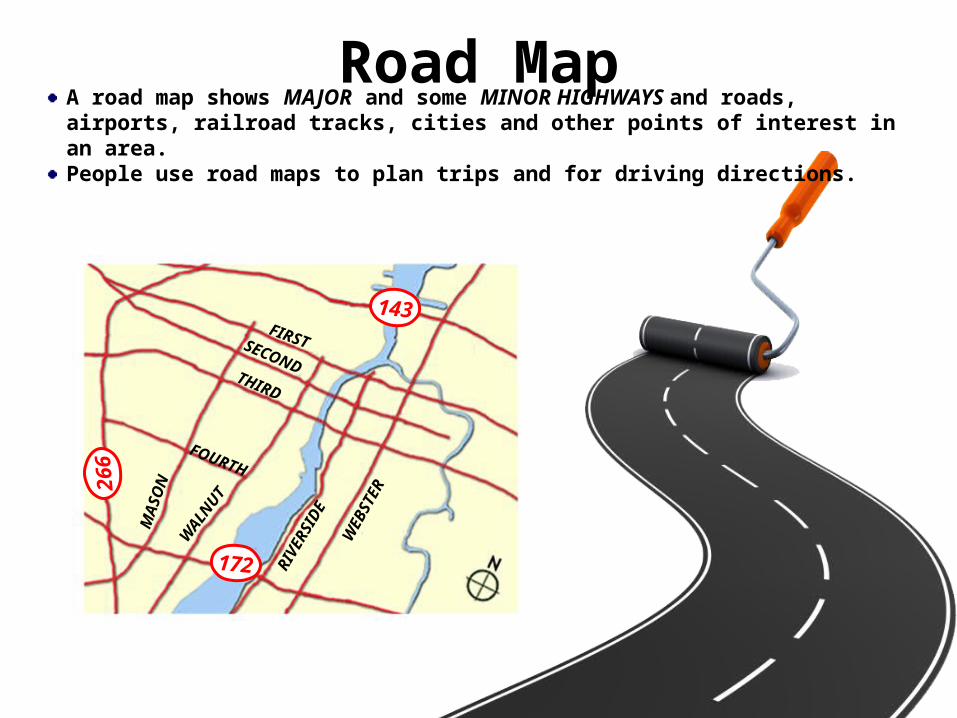
A road map shows MAJOR and some MINOR HIGHWAYS and roads, airports, railroad tracks, cities and other points of interest in an area. People use road maps to plan trips and for driving directions.
Road Map
SECOND
FIRST
THIRD
WEBSTER
WALN
UT
FOURTH
MA
SO
N
RIV
ERSID
E143
266
172
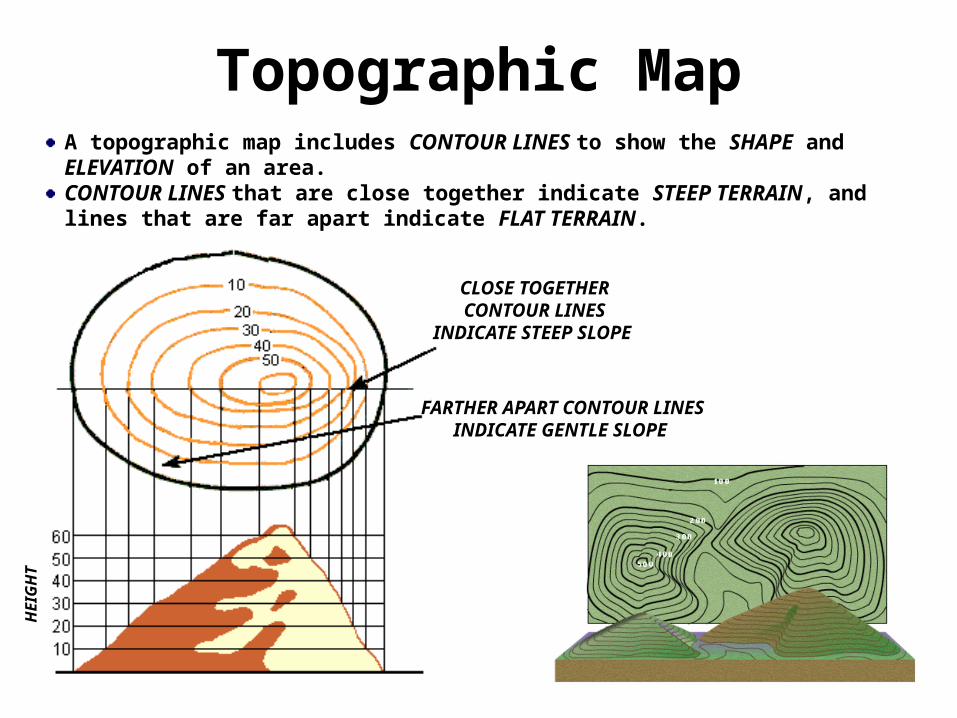
A topographic map includes CONTOUR LINES to show the SHAPE and ELEVATION of an area. CONTOUR LINES that are close together indicate STEEP TERRAIN, and lines that are far apart indicate FLAT TERRAIN.
Topographic Map
CLOSE TOGETHER CONTOUR LINES INDICATE STEEP
SLOPE
FARTHER APART CONTOUR LINES INDICATE GENTLE
SLOPE
HEIG
HT
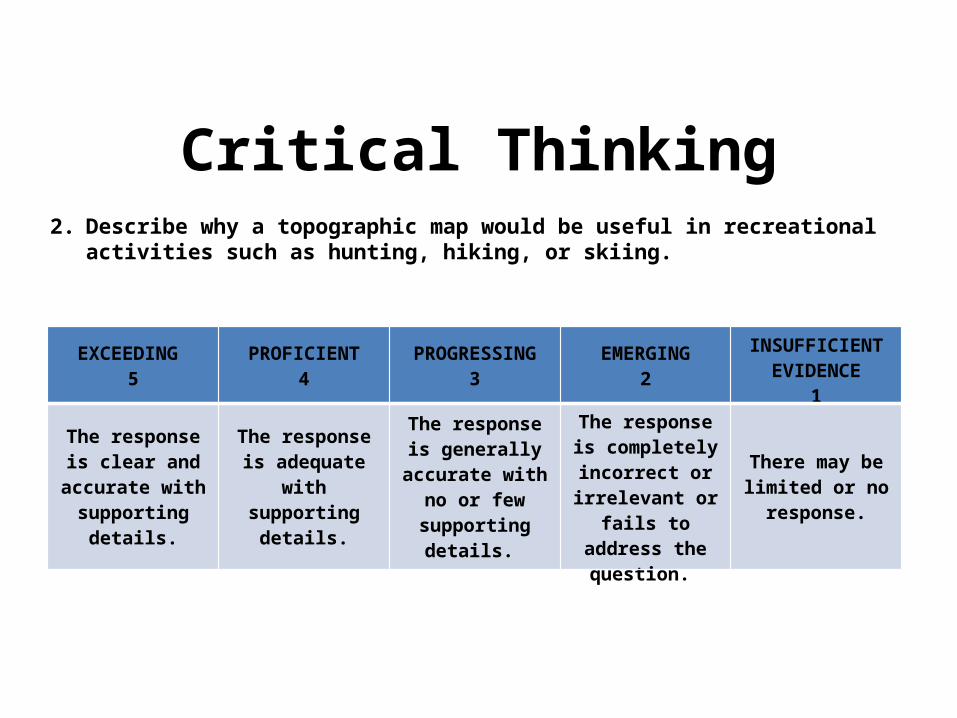
2. Describe why a topographic map would be useful in recreational activities such as hunting, hiking, or skiing.
Critical Thinking
EXCEEDING 5
PROFICIENT4
PROGRESSING3
EMERGING2
INSUFFICIENT EVIDENCE
1
The response is clear and
accurate with supporting
details.
The response is adequate
with supporting
details.
The response is generally
accurate with no or few
supporting details.
The response is completely incorrect or irrelevant or
fails to address the question.
There may be limited or no
response.
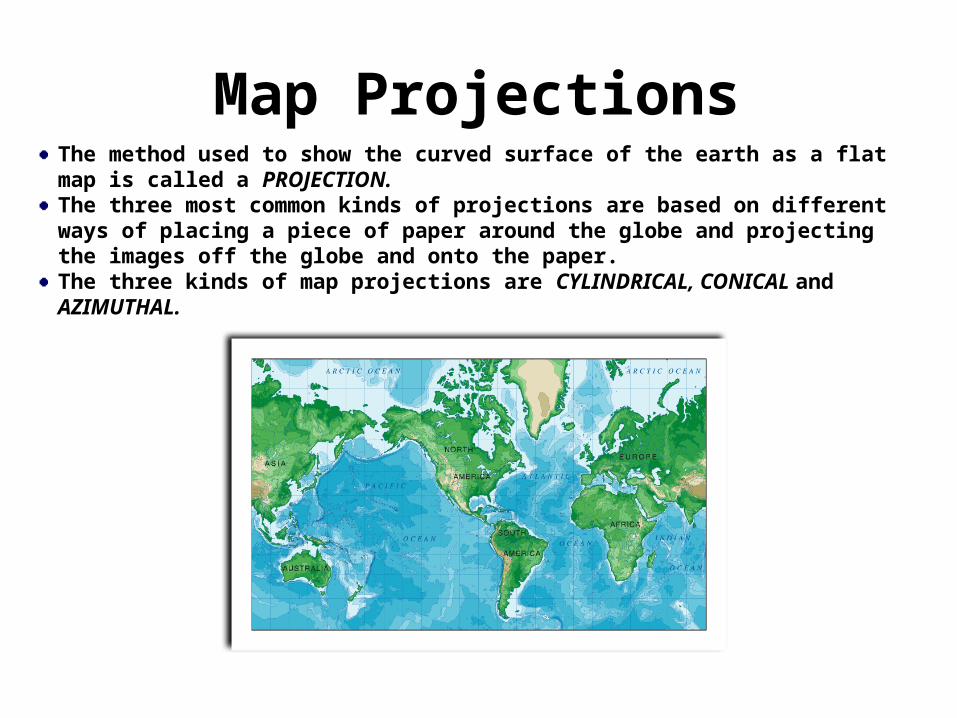
Map ProjectionsThe method used to show the curved surface of the earth as a flat map is called a PROJECTION.The three most common kinds of projections are based on different ways of placing a piece of paper around the globe and projecting the images off the globe and onto the paper.The three kinds of map projections are CYLINDRICAL, CONICAL and AZIMUTHAL.
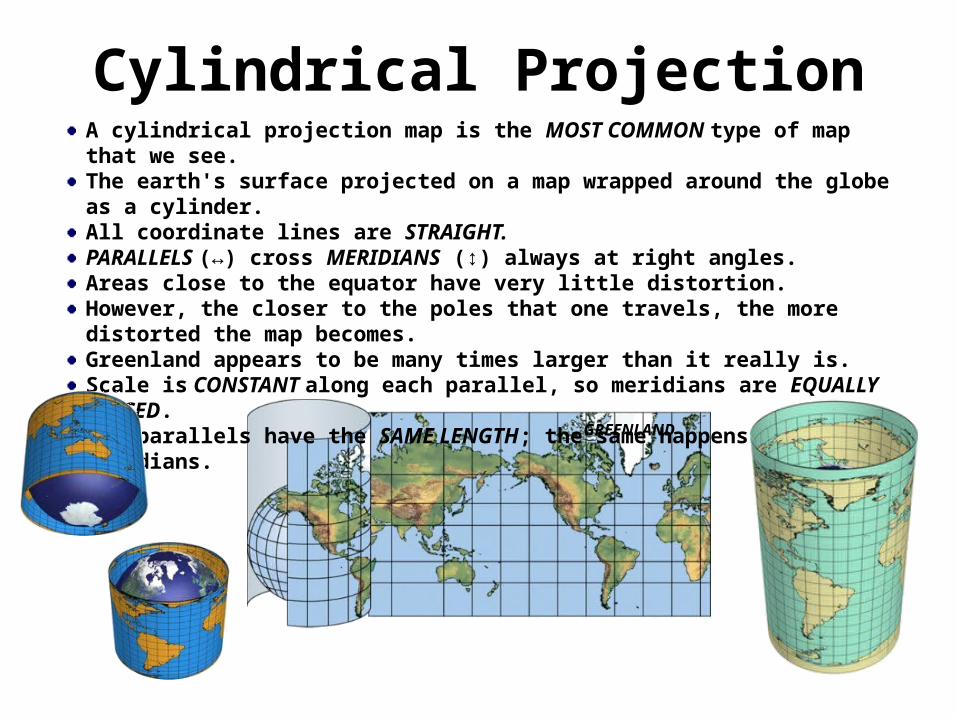
Cylindrical ProjectionA cylindrical projection map is the MOST COMMON type of map that we see. The earth's surface projected on a map wrapped around the globe as a cylinder. All coordinate lines are STRAIGHT.PARALLELS (↔) cross MERIDIANS (↕) always at right angles. Areas close to the equator have very little distortion.However, the closer to the poles that one travels, the more distorted the map becomes.Greenland appears to be many times larger than it really is.Scale is CONSTANT along each parallel, so meridians are EQUALLY SPACED.All parallels have the SAME LENGTH; the same happens to meridians.
GREENLAND
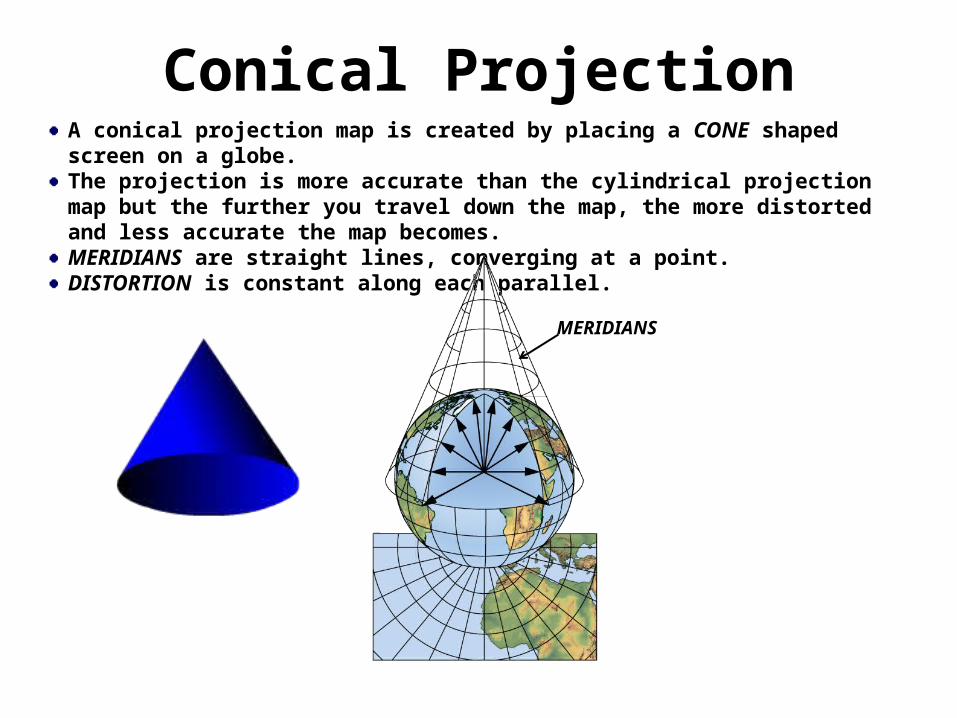
A conical projection map is created by placing a CONE shaped screen on a globe. The projection is more accurate than the cylindrical projection map but the further you travel down the map, the more distorted and less accurate the map becomes.MERIDIANS are straight lines, converging at a point.DISTORTION is constant along each parallel.
Conical Projection
MERIDIANS
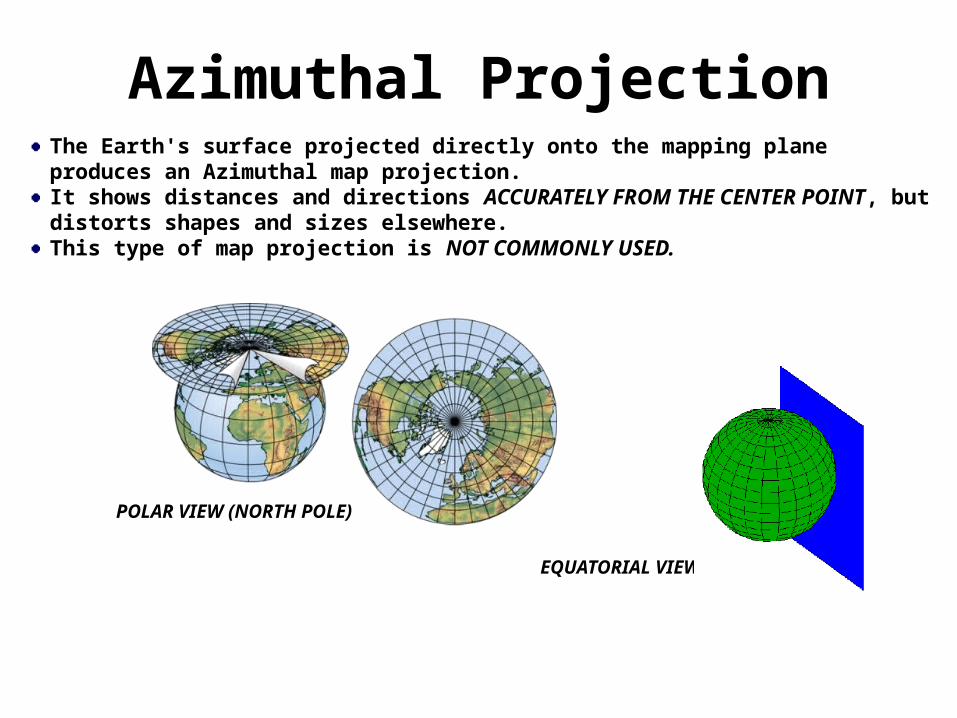
The Earth's surface projected directly onto the mapping plane produces an Azimuthal map projection. It shows distances and directions ACCURATELY FROM THE CENTER POINT, but distorts shapes and sizes elsewhere. This type of map projection is NOT COMMONLY USED.
POLAR VIEW (NORTH POLE)
EQUATORIAL VIEW (EQUATOR)
Azimuthal Projection

Map DistortionEach of the different types of map projections has strengths and weaknesses. DISTORTION is a FALSE PRESENTATION of angles, shapes, distances and areas, in any degree or combination. No matter how sophisticated the projection process, the original surface's features can never be perfectly converted to a flat map: DISTORTION, great or small, is always present in at least one region of planar maps of a sphere.
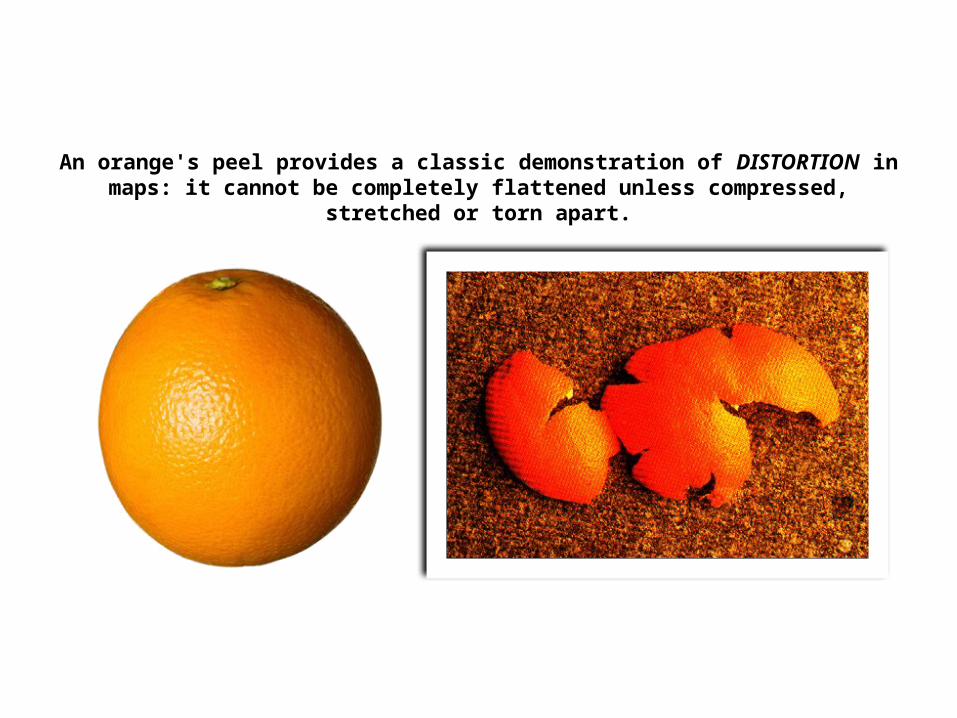
An orange's peel provides a classic demonstration of DISTORTION in maps: it cannot be completely flattened unless compressed,
stretched or torn apart.
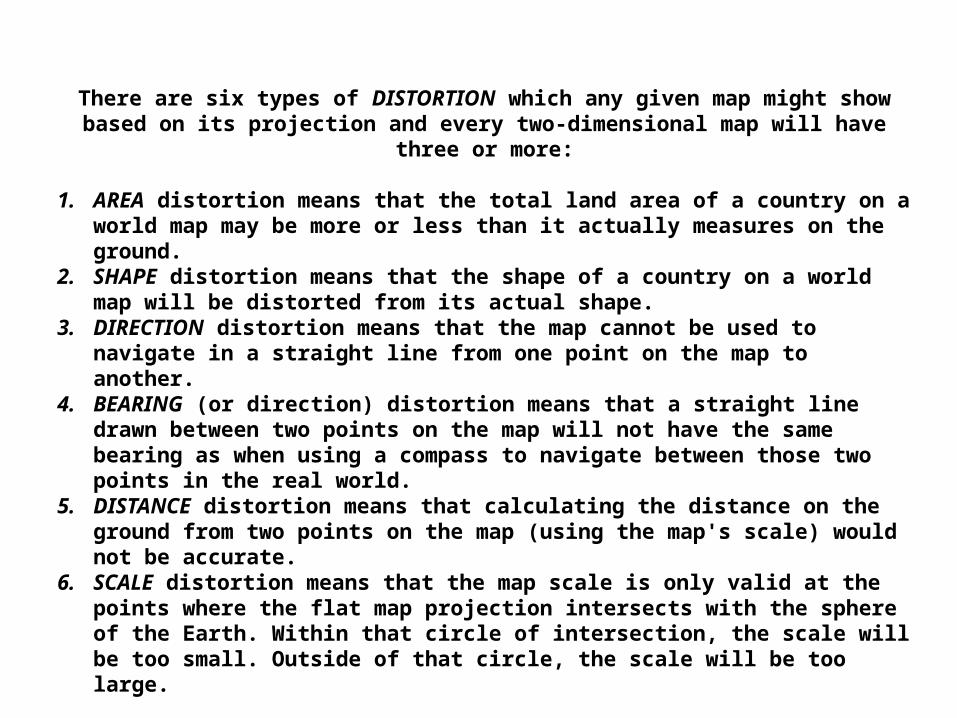
There are six types of DISTORTION which any given map might show based on its projection and every two-dimensional map will have three
or more:
1. AREA distortion means that the total land area of a country on a world map may be more or less than it actually measures on the ground.
2. SHAPE distortion means that the shape of a country on a world map will be distorted from its actual shape.
3. DIRECTION distortion means that the map cannot be used to navigate in a straight line from one point on the map to another.
4. BEARING (or direction) distortion means that a straight line drawn between two points on the map will not have the same bearing as when using a compass to navigate between those two points in the real world.
5. DISTANCE distortion means that calculating the distance on the ground from two points on the map (using the map's scale) would not be accurate.
6. SCALE distortion means that the map scale is only valid at the points where the flat map projection intersects with the sphere of the Earth. Within that circle of intersection, the scale will be too small. Outside of that circle, the scale will be too large.
A GLOBE is the only true representation of the Earth.
3. Discuss DISTORTION and why can’t maps represent the surface of the planet the way globes can.
Critical Thinking
EXCEEDING 5
PROFICIENT4
PROGRESSING3
EMERGING2
INSUFFICIENT EVIDENCE
1
The response is clear and
accurate with supporting
details.
The response is adequate
with supporting
details.
The response is generally
accurate with no or few
supporting details.
The response is completely incorrect or irrelevant or
fails to address the question.
There may be limited or no
response.
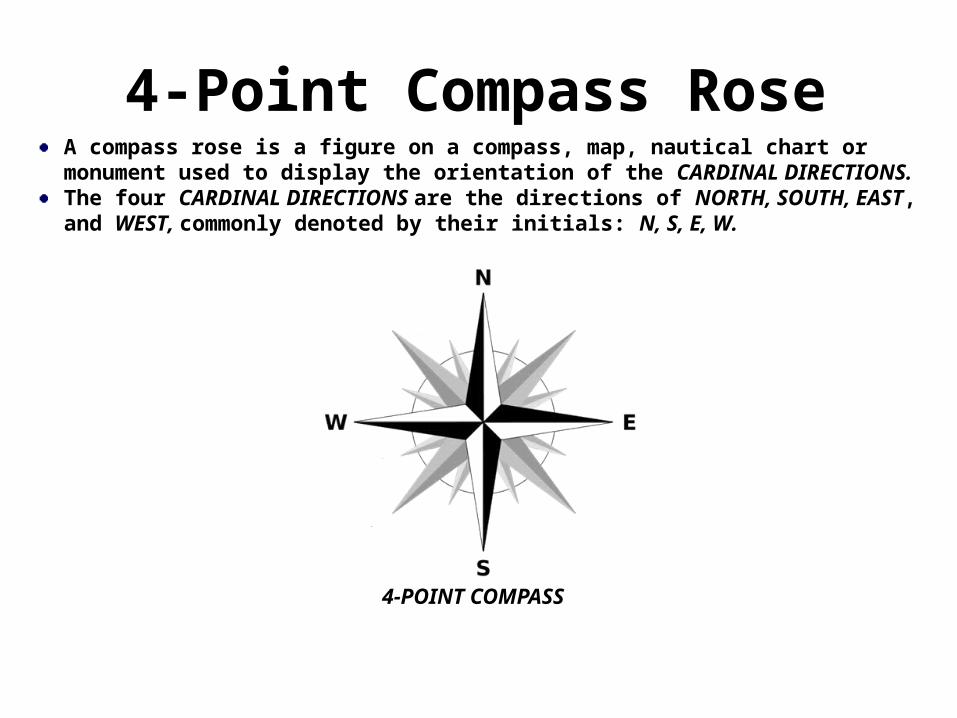
A compass rose is a figure on a compass, map, nautical chart or monument used to display the orientation of the CARDINAL DIRECTIONS.The four CARDINAL DIRECTIONS are the directions of NORTH, SOUTH, EAST, and WEST, commonly denoted by their initials: N, S, E, W.
4-POINT COMPASS
4-Point Compass Rose
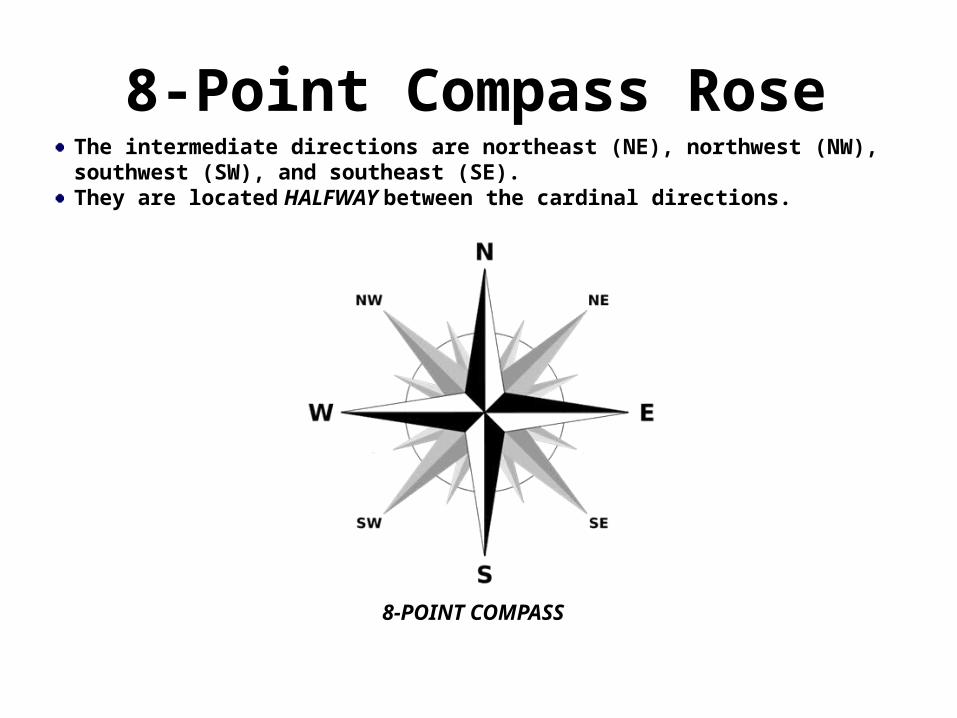
The intermediate directions are northeast (NE), northwest (NW), southwest (SW), and southeast (SE). They are located HALFWAY between the cardinal directions.
8-POINT COMPASS
8-Point Compass Rose
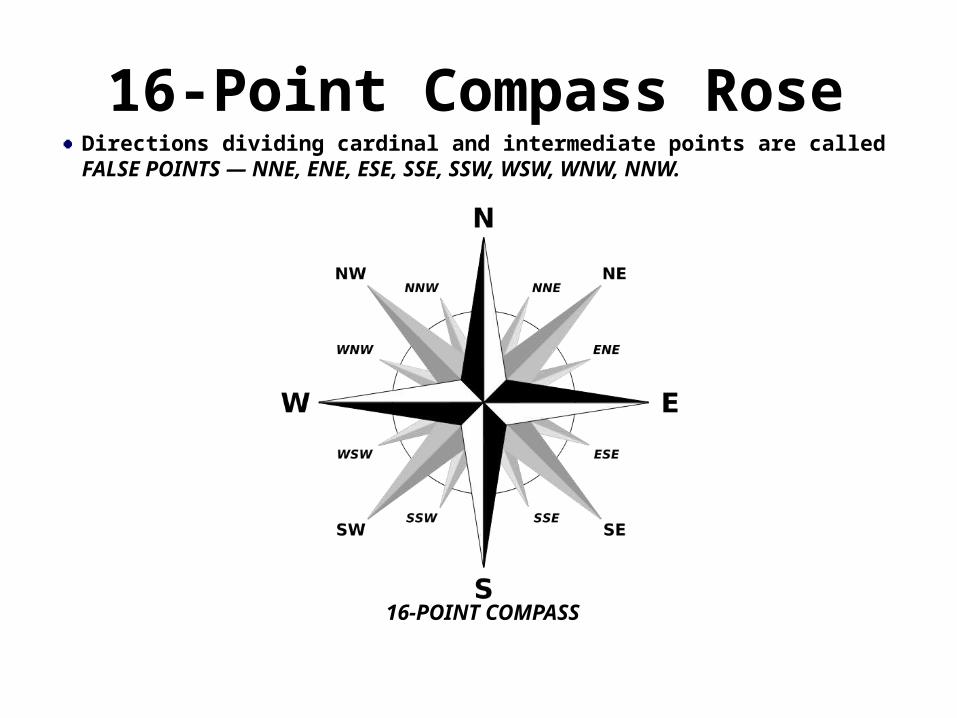
Directions dividing cardinal and intermediate points are called FALSE POINTS — NNE, ENE, ESE, SSE, SSW, WSW, WNW, NNW.
16-POINT COMPASS
16-Point Compass Rose

A map must be drawn to SCALE to be accurate. The SCALE of a map is often expressed as so many UNITS ON THE MAP equaling so many UNITS ON THE GROUND. Scale can be described or shown in three different ways:
1. WORDS: one inch equals 100 miles.2. FRACTION or RATIO: 1/100 (one “unit” on the map equals “100”
units on the Earth’s surface) 3. SCALE BAR:
Example:The scale on a map indicates that 1-inch equals 240
miles.Using a ruler, the distance between the two cities is 3
inches. How far is it from Chicago, Illinois, to Montreal,
Canada?240 miles x 3 inches = 720 miles.
Map Scale

The mapmaker uses standard SYMBOLS. They represent NATURAL and MANMADE features. Resemble as closely as possible, the actual features but as viewed from above.
DRY LAKE LAKESTREAM
RAILROADATHLETIC FIELD
HIGHWAY
Map Symbols
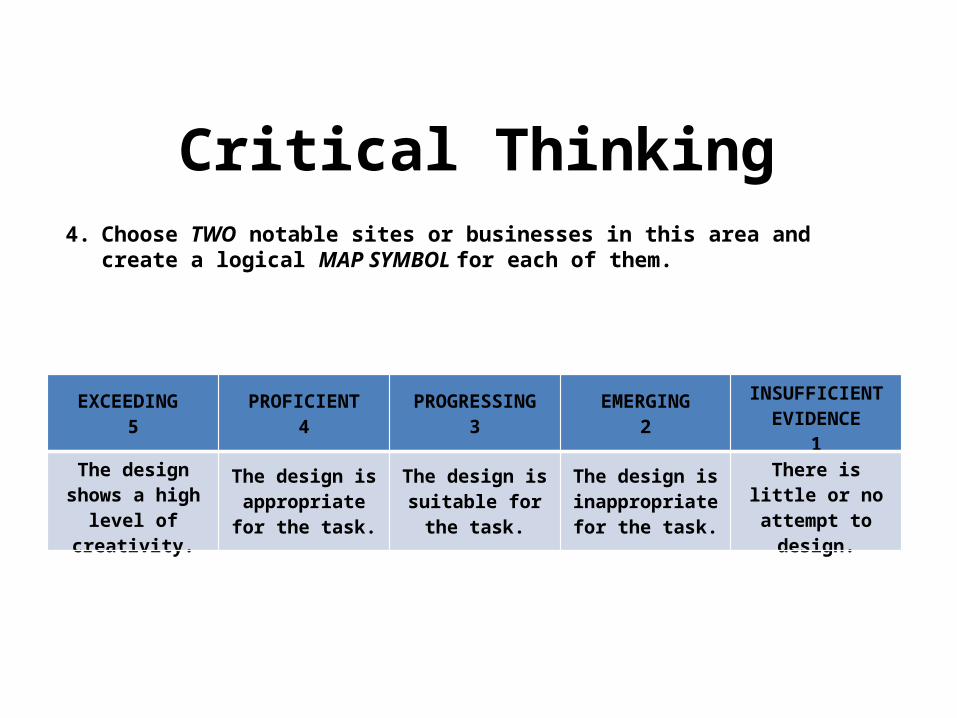
4. Choose TWO notable sites or businesses in this area and create a logical MAP SYMBOL for each of them.
Critical Thinking
EXCEEDING 5
PROFICIENT4
PROGRESSING3
EMERGING2
INSUFFICIENT EVIDENCE
1
The design shows a high
level of creativity.
The design is appropriate for the task.
The design is suitable for
the task.
The design is inappropriate for the task.
There is little or no attempt
to design.

Map COLORS are used to ease the identification of features on the map.The colors vary with different types of maps, but on a standard, large scale, TOPOGRAPHIC map, there are five basic colors. • BLACK - used to identify the majority of cultural or MAN-MADE
FEATURES, such as buildings, bridges, and roads not shown in red.
• RED - main ROADS, built up areas, and special features such as dangerous or restricted areas.
• BLUE - is for WATER features such as lakes, rivers, swamps, and streams.
• GREEN - identifies VEGETATION such as woods and orchards. • BROWN - all LANDFORMS such as mountains or hills.
Map Colors
Relative locations are described by LANDMARKS, TIME, DIRECTION, or DISTANCE FROM ONE PLACE to ANOTHER.
The location of a place in relation to another place (i.e. south or downhill).Kansas City, Missouri is just EAST of Kansas City, Kansas.Wisconsin is SOUTH of Canada.It is 3 MILES NORTHWEST of Seattle.Galveston Island, located in SOUTHEASTERN Texas in the Gulf of Mexico, is about 48 MILES SOUTHEAST of Houston. Sherwood, Oregon is a city in the SOUTHEAST CORNER of Washington County.Sherwood is located APPROXIMATELY 14 MILES from downtown Portland.
Relative Location
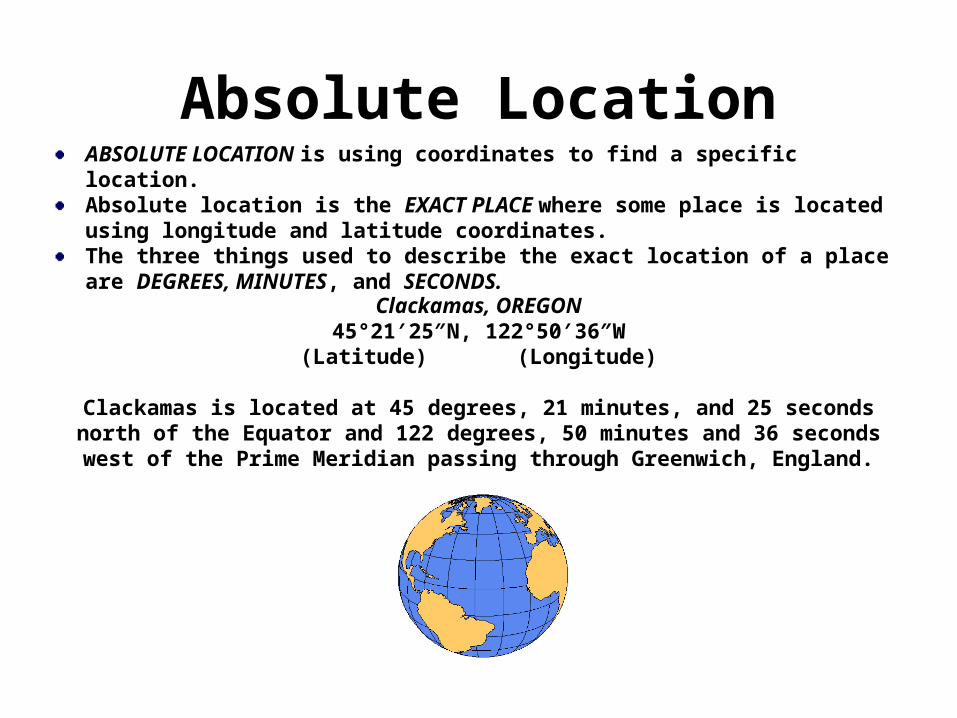
Absolute LocationABSOLUTE LOCATION is using coordinates to find a specific location. Absolute location is the EXACT PLACE where some place is located using longitude and latitude coordinates.The three things used to describe the exact location of a place are DEGREES, MINUTES, and SECONDS.
Clackamas, OREGON45°21′25″N, 122°50′36″W(Latitude) (Longitude)
Clackamas is located at 45 degrees, 21 minutes, and 25 seconds north of the Equator and 122 degrees, 50 minutes and 36 seconds west of the Prime Meridian passing through Greenwich, England.
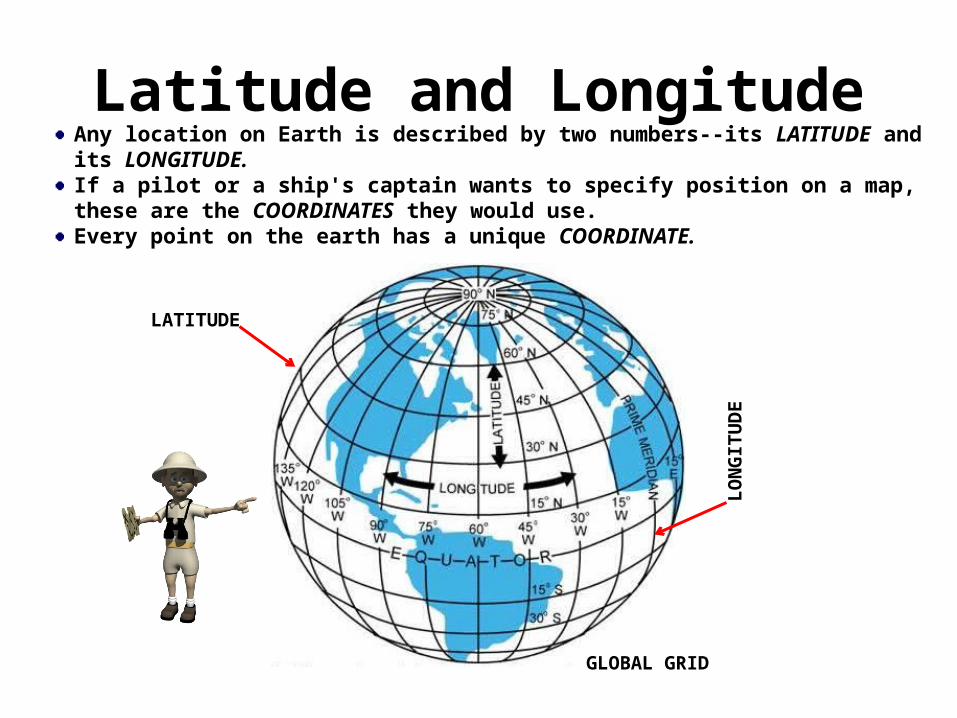
Any location on Earth is described by two numbers--its LATITUDE and its LONGITUDE. If a pilot or a ship's captain wants to specify position on a map, these are the COORDINATES they would use. Every point on the earth has a unique COORDINATE.
Latitude and Longitude
LATITUDE
LO
NG
ITU
DE
GLOBAL GRID

Latitude gives the location of a place on Earth, north or south of the EQUATOR. The equator separates the Earth into NORTHERN and SOUTHERN hemispheres.Lines of latitude are the imaginary HORIZONTAL lines () shown running east-to-west or west–to-east that run either north or south of the equator.They are also called PARALLELS.
NORTHERN HEMISPHERE
SOUTHERN HEMISPHERE
EQUATOR
Understanding Latitude
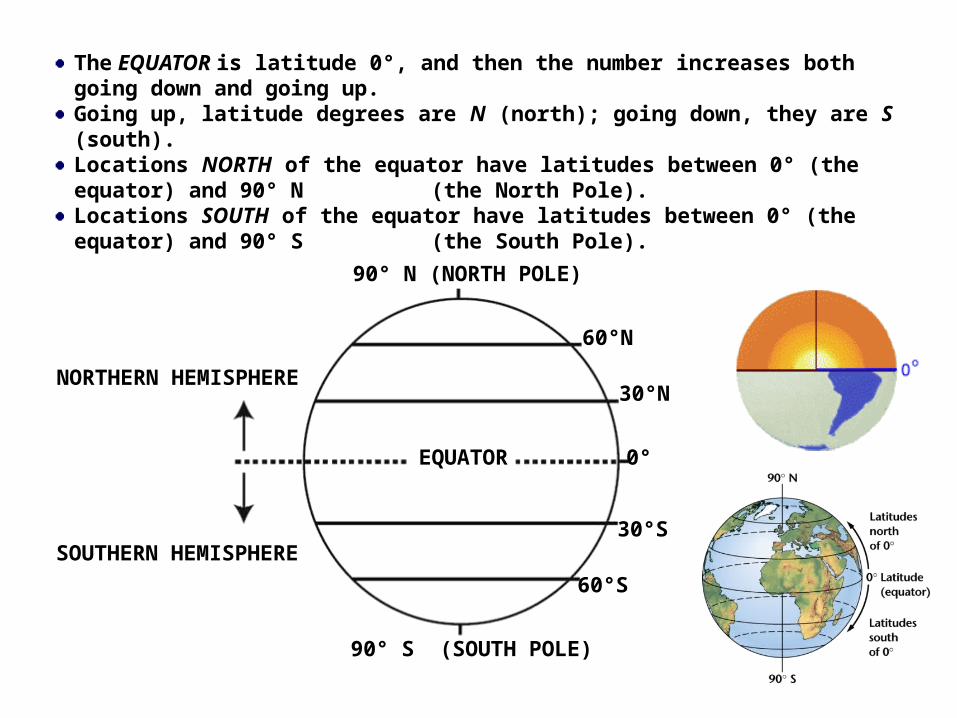
The EQUATOR is latitude 0°, and then the number increases both going down and going up. Going up, latitude degrees are N (north); going down, they are S (south).Locations NORTH of the equator have latitudes between 0° (the equator) and 90° N (the North Pole).Locations SOUTH of the equator have latitudes between 0° (the equator) and 90° S (the South Pole).
90° N (NORTH POLE)
90° S (SOUTH POLE)
EQUATOR 0°
30°S
60°S
30°N
60°N
SOUTHERN HEMISPHERE
NORTHERN HEMISPHERE
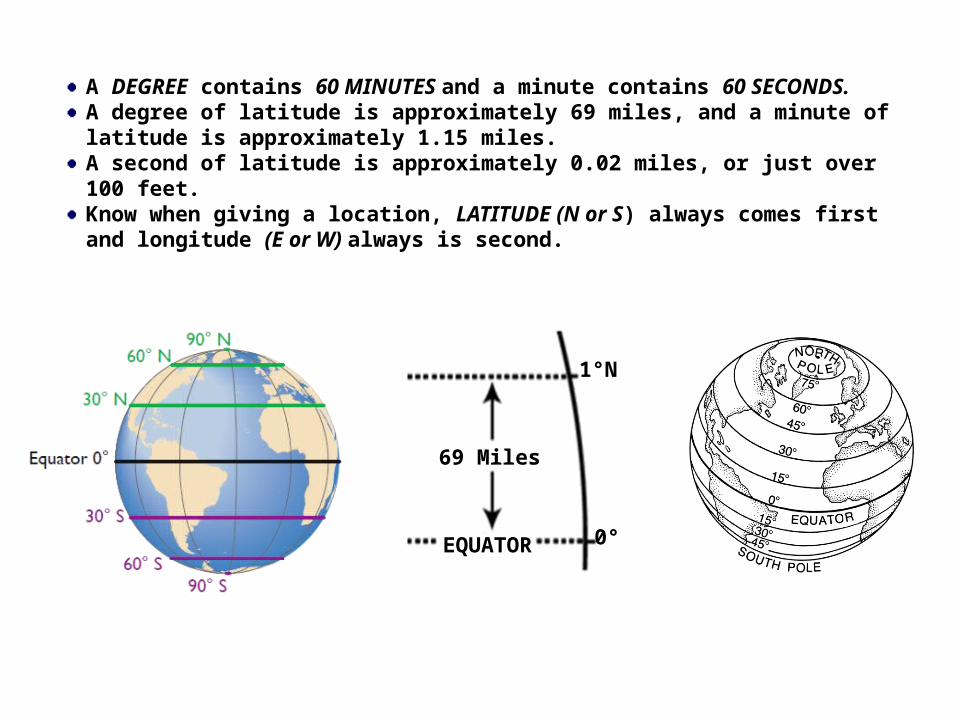
A DEGREE contains 60 MINUTES and a minute contains 60 SECONDS. A degree of latitude is approximately 69 miles, and a minute of latitude is approximately 1.15 miles. A second of latitude is approximately 0.02 miles, or just over 100 feet.Know when giving a location, LATITUDE (N or S) always comes first and longitude (E or W) always is second.
69 Miles
EQUATOR 0°
1°N
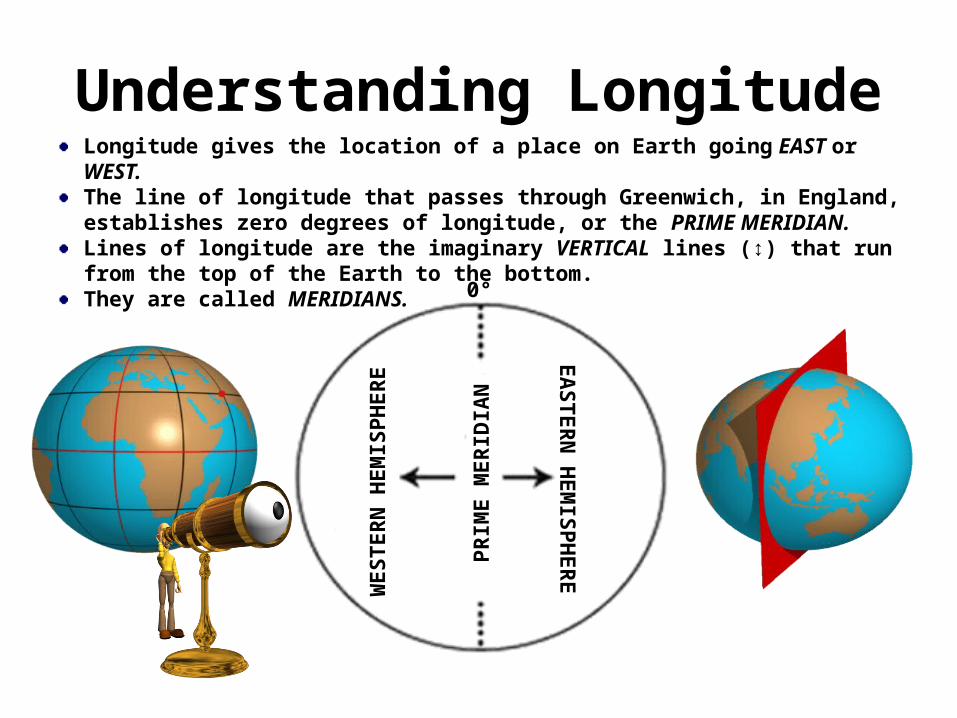
Longitude gives the location of a place on Earth going EAST or WEST.The line of longitude that passes through Greenwich, in England, establishes zero degrees of longitude, or the PRIME MERIDIAN.Lines of longitude are the imaginary VERTICAL lines (↕) that run from the top of the Earth to the bottom.They are called MERIDIANS. 0°
PR
IME M
ER
IDIA
N
WES
TER
N H
EM
ISP
HER
EEA
STER
N H
EM
ISP
HER
E
Understanding Longitude
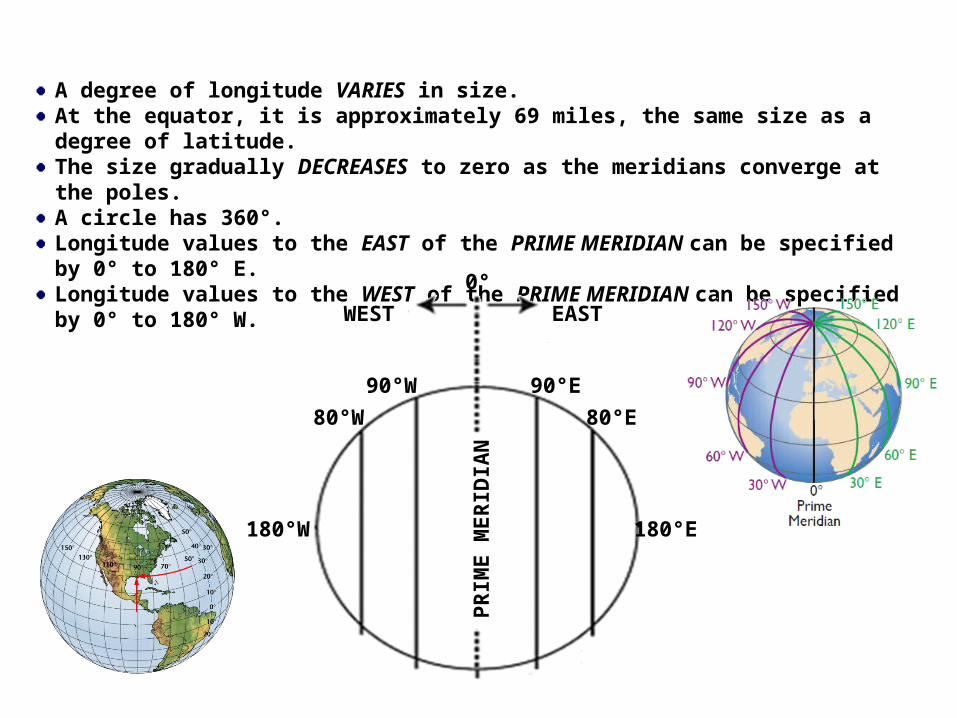
A degree of longitude VARIES in size. At the equator, it is approximately 69 miles, the same size as a degree of latitude. The size gradually DECREASES to zero as the meridians converge at the poles.A circle has 360°.Longitude values to the EAST of the PRIME MERIDIAN can be specified by 0° to 180° E. Longitude values to the WEST of the PRIME MERIDIAN can be specified by 0° to 180° W.
PR
IME M
ER
IDIA
N
WEST EAST
180°E 180°W
80°E
90°E
0°
80°W
90°W
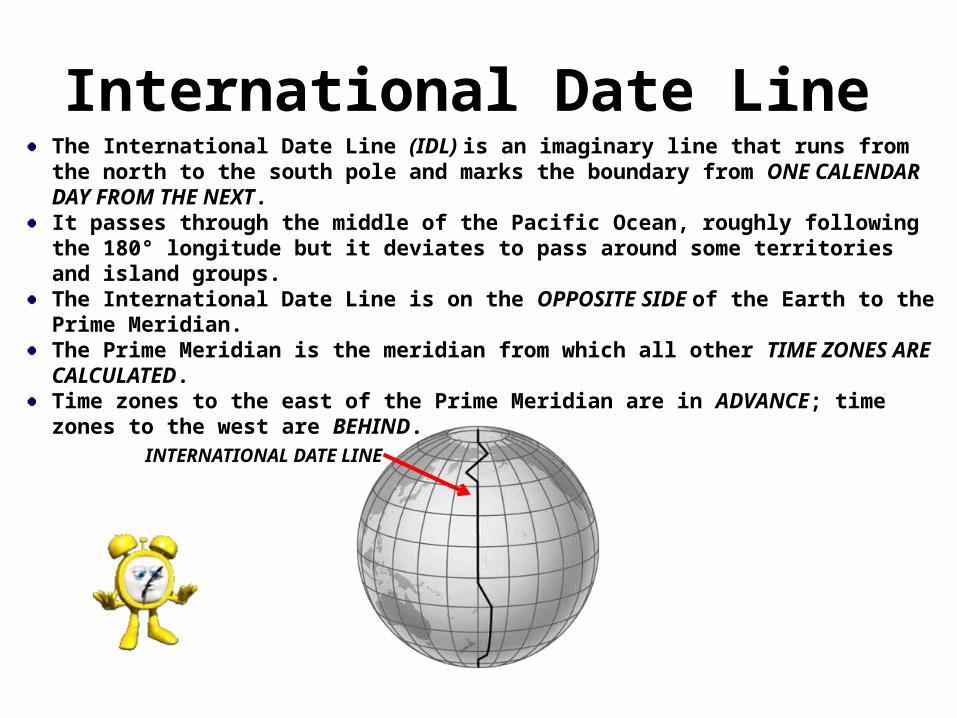
International Date LineThe International Date Line (IDL) is an imaginary line that runs from the north to the south pole and marks the boundary from ONE CALENDAR DAY FROM THE NEXT. It passes through the middle of the Pacific Ocean, roughly following the 180° longitude but it deviates to pass around some territories and island groups.The International Date Line is on the OPPOSITE SIDE of the Earth to the Prime Meridian. The Prime Meridian is the meridian from which all other TIME ZONES ARE CALCULATED. Time zones to the east of the Prime Meridian are in ADVANCE; time zones to the west are BEHIND.
INTERNATIONAL DATE LINE
Google Earth lets you fly anywhere on Earth to view satellite imagery, maps, terrain, 3D buildings, from galaxies in outer space to the canyons of the ocean.
Google Earth
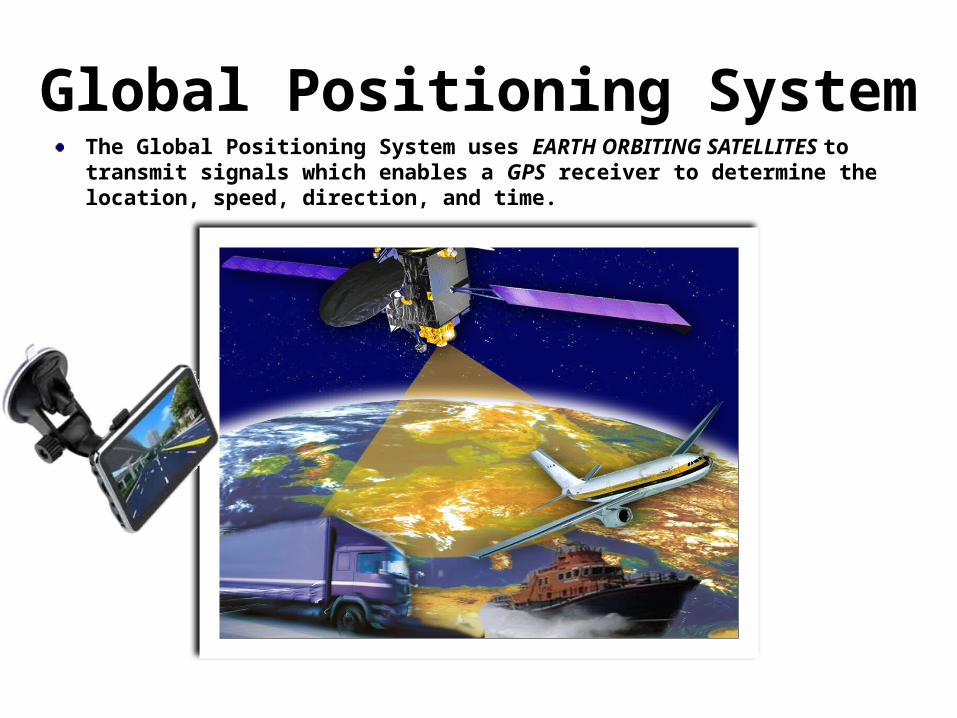
The Global Positioning System uses EARTH ORBITING SATELLITES to transmit signals which enables a GPS receiver to determine the location, speed, direction, and time.
Global Positioning System
Map and GlobeSkills Practice
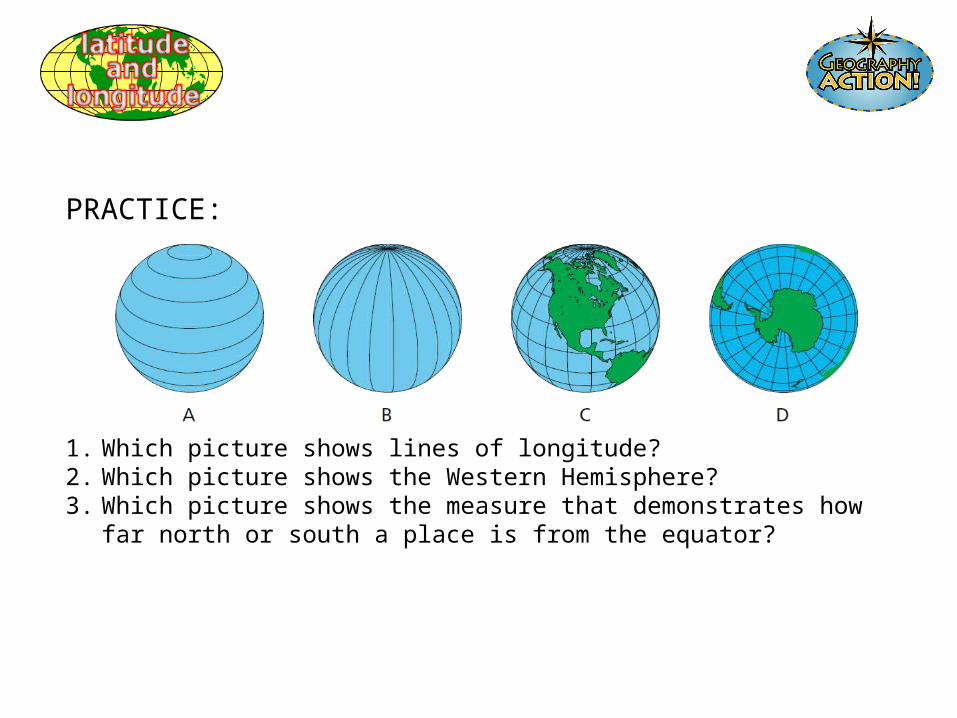
PRACTICE:
1. Which picture shows lines of longitude?2. Which picture shows the Western Hemisphere?3. Which picture shows the measure that demonstrates how far north or south a
place is from the equator?
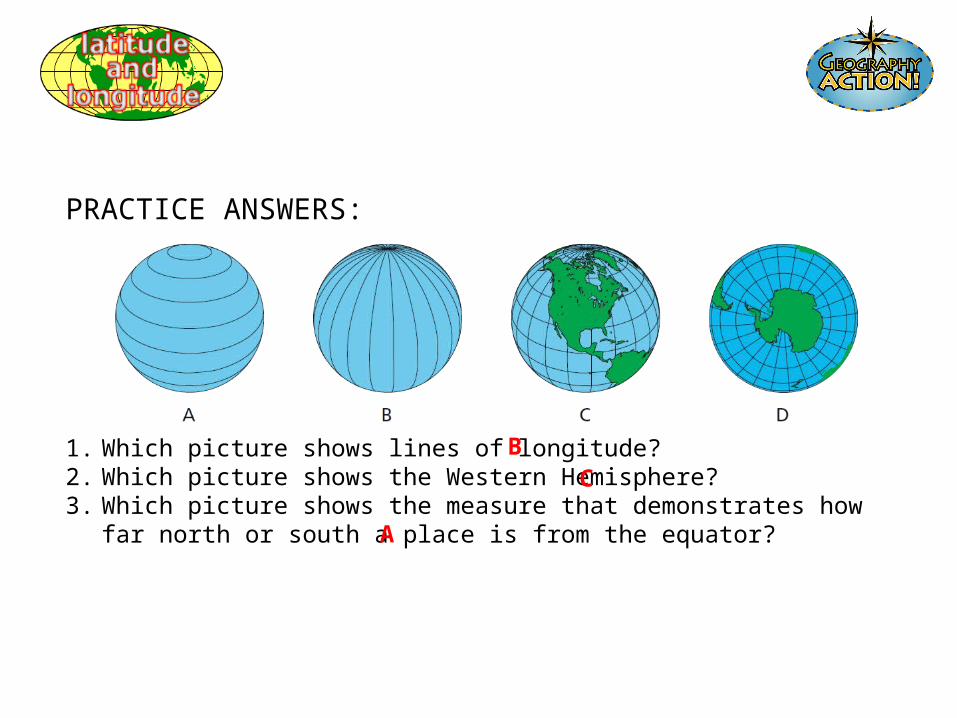
PRACTICE ANSWERS:
1. Which picture shows lines of longitude?2. Which picture shows the Western Hemisphere?3. Which picture shows the measure that demonstrates how far north or south a
place is from the equator?
BC
A
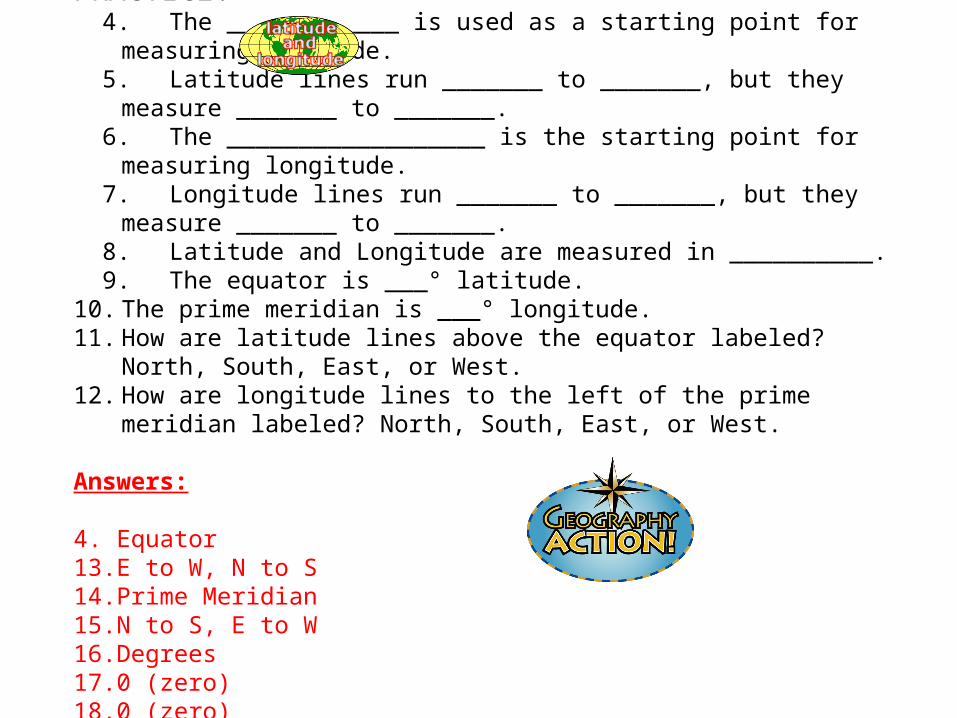
PRACTICE: 4. The ____________ is used as a starting point for measuring latitude. 5. Latitude lines run _______ to _______, but they measure _______ to _______. 6. The __________________ is the starting point for measuring longitude. 7. Longitude lines run _______ to _______, but they measure _______ to _______. 8. Latitude and Longitude are measured in __________. 9. The equator is ___° latitude. 10. The prime meridian is ___° longitude. 11. How are latitude lines above the equator labeled? North, South, East, or West. 12. How are longitude lines to the left of the prime meridian labeled? North, South,
East, or West.
Answers:
4. Equator13. E to W, N to S14. Prime Meridian15. N to S, E to W16. Degrees17. 0 (zero)18. 0 (zero)19. North20. West
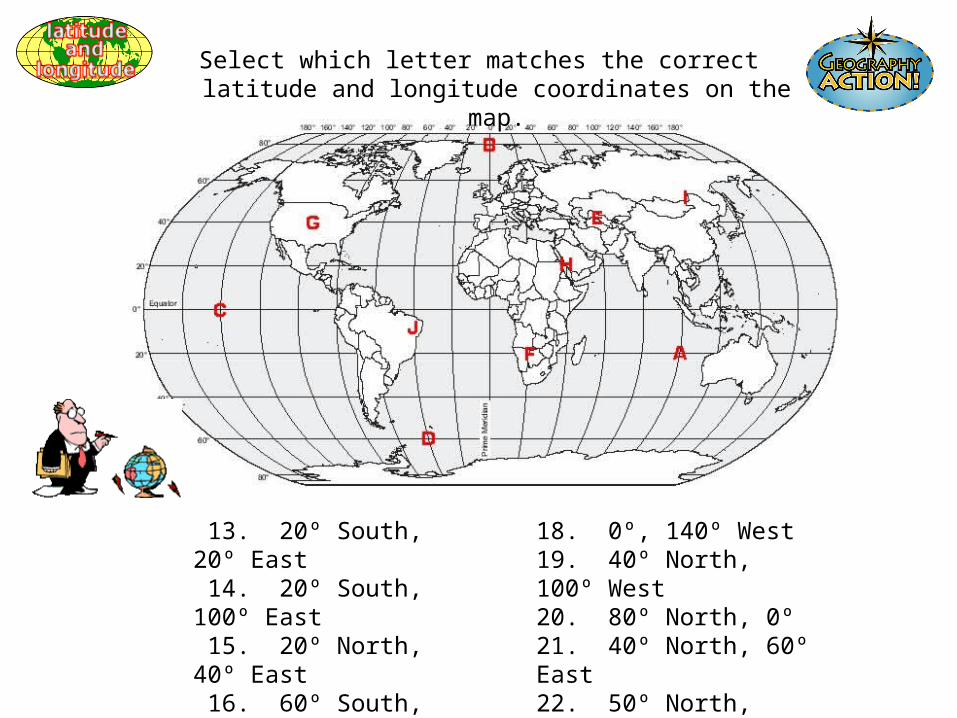
13. 20º South, 20º East 14. 20º South, 100º East 15. 20º North, 40º East 16. 60º South, 40º West 17. 10º South, 40º West
Select which letter matches the correct latitude and longitude coordinates on the map.
18. 0º, 140º West 19. 40º North, 100º West 20. 80º North, 0º 21. 40º North, 60º East 22. 50º North, 120º East
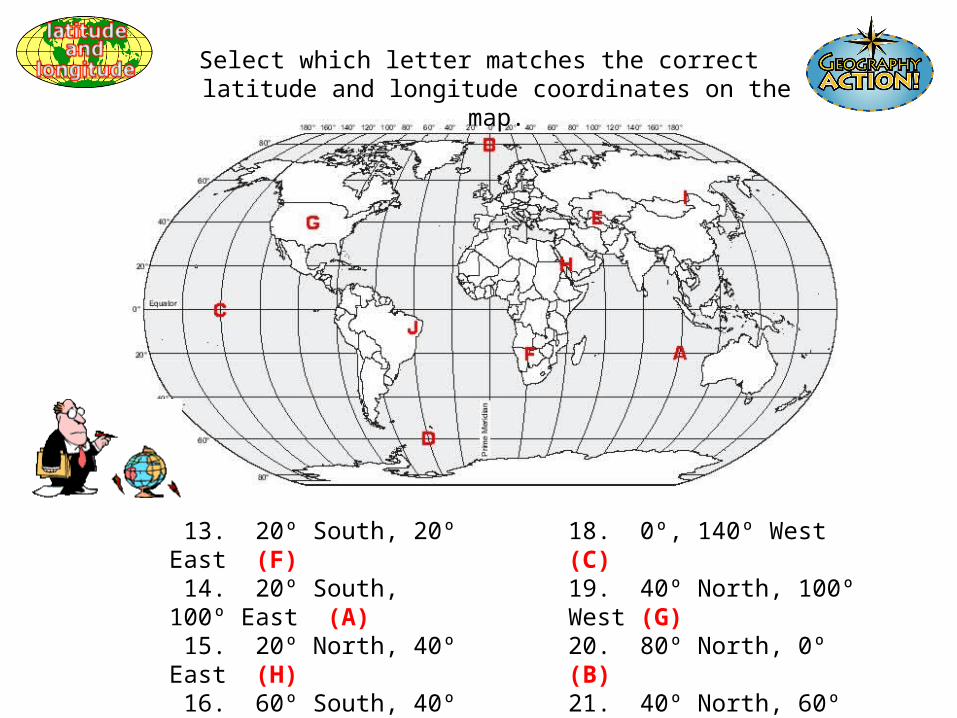
13. 20º South, 20º East (F) 14. 20º South, 100º East (A) 15. 20º North, 40º East (H) 16. 60º South, 40º West (D) 17. 10º South, 40º West (J)
Select which letter matches the correct latitude and longitude coordinates on the map.
18. 0º, 140º West (C) 19. 40º North, 100º West (G) 20. 80º North, 0º (B)21. 40º North, 60º East (E)22. 50º North, 120º East (I)

Use the U.S. Map on page 36-37 in the Rand McNally AtlasFind the exact location of the following cities in the U.S.
Reminder: You can problem solve with a partner, but you will be expected to know this for the quiz next time we meet.
Problems 23-32
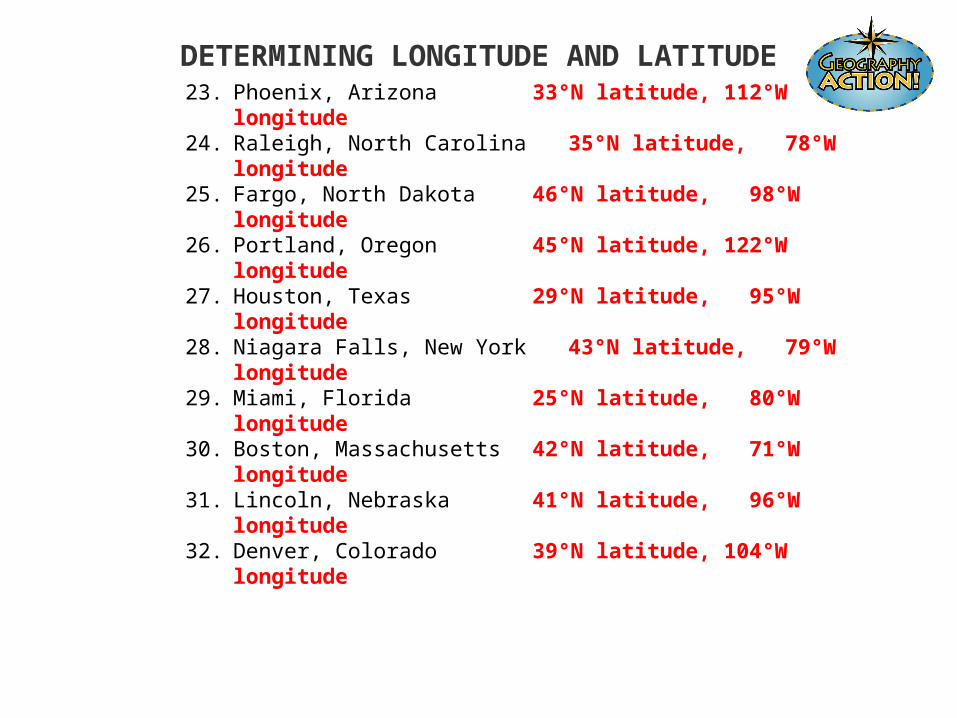
23. Phoenix, Arizona 33°N latitude, 112°W longitude
24. Raleigh, North Carolina 35°N latitude, 78°W longitude
25. Fargo, North Dakota 46°N latitude, 98°W longitude
26. Portland, Oregon 45°N latitude, 122°W longitude
27. Houston, Texas 29°N latitude, 95°W longitude
28. Niagara Falls, New York 43°N latitude, 79°W longitude
29. Miami, Florida 25°N latitude, 80°W longitude
30. Boston, Massachusetts 42°N latitude, 71°W longitude
31. Lincoln, Nebraska 41°N latitude, 96°W longitude
32. Denver, Colorado 39°N latitude, 104°W longitude
DETERMINING LONGITUDE AND LATITUDE
33. Use only compass directions to describe the location of your school. You will need to select your home as a starting reference point for this description. 34. Describe the location of your school in relationship to other physical and manmade features. (Next to what? Between what?)
Use the World Map on page 12-13 in the Rand McNally Atlas
Write your answers on a separate piece of notebook paper and turn them into me
You then are free to work on your “World Map Exercise”
Find the Exact location of the following:
1. New York (U.S.A) 11. Bombay, India2. Sydney, Australia 12. Tehran, Iran3. Buenos Aires, Argentina 13. London, England4. Anchorage (U.S.A) 14. Mexico City, Mexico5. Moscow, Russia 15. Brasilia, Brazil6. Manila, Philippines7. Vancouver B.C. (Canada)8. Falkland Islands9. Tokyo, Japan10. Madrid, Spain
World Map Coloring Key
Color and shade neatly each of the 7 continents on your map
Color the oceans Blue after you have labeled them