the slides for the analyst presentation (pdf, 2.93 mb)
TRANSCRIPT
2015 Half-Year ResultsJean-Jacques Gauthier
July 29, 2015
2015 Half-Year ResultsJean-Jacques Gauthier
July 29, 2015
© M
édia
thèq
ue L
afar
ge -
Cha
rles
Plu
mey
-Fay
e -
Rud
y R
icci
otti
(arc
hite
ct)
France, Marseille – Mucem (Museum of European & Mediterranean Civilizations)
Disclaimer
2
This document contains forward-looking trends, targets or objectives, as the case may be, including with respect to plans, initiatives, events, products, solutions and services. Their development and potential do not constitute forecasts regarding results or any other performance indicator. Although Lafarge believes that the expectations reflected in such forward-looking statements are based on reasonable assumptions as at the time of publishing this document, investors are cautioned that these statements are not guarantees of future performance. Actual results may differ materially from the forward-looking statements as a result of a number of risks and uncertainties, many of which are difficult to predict and generally beyond the control of Lafarge, including but not limited to the risks described in the Lafarge’s annual report available on its Internet website (www.lafarge.com) and uncertainties related to the market conditions and the implementation of our plans. Nothing contained herein is, or shall be relied on as, a promise or representation as to the future performance of Lafarge. Accordingly, we caution you against relying on forward looking statements. Lafarge does not undertake to provide updates of these forward-looking statements. More comprehensive information about Lafarge may be obtained on its Internet website (www.lafarge.com), including under “Regulated Information” section.
This communication does not constitute an offer to purchase or exchange or the solicitation of an offer to sell or exchange any securities of Lafarge.
Q2 Highlights
3
� Cement volumes down 4% in Q2 in a contrasted enviro nment� Solid developments in many countries of Middle East Africa and in North America,
despite harsh weather in the US
� Positive impact of the ramp up of our new plants in Rajasthan and in Russia mitigating lower export sales and impact of divestments
� Headwinds in Brazil and in France; in Iraq, cement transportation across the country is limited since June 2014
� EBITDA is up 1% in Q2 and up 6% for the first half� Positive impact of exchange rates; after a strong Q1, like for like EBITDA is down 2%
in Q2 and up 2% in H1, facing solid comparables in 2014
� €125M generated from our cost cutting and innovation measures in Q2, €250M YTD, on budget to achieve our full year objective
� Price increase were limited in a environment where inflation continues, although at a more moderate pace
� Merger to create LafargeHolcim has been completed on Jul 10, 2015
� Net result is impacted by timing accounting impacts linked to the merger� Excluding one-offs, Net income Group share is up 57% at €182M
Key Figures
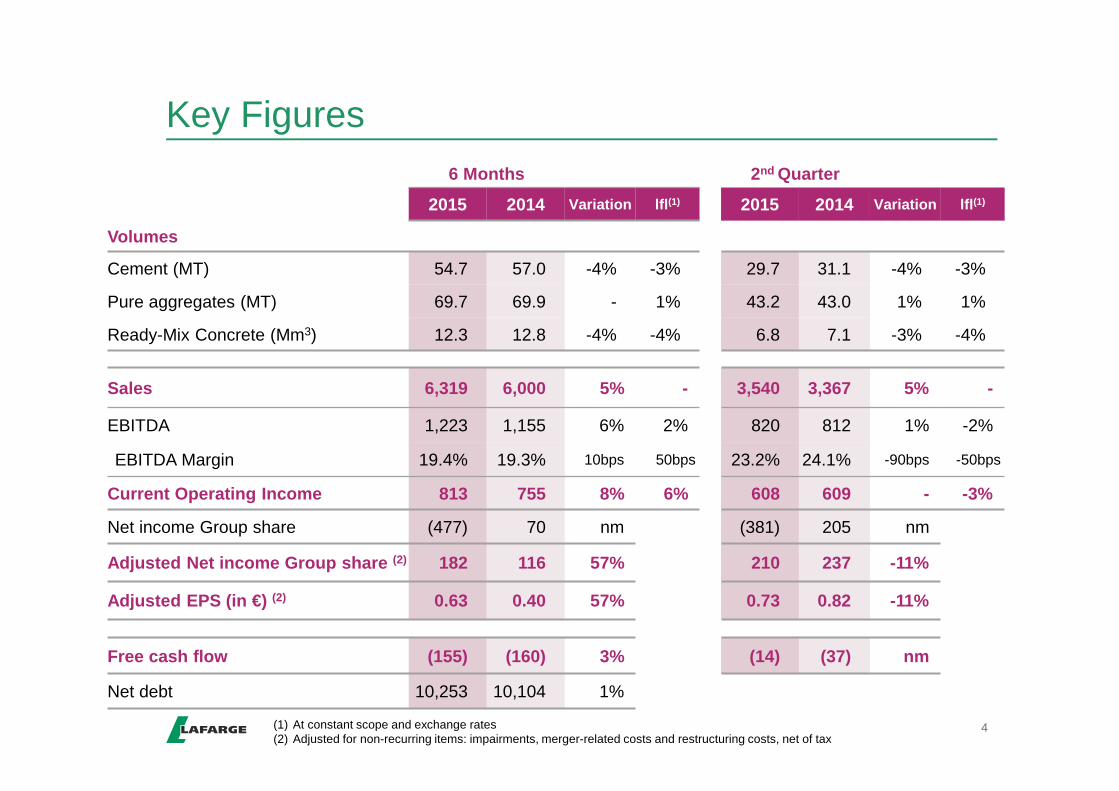
4(1) At constant scope and exchange rates(2) Adjusted for non-recurring items: impairments, merger-related costs and restructuring costs, net of tax
6 Months 2nd Quarter
2015 2014 Variation lfl (1) 2015 2014 Variation lfl(1)
Volumes
Cement (MT) 54.7 57.0 -4% -3% 29.7 31.1 -4% -3%
Pure aggregates (MT) 69.7 69.9 - 1% 43.2 43.0 1% 1%
Ready-Mix Concrete (Mm3) 12.3 12.8 -4% -4% 6.8 7.1 -3% -4%
Sales 6,319 6,000 5% - 3,540 3,367 5% -
EBITDA 1,223 1,155 6% 2% 820 812 1% -2%
EBITDA Margin 19.4% 19.3% 10bps 50bps 23.2% 24.1% -90bps -50bps
Current Operating Income 813 755 8% 6% 608 609 - -3%
Net income Group share (477) 70 nm (381) 205 nm
Adjusted Net income Group share (2) 182 116 57% 210 237 -11%
Adjusted EPS (in €) (2) 0.63 0.40 57% 0.73 0.82 -11%
Free cash flow (155) (160) 3% (14) (37) nm
Net debt 10,253 10,104 1%
Operational ReviewAlgeria, City of Algiers – Building better cities - Notre-Dame d'Afrique cable car
Cop
yrig
ht:
© L
ibra
ry L
afar
ge
M. K
adri
-C
AP
A P
ictu
res
North America
6
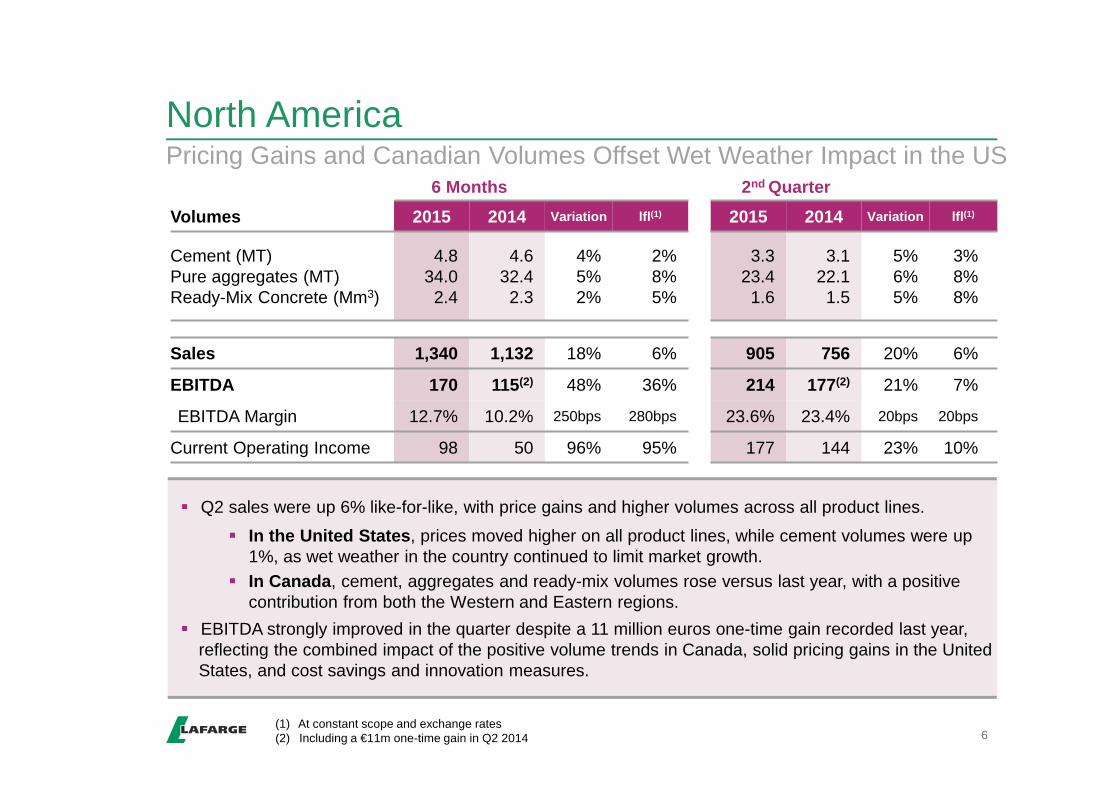
Pricing Gains and Canadian Volumes Offset Wet Weather Impact in the US
� Q2 sales were up 6% like-for-like, with price gains and higher volumes across all product lines.
� In the United States , prices moved higher on all product lines, while cement volumes were up 1%, as wet weather in the country continued to limit market growth.
� In Canada , cement, aggregates and ready-mix volumes rose versus last year, with a positive contribution from both the Western and Eastern regions.
� EBITDA strongly improved in the quarter despite a 11 million euros one-time gain recorded last year, reflecting the combined impact of the positive volume trends in Canada, solid pricing gains in the United States, and cost savings and innovation measures.
6 Months 2nd Quarter
Volumes 2015 2014 Variation lfl (1) 2015 2014 Variation lfl(1)
Cement (MT)Pure aggregates (MT)Ready-Mix Concrete (Mm3)
4.834.02.4
4.632.42.3
4%5%2%
2%8%5%
3.323.41.6
3.122.11.5
5%6%5%
3%8%8%
Sales 1,340 1,132 18% 6% 905 756 20% 6%
EBITDA 170 115 (2) 48% 36% 214 177(2) 21% 7%
EBITDA Margin 12.7% 10.2% 250bps 280bps 23.6% 23.4% 20bps 20bps
Current Operating Income 98 50 96% 95% 177 144 23% 10%
(1) At constant scope and exchange rates(2) Including a €11m one-time gain in Q2 2014
Western Europe
7
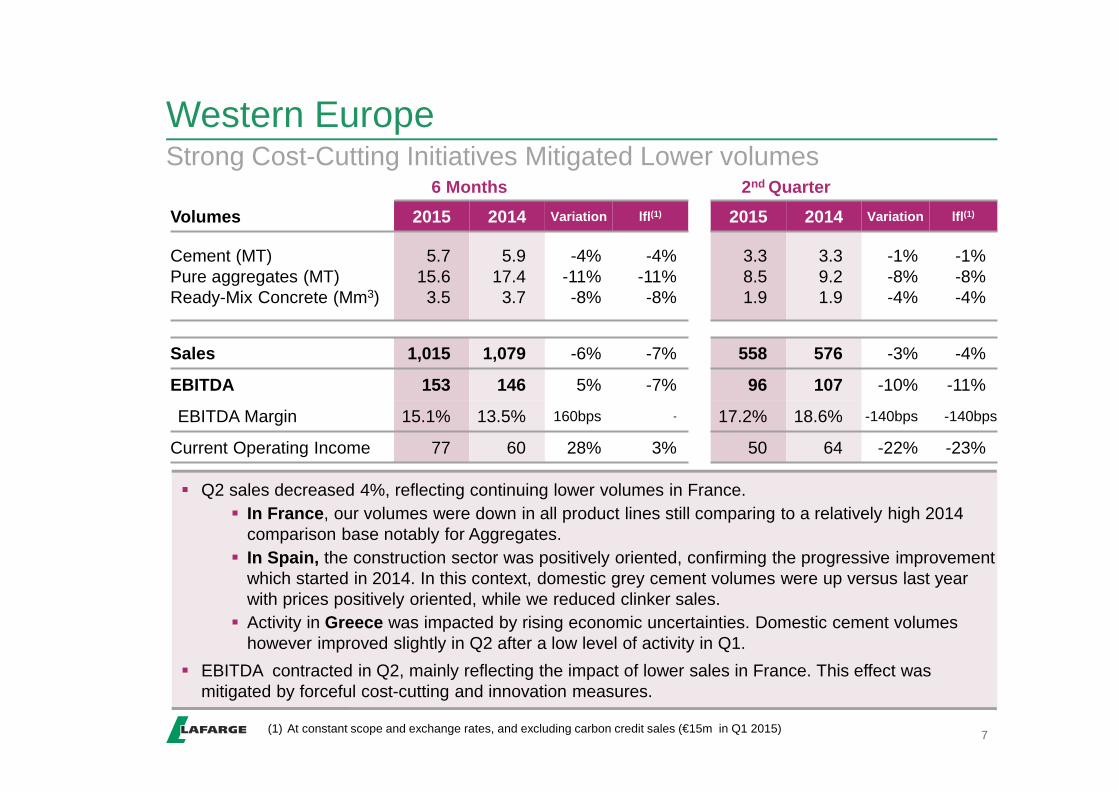
Strong Cost-Cutting Initiatives Mitigated Lower volumes
� Q2 sales decreased 4%, reflecting continuing lower volumes in France.� In France , our volumes were down in all product lines still comparing to a relatively high 2014
comparison base notably for Aggregates.� In Spain, the construction sector was positively oriented, confirming the progressive improvement
which started in 2014. In this context, domestic grey cement volumes were up versus last year with prices positively oriented, while we reduced clinker sales.
� Activity in Greece was impacted by rising economic uncertainties. Domestic cement volumes however improved slightly in Q2 after a low level of activity in Q1.
� EBITDA contracted in Q2, mainly reflecting the impact of lower sales in France. This effect was mitigated by forceful cost-cutting and innovation measures.
6 Months 2nd Quarter
Volumes 2015 2014 Variation lfl (1) 2015 2014 Variation lfl(1)
Cement (MT)Pure aggregates (MT)Ready-Mix Concrete (Mm3)
5.715.63.5
5.917.43.7
-4%-11%-8%
-4%-11%-8%
3.38.51.9
3.39.21.9
-1%-8%-4%
-1%-8%-4%
Sales 1,015 1,079 -6% -7% 558 576 -3% -4%
EBITDA 153 146 5% -7% 96 107 -10% -11%
EBITDA Margin 15.1% 13.5% 160bps - 17.2% 18.6% -140bps -140bps
Current Operating Income 77 60 28% 3% 50 64 -22% -23%
(1) At constant scope and exchange rates, and excluding carbon credit sales (€15m in Q1 2015)
Central and Eastern Europe
8
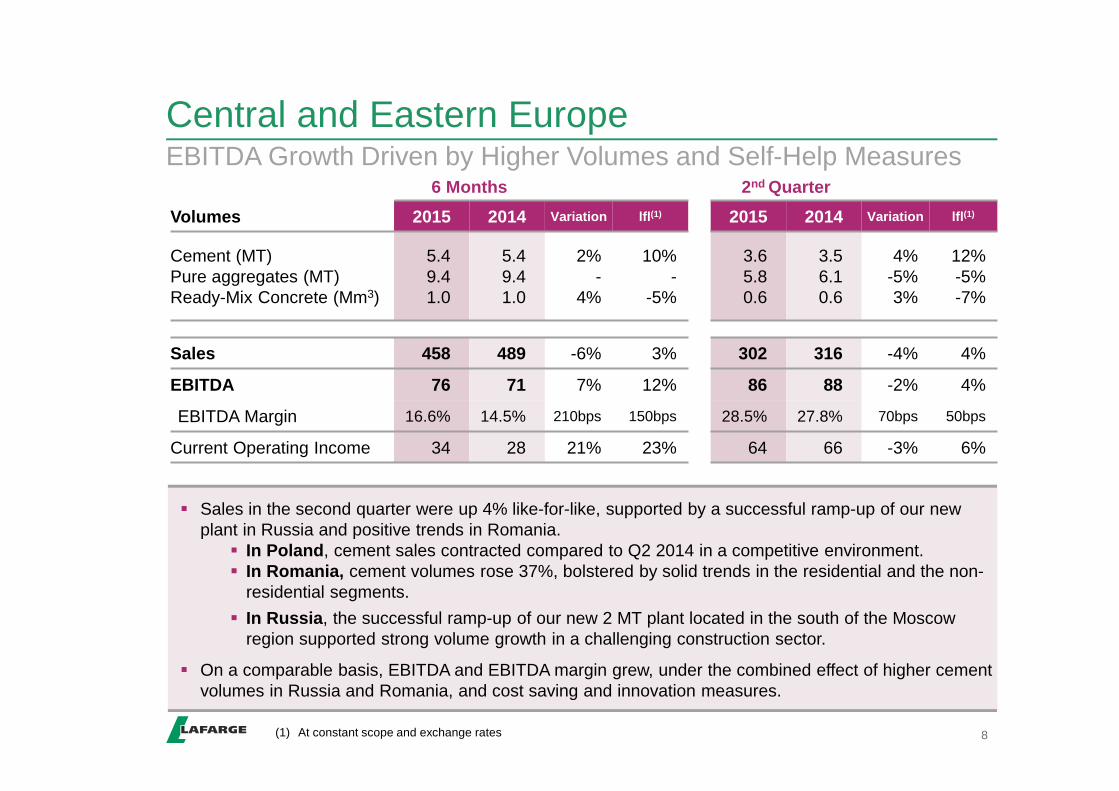
EBITDA Growth Driven by Higher Volumes and Self-Help Measures
� Sales in the second quarter were up 4% like-for-like, supported by a successful ramp-up of our new plant in Russia and positive trends in Romania.
� In Poland , cement sales contracted compared to Q2 2014 in a competitive environment.� In Romania, cement volumes rose 37%, bolstered by solid trends in the residential and the non-
residential segments.
� In Russia , the successful ramp-up of our new 2 MT plant located in the south of the Moscow region supported strong volume growth in a challenging construction sector.
� On a comparable basis, EBITDA and EBITDA margin grew, under the combined effect of higher cement volumes in Russia and Romania, and cost saving and innovation measures.
6 Months 2nd Quarter
Volumes 2015 2014 Variation lfl (1) 2015 2014 Variation lfl (1)
Cement (MT)Pure aggregates (MT)Ready-Mix Concrete (Mm3)
5.49.41.0
5.49.41.0
2%-
4%
10%-
-5%
3.65.80.6
3.56.10.6
4%-5%3%
12%-5%-7%
Sales 458 489 -6% 3% 302 316 -4% 4%
EBITDA 76 71 7% 12% 86 88 -2% 4%
EBITDA Margin 16.6% 14.5% 210bps 150bps 28.5% 27.8% 70bps 50bps
Current Operating Income 34 28 21% 23% 64 66 -3% 6%
(1) At constant scope and exchange rates

6 Months 2nd Quarter
Volumes 2015 2014 Variation lfl (1) 2015 2014 Variation lfl (1)
Cement (MT)Pure aggregates (MT)Ready-Mix Concrete (Mm3)
19.85.22.6
21.55.02.8
-8%5%
-6%
3%5%
-6%
9.92.81.3
11.02.61.5
-10%8%
-8%
3%8%
-8%
Sales 1,975 1,854 7% - 1,003 961 4% -2%
EBITDA 554 529 5% 4% 295 279 6% 5%
EBITDA Margin 28.1% 28.5% -40bps 100bps 29.4% 29.0% 40bps 180bs
Current Operating Income 417 400 4% 6% 226 214 6% 7%
Middle East and Africa
9
Solid Performance with Positive Market Trends and Self-Help Measures
(2) (2)
(1) At constant scope and exchange rates, and excluding the drop in cement volumes in Iraq due to transport limitations.When including the loss in volumes in Iraq : volumes: -1% YTD and flat in Q2, sales: -2% YTD and -3% in Q2, EBITDA: flat YTD
and 2% in Q2, COI: flat YTD and 3% in Q2(2) Domestic only
� Excluding the volume impact of transport limitations in Iraq , sales decreased 2% in Q2 under the combined effect of lower exports, the stoppage of our Syrian plant and Ramadan timing. Solid trends in many markets helped mitigating these trends.
� Nigeria enjoyed higher volumes and pricing gains to offset cost inflation.� In Egypt, cement sales improved 7% vs. last year reflecting the increasing utilization rate of our kilns
and some price corrections as some players progressively resume production.� In Kenya, our volumes were bolstered by the infrastructure segment.� In Algeria , sales rose 9% versus Q2 last year, with volumes and prices positively oriented.� In South Africa, our volumes were affected by production limitations at one plant.
� On a comparable basis, EBITDA increased 5%, supported by solid market trends in most markets and innovation and cost-saving measures.
Latin America
10
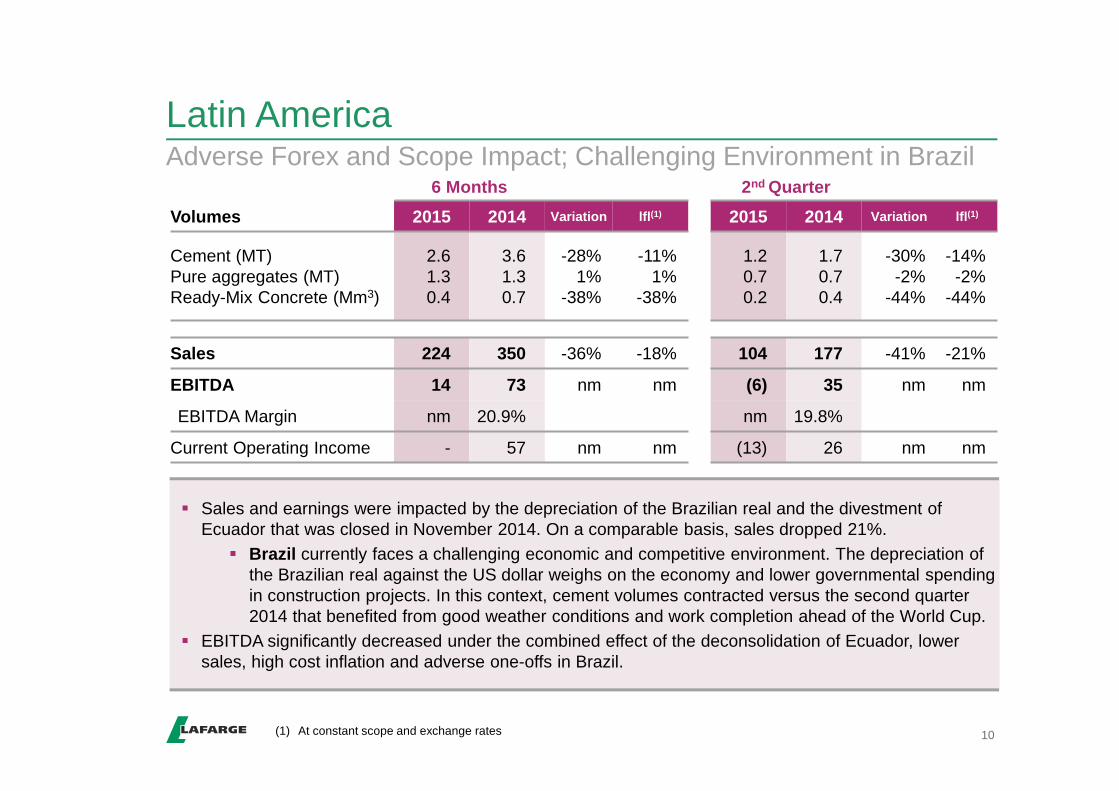
Adverse Forex and Scope Impact; Challenging Environment in Brazil6 Months 2nd Quarter
Volumes 2015 2014 Variation lfl (1) 2015 2014 Variation lfl(1)
Cement (MT)Pure aggregates (MT)Ready-Mix Concrete (Mm3)
2.61.30.4
3.61.30.7
-28%1%
-38%
-11%1%
-38%
1.20.70.2
1.70.70.4
-30%-2%
-44%
-14%-2%
-44%
Sales 224 350 -36% -18% 104 177 -41% -21%
EBITDA 14 73 nm nm (6) 35 nm nm
EBITDA Margin nm 20.9% nm 19.8%
Current Operating Income - 57 nm nm (13) 26 nm nm
� Sales and earnings were impacted by the depreciation of the Brazilian real and the divestment of Ecuador that was closed in November 2014. On a comparable basis, sales dropped 21%.
� Brazil currently faces a challenging economic and competitive environment. The depreciation of the Brazilian real against the US dollar weighs on the economy and lower governmental spending in construction projects. In this context, cement volumes contracted versus the second quarter 2014 that benefited from good weather conditions and work completion ahead of the World Cup.
� EBITDA significantly decreased under the combined effect of the deconsolidation of Ecuador, lower sales, high cost inflation and adverse one-offs in Brazil.
(1) At constant scope and exchange rates

Asia
11
Cost Reduction Mitigated Subdued Volumes and Cost Inflation
� Q2 sales were up 15%, mostly reflecting positive FX impacts that largely offset the effect of the divestiture of our operations in Pakistan.
� In India, our cement volumes increased 5%, notably supported by our plant in Rajasthan that was progressively ramping-up last year.
� In the Philippines, cement demand is supported by the private construction sector with continued strong demand for offices, retail and housing. Our cement volumes rose 11%.
� In Malaysia , our cement volumes slightly contracted reflecting production limitations at one plant.� In Indonesia and South Korea, cement volume growth was subdued, up 1% versus last year.
� Despite significant cost-saving and innovation measures, EBITDA decreased like-for-like, under a combined effect of lower prices and cost inflation.
6 Months 2nd Quarter
Volumes 2015 2014 Variation lfl (1) 2015 2014 Variation lfl(1)
Cement (MT)Pure aggregates (MT)Ready-Mix Concrete (Mm3)
16.44.22.4
16.04.42.3
2%-4%5%
4%-4%5%
8.42.01.2
8.52.31.2
--9%2%
3%-9%2%
Sales 1,307 1,096 19% 3% 668 581 15% 1%
EBITDA 256 221 16% 1% 135 126 7% -5%
EBITDA Margin 19.6% 20.2% -60bps -50bps 20.2% 21.7% -150bps -140bps
Current Operating Income 187 160 17% 2% 104 95 9% -2%
(1) At constant scope and exchange rates
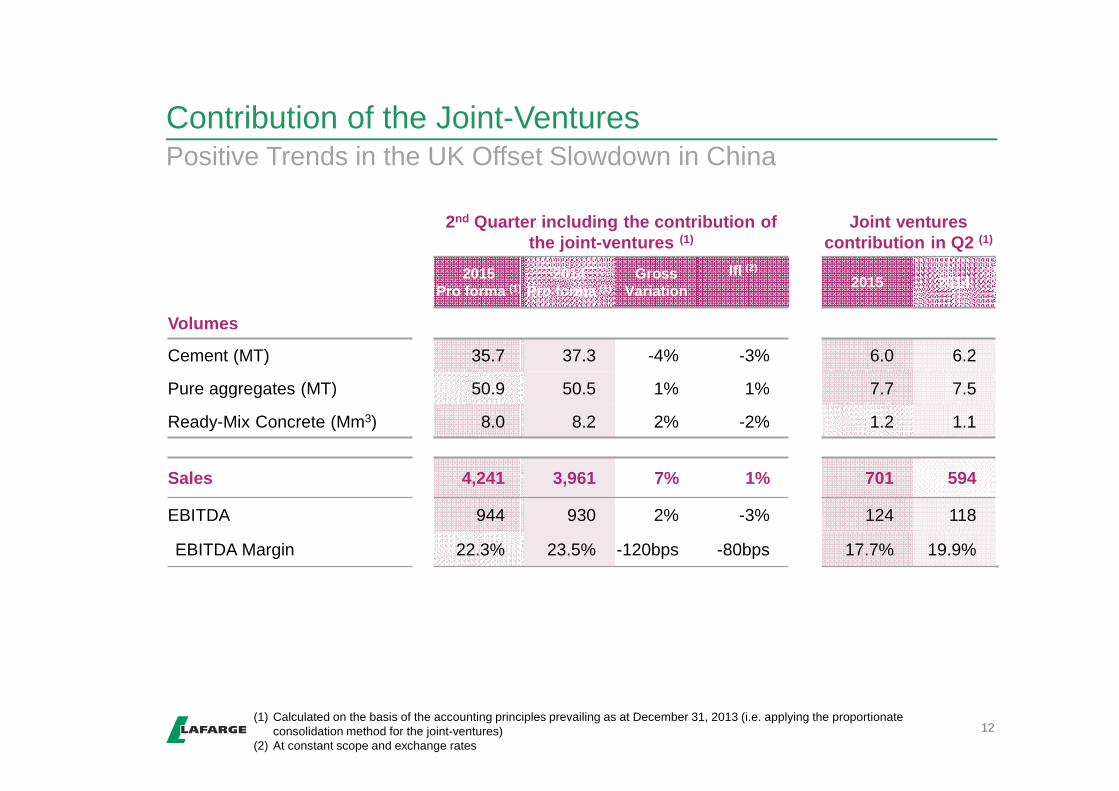
Contribution of the Joint-Ventures
12(1) Calculated on the basis of the accounting principles prevailing as at December 31, 2013 (i.e. applying the proportionate
consolidation method for the joint-ventures)(2) At constant scope and exchange rates
2nd Quarter including the contribution of the joint-ventures (1)
Joint ventures contribution in Q2 (1)
2015 Pro forma (1)
2014 Pro forma (1)
Gross Variation
lfl (2)
2015 2014
Volumes
Cement (MT) 35.7 37.3 -4% -3% 6.0 6.2
Pure aggregates (MT) 50.9 50.5 1% 1% 7.7 7.5
Ready-Mix Concrete (Mm3) 8.0 8.2 2% -2% 1.2 1.1
Sales 4,241 3,961 7% 1% 701 594
EBITDA 944 930 2% -3% 124 118
EBITDA Margin 22.3% 23.5% -120bps -80bps 17.7% 19.9%
Positive Trends in the UK Offset Slowdown in China
Net IncomeFrance, Paris – Fondation Louis Vuitton
©Iw
an B
aan
2014
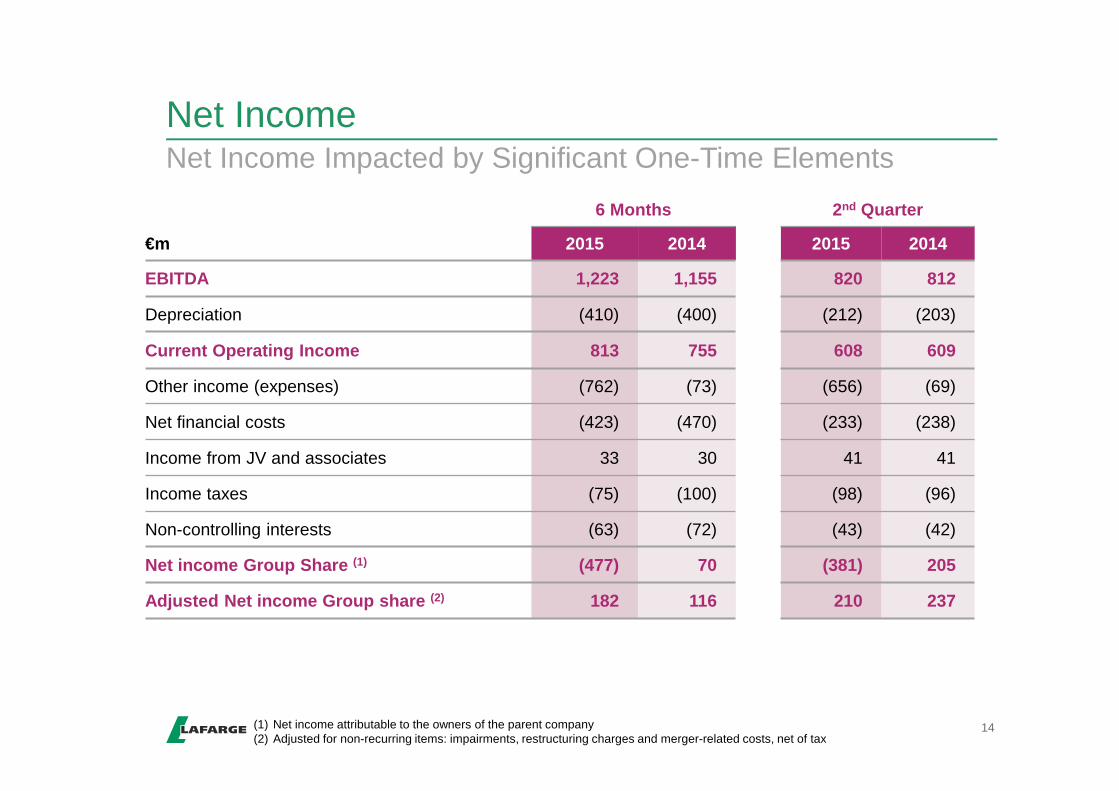
Net Income
14
6 Months 2nd Quarter
€m 2015 2014 2015 2014
EBITDA 1,223 1,155 820 812
Depreciation (410) (400) (212) (203)
Current Operating Income 813 755 608 609
Other income (expenses) (762) (73) (656) (69)
Net financial costs (423) (470) (233) (238)
Income from JV and associates 33 30 41 41
Income taxes (75) (100) (98) (96)
Non-controlling interests (63) (72) (43) (42)
Net income Group Share (1) (477) 70 (381) 205
Adjusted Net income Group share (2) 182 116 210 237
(1) Net income attributable to the owners of the parent company(2) Adjusted for non-recurring items: impairments, restructuring charges and merger-related costs, net of tax
Net Income Impacted by Significant One-Time Elements
Cash Flow and DebtHighlights
Cash Flow and DebtHighlightsFrance, City of Lyon – Lyon Confluence district, in the Lyon former Docks district. Shopping center designed
by architect Jean-Paul Viguier. Lafarge concrete has been used for the exterior surfaces around the center.
Cop
yrig
ht:
© L
ibra
ry L
afar
geT
. Cam
pagn
e -
CA
PA
Pic
ture
s-
Jean
-Pau
l Vig
uier
(ar
chite
ct)
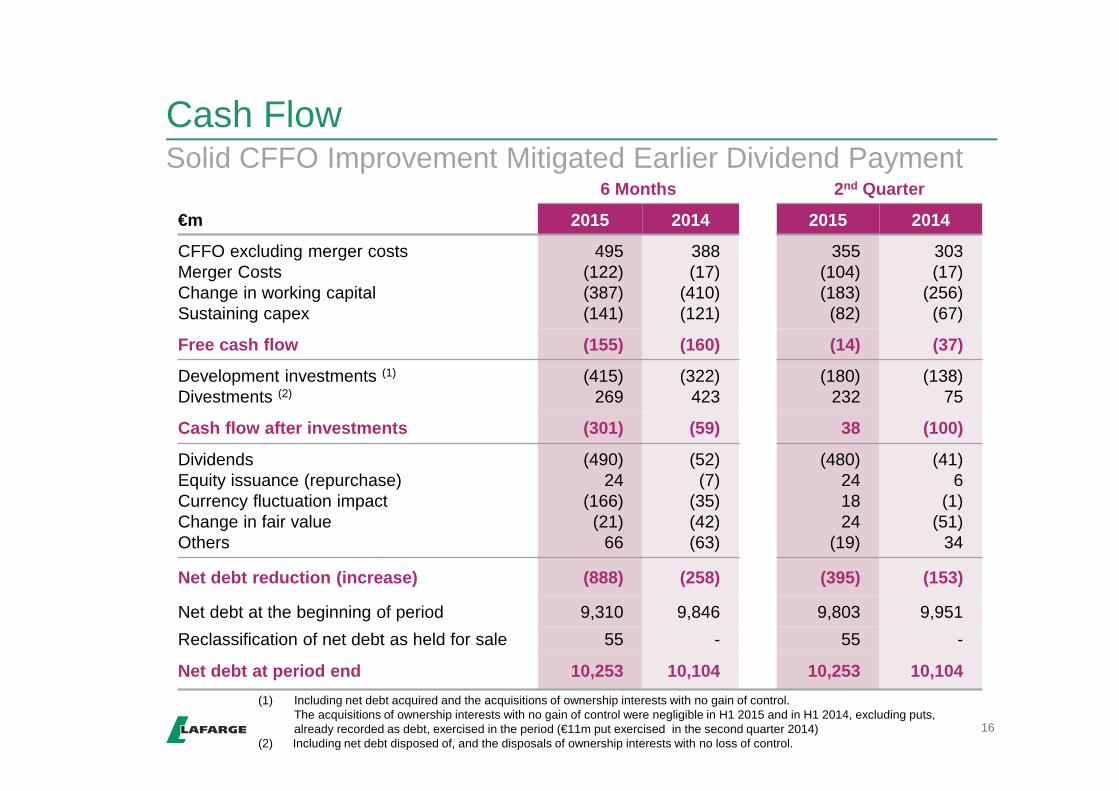
(1) Including net debt acquired and the acquisitions of ownership interests with no gain of control.The acquisitions of ownership interests with no gain of control were negligible in H1 2015 and in H1 2014, excluding puts, already recorded as debt, exercised in the period (€11m put exercised in the second quarter 2014)
(2) Including net debt disposed of, and the disposals of ownership interests with no loss of control.
Cash Flow
16
Solid CFFO Improvement Mitigated Earlier Dividend Payment6 Months 2nd Quarter
€m 2015 2014 2015 2014
CFFO excluding merger costsMerger CostsChange in working capitalSustaining capex
495(122)(387)(141)
388(17)
(410)(121)
355(104)(183)(82)
303(17)
(256)(67)
Free cash flow (155) (160) (14) (37)
Development investments (1)
Divestments (2)(415)
269(322)
423(180)
232(138)
75
Cash flow after investments (301) (59) 38 (100)
DividendsEquity issuance (repurchase)Currency fluctuation impactChange in fair valueOthers
(490)24
(166)(21)
66
(52)(7)
(35)(42)(63)
(480)241824
(19)
(41)6
(1)(51)
34
Net debt reduction (increase) (888) (258) (395) (153)
Net debt at the beginning of period 9,310 9,846 9,803 9,951
Reclassification of net debt as held for sale 55 - 55 -
Net debt at period end 10,253 10,104 10,253 10,104
Outlook 2015Outlook 2015United States - Elmwood, New Jersey – Refurbishment in Ductal, the ultra-high performance concrete of Lafarge, of the Pulaski Skyway Bridge carrying a four-lane freeway over the Passaic and Hackensack rivers linking Jersey City to Newark airport.
© L
afar
ge M
edia
libra
ry-
Ron
Saa
ri
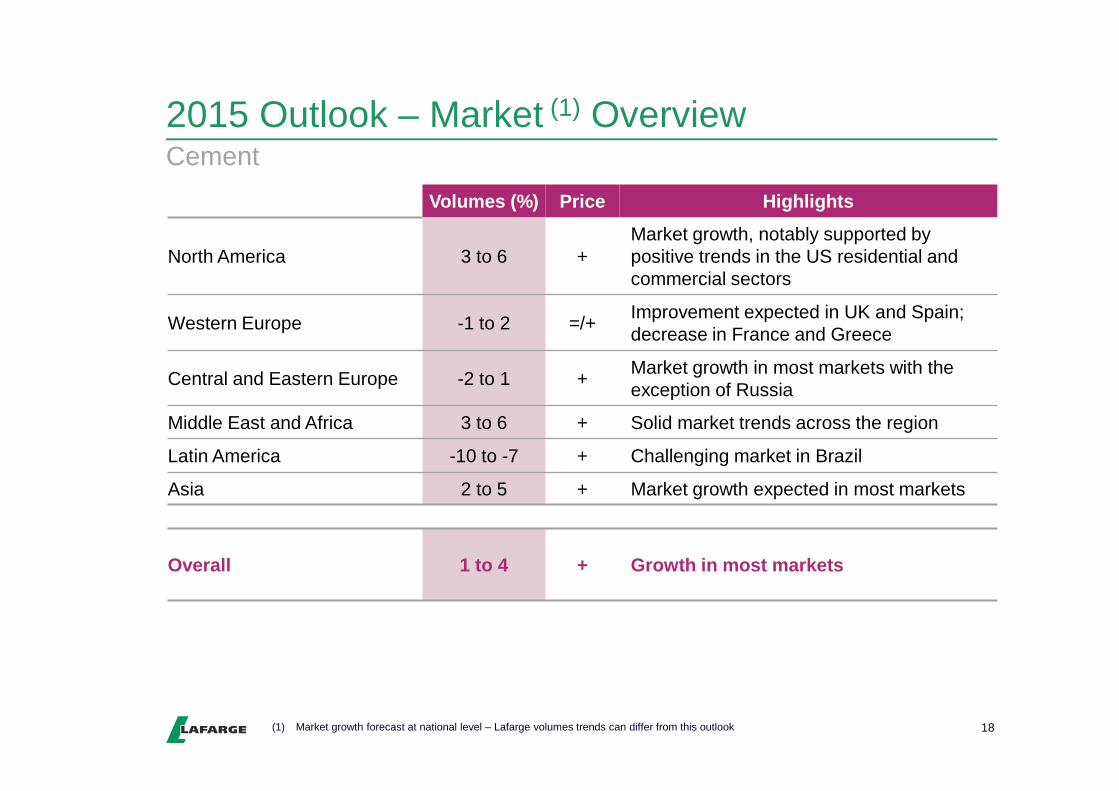
2015 Outlook – Market (1) Overview
18
Cement
(1) Market growth forecast at national level – Lafarge volumes trends can differ from this outlook
Volumes (%) Price Highlights
North America 3 to 6 +Market growth, notably supported by positive trends in the US residential and commercial sectors
Western Europe -1 to 2 =/+Improvement expected in UK and Spain; decrease in France and Greece
Central and Eastern Europe -2 to 1 +Market growth in most markets with the exception of Russia
Middle East and Africa 3 to 6 + Solid market trends across the region
Latin America -10 to -7 + Challenging market in Brazil
Asia 2 to 5 + Market growth expected in most markets
Overall 1 to 4 + Growth in most markets
2015 Outlook – Other Elements
19
and coal), partly compensated by increases in power
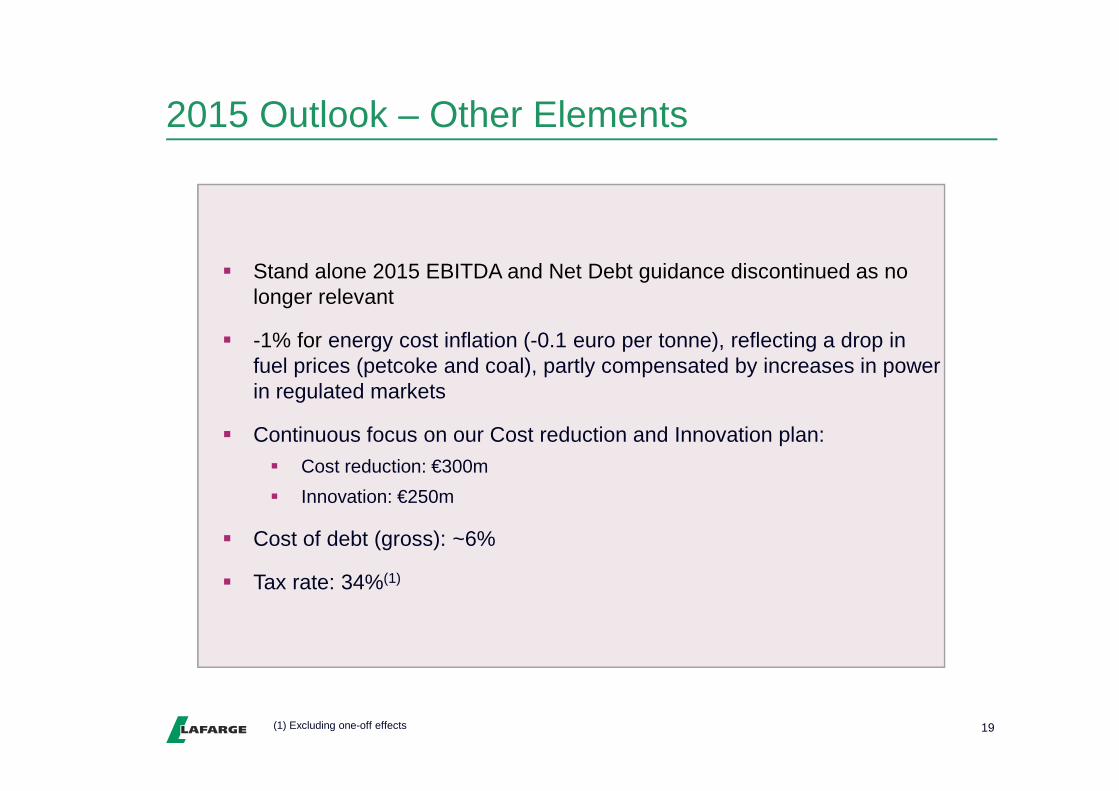
� Stand alone 2015 EBITDA and Net Debt guidance discontinued as no longer relevant
� -1% for energy cost inflation (-0.1 euro per tonne), reflecting a drop in fuel prices (petcoke and coal), partly compensated by increases in power in regulated markets
� Continuous focus on our Cost reduction and Innovation plan:
� Cost reduction: €300m
� Innovation: €250m
� Cost of debt (gross): ~6%
� Tax rate: 34%(1)
(1) Excluding one-off effects

ConclusionConclusionPhilippines – Affordable Housing
I. Other InformationI. Other InformationOutlook 2015 – Market OverviewOutlook 2015 – Market Overview
United States - Elmwood, New Jersey – Refurbishment in Ductal, the ultra-high performance concrete of Lafarge, of the Pulaski Skyway Bridge carrying a four-lane freeway over the Passaic and Hackensack rivers linking Jersey City to Newark airport.
© L
afar
ge M
edia
libra
ry-
Ron
Saa
ri
2015 Outlook – Market (1) overview
22
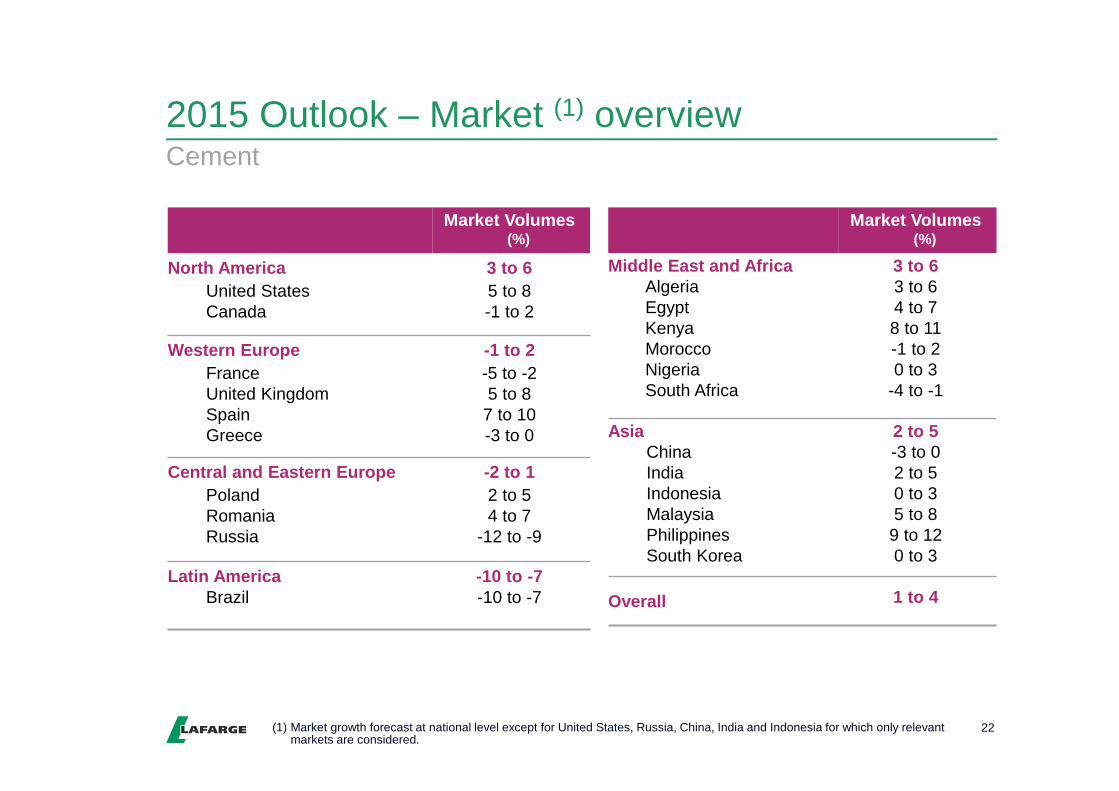
Cement
Market Volumes (%)
North AmericaUnited StatesCanada
3 to 65 to 8-1 to 2
Western EuropeFranceUnited KingdomSpainGreece
-1 to 2-5 to -25 to 87 to 10-3 to 0
Central and Eastern EuropePoland RomaniaRussia
-2 to 12 to 5 4 to 7
-12 to -9
Latin AmericaBrazil
-10 to -7-10 to -7
Market Volumes (%)
Middle East and AfricaAlgeriaEgyptKenyaMoroccoNigeria South Africa
3 to 63 to 64 to 78 to 11-1 to 2 0 to 3
-4 to -1
AsiaChinaIndiaIndonesiaMalaysiaPhilippinesSouth Korea
2 to 5-3 to 02 to 50 to 35 to 89 to 120 to 3
Overall 1 to 4
(1) Market growth forecast at national level except for United States, Russia, China, India and Indonesia for which only relevantmarkets are considered.
2015 Outlook – Market overview
� Main markets
� North America: Market growth, notably supported by positive trends in the US residential and commercial sectors.
� Western Europe: Overall stabilization at a low level. Growth expected in the UK, supported by the residential sector; decrease in France.
� Emerging markets: Market growth expected in most markets.
� Prices� Price improvement expected for both Pure Aggregates and Ready-Mix concrete.
Aggregates and Concrete
23
II. Other informationII. Other informationScope and Foreign Exchange EffectsScope and Foreign Exchange Effects
France, City of Lyon – Lyon Confluence district, in the Lyon former Docks district. Shopping center designed by architect Jean-Paul Viguier. Lafarge concrete has been used for the exterior surfaces around the center.
Cop
yrig
ht:
© L
ibra
ry L
afar
geT
. Cam
pagn
e -
CA
PA
Pic
ture
s-
Jean
-Pau
l Vig
uier
(ar
chite
ct)
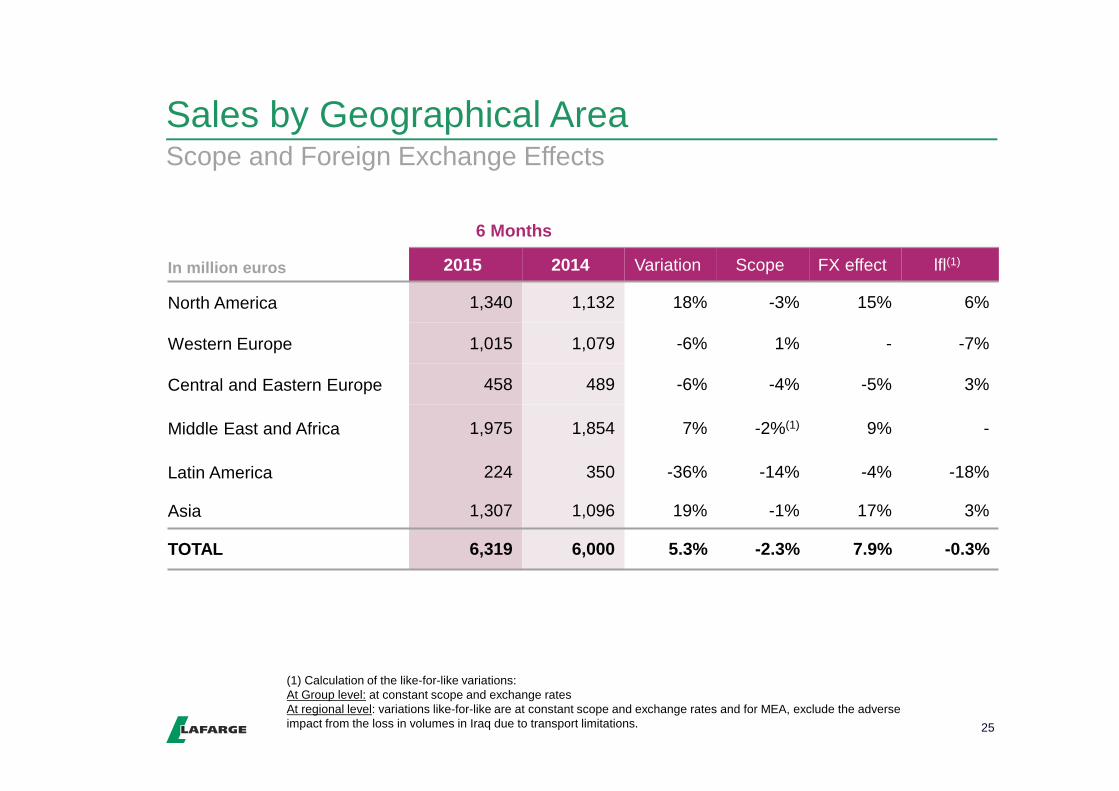
Sales by Geographical Area
25
Scope and Foreign Exchange Effects
In million euros
6 Months
2015 2014 Variation Scope FX effect lfl(1)
North America 1,340 1,132 18% -3% 15% 6%
Western Europe 1,015 1,079 -6% 1% - -7%
Central and Eastern Europe 458 489 -6% -4% -5% 3%
Middle East and Africa 1,975 1,854 7% -2%(1) 9% -
Latin America 224 350 -36% -14% -4% -18%
Asia 1,307 1,096 19% -1% 17% 3%
TOTAL 6,319 6,000 5.3% -2.3% 7.9% -0.3%
(1) Calculation of the like-for-like variations: At Group level: at constant scope and exchange ratesAt regional level: variations like-for-like are at constant scope and exchange rates and for MEA, exclude the adverse impact from the loss in volumes in Iraq due to transport limitations.

EBITDA by Geographical Area
26
Scope and Foreign Exchange Effects
In million euros
6 Months
2015 2014 Variation Scope FX effectImpact of one-off (1) lfl (1)
North America 170 115 48% -5% 17% - 36%
Western Europe 153 146 5% 2% - 10% -7%
Central and Eastern Europe 76 71 7% -5% - - 12%
Middle East and Africa 554 529 5% - 5% -4% 4%
Latin America 14 73 -81% -11% -1% - -69%
Asia 256 221 16% -2% 17% - 1%
TOTAL 1,223 1,155 6% -3% 7% - 2%
(1) Calculation of the like-for-like variations: At Group level: at constant scope and exchange ratesAt regional level: variations like-for-like are at constant scope and exchange rates and exclude:- carbon credit sales (€15m of credits sold in Q1 2015 versus none in Q1 2014 in Western Europe) - a €23m adverse impact from the loss in volumes in Iraq due to transport limitations.
II. Other informationII. Other informationInformation per ActivityInformation per Activity
Nigeria, City of Lagos
© L
afar
ge M
edia
libra
ry-
A. E
sieb
o-
CA
PA
P
ictu
res
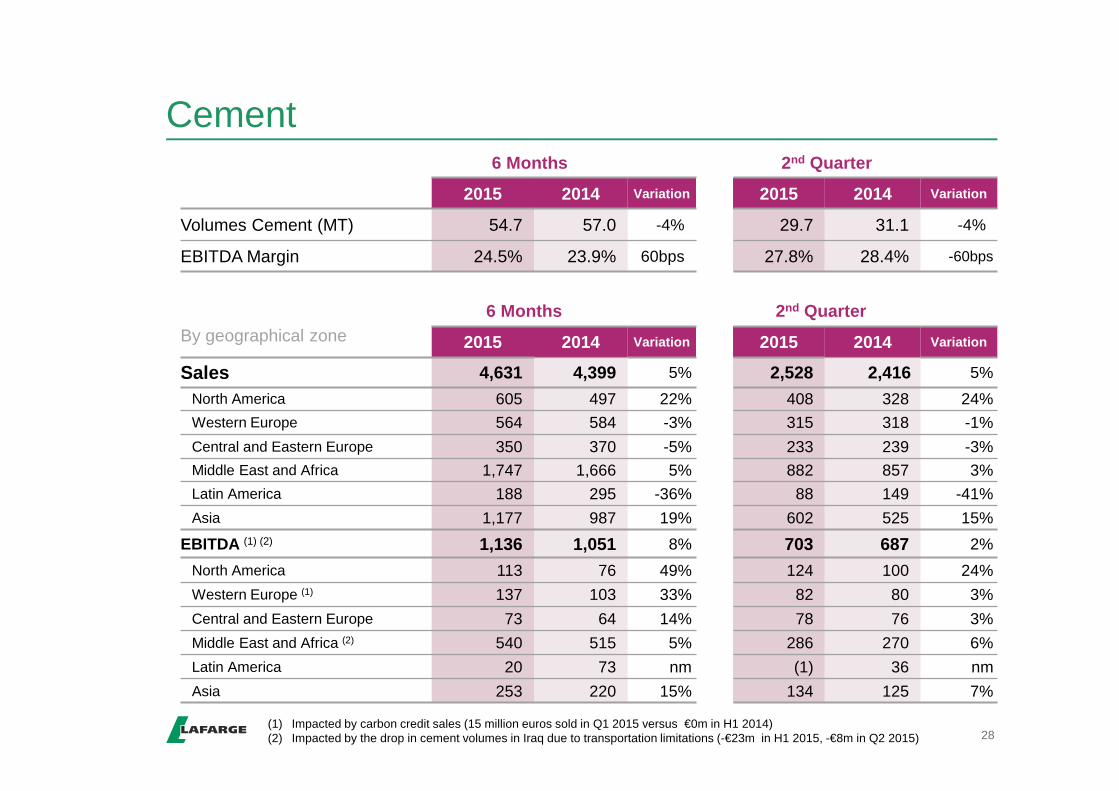
Cement
28
6 Months 2nd Quarter
2015 2014 Variation 2015 2014 Variation
Volumes Cement (MT) 54.7 57.0 -4% 29.7 31.1 -4%
EBITDA Margin 24.5% 23.9% 60bps 27.8% 28.4% -60bps
By geographical zone6 Months 2nd Quarter
2015 2014 Variation 2015 2014 Variation
Sales 4,631 4,399 5% 2,528 2,416 5%
North America 605 497 22% 408 328 24%
Western Europe 564 584 -3% 315 318 -1%
Central and Eastern Europe 350 370 -5% 233 239 -3%Middle East and Africa 1,747 1,666 5% 882 857 3%
Latin America 188 295 -36% 88 149 -41%
Asia 1,177 987 19% 602 525 15%
EBITDA (1) (2) 1,136 1,051 8% 703 687 2%
North America 113 76 49% 124 100 24%
Western Europe (1) 137 103 33% 82 80 3%
Central and Eastern Europe 73 64 14% 78 76 3%
Middle East and Africa (2) 540 515 5% 286 270 6%
Latin America 20 73 nm (1) 36 nm
Asia 253 220 15% 134 125 7%
(1) Impacted by carbon credit sales (15 million euros sold in Q1 2015 versus €0m in H1 2014)(2) Impacted by the drop in cement volumes in Iraq due to transportation limitations (-€23m in H1 2015, -€8m in Q2 2015)
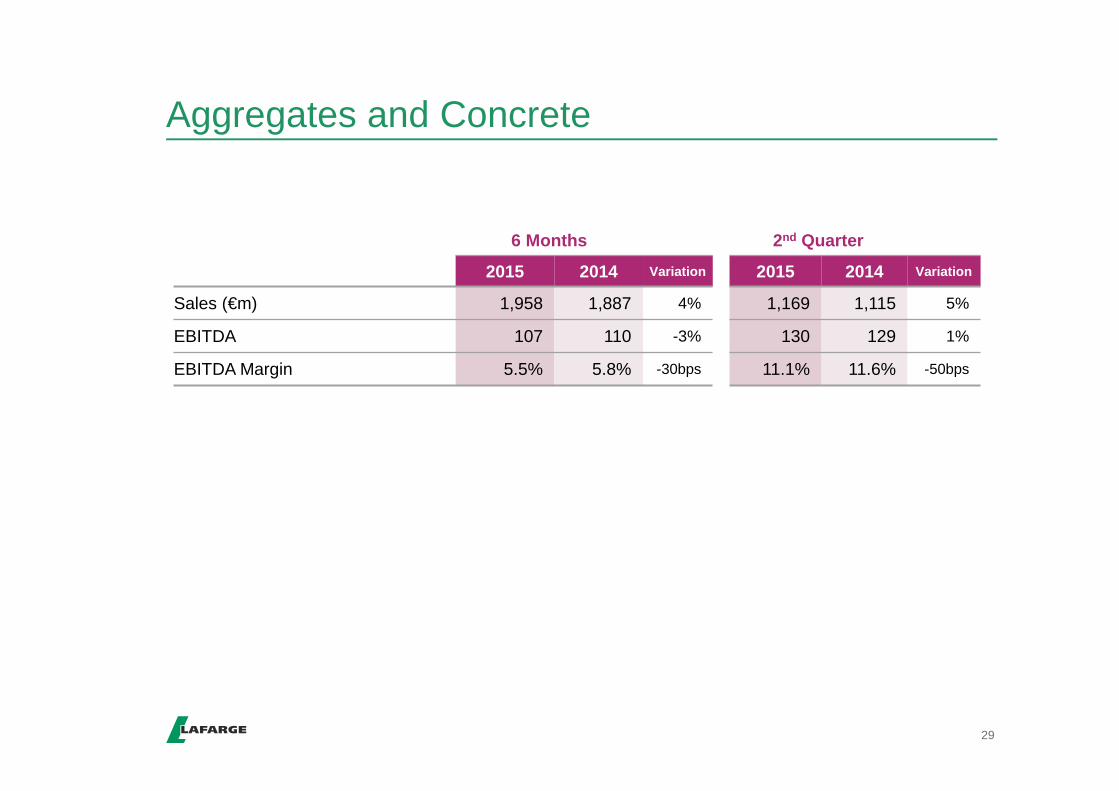
Aggregates and Concrete
29
6 Months 2nd Quarter
2015 2014 Variation 2015 2014 Variation
Sales (€m) 1,958 1,887 4% 1,169 1,115 5%
EBITDA 107 110 -3% 130 129 1%
EBITDA Margin 5.5% 5.8% -30bps 11.1% 11.6% -50bps
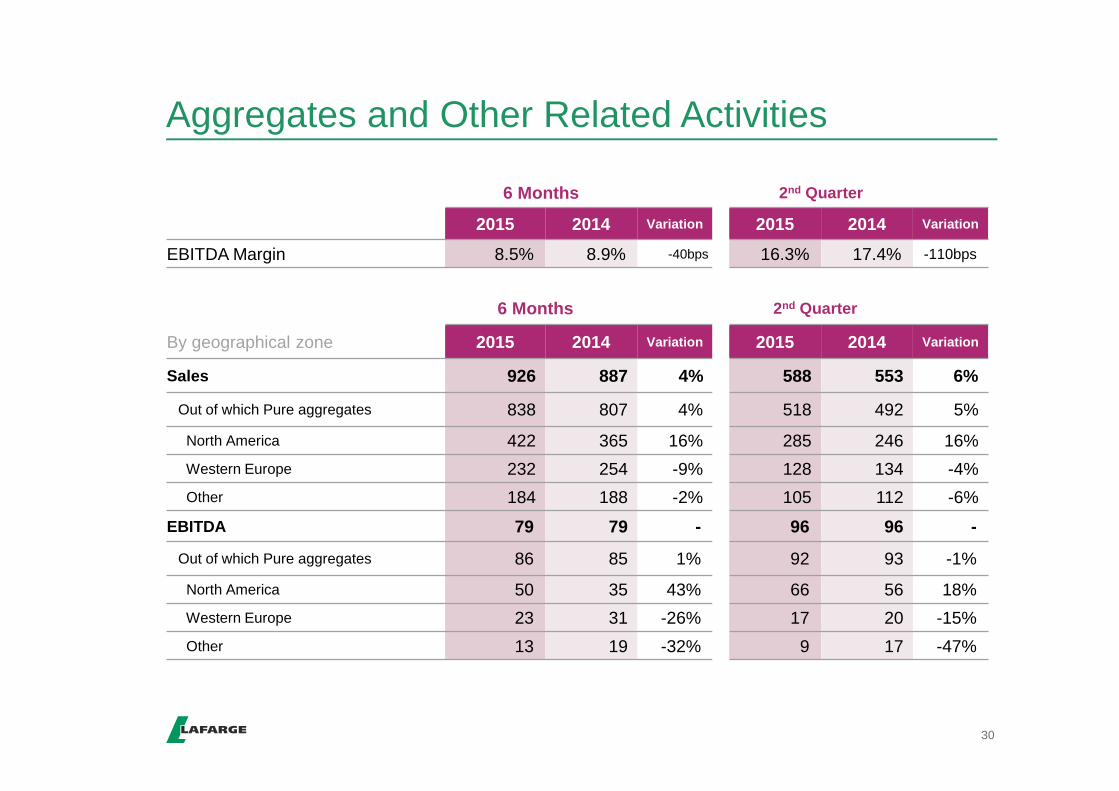
Aggregates and Other Related Activities
30
6 Months 2nd Quarter
2015 2014 Variation 2015 2014 Variation
EBITDA Margin 8.5% 8.9% -40bps 16.3% 17.4% -110bps
6 Months 2nd Quarter
By geographical zone 2015 2014 Variation 2015 2014 Variation
Sales 926 887 4% 588 553 6%
Out of which Pure aggregates 838 807 4% 518 492 5%
North America 422 365 16% 285 246 16%
Western Europe 232 254 -9% 128 134 -4%
Other 184 188 -2% 105 112 -6%
EBITDA 79 79 - 96 96 -
Out of which Pure aggregates 86 85 1% 92 93 -1%
North America 50 35 43% 66 56 18%
Western Europe 23 31 -26% 17 20 -15%
Other 13 19 -32% 9 17 -47%

Ready-Mix Concrete and Concrete Products
31
6 Months 2nd Quarter
2015 2014 Variation 2015 2014 Variation
EBITDA Margin 2.4% 2.7% -30bps 5.1% 5.1% -
6 Months 2nd Quarter
By geographical zone 2015 2014 Variation 2015 2014 Variation
Sales 1,184 1,150 3% 670 648 3%
Out of which ready-mix concrete 1,125 1,098 2% 633 615 3%
North America 331 283 17% 211 179 18%
Western Europe 371 408 -9% 198 211 -6%
Other 423 407 4% 224 225 -
EBITDA 28 31 -10% 34 33 3%
Out of which ready-mix concrete 17 22 -24% 24 25 -4%
North America - (3) nm 9 8 13%
Western Europe 15 20 -25% 11 13 -15%
Other 2 5 nm 4 4 -

II. Other informationII. Other informationSales variances for a selection of countriesSales variances for a selection of countries
Nigeria, City of Lagos
© L
afar
ge M
edia
libra
ry-
A. E
sieb
o-
CA
PA
P
ictu
res

YTD Like-for-Like Sales Variance – Cement
33
Analysis by Region and Major Market as at June 30, 2015
Volume effect Other effects (1) Activity variation vs. 2014
North AmericaUnited StatesCanada
2.3%-0.4%5.9%
2.6%6.9%
-2.5%
4.9%6.5%3.4%
Western EuropeFranceSpainGreece
-4.9%-6.7%(2)
-2.7%(3)
-1.1%
-2.1%-1.9%(2)
10.0%(3)
-7.0%
-7.0%-8.6%7.3%
-8.1%
Central and Eastern EuropePoland RomaniaRussia
10.3%-8.6%30.4%52.5%
-4.6%-4.0%-5.2%2.2%
5.7%-12.6%25.2%54.7%
Middle East and AfricaAlgeriaEgyptIraqKenyaNigeriaSouth Africa
-0.6%0.2%
19.8%-24.5%17.4%
6.0%-3.3%
3.0%4.7%
-6.6%-12.3%
-1.2%7.9%
-2.6%
2.4%4.9%
13.2%-36.8%16.2%13.9%-5.9%
Latin America -11.2% -3.1% -14.3%
AsiaIndiaIndonesiaMalaysiaPhilippinesSouth Korea
4.8%6.0%
-9.0%1.1%
11.7%2.1%
-0,8%-1.8%4.9%
-0,5%-3.2%0.3%
4.0%4.2%
-4.1%0.6%8.5%2.4%
Cement domestic markets 1.3% - 1.3%
Main Joint ventures UKMoroccoChina
-2.4%0.1%
-7.9%
5.5%2.6%
-13.2%
3.1%2.7%
-21.1%
(1) Other effects: including price effects, product and customer mix effects(2) Lime, grey and white cement(3) Impacted by lower clinker sales – grey cement volumes up 11%
(disclosed for information and not included in the regional sub-totals disclosed above
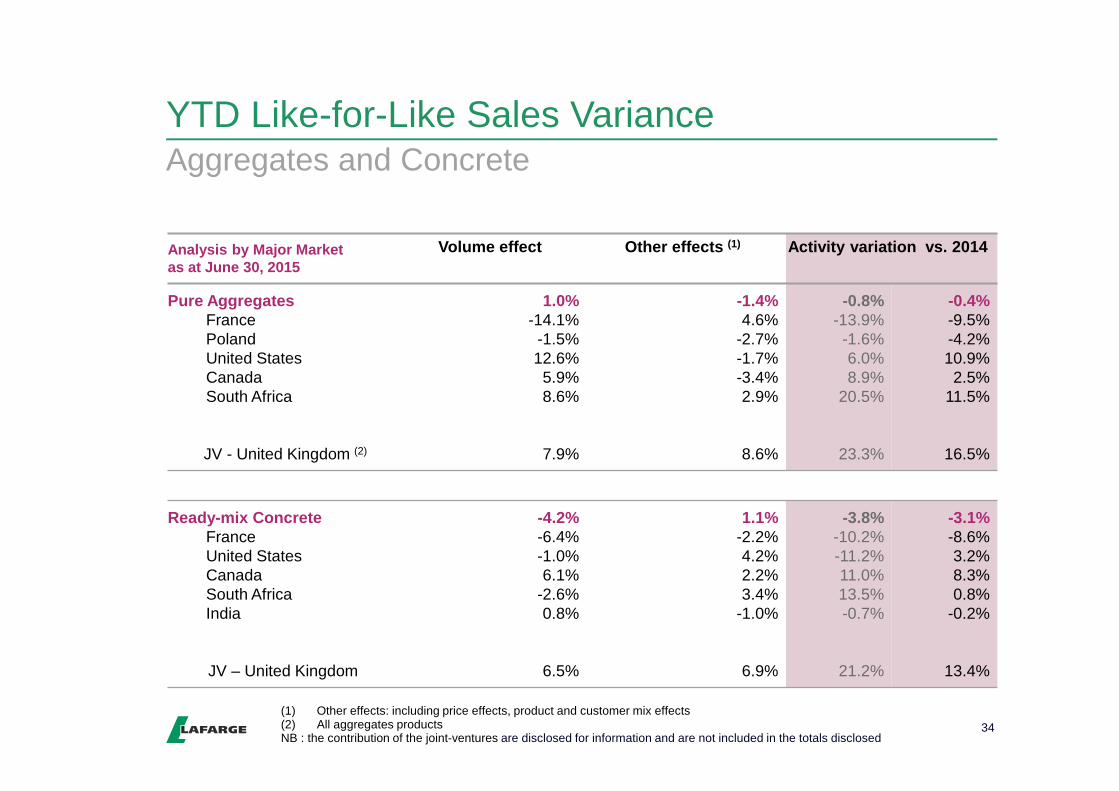
Analysis by Major Market as at June 30, 2015
Volume effect Other effects (1) Activity variation vs. 2014
Pure AggregatesFrancePolandUnited StatesCanadaSouth Africa
JV - United Kingdom (2)
1.0%-14.1%
-1.5%12.6%
5.9%8.6%
7.9%
-1.4%4.6%
-2.7%-1.7%-3.4%2.9%
8.6%
-0.8%-13.9%
-1.6%6.0%8.9%
20.5%
23.3%
-0.4%-9.5%-4.2%10.9%
2.5%11.5%
16.5%
Ready-mix ConcreteFranceUnited StatesCanadaSouth Africa India
JV – United Kingdom
-4.2%-6.4%-1.0%6.1%
-2.6%0.8%
6.5%
1.1%-2.2%4.2%2.2%3.4%
-1.0%
6.9%
-3.8%-10.2%-11.2%11.0%13.5%-0.7%
21.2%
-3.1%-8.6%3.2%8.3%0.8%
-0.2%
13.4%
YTD Like-for-Like Sales Variance
34
Aggregates and Concrete
(1) Other effects: including price effects, product and customer mix effects(2) All aggregates productsNB : the contribution of the joint-ventures are disclosed for information and are not included in the totals disclosed

VI. Other InformationVI. Other InformationIncome statementIncome statement
France, City of Lyon – Lyon Confluence district, in the Lyon former Docks district. Shopping center designed by architect Jean-Paul Viguier. Lafarge concrete has been used for the exterior surfaces around the center.
Cop
yrig
ht:
© L
ibra
ry L
afar
geT
. Cam
pagn
e -
CA
PA
Pic
ture
s-
Jean
-Pau
l Vig
uier
(ar
chite
ct)
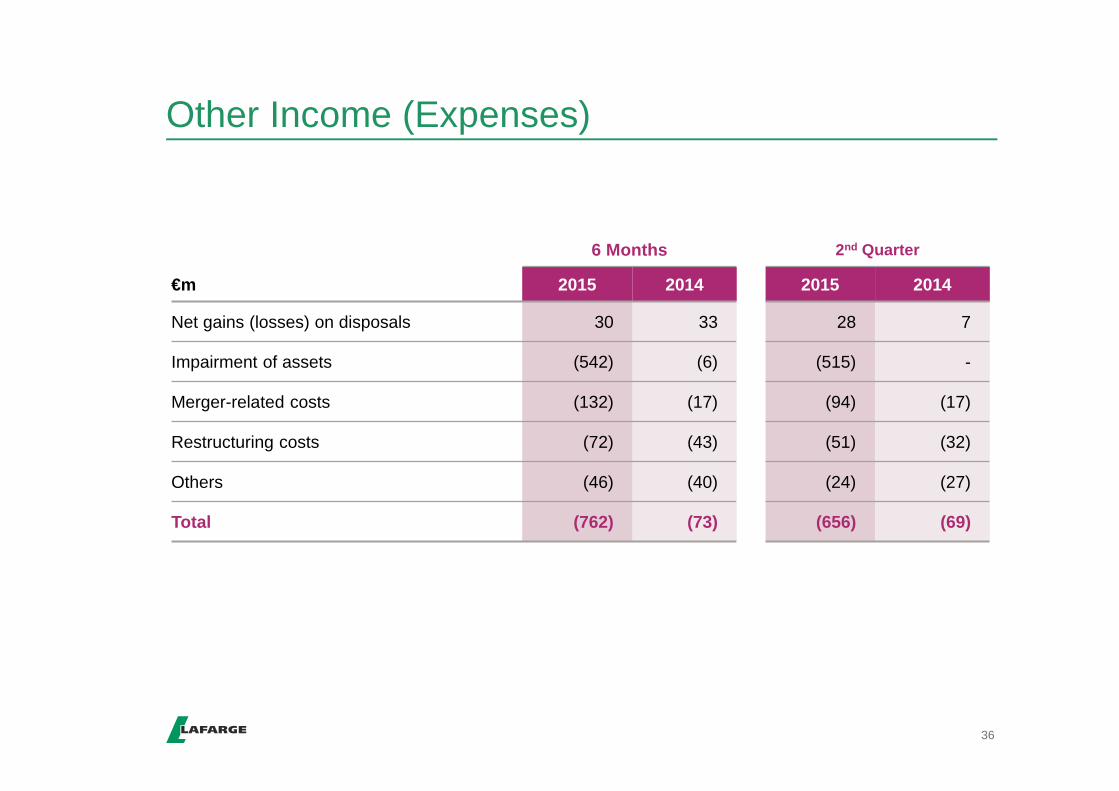
Other Income (Expenses)
36
6 Months 2nd Quarter
€m 2015 2014 2015 2014
Net gains (losses) on disposals 30 33 28 7
Impairment of assets (542) (6) (515) -
Merger-related costs (132) (17) (94) (17)
Restructuring costs (72) (43) (51) (32)
Others (46) (40) (24) (27)
Total (762) (73) (656) (69)
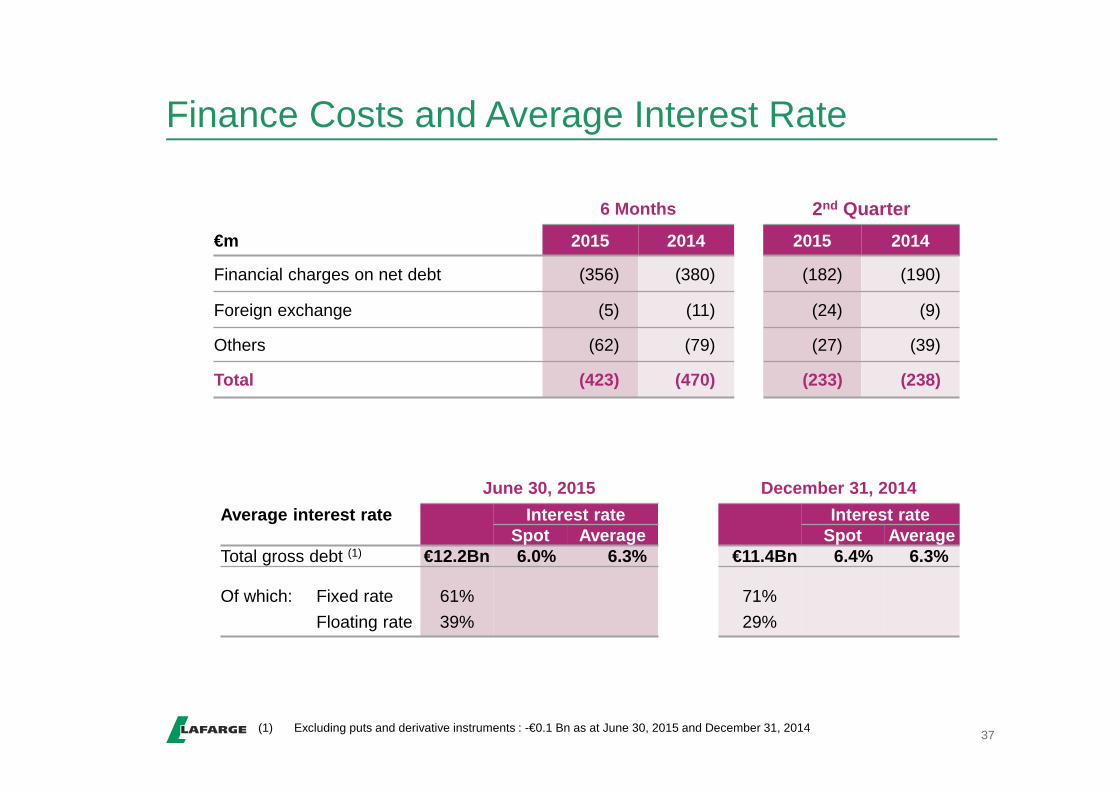
Finance Costs and Average Interest Rate
37(1) Excluding puts and derivative instruments : -€0.1 Bn as at June 30, 2015 and December 31, 2014
6 Months 2nd Quarter
€m 2015 2014 2015 2014
Financial charges on net debt (356) (380) (182) (190)
Foreign exchange (5) (11) (24) (9)
Others (62) (79) (27) (39)
Total (423) (470) (233) (238)
June 30, 2015 December 31, 2014
Average interest rate Interest rate Interest rateSpot Average Spot Average
Total gross debt (1) €12.2Bn 6.0% 6.3% €11.4Bn 6.4% 6.3%
Of which: Fixed rate 61% 71%
Floating rate 39% 29%
VI. Other InformationVI. Other InformationStatement of Financial Position & Cash Flow Stateme ntStatement of Financial Position & Cash Flow Stateme nt
© L
afar
ge M
edia
libra
ry-
Ron
nelC
uiso
n
Philippines - Affordable housing, colored houses in the village of Iliga
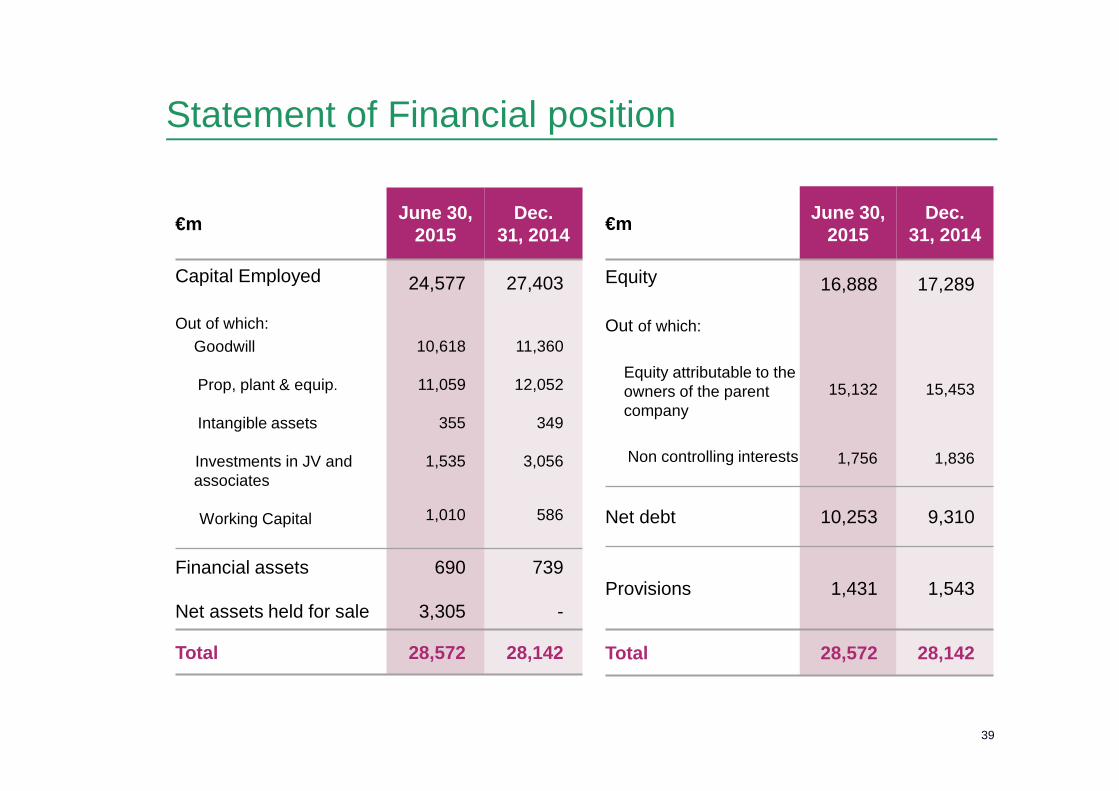
Statement of Financial position
39
€mJune 30,
2015Dec.
31, 2014
Capital Employed
Out of which:Goodwill
Prop, plant & equip.
Intangible assets
Investments in JV and associates
Working Capital
24,577
10,618
11,059
355
1,535
1,010
27,403
11,360
12,052
349
3,056
586
Financial assets
Net assets held for sale
690
3,305
739
-
Total 28,572 28,142
€mJune 30,
2015Dec.
31, 2014
Equity
Out of which:
Equity attributable to the owners of the parent company
Non controlling interests
16,888
15,132
1,756
17,289
15,453
1,836
Net debt 10,253 9,310
Provisions 1,431 1,543
Total 28,572 28,142
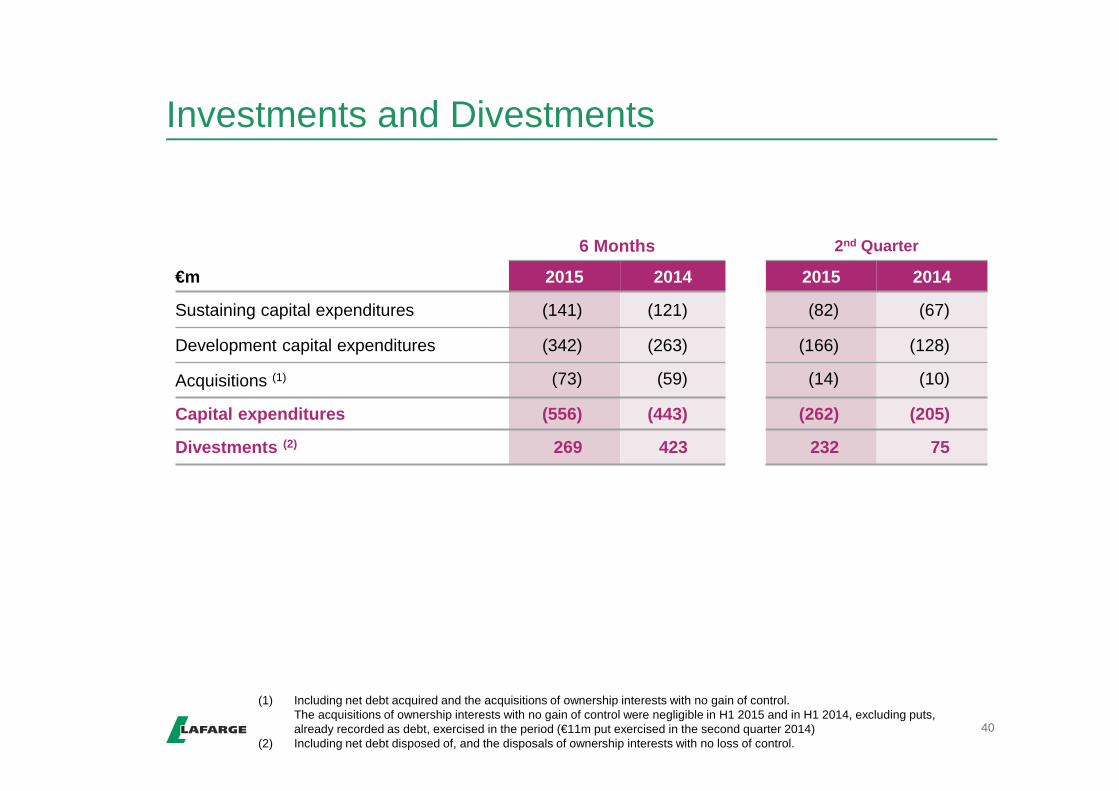
Investments and Divestments
40
6 Months 2nd Quarter
€m 2015 2014 2015 2014
Sustaining capital expenditures (141) (121) (82) (67)
Development capital expenditures (342) (263) (166) (128)
Acquisitions (1) (73) (59) (14) (10)
Capital expenditures (556) (443) (262) (205)
Divestments (2) 269 423 232 75
(1) Including net debt acquired and the acquisitions of ownership interests with no gain of control.The acquisitions of ownership interests with no gain of control were negligible in H1 2015 and in H1 2014, excluding puts, already recorded as debt, exercised in the period (€11m put exercised in the second quarter 2014)
(2) Including net debt disposed of, and the disposals of ownership interests with no loss of control.

Balanced Debt Maturity Schedule
41
Average maturity of gross debt is 3 years and 8 months
0
200
400
600
800
1000
1200
1400
1600
1800
2000
2200
2400
2600
2800
3000
2015 2016 2017 2018 2019 2020 2021 2022 and after
As at June 30, 2015 (1)
Lafarge SA short-term borrowings
Lafarge SA Bonds & other MLT instruments
Subsidiaries debt instruments
Securitization programs
In million euros
(1) Excluding puts on shares and derivatives instrumentsNB : €0.55Bn Lafarge SA short-term borrowings are classified as long-term in the Group’s Statement of Financial Position, as they can be refinanced on a medium and long-term basis through the committed credit lines.
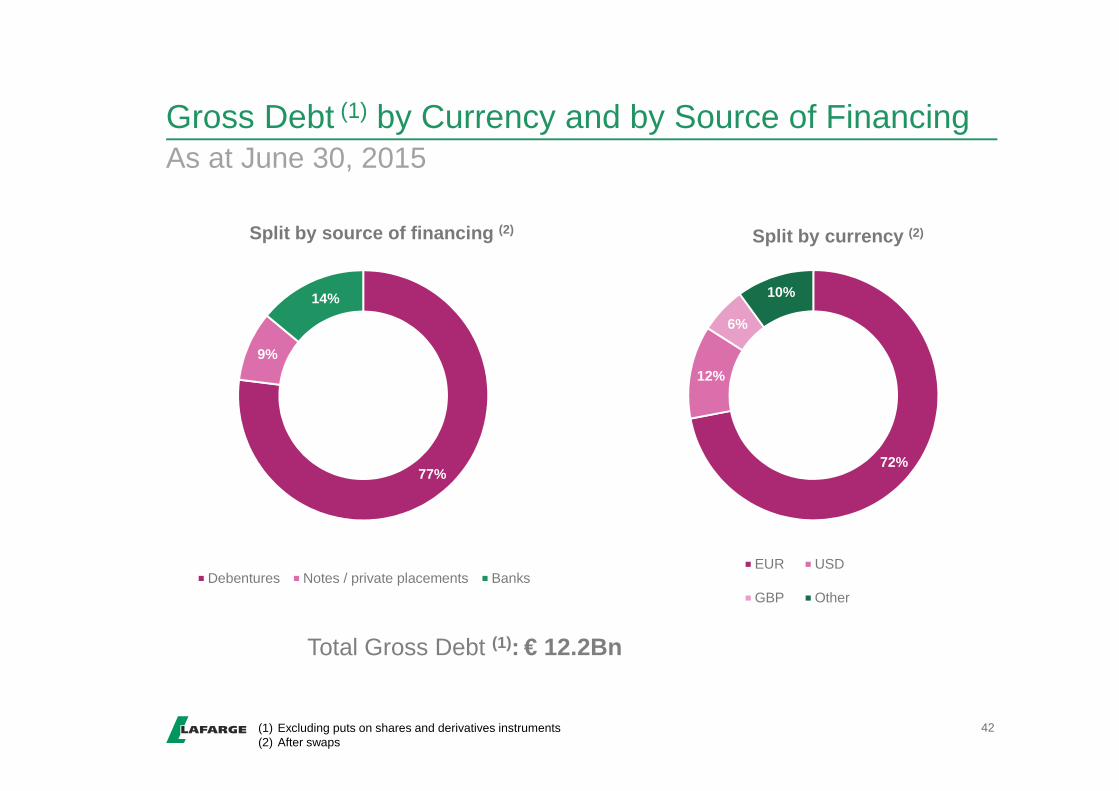
Gross Debt (1) by Currency and by Source of Financing
42
As at June 30, 2015
Total Gross Debt (1): € 12.2Bn
(1) Excluding puts on shares and derivatives instruments(2) After swaps
72%
12%
6%
10%
Split by currency (2)
EUR USD
GBP Other
77%
9%
14%
Split by source of financing (2)
Debentures Notes / private placements Banks
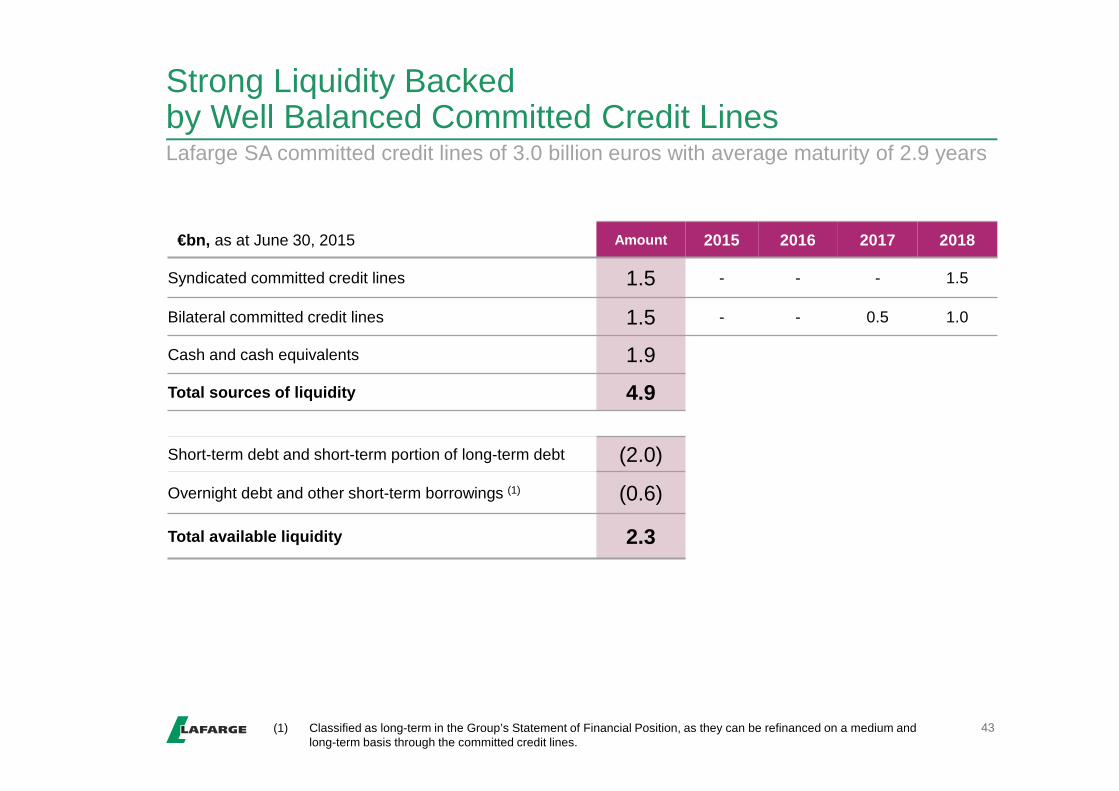
Strong Liquidity Backed by Well Balanced Committed Credit Lines
43
Lafarge SA committed credit lines of 3.0 billion euros with average maturity of 2.9 years
(1) Classified as long-term in the Group’s Statement of Financial Position, as they can be refinanced on a medium and long-term basis through the committed credit lines.
€bn, as at June 30, 2015 Amount 2015 2016 2017 2018
Syndicated committed credit lines 1.5 - - - 1.5
Bilateral committed credit lines 1.5 - - 0.5 1.0
Cash and cash equivalents 1.9
Total sources of liquidity 4.9
Short-term debt and short-term portion of long-term debt (2.0)
Overnight debt and other short-term borrowings (1) (0.6)
Total available liquidity 2.3

VII. Other InformationVII. Other InformationIFRS 11 on Joint Arrangements - Main Impacts on Grou p Key FiguresIFRS 11 on Joint Arrangements - Main Impacts on Grou p Key Figures
© L
afar
ge M
edia
libra
ry-
Ron
nelC
uiso
n
Philippines - Affordable housing, colored houses in the village of Iliga
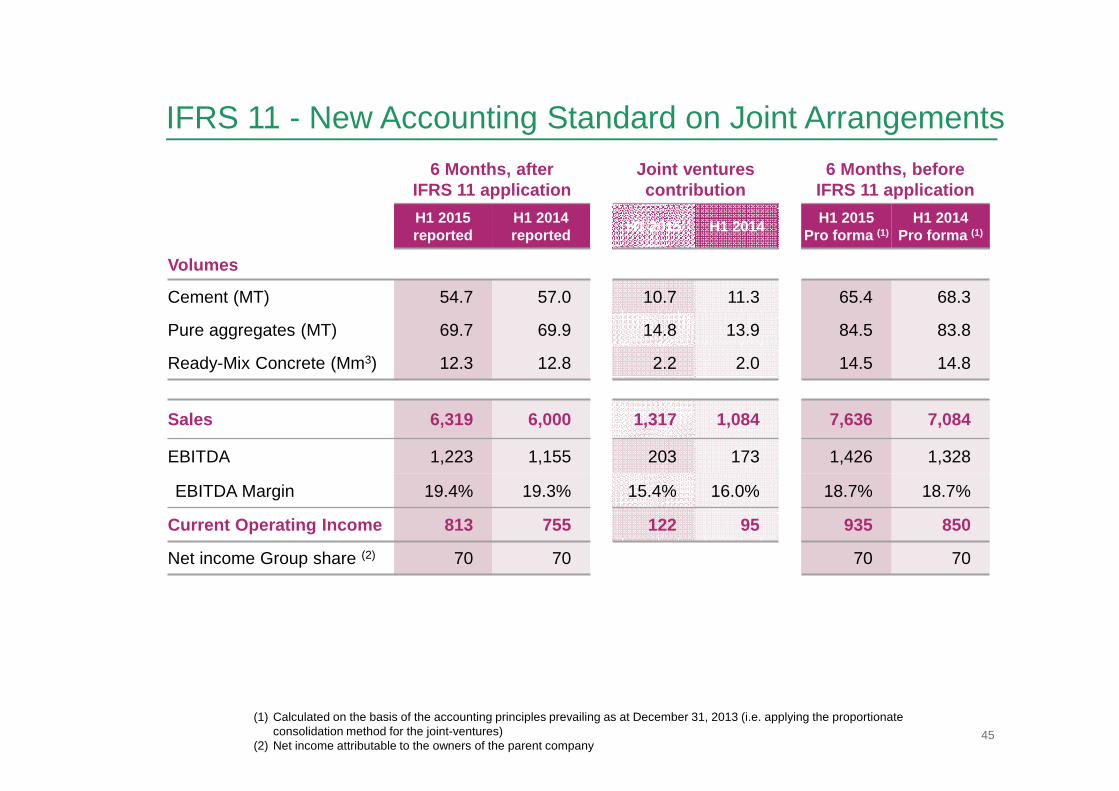
IFRS 11 - New Accounting Standard on Joint Arrangements
45
(1) Calculated on the basis of the accounting principles prevailing as at December 31, 2013 (i.e. applying the proportionate consolidation method for the joint-ventures)
(2) Net income attributable to the owners of the parent company
6 Months, after IFRS 11 application
Joint ventures contribution
6 Months, before IFRS 11 application
H1 2015 reported
H1 2014 reported
H1 2015 H1 2014H1 2015
Pro forma (1)H1 2014
Pro forma (1)
Volumes
Cement (MT) 54.7 57.0 10.7 11.3 65.4 68.3
Pure aggregates (MT) 69.7 69.9 14.8 13.9 84.5 83.8
Ready-Mix Concrete (Mm3) 12.3 12.8 2.2 2.0 14.5 14.8
Sales 6,319 6,000 1,317 1,084 7,636 7,084
EBITDA 1,223 1,155 203 173 1,426 1,328
EBITDA Margin 19.4% 19.3% 15.4% 16.0% 18.7% 18.7%
Current Operating Income 813 755 122 95 935 850
Net income Group share (2) 70 70 70 70
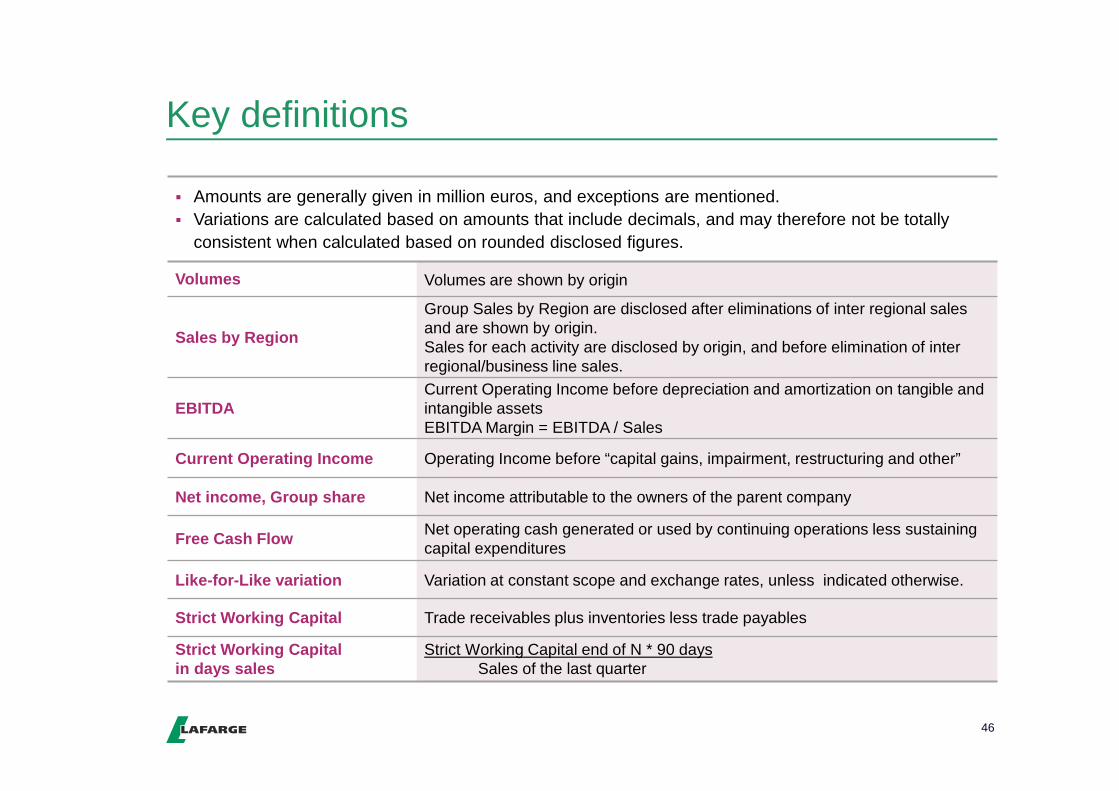
Key definitions
46
� Amounts are generally given in million euros, and exceptions are mentioned.� Variations are calculated based on amounts that include decimals, and may therefore not be totally
consistent when calculated based on rounded disclosed figures.
Volumes Volumes are shown by origin
Sales by Region
Group Sales by Region are disclosed after eliminations of inter regional sales and are shown by origin.Sales for each activity are disclosed by origin, and before elimination of inter regional/business line sales.
EBITDACurrent Operating Income before depreciation and amortization on tangible and intangible assetsEBITDA Margin = EBITDA / Sales
Current Operating Income Operating Income before “capital gains, impairment, restructuring and other”
Net income, Group share Net income attributable to the owners of the parent company
Free Cash FlowNet operating cash generated or used by continuing operations less sustaining capital expenditures
Like-for-Like variation Variation at constant scope and exchange rates, unless indicated otherwise.
Strict Working Capital Trade receivables plus inventories less trade payables
Strict Working Capital in days sales
Strict Working Capital end of N * 90 daysSales of the last quarter