the smart entres index 3
TRANSCRIPT

The Smart Centres Index 3
June 2021
Distributed Futures

Smart Centres Index 3
We are pleased to present the third edition of the Smart Centres Index (SCI 3). The SCI has been developed by Z/Yen, as part of its Long Finance Initiative and the Distributed Futures Programme to track the development of technology and financial centres across the world in their support for and readiness for new technology applications. It aims to help investors, governments, and regulators track the attractiveness of technology centres for new technologies and products by measuring how attuned centres and their regulatory systems are to attracting innovation and growth in Science, Technology, Energy Systems, Machine Learning, Distributed Ledgers, and Fintech. The SCI tracks three dimensions related to innovation and technology in the cities that we rank:
• Innovation Support - the support provided by regulatory and other systems to innovation and technology in a centre.
• Creative Intensity - the intensity of technology and innovation services and opportunities in a centre.
• Delivery Capability - the quality of the technology and innovation work that is taking place in a centre.
Z/Yen helps organisations make better choices - our clients consider us a commercial think-tank that spots, solves, and acts. Our name combines Zen and Yen - ‘a philosophical desire to succeed’ - in a ratio, recognising that all decisions are trade-offs. One of Z/Yen’s specialisms is the development and publication of research combining factor analysis and professional assessments. Long Finance is a Z/Yen initiative designed to address the question “When would we know our financial system is working?” This question underlies Long Finance’s goal to improve society’s understanding and use of finance over the long-term. In contrast to the short-termism that defines today’s economic views the Long Finance time-frame is roughly 100 years. The authors of this report, Mike Wardle and Professor Michael Mainelli, would like to thank Bikash Kharel, and the rest of the Z/Yen team for their contributions with research, modelling, and ideas.
Cover Photo by Ramón Salinero on Unsplash
Smart Centres Index 3
1
Foreword The launch of the third edition of Z/Yen’s Smart Centres Index comes at a time when we are seeing first-hand the benefit that successful technologies can have on the way we live and work. Without such innovation, global trade and business would surely have ground to a halt in the face of the global pandemic. It is only right that the Index recognises and celebrates those centres around the world which are successfully nurturing innovation. Here at Dubai International Financial Centre (DIFC), innovation has been part of our DNA from our inception in 2004 and continues to be part of our vision, which is to drive the future of finance. Dubai also has an innovation strategy. It does not just aim to be a smart city, we want to lead the way in smart initiatives. For the past four years, Dubai has launched over 130 specific initiatives and 1,000 smart services across government bodies. In doing so, it has simultaneously cultivated an ecosystem of innovation which goes far beyond the government and has seen Dubai bringing the fourth industrial revolution to life. We are home to the first, largest and most comprehensive ecosystem for innovation and FinTech in the Middle East, Africa, and South Asia region. DIFC is leading the charge, acting as a bridge to connect innovators with education, mentors, partners, operating and regulatory support as well as access to funding. Today, we have over 350 FinTech and innovation firms in our community who represent more than 50 per cent of those operating in the GCC. They sit alongside many of the world’s leading financial institutions, all of which have chosen DIFC as their home in our region. Within this community, there is the region’s leading pool of incredible talent. This allows us to bring together fresh thinking with seasoned expertise to address the challenges that society is facing, not just in the time of COVID-19 but looking ahead to the next normal. It is in this spirit of collaboration therefore that I am delighted to make this introduction to the Smart Centres Index 3. Not only does the Index highlight global trailblazers, it also helps to identify critical factors for success and share learnings which ultimately will support more cities cultivate a Smart approach for the benefit of all.
Arif Amiri CEO Dubai International Financial Centre Authority

Smart Centres Index 3
2
Summary And Headlines Overview • We researched 131 commercial and financial centres for this third edition of the Smart Centres
Index (SCI 3). The number of centres in the index has increased from 51 to 67. • All centres in the index received a higher rating than in SCI 2, with some centres’ ratings rising
sharply while they fell in the rankings due to new centres entering in higher positions. • Only two centres rose 10 or more places in the rankings in SCI 3, while 19 centres fell 10 or more
places. SCI 3 Results • London regained its first position in the index with New York falling to second place. Oxford,
Stockholm, Hong Kong, and Cambridge have overtaken Singapore, which fell from third to seventh place.
• New York is now the only US centre in the top 10, with Stockholm and Dublin replacing Los Angeles and Chicago in this group.
• The cluster of innovation activity between London, Oxford, and Cambridge, sometimes called the ‘Golden Triangle’ is shown in the index results. We will consider further how to reflect the fact of this cluster in future editions of the SCI.
• A number of centres that have entered the index for the first time have entered in high positions. Our experience with this type of research suggests that new centres are likely to fall back slightly in the rankings in subsequent editions.
North America • Seattle has joined the index for the first time, ranking 16th overall. 11 North American centres
feature in SCI 3. • All US centres fell in the rankings as other centres entered the index or improved their position. Asia/Pacific • Bangkok and Sydney rose in the SCI rankings, while other centres fell. • Seoul, Tianjin, Osaka, and Busan entered the SCI for the first time. • Some Chinese centres, including Shenzhen, which have strong technology ecosystems, do not
feature as highly in the index as we might have expected. This may be because those rating Chinese centres know Hong Kong, Beijing and Shanghai better than other centres.
Western Europe • Seven Western European centres featured in the world top 10 in SCI 3. • Lugano, Malta, Berlin, and Vienna are new entrants to the index. Middle East & Africa • Tel Aviv leads this region, although it fell seven places in SCI 3 to 18th, and is challenged by Dubai in
20th place. • Abu Dhabi and Riyadh join the SCI for the first time in SCI 3. Eastern Europe & Central Asia
• Sofia, Budapest, Warsaw, and Istanbul are new entrants to the index, joining Moscow. Other than
Sofia, ranked 28th, centres in the region mostly sit in the lower half of the rankings.

Smart Centres Index 3
3
Latin America & The Caribbean • Mexico City joins the Cayman Islands as the only two centres in the region to feature in the SCI.
Cayman Islands improved its rating considerably, although its ranking remained at 42nd. Commentary The Smart Centres Index focuses on financial and commercial centres across the world in relation to their approach to and delivery of innovation and technology, including Science, Energy Systems, Machine Learning, Distributed Ledgers, and Fintech, along with other applications. The SCI takes into account the three dimensions of Innovation Support, Creative Intensity and Delivery Capability. In broad terms, centres in North America and Western Europe score well for innovation Support and Delivery Capability but vary in terms of their Creative Intensity. Centres in China in particular score lower for Innovation Support. Leading centres in the SCI are based in places which combine a high performing university sector across STEM subjects, with well-developed regulatory, commercial and financial services. SCI 3 The SCI is a factor assessment index, combining a number of instrumental factors - data measures drawn from a range of data providers across the world - and assessments given by business and finance professionals of three dimensions related to innovation and technology in major commercial and financial centres: • Innovation Support - the approach taken to regulation and support for the innovation and
technology industry provided by the commercial ecosystem. • Creative Intensity - the extent to which technology and innovative industries are embedded in the
economy of the centre. • Delivery Capability - the quality of the work being undertaken in the field in the centre. These dimensions are brought together in the overall SCI ratings to produce the index, which is updated every six months. SCI 3 was compiled using 127 instrumental factors. These quantitative measures are provided by third parties including the World Bank, The Economist Intelligence Unit, the OECD, and the United Nations. Details can be found in Appendix 4. The instrumental factors were combined with 1,971 assessments provided by respondents to the SCI online questionnaire. Details of the 280 respondents are shown in Appendix 2. Further details of the methodology behind SCI 3 are in Appendix 3. The 67 centres listed in SCI 3 are those which received an adequate number of assessments from survey respondents or which had appeared in SCI 2. We are likely to increase this minimum for entry to the index in future editions. Assessments of respondents’ home centres were excluded from the data, in order to avoid home centre bias.

Smart Centres Index 3
4
SCI 3 Ranks And Ratings Table 1 | Smart Centres Index 3: Ranks And Ratings
Centre SCI 3 SCI 2 Change in
Rank
Change in
Rating Rank Rating Rank Rating
London 1 729 2 694 ▲1 ▲35
New York 2 716 1 701 ▼1 ▲15
Oxford, UK 3 709 5 677 ▲2 ▲32
Stockholm 4 705 12 650 ▲8 ▲55
Hong Kong 5 704 4 681 ▼1 ▲23
Cambridge, UK 6 703 6 676 0 ▲27
Singapore 7 701 3 689 ▼4 ▲12
Dublin 8 699 18 639 ▲10 ▲60
Zurich 9 694 8 671 ▼1 ▲23
Geneva 10 689 10 666 0 ▲23
Amsterdam 11 688 16 642 ▲5 ▲46
Los Angeles 12 684 9 670 ▼3 ▲14
Lugano 13 683 New New New New
Chicago 14 682 7 673 ▼7 ▲9
Boston 15 681 14 645 ▼1 ▲36
Seattle 16 678 New New New New
San Francisco 17 676 13 649 ▼4 ▲27
Tel Aviv 18 675 11 651 ▼7 ▲24
Glasgow 19 671 23 632 ▲4 ▲39
Dubai 20 670 17 640 ▼3 ▲30
Edinburgh 21 669 21 634 0 ▲35
Malta 22 668 New New New New
Beijing 23 667 15 643 ▼8 ▲24
Paris 24 666 19 636 ▼5 ▲30
Toronto 25 665 25 628 0 ▲37
Abu Dhabi 26 664 New New New New
Luxembourg 27 663 30 619 ▲3 ▲44
Sofia 28 662 New New New New
Berlin 29 661 New New New New
Shanghai 30 660 22 633 ▼8 ▲27
Vancouver 31 659 34 608 ▲3 ▲51
Seoul 32 658 New New New New
Bangkok 33 657 43 578 ▲10 ▲79
Sydney 34 656 39 588 ▲5 ▲68

Smart Centres Index 3
5
Table 1 (continued) | Smart Centres Index 3: Ranks And Ratings
Centre SCI 3 SCI 2 Change in
Rank
Change in
Rating Rank Rating Rank Rating
Vienna 35 655 New New New New
Guernsey 36 654 24 629 ▼12 ▲25
Tokyo 37 653 20 635 ▼17 ▲18
Dallas-Fort Worth 38 652 28 624 ▼10 ▲28
Frankfurt 39 651 26 627 ▼13 ▲24
Washington DC 40 650 27 626 ▼13 ▲24
Munich 41 648 29 623 ▼12 ▲25
Cayman Islands 42 647 42 585 0 ▲62
Austin 43 646 31 617 ▼12 ▲29
Johannesburg 44 645 32 611 ▼12 ▲34
Brussels 45 644 36 597 ▼9 ▲47
Melbourne 46 643 45 574 ▼1 ▲69
Isle of Man 47 642 38 591 ▼9 ▲51
Shenzhen 48 641 33 610 ▼15 ▲31
GIFT City-Gujarat 49 640 41 587 ▼8 ▲53
Cape Town 50 639 37 596 ▼13 ▲43
Budapest 51 637 New New New New
Mexico City 52 636 New New New New
Tianjin 53 629 New New New New
Guangzhou 54 623 35 598 ▼19 ▲25
Madrid 55 622 39 588 ▼16 ▲34
Warsaw 56 619 New New New New
Moscow 57 618 44 576 ▼13 ▲42
Rome 58 617 47 555 ▼11 ▲62
Milan 59 615 46 572 ▼13 ▲43
Manila 60 614 49 546 ▼11 ▲68
Osaka 61 613 New New New New
Busan 62 608 New New New New
Kuala Lumpur 63 604 48 554 ▼15 ▲50
Riyadh 64 598 New New New New
Istanbul 65 595 New New New New
Mumbai 66 470 51 443 ▼15 ▲27
New Delhi 67 462 50 455 ▼17 ▲7

Smart Centres Index 3
6
The Three SCI Dimensions We develop the SCI ratings and rankings by looking at three separate dimensions of technology and innovation development:
• Innovation Support - the approach taken to regulation and support for the innovation and technology industry provided by the commercial ecosystem.
• Creative Intensity - the extent to which technology and innovative industries are embedded in the economy of the centre.
• Delivery Capability - the quality of the work being undertaken in the field in the centre. We develop ratings for each dimension, which are ranked equally in creating the SCI. Full details of the separate ratings for each dimension are at Appendix 1. Table 2 shows the rating details for each dimension for the top 20 centres in SCI 3. Table 2 | Rating Details For SCI 3 Dimensions
SCI Dimensions SCI 3
Ranking Centre Innovation Support Creative Intensity Delivery Capability
Rank Rating Rank Rating Rank Rating
1 London 1 247 1 241 1 241
2 New York 2 244 3 236 4 237
3 Oxford, UK 3 242 10 230 3 237
4 Stockholm 9 237 4 235 5 232
5 Hong Kong 15 233 2 240 6 231
6 Cambridge, UK 5 239 21 223 2 241
7 Singapore 4 240 8 231 7 229
8 Dublin 5 239 9 230 7 229
9 Zurich 8 237 6 232 13 225
10 Geneva 5 239 11 229 24 221
11 Amsterdam 16 232 5 233 16 224
12 Los Angeles 12 235 26 222 10 227
13 Lugano 13 234 25 223 9 227
14 Chicago 18 231 14 226 14 225
15 Boston 19 231 19 225 11 225
16 Seattle 26 228 16 226 15 224
17 San Francisco 20 230 22 223 18 223
18 Tel Aviv 23 230 20 224 20 222
19 Glasgow 24 228 11 229 39 214
20 Dubai 17 231 13 227 42 212

Smart Centres Index 3
7
This analysis shows the effect that particular dimensions have on the placing of centres in the SCI. In particular:
• Leading centres have a spread of strengths across the dimensions, although Asia Pacific centres are given lower ratings for Innovation Support than for Creative Intensity and Delivery Capability.
• Oxford and Cambridge in the UK are stronger on innovation support and delivery capability-quality, but less strong on the intensity and amount of business transacted in the centre.
This balance of strengths is likely to be significant in the future, as we consider all three dimensions are important in creating long-term strengths in innovation and technology. The SCI 3 results showing the contribution of each dimension are shown in Chart 1.
SCI 3: Further Analysis Additional Centres We asked respondents to identify whether there were additional centres that they thought would become more significant as technology centres over the next two to three years. The centres mentioned were:
• Bangalore, Pune, and Suzhou in Asia/Pacific. • Kyiv and Bucharest in Eastern Europe. • Lagos, Accra, Cairo, Freetown, and Kigali in the Middle East & Africa. • Tampa-St Petersburg, Kansas City, Miami, Florida, Phoenix, and Philadelphia in the US. • Cardiff, Barcelona, Leeds, Sophia-Antipolis, Toulouse, Turin, Zug, and Reading in Western Europe.
We will take these views into account in future versions of the SCI survey.

Smart Centres Index 3
8
Chart 1 | SCI 3: Contribution Of The Dimensions To Overall Ratings

Smart Centres Index 3
9
Instrumental Factors SCI 3 is created using 127 instrumental factors which relate to a range of aspects of competitiveness, including measures relating to technology development. Table 3 shows the top 10 instrumental factors in terms of their correlation with the SCI ranking. This shows the impact of general measures of infrastructure, competitiveness, and trade on developing an innovation ecosystem. Table 3 | Top 10 Instrumental Factors By R Squared Correlation
Focusing only on the instrumental factors which relate to technology, the factors most closely correlated in terms of their R Squared relationship with the SCI ratings are set out in Table 4. Table 4 | Top 10 Technology Instrumental Factors By R Squared Correlation
Instrumental Factor R Squared
Telecommunication Infrastructure Index 0.475
Global Enabling Trade Report 0.456
ICT Development Index 0.431
E-Participation Index 0.411
Legatum Prosperity Index 0.407
Human Development Index 0.400
Best Countries for Business 0.399
Global Innovation Index 0.384
Global Competitiveness Index 0.377
Networked Readiness Index 0.377
Technology Factors R Squared
Telecommunication Infrastructure Index 0.475
ICT Development Index 0.431
E-Participation Index 0.411
Smart City Index 0.346
FinTech Index 0.201
Worldwide Broadband Speed League 0.200
Open Data Barometer 0.144
Use Of Blockchain In Healthcare 0.118
Global Cybersecurity Index 0.093
Use Of Blockchain In Land Registration 0.090

Smart Centres Index 3
10
Areas Of Competitiveness
The instrumental factors and data sets used in the SCI model are grouped into six broad areas: • Technology • Financial Services • Reputational • Business Environment • Human Capital • Infrastructure. These areas and the instrumental factor themes which comprise each area are shown in Chart 2.
Smart Centres Index 3
11
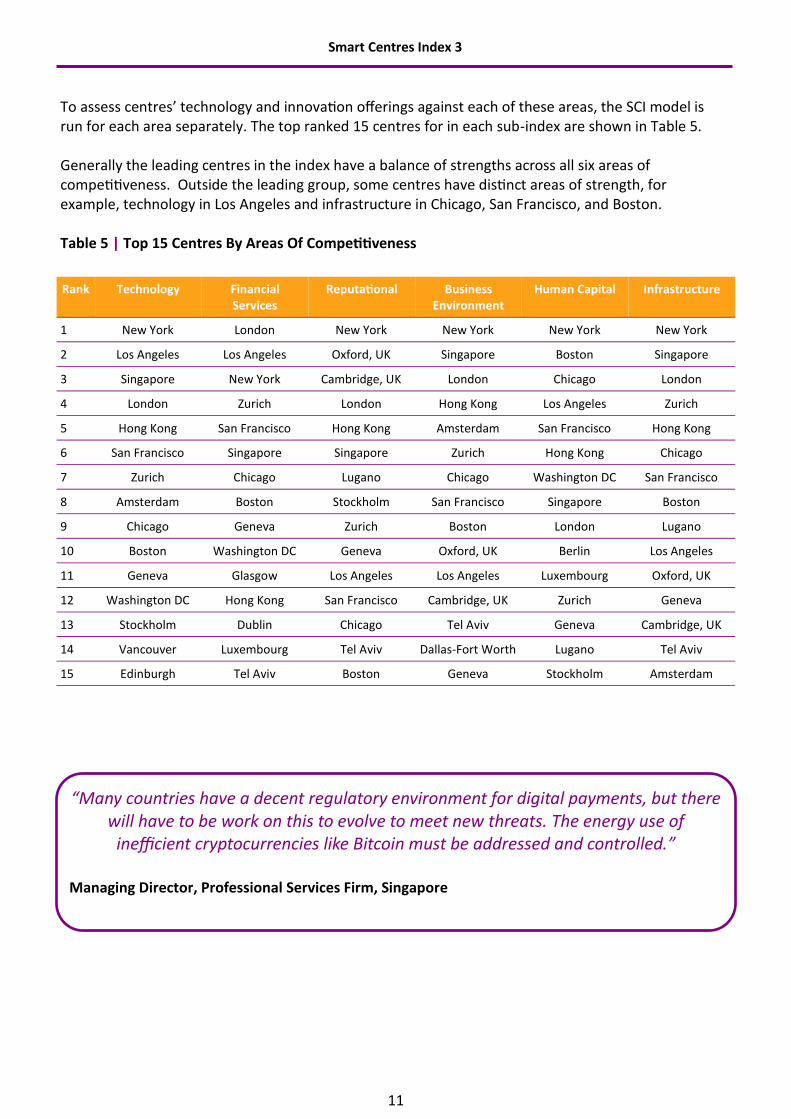
To assess centres’ technology and innovation offerings against each of these areas, the SCI model is run for each area separately. The top ranked 15 centres for in each sub-index are shown in Table 5. Generally the leading centres in the index have a balance of strengths across all six areas of competitiveness. Outside the leading group, some centres have distinct areas of strength, for example, technology in Los Angeles and infrastructure in Chicago, San Francisco, and Boston. Table 5 | Top 15 Centres By Areas Of Competitiveness
Rank Technology Financial Services
Reputational Business Environment
Human Capital Infrastructure
1 New York London New York New York New York New York
2 Los Angeles Los Angeles Oxford, UK Singapore Boston Singapore
3 Singapore New York Cambridge, UK London Chicago London
4 London Zurich London Hong Kong Los Angeles Zurich
5 Hong Kong San Francisco Hong Kong Amsterdam San Francisco Hong Kong
6 San Francisco Singapore Singapore Zurich Hong Kong Chicago
7 Zurich Chicago Lugano Chicago Washington DC San Francisco
8 Amsterdam Boston Stockholm San Francisco Singapore Boston
9 Chicago Geneva Zurich Boston London Lugano
10 Boston Washington DC Geneva Oxford, UK Berlin Los Angeles
11 Geneva Glasgow Los Angeles Los Angeles Luxembourg Oxford, UK
12 Washington DC Hong Kong San Francisco Cambridge, UK Zurich Geneva
13 Stockholm Dublin Chicago Tel Aviv Geneva Cambridge, UK
14 Vancouver Luxembourg Tel Aviv Dallas-Fort Worth Lugano Tel Aviv
15 Edinburgh Tel Aviv Boston Geneva Stockholm Amsterdam
“Many countries have a decent regulatory environment for digital payments, but there will have to be work on this to evolve to meet new threats. The energy use of
inefficient cryptocurrencies like Bitcoin must be addressed and controlled.” Managing Director, Professional Services Firm, Singapore

Smart Centres Index 3
12
Index Ranking For Technology As shown in Table 5, we have conducted an analysis of the assessments provided by respondents using only the instrumental factors that have a direct relationship to technology. We compare this analysis with the main index in Table 6. The plus and minus figures show the difference between the main index and the index calculated using only technology factors. Comparing the ranking using only technology factors with the overall SCI rankings makes minor differences for many centres. However, in the technology rankings, North American centres, including Los Angeles, San Francisco, Chicago, Boston, Washington DC, and Vancouver, gain a significant advantage. Table 6 | Top 15 Centres Using All Factors And Only Technology Factors
SCI 3
Rank All Factors Technology Factors
1 London New York (+1)
2 New York Los Angeles (+10)
3 Oxford, UK Singapore (+3)
4 Stockholm London (-3)
5 Hong Kong Hong Kong
6 Cambridge, UK San Francisco (+11)
7 Singapore Zurich (+2)
8 Dublin Amsterdam (+3)
9 Zurich Chicago (+5)
10 Geneva Boston (+5)
11 Amsterdam Geneva (-1)
12 Los Angeles Washington DC (+28)
13 Lugano Stockholm (-9)
14 Chicago Vancouver (+17)
15 Boston Edinburgh (+6)

Smart Centres Index 3
13
Commentary On Factors The SCI survey asks respondents to comment on factors that affect the development of technology and innovation in centres, and in particular regulation, taxation, and the availability of skills. The results are summarised in Table 7. Table 7 | Commentary On Areas Of Competitiveness
Area Of Competitiveness Number Of Mentions
Main Themes
Regulatory Environment 46 • Regulatory approaches need to be accommodating of new industries.
• Data protection will continue to be a key theme. • Regulation may need to look at factors such as the
energy consumption of business and of digital currencies.
• Regulators need a better understanding of technology.
Taxation 38 • Fairness and stability in tax regimes seen as important in driving technology investment.
• Some felt that US and European tax regimes less enlightened than in Asia in terms of encouraging innovation.
The Availability Of Skills 45 • This factor is felt to be the reason that developing-emerging markets are not able to compete with the Western leaders.
• Others noted that the UK and US need to continue importing skills as their STEM skills development continues to languish.
• Places which are strong in innovation may not be the best centres to build a business, eg the ‘Golden Triangle’ of Oxford, Cambridge and London in the UK, where housing and other costs are high.
We asked respondents to identify current interesting and successful initiatives in the fields of technology and innovation. These included: • The ‘Young Company Finance’ publication in Scotland, tracking and reporting on early stage high
growth companies. • The digitalisation of knowledge as a working and measurable asset (shift from intangibles to
tangibles). The potential of blockchain to replace traditional CSD and CCP processing in capital markets.
• The growth of Central Bank Digital Currencies, including the Bahamas Sand Dollar, and ensuring good regulation and anti-money laundering frameworks.
• Cryptocurrency and cryptoasset legislation in Switzerland, and to a lesser extent in Germany. • The application of digital instant payments in many countries, with cross-border instant payment
becoming more important, including use of cryptocurrencies with no central third party. • AI-based applications in Canada and in Toronto in particular. • Use of blockchain for voting security.

Smart Centres Index 3
14
The SCI 3 World - Centres In The Index
9
15 14
12
17
2
10
6
31
19
58
40
4
43 38
27
11
25
21
59
41
55
39 45
1 3
42
36 24
8 47
See Detailed Map Below
13
16
22
28
29
35
51
52
56

Smart Centres Index 3
15
The numbers indicate the rank of each centre in SCI 3.
An interactive map showing the data for each centre is at https://
www.longfinance.net/programmes/financial-centre-futures/smart-
centres-index/sci-3-explore-data/sci-3-map/
37
5
7
63
30
34
23
67
66
54
48
60
33
44
50
57
18
49
46
26 20
53
61 62
32 65
64

Smart Centres Index 3
16
Regional Analysis In our analysis of the SCI data, we look at six regions of the world to explore centres’ strengths in technology and finance. Alongside the ranks and ratings of centres, we investigate the average assessments received by regions and centres in more detail. We display this analysis in charts, which show: • The mean assessment provided to that centre. • The difference in the mean assessment when home region assessments are removed from the
analysis. • The difference between the mean and the assessments provided by respondents based in other
regional centres. • The proportion of assessments provided by each region.
Chart 3 shows an example of this analysis. Coloured bars to the left of the vertical axis indicate that respondents from that region gave lower than average assessments. Bars to the right indicate respondents from that region gave higher than average assessments. Assessments given to a centre by people based in that centre are excluded to remove ‘home’ bias. The additional vertical axis (in red) shows the mean of assessments when assessments from the home region are removed. The percentage figure noted by each region indicates the percentage of the total number of assessments that are from that region. Chart 3 | Example: Assessments Compared With The Mean For A Centre

Smart Centres Index 3
17
North America • Innovation Support scores higher than the other dimensions among US centres. • Seattle joins the index for the first time. Table 8 | North American Centres In SCI 3: Ranks And Ratings
Centre
SCI 3 SCI 2 Change In Change In
Rank Rating Rank Rating Rank Rating
New York 2 716 1 701 ▼1 ▲15
Los Angeles 12 684 9 670 ▼3 ▲14
Chicago 14 682 7 673 ▼7 ▲9
Boston 15 681 14 645 ▼1 ▲36
Seattle 16 678 New New New New
San Francisco 17 676 13 649 ▼4 ▲27
Toronto 25 665 25 628 0 ▲37
Vancouver 31 659 34 608 ▲3 ▲51
Dallas-Fort Worth 38 652 28 624 ▼10 ▲28
Washington DC 40 650 27 626 ▼13 ▲24
Austin 43 646 31 617 ▼12 ▲29
Table 9 | North American Centres In SCI 3: SCI Dimensions
SCI 3 Dimensions
Centre Innovation Support Creative Intensity Delivery Capability
Rank Rating Rank Rating Rank Rating
New York 2 244 3 236 4 237
Los Angeles 12 235 26 222 10 227
Chicago 18 231 14 226 14 225
Boston 19 231 19 225 11 225
Seattle 26 228 16 226 15 224
San Francisco 20 230 22 223 18 223
Toronto 31 225 33 219 27 220
Vancouver 30 225 34 219 36 215
Dallas-Fort Worth 45 219 23 223 48 210
Washington DC 36 222 42 212 34 216
Austin 48 216 29 220 51 209

Smart Centres Index 3
18
Chart 4 | New York Average Assessments – Difference From The Mean
Chart 5 | Los Angeles Average Assessments – Difference From The Mean
“The availability of skills is what causes developing-emerging markets to be unable to compete with the Western heavyweights.”
Principal Consultant, Equity Capital Markets, Dubai

Smart Centres Index 3
19
Asia/Pacific • Hong Kong and Singapore retain their place in the top 10 centres, but centres in mainland China did
not perform as well in SCI 3. • The majority of Asia/Pacific centres scored lower for Innovation Support, including regulation, than
their overall ranking in the SCI. Table 10 | Top 15 Asia/Pacific Centres In SCI 3: Ranks And Ratings
Centre
SCI 3 SCI 2 Change In Change In
Rank Rating Rank Rating Rank Rating
Hong Kong 5 704 4 681 ▼1 ▲23
Singapore 7 701 3 689 ▼4 ▲12
Beijing 23 667 15 643 ▼8 ▲24
Shanghai 30 660 22 633 ▼8 ▲27
Seoul 32 658 New New New New
Bangkok 33 657 43 578 ▲10 ▲79
Sydney 34 656 39 588 ▲5 ▲68
Tokyo 37 653 20 635 ▼17 ▲18
Melbourne 46 643 45 574 ▼1 ▲69
Shenzhen 48 641 33 610 ▼15 ▲31
GIFT City-Gujarat 49 640 41 587 ▼8 ▲53
Tianjin 53 629 New New New New
Guangzhou 54 623 35 598 ▼19 ▲25
Manila 60 614 49 546 ▼11 ▲68
Osaka 61 613 New New New New
SCI 3 Dimensions
Centre Innovation Support Creative Intensity Delivery Capability
Rank Rating Rank Rating Rank Rating
Hong Kong 15 233 2 240 6 231
Singapore 4 240 8 231 7 229
Beijing 43 220 15 226 23 222
Shanghai 50 216 17 225 30 219
Seoul 40 220 32 219 29 219
Bangkok 42 220 18 225 43 212
Sydney 51 216 36 218 19 222
Tokyo 47 217 28 221 37 215
Melbourne 54 212 40 215 33 216
Shenzhen 60 208 39 216 32 217
GIFT City-Gujarat 53 214 44 212 40 213
Tianjin 55 211 45 211 55 207
Guangzhou 61 208 51 205 49 210
Manila 46 217 59 200 62 197
Osaka 64 206 58 200 56 207
Table 11 | Top 15 Asia/Pacific Centres In SCI 3: SCI Dimensions

Smart Centres Index 3
20
Chart 6 | Hong Kong Average Assessments – Difference From The Mean
Chart 7 | Singapore Average Assessments – Difference From The Mean
“A fair, predictable, and transparent taxation system is required to encourage technology development.”
Director, Banking, Toronto

Smart Centres Index 3
21
Western Europe • Seven Western European centres feature in the world top 10, with London taking the top position. • The majority of Western European centres score higher for innovation support, including regulation,
than their overall rank. This suggests that systems of public support for, and regulation of innovation and technology are comparatively strong.
Table 12 | Top 15 Western European Centres In SCI 3: Ranks And Ratings
Centre SCI 3 SCI 2 Change In Change In
Rank Rating Rank Rating Rank Rating
London 1 729 2 694 ▲1 ▲35
Oxford, UK 3 709 5 677 ▲2 ▲32
Stockholm 4 705 12 650 ▲8 ▲55
Cambridge, UK 6 703 6 676 0 ▲27
Dublin 8 699 18 639 ▲10 ▲60
Zurich 9 694 8 671 ▼1 ▲23
Geneva 10 689 10 666 0 ▲23
Amsterdam 11 688 16 642 ▲5 ▲46
Lugano 13 683 New New New New
Glasgow 19 671 23 632 ▲4 ▲39
Edinburgh 21 669 21 634 0 ▲35
Malta 22 668 New New New New
Paris 24 666 19 636 ▼5 ▲30
Luxembourg 27 663 30 619 ▲3 ▲44
Berlin 29 661 New New New New
Table 13 | Top 15 Western European Centres In SCI 3: SCI Dimensions
Centre Innovation Support Creative Intensity Delivery Capability
Rank Rating Rank Rating Rank Rating
London 1 247 1 241 1 241
Oxford, UK 3 242 10 230 3 237
Stockholm 9 237 4 235 5 232
Cambridge, UK 5 239 21 223 2 241
Dublin 5 239 9 230 7 229
Zurich 8 237 6 232 13 225
Geneva 5 239 11 229 24 221
Amsterdam 16 232 5 233 16 224
Lugano 13 234 25 223 9 227
Glasgow 24 228 11 229 39 214
Edinburgh 10 237 27 222 50 210
Malta 21 230 41 213 12 225
Paris 25 228 38 217 22 222
Luxembourg 11 236 35 219 53 208
Berlin 14 233 54 205 17 223

Smart Centres Index 3
22
Chart 8 | London Average Assessments – Difference From The Mean
Note: All the assessments for Oxford, UK came from respondents in Western Europe, and the equivalent chart is not available.
Chart 9 | Stockholm Average Assessments – Difference From The Mean

Smart Centres Index 3
23
Middle East & Africa • The leading regional centres of Tel Aviv and Dubai are closely matched, with only 9 rating points
between them. Tel Aviv has a balance of scores across the three SCI dimensions, while Dubai is stronger in creative intensity, but less so in Delivery Capability.
• Abu Dhabi and Riyadh entered the SCI for the first time. Table 14 | Middle Eastern & African Centres In SCI 3: Ranks And Ratings
Centre SCI 3 SCI 2 Change In Change In
Rank Rating Rank Rating Rank Rating
Tel Aviv 18 675 11 651 ▼7 ▲24
Dubai 20 670 17 640 ▼3 ▲30
Abu Dhabi 26 664 New New New New
Johannesburg 44 645 32 611 ▼12 ▲34
Cape Town 50 639 37 596 ▼13 ▲43
Riyadh 64 598 New New New New
Table 15 | Middle Eastern & African Centres In SCI 3: SCI Dimensions
Centre Innovation Support Creative Intensity Delivery Capability
Rank Rating Rank Rating Rank Rating
Tel Aviv 23 230 20 224 20 222
Dubai 17 231 13 227 42 212
Abu Dhabi 22 230 30 220 38 214
Johannesburg 27 226 50 207 45 212
Cape Town 38 221 57 200 31 218
Riyadh 52 215 63 194 65 189
Chart 10 | Tel Aviv Average Assessments – Difference From The Mean

Smart Centres Index 3
24
Chart 11 | Dubai Average Assessments – Difference From The Mean
Eastern Europe & Central Asia • Four new entrants to the SCI joined Moscow in this region, with Sofia leading the region in 28th
position overall. Table 16 | Eastern European & Central Asian Centres In SCI 3: Ranks And Ratings
Centre SCI 3 SCI 2 Change In Change In
Rank Rating Rank Rating Rank Rating
Sofia 28 662 New New New New
Budapest 51 637 New New New New
Warsaw 56 619 New New New New
Moscow 57 618 44 576 ▼13 ▲42
Istanbul 65 595 New New New New
Table 17 | Eastern European & Central Asian Centres In SCI 3: SCI Dimensions
Centre Innovation Support Creative Intensity Delivery Capability
Rank Rating Rank Rating Rank Rating
Sofia 37 222 31 219 21 222
Budapest 58 209 48 208 28 219
Warsaw 44 219 55 204 63 197
Moscow 65 198 49 207 44 212
Istanbul 61 208 65 188 60 200
“Robust but frictionless regulation with minimum 'red tape' for the set-up and operation of innovative entities. Favourable licensing regime for innovative services.”
Director, Professional Services Firm, London

Smart Centres Index 3
25
Chart 12 | Sofia Average Assessments – Difference From The Mean
Chart 13 | Budapest Average Assessments – Difference From The Mean

Smart Centres Index 3
26
Latin America & The Caribbean • Mexico City joined the Cayman Islands in the SCI from the Latin America & Caribbean region. Table 18 | Latin America & The Caribbean Centres In SCI 3: Ranks And Ratings
Centre SCI 3 SCI 2 Change In Change In
Rank Rating Rank Rating Rank Rating
Cayman Islands 42 647 42 585 0 ▲62
Mexico City 52 636 New New New New
Table 19 | Latin America & The Caribbean Centres In SCI 3: SCI Dimensions
Centre Innovation Support Creative Intensity Delivery Capability
Rank Rating Rank Rating Rank Rating
Cayman Islands 29 226 47 209 41 213
Mexico City 41 220 51 205 47 211
Chart 14 | Cayman Islands Average Assessments – Difference From The Mean
Chart 15 | Mexico City Average Assessments – Difference From The Mean
Smart Centres Index 3
27
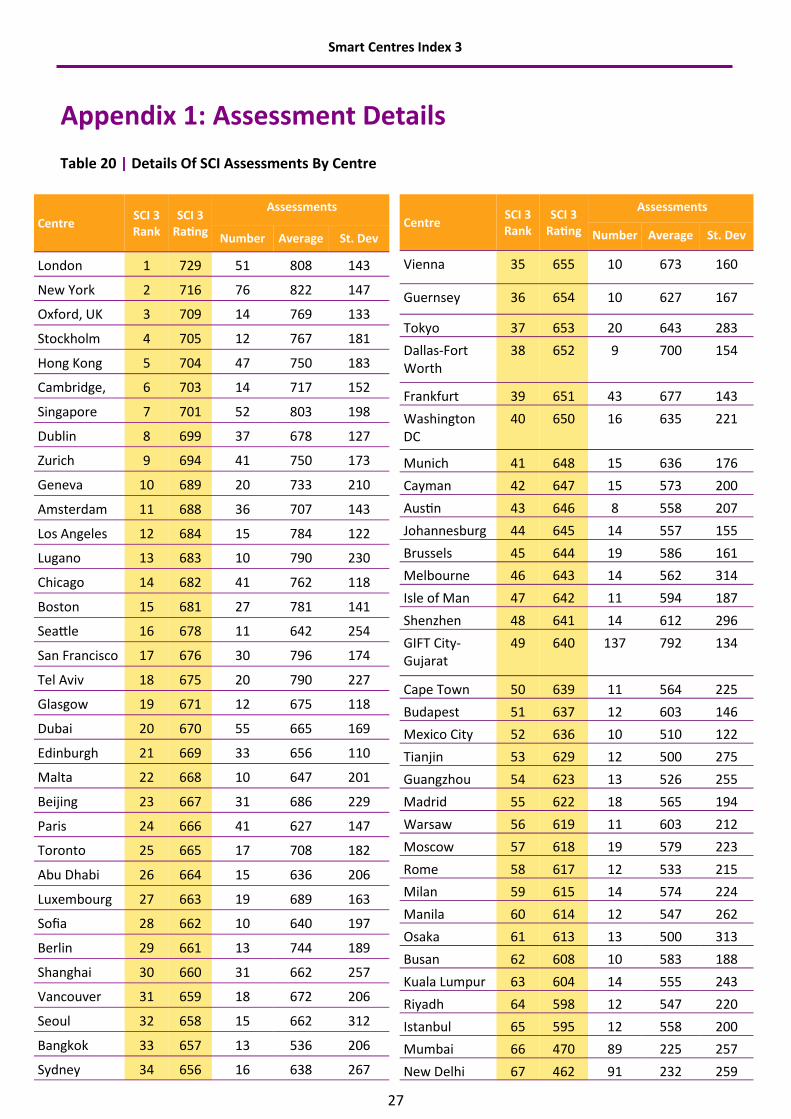
Appendix 1: Assessment Details
Table 20 | Details Of SCI Assessments By Centre
Centre SCI 3 Rank
SCI 3 Rating
Assessments
Number Average St. Dev
London 1 729 51 808 143
New York 2 716 76 822 147
Oxford, UK 3 709 14 769 133
Stockholm 4 705 12 767 181
Hong Kong 5 704 47 750 183
Cambridge, 6 703 14 717 152
Singapore 7 701 52 803 198
Dublin 8 699 37 678 127
Zurich 9 694 41 750 173
Geneva 10 689 20 733 210
Amsterdam 11 688 36 707 143
Los Angeles 12 684 15 784 122
Lugano 13 683 10 790 230
Chicago 14 682 41 762 118
Boston 15 681 27 781 141
Seattle 16 678 11 642 254
San Francisco 17 676 30 796 174
Tel Aviv 18 675 20 790 227
Glasgow 19 671 12 675 118
Dubai 20 670 55 665 169
Edinburgh 21 669 33 656 110
Malta 22 668 10 647 201
Beijing 23 667 31 686 229
Paris 24 666 41 627 147
Toronto 25 665 17 708 182
Abu Dhabi 26 664 15 636 206
Luxembourg 27 663 19 689 163
Sofia 28 662 10 640 197
Berlin 29 661 13 744 189
Shanghai 30 660 31 662 257
Vancouver 31 659 18 672 206
Seoul 32 658 15 662 312
Bangkok 33 657 13 536 206
Sydney 34 656 16 638 267
Centre SCI 3 Rank
SCI 3 Rating
Assessments
Number Average St. Dev
Vienna 35 655 10 673 160
Guernsey 36 654 10 627 167
Tokyo 37 653 20 643 283
Dallas-Fort Worth
38 652 9 700 154
Frankfurt 39 651 43 677 143
Washington DC
40 650 16 635 221
Munich 41 648 15 636 176
Cayman 42 647 15 573 200
Austin 43 646 8 558 207
Johannesburg 44 645 14 557 155
Brussels 45 644 19 586 161
Melbourne 46 643 14 562 314
Isle of Man 47 642 11 594 187
Shenzhen 48 641 14 612 296
GIFT City-Gujarat
49 640 137 792 134
Cape Town 50 639 11 564 225
Budapest 51 637 12 603 146
Mexico City 52 636 10 510 122
Tianjin 53 629 12 500 275
Guangzhou 54 623 13 526 255
Madrid 55 622 18 565 194
Warsaw 56 619 11 603 212
Moscow 57 618 19 579 223
Rome 58 617 12 533 215
Milan 59 615 14 574 224
Manila 60 614 12 547 262
Osaka 61 613 13 500 313
Busan 62 608 10 583 188
Kuala Lumpur 63 604 14 555 243
Riyadh 64 598 12 547 220
Istanbul 65 595 12 558 200
Mumbai 66 470 89 225 257
New Delhi 67 462 91 232 259
Smart Centres Index 3
28
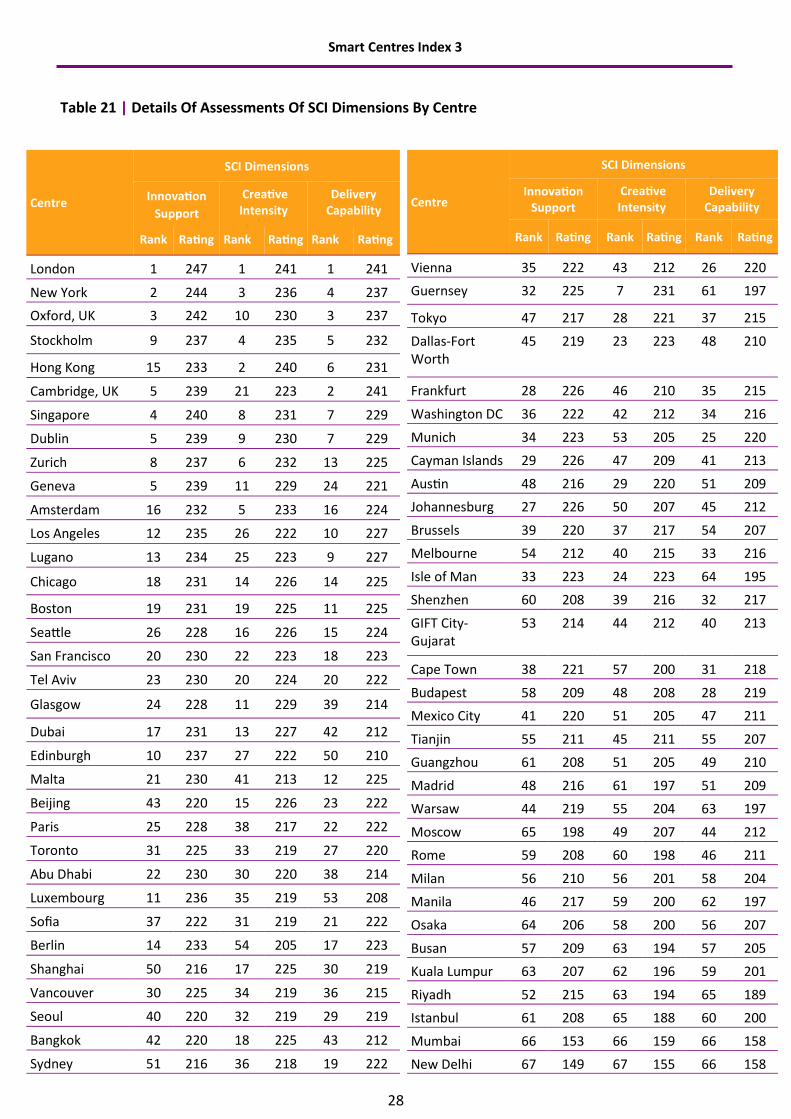
Table 21 | Details Of Assessments Of SCI Dimensions By Centre
Centre
SCI Dimensions
Innovation
Support
Creative Intensity
Delivery Capability
Rank Rating Rank Rating Rank Rating
London 1 247 1 241 1 241
New York 2 244 3 236 4 237
Oxford, UK 3 242 10 230 3 237
Stockholm 9 237 4 235 5 232
Hong Kong 15 233 2 240 6 231
Cambridge, UK 5 239 21 223 2 241
Singapore 4 240 8 231 7 229
Dublin 5 239 9 230 7 229
Zurich 8 237 6 232 13 225
Geneva 5 239 11 229 24 221
Amsterdam 16 232 5 233 16 224
Los Angeles 12 235 26 222 10 227
Lugano 13 234 25 223 9 227
Chicago 18 231 14 226 14 225
Boston 19 231 19 225 11 225
Seattle 26 228 16 226 15 224
San Francisco 20 230 22 223 18 223
Tel Aviv 23 230 20 224 20 222
Glasgow 24 228 11 229 39 214
Dubai 17 231 13 227 42 212
Edinburgh 10 237 27 222 50 210
Malta 21 230 41 213 12 225
Beijing 43 220 15 226 23 222
Paris 25 228 38 217 22 222
Toronto 31 225 33 219 27 220
Abu Dhabi 22 230 30 220 38 214
Luxembourg 11 236 35 219 53 208
Sofia 37 222 31 219 21 222
Berlin 14 233 54 205 17 223
Shanghai 50 216 17 225 30 219
Vancouver 30 225 34 219 36 215
Seoul 40 220 32 219 29 219
Bangkok 42 220 18 225 43 212
Sydney 51 216 36 218 19 222
Centre
SCI Dimensions
Innovation Support
Creative Intensity
Delivery Capability
Rank Rating Rank Rating Rank Rating
Vienna 35 222 43 212 26 220
Guernsey 32 225 7 231 61 197
Tokyo 47 217 28 221 37 215
Dallas-Fort Worth
45 219 23 223 48 210
Frankfurt 28 226 46 210 35 215
Washington DC 36 222 42 212 34 216
Munich 34 223 53 205 25 220
Cayman Islands 29 226 47 209 41 213
Austin 48 216 29 220 51 209
Johannesburg 27 226 50 207 45 212
Brussels 39 220 37 217 54 207
Melbourne 54 212 40 215 33 216
Isle of Man 33 223 24 223 64 195
Shenzhen 60 208 39 216 32 217
GIFT City-Gujarat
53 214 44 212 40 213
Cape Town 38 221 57 200 31 218
Budapest 58 209 48 208 28 219
Mexico City 41 220 51 205 47 211
Tianjin 55 211 45 211 55 207
Guangzhou 61 208 51 205 49 210
Madrid 48 216 61 197 51 209
Warsaw 44 219 55 204 63 197
Moscow 65 198 49 207 44 212
Rome 59 208 60 198 46 211
Milan 56 210 56 201 58 204
Manila 46 217 59 200 62 197
Osaka 64 206 58 200 56 207
Busan 57 209 63 194 57 205
Kuala Lumpur 63 207 62 196 59 201
Riyadh 52 215 63 194 65 189
Istanbul 61 208 65 188 60 200
Mumbai 66 153 66 159 66 158
New Delhi 67 149 67 155 66 158

Smart Centres Index 3
29
Appendix 2: Respondents’ Details
Industry Sector Number Of
Respondents
Percentage Of
Respondents
Banking 11 4%
Debt Capital Markets 7 3%
Equity Capital
Markets 4 1%
Insurance 19 7%
Investment
Management 26 9%
Knowledge 24 9%
Policy and Public
Finance 19 7%
Professional Services 55 20%
Technology 87 31%
Trading 23 8%
Not Specified 5 2%
Total 280 100%
Region Number Of
Respondents
Percentage Of
Respondents
Western Europe 128 46%
Asia/Pacific 56 20%
North America 27 10%
Middle East & Africa 18 6%
Eastern Europe &
Central Asia 27 10%
Latin America & the
Caribbean 23 8%
Multi-Regional 1 0%
Total 280 100%
Table 22 | Respondents By Industry Sector
Table 23 | Respondents By Region
Table 24 | Respondents By Size Of Organisation
Size Of Organisation Number Of
Respondents
Percentage Of
Respondents
Fewer than 50 166 59%
50 to 100 35 13%
100 to 500 19 7%
500 to 1,000 12 4%
1,000 to 2,000 9 3%
2,000 to 5,000 8 3%
More than 5,000 31 11%
Not Specified 0 0%
Total 280 100%

Smart Centres Index 3
30
Appendix 3: Methodology The SCI provides ratings for the innovation and technology offering of commercial and financial centres. The process involves taking two sets of ratings – one from survey respondents and one generated by a statistical model – and combining them into a single ranking. For the first set of ratings, the centre assessments, respondents use an online questionnaire to rate three dimensions:
• Innovation Support - the approach taken to regulation and support for the innovation and technology industry provided by the commercial ecosystem.
• Creative Intensity - the extent to which technology and innovative industries are embedded in the economy of the centre.
• Delivery Capability - the quality of the work being undertaken in the field in the centre. Ratings are given using a 10 point scale ranging from very poor to excellent. Responses are sought from a range of individuals drawn from the financial services and technology sectors, non-governmental organisations, regulators, universities, and trade bodies. For the second set of ratings, a support vector engine uses a database of indicators, or Instrumental Factors, that contains quantitative data about each centre, to predict how each respondent would have rated the financial centres they do not know. These instrumental factors draw on data from 127 different sources covering technology, financial services, reputation, business environment, human capital, and infrastructure. A full list of the instrumental factors used in the model is in Appendix 5. The respondents’ actual ratings as well as their predicted ratings for the centres they did not rate, are then combined into a single table to produce ratings for each dimension. These are then added together, using equal weighting, to create the SCI ranking. Factors Affecting The Inclusion Of Centres In The SCI The questionnaire lists a total of 131 commercial and financial centres which can be rated by respondents. The questionnaire asks whether there are financial centres not currently in the survey that will become significant over the next two to three years. Centres which are not currently within the questionnaire and which are mentioned repeatedly in response to this question will be added to the questionnaire for future editions. We give a financial centre a SCI rating and ranking if it receives a statistically significant minimum number of assessments from individuals based in other geographical locations - at least 10 in SCI 3. This means that not all 131 centres in the questionnaire receive a ranking. We will keep this number under review for further editions of the index as the number of assessments increases. We will also develop rules as successive indices are published as to when a centre may be removed from the rankings, for example, if over a 24 month period, a centre has not received a minimum number of assessments.
Smart Centres Index 3
31
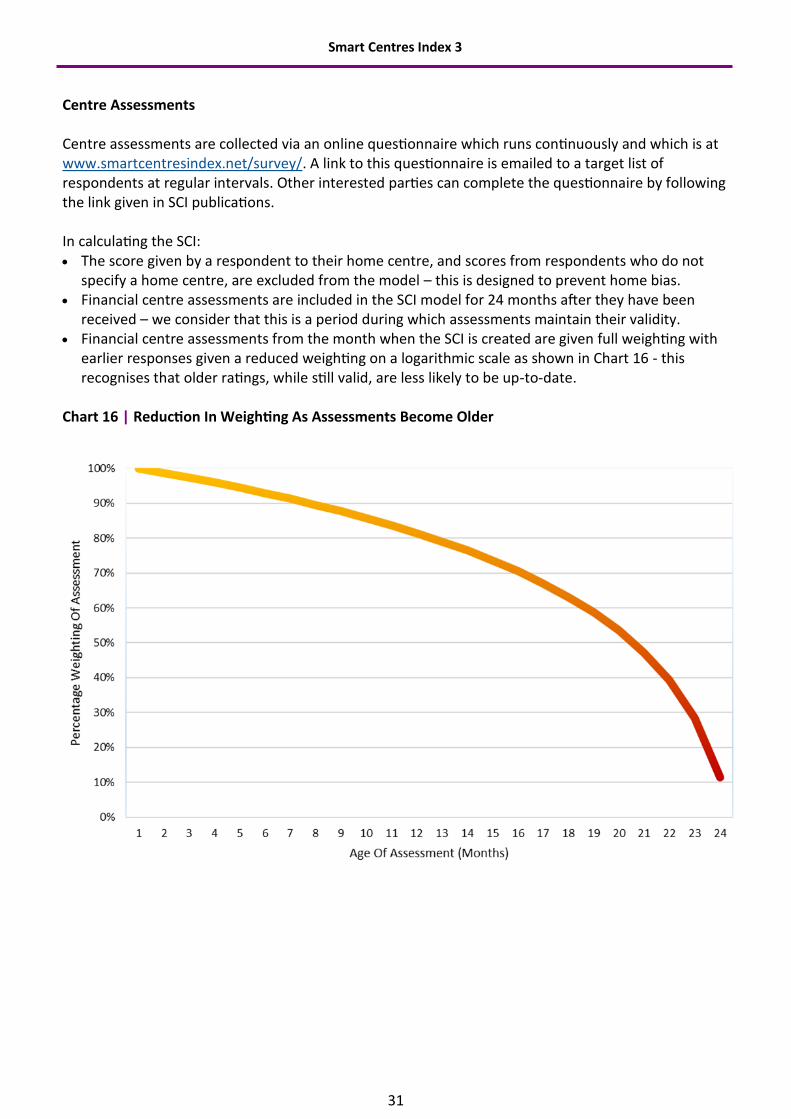
Centre Assessments Centre assessments are collected via an online questionnaire which runs continuously and which is at www.smartcentresindex.net/survey/. A link to this questionnaire is emailed to a target list of respondents at regular intervals. Other interested parties can complete the questionnaire by following the link given in SCI publications. In calculating the SCI: • The score given by a respondent to their home centre, and scores from respondents who do not
specify a home centre, are excluded from the model – this is designed to prevent home bias. • Financial centre assessments are included in the SCI model for 24 months after they have been
received – we consider that this is a period during which assessments maintain their validity. • Financial centre assessments from the month when the SCI is created are given full weighting with
earlier responses given a reduced weighting on a logarithmic scale as shown in Chart 16 - this recognises that older ratings, while still valid, are less likely to be up-to-date.
Chart 16 | Reduction In Weighting As Assessments Become Older

Smart Centres Index 3
32
Instrumental Factor Data For the instrumental factors, we have the following data requirements: • Data series should come from a reputable body and be derived by a sound methodology. • Data series should be readily available (ideally in the public domain) and be regularly updated. The rules on the use of instrumental factor data in the model are as follows: • Updates to the indices are collected and collated every six months. • No weightings are applied to indices. • Indices are entered into the SCI model as directly as possible, whether this is a rank, a derived score,
a value, a distribution around a mean or a distribution around a benchmark. • If a factor is at a national level, the score will be used for all centres in that country; nation-based
factors will be avoided if financial centre (city)-based factors are available. • If an index has multiple values for a city or nation, the most relevant value is used. • If an index is at a regional level, the most relevant allocation of scores to each centre is made (and
the method for judging relevance is noted). • If an index does not contain a value for a particular financial centre, a blank is entered against that
centre (no average or mean is used). Factor Assessment Neither the financial centre assessments nor the instrumental factors on their own can provide a basis for the construction of the SCI. The centre assessments rate centres on their technology and innovation performance, but each individual completing the questionnaire will: • Be familiar with only a limited number of centres - probably no more than 10 or 15 centres. • Rate a different group of centres making it difficult to compare data sets. • Consider different aspects of centres’ performance in their ratings. The process of creating the SCI is outlined in Chart 17. Chart 17 | The SCI Process

Smart Centres Index 3
33
Appendix 4: Instrumental Factors Table 25 | Instrumental Factor Correlation With SCI Ratings - Highest 30 Factors
Instrumental Factors R-squared
Telecommunication Infrastructure Index 0.475
Global Enabling Trade Report 0.456
ICT Development Index 0.431
E-Participation Index 0.411
Legatum Prosperity Index 0.407
Human Development Index 0.400
Best Countries For Business 0.399
Global Innovation Index 0.384
Global Competitiveness Index 0.377
Networked Readiness Index 0.377
Government Effectiveness 0.376
Global Power City Index 0.371
World Energy Trilemma Index 0.365
World Talent Rankings 0.362
Environmental Performance Index 0.358
Sustainable Economic Development 0.355
Business Environment Rankings 0.354
Regulatory Quality 0.352
Smart City Index 0.346
Global Connectedness Index 0.343
World Competitiveness Scoreboard 0.335
Operational Risk Rating 0.326
Corruption Perception Index 0.321
Control of Corruption 0.321
Rule Of Law 0.311
Global Sustainable Competitiveness Index 0.306
Economic Freedom Of The World 0.296
International IP Index 0.294
Regulatory Enforcement 0.285
Henley Passport Index 0.279

Smart Centres Index 3
34
Instrumental Factor Source Website Updated
Since SCI 2 Y/N
E-Participation Index United Nations https://publicadministration.un.org/egovkb/Data-Center N
UN International Sale Of Goods United Nations https://treaties.un.org/pages/ViewDetails.aspx?src=TREATY&mtdsg_no=X-10&chapter=10 N
ISO TC307 Participation International Organisation For Standardisation
https://www.iso.org/committee/6266604.html N
Internet Censorship Rank comparitech https://www.comparitech.com/blog/vpn-privacy/internet-censorship-map/ N
Volume Of Bitcoin Trades Coin Dance https://coin.dance/volume/localbitcoins Y
Legal Status Of Bitcoin Coin Dance https://coin.dance/poli/legality Y
Use Of Blockchain In Land Registration Airtable Blockchain in Government Tracker
https://airtable.com/universe/expsQEGKoZO2lExKK/blockchain-in-government-tracker?explore=true Y
Use Of Blockchain In Identity Management Airtable Blockchain in Government Tracker
https://airtable.com/universe/expsQEGKoZO2lExKK/blockchain-in-government-tracker?explore=true Y
Use Of Blockchain For Trade Finance Airtable Blockchain in Government Tracker
https://airtable.com/universe/expsQEGKoZO2lExKK/blockchain-in-government-tracker?explore=true Y
Use Of Blockchain In Healthcare Airtable Blockchain in Government Tracker
https://airtable.com/universe/expsQEGKoZO2lExKK/blockchain-in-government-tracker?explore=true Y
Use Of Blockchain In Voting Airtable Blockchain in Government Tracker
https://airtable.com/universe/expsQEGKoZO2lExKK/blockchain-in-government-tracker?explore=true N
Global AI Index Tortoise Intelligence https://www.tortoisemedia.com/intelligence/ai N
FinTech Index Z/Yen https://www.longfinance.net/programmes/financial-centre-futures/global-financial-centres-index/ Y
The Global Fintech Index Findexable https://findexable.com/ N
Global Cybersecurity Index ITU http://www.itu.int/en/ITU-D/Cybersecurity/Pages/GCI.aspx N
ICT Development Index United Nations http://www.itu.int/net4/ITU-D/idi/2017/index.html N
Telecommunication Infrastructure Index United Nations https://publicadministration.un.org/egovkb/en-us/Data-Center N
Open Data Barometer World Wide Web Foundation https://opendatabarometer.org/4thedition/?_year=2016&indicator=ODB N
Worldwide Broadband Speed League Cable https://www.cable.co.uk/broadband/speed/worldwide-speed-league/ Y
Smart City Index IMD https://www.imd.org/smart-city-observatory/smart-city-index/ New
Table 26 | Technology Factors

Smart Centres Index 3
35
Instrumental Factor Source Website Updated
Since SCI 2 Y/N
Capitalisation Of Stock Exchanges The World Federation of Stock Exchanges
https://focus.world-exchanges.org/issue/december-2020/market-statistics Y
Value Of Share Trading The World Federation of Stock Exchanges
https://focus.world-exchanges.org/issue/december-2020/market-statistics Y
Volume Of Share Trading The World Federation of Stock Exchanges
https://statistics.world-exchanges.org/ReportGenerator/Generator# Y
Broad Stock Index Levels The World Federation of Stock Exchanges
https://focus.world-exchanges.org/issue/december-2020/market-statistics Y
Value Of Bond Trading The World Federation of Stock Exchanges
https://statistics.world-exchanges.org/ReportGenerator/Generator# Y
Domestic Credit Provided By Banking Sector (% Of GDP)
The World Bank http://databank.worldbank.org/data/reports.aspx?source=world-development-indicators&series=FS.AST.DOMS.GD.ZS
Y
Percentage Of Firms Using Banks To Finance Investment
The World Bank http://databank.worldbank.org/data/reports.aspx?source=world-development-indicators&series=IC.FRM.BNKS.ZS
Y
Total Net Assets Of Regulated Open-End Funds
Investment Company Institute http://www.icifactbook.org/ N
Islamic Finance Country Index Islamic Banks and Financial Institutions
http://www.gifr.net/publications N
Net External Positions of Banks The Bank for International Settlements
http://www.bis.org/statistics/annex_map.htm Y
External Positions Of Central Banks As A Share Of GDP
The Bank for International Settlements
http://www.bis.org/statistics/annex_map.htm Y
Liner Shipping Connectivity Index The World Bank http://databank.worldbank.org/data/reports.aspx?source=2&series=IS.SHP.GCNW.XQ N
Global Connectedness Index DHL https://www.dhl.com/global-en/spotlight/globalization/global-connectedness-index.html Y
Economic Performance Index The Brookings Institution https://www.brookings.edu/research/global-metro-monitor-2018/#rank N
Financial System Green Alignment Corporate Knights https://www.finance-watch.org/publication/global-green-finance-index-3/ N
Protected Land Area % Of Land Area The World Bank http://databank.worldbank.org/data/reports.aspx?source=2&series=ER.LND.PTLD.ZS&country= N
Climate-Aligned Bonds Outstanding By Country Of Issuer
CBI https://www.finance-watch.org/publication/global-green-finance-index-3/ N
Sustainable Stock Exchanges (Y/N) UN Sustainable Stock Exchange Initiative
https://sseinitiative.org/members/ Y
Green Bond Segments On Stock Exchanges (Y/N)
CBI https://www.climatebonds.net/green-bond-segments-stock-exchanges N
The Global Green Finance Index (Depth) Z/Yen https://www.longfinance.net/programmes/financial-centre-futures/global-green-finance-index/ Y
The Global Green Finance Index (Quality) Z/Yen https://www.longfinance.net/programmes/financial-centre-futures/global-green-finance-index/ Y
The Global Financial Centres Index Z/Yen https://www.longfinance.net/programmes/financial-centre-futures/global-financial-centres-index/ Y
Table 27 | Financial Sector Development Factors

Smart Centres Index 3
36
Table 28 | Reputational Factors
Instrumental Factor Source Website Updated
Since SCI 2 Y/N
World Competitiveness Scoreboard IMD https://www.imd.org/wcc/world-competitiveness-center-rankings/world-competitiveness-ranking-2020/ N
Global Competitiveness Index World Economic Forum http://reports.weforum.org/global-competitiveness-report-2019/competitiveness-rankings/ N
Foreign Direct Investment Inflows UNCTAD http://unctadstat.unctad.org/wds/TableViewer/tableView.aspx?ReportId=96740 Y
FDI Confidence Index AT Kearney https://www.atkearney.com/foreign-direct-investment-confidence-index N
GDP per Person Employed (Constant 2017 PPP $)
The World Bank https://databank.worldbank.org/reports.aspx?source=world-development-indicators&series=SL.GDP.PCAP.EM.KD Y
Global Innovation Index INSEAD http://www.globalinnovationindex.org/content.aspx?page=GII-Home Y
International IP Index GIPC https://www.theglobalipcenter.com/ipindex2020/ New
RPI (% Change On Year Ago) The Economist https://www.economist.com/economic-and-financial-indicators/2020/12/16/economic-data-commodities-and-markets
Y
Number of International Association Meetings
World Economic Forum http://reports.weforum.org/travel-and-tourism-competitiveness-report-2019/rankings/#series=NRFAIREX N
Innovation Cities Global Index 2ThinkNow Innovation Cities
https://www.innovation-cities.com/index-2019-global-city-rankings/18842/ N
Big Mac Index The Economist https://www.economist.com/news/2020/07/15/the-big-mac-index Y
Sustainable Economic Development Boston Consulting Group https://www.bcg.com/en-gb/publications/2019/seda-measuring-well-being.aspx N
Global Enabling Trade Report World Economic Forum https://www.weforum.org/focus/global-enabling-trade-report-2016 N
Good Country Index Good Country Party https://www.goodcountry.org/index/results Y
Legatum Prosperity Index Legatum Institute http://www.prosperity.com/#!/ranking Y
FDI Inward Stock (In Million Dollars) UNCTAD http://unctad.org/en/Pages/DIAE/World%20Investment%20Report/Annex-Tables.aspx N
Quality Of Nationality Index Henley Partners https://nationalityindex.com/# N
Global Power City Index The Mori Memorial Foundation
http://mori-m-foundation.or.jp/english/ius2/gpci2/index.shtml Y

Smart Centres Index 3
37
Instrumental Factor Source Website Updated
Since SCI 2 Y/N
Business Environment Rankings EIU http://country.eiu.com/All Y
Ease Of Doing Business Index The World Bank https://www.doingbusiness.org/en/reports/global-reports/doing-business-2020 N
Operational Risk Rating EIU http://viewswire.eiu.com/site_info.asp?info_name=VW2_RISK_nib&page=rk&page_title=Risk%20table Y
Real Interest Rate The World Bank https://databank.worldbank.org/reports.aspx?source=world-development-indicators&series=FR.INR.RINR Y
Global Services Location AT Kearney https://www.atkearney.com/digital-transformation/gsli N
Corruption Perception Index Transparency International https://www.transparency.org/en/cpi/2019/ N
Corporate Tax Rates PWC https://www.pwc.com/payingtaxes N
Personal Tax Rates OECD https://stats.oecd.org/index.aspx?DataSetCode=TABLE_I6 N
Tax Revenue As % Of GDP The World Bank https://databank.worldbank.org/reports.aspx?source=2&series=GC.TAX.TOTL.GD.ZS&country=# Y
Bilateral Tax Information Exchange Agreements
OECD http://www.oecd.org/ctp/exchange-of-tax-information/taxinformationexchangeagreementstieas.htm N
Economic Freedom Of The World Fraser Institute https://www.fraserinstitute.org/economic-freedom/map?geozone=world&page=map&year=2018 Y
Government Debt As % Of GDP CIA https://www.cia.gov/library/publications/the-world-factbook/rankorder/2186rank.html N
OECD Country Risk Classification OECD http://www.oecd.org/trade/topics/export-credits/documents/cre-crc-current-english.pdf Y
Global Peace Index Institute for Economics & Peace
https://www.visionofhumanity.org/maps/#/ N
Financial Secrecy Index Tax Justice Network http://www.financialsecrecyindex.com/ N
Government Effectiveness The World Bank http://info.worldbank.org/governance/wgi/ Y
Open Government World Justice Project http://worldjusticeproject.org/rule-of-law-index N
Regulatory Enforcement World Justice Project http://worldjusticeproject.org/rule-of-law-index N
Press Freedom Index Reporters Without Borders (RSF)
https://rsf.org/en/ranking/2020 N
Currencies Swiss Association for Standardization (SNV)
http://www.currency-iso.org/en/home/tables/table-a1.html Y
Commonwealth Countries The Commonwealth http://thecommonwealth.org/member-countries N
Common Law Countries CIA https://www.cia.gov/library/publications/the-world-factbook/fields/308.html N
Inflation, GDP Deflator The World Bank https://data.worldbank.org/indicator/NY.GDP.DEFL.KD.ZG Y
Rule Of Law The World Bank http://info.worldbank.org/governance/wgi/ Y
Political Stability And Absence Of Violence/Terrorism
The World Bank http://info.worldbank.org/governance/wgi/ Y
Regulatory Quality The World Bank http://info.worldbank.org/governance/wgi/ Y
Control of Corruption The World Bank http://info.worldbank.org/governance/wgi/ Y
Best Countries For Business Forbes https://www.forbes.com/best-countries-for-business/list/ N
Open Budget Survey International Budget Partnership
http://survey.internationalbudget.org/#download N
Refined Oil Products Production Enerdata Statistical Yearbook https://yearbook.enerdata.net/download/ N
Table 29 | Business Environment Factors

Smart Centres Index 3
38
Instrumental Factor Source Website Updated
Since SCI 2 Y/N
Graduates In Social Science, Business And Law (As % Of Total Graduates)
The World Bank http://databank.worldbank.org/data/reports.aspx?source=Education%20Statistics&series=UIS.FOSGP.5T8.F400 Y
Gross Tertiary Graduation Ratio The World Bank http://databank.worldbank.org/data/reports.aspx?source=Education%20Statistics&series=SE.TER.CMPL.ZS Y
Henley Passport Index Henley Partners https://www.henleypassportindex.com/passport Y
Human Development Index UN Development Programme
http://hdr.undp.org/en/2019-report/download Y
Purchasing Power Index Numbeo https://www.numbeo.com/quality-of-life/rankings.jsp?title=2021&displayColumn=1 New
Number of High Net Worth Individuals Capgemini https://www.worldwealthreport.com/ N
Homicide Rates UN Office of Drugs & Crime https://dataunodc.un.org/content/data/homicide/homicide-rate N
Average Precipitation In Depth (Mm Per Year) The World Bank http://databank.worldbank.org/data/reports.aspx?source=world-development-indicators&series=AG.LND.PRCP.MM N
Global Skills Index Hays http://www.hays-index.com/ N
Linguistic Diversity Ethnologue https://www.ethnologue.com/guides/countries-most-languages N
Global Terrorism Index Institute for Economics & Peace
http://visionofhumanity.org/indexes/terrorism-index/ Y
World Talent Rankings IMD https://www.imd.org/wcc/world-competitiveness-center-rankings/world-talent-ranking-2019/ Y
Household Net Adjusted Disposable Income OECD https://stats.oecd.org/Index.aspx?DataSetCode=BLI N
Household Net Financial Wealth OECD https://stats.oecd.org/Index.aspx?DataSetCode=BLI N
Educational Attainment OECD https://stats.oecd.org/Index.aspx?DataSetCode=BLI N
Life Expectancy OECD https://stats.oecd.org/Index.aspx?DataSetCode=BLI N
Employees Working Very Long Hours OECD https://stats.oecd.org/Index.aspx?DataSetCode=BLI N
Human Freedom Index Cato Institute https://www.cato.org/human-freedom-index Y
Table 30 | Human Capital Factors

Smart Centres Index 3
39
Table 31 | Infrastructure Factors
Instrumental Factor Source Website Updated
Since SCI 2 Y/N
JLL Real Estate Transparency Index Jones Lang LaSalle https://www.jll.co.uk/en/trends-and-insights/research/global-real-estate-transparency-index N
Quality of Domestic Transport Network World Economic Forum http://reports.weforum.org/travel-and-tourism-competitiveness-report-2019/rankings/#series=TRSPEFFICY N
Quality of Road Infrastructure World Economic Forum http://reports.weforum.org/travel-and-tourism-competitiveness-report-2019/rankings/#series=EOSQ057 N
Roadways Per Land Area CIA https://www.cia.gov/library/publications/the-world-factbook/rankorder/2085rank.html Y
Railways Per Land Area CIA https://www.cia.gov/library/publications/the-world-factbook/rankorder/2121rank.html Y
Networked Readiness Index World Economic Forum http://reports.weforum.org/global-information-technology-report-2016/ N
World Energy Trilemma Index World Energy Council https://trilemma.worldenergy.org/ Y
Environmental Performance Index Yale University https://epi.yale.edu/epi-results/2020/component/epi N
Global Sustainable Competitiveness Index Solability http://solability.com/the-global-sustainable-competitiveness-index/the-index Y
Logistics Performance Index The World Bank http://lpi.worldbank.org/international/global N
Water Quality OECD https://stats.oecd.org/Index.aspx?DataSetCode=BLI N
INRIX Traffic Scorecard INRIX http://inrix.com/scorecard/ N
Labelled Green Bonds Issued By Country Of issuer
Corporate Knights https://www.finance-watch.org/publication/global-green-finance-index-3/ N
Forestry Area World Bank http://databank.worldbank.org/data/reports.aspx?source=2&series=AG.LND.FRST.ZS&country= N
CO2 Emissions Per Capita World Bank https://databank.worldbank.org/reports.aspx?source=2&series=EN.ATM.CO2E.PC&country=# N
4G Availability % Open Signal https://www.opensignal.com/reports/2020/05/global-state-of-the-mobile-network N
Share Of Wind And Solar In Electricity Production
Enerdata Statistical Yearbook
https://yearbook.enerdata.net/download/ N
Energy Intensity Of GDP Enerdata Statistical Yearbook
https://yearbook.enerdata.net/download/ N
Share Of Renewables In Electricity Production Enerdata Statistical Yearbook
https://yearbook.enerdata.net/download/ N
Smart Centres Index 3
40
Vantage Financial Centres is an exclusive network of financial centres around the world looking for a deeper understanding of financial centre competitiveness. Members receive enhanced access to SCI GFCI and GGFI data, marketing opportunities, and training for centres seeking to enhance their profile and reputation.
Supported by the industry, the Financial Services Development Council (FSDC) is a high-level, cross-sectoral advisory body to the Hong Kong Special Administrative Region Government. FSDC formulates proposals to promote the further development of Hong Kong’s financial services industry and to map out the strategic direction for the development. As of March 2020, 110 of the 137 policy recommendations had been adopted by the Government and relevant regulators since FSDC’s inception in 2013. On top of research, FSDC also carries out market promotion and human capital development functions. Among others, FSDC focuses on topics including Mainland and international connectivity, green and sustainable finance, FinTech, as well as asset and wealth management.
[email protected] https://www.fsdc.org.hk/en
Since 2009 Busan Metropolitan City has been developing a financial hub specialising in maritime finance and derivatives. With its strategic location in the center of the southeast economic block of Korea and the crossroads of a global logistics route, Busan envisions growing into an international financial city in Northeast Asia. Busan Finance Center (BFC) will continue to develop and implement measures to promote Busan as the financial hub and bolster the local financial industry, while working together with various local economic players to pursue sustainable growth of the financial sector including FinTech. These efforts will enable BFC to play a leading role in taking Busan to the next level and become the international financial center and maritime capital of Northeast Asia. BFC offers an attractive incentive package to global financial leaders and cooperation network of Busan Metropolitan City, and Busan Finance Center will support you to identify opportunities in Busan, one of the fastest developing cities in Asia.
[email protected] www.kbfc.or.kr/eng/
Dubai International Financial Centre (DIFC) is one of the world’s most advanced financial centres, and the leading financial hub for the Middle East, Africa and South Asia (MEASA) region, which comprises 72 countries with an approximate population of 3 billion and a nominal GDP of US$ 7.7 trillion.
DIFC is home to an internationally recognised, independent regulator and a proven judicial system with an English common law framework, as well as the region’s largest financial ecosystem of more than 24,000 professionals working across over 2,300 active registered companies – making up the largest and most diverse pool of industry talent in the region. The Centre’s vision is to drive the future of finance. Today, it offers one of the region’s most comprehensive FinTech and venture capital environments, including cost-effective licensing solutions, fit-for-purpose regulation, innovative accelerator programmes, and funding for growth-stage start-ups.
Comprising a variety of world-renowned retail and dining venues, a dynamic art and culture scene, residential apartments, hotels and public spaces, DIFC continues to be one of Dubai’s most sought-after business and lifestyle destinations.
www.difc.ae Twitter @DIFC
AIFC is an all-around financial centre located in Nur-Sultan, the capital of Kazakhstan, which offers ample opportunities for businesses to grow. AIFC provides greater access to world-class capital markets and the asset management industry. It also promotes financial technology and drives the development of niche markets such as Islamic and green finance in the region.
AIFC provides unprecedented conditions and opportunities for its participants and investors: legal system based on the principles of English law, independent judicial system, regulatory framework consistent with internationally recognised standards, wide range of financial services and instruments, simplified visa and labour regimes, zero corporate tax rate, and English as a working language.
Located in the heart of Eurasia, AIFC is striving to become the gateway to the Eurasian Economic Union, Central Asia and Caucasus, and play a key role in the Belt and Road Initiative. AIFC is already gaining tremendous recognition as a leading financial hub in the region: recently, Asiamoney Awards recognised it as the best Belt and Road Initiative project of 2019.
Daniyar Kelbetov at [email protected] www.aifc.kz

Smart Centres Index 3
41
Please find out more at: www.vantagefinancialcentres.net or by contacting Mike Wardle at [email protected]
Seoul is a rising star among the financial cities of the world. It is already one of the top 10 cities in the world based on various indices, and it has many more opportunities to offer as a financial hub and great growth potential. Seoul believes global financial companies are our true partners for growth. There are many incentives provided to global financial companies that enter into Seoul, such as the financial incentives provided when moving into IFC, so that we can all jointly work towards the growth and development of the financial market.
It is sure that Seoul will become a top star of global financial hubs in the near future! Pay close attention to Seoul's potentials and pre-emptively gain a foothold in the Seoul financial hub. Seoul is the gateway to Northeast Asia and the world.
Han Dong-Uk, [email protected] www.seoul.go.kr/main/index.jsp
Luxembourg for Finance (LFF) is the Agency for the Development of the Financial Centre. It is a public-private partnership between the Luxembourg Government and the Luxembourg Financial Industry Federation (PROFIL). Founded in 2008, its objective is to develop Luxembourg’s financial services industry and identify new business opportunities.
LFF connects international investors to the range of financial services provided in Luxembourg, such as investment funds, wealth management, capital market operations or advisory services. In addition to being the first port of call for foreign journalists, LFF cooperates with the various professional associations and monitors global trends in finance, providing the necessary material on products and services available in Luxembourg. Furthermore, LFF manages multiple communication channels, organises seminars in international business locations, and takes part in selected world-class trade fairs and congresses.
[email protected] luxembourgforfinance.com
The Long Finance initiative grew out of the London Accord, a 2005 agreement among investment researchers to share environmental, social and governance research with policy-makers and the public. Long Finance was established more formally by Z/Yen Group and Gresham College from 2007 with the aim of exploring long-term thinking across a global network of people. We work on researching innovative ways of building a more sustainable financial system. In so doing, we try to operate openly and emulate scientific ideals. At the same time, we are looking to create a supportive and caring community where people can truly question the accepted paradigms of risk and reward.
www.longfinance.net
Approved by the China’s State Council, China Development Institute (CDI) was founded in 1989 with 116 representatives from the government, academia and business in China. Being an independent think tank, CDI is committed to develop policy solutions via research and debates that help to advance China’s reform and opening-up. After years of development, CDI has become one of the leading think tanks in China. CDI focuses on the studies of open economy and innovation-driven development, regional economy and regional development, industrial policies and industrial development, urbanization and urban development, business strategies and investment decision-making. Via conducting research, CDI provides policy recommendations for the Chinese governments at various levels and develops consultation for corporate sectors at home and abroad. CDI organizes events in different formats that evokes dialogue among scholars, government officials, business people and civil society members around the globe. Based in Shenzhen, Southern China, CDI has one hundred and sixty staff, with an affiliated network that consists of renowned experts from different fields.
Carol Feng at [email protected] www.cdi.org.cn

Smart Centres Index 3
42
Vantage Financial Centres is an exclusive network of financial centres around the world looking for a deeper understanding of financial centre competitiveness. Members receive enhanced access to SCI, GFCI , and GGFI data, marketing opportunities, and training for centres seeking to enhance their profile and reputation.
Finance Montréal’s mandate is to promote Montréal as a world-class financial hub and foster cooperation among its member institutions to accelerate the industry’s growth. With renowned research capacities in artificial intelligence and a booming fintech sector, Montréal offers an experienced, diversified and innovative pool of talent as well as a stable, low cost and dynamic business environment.
For financial institutions searching for an ideal location to set up an intelligent service centre and operationalize their digital transformation, Finance Montréal can advise on the advantageous tax incentives aimed at facilitating the establishment and development of financial services corporations in the city.
[email protected] www.finance-montreal.com/en
Abu Dhabi Global Market (ADGM), an award-winning financial centre in the capital of the UAE, opened for business in October 2015, consisting of three independent authorities: the Registration Authority (RA); the Financial Services Regulatory Authority (FSRA); and ADGM Courts. Comprised of the three independent authorities where Common English Law is directly applicable, ADGM plays an essential role in the diversification of the economy in the UAE and is committed to providing a comprehensive business ecosystem operating with the highest standards of integrity and is renowned for its ease of doing business.
Strategically situated in Abu Dhabi, home to one of the world’s largest sovereign wealth funds, ADGM plays a vital role in positioning Abu Dhabi as a global trade and business hub and serves as a link between the growing economies of the Middle East, Africa and South Asia to the rest of the world. ADGM has earned industry recognition as the Financial Centre of the Year (MENA) four years in a row as well as being recognized as the leading FinTech Hub in the region.
www.adgm.com/ [email protected]

PRODUCED BY Z/YEN GROUP
www.zyen.com
Z/Yen helps organisations make better choices - our clients consider us a commercial think-tank that spots, solves and acts. Our name combines Zen and Yen - ‘a philosophical desire to succeed’ - in a ratio, recognising that all decisions are trade-offs. One of Z/Yen’s specialisms is the development and publication of research combining factor analysis and perception surveys.
PUBLISHED BY LONG FINANCE AND DISTRIBUTED FUTURES
www.longfinance.net Long Finance is a Z/Yen initiative designed to address the question “When would we know our financial system is working?” This question underlies Long Finance’s goal to improve society’s understanding and use of finance over the long-term. In contrast to the short-termism that defines today’s economic views the Long Finance timeframe is roughly 100 years.
www.distributedfutures.net Distributed Futures is a Long Finance programme dedicated to exploring new technologies and finance. The programme looks as Smart Ledgers, but also wider technologies ranging from quantum computing to machine learning to biological finance.
THE SMART CENTRES INDEX
www.smartcentresindex.net The Smart Centres Index is designed to track the development of technology and financial centres across the world in their support for and readiness for new technology applications. It aims to measure how attuned centres and their regulatory systems are to attracting innovation and growth in Science, Technology, Energy Systems, Machine Learning, Distributed Ledgers, and Fintech.