the smart growth strategy/ regional livability footprint project… policies shape reality alex...
TRANSCRIPT
The Smart Growth Strategy/Regional Livability Footprint Project…
Policies Shape Reality
Alex AmorosoPrincipal Planner
Association of Bay Area Governments

Why Smart Growth?
• 1 million New Jobs
• 1 million More People
• 265,000 daily In-Commuters to the region
• 150% increase in aggregate Traffic Congestion
If Current Trends continue, by 2020, the Bay Area can expect...
Effects of Current Trends... • Loss of Open Space
• Longer Commutes
• Poor Air Quality
If Current Trends continue, Bay Area Residents can expect a degraded quality of life.
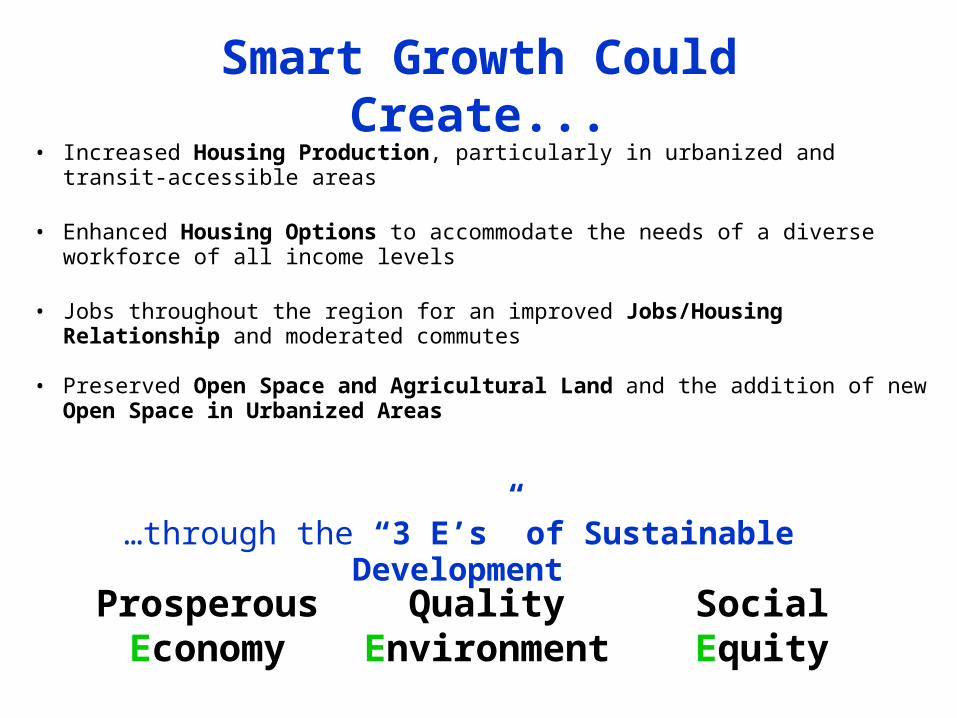
Smart Growth Could Create...• Increased Housing Production, particularly in urbanized and transit-accessible
areas
• Enhanced Housing Options to accommodate the needs of a diverse workforce of all income levels
• Jobs throughout the region for an improved Jobs/Housing Relationship and moderated commutes
• Preserved Open Space and Agricultural Land and the addition of new Open Space in Urbanized Areas
…through the “3 E’s” of Sustainable Development
Social Equity
Quality Environment
Prosperous Economy

Smart Growth Policy Issue Areas
- Jobs/Housing Relationships and Balance
- Gentrification and Displacement
- Social Justice and Equity
- Environmental, Natural Resource and Agricultural Preservation
- Mobility, Livability and Transit Support
- Local and Regional Transportation Efficiencies
- Infrastructure to Support Urban Development
- Local Government Fiscal Health
- Inter-jurisdictional and Inter-regional Cooperation
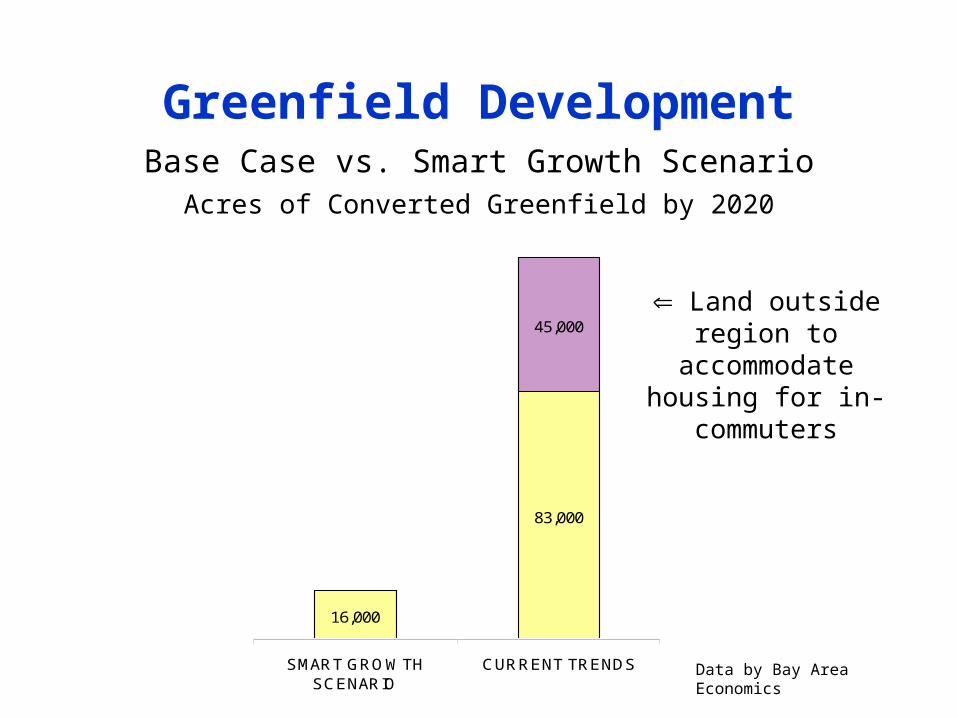
Greenfield DevelopmentBase Case vs. Smart Growth Scenario
Acres of Converted Greenfield by 2020
16,000
83,000
45,000
SMART GROWTHSCENARIO
CURRENT TRENDS
Land outside region to accommodate housing
for in-commuters
Data by Bay Area Economics
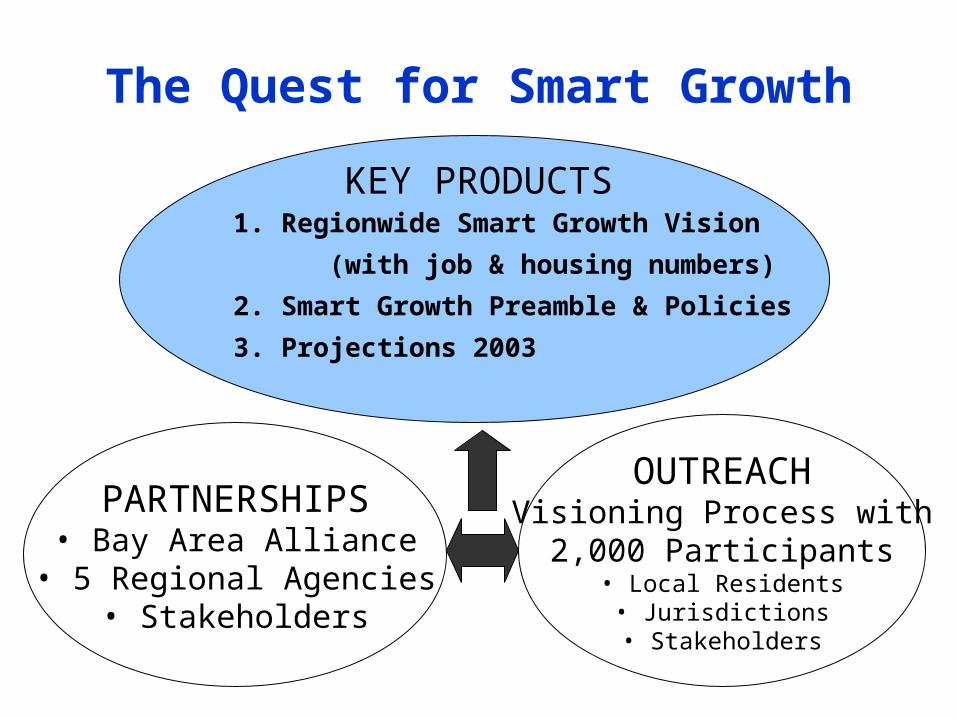
The Quest for Smart Growth
PARTNERSHIPS• Bay Area Alliance
• 5 Regional Agencies• Stakeholders
OUTREACHVisioning Process with
2,000 Participants• Local Residents
• Jurisdictions• Stakeholders
1. Regionwide Smart Growth Vision
(with job & housing numbers)
2. Smart Growth Preamble & Policies
3. Projections 2003
KEY PRODUCTS

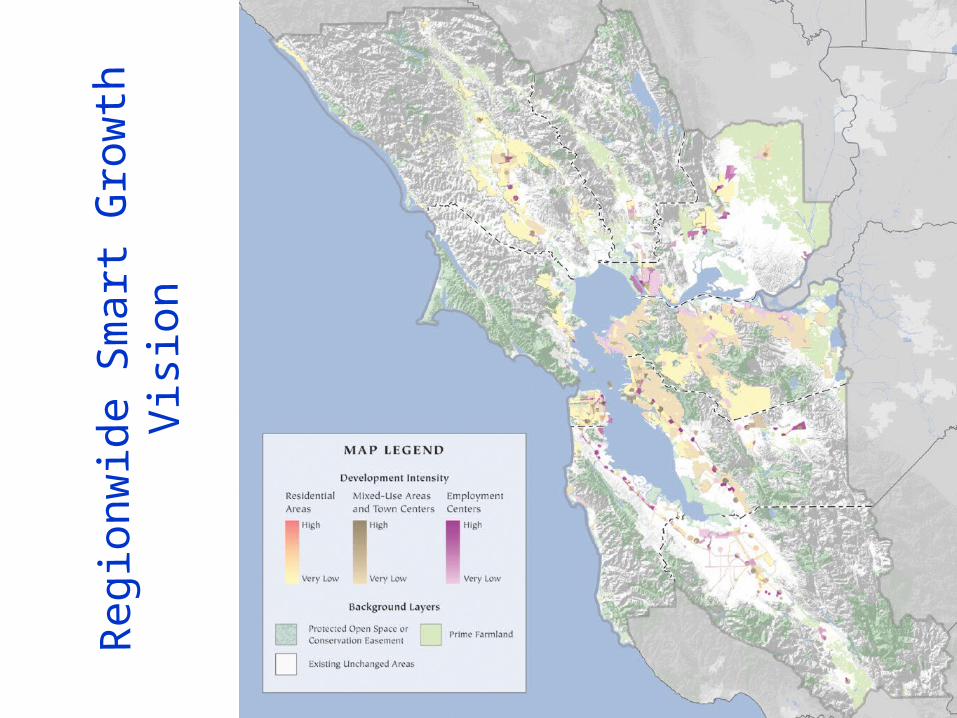
The Regionwide Smart Growth Vision
• Calls for more development in the region’s central urbanized areas
• Locates growth in nodes around public transit stations and major corridors
• Encourages compact, walkable, mixed-use development in each county’s largest city or cities.
• Produces higher densities of jobs and housing throughout the region
• Refocuses development away from unincorporated areas and greenfields
The Smart Growth Vision Will Bring the Bay Area Towards A Regionwide “Network of Neighborhoods.”
Reg
ionw
ide
Sm
art G
row
th V
isio
n

Trends-based Projections vs. (policy-based) Projections 2003
Trends-Based Forecasts
• Historical ABAG Approach
• Defined by existing & imminent economic conditions and land use
• Reliant on existing and planned local government policies and land use
Projections 2003
• New… never before done by ABAG
• Defined by the Vision and the jobs & housing data along with local inputs
•Reliant on local government policies with Smart Growth enhancements
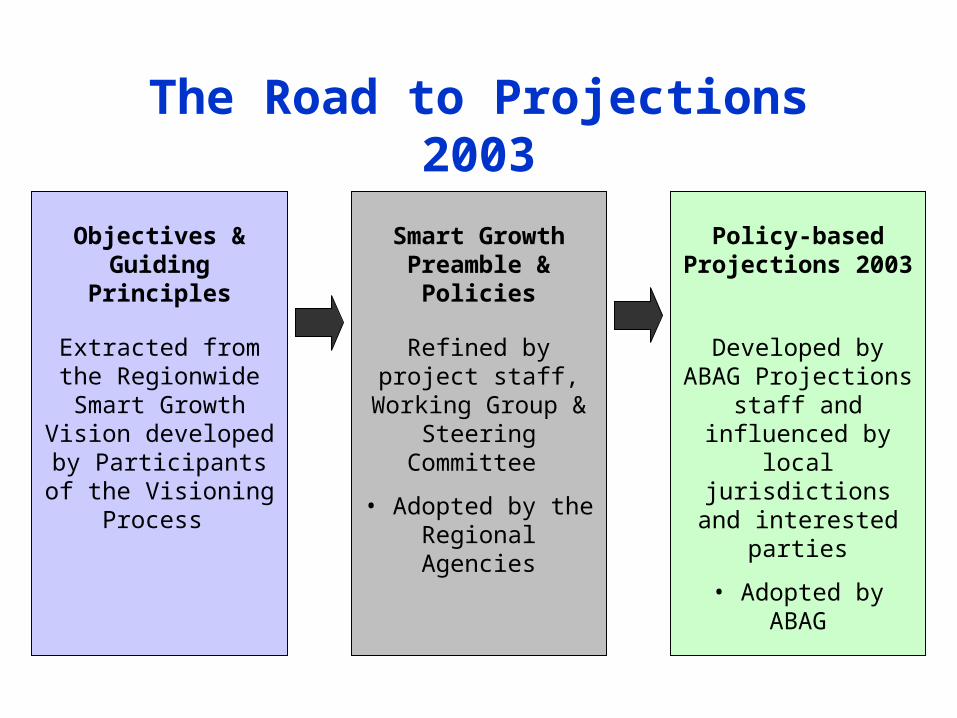
The Road to Projections 2003
Objectives & Guiding Principles
Smart Growth Preamble & Policies
Policy-based Projections 2003
Extracted from the Regionwide Smart
Growth Vision developed by
Participants of the Visioning Process
Refined by project staff, Working Group
& Steering Committee
• Adopted by the Regional Agencies
Developed by ABAG Projections staff and influenced by local jurisdictions and interested parties
• Adopted by ABAG
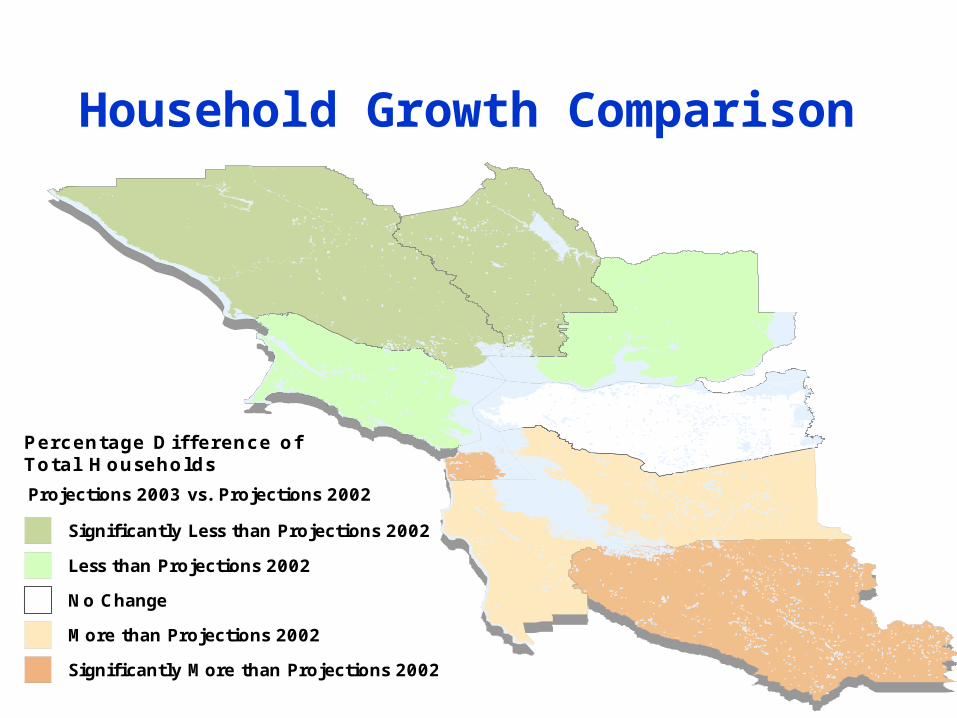
Household Growth Comparison
Percentage Diff erence of Total Households
No Change
Significantly Less than Projections 2002
Less than Projections 2002
More than Projections 2002
Significantly More than Projections 2002
Projections 2003 vs. Projections 2002
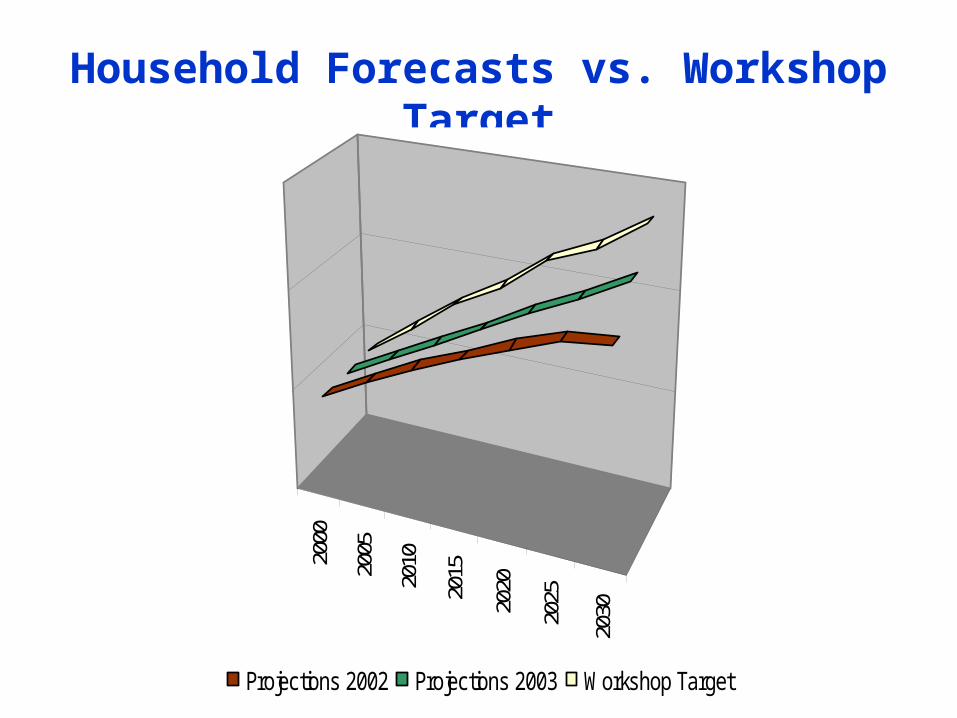
Household Forecasts vs. Workshop Target
2000
2005
2010
2015
2020
2025
2030
Projections 2002 Projections 2003 Workshop Target

The Value of Projections 2003
• Confirms the Regional Agencies’ commitment to Smart Growth
• Increases likelihood of securing Incentives and regulatory changes
• Influences 2005 Regional Transportation Plan
• Influences other Regional Agencies’ plans
• Serves as a benchmark for future evaluation of how well the Bay Area shifts toward Smart Growth
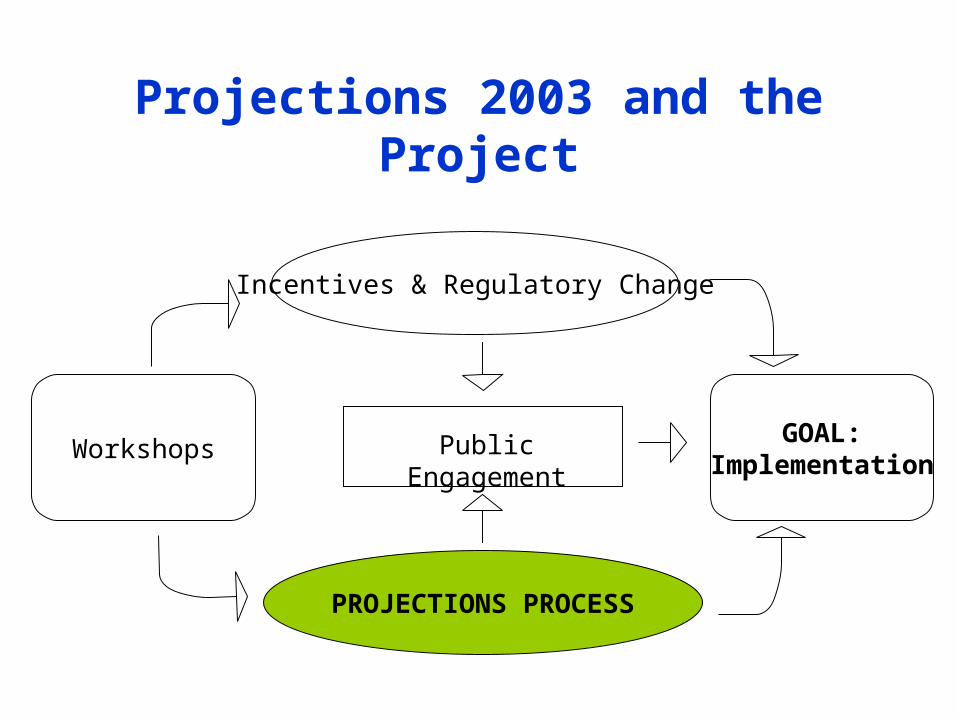
Projections 2003 and the Project
WorkshopsGOAL:
Implementation
Incentives & Regulatory Change
PROJECTIONS PROCESS
Public Engagement

Future of the Smart Growth Project
The Project is engaged in three critical project components:
• Identifying and obtaining Incentives & Regulatory Changes
• Defining Outreach & Engagement efforts
• Developing Smart Growth Implementation Programs
Incentives & Regulatory Changes
• Working with local and regional government staff and representatives from the 3 E’s to promote legislation
• Building alliances with other incentive-seeking agencies and organizations

Outreach & Engagement Efforts
• Maintaining working relationships with local and regional government staff and representatives from the 3 E’s
• Developing methods to provide education about Smart Growth to the general public and under-engaged groups
• Addressing the concerns of local and regional governments, residents and stakeholders

Implementation Programs
• Working collaboratively with the Regional Agencies and local governments on existing and prospective regional programs
•Incorporating other ABAG efforts (e.g. Water Program, Housing Program, Bay Area Green Business Program and the Inter-Regional Partnership))
