the snapshot of school management effectiveness …pdf.usaid.gov/pdf_docs/pnado066.pdf · education...
TRANSCRIPT

EDDATA II
The Snapshot of School Management Effectiveness: Report on Pilot Applications
EdData II Technical and Managerial Assistance, Task Number 1 Contract Number EHC-E-00-04-00004-00 Strategic Objective 3 October 2008 This publication was produced for review by the United States Agency for International Development. It was prepared by RTI International.
The Snapshot of School Management Effectiveness: Report on Pilot Applications October 2008 Prepared for Bureau for Economic Growth, Agriculture and Trade (EGAT/ED) United States Agency for International Development Prepared by Luis Crouch RTI International 3040 Cornwallis Road Post Office Box 12194 Research Triangle Park, NC 27709-2194 RTI International is a trade name of Research Triangle Institute.
The authors’ views expressed in this publication do not necessarily reflect the views of the United States Agency for International Development or the United States Government.
Acknowledgments The collaboration of our two key in-country subcontractors, the Joint Board of Teacher Education (JBTE) Foundation at the University of the West Indies in Jamaica, and the Fundación para el Desarrollo Agrario (FDA) in Peru, is gratefully acknowledged. This analysis would, of course, not have been possible without them.
iii

iv
Table of Contents
Executive Summary .........................................................................................................................1
1. Introduction.............................................................................................................................2
2. Background and Motivation ...................................................................................................3
2.1. Trends in the education sector: Need for monitoring quality ........................................3 2.2. Other options..................................................................................................................6 2.3. Antecedents in other sectors ..........................................................................................7
3. Process Followed in Tool Development .................................................................................8
3.1. Literature review and summary .....................................................................................8 3.2. Panel consultation ..........................................................................................................9
4. Field Application Planning and Protocols ..............................................................................9
5. Performance of Process and Tool in the Field Trials............................................................12
5.1. Process, sampling, and deployment issues ..................................................................12 5.2. Numerical and research characteristics of the tool ......................................................14
5.2.1 Sample of studied behaviors, discrimination between behaviors...................15 5.2.2 Discrimination between schools: Capturing extremes in behavior ................18 5.2.3 Performance of the reading component..........................................................21 5.2.4 Relation of management practices to reading outcomes ................................23 5.2.5 The importance of observation versus self-reporting.....................................26 5.2.6 Cost-effectiveness and reliability of SSME applications ...............................27
6. Smaller and Quicker Than SSME?.......................................................................................30
7. Call for Further Applications and Refinement......................................................................31
8. Conclusions...........................................................................................................................32
Bibliography ..................................................................................................................................33
Annex 1. Literature Reviewed.....................................................................................................35
Annex 2. Experts, Users, and Reviewers Consulted ...................................................................45
Tables Table 1. Catalogue of data contents of SSME ...........................................................................10 Table 2. Basic sample characteristics, Peru and Jamaica pilots.................................................13 Table 3. School management issues (based on observations of grades 2 and 3).......................16 Table 4. Total reading score distribution in Jamaica and Peru ..................................................23 Table 5. Effect sizes and statistical significance of other variables...........................................25 Table 6. Accuracy of SSME results as per pilot experiences ....................................................28 Table 7. Gain in accuracy with increased sample size...............................................................30 Figures
Figure 1. Management behaviors and learning outcomes...........................................................24 Figure 2. Pages marked by teachers and total reading scores .....................................................25
Executive Summary Concern over quality of education is increasing as enrollment levels and even completion levels in countries edge toward 100%. So far, there has been much more streamlined advice available to countries and donors on how to assess enrollment and completion than on how to assess quality in schools. There is, thus, a need for advice on how to assess quality—ideally advice that can actually be embodied in sets of questions and questionnaires that have already been tried and found to be useful. The Snapshot of School Management Effectiveness (SSME) addresses that need. It is being designed under the U.S. Agency for International Development’s EdData II project as a tool that can quickly assess levels of educational quality in a district, region, or country. Recent research on school quality and effectiveness, and on other practical checklists created by other analysts, projects, and countries, were all used as a source of inspiration for many of the questions and items the tool addresses. Finally, the tool was designed to be applicable via one-person-day school visits, and the intent was to enable visits to approximately 50–60 schools to produce information on the quality of management factors. In a sense, the tool is designed so as to extract the maximum amount of information from a set of schools that can be obtained in one school day. The tool is intended to be more than what might be described as a “donor walkabout,” where a few schools are visited before a country develops a regional improvement project, with or without donor funding and technical input. It is also intended to provide a template, based on careful attention to the literature and careful piloting, for countries that wish to improve their quality assurance systems and checklists, at the national, regional, or district level. The tool is not intended to substitute for other in-depth studies or for education management information system (EMIS) administrative record-keeping, as those sorts of data exercises fulfill different needs and have their own merits. In general, similar to what has been done in the health sector, the attempt was to provide a tool that could typically catch large differences in behavior, and could establish whether certain behaviors (e.g., attendance checking) are taking place with at least 90% confidence and a 10-point confidence interval. This is similar to what quick surveys in the health sector, such as Expanded Program on Immunization (EPI) surveys, have attempted to do. The SSME is planning to offer a standardized item bank of questions that can be put into a questionnaire, to be applied to a reasonably standardized set of school actors—principal, teachers, parents, and students—to develop a faithful “snapshot” of the school. It uses a simple measure of student learning outcomes as an approximate proxy for outcome quality. The tool was tested in Jamaica and Peru in 48 and 64 schools respectively, with corresponding numbers of principals, parents, teachers, and students. Students were naturally the most common type of respondent—the survey had 374 and 512 respectively in the two countries.
1

The pilot confirms that something meaningful can be done at relatively low cost. The cost can be kept low by making sure that the information can be gathered at each school in one visit, and that the number of schools is kept just large enough to provide levels of statistical sampling error that are not too high, and that permit analysts to detect substantive differences (e.g., between regions, or between behaviors observed) with some statistical significance. In terms of adjustments that need to be made, the pilot research shows that the initial questionnaires seem to be about 25% too long, so some adaptation in the length is needed. It was hypothesized that even a relatively inexpensive tool such as SSME would be able to accomplish the following tasks: 1. Discriminate clearly between behaviors that are practiced at schools and those that are not
being practiced. 2. Distinguish between schools and groups of schools that do not practice the recommended
behaviors and those that do. 3. Confirm, without claiming to be an original contribution to the literature on school
effectiveness or “production functions,” that behaviors are broadly correlated with outcomes. 4. Assess some simple outcome indicators, such as proficiency in an oral reading assessment,
with good accuracy. 5. Establish confidence intervals that are reasonably narrow, and for which observed differences
that are of substantive significance also have statistical significance. That is, that if observed differences (between behaviors, or groups of schools) are large enough to cause managerial concern, the difference is not likely to be a mere artifice of sampling.
The pilot experience confirms these hypotheses. Important behavioral differences of all sorts can be ascertained. Average levels of behavior performance can be established with 90% confidence and a 10-point confidence interval in most cases, and most of the time better than that. SSME appears, then, to be a tool that could be used to evaluate a country’s or region’s quality levels in a manner that is much more profound than the usual qualitative “donor walkabouts,” fresher and more original than relying on old and partial data, more school-based and classroom-oriented than relying on administrative data, and less expensive than the typical large-scale and intensive studies of outcomes and associated factors. 1. Introduction Enrollment in and completion of primary and secondary schooling in poor countries continue to be a problem. But as numbers expand, the problem of school quality appears to be an increasingly binding constraint on human development. This paper describes the piloting of a new instrument, the Snapshot of School Management Effectiveness, being developed to help countries and cooperating agencies raise quality levels both in routine management and in special projects in the education sector. For example, cooperating agencies and countries could use the tool to prepare for a joint periodic agency–country review of a budget support program or a Sector Wide Approach (SWAp) effort.
2
Alternatively, a country could use the tool in assessing subnational sector management capacity during a process of decentralization. Or a cooperating agency could use it to prepare a more traditional projectized loan or grant that might work in a particular area of the country.1 The instrument, as explained in detail below, is being designed with a view to straddling the tradeoff between the need for depth and detail on the one hand, and the need for economy, speed, and relevance on the other. It has now been piloted in two countries: Peru and Jamaica. This note describes the instrument in some detail, assesses its pilot performance, and calls for further application—both in actually assisting countries and in further developing the instrument itself. In developing this instrument, EdData II’s goal is to produce an adaptable tool which agencies and countries can use to inexpensively yet systematically assess processes and outcomes of education quality over time and in different school populations. Many analysts will continue to use existing tools, and various tools may merge as they get used and discussed. It is the hope of the EdData II project, and the writers of this report, however, that sooner rather than later, a fairly efficient, inexpensive, and easy-to-apply tool does emerge that can serve countries’ and donors’ needs to evaluate education sectors in a relatively rigorous and systematic way via access to common set of question items that can be used to construct questionnaires by choosing and mixing. And it is also the hope of the project and the authors that the SSME either could be such a tool, or could contribute in a significant way to the emergence of such a tool via further trials and discussions. The paper is organized as follows. A background section explains the motivation behind the development of the tool and notes why the present is an appropriate time for such a quality management tool to be developed and promoted. It notes the types of uses one could expect for such a tool. The paper then moves on to explain the process followed in developing the tool thus far. Next, the tool is described in some detail, in terms of the sorts of questions that are available, the format of the tool, and its field application experience thus far. The field performance of the tool is then assessed, based on the pilot efforts carried out in Jamaica and Peru: Does the tool do what is expected and needed from an instrument intended to provide simple yet effective measures of school quality and management processes? To further concretize ideas about what the tool can and could do, a sampling of recommendations emerging from both Jamaica and Peru is presented. Finally, a concluding section summarizes the pilot findings and presents suggested next steps. 2. Background and Motivation
2.1. Trends in the education sector: Need for monitoring quality
The world’s poor countries and cooperating agencies invest large amounts of money and effort into the monitoring of school access and completion. Countries invest their own resources in
1 The term “projectized” loan or grant refers to a traditional donor approach where implementation is carried out by an implementation unit that is separate from the standard implementation structure of the Ministry. They often follow separate procurement and financial accounting procedures. They sometimes show up in the development portion of a Ministry’s budget even if they fund mostly recurrent expenditure. In many cases such projects are actually implemented by NGOs.
3

EMIS and (less often) household surveys to gather primary data. They report to the United Nations Educational, Scientific, and Cultural Organization (UNESCO) Institute of Statistics (UIS), which further compiles and analyzes the data, and makes such data available to other agencies, such as the World Bank and bilateral agencies (who in turn often further report, such as in the World Bank’s EdStats system), back to countries’ own systems, and to scholars and analysts. Of the data typically captured or reported by UNESCO in its main set of education indicators, approximately 8% relate to quality, if one interprets somewhat generously.2 Since the 1990s, the standard forms whereby UNESCO seeks information from countries’ education management information systems request only data referring to enrollment and to relatively distal proxies of quality such as transition rates (or, rather, actual numbers of repeaters, from which transition rates are estimated) and pupil–teacher ratios.3 In the World Bank’s EdStats website (standard query), similarly, at best some 9% of indicators refer to quality.4 It is true that the World Bank’s EdStats website has also started providing a convenient way to download learning outcomes data from a variety of international assessments, but this is not part of the standard query system (and most likely should not be). Additionally, some researchers have started to calculate approximate equivalences between international indicators (e.g., Altinook and Murseli 2006; Crouch and Fasih 2004; Mingat, Rakotomalala, and Kengne 2004) of learning outcomes, but these tend to be unofficial estimates and are sometimes informal and not even published. There is currently no way for international organizations or countries themselves to access data on management performance that has been gathered in a similar way and with reference to similar literatures, and is all available in one single electronic repository. The case for investing as much creativity and thought, as well as human and financial resources, on monitoring school quality and management processes as is invested on monitoring access and completion, is not as obvious as one might think. This section lays out some of the rationale for this investment, after admitting that making the case is not as straightforward as may appear at first blush. There seem to be two reasons why there has been less invested in measuring and tracking education quality: First, investments in tracking access and completion have reflected higher policy priorities (perhaps more implicit than explicit); and, second, there is a pervasive belief in
2 This refers to the set of variables available at http://stats.uis.unesco.org/unesco/TableViewer/document.aspx?ReportId=136&IF_Language=eng&BR_Topic=0 if one chooses all of the variables that appear in the “Education” tick box (as of August 23, 2008). We gave a count a weight of 0.3 to variables that are proxies of quality, such as the completion rate, repetition rates (and we counted number of repeaters as well as the rate), the pupil–teacher ratio, the percentage of teachers that are trained, and so on. Weighting those variables at 0.3, and the others at 1, about 7.8% of the database ties to quality. The weight of 0.3 as a means to weight proxies is not entirely arbitrary. For example, in many surveys, the percentage of dropouts stating that quality issues (e.g., “School is irrelevant” or “I was bored”) are their main reason for dropping out is often somewhere between 20% to 40% of respondents (cost is almost universally the main reason—of course, the implicit judgment being made is probably a quality-for-cost judgment). Similarly, factors such as pupil–teacher ratios and teacher certification percentages seem to explain about 30% (optimistically, perhaps) of the variance in learner results across “production function” studies. 3 For example, form STE/Q/981, used in 1997–98. 4 This refers to the set of variables available at http://ddp-ext.worldbank.org/ext/DDPQQ/member.do?method=getMembers (as of August 23, 2008). We gave a weight of 0.3 to distal proxies of quality, similarly to what was done with the UNESCO data set.
4
the high cost and impracticality of gathering more data on quality. These two issues merit some discussion. The world’s education community has put far more emphasis on access and completion than on measurable learning or managerial process, probably because access and completion data are simply easier to get at, and because they track important goals. Furthermore, in the past there has been significant correlation between completion and measures of learning or cognitive achievement (see Crouch and Fasih 2004), to the point that some analysts claim that the simplest and cheapest way to improve learning outcomes may be, essentially, just to add on more years of education by encouraging persistence and completion (Carnoy 2007). But this state of affairs seems unsatisfactory and risky on various grounds. First, while it is true that under “normal” conditions of educational progress, completion rates and learning outcomes have paralleled each other reasonably well, it is also possible to show that certain areas of the world, in particular Southern Africa, have in the past veered off this “typical” path rather seriously—that is, it does seem possible to overemphasize access and throughput at the expense, and to the detriment, of quality (see Crouch and Vinjevold 2006). One is justified, then, in worrying that under “unusual” conditions, such as pressure from the international community and from single-minded focus on access and completion goals, quality could be neglected and start not to track completion and access in a major way.5 Second, research suggests that direct approaches to improving learning outcomes need not be very expensive, although implementing them does require political will. Such approaches may be most valid in lower- and lower-middle-income countries, rather than in more developed countries where efforts to directly improve quality seem to often hit seriously diminishing returns at the margin. In countries with abysmally poor educational quality, where many children are barely reading by grade 5 or 6, it seems imperative to determine whether certain basic practices associated with effective education are taking place in schools and classrooms, and if not, to take corrective action. The second argument is that while access and completion data are seen as easy to collect, it is widely held that collecting quality and process data is extremely difficulty and expensive. It is true that getting an EMIS to produce even crude data on enrollment is hard enough, and thus it is excusable to be pessimistic to the point of dismay with proposals that the world do more about tracking quality. But this argument assumes that one would always gather such data based on
5 One could argue that the enrollment pressure brought on by, say, free primary education efforts in Africa, or by Education for All–Fast-Track Initiative (EFA–FTI) goals or Millennium Development Goals, is not necessarily responsible for any measurable decrease in quality so far. While this pressure may have resulted in worsening performance on proxies of quality, such as pupil–teacher ratios, or lower percentages of trained teachers in front of classes, these are just proxies, as argued elsewhere. We see little direct evidence that these efforts have resulted in less learning or lower “client satisfaction.” This may be, of course, because there simply is no data-gathering on these issues, as very few countries have learning outcomes assessments that are comparable over time, and even fewer directly assess parental satisfaction with schooling over time. Or it may be because in many countries where enrollment has expanded, quality was already at a floor and one can hardly contemplate children learning even less than was the case before the surge in enrollment. In any case, one needs to be cautious in proclaiming that expansions in enrollment have led to decreases in quality. At the same time, the evidence does show that it is possible for countries that overemphasize enrollment to be off the main path, given that enrollment and learning outcomes track each other fairly well.
5
administrative records produced on a routine basis via traditional bureaucratic mechanisms. Alternatives can be considered, however. For example, Wagner (2003), in an intriguing paper, points out that there may be “smaller, quicker, cheaper” ways to obtain useful data on learning processes and outcomes, particularly around the issue of literacy. But one can also generalize to educational quality issues more broadly, and employ sample-based survey techniques. The motivation for working on SSME responds to both of these issues. First, it responds to the need to start monitoring quality, because while it is true that quality and access have tended to track each other well in the past, the current pressure on access and completion has meant that their correlation with quality might no longer be quite as strong. Second, it contributes to the search for “smaller, quicker, cheaper” ways to track educational quality usefully in developing countries.
2.2. Other options
The proposal for an SSME does not imply that other options are not suitable. Countries need a variety of tools. The existence of an SSME is predicated on the notion that the available tools and approaches do not fill a vital need. In designing projects and remediation approaches in regions, country governments and donors often carry out simple qualitative “walkabouts” (or “driveabouts”), which literally imply driving to a few schools and talking to a few principals, teachers, and parents. This is usually done without a fixed protocol of questions, and there is no tabulation of results, or even a systematic feedback of the results of the visits to the design team. SSME can be seen as a formalization of this approach. One could, for example, invite a local nongovernmental organization (NGO) or the quality assurance group in the Ministry of Education to carry out an SSME application a month or two prior to a visit to a region or country by senior Ministry and donor visitors, so as to provide a more in-depth picture of the management practices in the schools. When interventions are designed or monitored, either by donors or governments themselves, another important source of information is the stock of previous donor evaluations or sector assessments. But these are often old, and/or are often not themselves based on systematic school-level management information. In some cases the country in question will have carried out serious studies of learning outcomes and factors associated with learning outcomes. In those cases some in-depth data will be available. However, most such studies have relied on “distal” factors related to school achievement (e.g., parental wealth) or the measurement of inputs such as the availability of textbooks. Only a few dig into managerial issues such as the use and marking of homework, the management of time on task, and so on. EMIS data are, of course, an often-used source for progress tracking and intervention design. While useful, such data almost universally refer to raw numbers, from which a very limited set of quality indicators can be produced. These indicators (such as completion rates) are fairly distant proxies for quality. In all this it is important to make one aside. EMIS-based efforts, which use the already-paid-for time of officials, may appear to be an inexpensive way to gather information from schools, above and beyond the minimum required for administrative operations of schools and school systems.
6

This may be true in a pure fiscal sense and in terms of cost to international agencies. Yet using EMIS-based data-gathering operations that reach all schools, in order to collect finer observations of process and learning outcomes, can have enormous opportunity costs for little, and sometimes even negative, social return. EMIS forms that are used as all-purpose instruments, gathering far more data on all schools than are likely to be needed or used for basic administrative purposes, can be of enormous length, taking school administrators many hours to fill out. Because the data thus collected are often of poor quality (partly due to the effort it takes to fill out the forms), or have internal contradictions, they often generate uncertainty and debate among statistical authorities of the countries themselves, as well as with other countries and international organizations. This uncertainty can distract the scarce statistical talent that exists from other, more meaningful, data pursuits. And worse still, such data can be downright misleading, as in their tendency to understate repetition and transfer and overstate dropping out, producing underestimates of survival rates. Thus, when one discusses issues of cost (see below), it is good to bear in mind that while an instrument based on a random sample survey, using paid enumerators, may appear more expensive in terms of cash costs, it may actually be much less expensive than EMIS-produced data, in terms of opportunity cost and real social cost—i.e., the time of human officials and school managers at every single school when a sample survey will do. Thus, EMIS should ideally concentrate on producing regular series on key access indicators, and issues of quality may well best be handled via occasional surveys. In summary, all these other various sources of information for sector tracking and intervention design are useful and valid. SSME adds something that in the view of its creators is sorely missing: a source of school-based information that is fresh, recent, tightly focused on managerial issues, related to outcomes, relatively inexpensive, and yet reliant on a systematic and reasonably large sample so as to provide quantitative information whose characteristics can be stated with precision.
2.3. Antecedents in other sectors
The education sector, at an international level, seems to have lacked a tool such as SSME. Not so in the health sector. SSME in some sense takes its inspiration from tools in the health sector that have produced the same sorts of information that the SSME tries to produce in the education sector. It is also interesting that the health sector has often used schools as a sampling frame in much the same manner that is proposed for SSME, and seems to have done so to greater advantage than the education sector itself has. Often these applications have to do with child health, in which case using schools, rather than homes, as a sampling frame, is seen as a cost-effective way to proceed. A good example is the process of development and application of the EPI concept in the health sector. A description can be found on the University of California–Los Angeles Department of Epidemiology website on rapid surveys, http://www.ph.ucla.edu/epi/rapidsurvey.html. However, one can summarize by saying that the health sector has seen a productive interaction between international United Nations organizations such as the World Health Organization, bilaterals such as USAID, and academics, in the production and refinement of tools that mix rapidity and low cost with rigor. Nothing of the kind (to our knowledge) has ever happened in the education
7
sector. These tools frequently recommend sampling 30 units (clinics, for example), and 7 users or providers per clinic. These have come to be known as 30×7 surveys and seem to have played an important role in successful health drives. A significant literature on these procedures exists, including Bennett, Woods, Liyanage and Smith (1991); Frerichs (1989); Frerichs and Shaheen (2001); Frerichs and Tar Tar (1989); and Lemeshow and Robinson (1985), all available from the cited UCLA website. Interesting work has also been done by health analysts using schools as efficient sampling frameworks for dealing with a whole host of child-related issues. For example, David, Wang, Åstrøm, and Kuriakose (2005) have used schools as sampling frames in the study of dental problems in children, using cluster sampling of the type used in EPI in clinics, and in SSME in schools. Sinha, Gupta, Warren, and Asma (2004) have used similar approaches to study tobacco use and policy in schools in India. Sampling 50 schools, and then children within schools, they were able to demonstrate that children in schools without a tobacco policy had significantly more tobacco use among students. Bawazeer, Hattab, and Morales (1999) similarly used schools as clusters to determine first-time-ever smoking behavior among youth. In summary, the importance of assessment that straddles the tradeoff between rapidity (and cost), on the one hand, and rigor (statistical accuracy) seems to have been recognized in the health sector earlier and more thoroughly than in the education sector. To some degree SSME is an attempt to learn from these applications, and adjust the learning to the education sector. 3. Process Followed in Tool Development
3.1. Literature review and summary
The development of the SSME began with a review of similar efforts and of relevant research literature. An extensive conceptual and empirical literature was first compiled. Literature that was research-based, but as practical and field-oriented as possible, was generally selected. The literature reviewed and selected also had intellectual precedents in “effective schools” approaches, and tended to emphasize school-level factors that fall under the span of managerial control of schools and systems. For several reasons, the quantitative “production function” literature was not purposefully avoided, but was somewhat minimized, while greater emphasis was placed on finding checklists produced by actual managers of projects and districts, and practical checklists used by experts. We limited our research in this way as our approach purposefully focused on how inputs and situations are managed, and less so on which inputs, or how many, are “needed” or are even most cost-effective, to “produce” education. The literature reviewed (as distinct from the bibliography of items cited in this report) is presented in Annex 1. The literature was “filtered” through the following criteria: 1. Was it published in a refereed journal or by a “recognized” institution? 2. Was the study conducted in elementary or secondary schools? 3. Does it have direct developing country relevance? 4. Was the focus on general school effectiveness (i.e., multidimensional)?
8

5. With the exception of a few hallmark studies and other particularly relevant studies, was it published in 2000 or later?
6. Does it include an empirical measure of learning? Only publications passing at least three of these criteria were generally kept and further analyzed as sources of items. A summary of the findings was then produced for key pieces of literature, and the most useful effectiveness indicators derived from each piece of literature were listed. These indicators were then transformed into direct questions or items and placed into an item bank.
3.2. Panel consultation
Parallel to this review, EdData II brought together a panel of experts, users of data, and cooperating agency officials to exchange impressions on “state of the art” and “best practices” approaches regarding the measurement of school management quality. A limited number of panelists met face to face. E-mail exchanges took place with a much larger number of panelists. Some panelists provided only limited input; others contributed at length. A list of panelists is included in Annex 2. Consultation and discussion continues to date. A seminar presenting the SSME instruments and findings was held in Jamaica in mid-September 2008; input from Ministry, teacher and principal organization representatives, and donor and NGO representatives was sought. In addition, Noel McGinn, retired Harvard University Professor of Education; and Massoud Moussavi, retired information technology expert from the World Bank, have taken an interest in using SSME types of data to create a tool that can model the impact of management practices on learning achievement. They led discussion of this sort of application in Peru and Jamaica in 2008. A workshop with the original SSME panelists is planned for fall 2008 in Washington, DC. 4. Field Application Planning and Protocols The processes outlined above together informed the construction of a broadly applicable and valid set of “fresh”—and “refreshed”—straightforward measures of school management effectiveness. At present there are several “levels” at which the tool exists, or is conceptualized. At the broadest level, an item bank of questions and interview topics has been constructed. Thus far it is housed in a basic Microsoft Access database of some 400 items, and its contents are available in Word and Excel formats. If the SSME finds favor and use, this item bank could be maintained and developed on an ongoing basis, and hosted on a permanent website. As officials and researchers apply items and develop new ones, information could be incorporated into the item bank regarding how well certain items and questions perform in helping them analyze their systems’ managerial quality. If the idea gains traction, it may be necessary to maintain the item bank using a more robust software to permit greater record integrity and version control.6
6 The “item bank” of questions is already too large, and too text-laden, to be practicable in an Excel format without great risk of losing data integrity, especially with multiple (even just two) users. An attempt has been made to move
9

The information in the current item bank includes the fields shown in Table 1.
Table 1. Catalogue of data contents of SSME Field name Field descriptor Further description Item code The question or item
number
SD_code Sub-dimension code (see below)
Dimension Broad categorization of the item
1. Pedagogical leadership & management 2. Class & classroom management 3. School management 4. Parent & community involvement in the school 5. District- & system-level support & supervision
Sub-dimension Finer categorization of the dimension (codes keyed to the numbering of the dimension)
101. Teachers’ access to pedagogical advice, support, teamwork 102. Teachers’ instructional practices 103. Learning evaluation practices & feedback 105. School head’s engagement in the school 106. Student engagement in learning 107. Student learning performance 108. Teachers’ pedagogical preparation & training 110. Learning expectations on the part of educators for their students 201. Equipment & materials in the classroom 203. Class composition (by gender, age, grade level, etc.) 204. Student management & discipline in the classroom 207. Use of class time 301. Communication 303. Planning, decision-making, and management teamwork 305. School funding, financial management 306. Infrastructural management 307. Equipment & materials management 308. School head characteristics 311. Personnel management and treatment 312. Student attendance 313. Student management/treatment 314. Time organization & use 319. Overall school characteristics 401. Parents’/community in-kind or financial contribution to the school 402. Parents’/community role in school management & governance 404. Parents’ engagement & investment in own child(ren)’s learning 406. School-initiated communication with parents
the item bank to Access, although this database is still too primitive and not yet fully operational for general consumption; thus, its contents can be made available in Excel (or Word), but in that case it may not be reasonable to call it an “item bank” since this suggests that programming to update and add new items has been done. It would be very risky, from a data integrity and user tracking point of view, to simply open up Excel files to general use and for other analysts to add information. In Access, at least, the basic item bank is “safe,” and rudiments of the necessary programming exist (although work on this has been suspended pending further funding and expression of interest). Updating remains an issue; tracking when and where a given item is used is an issue. These issues can be solved with a little more work.
10

Table 1. Catalogue of data contents of SSME Field name Field descriptor Further description
409. Parents’ perceptions of school quality 501. Financial management & legislation 502. Human resource management 503. Monitoring & supervision 504. Pedagogical advice & support 505. Sectoral planning 506. Educators’ professional development 507. Overall management support provided by district or broader system
Instrument Instruments in which the question belongs
1. Student 2. Teacher 3. School head 4. Class observation 5. Parents and community 6. District officers
Classification Whether question goes into “core” instrument
1. Core 2. Non-core 3. Questionable
Presentation order in instrument
Logic of likely presentation in an instrument
Question Actual question or item Response categories
How response will be or should be coded
Original item source or inspiration
Where in the literature the item comes from
Other relevant comments, special instructions for the questions
Self-explanatory
Indicator “Objective” indicator to be probed in question, e.g., whether records of certain type are kept at school, asking to see them
Respondent or other source of Information
Whether information is based on responder, direct observation, or reading of records
Source: Study design. Not all items in the item bank would be used in any given instrument or application. The idea, then, was to pilot a set of “Core” items, configured into a set of instruments or questionnaires, and that this “Core” would eventually be refined and then applied fairly systematically across applications, with extra items added according to the specific circumstances and interests of each country.
11

The resulting “Core” SSME instrument consists of structured interviews with students, teachers, school heads, parents/guardians, and system supervisors; and school and classroom observation grids. It collects information on pedagogical leadership and management, classroom management, resource and time management at the school, parent and community involvement, and system-level support and supervision. A rapid assessment of children’s early reading skills (Early Grade Reading Assessment, or EGRA), also developed through EdData II, offers one learning outcome measure; others may be added.7 5. Performance of Process and Tool in the Field Trials It is important to note, in the discussion that follows, that the main purpose of pilot efforts in Jamaica and Peru was to test how the tool performs in the field, rather than to reach unassailable policy recommendations about primary schooling for the two pilot countries. The pilot samples were not drawn with sufficient attention to random representative selection to permit completely firm generalizations about primary schooling in either country. However, a sufficient number of schools, and a large enough breadth of schools, were sampled in each country to provide an idea of how the tool would behave under circumstances of a formal, rigorous sampling process. In this sense, the sufficiency of the sample size is achieved to a significant though not perfect degree, since the variance estimates may be somewhat biased. These sampling limitations need to be kept in mind in what follows. It is also important to note that correlations and differences are likely to be more significant, even if the sample was not designed to be totally representative, than the average levels of key variables.
5.1. Process, sampling, and deployment issues
In terms of process, it was of interest to see whether the tool could be reasonably applied, with sufficient faithfulness to original design (and therefore some potential guarantee of standardized application), and with the time and cost of training and deployment kept within the limits of a relatively quick and inexpensive assessment. The results indicate that this is possible. In both Jamaica and Peru there was one week of interaction between EdData II personnel and the local groups carrying out the fieldwork and coding, accompanied by a process of coordination and assistance at a distance involving some e-mailing and a few person-days of work from the EdData II coordinators—amounts that are not unreasonable. In both countries the week of interaction included “pre-piloting” in a few schools prior to the study itself. In Jamaica, drawing of the survey sample began with the selection of seven parishes (out of 14 countrywide) in which the pilot would be implemented. From these parishes, a total of 48 schools—eight schools from each of five parishes, and eight schools from Kingston and St. Andrew combined—were drawn from the Directory of Educational Institutions published by the Ministry of Education and Youth. The final sample included one private school in each parish
7 More information on EGRA can be found in section 5.2.3 and at http://www.eddataglobal.org/documents/index.cfm?fuseaction=showdir&ruid=1&statusID=3. Accessed on August 24, 2008.
12

(with the exception of Kingston); a mix of large and small, urban and rural schools; and at least one shift school8 in each parish. In Peru, there were 64 schools in the pilot, in four departments, with a mix of urban and rural schools appropriate to a pilot test of the instrument (so as to test the instrument under purposefully varied conditions), rather than strictly proportional to population. In each school, the principal or vice principal, a grade 2 teacher and four of that teacher’s students (two boys and two girls), a grade 3 teacher and four of that teacher’s students (two boys and two girls), and one parent were interviewed. Structured observations of both the school and the two classrooms were also carried out. Interviewed students also completed a brief early-grade reading test (similar to the EGRA protocol described in section 5.2.3). While rigorous random sampling was not strictly necessary for the purposes of the pilot in each country, the pilot experience revealed some potential threats to rigorous random sampling that full formal applications will need to address. Authorities in many countries do not always understand the importance of random sampling (e.g., sometimes a principal might push for the most knowledgeable parent to be interviewed, rather than a parent at random), nor do they always understand the notion that, with very small samples, one cannot meaningfully stratify. For example, in some countries, including some special-needs schools in a small sample via stratification or forced selection often merely biases the sample (if no weighting correction is subsequently used) without enabling one to say anything about those schools, because the sample is too small. In Jamaica, for example, private schools were included in the sample so as to allow one to have a sense of how the tool performs in a range of schools, but it is difficult to make meaningful generalizations that subset of schools based on such a small subsample. Furthermore, at the school level, principals and teachers did not always sympathize with the notion of choosing classrooms, teachers, or students at random, and it is not clear whether our samples remain uncontaminated by this sort of interference. Nonetheless, because the purpose of the sampling and the pilot was not to offer statistical representativeness upon which watertight policy or change suggestions could be based, but to test the tool as such, and because it is important to show respect for the principals, the researchers did not stand their ground too firmly on this score. Table 2 presents a brief comparison of the most basic sample characteristics for the two pilot assessments.
Table 2. Basic sample characteristics, Peru and Jamaica pilots Jamaica Peru Schools observed 48 64 Principals/Vice principals interviewed 48 64 Teachers interviewed 91 127 Classrooms observed 91 127 Students interviewed and assessed 374 512
8 A shift school is one where multiple school sessions are held during the day. For example, primary students may use the school facilities in the morning and secondary students may use the facilities in the afternoon.
13
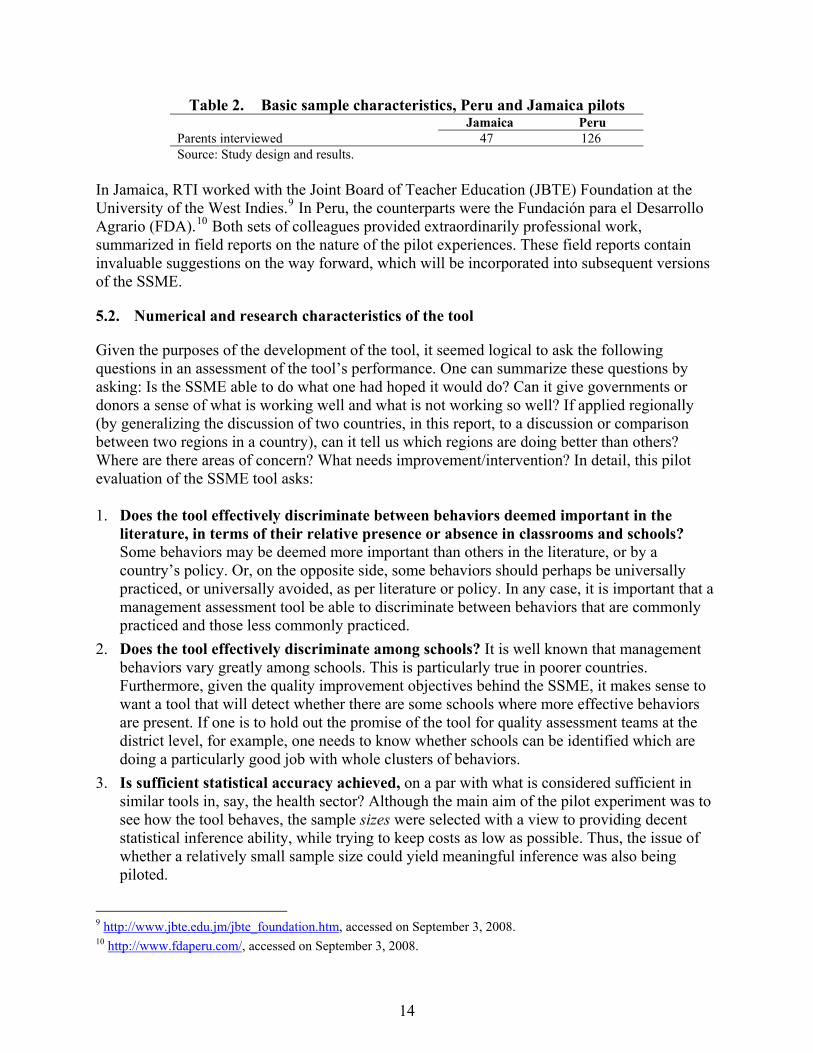
Table 2. Basic sample characteristics, Peru and Jamaica pilots Jamaica Peru Parents interviewed 47 126 Source: Study design and results.
In Jamaica, RTI worked with the Joint Board of Teacher Education (JBTE) Foundation at the University of the West Indies.9 In Peru, the counterparts were the Fundación para el Desarrollo Agrario (FDA).10 Both sets of colleagues provided extraordinarily professional work, summarized in field reports on the nature of the pilot experiences. These field reports contain invaluable suggestions on the way forward, which will be incorporated into subsequent versions of the SSME.
5.2. Numerical and research characteristics of the tool
Given the purposes of the development of the tool, it seemed logical to ask the following questions in an assessment of the tool’s performance. One can summarize these questions by asking: Is the SSME able to do what one had hoped it would do? Can it give governments or donors a sense of what is working well and what is not working so well? If applied regionally (by generalizing the discussion of two countries, in this report, to a discussion or comparison between two regions in a country), can it tell us which regions are doing better than others? Where are there areas of concern? What needs improvement/intervention? In detail, this pilot evaluation of the SSME tool asks: 1. Does the tool effectively discriminate between behaviors deemed important in the
literature, in terms of their relative presence or absence in classrooms and schools? Some behaviors may be deemed more important than others in the literature, or by a country’s policy. Or, on the opposite side, some behaviors should perhaps be universally practiced, or universally avoided, as per literature or policy. In any case, it is important that a management assessment tool be able to discriminate between behaviors that are commonly practiced and those less commonly practiced.
2. Does the tool effectively discriminate among schools? It is well known that management behaviors vary greatly among schools. This is particularly true in poorer countries. Furthermore, given the quality improvement objectives behind the SSME, it makes sense to want a tool that will detect whether there are some schools where more effective behaviors are present. If one is to hold out the promise of the tool for quality assessment teams at the district level, for example, one needs to know whether schools can be identified which are doing a particularly good job with whole clusters of behaviors.
3. Is sufficient statistical accuracy achieved, on a par with what is considered sufficient in similar tools in, say, the health sector? Although the main aim of the pilot experiment was to see how the tool behaves, the sample sizes were selected with a view to providing decent statistical inference ability, while trying to keep costs as low as possible. Thus, the issue of whether a relatively small sample size could yield meaningful inference was also being piloted.
9 http://www.jbte.edu.jm/jbte_foundation.htm, accessed on September 3, 2008. 10 http://www.fdaperu.com/, accessed on September 3, 2008.
14
4. Do the behaviors detected correlate to a reasonable degree with the learning outcome variable selected? The SSME pilots included a simple measure of learning because this is of some interest in and of itself. In addition, while the intent of the tool and the pilot was not to reestablish or validate well-known correlations, found in the literature, between “effective behaviors” and student learning outcomes, it would nonetheless be disconcerting if many of the behaviors chosen for inclusion in the tool on the basis of this literature were not found to correlate with any measure of outcome. Thus, these relationships were tested, not as a further contribution to the literature, but as confirmation of the utility of the tool.
5. A final area of possible interest is whether the tool can discriminate among countries. This would be of more interest to the international cooperating agencies and to researchers than to the countries themselves, of course (although officials in some countries might be curious to have the practices in their systems compared to practices in other systems). It nevertheless seems an interesting question to ask. Unfortunately, a sample of just two, where the instrument has been piloted, both of which are middle-income countries, is not a suitable way to test the tool’s capacities in this regard. Nevertheless, one could try to ascertain whether, even with a sample of two, some aspects that might differentiate between the two countries do stand out.
While these were the questions the SSME pilot team set for itself ex ante, an interesting question to think about, ex post, is whether even this attempt at “quicker, smaller, cheaper” is bigger and more complex than it need be.
5.2.1 Sample of studied behaviors, discrimination between behaviors
Table 3 gives a sample (but a sample only—the table shows only about 20%) of the behaviors the tool can address. It also shows that the tool clearly discriminates between behaviors, within the chosen countries. While the pilot is only a pilot, and hence not representative of the countries, the results are nonetheless interesting. For example, in Peru the pilot took place only within complete (all grades) multiteacher schools (approximately 65% of Peruvian schools, 70% of enrollment), thus leaving aside single-teacher schools and multigrade rural schools, which tend to be among the poorest schools in the country. Thus, the pilot sample is probably biased toward better-off schools. Nonetheless, the tool addresses and singles out important behaviors, such as a rate of 13% nonattendance (official enrollment minus learners present that day) or within-year dropout, relative to official enrollment, on the day of the survey team’s class visit. Attendance as reported by pupils themselves, during the week prior to the survey, shows a 14% absentee rate among students. Among teachers, 11% of teachers appeared to be absent from their classrooms at a time when class was supposed to be in session.11 Repetition rates as calculated by simply asking students what grade they had been in the previous year, and as reported by teachers, averaged 9.4% and 11.4% respectively (against a nationally estimated rate, via the EMIS, of about 15%). It is reassuring to find reasonable consistency here.
11 It may be difficult to judge when teachers are supposed to be in class. This area of the SSME may need further refinement or elimination. Elimination would probably be a bad choice, however, given that time on task is such a critical variable.
15
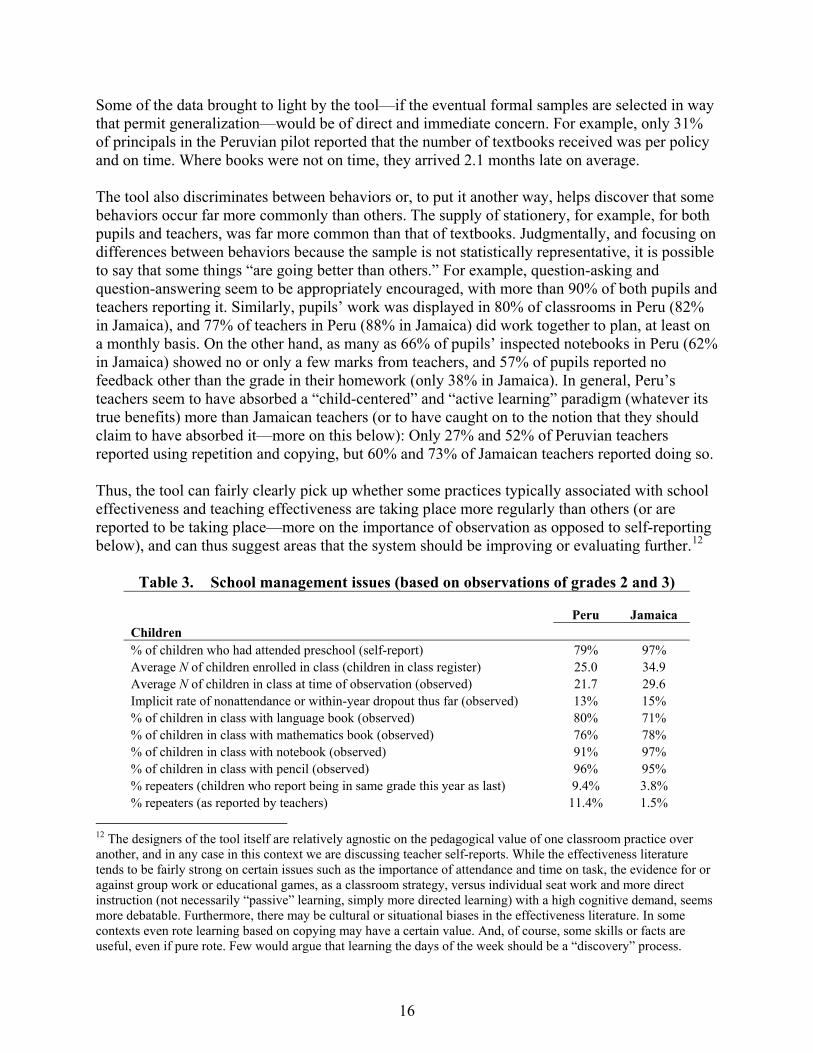
Some of the data brought to light by the tool—if the eventual formal samples are selected in way that permit generalization—would be of direct and immediate concern. For example, only 31% of principals in the Peruvian pilot reported that the number of textbooks received was per policy and on time. Where books were not on time, they arrived 2.1 months late on average. The tool also discriminates between behaviors or, to put it another way, helps discover that some behaviors occur far more commonly than others. The supply of stationery, for example, for both pupils and teachers, was far more common than that of textbooks. Judgmentally, and focusing on differences between behaviors because the sample is not statistically representative, it is possible to say that some things “are going better than others.” For example, question-asking and question-answering seem to be appropriately encouraged, with more than 90% of both pupils and teachers reporting it. Similarly, pupils’ work was displayed in 80% of classrooms in Peru (82% in Jamaica), and 77% of teachers in Peru (88% in Jamaica) did work together to plan, at least on a monthly basis. On the other hand, as many as 66% of pupils’ inspected notebooks in Peru (62% in Jamaica) showed no or only a few marks from teachers, and 57% of pupils reported no feedback other than the grade in their homework (only 38% in Jamaica). In general, Peru’s teachers seem to have absorbed a “child-centered” and “active learning” paradigm (whatever its true benefits) more than Jamaican teachers (or to have caught on to the notion that they should claim to have absorbed it—more on this below): Only 27% and 52% of Peruvian teachers reported using repetition and copying, but 60% and 73% of Jamaican teachers reported doing so. Thus, the tool can fairly clearly pick up whether some practices typically associated with school effectiveness and teaching effectiveness are taking place more regularly than others (or are reported to be taking place—more on the importance of observation as opposed to self-reporting below), and can thus suggest areas that the system should be improving or evaluating further.12
Table 3. School management issues (based on observations of grades 2 and 3) Peru Jamaica Children % of children who had attended preschool (self-report) 79% 97% Average N of children enrolled in class (children in class register) 25.0 34.9 Average N of children in class at time of observation (observed) 21.7 29.6 Implicit rate of nonattendance or within-year dropout thus far (observed) 13% 15% % of children in class with language book (observed) 80% 71% % of children in class with mathematics book (observed) 76% 78% % of children in class with notebook (observed) 91% 97% % of children in class with pencil (observed) 96% 95% % repeaters (children who report being in same grade this year as last) 9.4% 3.8% % repeaters (as reported by teachers) 11.4% 1.5%
12 The designers of the tool itself are relatively agnostic on the pedagogical value of one classroom practice over another, and in any case in this context we are discussing teacher self-reports. While the effectiveness literature tends to be fairly strong on certain issues such as the importance of attendance and time on task, the evidence for or against group work or educational games, as a classroom strategy, versus individual seat work and more direct instruction (not necessarily “passive” learning, simply more directed learning) with a high cognitive demand, seems more debatable. Furthermore, there may be cultural or situational biases in the effectiveness literature. In some contexts even rote learning based on copying may have a certain value. And, of course, some skills or facts are useful, even if pure rote. Few would argue that learning the days of the week should be a “discovery” process.
16
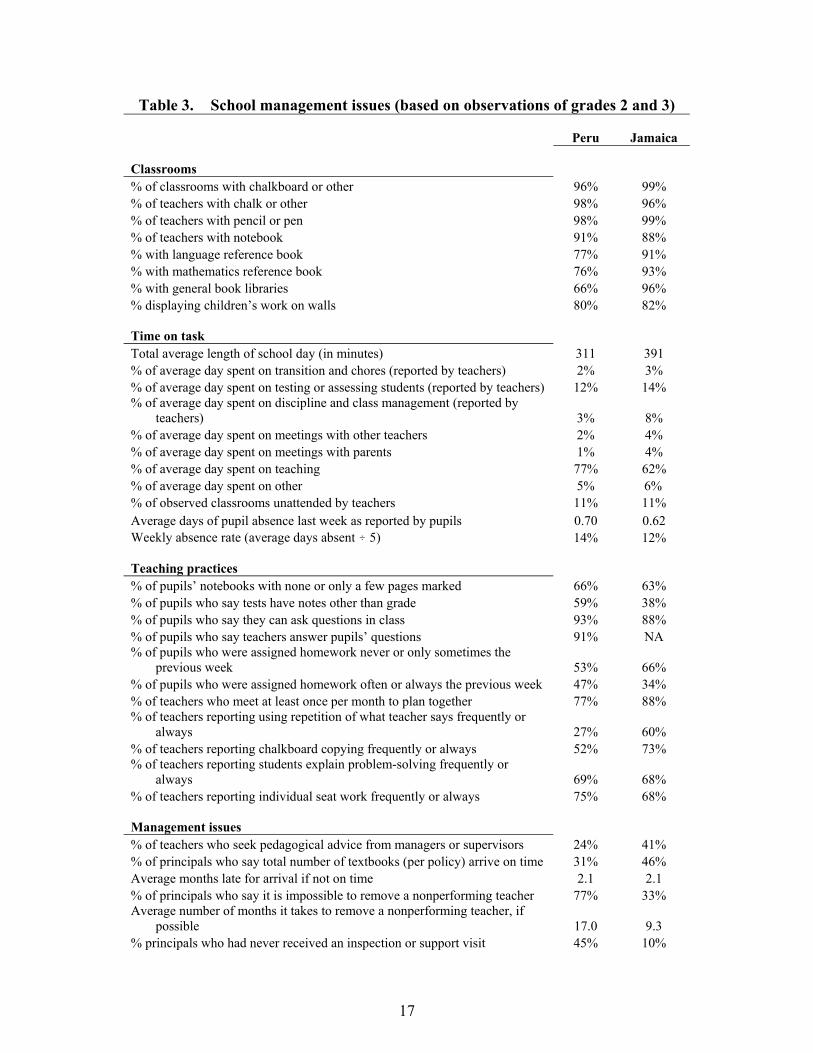
Table 3. School management issues (based on observations of grades 2 and 3) Peru Jamaica Classrooms % of classrooms with chalkboard or other 96% 99% % of teachers with chalk or other 98% 96% % of teachers with pencil or pen 98% 99% % of teachers with notebook 91% 88% % with language reference book 77% 91% % with mathematics reference book 76% 93% % with general book libraries 66% 96% % displaying children’s work on walls 80% 82% Time on task Total average length of school day (in minutes) 311 391 % of average day spent on transition and chores (reported by teachers) 2% 3% % of average day spent on testing or assessing students (reported by teachers) 12% 14% % of average day spent on discipline and class management (reported by
teachers) 3% 8% % of average day spent on meetings with other teachers 2% 4% % of average day spent on meetings with parents 1% 4% % of average day spent on teaching 77% 62% % of average day spent on other 5% 6% % of observed classrooms unattended by teachers 11% 11% Average days of pupil absence last week as reported by pupils 0.70 0.62 Weekly absence rate (average days absent ) 5) 14% 12% Teaching practices % of pupils’ notebooks with none or only a few pages marked 66% 63% % of pupils who say tests have notes other than grade 59% 38% % of pupils who say they can ask questions in class 93% 88% % of pupils who say teachers answer pupils’ questions 91% NA % of pupils who were assigned homework never or only sometimes the
previous week 53% 66% % of pupils who were assigned homework often or always the previous week 47% 34% % of teachers who meet at least once per month to plan together 77% 88% % of teachers reporting using repetition of what teacher says frequently or
always 27% 60% % of teachers reporting chalkboard copying frequently or always 52% 73% % of teachers reporting students explain problem-solving frequently or
always 69% 68% % of teachers reporting individual seat work frequently or always 75% 68% Management issues % of teachers who seek pedagogical advice from managers or supervisors 24% 41% % of principals who say total number of textbooks (per policy) arrive on time 31% 46% Average months late for arrival if not on time 2.1 2.1 % of principals who say it is impossible to remove a nonperforming teacher 77% 33% Average number of months it takes to remove a nonperforming teacher, if
possible 17.0 9.3 % principals who had never received an inspection or support visit 45% 10%
17
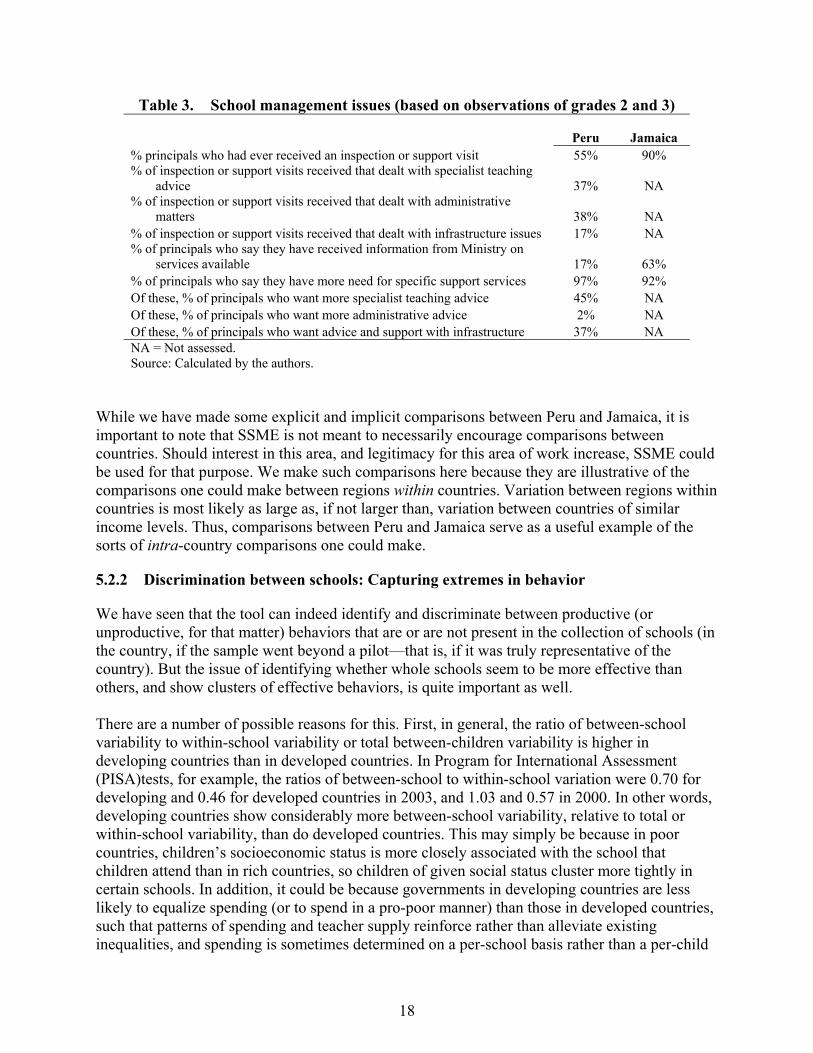
Table 3. School management issues (based on observations of grades 2 and 3) Peru Jamaica % principals who had ever received an inspection or support visit 55% 90% % of inspection or support visits received that dealt with specialist teaching
advice 37% NA % of inspection or support visits received that dealt with administrative
matters 38% NA % of inspection or support visits received that dealt with infrastructure issues 17% NA % of principals who say they have received information from Ministry on
services available 17% 63% % of principals who say they have more need for specific support services 97% 92% Of these, % of principals who want more specialist teaching advice 45% NA Of these, % of principals who want more administrative advice 2% NA Of these, % of principals who want advice and support with infrastructure 37% NA NA = Not assessed. Source: Calculated by the authors.
While we have made some explicit and implicit comparisons between Peru and Jamaica, it is important to note that SSME is not meant to necessarily encourage comparisons between countries. Should interest in this area, and legitimacy for this area of work increase, SSME could be used for that purpose. We make such comparisons here because they are illustrative of the comparisons one could make between regions within countries. Variation between regions within countries is most likely as large as, if not larger than, variation between countries of similar income levels. Thus, comparisons between Peru and Jamaica serve as a useful example of the sorts of intra-country comparisons one could make.
5.2.2 Discrimination between schools: Capturing extremes in behavior
We have seen that the tool can indeed identify and discriminate between productive (or unproductive, for that matter) behaviors that are or are not present in the collection of schools (in the country, if the sample went beyond a pilot—that is, if it was truly representative of the country). But the issue of identifying whether whole schools seem to be more effective than others, and show clusters of effective behaviors, is quite important as well. There are a number of possible reasons for this. First, in general, the ratio of between-school variability to within-school variability or total between-children variability is higher in developing countries than in developed countries. In Program for International Assessment (PISA)tests, for example, the ratios of between-school to within-school variation were 0.70 for developing and 0.46 for developed countries in 2003, and 1.03 and 0.57 in 2000. In other words, developing countries show considerably more between-school variability, relative to total or within-school variability, than do developed countries. This may simply be because in poor countries, children’s socioeconomic status is more closely associated with the school that children attend than in rich countries, so children of given social status cluster more tightly in certain schools. In addition, it could be because governments in developing countries are less likely to equalize spending (or to spend in a pro-poor manner) than those in developed countries, such that patterns of spending and teacher supply reinforce rather than alleviate existing inequalities, and spending is sometimes determined on a per-school basis rather than a per-child
18

basis. Finally, it is also possible that, because of poorer quality control mechanisms, schools in developing countries simply vary among each other in random ways, more than do schools in developed countries; in which case such random between-school variability in practices may overwhelm between-child socioeconomic and other nonschool differences. It may be that, in an unfortunate sense, “the luck of the draw” (as to the quality of a given school) simply matters more in determining children’s life chances in developing countries. This is one reason why quality control needs to be addressed and why tools such as the SSME can be particularly useful: improving educational quality by reducing the element of chance at the bottom of the quality distribution. A second reason to study whether effective behaviors cluster in certain schools is that empirically, even in our own data, the school factor simply matters a great deal. In Peru, for example, using the SSME sample for grade 2, simply knowing which school a child attends, without taking any measurable school or child characteristics into account, can predict a large 41% of the variability among children in a combined score of early-grade reading capability. In Jamaica, this proportion is an even greater 59% in grade 2 (42% in grade 3). This bears repeating: Merely including the school code, without knowing any school characteristics, in an “explanatory” model, and no other variables (no variables pertaining to practices, to socioeconomic background of the children, etc.) at all, explains nearly half of the variation in performance among children. Of course, some of this is a reflection of the fact that there are indeed socioeconomic differences among schools. Nonetheless, it is an important fact that merely knowing the code of a school can predict the performance of the children at that school—a fact that calls for further attention: If results cluster in schools, then something else that produces those results must also cluster in schools. As we will discuss in section 5.2.4, it is possible to use SSME data to construct simple management indices to rank schools by their management behavior. However, in our preliminary research we have not yet identified strong or large clusters of behaviors that are common in clusters of schools. As noted, there is no doubt that some schools are better than others in terms of results, and this certainly in some sense identifies effective schools (subject to value-added considerations: Some schools may appear better simply because they have easier-to-teach children). But finding very strong whole clusters of process or management behaviors that are commonly present (or absent) in whole clusters of schools has proven elusive. That said, the tool can certainly discriminate among schools in terms of particular behaviors that would need to be corrected; and some clustering of behaviors, although weak, can also be found. Both of these qualities or capacities of the tool are useful. In terms of clustering of behaviors, for example, we found that one can identify at least some behaviors that tend to cluster in certain schools. For example, 11% of the students had teachers whose behaviors clustered in a positive way, in that all of three key or “marker” behaviors (teachers marking tests with marks other than the grade, frequently assigning homework, and marking most of students’ notebooks) were found frequently in the child’s teacher feedback or homework practices for all of those children. Interestingly, teachers showing these behaviors tended to be the ones offering lessons for pay. But 30% of children in Jamaica had teachers for whom the three behaviors could be seen to cluster together: Teachers seldom marked tests with anything other than the grade, teachers never or seldom assigned homework, and teachers
19

infrequently marked students’ notebooks.13 (In the middle 60% or so of classrooms, only one or two behaviors were missing or present rather than none or all three.) That all this is to a large degree a teacher practice, and not a random factor spread out over individual children, can be seen in that the teacher “treatment” (i.e., merely using the classroom ID as an explanatory factor) explains 61% of the between-student variance in these three clustered behaviors. In Peru, the behaviors clustered negatively on only 11% or so of the children, and positively in 10% of the children, with 59% of the variability among children being explained by the individual teacher as a “treatment.” While informative and suggestive, this kind of clustering could not be found around a very broad swathe of behaviors. Important individual behaviors do of course strongly discriminate among schools. Thus, for example, teaching time in the classroom (self-reported by the teachers in this case, but useful nonetheless to isolate extremes), a behavior widely acknowledged to be important for learning, shows considerable variation such that it is possible to pick out schools or classrooms providing teaching time much below the average. In Jamaica, for example the (self-reported) average was a fairly “respectable” 4 hours, but the bottom 10% of classrooms were providing 2.75 hours (165 minutes) or less. In Peru, in slight contrast but still problematic, the bottom 10% of schools were providing 3.17 hours (190 minutes) or less, with the average school providing exactly the same amount of time as in Jamaica. Similarly, in Peru, while the classroom observation instrument showed that during “only” 11% of observation moments were classrooms unattended by the teachers at a time when class was supposed to be in session, the bottom 10% of schools on this measure averaged about 31% (nearly a third) of classroom observation moments during which teachers were absent from the classroom when class was supposed to be in session. The data for Jamaica are again remarkably similar: In the “worst” 10% of schools, 33% of the classroom observation moments showed a classroom unattended at a time when the classroom was supposed to be in session. Another key variable (this one operating at the individual child level, although illustrating the importance of variability and the instrument’s ability to detect it), widely acknowledged to matter in driving student achievement, is student absenteeism. While students reported missing, on average, “only” 12% of school days in the previous week (“only” is placed in quotation marks because 12% is of sufficient concern), the extremes are significant: 8% of the children studied said they had been absent three days or more, or 60% or more of time, during the week prior to the survey. The pattern in Peru is remarkably similar: While “only” 14% of school days were missed on average, 8% of children had missed three days or more during the week before the survey.14
13 One has to take care in interpreting these factors or behaviors as “negative” or as signs of lack of teacher concern, and in inferring cause and effect: Some teachers may not comment much on students’ work because the work is so good, or may not assign much homework because the children are doing so well—these kinds of effects are known to plague all correlational studies. On the other hand, one of the challenges for quality control in developing countries is that, because of the lack of standards, teachers’ perception of how well their children are doing often has a low threshold and is inconsistent with what the system desires. In general, however, lack of marks and feedback is indeed correlated with poorer results (p = 0.0009 in Jamaica, p = 0.06 in Peru). 14 The survey did not ask whether this attendance pattern was customary for these particular children; that is, it may be that some children were absent a lot one week, but one cannot infer that this is damaging their learning, if the pattern is not habitual. Thus, all one knows is that some children missed a lot of school the previous week, but one
20

Other examples could be given, but these suffice: The tool seems to be able to capture extremes in behavior that are useful both for monitoring and for assessing system performance.
5.2.3 Performance of the reading component
It was hypothesized, during the design of the SSME, that a survey of school management issues, even if meant to be fast and economical, should attempt to directly ascertain some element of school quality by looking at actual learning outcomes, for two reasons. First, outcomes ultimately matter a great deal; certainly they matter more than whether the school is practicing or not practicing one or a few out of several dozen useful process or management behaviors. In a sense, even one single outcome is a very parsimonious and “leveraged” proxy for process quality (something must be going right if the school has good results—holding learner preparedness and socioeconomic status constant), as well as being an index of ultimate quality. Thus there is a prima facie case for including a simple measure of outcomes. But, secondly, while the SSME does not, in the least, attempt to add to, or validate, the literature on the determinants of outcomes, and instead simply uses and relies on that literature, it is nonetheless true that if the pilot survey were unable to find any relationships between any of the managerial behaviors observed and some outcomes, then the case for the utility of the tool would not be quite as strong. For those reasons, it was decided to use a simple oral reading assessment of a random sample of early grade students. This assessment is similar to and related to the EGRA, also funded and sponsored by USAID (and the World Bank, among others). EGRA is an oral reading assessment, which is applied individually to children, and which focuses on direct, timed performance, rather than multiple choices. There are various versions of the instrument, but the one used in Jamaica and Peru, for example, under SSME, includes: 1. Does the child know the letters? Letter-naming fluency per minute. 2. Can the child read validly constructed but invented words (or nonfamiliar words)? Invented
or nonfamiliar word fluency in correct words per minute. Aimed at testing children’s ability to decode new words.
3. Can the child read and understand a simple passage? Fluency in reading connected text telling a simple story, and ability to answer some questions regarding the text.
4. Oral comprehension. Ability to hear a simple story and understand it. Assesses a key pre-reading skill.
The application in Peru also included the following aspects: 5. Orientation to print. Does the child know where to start reading, to read left-to-right, that
most text is arranged in sequential lines, etc.?
does not know whether it was the same children over many weeks. Evidently the latter would be the more worrying problem. This flaw in the instrument could be improved in future versions.
21

6. Does the child read common words? Familiar word reading fluency in correct words read in one minute.
7. Dictation. Assesses ability to write simple words, as ability to write and to read are well correlated.
EGRA, or some version of it, has been applied in at least a dozen countries by colleagues in a community of practice that has emerged around the EGRA tool, and it has been discussed and presented at large international events and workshops. While no assessment is perfect for every purpose, EGRA is seen as a promising tool for various purposes. A large international gathering that examined EGRA was sponsored in March 2008 by USAID, the World Bank, and RTI International. The website prepared for this gathering includes many presentations pertaining to other country applications as well as various theoretical and practical follow-up considerations.15 Other organizations are using, or at least discussing, similar approaches. For example, UNESCO’s Literacy Assessment and Monitoring Programme (LAMP) approach focuses on very similar abilities, such as recognition of letters, recognition of familiar words, ability to decode nonfamiliar or invented words, and so on. More information on these LAMP components can be found at the LAMP website.16 The reading assessment performs reasonably well, by most standards. In Peru, the whole EGRA portion had an alpha coefficient of 0.80 in grade 2, if all components are included.17 An assessment is generally considered reliable if the alpha coefficient is around 0.80 or above, although some analysts put the cutoff point at 0.70. If one restricts the test to some “core” components (letter recognition, familiar words, nonwords, connected text fluency, and comprehension of connected text), the reliability goes up to 0.87—quite respectable. A principal components analysis of the same “core” components shows that the first component captures 64% of the total variance. This is a little lower than one would like to see, but, on the other hand, the loadings on all the variables on the first factor are uniform, and the first factor explains a lot more variance than the second factor (64% versus 14%), which does suggest that there is a fairly unified main factor (generalized reading ability as assessed by fluency and simple comprehension) that the assessment does capture. The results for Jamaica were almost exactly the same: an alpha of 0.84, a first factor that captures 67% of the variance, a second factor that captures only 18% of the variance, and largely uniform loadings on the first factor. The similar behavior of the assessment in the two countries strengthens the already strong sense that (a) there is a generalized, more or less unitary, reading and decoding ability being assessed (albeit not necessarily a very advanced one; that is, the unitary ability is appropriate for the early grades); and (b) the assessment is fairly reliable across children.
15 At http://web.worldbank.org/WBSITE/EXTERNAL/TOPICS/EXTEDUCATION/0,,contentMDK:21708903~menuPK:282428~pagePK:64020865~piPK:51164185~theSitePK:282386,00.html. Accessed on August 24, 2008. 16 At http://www.uis.unesco.org/ev.php?ID=6412_201&ID2=DO_TOPIC. Accessed on August 24, 2008. 17 In both countries, children in grades 2 and 3 were assessed. Given that all of the statistical measures related to EGRA are essentially based on correlations between items across children, doing the analysis with both grades pooled versus doing the analysis grade by grade does not affect the results very much at all. We have chosen to discuss the results based on an analysis of separate grades.
22
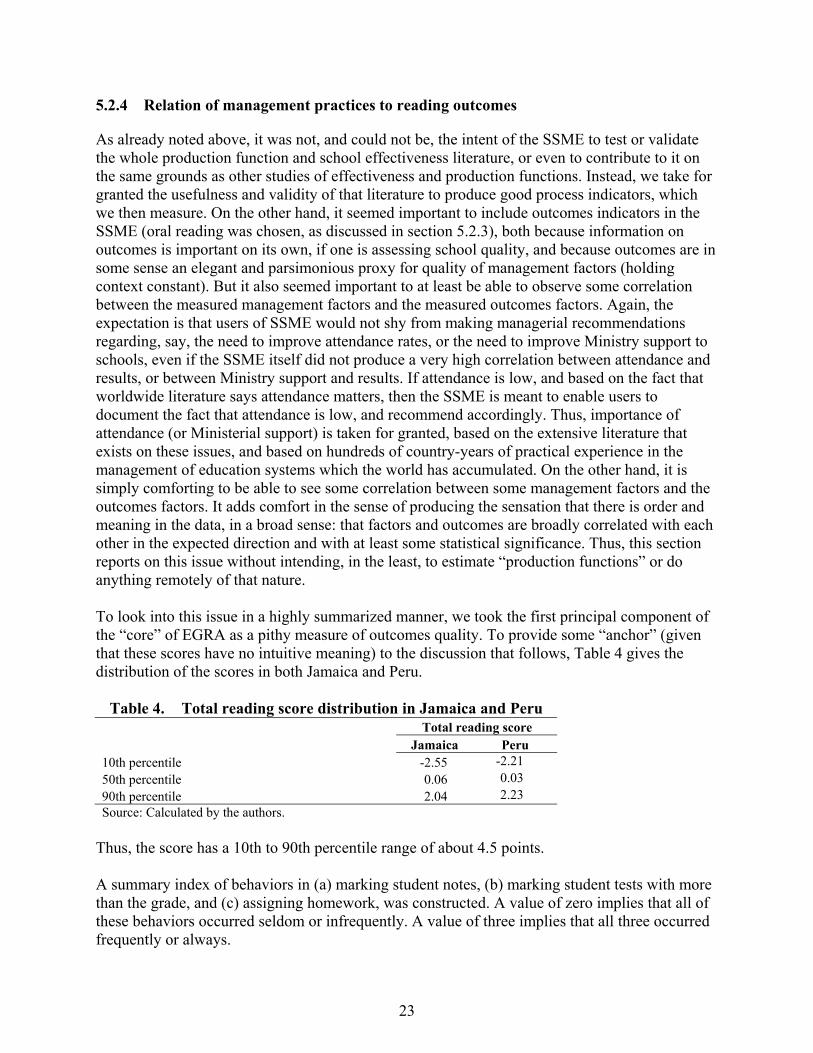
5.2.4 Relation of management practices to reading outcomes
As already noted above, it was not, and could not be, the intent of the SSME to test or validate the whole production function and school effectiveness literature, or even to contribute to it on the same grounds as other studies of effectiveness and production functions. Instead, we take for granted the usefulness and validity of that literature to produce good process indicators, which we then measure. On the other hand, it seemed important to include outcomes indicators in the SSME (oral reading was chosen, as discussed in section 5.2.3), both because information on outcomes is important on its own, if one is assessing school quality, and because outcomes are in some sense an elegant and parsimonious proxy for quality of management factors (holding context constant). But it also seemed important to at least be able to observe some correlation between the measured management factors and the measured outcomes factors. Again, the expectation is that users of SSME would not shy from making managerial recommendations regarding, say, the need to improve attendance rates, or the need to improve Ministry support to schools, even if the SSME itself did not produce a very high correlation between attendance and results, or between Ministry support and results. If attendance is low, and based on the fact that worldwide literature says attendance matters, then the SSME is meant to enable users to document the fact that attendance is low, and recommend accordingly. Thus, importance of attendance (or Ministerial support) is taken for granted, based on the extensive literature that exists on these issues, and based on hundreds of country-years of practical experience in the management of education systems which the world has accumulated. On the other hand, it is simply comforting to be able to see some correlation between some management factors and the outcomes factors. It adds comfort in the sense of producing the sensation that there is order and meaning in the data, in a broad sense: that factors and outcomes are broadly correlated with each other in the expected direction and with at least some statistical significance. Thus, this section reports on this issue without intending, in the least, to estimate “production functions” or do anything remotely of that nature. To look into this issue in a highly summarized manner, we took the first principal component of the “core” of EGRA as a pithy measure of outcomes quality. To provide some “anchor” (given that these scores have no intuitive meaning) to the discussion that follows, Table 4 gives the distribution of the scores in both Jamaica and Peru.
Table 4. Total reading score distribution in Jamaica and Peru Total reading score Jamaica Peru 10th percentile -2.55 -2.21 50th percentile 0.06 0.03 90th percentile 2.04 2.23 Source: Calculated by the authors.
Thus, the score has a 10th to 90th percentile range of about 4.5 points. A summary index of behaviors in (a) marking student notes, (b) marking student tests with more than the grade, and (c) assigning homework, was constructed. A value of zero implies that all of these behaviors occurred seldom or infrequently. A value of three implies that all three occurred frequently or always.
23

The relationship between this management index and the total reading score, a synthetic summary of some key relationships, then looks as depicted in Figure 1, where the horizontal axis displays the number of positive management behaviors, and the vertical axis displays the summary reading score. Students facing all three positive behaviors had scores about 0.8 higher (out of a p 10–p 90 range of about 4.5) than those who faced none of these behaviors. Recall that some 30% of children in Jamaica, and 11% in Peru, were facing conditions in which none of these behaviors was being practiced. Figure 1. Management behaviors and learning outcomes
-1.00
-0.50
0.00
0.50
1.00
1.50
2.00
0 1 2 3
Jamaica, Grade 2
Peru, Grade 3
The same sorts of results can be shown for single rather than composite variables. For example, the practice of marking students’ work discriminates between students’ total scores, as shown in Figure 2.18
18 Note that in Figure 1 we have included data for second graders from Jamaica and for third graders from Peru to show the progression in student performance across the grades. In Figure 2, we have depicted third graders from Jamaica and second graders from Peru.
24
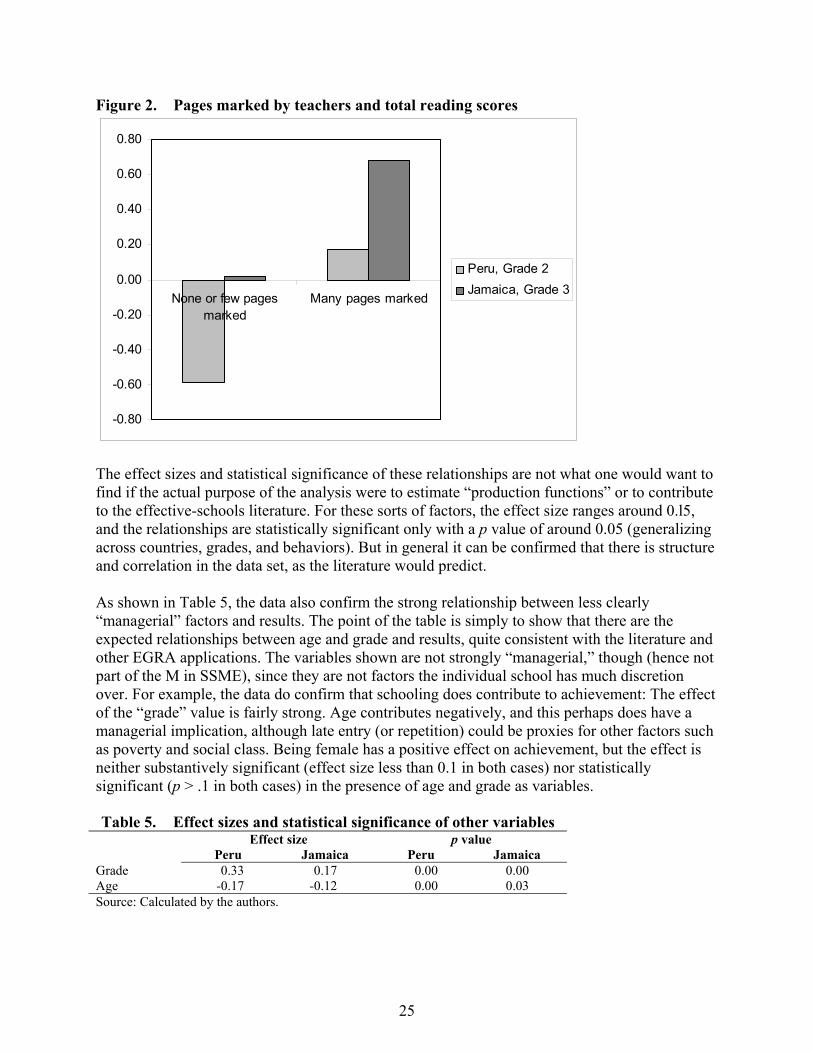
Figure 2. Pages marked by teachers and total reading scores
-0.80
-0.60
-0.40
-0.20
0.00
0.20
0.40
0.60
0.80
None or few pagesmarked
Many pages marked
Peru, Grade 2Jamaica, Grade 3
The effect sizes and statistical significance of these relationships are not what one would want to find if the actual purpose of the analysis were to estimate “production functions” or to contribute to the effective-schools literature. For these sorts of factors, the effect size ranges around 0.l5, and the relationships are statistically significant only with a p value of around 0.05 (generalizing across countries, grades, and behaviors). But in general it can be confirmed that there is structure and correlation in the data set, as the literature would predict. As shown in Table 5, the data also confirm the strong relationship between less clearly “managerial” factors and results. The point of the table is simply to show that there are the expected relationships between age and grade and results, quite consistent with the literature and other EGRA applications. The variables shown are not strongly “managerial,” though (hence not part of the M in SSME), since they are not factors the individual school has much discretion over. For example, the data do confirm that schooling does contribute to achievement: The effect of the “grade” value is fairly strong. Age contributes negatively, and this perhaps does have a managerial implication, although late entry (or repetition) could be proxies for other factors such as poverty and social class. Being female has a positive effect on achievement, but the effect is neither substantively significant (effect size less than 0.1 in both cases) nor statistically significant (p > .1 in both cases) in the presence of age and grade as variables.
Table 5. Effect sizes and statistical significance of other variables Effect size p value Peru Jamaica Peru Jamaica Grade 0.33 0.17 0.00 0.00 Age -0.17 -0.12 0.00 0.03 Source: Calculated by the authors.
25

5.2.5 The importance of observation versus self-reporting
A well-known problem with survey research is the tendency for participants to respond how they think the enumerator would like them to respond, or to respond in a manner that is consistent with what they have been told is “good” behavior. Thus, more voters of every background might say they would vote for a candidate from an ethnic minority than really would vote for such a candidate. Similarly, the percentage of respondents who would admit to being absent from work, when they know they should be at work, is probably smaller than the percentage of respondents who are not at work at any given time when they should be. Teachers around the world have, by now, been told that “active learning” and “learner-centered education” are better than “chalk-and-talk” or “teacher-centered” education. The scientific merits of such distinctions, and the optimal mix of methods, are complex issues that are not relevant here. But it is relevant to note that, if simply asked, teachers might overstate the degree to which they practice certain methods they have been told are the “modern” and “good” methods. Or, if one relies on simply asking teachers whether they are always in the classroom when they are supposed to be, one may get a biased estimation of the actual degree of presence in the classroom. Thus, the SSME relies on actual observation, to some degree. Unfortunately, actual observation is extremely expensive and also technically challenging. Thus, for the pilot assessments, it was not possible to rely on observation for all key issues. The SSME pilots restricted actual observation to a few important issues, such as teaching method, teacher feedback, availability of pedagogical materials, the condition of school infrastructure and, to some degree, gross estimates of time on task. By using both self-report and observation, the SSME also affords the opportunity to compare (to some degree) reported behavior to observed behavior. This ability to (approximately) compare reported and observed behaviors might be a useful methodological contribution. Thus, the findings generally indicate that teachers had knowledge of what is deemed appropriate teaching methodology, but there was a notable contrast between teachers’ reports of their beliefs and practice and observed practice in their classrooms. For example, teachers reported both relatively high use of active-learning practices and appreciation for the usefulness of such practices. Among teachers in Jamaica, 47% said that their students engaged in learning games frequently or daily, and 77% stated their students solved problems on the blackboard frequently or every day (34% and 80% respectively in Peru). However, the observed frequency of these and other active engagement activities was relatively low. On a scale of 0 to 3 for classroom observations, the rating for educational game-playing was 0.11 in Jamaica, and for blackboard work 0.21 (0.31 and 0.3 respectively in Peru). In contrast, student copy-work received an observation score of 1.03 in Jamaica (and 1.37 in Peru). This finding suggests that teachers generally know what is expected of them, and state this, but they practice these expected behaviors only to some degree. Before one can come to firmer conclusions on this, however, the correspondence between the self-reporting and observational aspects of the SSME might need to be fine-tuned, so that the behaviors match more closely. Observation, more strongly than self-reporting, also yields some interesting correlations that are tantalizing and suggestive about how teachers interpret and implement the presumably more learner-centered or active methodologies. For example, it is often alleged anecdotally that after “child centered” reforms, teachers sometimes interpret group work, or discovery methods, or the
26

notion that “the teacher should not be the center of learning but the facilitator of the learning,” as excuses to disengage and lower the intensity of their work, while it is known that group work, in theory, is supposed to be strongly supervised by an engaged teacher. There is confirmation of some of these ideas in SSME. For example, using data from Peru, one can note that the time-use correlation most strongly (but negatively) correlated with learner outcomes was time spent by teachers talking to other teachers (during class time), which shows a –0.30 correlation with learning outcomes. And one of the highest positive correlations between time factors was the correlation between time spent by teachers talking to other teachers during class, and time spent by learners on (presumably) observed frequency of educational games in the classroom, at 0.44. The frequency of such behavior was not high enough to be alarming, but the correlations are interesting because they suggest something about how teachers use their time. Observation similarly makes it more plausible to draw correlations between types of learner behaviors to see whether more traditional behaviors tend to cluster with each other. Thus, again in Peru, for example, the correlation between observed individual work and copy-work was 0.51, implying that more or less traditionalist methods seem to cluster, as one would expect. Similar findings can be reported from Jamaica. As the literature would predict, observed student copy-work is negatively correlated with learning outcomes, whereas observed student composition is positively correlated with outcomes. Interestingly, observed student copy-work is highly correlated with observed teacher desk-work, implying a sort of clustering of negative factors that imply teacher unavailability to the students combined with students doing relatively unproductive busy-work. As noted, however, observation turns out to be expensive, although it is powerful, particularly when it serves to isolate clusters of behaviors that correlate with each other and with outcomes, and can thus drive recommendations.
5.2.6 Cost-effectiveness and reliability of SSME applications
The SSME tries to do more than a brief “walkabout” of schools, but at lower cost than is usually incurred by the usual, fairly massive study with hundreds of schools and variables. Obviously, the tool cannot produce the statistical reliability or accuracy of knowledge that a large-scale, expensive study can. The question then arises as to whether SSME is in some way a reasonably efficient compromise between a “walkabout” and a more expensive study, and is suited to purpose. To answer this question requires that one look at the statistical characteristics of the results, particularly at the child level, and that one quantify the cost of increasing the accuracy. Table 6 helps with a discussion of the first of these two issues. In general, the idea that SSME can provide estimates that are 10 points wide, with 90% confidence, with sample sizes of somewhere around 50 to 70 schools, two classrooms (and teachers) per school, and four to five children per grade per school, is confirmed. For example, the proportion of children with some form of preschool can be estimated with 90% confidence as between 74% and 84% in Peru, and 95% to 98% in Jamaica, and one can do more or less similarly for other variables, such as the percentage of children with textbooks. The statistical characteristics also need to be analyzed based on the assumption that schools are the primary sampling unit or cluster, and that children are then sampled within schools. In some sense the most important point of analysis is the child. Because the schools are used to sample
27
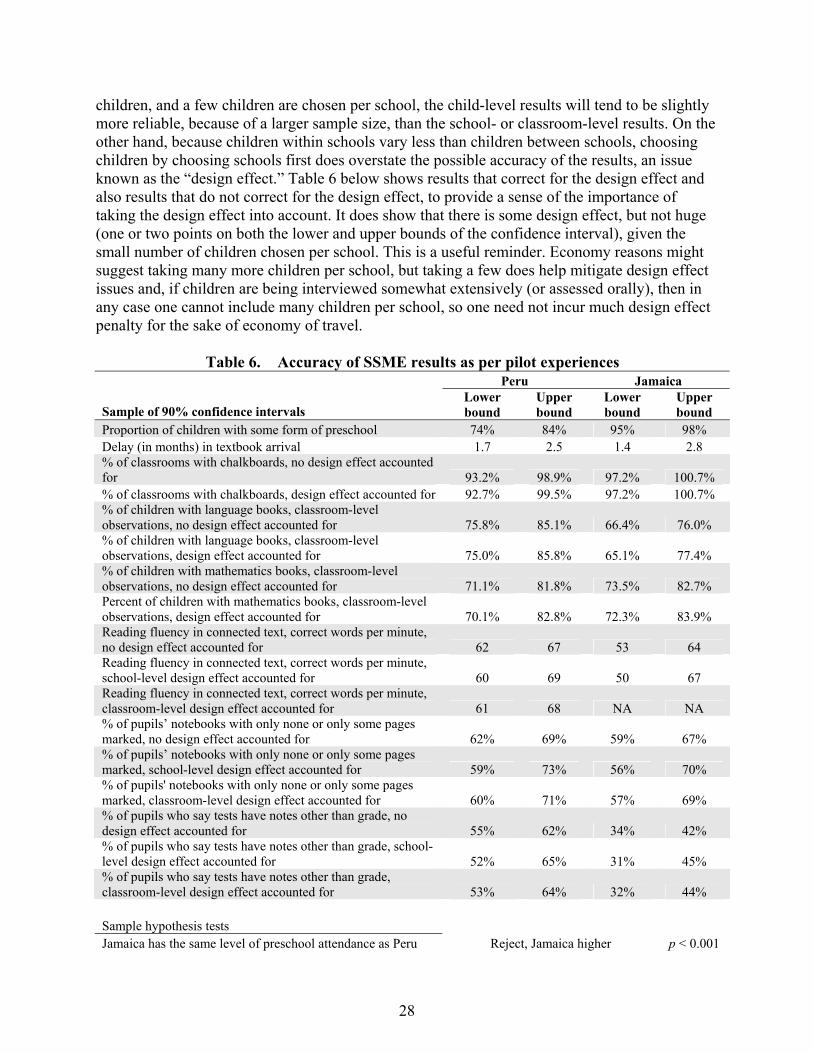
children, and a few children are chosen per school, the child-level results will tend to be slightly more reliable, because of a larger sample size, than the school- or classroom-level results. On the other hand, because children within schools vary less than children between schools, choosing children by choosing schools first does overstate the possible accuracy of the results, an issue known as the “design effect.” Table 6 below shows results that correct for the design effect and also results that do not correct for the design effect, to provide a sense of the importance of taking the design effect into account. It does show that there is some design effect, but not huge (one or two points on both the lower and upper bounds of the confidence interval), given the small number of children chosen per school. This is a useful reminder. Economy reasons might suggest taking many more children per school, but taking a few does help mitigate design effect issues and, if children are being interviewed somewhat extensively (or assessed orally), then in any case one cannot include many children per school, so one need not incur much design effect penalty for the sake of economy of travel.
Table 6. Accuracy of SSME results as per pilot experiences Peru Jamaica
Sample of 90% confidence intervals Lower bound
Upper bound
Lower bound
Upper bound
Proportion of children with some form of preschool 74% 84% 95% 98% Delay (in months) in textbook arrival 1.7 2.5 1.4 2.8 % of classrooms with chalkboards, no design effect accounted for 93.2% 98.9% 97.2% 100.7% % of classrooms with chalkboards, design effect accounted for 92.7% 99.5% 97.2% 100.7% % of children with language books, classroom-level observations, no design effect accounted for 75.8% 85.1% 66.4% 76.0% % of children with language books, classroom-level observations, design effect accounted for 75.0% 85.8% 65.1% 77.4% % of children with mathematics books, classroom-level observations, no design effect accounted for 71.1% 81.8% 73.5% 82.7% Percent of children with mathematics books, classroom-level observations, design effect accounted for 70.1% 82.8% 72.3% 83.9% Reading fluency in connected text, correct words per minute, no design effect accounted for 62 67 53 64 Reading fluency in connected text, correct words per minute, school-level design effect accounted for 60 69 50 67 Reading fluency in connected text, correct words per minute, classroom-level design effect accounted for 61 68 NA NA % of pupils’ notebooks with only none or only some pages marked, no design effect accounted for 62% 69% 59% 67% % of pupils’ notebooks with only none or only some pages marked, school-level design effect accounted for 59% 73% 56% 70% % of pupils' notebooks with only none or only some pages marked, classroom-level design effect accounted for 60% 71% 57% 69% % of pupils who say tests have notes other than grade, no design effect accounted for 55% 62% 34% 42% % of pupils who say tests have notes other than grade, school-level design effect accounted for 52% 65% 31% 45% % of pupils who say tests have notes other than grade, classroom-level design effect accounted for 53% 64% 32% 44% Sample hypothesis tests Jamaica has the same level of preschool attendance as Peru Reject, Jamaica higher p < 0.001
28
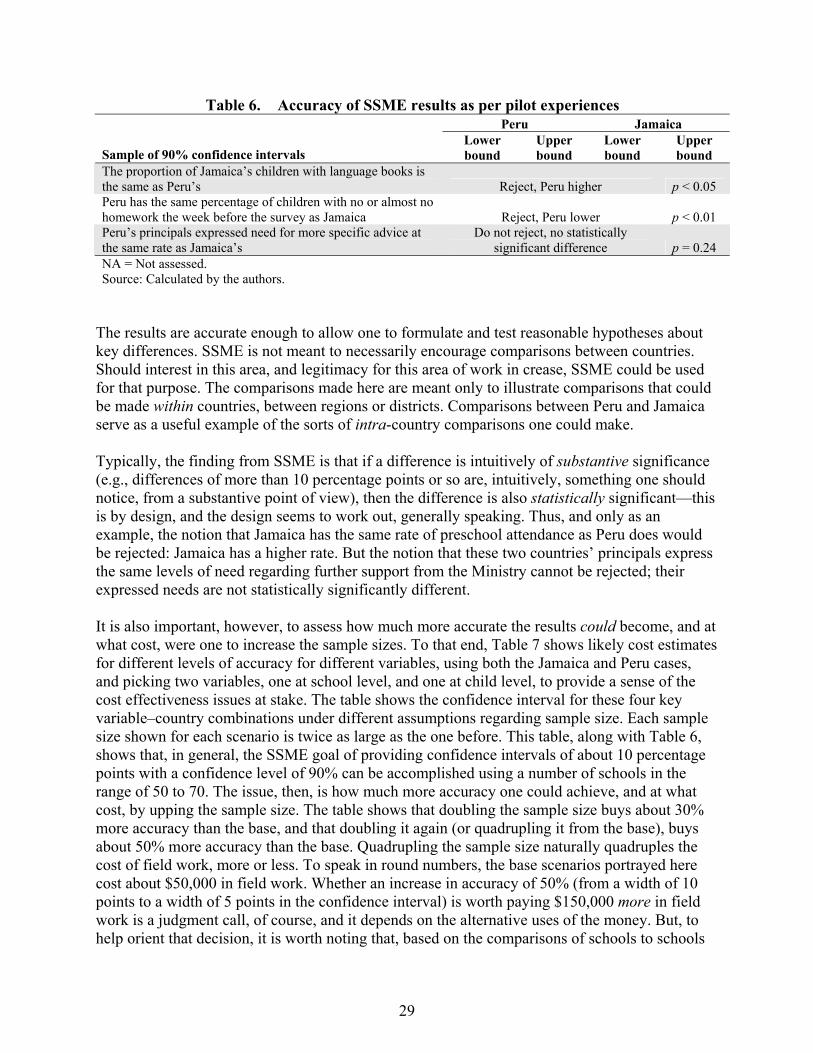
Table 6. Accuracy of SSME results as per pilot experiences Peru Jamaica
Sample of 90% confidence intervals Lower bound
Upper bound
Lower bound
Upper bound
The proportion of Jamaica’s children with language books is the same as Peru’s Reject, Peru higher p < 0.05 Peru has the same percentage of children with no or almost no homework the week before the survey as Jamaica Reject, Peru lower p < 0.01 Peru’s principals expressed need for more specific advice at the same rate as Jamaica’s
Do not reject, no statistically significant difference p = 0.24
NA = Not assessed. Source: Calculated by the authors.
The results are accurate enough to allow one to formulate and test reasonable hypotheses about key differences. SSME is not meant to necessarily encourage comparisons between countries. Should interest in this area, and legitimacy for this area of work in crease, SSME could be used for that purpose. The comparisons made here are meant only to illustrate comparisons that could be made within countries, between regions or districts. Comparisons between Peru and Jamaica serve as a useful example of the sorts of intra-country comparisons one could make. Typically, the finding from SSME is that if a difference is intuitively of substantive significance (e.g., differences of more than 10 percentage points or so are, intuitively, something one should notice, from a substantive point of view), then the difference is also statistically significant—this is by design, and the design seems to work out, generally speaking. Thus, and only as an example, the notion that Jamaica has the same rate of preschool attendance as Peru does would be rejected: Jamaica has a higher rate. But the notion that these two countries’ principals express the same levels of need regarding further support from the Ministry cannot be rejected; their expressed needs are not statistically significantly different. It is also important, however, to assess how much more accurate the results could become, and at what cost, were one to increase the sample sizes. To that end, Table 7 shows likely cost estimates for different levels of accuracy for different variables, using both the Jamaica and Peru cases, and picking two variables, one at school level, and one at child level, to provide a sense of the cost effectiveness issues at stake. The table shows the confidence interval for these four key variable–country combinations under different assumptions regarding sample size. Each sample size shown for each scenario is twice as large as the one before. This table, along with Table 6, shows that, in general, the SSME goal of providing confidence intervals of about 10 percentage points with a confidence level of 90% can be accomplished using a number of schools in the range of 50 to 70. The issue, then, is how much more accuracy one could achieve, and at what cost, by upping the sample size. The table shows that doubling the sample size buys about 30% more accuracy than the base, and that doubling it again (or quadrupling it from the base), buys about 50% more accuracy than the base. Quadrupling the sample size naturally quadruples the cost of field work, more or less. To speak in round numbers, the base scenarios portrayed here cost about $50,000 in field work. Whether an increase in accuracy of 50% (from a width of 10 points to a width of 5 points in the confidence interval) is worth paying $150,000 more in field work is a judgment call, of course, and it depends on the alternative uses of the money. But, to help orient that decision, it is worth noting that, based on the comparisons of schools to schools
29
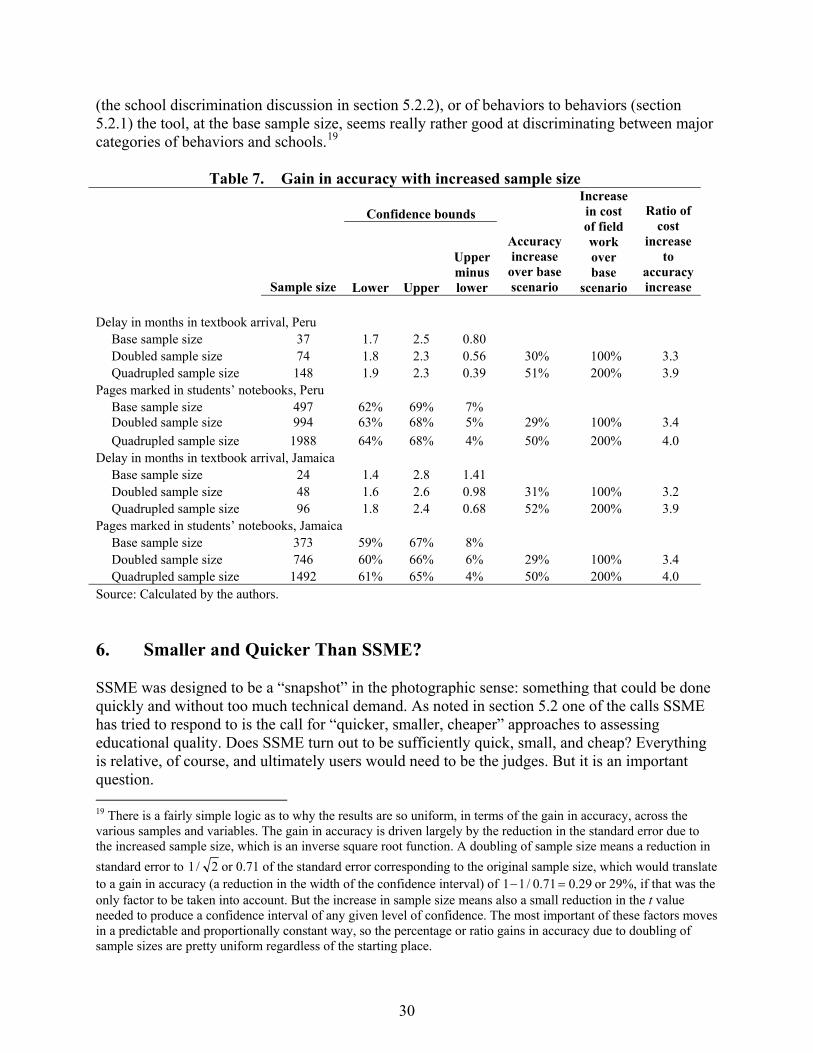
(the school discrimination discussion in section 5.2.2), or of behaviors to behaviors (section 5.2.1) the tool, at the base sample size, seems really rather good at discriminating between major categories of behaviors and schools.19
Table 7. Gain in accuracy with increased sample size
Confidence bounds
Sample size Lower Upper
Upper minus lower
Accuracy increase
over base scenario
Increase in cost of field work over base
scenario
Ratio of cost
increase to
accuracy increase
Delay in months in textbook arrival, Peru Base sample size 37 1.7 2.5 0.80 Doubled sample size 74 1.8 2.3 0.56 30% 100% 3.3 Quadrupled sample size 148 1.9 2.3 0.39 51% 200% 3.9 Pages marked in students’ notebooks, Peru Base sample size 497 62% 69% 7% Doubled sample size 994 63% 68% 5% 29% 100% 3.4 Quadrupled sample size 1988 64% 68% 4% 50% 200% 4.0 Delay in months in textbook arrival, Jamaica Base sample size 24 1.4 2.8 1.41 Doubled sample size 48 1.6 2.6 0.98 31% 100% 3.2 Quadrupled sample size 96 1.8 2.4 0.68 52% 200% 3.9 Pages marked in students’ notebooks, Jamaica Base sample size 373 59% 67% 8% Doubled sample size 746 60% 66% 6% 29% 100% 3.4 Quadrupled sample size 1492 61% 65% 4% 50% 200% 4.0 Source: Calculated by the authors. 6. Smaller and Quicker Than SSME? SSME was designed to be a “snapshot” in the photographic sense: something that could be done quickly and without too much technical demand. As noted in section 5.2 one of the calls SSME has tried to respond to is the call for “quicker, smaller, cheaper” approaches to assessing educational quality. Does SSME turn out to be sufficiently quick, small, and cheap? Everything is relative, of course, and ultimately users would need to be the judges. But it is an important question. 19 There is a fairly simple logic as to why the results are so uniform, in terms of the gain in accuracy, across the various samples and variables. The gain in accuracy is driven largely by the reduction in the standard error due to the increased sample size, which is an inverse square root function. A doubling of sample size means a reduction in standard error to 2/
29.071.0/11 or 0.71 of the standard error corresponding to the original sample size, which would translate
to a gain in accuracy (a reduction in the width of the confidence interval) of 1 =− or 29%, if that was the only factor to be taken into account. But the increase in sample size means also a small reduction in the t value needed to produce a confidence interval of any given level of confidence. The most important of these factors moves in a predictable and proportionally constant way, so the percentage or ratio gains in accuracy due to doubling of sample sizes are pretty uniform regardless of the starting place.
30

The main criterion to be considered, as it drives the cost, is time per school. In Jamaica it proved possible for one enumerator to get all the information (school sight inspection, principal, teachers, classroom observations, parent, children interviewed and tested) in one reasonable day’s visit. In Peru it did not prove possible, or it was possible only with major strain and difficulty. The research group collaborating with RTI on the Peru SSME, the FDA, strongly recommends cutting back the instrument by some 25%. In this country, effective school days are about 4½ hours, yet in their estimation a proper application of SSME takes 6 hours. This necessitated taking two days per school, which ups the cost considerably (essentially doubling the fieldwork cost, if one notes that much of the time of a field day is getting to the school). Thus their recommendation that approximately 1½ hours (or 25%) be saved from the length of the instrument. The Jamaica team had some challenges in getting through the instrument in one day, as well, but were able to achieve it in most cases, because the school day is longer in Jamaica. However, they also strongly felt the instrument should be shortened. Further analysis of the instrument will be done to shorten it as required by results of the field trial. Note that the philosophy of the creators of SSME is not to throw away items, but to create an item bank. In that sense it will be up to other applications to stick to a length that can be done in one day, if there is an interest in economy of application. The fact that there are many instruments for one school, and different numbers of interviewees and observations, means that interviewers have to juggle many different types of questionnaires. Similarly, it means that when it comes to data entry and data processing, the files that result are not simple “flat” files, but files that need to be linked via school and classroom ID numbers. While this is not beyond the capacity of any central Ministry of Education home office (that we know of), it is likely to be beyond the capacity, or at least the ready capacity, of many subnational offices, particularly at the district level. Since part of the purpose of the SSME is to provide an easy snapshot, an area of work and discussion would be how to make this whole process easier. In Jamaica, color coding of the questionnaires helped quite a bit. Other innovations have to be discussed. 7. Call for Further Applications and Refinement It appears that the SSME is now ready for nonpilot applications—that is, for applications that are not aimed at improving the instrument or the sample size, but can be considered for actual monitoring or baseline design. However, like all instruments that have gone before it, it will remain a work in progress for the foreseeable future. It is interesting to note that the useful EPI surveys in the health sector, for example, have now had an evolution over 40 years, since they were first proposed and tried in the late 1960s (Serfling and Sherman 1965).20 Similarly, the highly-valued Demographic and Health Surveys (DHS) series underpinned mostly by USAID funds has 30 years of continuous history.21 The education sector has nothing that can even remotely compare. It seems important to try to catch up. Thus, it is important for a tool such as SSME to garner more creative usage, while also attempting to stabilize it, relatively soon, so that it can be extended to interested analysts and practitioners in government, donor agencies, and
20 See the UCLA website http://www.ph.ucla.edu/epi/rapidsurvey.html, accessed on September 6, 2008. 21 See http://www.measuredhs.com/aboutdhs/history.cfm, accessed on September 6, 2008.
31
research institutions as a tool that can be used repeatedly and has some comparative analysis potential. This suggests that a “community of practice,” or at least a given donor project or set of projects, should sponsor a few more applications that, while intended as “real” applications aimed at producing baselines and policy diagnostics, also will continue to produce lessons learned and refinements to the tool. In particular, it would be optimal, for the near future, to maintain an item bank of interesting questions, to have a repository of experiences of actual instruments and resulting reports, and—at some point—to carry out another meta-study of the various studies, so as to set standards that the community can study, and correct methodological flaws that may creep in as applications proceed, or that were not detected, or not deemed important enough, from the outset. 8. Conclusions The SSME appears to have most of the characteristics for which it was designed. It functions well as a snapshot. The cost is relatively low, compared to traditional studies that look at learning outcomes and a large variety of associated factors, at some sacrifice of detail. But the detail, the systematization of answers and results-presentation that are possible, the freshness of data, and the depth of managerial behaviors studies are much better than what can be achieved through more casual qualitative analysis, albeit at a higher cost. It seems that the tool is a practical means to fill a gap between extremes, as it was intended to be. Further applications are called for, both to start actually producing diagnostics and policy recommendations, and to further refine the instrument.
32
Bibliography Altinok, N., and H. Murseli. 2006. International database on human capital quality. Working
paper. Bourgogne, France: Institute for Research in the Sociology and Economics of Education (IREDU) and French National Center for Scientific Research (CNRS), University of Bourgogne.
Bawazeer, A.A., A.S. Hattab, and E. Morales. 1999. First cigarette smoking experience among secondary-school students in Aden, Republic of Yemen. Eastern Mediterranean Health Journal, 5(3): 440–449.
Bennett S., T. Woods, W.M. Liyanage, and D.L. Smith. 1991. A simplified general method for cluster-sample surveys of health in developing countries. World Health Statistics Quarterly, 44(3): 98–106.
Carnoy, M. 2007. La mejora de la calidad y equidad educativa: Una evaluación realista [Improving quality and equity in Latin American education: A realistic assessment]. Pensamiento educativo, 40(1): 103–130.
Crouch, L., and T. Fasih. 2004. Patterns in educational development: Implications for further efficiency analysis. Washington, DC: World Bank, Human Development Network.
Crouch, L., and P. Vinjevold. 2006. South Africa: Access before quality, and what to do now? Profesorado. (10)1..
David, J., N.J. Wang, A.N. Åstrøm, and S. Kuriakose. 2005. Dental caries and associated factors in 12-year-old schoolchildren in Thiruvananthapuram, Kerala, India. International Journal of Paediatric Dentistry, 15: 420–428.
Frerichs, R.R. 1989. Simple analytic procedures for rapid microcomputer-assisted surveys in developing countries. Public Health Reports, 104(1): 24–35.
Frerichs, R.R., and M.A. Shaheen. 2001. Small-community-based surveys. Annual Review of Public Health, 22: 231–47.
Frerichs R.R., and K. Tar Tar. 1989. Computer-assisted rapid surveys in developing countries. Public Health Reports, 104(1): 14–23.
Lemeshow S., and D. Robinson. 1985. Surveys to measure programme coverage and impact: A review of the methodology used by the Expanded Programme on Immunization. World Health Statistics Quarterly, 38: 65–75.
Mingat, A., R. Rakotomalala, and V.M. Kengne. 2004. La dynamique des scolarisations au Niger: e´valuation pour un de´veloppement durable [The progress of schooling in Niger: evaluation for sustainable development]. Washington, DC: World Bank.
33

Serfling, R.E., and I.L. Sherman. 1965. Attribute sampling methods for local health departments. Publication No. 1230. Washington, DC: U.S. Department of Health and Human Services, Public Health Service.
Sinha, D.N., P.C. Gupta, C.W. Warren, and S. Asma. 2004. School policy and tobacco use by students in Bihar, India. Indian Journal of Public Health, 48(3): 118–122.
Wagner, D. 2003. Smaller, quicker, cheaper: Alternative strategies for literacy assessment in the UN Literacy Decade. International Journal of Educational Research, 39: 293–309.
34
Annex 1. Literature Reviewed Given the nature of the effort, the literature reviewed is not just something that can be relegated to a bibliography for further reading or a list of references cited. The literature reviewed was a central input into the process. We therefore list the pieces reviewed as separate from the bibliography in the summary report itself. Abd-El-Khalick, Fouad. 2005. Education quality baseline study: Standards-Based Classroom
Observation Protocol for Egypt (SCOPE). Egypt Education Reform Program/Education Quality Improvement Program (ERP/EQUIP1) Baseline Study, USAID.
Acedo, C. 2000. What makes a good school? Washington DC: The World Bank.
Barrera-Osorio, F. 2003. Decentralization and education: An empirical investigation. Ph.D. dissertation. College Park: University of Maryland. Retrieved June 19, 2005, from https://drum.umd.edu/dspace/bitstream/1903/89/1/dissertation.pdf
Behrman, J., A. Deolalikar, and L. Soon. 2002. Conceptual issues in the role of education decentralization in promoting effective schooling in Asian countries. ERD Working Paper Series No. 22. Manila, Philippines: Economic Research Department, Asian Development Bank. Retrieved May, 2005, from http://www.adb.org/Documents/ERD/Working_Papers/wp022.pdf
Bishop, J. and L. Wossmann. 2004. Institutional effects in a simple model of educational production. Education Economics, 12(1): 17–38. Carfax Publishing Company.
Bray, Mark. 2001. Community partnerships in education: Dimensions, variations, and implications. Education for All Thematic Study. Dakar, Senegal: United Nations Educational, Scientific, and Cultural Organization (UNESCO). http://unesdoc.unesco.org/images/0012/001234/123483e.pdf#search=%22Community%20Partnerships%20in%20Education%3A%20Dimensions%2C%20Variations%20and%20Implications.%20EFA%20Thematic%20Study%22
Calstat Learning Center. n.d. Synthesis of research on indicators of a productive school culture. Available at http://www.calstat.org/learningCenter/pdfs/Synthesis_of_Research.pdf#search=%22Indicators%20of%20Effective%20Schools%22
Carnoy, M., A.K. Gove, and J.H. Marshall. 2004. Explaining differences in academic achievement in Latin America: Qualitative evidence from Brazil, Chile and Cuba. Palo Alto, California: Stanford University, School of Education.
Chapman, David W., Lars O. Mahlck, and Anna E. M. Smulders (Eds.). 1997. From planning to action: Government initiatives for improving school-level practice. Paris, France: UNESCO International Institute for Educational Planning; Oxford: Pergamon.
35
Cotton, Kathleen. 1990. Schoolwide and classroom discipline. School Improvement Research Series, Northwest Regional Educational Laboratory. Available at http://www.nwrel.org/scpd/sirs/5/cu9.html
Crouch, Luis. 2006. Educación: Estándares, rendición de cuentas y apoyo [Education: Standards, accountability, and support]. In D. Cotlear (Ed.), Un nuevo contrato social para el Perú: ¿Cómo lograr un país mas educado, saludable, y solidario? [A new social contract for Peru: How can we develop a country that is more educated, healthy, and sound?] Washington, DC: International Bank for Reconstruction and Development and World Bank.
Das, J., S. Dercon, P. Kirshnan, and J. Habyarimana. Does teacher absenteeism affect learning? Evidence from pupil-teacher matched data from Zambia.
De Grauwe, A. 2004. School-based management (SBM): Does it improve quality? Background paper for Education for All Global Monitoring Report 2005. Retrieved June 20, 2005 from http://unesdoc.unesco.org/images/0014/001466/146639e.pdf
Deutscher, Rebecca, and Mary Ibe. Relationships between parental involvement and children’s motivation. Apple Valley CA: Lewis Center for Educational Research.
Devlin-Scherer, Roberta. 2003. Preservice professional employment portfolios for middle schools. Essays in Education Series, No. 6. Aiken, South Carolina: Department of Education, University of South Carolina at Aiken. Available at http://www.usca.edu/essays/vol62003/scherer.pdf
Di Gropello, E. 2002. An assessment of the impact of decentralization on the quality of education in Chile. World Bank Economists’ Forum, 2: 117–154. Washington DC: The World Bank.
Duflo, Esther, and Rema Hanna. 2005. Monitoring works: Getting teachers to come to school. Working Paper No. 11880, issued December 2005. Available for purchase from National Bureau of Economic Research (NBER), http://www.nber.org/papers/w11880.
Eskeland, G., and D. Filmer. 2002. Does decentralization improve learning? Autonomy and parental participation in Argentine schools. Washington: The World Bank. Mimeographed.
Ford, Daryl. 2003. Choosing a good school for your children. The Jakarta Post. Sunday, April 27, 2003.
Fuchs, Thomas, and Ludger Wossmann. 2004. What accounts for international differences in student performance? A re-examination using PISA data. Econometric Society 2004 Australasian Meetings, 274. http://econpapers.repec.org/paper/ecmausm04/274.htm
Fuller, Bruce. 1986. Raising school quality in developing countries: What investments boost learning? World Bank Discussion Papers Series. Washington, DC: The World Bank.
36

Fuller, Bruce. 1987. What school factors raise achievement in the Third World? Review of Educational Research, 57(3): 255–292.
Galiani, S., and E. Schargrodsky. 2001. Evaluating the impact of school decentralization on education quality. Buenos Aires, Argentina: Universidad Torcuato Di Tella. Retrieved June 2005 from http://ssrn.com/abstract=297829 or DOI: 10.2139/ssrn.10.2139/ssrn.297829
Galiani, S., E. Schargrodsky, and P. Gertler. 2004. Helping the good get better, but leaving the rest behind: How decentralization affects school performance. https://register.rti.org/EducationFinance/background/FiscalDec/Gertler_School%20Decentalization.pdf
Glewwe, Paul, Margaret Grosh, Hanan Jacoby, and Marlaine Lockheed. 1995. An eclectic approach to estimating the determinants of achievement in Jamaican primary education. World Bank Economic Review, 9(2): 231–258. Washington, DC: The World Bank.
Goldstein, Harvey. 1997. Methods in school effectiveness research. School Effectiveness and School Improvement, 8(4): 369–395.
Goldstein H., and G. Woodhouse. 2000. School effectiveness research and educational policy. Oxford Review of Education, 26 (3–4): 353–363.
Gove, Amber, and Susanna Loeb. 2003. Preliminary evaluation of MEC/Fundescola’s school development plan (PDE) experience: Student achievement, attendance, attainment, degree of implementation and cost-benefit analysis. Selection Bias Final Report. Palo Alto, California: Stanford University, School of Education.
Health Economics and HIV/AIDS Research Division (HEARD), University of KwaZulu-Natal, South Africa; and EduAction, British Department for International Development (DFID). 2001. District-level education management and monitoring information system (DEMMIS). Available at http://www.mttaids.com/site/awdep.asp?dealer=5562&depnum=9093
Heneveld, Ward. 1994. Planning and monitoring the quality of primary education in sub-Saharan Africa. World Bank Technical Paper. Washington, DC: The World Bank.
Heneveld, Ward. 2006. Synthesis report: Local studies on the quality of primary education in four countries. Association for the Development of Education in Africa (ADEA) Biennial Meeting on Education in Africa, Libreville, Gabon.
Heneveld, Ward, and Helen Craig. 1996. Schools count: World Bank project designs and the quality of primary education in sub-Saharan Africa. World Bank Technical Paper. Washington, DC: The World Bank.
Her Majesty’s Inspectorate of Education (HMIE). 2003. The Independent Schools Inspectorate (ISI) framework for the inspection of schools. London: HMIE.
37
HMIE. 2002. How good is our school? Self-evaluation using quality indicators. London: HMIE.
Hill, Peter W., and Kenneth J. Rowe. 1996. Multilevel modeling in school effectiveness research. School Effectiveness and School Improvement, 7(1): 1–34.
Hinum, Manfred. 1999. Strategies for managing education facilities infrastructure. Presented at Track 3 of the Universal Education Foundation/Program on Educational Building/ Committee on Architecture for Education of the American Institute of Architects (UEF/PEB/CAE) International Symposium, Baltimore, Maryland, USA. Available at http://www.oecd.org/dataoecd/42/26/2675945.pdf
Indiana Department of Education. 2001. School-parent community partnerships resource book. Indianapolis: Indiana Department of Education, September.
Inter-American Development Bank (IDB). 2005. Expanding the knowledge capital of Latin America and the Caribbean: An IDB strategy for education and training. Unpublished draft. Washington, DC: Education Unit, Sustainable Development Department, IDB.
Kentucky Department of Education. 2004. School-level performance descriptors for Kentucky’s standards and indicators for school improvement. Available at http://eric.ed.gov/ERICDocs/data/ericdocs2sql/content_storage_01/0000019b/80/1b/9e/64.pdf
King, Elizabeth M., Peter F. Orazem, and Victoria Gunnarsson. 2003. Decentralization and student achievement: International evidence on the roles of school autonomy and community participation. Background paper for Fourth Annual Global Development Conference Globalization and Equity in Cairo, Egypt. Retrieved June 24, 2005, from http://www.gdnet.org/pdf/Fourth_Annual_Conference/parallels4/ResearchEducationGlobalContext/Orazam_paper.pdf
Kulinna, Pamela Hodges, Donetta Cothran, and Rey Regualos. 2001. Development of an instrument to measure students’ views of classroom management. Paper presented at the annual meeting of the American Educational Research Association, Seattle, Washington, April 10–14, 2001. Available at http://eric.ed.gov/ERICDocs/data/ericdocs2sql/content_storage_01/0000019b/80/19/41/27.pdf
Landua, Barbara. 2001. Teaching classroom management: A stand-alone necessity for preparing new teachers. Paper presented at the Annual Meeting of the American Educational Research Association, Seattle, Washington, April 10–14, 2001. Available at http://eric.ed.gov/ERICDocs/data/ericdocs2sql/content_storage_01/0000019b/80/17/0c/88.pdf
Lee, Valerie E., Anthony S. Brysk, and Julia B. Smith. 1993. The organization of effective secondary schools. Review of Research in Education, 19:171-267.
Levin, Henry M., and Marlaine E. Lockheed (Eds.). 1993. Effective schools in developing countries. London; Washington, DC: The Falmer Press.
38
Lockheed, Marlaine E., and Eric Hanushek. 1994. Concepts of educational efficiency and effectiveness. Human Capital Working Paper. Washington, DC: The World Bank.
Lockheed, Marlaine E., and Adriaan Verspoor. 1991. Improving primary education in developing countries. Washington, DC: Published for the World Bank by Oxford University Press.
Martin, M.O., I.V.S. Mullis, and A.M. Kennedy (Eds.). 2003. Progress in International Literacy Study (PIRLS) 2001 technical report. Chestnut Hill, Massachusetts: Boston College. Available at http://timss.bc.edu/pirls2001i/PIRLS2001_Pubs_TR.html
Martin, Nancy, K., and Zenong Yin. 1997. Attitudes and beliefs regarding classroom management: Differences between male and female teachers. Paper presented at the 20th annual meeting of the Southwest Educational Research Association, Austin, Texas, January 1997. Available at http://eric.ed.gov/ERICDocs/data/ericdocs2sql/content_storage_01/0000019b/80/16/4d/45.pdf
Michaelowa, Katharina. 2003. Determinants of primary education quality: What can we learn from PASEC for francophone Sub-Saharan Africa? Background Paper. Association for the Development of Education in Africa (ADEA) Biennial Meeting on Education in Africa. Available at http://www.hwwa.de/Forschung/Handel_&_Entwicklung/docs/Archiv/Determinants_eng.pdf#search=%22PASEC%20education%20africa%22
Michaelowa, Katarina, and Annika Wechtler. 2006. The cost-effectiveness of inputs in primary education: Insights from the literature and recent student surveys for sub-Saharan Africa. Association for the Development of Education in Africa (ADEA) Biennial Meeting on Education in Africa, Libreville, Gabon.
Miles, Karen H., and Darling-Hammond, Linda. 1998. Rethinking the allocation of teaching resources: Some lessons from high-performing schools. Educational Evaluation and Policy Analysis, 20(1): 9–29.
Ministry of Education, Youth, and Sport, Cambodia. 2000. Education Quality Improvement Project achievement test, literacy (Khmer language) for grade 4. Phnom Penh.
Mississippi Department of Education. 2003. Mississippi Principal Appraisal System. Jackson: Office of Evaluation and Enhancement, Mississippi Department of Education.
Narayan, Deepa, and Lant Pritchett. 2000. Social capital: Evidence and implications. In Partha Dasgupta and Ismail Serageldin, Social capital: A multifaceted perspective, 269–295. Washington DC: The World Bank, Available at http://www.exclusion.net/images/pdf/778_teadi_narayan_pritchett.pdf
39
Nebeshima, K. 2003. Raising the quality of secondary education in East Asia. World Bank Policy Research Working Paper 3140. Washington DC: The World Bank. Retrieved June 17, 2005, from http://www-wds.worldbank.org/servlet/WDSContentServer/WDSP/IB/2003/10/08/000160016_20031008131122/Rendered/PDF/wps3140.pdf
New England Association of Schools and Colleges (NEASC). 2001a. Commission on Independent Schools: Standards for accreditation. Bedford, Massachusetts: NEASC.
NEASC. 2001b. Manual for school evaluation: Preparing the self-study. Bedford, Massachusetts: NEASC.
New Zealand Education Review Office. 2003. Evaluation indicators for education reviews in schools. Wellington, New Zealand: New Zealand Education Review Office. http://www.ero.govt.nz/ero/publishing.nsf/Print/Evaluation%20Indicators%20for%20Education%20Reviews%C2%A0in%20Schools
Nguyen, T.K.C, M. Wu, and S. Gillis. 2005. Factors influencing achievement levels in the Southern and Eastern Africa Consortium for Monitoring Educational Quality (SACMEQ) II – Botswana: An application of structural equation modeling. Referred paper presented at SACMEQ International Invitational Research Conference, Paris, France, September 28–30, 2005. Available at http://www.edfac.unimelb.edu.au/arc/PDFs/SACMEQpaper.pdf
Odden, Allan, and Clune, William. 1995. Improving educational productivity and school finance. Educational Researcher, 24(9), 6–10, 22.
Onsomu, Eldah Nyamoita, John Njoroge Mungai, Dramane Oulai, James Sankale, and Jeddidah Mujidi. 2004. Community schools in Kenya: Case study on community participation in funding and managing schools. Paris: International Institute for Education Planning (IIEP)/UNESCO.
Organization for Economic Cooperation and Development (OECD). 2000. School factors related to quality and equity: Results from PISA 2000. Paris: OECD. Retrieved June 21, 2005, from http://www.pisa.oecd.org/dataoecd/15/20/34668095.pdf
OECD. 2001. Knowledge and skills for life: First results from PISA 2000. OECD, Paris. Retrieved June 2005 from http://www.pisa.oecd.org/dataoecd/44/53/33691596.pdf
OECD. 2004. Annex 3: Sources, Methods and Technical Notes. Chapter D: The Learning Environment and Organization of Schools. In Decision making in education systems. Education at a glance: OECD indicators 2004. Available at http://www.oecd.org/dataoecd/35/50/33714920.pdf
Pennycuick, David. 1993. School effectiveness in developing countries: A summary of the research evidence. Education Research Paper No. 01. Sussex: University of Sussex Centre for International Education/DFID.
40

Program on the Analysis of Education Systems (PASEC). Managing the impact of PASEC projects in francophone sub-Saharan Africa. Available at http://www.ipz.uzh.ch/institut/mitarbeitende/staff/michaelowa/publikationen/Buechern/25-paper.pdf
Raczynski, Dagmar, and Gonzalo Muñoz. 2005. Effective schools in poverty areas in Chile: Keys and challenges. Unpublished manuscript.
Rameckers, Frans. n.d. Effective monitoring of the quality of education. Washington, DC: The World Bank.
Reynolds, D. et. al. 2000. An introduction to school effectiveness. In C. Teddlie and D. Reynolds, The international handbook of school effectiveness research. London: Falmer Press.
Rimm-Kaufmann, Sara E. 2006. Summary of research on the responsive classroom approach. Charlottesville: University of Virginia. Available at http://www.responsiveclassroom.org/pdf_files/sals_findings_rc.pdf
Rose, Pauline. 2003. Communities, gender and education: Evidence from sub-Saharan Africa. Background Paper for 2003 UNESCO Global Monitoring Report. Sussex: Centre for International Education, University of Sussex.
RTI International, USAID Decentralized Basic Education 1 (DBE1) Project, and USAID Local Governance Support Program (LGSP). 2006. Diagnostic assessment instruments: Component 1: Improved educational planning capacity; Component 2: Improved educational financial management capacity; Component 3: Improved education personnel management capacity; Component 4: Improved asset management capacity; Component 5: Improved school supervision capacity; basic education performance and management assessment. Jakarta: USAID/Indonesia.
RTI International, USAID Education Sector Reform Assistance (ESRA) Project. 2006. School questionnaire (English). Islamabad: USAID/Pakistan.
RTI International, USAID Integrated Education Program (IEP). 2006a. School management teams (SMT) questionnaire instrument. Result 6: Improved instructional leadership skills for SMT. Pretoria: USAID/South Africa.
RTI International, USAID IEP. 2006b. School governing bodies (SGB) questionnaire instrument. Result 7: Improved management and administrative capacity of schools to collaborate with SGBs and communities to develop and effective implement SDP to improve school functionality. Pretoria: USAID/South Africa.
RTI International, USAID IEP. 2006c. Teacher instrument (classroom observation). Result 2: Improved ability of teachers to develop and apply continuous assessment strategies and techniques. Result 4: Increased number of teachers that are teaching literacy, numeracy, mathematics and science in a manner consistent with the RNCS. Result 5: Improved
41
teachers’ ability to develop and use classroom materials that support learner-centered instruction. Pretoria: USAID/South Africa.
RTI International and DCDM Consulting. 2003a. Survey on teacher attendance and attrition: Head teacher questionnaire. Prepared for USAID/Africa Bureau/OSD/Education Division and the Ministry of Education, Republic of Zambia.
RTI International and DCDM Consulting. 2003b. Survey on teacher attendance and attrition: Teacher questionnaire. Prepared for USAID/Africa Bureau/OSD/Education Division and the Ministry of Education, Republic of Zambia.
Sammons, P., J. Hillman, and P. Mortimore. 1995. Key characteristics of effective schools: A review of school effectiveness research. London: Institute of Education/Office for Standards in Education (Ofsted).
Sanderson, Donna R. 2004. Classroom management students observing students: A win-win combination. Essays in Education Series, No. 9. Aiken, South Carolina: Department of Education, University of South Carolina at Aiken. Available at http://www.usca.edu/essays/vol92004/sanderson.pdf
Scheerens, Jaap. 1999. School effectiveness in developed and developing countries: A review of the research evidence. Enschede, The Netherlands: University of Twente. http://www1.worldbank.org/education/est/resources/topic%20papers/jaap699.doc
Schiefelbein, Ernesto. 2001. 20-minute yardstick: Instrument for objective measurement of classroom processes driving learning quality. Unpublished manuscript (trans. from Spanish by Luis Crouch). Available from [email protected].
Smith, Nick L. 1982. The context of evaluation practice in state departments of education. Educational Evaluation and Policy Analysis, 4(3).
Taylor, Sheryl V., and Donna M. Sobel. 2002. Missing in action: Research on the accountability of multicultural, inclusive teacher education. Essays in Education Series, No. 2. Aiken, South Carolina: Department of Education, University of South Carolina at Aiken. Available at http://www.usca.edu/essays/vol22002/taylor.pdf
Teddlie, Charles, and David Reynolds. 2000. The international handbook of school effectiveness research. London: Falmer Press.
The Population and Human Resources Division, Eastern Africa Department, World Bank, in collaboration with the University of Dar-Es-Salaam and the Government of Tanzania’s Planning Commission. 1993–1994. Tanzania Human Resource Development Survey (HRDS). Available at http://www.worldbank.org/LSMS/country/tza/tanzhome.html
Training and Support Programme for School Heads in Africa. 1993. Better schools: Resource materials for school heads in Africa. Paris: UNESCO. http://library.unesco-iicba.org/English/Better_Schools/Better%20Schools/main%20pages/Contents.htm
42

Uemura, Mitsue. n.d. Community participation in education: What do we know? Washington DC: The World Bank (Effective Schools and Teachers and the Knowledge Management System, HDNED).
United Nations Educational, Scientific, and Cultural Organization (UNESCO) Institute for Statistics. 2004a. National project manager questionnaire for the World Education Indicators Survey of primary schools, pilot version. Paris: Organisation for Economic Co-Operation and Development (OECD).
UNESCO Institute for Statistics. 2004b. School questionnaire for the World Education Indicators Survey of primary schools, pilot version. Paris: OECD.
UNESCO Institute for Statistics. 2004c. Teacher questionnaire for the World Education Indicators Survey of primary schools, pilot version. Paris: OECD.
UNESCO Institute for Statistics. 2006. World education indicators. Available at http://www.uis.unesco.org/template/publications/wei2006/WEI2006-FINALwc.pdf
UNESCO and United Nations Children’s Fund (UNICEF). n.d. Monitoring learning achievement (MLA). Available at http://www.unicef.org/girlseducation/index_achievement.html
UNICEF. Multiple Indicator Cluster Survey (MICS) 2 questionnaire. n.d. Available at http://www.childinfo.org/mics2_questionnaire.html
United States Agency for International Development (USAID). 1994. The School Fundamental Quality Indicators (SFQI) System. Ministry of Education/Benin and USAID/Benin through the Children’s Learning and Equity Foundations Program (CLEF) and USAID Africa Bureau, Office of Sustainable Development.
van der Werf, Greetje. 1997. Differences in school and instruction characteristics between high-, average-, and low-effective schools. School Effectiveness and School Improvement 8(4): 430–448.
Verspoor, Adriaan. 2006. Effective schools for Sub-Saharan Africa. Association for the Development of Education in Africa (ADEA) Biennial Meeting on Education in Africa.
Vincent, Susan (Ed.). 1999. The multigrade classroom: A resource handbook for small rural schools. Book 3: Classroom management and discipline. Portland, Oregon: Northwest Educational Regional Laboratory, Rural Education Program. Available at http://eric.ed.gov/ERICDocs/data/ericdocs2sql/content_storage_01/0000019b/80/16/c7/b5.pdf
Walberg, Herbert J., and Herbert J. Walberg, III. 1994. Losing local control. Educational Researcher, 23(5).
Wheeler, Christopher W., Stephen Raudenbush, and Aida Pasigna. 1989. Policy initiatives to improve primary school quality in Thailand: An essay on implementation, constraints,
43

and opportunities for educational improvement. USAID Basic Research and Implementation in Developing Education Systems (BRIDGES) Project. Research Report Series, No. 5. Cambridge, Massachusetts: Harvard University and S&T/ED for the United States Agency for International Development.
Windham, Douglas. 1988. Improving the efficiency of educational systems: Indicators of educational effectiveness and efficiency. Prepared under the Improving the Efficiency of Educational Systems (IEES) Project, USAID Contract No. DPE-5823-C-00-4013-00, Project No. 936-5823.
Windham, Douglas. 1990. Indicators of educational effectiveness and efficiency. Prepared under the IEES Project, USAID Contract No. DPE-5823-C-00-4013-00, Project No. 936-5823. Washington, DC: USAID Bureau for Science and Technology, Office of Education, USAID.
Wolff, Laurence, Ernesto Schiefelbein, and Jorge Valenzuela. 1994. Improving the quality of primary education in Latin America and the Caribbean: Toward the 21st century. World Bank Discussion Paper. Education and Training Series. Washington, DC: The World Bank.
World Bank. 2000. Effective schooling in rural Africa Report 4: Frequently asked questions about effective schooling in rural communities. Washington, DC: The World Bank, Human Development Network. http://siteresources.worldbank.org/EDUCATION/Resources/278200-1099079877269/547664-1099080063795/Effective_schooling_rural_Africa_report1En00.pdf
Wössmann, L. 2000. Schooling resources, educational institutions, and student performance: The international evidence. Kiel Working Paper No. 983. Kiel, Germany: Institut für Weltwirtschaft [Kiel Institute for World Economics], Kiel University. Retrieved May, 2005 from http://www.uni-kiel.de/ifw/pub/kap/2000/kap983.pdf
Wössmann, Ludger, and Thomas Fuchs. 2004. What accounts for international differences in student performance? A re-examination using PISA data. http://www.cesifo.de/pls/guestci/download/CESifo%20Working%20Papers%202004/CESifo%20Working%20Papers%20July%202004/cesifo1_wp1235.pdf
Woytek, Amy. 2005. Utilizing assessment to improve student motivation and success. Essays in Education Series, No. 14. Aiken, South Carolina: Department of Education, University of South Carolina at Aiken. Available at http://www.usca.edu/essays/vol142005/woytek.pdf
44
45
Annex 2. Experts, Users, and Reviewers Consulted The following persons were consulted on questions of either design, literature sources, or overall utility of the approach. The institutional affiliation of each person at the time of the consultation is shown. Panelist Institutional Affiliation Abelman, Charles World Bank Allen, Barbara Ministry of Education, Jamaica Bertoli, Sandra USAID/Washington Bolaños, Fernando USAID/Peru Buckland, Peter World Bank Chapman, David University of Minnesota Cueto, Santiago Grupo de Análisis del Desarrollo (GRADE), Peru Cummings, William George Washington University Etymezian, Nina DevTech Systems
Fuller, Bruce Policy Analysis for California Education (PACE),
University of California, Berkeley Hatch, John USAID/Washington Heneveld, Ward Independent consultant Heyneman, Stephen Vanderbilt University Kolodin, Susan Inter-American Development Bank (IDB)/Health Lockheed, Marlaine Center for Global Development Mabogoane, Thabo Joint Education Trust (JET), South Africa McGinn, Noel Harvard University, retired Middleton, John Independent consultant Miranda, Liliana Ministry of Education, Peru Navarro, Juan Carlos IDB Olive, Cristina USAID/Peru Raczynski, Dagmar Asesorías para el Desarrollo, Santiago, Chile Shamblin, Leigh USAID/Jamaica Solari, Alfredo IDB/Health Spence, Claire USAID/Jamaica Taylor, Nick Joint Education Trust (JET), South Africa Verspoor, Adrian Independent consultant Wolff, Laurence Independent consultant