the social engagement rankings of the top 15 cosmetic · pdf filethe social engagement...
TRANSCRIPT

The Social Engagement Rankings of the Top 15 Cosmetic Brands:
By Dr. Natalie PetouhoffLecturer, UCLA Anderson School of Business
A Social Engagement Report presented by
& Lisa M. Schwartz
Where Does Your Brand Rate?*
Learn why inside ...
Olay Cover Girl Sephora MAC Cosmetics LOccitane Avon Urban Decay Estee Lauder Lancome Clinique Benefit Smashbox Bobbie Brown L’Oreal Elf
1
2
3
4
5
6
7
8
9
10
11
12
13
14
15
Social Engagement Rankings:Social Engagement Rankings:

2
Why Read This Report?Do you have the answers?
This report will give you the answers needed to develop a better, more cost effective social media and digital
communication engagement in the cosmetic industry
Strategy Intelligence:• Am I effectively deploying my marketing spend?• What are my competitors doing?• Is my engagement better or worse than my competitors?• What can I learn from other brands most relevant to my audience?• Is my content marketing a competitive differentiator?• Do I know how to use real-time data to make these decsions?• Are my expenditures being wasted or are they highly effective, compared to competitors?
Tactical Intelligence:• Do I know the themes of content that are getting the most engagement?• Am I creating enough of the right type of content?• Am I releasing content on the right days and times of a day?• What channels does my content perform better on?• What can I learn about my competitors to improve my engagement?

Secret #1: Winning Brands Dynamically Engage ....................
Secret #2: Winning Brands Beat EdgeRank ................................
Secret #3: Winning Brands Know What’s Working & What’s Not .......................................................................
Secret #4: Winning Brands Have The Data To Analyze Their Competition ...........................................................
Secret #5: Winning Brands Use A 5-Step Process To Get Competitive Data ...............................................
Secret #6: Winning Brands Use A 7-Step Strategy Planning Process ..........................................
Author Bios .................................................................................................
Appendix ....................................................................................................
Six Secrets of Engagement For The Top Cosmetic Brands
Table of Contents
1
9
15
23
42
45
53
55

4
Secret #1: Winning Brands Dynamically Engage

5
Secret #1: Winning Brands Dynamically Engage
>5223
7
14
in
Social cosmetic brands are moving from static logos ...
... to Dynamic Engagements

6
Secret #1: Winning Brands Dynamically Engage
Historically brands were managed via brand guide-lines that specified font, colors, icons, visual imagery, logos, and design—all of which were incorporated in the brand’s vision, mission, position-ing and benefits. The brand “toolkit”—before social media— was about creating these emblems to represent the “expression” of a brand.
The emblems were the means for the brand to com-municate to the “audience.” Done well, those brand emblems or assets created the experience of— and the perception of the brand.
The brand’s identity—and thus brand equity— was then expressed through: • Promises & Guarantees • Position & Ideology • Logos & Icons • Tagline & Key Messages
An emphasis in brand building is the idea of evok-ing an emotional connection between the brands and customers. Before social media the above brand assets were used generate the associated feel-ings about a brand and defined the relationship and bond with customers.
““Driven by the fundamental shift in control from companies to consumers, the future belongs to those who make emotional connections with them.”
- Kevin Roberts CEO of Saatchi & Saatchi & Author of Lovemarks Effect: Winning in the Consumer Economy
7
Secret #1: Winning Brands Dynamically Engage
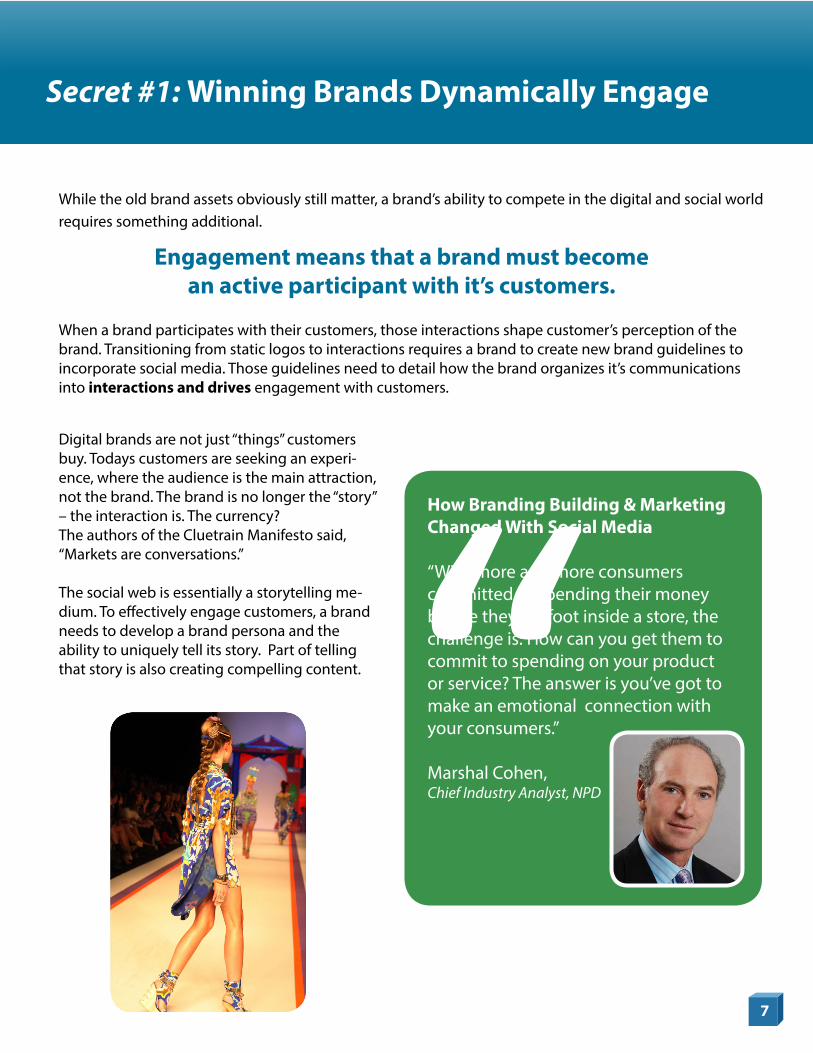
Digital brands are not just “things” customers buy. Todays customers are seeking an experi-ence, where the audience is the main attraction, not the brand. The brand is no longer the “story” – the interaction is. The currency? The authors of the Cluetrain Manifesto said, “Markets are conversations.”
The social web is essentially a storytelling me-dium. To effectively engage customers, a brand needs to develop a brand persona and the ability to uniquely tell its story. Part of telling that story is also creating compelling content. “
How Branding Building & Marketing Changed With Social Media
“With more and more consumers committed to spending their money before they set foot inside a store, the challenge is: How can you get them to commit to spending on your product or service? The answer is you’ve got to make an emotional connection with your consumers.”
Marshal Cohen, Chief Industry Analyst, NPD
While the old brand assets obviously still matter, a brand’s ability to compete in the digital and social world requires something additional.
When a brand participates with their customers, those interactions shape customer’s perception of the brand. Transitioning from static logos to interactions requires a brand to create new brand guidelines to incorporate social media. Those guidelines need to detail how the brand organizes it’s communications into interactions and drives engagement with customers.
Engagement means that a brand must becomean active participant with it’s customers.

8
Today, brand perception is shaped by the conversation between the brand and the customer, where the customers’ motivation is to make an emotional connection with the brand. It’s imperative to understand the difference between “awareness” and being “loved” by customers. To be a “Loved“ brand requires the brand correspond with customers in a genuine, authentic and real persona. Out with stale, stiff, rigid one-way brand communications. In with social, deeply personal , novel two-way dialogues.
Thus, Digital Cosmetic Brands are activities and social experiences requiring a brand to define their behavior strategy. Some of those interaction behaviors include being:
• Transparent, of service, entertaining• Providing utility, rewards & unique, exclusive experiences.
What might get in the way of delivering social experiences?
Secret #1: Winning Brands Dynamically Engage

9
Secret #2: Winning Brands Beat EdgeRank

10
Secret #2: Winning Brands Beat EdgeRank
Why did Facebook develop EdgeRank?Are you one of those brands spending hundreds of thousands or millions of dollars on creating content for social media interactions? Facebook themselves admits the average brand page only reaches 16-17% of its fans. Data from PageLever shows that for brands with millions of fans, even less of their fans see the content. They estimate the content only reaches ~3% of their fans. Why is this so? It’s because of an algorithm, EdgeRank, that calculates what posts to filter out.
When Facebook allowed brands to have pages, brands began posting a lot of content. Facebook users felt there was too much content coming at them, almost so much that it felt like spam. As a result, Facebook created a filter that determines who sees particular posts. There are three parts to the filter.
The first part of the equation, affinity, takes into consideration how much time you spend interacting with certain friends, groups and pages. If you are spending a lot of time interacting with them, then your affinity will be stronger. The next piece of the puzzle is about weight. Weight is essentially the level of interaction a piece of content gets. For example how many likes and comments. And the last piece to the puzzle is time. Over time, a post’s relevance decays making it less important, pushing it down the feed.
“If you want to speak to the other 80 to 85 percent of people who signed up to hear from you, Sponsoring Posts is important.”
-Gokul Rajaram, Head of Advertising, Facebook
This is the Facebook filter,known as EdgeRank
~80 % of your fans don’t see your posts because of EdgeRank.

11
Secret#2: Winning Brands Beat EdgeRank
What are the three big problems around content and engagement?
The truth is most brands don’t have the budget to create enough great content to be effective at engaging their customers. What makes matters worse, in addition to a content creation budget, you also need a promotion budget. And the cost to promote content can become prohibitive.
How much does it cost a brand to send a Sponsored Posts or Stories? One sponsored story from Facebook costs $200• Let’s say the brand posts 2 times per day• $200 x 2 = $400/day• 7 days/wk x $400/day = $2,800/wk• 4 wks/mo x $2,800/wk = $11,200/mo• 12 mo/yrs x $11,200 = $134,400/yr• $134,400/ yr just to get your content seen!
And that doesn’t include the cost of the:
• Creative• Content production• Content delivery systems (like Buddymedia)• Community managers
1. Creating great content so fans will want to interact with it2. Creating a lot of that great content3. Promoting the content so it’s seen.
12
Secret#2: Winning Brands Beat EdgeRank
How Do I get EdgeRank to work in my favor and rise abovemy competitors in the cosmetic industry?
• EdgeRank gives greater exposure (reach) to posts that are more engaging• Boring posts decrease your reach and thus your bottom line• The solution is to create more interesting posts
What makes a better post in the cosmetic industry?
We’ll cover this more in the following sections, but here are some hints. It’s the ability to:
• Benchmark engagement performance vs. your competitors in the cosmetic industry• Surface the best content and content types to engage your target audiences in the cosmetic industry• Determine how frequently to post• Calculate the best days of the week and hours in the day to post compared to cosmetic industry competitors• Know when to post the right type of content to get the highest engagement in the cosmetic industry
But without the right data, cosmetic brands can’t possibly know how to
do all of that well and consistently …

13
Secret#2: Winning Brands Beat EdgeRank
What makes Facebook marketing even more frustrating?EdgeRank essentially collapses your marketing funnel. How? EdgeRank essentially blocks a great deal of your posts from being seen. This means you have less people seeing your posts and thus fewer customers completing the phases of awareness, consideration, conversion, loyalty & advocacy… so you essentially you have less word-of-mouth, fewer leads, lower conversion rate & less sales, revenue and profits.
Can you afford for your content to not be seen?What would your CEO or CFO think if they knew?
Marketing Funnel Facebook’s EdgeRank: Collapses the Marketing Funnel

14
Secret#2: Winning Brands Beat EdgeRank
Wondering about best practices for posting on Facebook?
Recommended Facebook Postings
CURATEDCONTENT
ORIGINALCONTENT
PROMOTIONALCONTENT
50%
30%
20%

15
Secret #3: Winning Brands Know What’s Working & What’s Not

16
What’s the point of creating and posting content? It should be to drive business results. Content is what creates engagement and engagement is what drives business results. Here’s typical marketing metrics brands use to drive business results:• Increase positive sentiment• Increase share of voice• Increase awareness, interest, consideration, intent• Increase lead conversions rates and sales• Loyalty, Brand Advocacy and Referrals
So if you want to get a return on your investment for your digital and social media initiatives you need a way to measure your engagement results. That way you can hit your business objectives and goals as well as get buy-in from executives stakeholders for budgets. But if engagement is low, then the business results are gonna be lower. So its important to know what else can hinder high engagement capabilities.
Why aren’t typical social media listening & monitoring tools aren’t enough to help you drive higher engagement?If you are using social media listening and moni-toring tools that are keyword based, i.e., post-2009 you are missing data that provides your social media engagement ranking compared to your cosmetic industry competitors.
Why should your customers’ interests drive your engagement strategy?The only thing that can tell you how your brand ranks compared to your competitors is interest graph data. Interest graph data looks at what is important to your customers. Without it brands and their agencies are essentially creating con-tent without knowing:
• What appeals to their target audience• What makes a great post and • How they stack-up against their competitors
How does interest graph data work? it is like one big, highly accurate, ongoing focus group. It measures the collective cosmetic indus-try audience’s interests and their interactions. This type of information is key because its based on the context of cosmetic consumer’s collective actions with content that is interesting to them, i.e., their “interest graph.”
Secret #3: Winning Brands Know What’s Working & What’s Not

17
Why is interest graph data needed now more than ever by the cosmetic industry? When social media and digital communications first began to proliferate the web, content created by bloggers, publishers, brands etc.. was highly text based. Today people are using vast range of content types and in particular visual content like that on sites like Pinterest, Shutterfly, Youtube-type videos and micro-blogging (Twitter).
Often the content shared in social media has lit-tle or no text (think Twitter with 140 characters) which makes it difficult for keyword listening plat-forms to find it or deem it relevant. This is wherein the big issue lies. When we consider engagement capabilities, statistics show that visual assets per-form better than text, which means that more and more people are acting on visual assets as part of a theme that interests them. And to understand what’s trending and how to adjust your strategy, you’d need to find and evaluate those visual as-sets. But to do that, you’d need something more than social media listening and monitoring tools
How can you learn more about the in-terest graph of your target customers in the cosmetic industry?Part of that requires you begin by observing what’s working and what’s not working in the cosmetic industry. If you want to create great content that your fans and customers will inter-act with you can’t just have some really smart people sitting in a room brainstorming by them-selves.
Studies show that when consumersclick and look at your content or when they
post comments, those comments are not alwaysrelated directly to a brand or mention the brand’s name. Instead, they need to become really knowledgeable about the types of content your fans and customers like the best– i.e., engage-ment with the most. You’ll need to analyze what themes and types of visual and text-based con-tent customers are preferring.
And then you need to understand what your particular collective consumer base is interact-ing with and use that intelligence to inform the creative content direction and themes. With the ability to analyze those collective target audience preferences your brand will:
• Have the edge over your competitor• Drive better and higher engagement• Fill your marketing funnel and • Obtain better business results.
What does it mean that we are now in the “interest graph era?”With all the content that is being shared, we have now entered into the interest graph era. Data also shows that many customers, when they are posting online don’t mention a brands name. However they do act on content which is relevant to the cosmetic industry. Studies show that when consumers click and look at your content, when the post comment those comments are not always related directly to a brand or include the mention of a brand. However, those clicks and posts are all related to a” theme of interest.”
What’s key is to understand what themes cos-metic customers are interested in and use that to inform your marketing content.
Secret #3: Winning Brands Know What’s Working & What’s Not

18
Consider that your customers have more content choices and ability to transverse between those choices now more than ever before. And customers have the ability to share that content through many modes. In the old days when someone read an article in a magazine that they liked, it would be shared face-to-face or on the phone in a conversation. Then came email and people could share an article or boat load of jokes with their email list. As time went on, more and more people migrated to online content sources like bulletin boards, forums, etc.. which are by the way, content themed.
Today many of your customers are interacting in social media – Twitter, Facebook Pinterest, etc…
They have more content and more ways and places to share that content with their friends and families. To get really good at determining what is working and what is not, you need analysis. But to do the competitive comparison without a interest graph platform is impossible. The analysis of what content is interacted with should become the basis of a brand’s content and engagement strategy. Interest graph data tells us what customers are sharing and interacting with. We can also learn more about brand affinity inter-ests, i.e., interest of your customers in related or unrelated vertical industries. Facebook’s launch of Graph Search is further validation brands must understand what their customers find relevant.
Secret #3: Winning Brands Know What’s Working & What’s Not
18

19
What is the impact of the 3.5 billion pieces of content shared per week?
You need a platform designed to organize all that content that is shared. And keyword searches can’t help you analyze all that.
Secret #3: Winning Brands Know What’s Working & What’s Not
What’s the difference between keyword monitoring and interest Graph intelligence?
Why won’t platforms based on keywords help you with all of this? Keyword monitoring can only bring back results for the “key words” you choose to search on. This is called a Boolean-type search. The prob-lem is that it is very difficult to think up enough words to string to together to find the content themes from the 3.5 billion pieces of content shared per week. As a result that type of information does not rep-resent your collective cosmetic consumer’s interests.
In addition, when many customers post, they don’t mention the brand name, so those interactions can escape keyword searches. And if customers mention a brand or if you search on a topic – you are still getting the results for that “word” or but it’s not categorized by content themes.
What’s required is a platform that systematically lowers the noise in the data by providing relative con-tent that consumers have shown a high propensity of interacting with it regardless of whether it is a picture, a video or text. Keyword searches provide information on the content topic but it can’t rank the topic. Interest graph intelligence tells you which content themes rank the highest so you have factual information on which to base your marketing initiatives.
How can marketers make sense of all this data?

20
Want an example of how the Interest Graph Intelligence works in the cosmetic industry?Let’s look at an example. Say you are a cosmetic company and you want to listen to customer’s conversations in social media. If you do a search on keywords, you would probably choose variousterms related to cosmetics and the brand name
Now let’s look at what customers are actually sharing. In this example, a customer shares a picture of new nail polish and posts the words – “What do you think?” And all her friends respond to the post, never mentioning the brand name or even that is nail polish.
In a keyword search, that picture with those words would not be picked. Hence the brand would be missing the opportunity to interact with that cus-tomer as well as miss analyzing key content and interaction data.
In an interest graph search, the technology is able to discern that the picture is related to cosmetics and it brings it back as an result.
And that’s just one post. Take this one example and multiply it by hundreds of thousand or millions or billions of posts. Now think about how you would try to analyze these interactions with a keyword tool. The only way to analyze millions or billions of interactions is with an interest graph platform.
Secret #3: Winning Brands Know What’s Working & What’s Not
This is an example of the search results from an interest graph platform. What you can see is that one of the top ranking interactions is the picture of the nail polish.
21
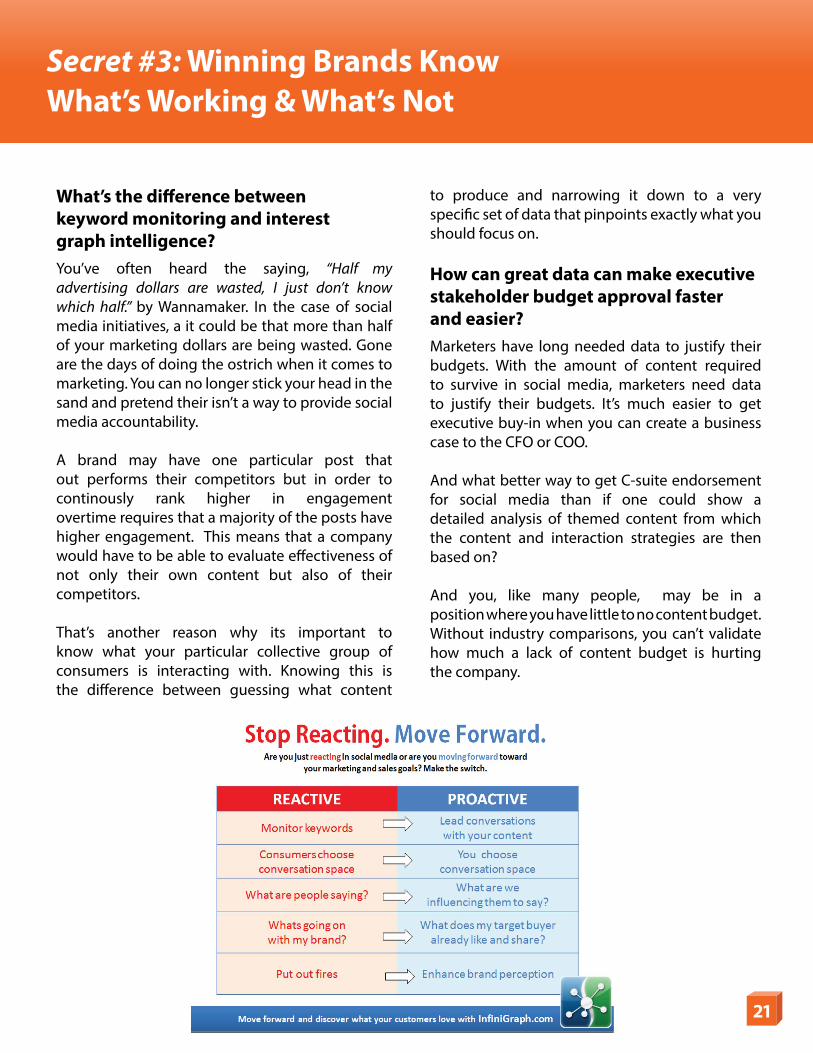
What’s the difference between keyword monitoring and interest graph intelligence?You’ve often heard the saying, “Half my advertising dollars are wasted, I just don’t know which half.” by Wannamaker. In the case of social media initiatives, a it could be that more than half of your marketing dollars are being wasted. Gone are the days of doing the ostrich when it comes to marketing. You can no longer stick your head in the sand and pretend their isn’t a way to provide social media accountability.
A brand may have one particular post that out performs their competitors but in order to continously rank higher in engagement overtime requires that a majority of the posts have higher engagement. This means that a company would have to be able to evaluate effectiveness of not only their own content but also of their competitors.
That’s another reason why its important to know what your particular collective group of consumers is interacting with. Knowing this is the difference between guessing what content
to produce and narrowing it down to a very specific set of data that pinpoints exactly what you should focus on.
How can great data can make executive stakeholder budget approval faster and easier?Marketers have long needed data to justify their budgets. With the amount of content required to survive in social media, marketers need data to justify their budgets. It’s much easier to get executive buy-in when you can create a business case to the CFO or COO.
And what better way to get C-suite endorsement for social media than if one could show a detailed analysis of themed content from which the content and interaction strategies are then based on?
And you, like many people, may be in a position where you have little to no content budget. Without industry comparisons, you can’t validate how much a lack of content budget is hurting the company.
Secret #3: Winning Brands Know What’s Working & What’s Not

22
Secret #4: Winning Brands Have The Data To Analyze Their Competition

23
Secret #4: Winning Brands Have The Data To Analyze Their Competition
Social Engagement Rankings:
Olay Cover Girl Sephora MAC Cosmetics LOccitane Avon Urban Decay Estee Lauder Lancome Clinique Benefit Smashbox Bobbie Brown L’Oreal Elf
1
2
3
4
5
6
7
8
9
10
11
12
13
14
15

24
Secret #4: Winning Brands Have The Data To Analyze Their Competition
Figure 1. The graph above compares 15 cosmetic brand’s overall social media engagement (includes both Facebook and Twitter.)
• The Olay brand has the highest level of over-all social media engagement
• CoverGirl has the second highest level of engagement, but is far behind Olay
• L’OREAL, Bobbi Brown and Elf have the lowest overall social media engagement
What is interesting is that often some of the most engaging brands post less frequently than their
competitors. This may be because the quality of the content is better. This means that a brand should pay attention to higher quality content vs. the quantity of content.
How to use this type of information in your business:• Begin by looking at where your brand ranks
compared to your competitors • Use this as your benchmark so you can
compare this evaluation after you have made changes based on the interest graph data

25
Secret #4: Cosmetic Brand’s Engagement Ranking
Figure 2. The graph above compares the number of Facebook posts for each brand. • Elf cosmetics is leading the pack, with Cover-
Girl ranking second and Bobbi Brown Cosmetics ranking third.
• Mac Cosmetics, Smashbox Cosmetics and L’OCCITANE rank with the lowest amount of posts.
How to use this type of information in your business:• Begin by looking at where your brand ranks
compared to your competitors • Use this as your benchmark so you can
compare this evaluation after you have made changes based on the interest graph data
Use this data as part of your Content Strategy Planning
Comparison: Number of Facebook Posts

26
Secret #4: Cosmetic Brand’s Engagement Ranking
Figure 3. This graph compares the engagement on Facebook.
CoverGirl leads the pack, then Olay and Sephora for Facebook Engagement. The brands with the lowest engagement on Facebook are Elf Cosmetics and Bobbi Brown Cosmetics.
While Elf, CoverGirl and Bobbi Brown had the highest number of Facebook posts, Elf has the lowest level of engagement of all the brands. CoverGirl ranked second in the number of posts and has the highest level of Facebook engagement.
Key take-a-ways:
• Posting a large volume of content does not guarantee high engagement
• Evaluate the tops brands with respect to the number of posts and the engagement to help inform your social media strategy.
Comparison: Engagement on Facebook
Use this data as part of your Content Strategy Planning

27
Secret #4: Cosmetic Brand’s Engagement Ranking
Figure 4. This graph compares the total number of Facebook and Twitter posts
• Using this view of the data, you can easily see the overall winners and losers with respect to the volume of posts.
• Elf and Clinque top the list for volume of Facebook posts. Elf and CoverGirl top the list for the volume of Twitter posts.
Key take-a-ways:With a view of all the brands and the volume of posts on Facebook and Twitter, evaluate where your brand stands with respect to the volume of content posted.• Do you need to increase the volume of content you are creating
and posting?• Be sure to not only look at this graph, but also the next one which compares
the level of engagement• You want to optimize the volume of posts as well as the level of engagement• If you need to create a business case for a large content or social media
engagement plan, this type of data can provide the justification to either keep or expand your resources.
Comparison: Total Volume of Facebook and Twitter

28
Secret #4: Cosmetic Brand’s Engagement Ranking
Figure 5. This graph compares the level of engagement on Facebook and Twitter
• Using this view of the data, you can easily see that in the cosmetic industry, engagement is dominated by Facebook interactions. CoverGirl and Olay top the list for Facebook engagement. Elf and Bobbie Brown are at the post of the list for Facebook engagement. The Twitter engagement in comparison to the Face-book engagement is extremely low.
Key take-a-ways:
• With a view of all the brands and level of engagement on Facebook and Twitter, evaluate where your brand stands
• If you are lagging behind, you might want to evaluate the type of content and when the top brands are posting
• You want to optimize the volume of posts as well as the level of engagement• If you need to create a business case for a large content or social media en-
gagement plan, this type of data can provide the justification to either keep or expand your resources.
Comparison: Total Engagement of Facebook and Twitter

29
Secret #4: Cosmetic Brand’s Engagement Ranking
Figure 6. both the level of engagement as well as the post volume on Facebook and Twitter.
• Using this view of the data, you can easily see that in the cosmetic industry, engagement is dominated by Facebook interactions. CoverGirl and Olay top the list for Facebook engagement. Elf and Bobbie Brown are at the post of the list for Facebook engagement. The Twitter engagement in comparison to the Face-book engagement is extremely low.
Key take-a-ways:
• With a view of all the brands and level of engagement on Facebook and Twitter, evaluate where your brand stands
• If you are lagging behind, you might want to evaluate the type of content and when the top brands are posting
• You want to optimize the volume of posts as well as the level of engagement
• If you need to create a business case for a large content or social media en-gagement plan, this type of data can provide the justification to either keep or expand your resources.
Comparison: Total Engagement of Facebook and Twitter

30
Secret #4: Cosmetic Brand’s Engagement Ranking
Figure 7 . This graph compares the various types of con-tent used to engagement the cosmetic audience (this in-cludes content on both Facebook and Twitter
• Photos get the largest amount of engagement • Offers are the second most used type of content• Video is the third type of content • Status post are the seconds to last type of content
that drives engagement• And links are the least engaging
Many brands are enamored by videos. Everyone wants a video that goes viral. However, it doesn’t look like video would be a good investment unless you know you’re get-ting your videos out through other avenues like YouTube or AdWords ads. This information can be used as part of a strategic and budgeting decision for the CMO and the social media manager. It may be that the companies in the cosmetic industry would be better off putting the content creation budget into creating photos vs videos.
Key take-a-ways:
• Part of a content marketing strategy is to take the key mes-sages and decide what form they will be distributed as
• If your brand is focusing on links and status, those types of content get the lowest engagement and it might be a good idea to look at delivering the information in a form that gets more interactions
• Because photos and offers get the highest engagement, these need to be considered as part of the type of content to be used in campaigns.
• Evaluate your content type strategy and shift it to types of content that drive more engagement
Comparison: Type of Content For the Highest Engagement
Use this data as part of your Tactical Content Strategy

31
Secret #4: Cosmetic Brand’s Engagement Ranking
Figure 8. This graph compares the various types of con-tent and the level of engagement per day of the week
• This shows daily, average performance (sum of all brands) by type of content. Which day of the week is best for certain types of content?
• Wednesday is the day of the highest overall engage-ment and photo top the list of content types for that day Offers are the second most used type of content
• Saturday is the day with the least overall engagement and photo top the list of content types for that day
• Status updates are engaged with the most on Fridays• Mondays and Thursdays are the best days for getting
engagement with videos• The best day for engagement with offers is Tuesday
Marketers can use this data to determine what type of content to load into the content management system and deliver per day.
Key take-a-ways:• Does your team have a content calendar?• If the team has a content calendar, are they using it to post
(the various types of content) on the days where it has the best chance of being engaged with?
• Evaluate when you post your various types of content to make sure they will get the best engagement
Comparison: Enagement vs. Types of Content vs. Day of The Week
32
Secret #4: Cosmetic Brand’s Engagement Ranking
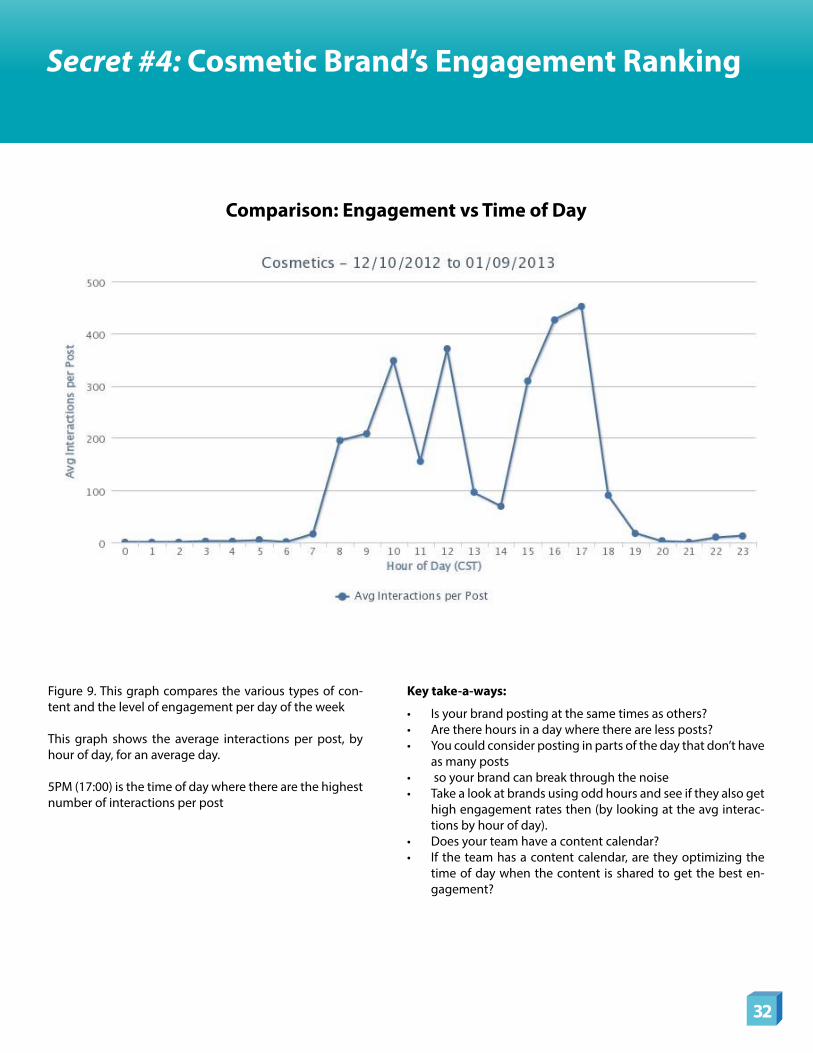
Figure 9. This graph compares the various types of con-tent and the level of engagement per day of the week
This graph shows the average interactions per post, by hour of day, for an average day.
5PM (17:00) is the time of day where there are the highest number of interactions per post
Key take-a-ways:
• Is your brand posting at the same times as others?• Are there hours in a day where there are less posts?• You could consider posting in parts of the day that don’t have
as many posts• so your brand can break through the noise• Take a look at brands using odd hours and see if they also get
high engagement rates then (by looking at the avg interac-tions by hour of day).
• Does your team have a content calendar?• If the team has a content calendar, are they optimizing the
time of day when the content is shared to get the best en-gagement?
Comparison: Engagement vs Time of Day

33
Secret #4: Cosmetic Brand’s Engagement Ranking
Figure 10 shows the top content brands with the top engagement are CoverGirl and Olay. In addition to the above graph, you can also see the type of content that is driving the results behind the graph.
Figure 11. The red squares outline the type of content: photo, the Brand: CoverGirl, the place where the photo was posted: Facebook and the number of Comments: 1,102 and the number of Likes: 94,978. number of interac-tions per post
Key take-a-ways:• By being able to not only see who ranks at the top for en-
gagement, you can also examine the content type and the type of interactions, Likes and Comments.
• Study this to determine how you can improve your tactics and strategy
Comparison: Engagement vs Day of the Week
34
Secret #4: Cosmetic Brand’s Engagement Ranking
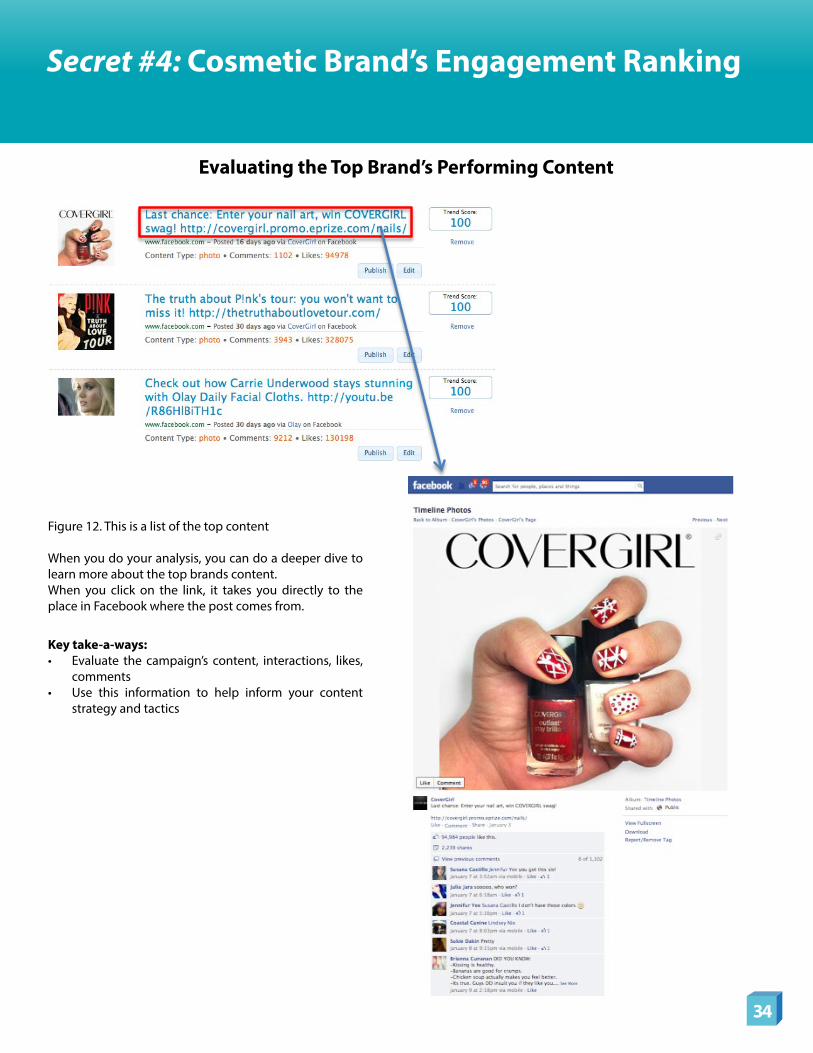
Figure 12. This is a list of the top content
When you do your analysis, you can do a deeper dive to learn more about the top brands content.When you click on the link, it takes you directly to the place in Facebook where the post comes from.
Key take-a-ways:• Evaluate the campaign’s content, interactions, likes,
comments• Use this information to help inform your content
strategy and tactics
Evaluating the Top Brand’s Performing Content

35
Secret #4: Cosmetic Brand’s Engagement Ranking
Figure 13. This is a list of the top content
When you do your analysis, you can do a deeper dive to learn more about the top brand’s content.By hitting the Publish button, you are taken directly to the brands trending content list
Key take-a-ways:• Evaluate the campaign’s content, interactions, likes,
comments• Use this information to help inform your content
strategy and tactics
Evaluating the Top Brand’s Campaigns cont’d

36
Secret #4: Cosmetic Brand’s Engagement Ranking
Figure 14. This is a list of the top content
When you do your analysis, you can do a deeper dive to learn more about the top brand’s content.
By hitting the Publish button, you are taken directly to the brands trending content list
Key take-a-ways:• Do you know who your brand’s top influencers are?• Have you engaged those influencers?• How does your influencer list compare to this list
for CoverGirl?• Have you engaged all these Twitter influencers?• What are your key social indicators?• How do they compare to other brands?• Use this content when creating your Twitter Strategy
and Tactical plans
List of “CoverGirl” Twitter Influencers

37
Secret #4: Cosmetic Brand’s Engagement Ranking
Figure 15. This is a list of the top content. Affinity or Partnership Marketing is a targeted way that complementary brands can leverage one another’s customer base. Wondering what brands your customers interaction with beyond yours? You can use these reports to look at brands outside your industry to evaluate consumer consumption behavior. Even if you aren’t competing with directly with Walmart, if your fans are interacting with them, you need to include that data to create your social media strategy. This analysis shows just Twitter, but the same analysis can be run for Facebook.
For example, CoverGirl fans are interacting Walmart, Burberry and WhoWhatWhere. These brands might represent opportunities for cross promotion and also consideration for ad placement. For example, WhoWhatWear.com provides the latest and greatest celebrity style, runway trends, and shopping suggestions from fashion and beauty experts. This could be a great site to place ads or do a promotion. Burberry might want to offer CoverGirl products on their site and vice versa.
Key take-a-ways:• Do you know who your fans are interacting with besides your brand?• Have you reached out to them to do joint partnerships?• Have you studied their sites to determine how they engagement fans with content?
List of Brands shared by “CoverGirl” fansUse this data as part of your Affinity Strategy Planning

38
Secret #4: Cosmetic Brand’s Engagement Ranking
Figure 16. This is a list of the content from some of CoverGirl’s Affinity Brands, BurBerry and Walmart
This view provides you with a strategic look at the content being posted from your Affinity Brands. By studying what Burberry and Walmart are doing, CoverGirl can more closely know what their fans find fascinating about these other brands.
Key take-a-ways:• Do you know the type of content your affinity brands post?• Have you looked at the content your affinity brands post?• Use this information to inform your overall content creation and distribution plan as well as with partnership planning
Evaluation of Content From CoverGirl’s Affinity BrandsUse this data as part of your Affinity Strategy Planning

39
Secret #4: Cosmetic Brand’s Engagement Ranking
Figure 17. This is a list of the top content via HyperCuration of the Interest Graph Data
It’s a common trend now that our business data sets are too big to capture and analyze manually. Why is big data such a big deal? McKinsey calls it “the next frontier for innovation, competition and productivity. Our customers are liking, commenting, sharing, tweeting, plussing and repinning. They’re telling us, through that big data, exactly which photos and videos and blog posts have the biggest impact on them. There’s a lot of this social data, and it’s not organized
Evaluating the Top Brand’s Hypercuration™ ContentUse this data as part of your Content Strategy Planning

40
==
Secret #4: Cosmetic Brand’s Engagement Ranking
Figure 18. Pushing the Publish button allows you to send that highly relevant content to your fans.
How do we turn this big data social media activity into something that gets results for businesses? We need to capture the right information and prioritize it. How can you organize all that social media activity to make it actionable? Well social networks are a barometer for relevance. Hypercuration leverages social media big data to help you curate content that you already know is engag-ing, viral, and hot right now.
Post from this highly relevant list of content, you just push the publish button. A dialogue box comes up and allows you to post the content to your fanbase. So using the Hypercuration capability, you can find and then post the best content. When you do that, it creates very relevant social media conversations around your brand. And by using the tool to find the content, you don’t have to create a ton of new content or outsource it someone else to create content.
Key take-a-ways:• Evaluate the top, hot, relevant content that your fan base is interested in• Choose the posts that you feel are most relevant to your fanbase
Evaluating the Top Brand’s HyperCuration Content Cont’dUse this capability as part of your Tactical Planning Strategy

41
Secret #5: Winning Brands Know Where to Get Their Interest Graph Data

42
Secret #5: Winning Brands Know Where to Get Their Interest Graph Data
By studying and applying the insights from theirreports, brands see >30% increase in engagement
Evaluating the Top Brand’s HyperCuration Content Cont’d
Instant data at your fingertips
The new industry engagement reports valuate & compare to competitors:
• Change / improve strategy• Drive tactical outcomes:• Brand Engagement• Content Decisions• Best type of content • When to post the content• Better editorial calendaring• Optimal channels to post in• Ad Targeting Optimization
Strategic and Tactical:Content Marketing Calendar for optimal engagement andbusiness results

43
Secret #5: Winning Brands Know Where to Get Their Interest Graph Data
Evaluating the Top Brand’s HyperCuration Content Cont’d
1. Download your Own Vertical Industry Report Go to http://smo.infinigraph.com to download your brand’s vertical industry data.
2. Evaluate Your Own BrandDevelop a deep understanding of your cus-tomer’s behaviors, interests and favored media content types and channels to create dynamic social interactions that add value to both the brand and to the customers interacting with the brand, Figure 10. This will help you express the brand in an authentic and compelling ways.
3. Evaluate Your CompetitorsWith a deep understanding of your own brand’s standing, evaluate the top content and en-gagement compared to your brand, Figure 10. Make appropriate changes to your engagement strategy and tactical plans around content type, channel, time and day of interaction.
4. Create a Strategic Content Marketing Calendar With the analysis in the previous two steps, cre-ate a strategic content marketing calendar that specifies the type of content and the time of day to release it per channel. This also includes calendarizing reposts of content.
5. Understand the Data for Content Marketing Strategy That Drives EngagementContent marketing strategy generates highly-qualified leads for sales, shortening the sales cycle, and creating more loyal customers who buy more often.
Use the information in these reports to not only improve your engagement and optimize your content performance but also drive more customer’s through the marketing funnel and increase lead conversion rates and customer lifetime value and thus your overall ROI on your social and digital communication expenditures.

44
Secret #6: Winning Brands Use A 7-Step Strategy Planning Process

45
Secret #6: Winning Brands Use A 7-Step Strategy Planning Process
Consumer adoption of social media has greatly exceeded most brands ability to integrate it into “how they do business.”
The problem for business? Customers expect their online experiences with brands to reflect the same two-way, engaging interactions they have with friends and family.
Why is engagement so important?
Some of the biggest minds in business have shown a direction correlation between business results & engaging customers.
Word-of-mouth advocacy is a top driver of pur-chase and overall growth:
• The London School of Economics found that strong customer advocacy, on behalf of a com-pany, is one of the best predictors of top-line growth.
• McKinsey & Company says 67% of all consumer purchase decisions are primarily influenced by word-of-mouth. Bain and Satmetrix found that advocacy leaders grow at an average rate of 2.5x faster their competitors.
How Social Media Can Increase Your Brand’s Engagement
A clear brand strategy provides a unique identity to differentiate a company from the competition so it can focus on making, creating, and selling products and services to target customers. Branding not only keeps the company top-of-mind to customers, but also provides distinctive qualities driving exclusiv-ity and brand preference. Paid, earned and owned media planning and execution requires content In-telligence. Content strategies must be driven based on crowd interactions. Brands need to validate what content works, eliminating the guesswork.

46
Secret #6: Winning Brands Use A 7-Step Strategy Planning Process
Marketers need a strategy for digital & social media marketing budgeting & planning
Most brands skip steps 1 through 4 and get really tactical by jumping into Step 5, the Interaction Step. So without understanding that there are precursors to getting solid, bottom-line business results, they open up a twitter account, get a facebook Page and start posting things like, “Happy Monday or Buy Our Stuff.” And then they wonder why there’s no or little return on investment for social media. Brands need a process and tools to take insights and inform not only their strategy but also their tactical planning.
Without following some sort of process to bench-mark and evaluate engagement, interactions and content, you can see why many brands are frustrated with the outcome of social media. The problem is most brands don’t spend the time gaining insights (Step 1) into their audience and content or
Engagement Marketing. They think they know their audience, but the fact is that they generally don’t have a list of their top brand ambassadors and customers and their twitter and facebook identi-ties. And they have not used a tool like the industry reports in this paper to determine affinity content.
Most brand aren’t using anything to standardized their social media bet practices. They don’t bench-mark themselves over time or against their competi-tors (Step 2) Without some way to measure how engaging their content is or how it stack up against their competitors, they can’t benchmark where they are and great obtainable goals. This is one reason social media seems like a random post fest.
UCLA Anderson’s Business School Brand Engagement

47
Secret #6: Winning Brands Use A 7-Step Strategy Planning Process
It can provide real business results, but to get there brands must use tools to benchmark themselves. And without that information, they are ill equipped to understand their audiences (Step 3) enough to know how to design content that engages their audiences (Step 4) . And without this type of data and analysis, they create “Buy our stuff”- type interac-tions (Step 5) and are at a loss for how to explain the thousands or millions of dollars they are spending on “Likes & Like-Gating” activities and little improve-ment in key metrics or results. Which creates less alignment and more politics (Step 6) .
What’s even worse is that most brands are moving so fast and focusing on the tactical, day to day of social media that they don’t use interest graph data to understand what is working and what is not working. They need to take a note from start-ups who have adopted am iterate and pivot philosophy (Step 7.) The key is to constantly beware of what is happen-ing with your brand and make daily, weekly, monthly and yearly decisions based on data.
UCLA Anderson’s Business School Brand Engagement

48
Secret #6: Winning Brands Use A 7-Step Strategy Planning Process
Step 1: Gathering The Right Insights Using a social media interest graph platform, evaluate customer conversations and use the data and insights to create a social brand strategy and tactical program to enhance en-gagement and content performance.
• Gather the right insights about how well the strategy and tactical plans are working. • Capture consumer insights with interest graph data: - Online habits - Brand affinities - Online conversations - Influencers, advocates and brand ambassadors - Purchase behaviors…• With this information, assess not only how the strategy and tactical plans evolve over time, but also de-
termine how the strategy stack-ups against competitors over time.
Step 2: Creating a Measurement Practice Set-up business goals, strategy & tactical plans from your benchmarks and measure-ments with metrics to measure progress & ROI
• Set-up your measurement practice using the benchmarks for the brand & the competitors from the interest graph data
• These critical benchmarks provide a basis for not only evaluating the social media and marketing spend, but also a way to evaluate its effectiveness overtime
• Examine how the content and posting strategy perform compared to competitors• Use the Industry Report’s hypercuration capabilities to discover which content in your niche works the
best. • Are you doing similar things to the top performers?• What can you learn from the top performers?• With this insight, data interpretation and market analysis, determine key topics and trends use this infor-
mation to create actionable insights to consider when creating strategy and tactical plans• Update your interest graph data reports monthly• Examine the hypercuration of content of your competitors daily using the industry reports• Ask yourself, “Are my expenditures being wasted or are they highly effective compared to competitors?”• This marks the beginning of a social media measurement program, i.e., a way to assess, benchmark and
measure success.
Your Guide To Brand Strategy & Tactical Engagement Planning

49
Secret #6: Winning Brands Use A 7-Step Strategy Planning Process
Step 3: Connecting to Your Audience Use the data to understand a brand’s audience and to shape business decisions about constructing the rest of the social media program
With the information from Steps 1 and 2, a brand can easily move into Step 3Use the interest graph data to understand what engagement means to your customers so that you can devise ways to truly connect to your audience and develop an emotional bond:What are customers talking about?What and whom are they passionately interacting with?Who are your top influencers, customers, advocates, followers?What press or media is following or interacting with your brand?What other brands are your fans interacting with?Who follows your competitors?What types of social media posts gets the most interactions with your target audience?
Step 4: Creating Engaging Content Use social media interest graph data and the audience analysis, to create content that will engage target audiences
This step is your content planning, creation and curation strategyAudit your current inventory of contentWhat do you have?How well did it perform?What should you add based on the analysis of the Interest Graph Data?What type of content is most engaging to your audience?User-generated content, conversion-based content, trust-building content, educational content, games, etc…What type of content are your competitors are creating and sharing?Note that understand what Interests your particular audience helps direct relevant content by extracting long-tail interestsWith this information, you’ll have insights into what consumers are attracted to

50
Secret #6: Winning Brands Use A 7-Step Strategy Planning Process
Step 5: Designing Galvanizing Interactions Using the previous step’s data, develop interaction strategies and plans for all function departments- individually and to work together, synergistically
• How much more engaging is your brand compared to your competitors?• How much more engaging is your brand over time?• Where is your audience is sharing your content?• Which channels provide the best interactions and engagement?• Where should your content be posted for higher engagement? Long-term vs short-term?• What days of the week and times of the day should you post content on any given channel?• What trends and themes drive the best engagements?• How can you use social targeting better based on interests and brand preferences to close more leads
and sales?• How can you use social engagement to drive customer loyalty and long-term brand preference?
Step 6: Stop the Politics & Align for SuccessGain executive sponsorship for your digital marketing and social media initiatives and thereby reduce the politics and get done what you need to do
With interest graph data to inform your strategic and tactical plans, devise your overall strategy and set-up meetings with various stakeholders. Be prepared to show them:
• Budget• Plan• Data that backs up your plan including, interest graph data for your brand and your competitors
Ask each stakeholder:• Why they think the plan will work• What obstacles might make it difficult to implement in the current organization• Who the best person is to champion the plan• Why they would or would not support the plan
Determine what tools and software exits in your organization and be prepared to define your choice of tools
Create interdepartmental collaboration by asking for other department’s input and look to share tools across departments to reduce overall costs with master agreements and reduce misinformation when inter-acting with customers in public forums like Twitter and Facebook
Prevent public fopas or doing things that drive stock price down & send customers running to your competitors. Work cross-functionally with other departments to leverage the investments in your digital, social marketing plans to increase their effectiveness by empowering PR/Marketing, Sales, Customer Service.

51
Secret #6: Winning Brands Use A 7-Step Strategy Planning Process
Step 7: Pivot And IterateTaking a note from lean, agile philosophies, with this evaluation, continously iterate and pivot your strategic and tactical plans. Pivoting means a wholesale change in the way business gets done. Iterating is a minor change to how business gets done. Both are geared so that the business can get better results.
What we are looking at is not just about campaign iteration, but also looking beyond the tactics of launch-ing one campaign and then going to the next one. It’s really about truly analyzing your business and your business results and then getting rid of what doesn’t make sense and changing how things get done. This can be very difficult for large organizations that are knee deep in politics. Those ships are hard to turn. Deci-sion by committee usually ends up in a less valuable decision than it could be.
If your brand, company, division or department is ready to enter the stream of Social Business, then it needs two things. One, have a culture that rewards pivoting and iterating. Two, the right data to make better deci-sions. It’s not easy to slow the ship down and get people to look up from their computers and smart phones. But sometimes you have to slow down to go fast. If the leadership is willing to slow down enough to do the research, analyze the data and make new types of decisions, those brands will end up winning in the end. Those that don’t will continue doing things the way they always have and if the customer’s aren’t into it, they will vote with their feet. And that is the whole purpose of the interest graph data. To know and under-stand your customer’s and their engagement with your brand. Only you can decide if you need to pivot or iterate your business.
This 7 Step process provides a repeatable process to optimize: • Strategic and tactical direction• Content planning, creation and curation• Campaign creation and community management• Customer segmentation, activation and acquisition• Return on investment in social media and digital communications
If you make a habit out of using data to inform your Social Media
Engagement Initiatives, you’ll be a winner and have something
to celebrate!

52
Author: Dr. Natalie Petouhoff
Social Business Builders: The Results Group™Providing Top Brands With the Latest in Social Media Strategy and Tactical Advice
As a Forrester Analyst, Dr. Natalie led the pack by writing one of the world’s 1st social media ROI models. Today companies rely on Dr. Natalie’s 7 Steps to FastTrack Social Media Business Success to help them create a plan, justify it to upper management, track the progress, do more of the right things and integrate it with traditional business objectives to obtain an ROI. This includes: 1. Benchmarking Your Social Media Capabilities:
Your Capabilities Ranking vs. Competitors
2. Setting Business Goals: Your Business Case, Measurement Program & Dynamic ROI Dashboard & Scorecard
3. Determining Target Audiences: Identify Customers & Ambassadors For Higher WOM
4. Establishing A Content Strategy: Create Content To Intentionally DriveBusiness Goals
5. Creating an Interaction Strategy: Design Audience Engagement, Integrate w/ Traditional Business Processes & Scale it by Choosing Social Software
6. Training Executives & Staff: Align Business Objectives, Skills & Organizational Change
7. Pivoting & Iterating: Update Your Social Media Scorecard & Optimize Goals and Plan Dr. Natalie’s 7-step process provides companies with a customized, benchmark report; a scorecard comparing them to their competitors and a strategic/tactical short/long-term plan based on best practices.
This process is so successful its one of the world’s first social business courses anywhere and why UCLA Anderson’s Business School & UCLA Extension chose Dr. Natalie’s 7 Steps to FastTrack Social Media Business Success because it delivers unprecedented, real-world business results.
Connect with Dr. Natalie on Twitter at @drnatalie
andwww.drnatalienews.com

53
Author: Dr. Natalie Petouhoff
As a sought after thought leader, Dr. Natalie’s work is featured in Huffington Post, USAToday, Adage, BusinessWeek, Fast Company, The New York Times and The Wall Street Journal; is the subject of four books including Like My Stuff: How to Monetize Facebook; numerous best practice white papers and makes her a top choice as a TV commentator.
As an accomplished keynote speaker at OMMA, Gartner, SMAC, WOMMA, Digital Hollywood, Forrester… and on her radio program, TheSocialNetworkShow.com, Dr. Natalie enlightens, empowers and inspires listeners. And Dr. Natalie’s social media ROI videos have set the precedent for businesses to take social media seriously:
Want to see how to get an ROI from Social Media? Check out these fun videos: Video 1: Building the Business Case for Social MediaVideo 2: How to Measure the ROI of Social MediaVideo 3: How Social Media Benefits the Whole Company
Here’s Dr. Natalie’s book on how businesses can drive sales on Facebook: Like My Stuff: How To Monetize Your Facebook Fans
Want to get more info on the business use of social media? Connect with Dr. Natalie here:Twitter: @drnatalieLinkedIn: DrNataliePetouhoffG+: Google Plus postsFacebook: https://www.facebook.com/natalie.petouhoff
KeyNote Speech- Steps to Gain Higher Social Media ROIAMA Webinar on Social Engagement & Customer Experience

54
Author: Lisa M. Schwartz
Lisa M. Schwartz
• MBA specializing in marketing and business management. Works with Dr. Natalie in conducting research, social media business assessments, brand audits, organizational change management, traditional market planning integrated with social media.
• Creates custom strategic business programs in social business/media, leadership and employee motivation, specializing in customer service, CRM and social media.
• Experienced business analyst, program manager, data center, network operations and contact center manager.
• Author of two business books, many white papers on the topics of technology adoption, change management, call centers, customer service and social media.
• Former positions: Vice President and Director Product Marketing Oracle Corporation, Business Management Director at Accenture and Hitachi, Management positions at Cedars-Sinai, Intertainer, Geffen Records.

55
Appendix
References:
http://www.pr2020.com/blog/2012-social-media-marketing-statshttp://m.marketingprofs.com/charts/2012/9184/2013-b2b-content-marketing-benchmarks-budgets-and-trendshttp://www.business2community.com/content-marketing/5-barriers-to-implementing-a-small-business-content-marketing-plan-0313376http://www.contentmarketinginstitute.com/2012/10/7-content-marketing-strategies-for-2013/
Definitions:
Content: Pictures, video, text… that is posted online
Engagement: When your fans interact with our brand. Fans interact with the content you brand posts, i.e., with pictures, videos, text, etc…
Content Marketing: Developing content that has your key messages in it and use that content to engage your fans.
Customers: People who buy your products and services.
Curation: The process of collecting highly relevant content.

56
Appendix
Trademark InformationThis report mentions by name several cosmetic brands, including reference and usage of their individual logos, service marks or other trademarked material. The absence of a product or service name or logo belonging to any of the cosmetic brands men-tioned in this report or any of its affiliates anywhere in the text of this report does not constitute a waiver of trademark or other intellectual property rights concerning that name or logo. No license to or right in any such trademarks, patents, copyrighted materials, trade secrets, technologies, products, processes and other proprietary rights, of these other parties is implied, granted to or conferred.
Creative Commons Licensed ImagesSome of the photos/images used in this report are available under a Creative Commons Attribution-Noncommercial license. Unless noted, all other illustrative works, charts, tables or graphs are copyrighted by Infinigraph and should not be used without written permission.
Photo by Courtney Rhodes
Photo by Olivia Proença
Photo by Patrick Hoesly
Photos by Maria Morri