the social wellbeing of new york city's neighborhoods: the
TRANSCRIPT

University of Pennsylvania University of Pennsylvania
ScholarlyCommons ScholarlyCommons
Culture and Social Wellbeing in New York City—2014-2017 Social Impact of the Arts Project
3-2017
The Social Wellbeing of New York City's Neighborhoods: The The Social Wellbeing of New York City's Neighborhoods: The
Contribution of Culture and the Arts Contribution of Culture and the Arts
Mark J. Stern University of Pennsylvania, [email protected]
Susan C. Seifert University of Pennsylvania, [email protected]
Follow this and additional works at: https://repository.upenn.edu/siap_culture_nyc
Part of the Arts and Humanities Commons, Public Policy Commons, Quantitative, Qualitative,
Comparative, and Historical Methodologies Commons, and the Urban Studies and Planning Commons
Stern, Mark J. and Seifert, Susan C., "The Social Wellbeing of New York City's Neighborhoods: The Contribution of Culture and the Arts" (2017). Culture and Social Wellbeing in New York City—2014-2017. 1. https://repository.upenn.edu/siap_culture_nyc/1
The Culture and Social Wellbeing in New York City project was undertaken in collaboration with Reinvestment Fund, a community development financial institution, with support by the Surdna Foundation, the NYC Cultural Agenda Fund in the New York Community Trust, and the University of Pennsylvania. The research was conducted between 2014 and 2017.
This paper is posted at ScholarlyCommons. https://repository.upenn.edu/siap_culture_nyc/1 For more information, please contact [email protected].

The Social Wellbeing of New York City's Neighborhoods: The Contribution of The Social Wellbeing of New York City's Neighborhoods: The Contribution of Culture and the Arts Culture and the Arts
Abstract Abstract This research report presents the conceptual framework, data and methodology, findings and implications of a three-year study of the relationship of cultural ecology to social wellbeing across New York City neighborhoods. The team gathered data from City agencies, borough arts councils, and cultural practitioners to develop a 10-dimension social wellbeing framework—beginning with construction of a cultural asset index—for every neighborhood in the City’s five boroughs.
The social wellbeing tool enabled a variety of analyses: the distribution of opportunity across the City; identification of areas with concentrated advantage, concentrated disadvantage, and “diverse and struggling” neighborhoods with both strengths and challenges; and analysis of the relationship of “neighborhood cultural ecology” to other features of community wellbeing. Major findings include: 1) Cultural resources are unequally distributed across the city, with many neighborhoods having few resources. 2) At the same time, there are a significant number of civic clusters—that is, lower-income neighborhoods with more cultural resources than their economic standing would lead us to predict. 3) Although lower-income neighborhoods have relatively few resources, these neighborhoods demonstrate the strongest relationship between culture and social wellbeing. Notably, if we control for socio-economic status and ethnic composition, the presence of cultural resources is significantly associated with improved outcomes around health, schooling, and personal security. Qualitative study highlighted how neighborhood cultural ecology also contributes to other dimensions of wellbeing—in particular, social connection, political and cultural voice, and the public environment and public sphere.
Disciplines Disciplines Arts and Humanities | Public Policy | Quantitative, Qualitative, Comparative, and Historical Methodologies | Urban Studies and Planning
Comments Comments The Culture and Social Wellbeing in New York City project was undertaken in collaboration with Reinvestment Fund, a community development financial institution, with support by the Surdna Foundation, the NYC Cultural Agenda Fund in the New York Community Trust, and the University of Pennsylvania. The research was conducted between 2014 and 2017.
This research report is available at ScholarlyCommons: https://repository.upenn.edu/siap_culture_nyc/1
THE SOCIAL WELLBEING OF NEW YORK CITY’S NEIGHBORHOODS:
THE CONTRIBUTION OF CULTURE AND THE ARTS
Mark J. Stern and Susan C. Seifert
University of Pennsylvania
Social Impact of the Arts Project March 2017
This project was generously supported by the Surdna Foundation, the New York City Cultural Agenda Fund in the New York Community Trust, and the University of Pennsylvania. The project was undertaken in collaboration with Reinvestment Fund, a community development financial institution. The views expressed are solely those of the authors.
For information about the Social Impact of the Arts Project (SIAP) or a downloadable copy of the research report and summary, visit the SIAP Collections at Penn Libraries’ ScholarlyCommons: http://repository.upenn.edu/siap/.
CONTENTS
Introduction
Chapter 1—Conceptual Framework
Chapter 1 outlines the two key concepts of the report. Neighborhood cultural ecology focuses on the relationship between social context and the clustering of cultural assets in particular neighborhoods. We employ the idea of social wellbeing as a multi-‐dimensional framework that assesses residents’ opportunity to live a life they have reason to value.
Chapter 2—Measuring New York City’s Cultural Assets
Chapter 2 describes our approach to developing estimates of four types of cultural assets at the neighborhood level: nonprofits, for-‐profits, employed artists, and cultural participants. We then combine these four measures into a Cultural Asset Index that we use to identify several types of cultural clusters across the five boroughs.
Chapter 3—Measuring Social Wellbeing in New York City
Chapter 3 describes how we estimate nine other dimensions of social wellbeing. We then combine these and the Cultural Asset Index to identify four types of social wellbeing clusters in New York City.
Chapter 4—Analytical Perspectives on Culture and Social Wellbeing in New York City
Chapter 4 focuses on the relationship between neighborhood cultural ecology and other dimensions of social wellbeing. In particular, we analyze the relationship between the Cultural Asset Index and measures of health, personal security, and school effectiveness.
Chapter 5—Community Perspectives on Culture and Social Wellbeing in New York City
Chapter 5 uses interviews conducted with community-‐based cultural practitioners to explore the relationship between culture and social wellbeing. We focus on three dimensions of wellbeing: social connection, political and cultural voice, and the public environment and public sphere.
Chapter 6—Conclusion
The Conclusion summarizes the key concepts and findings of the study, identifies implications for policy and further research, and looks ahead to ongoing work on the project.
APPENDIX

Introduction
This report presents the current findings of a study of culture and social wellbeing in New York City conducted by the University of Pennsylvania Social Impact of the Arts Project (SIAP) in collaboration with Reinvestment Fund. The project began in the fall of 2014 when SIAP accepted an invitation from Tom Finkelpearl, Commissioner of Cultural Affairs for the City, to conduct a study of the social value of the arts.
The study builds on SIAP’s over twenty years of research and writing on the non-‐economic impact of the arts on urban communities. During that time, SIAP has formulated a perspective on culture’s role in urban neighborhoods based on the idea of neighborhood cultural ecology or “natural” cultural districts. We’ve completed a variety of studies—typically combining quantitative data analysis and qualitative evidence from interviews and observation—in a number of cities, including Philadelphia, Seattle, and Baltimore.
In 2011 SIAP, The Reinvestment Fund and the City of Philadelphia Office of Arts, Culture, and the Creative Economy were funded by the National Endowment for the Arts’ Our Town program and by ArtPlace America to complete what became the CultureBlocks project. Much of that project focused on the creation of an online cultural and community asset mapping application. However, the research element of the project focused on integrating a new concept—social wellbeing—into our conceptualization of the social role of the arts. Based on preliminary work undertaken by Mark Stern and Ira Goldstein with the students in their Urban Studies course at Penn, the goal was to develop a multidimensional model of social wellbeing, which drew on the work of a group of international scholars including Amartya Sen, Joseph Stiglitz, and Martha Nussbaum.
Our research differed from earlier international work on wellbeing, known as the capability approach, in three ways. First, we conceptualized culture as a core dimension of wellbeing, specifically as one dimension of social connection. Second, we wanted to explore culture as a potential contributor to other dimensions of wellbeing. Third, our goal was to estimate social wellbeing at the neighborhood level, rather than at a larger geography (typically nation-‐state). Our previous work on neighborhood ecology (and, of course, the large body of theoretical and empirical work on the ecological approach) had convinced us that only a focus on small geographies provides a full understanding of social wellbeing as experienced by urban residents. The original analysis of Philadelphia’s social wellbeing index and the relationship between culture and other dimensions was completed in December 2013.
In the meantime, the Surdna Foundation approached SIAP about continuing the investigation of culture and social wellbeing in other American cities. In early 2014 SIAP began the Surdna-‐funded work, which included updating of the work in Philadelphia and preliminary investigation of the feasibility of similar studies in Austin, Baltimore, and several other cities.
ii
Commissioner Finkelpearl’s invitation disrupted this work. From a relatively small exploratory study of a new topic in several mid-‐sized cities, the study became an intensive research project in a single large city. Indeed, when we realized that New York City is more than five times larger than Philadelphia, we decided to consider the project a five-‐city study—Bronx, Brooklyn, Manhattan, Queens, and Staten Island.
The research design for the New York project followed what we had used in Philadelphia. It essentially consists of four parts:
• Create an inventory of cultural assets at the neighborhood level.
• Use existing data to estimate a multi-‐dimensional model of social wellbeing at the same geography.
• Analyze the relationship between culture and other dimensions of wellbeing, controlling for selected determinants of wellbeing.
• Conduct a series of interviews in selected neighborhoods to provide a ground-‐level view of these phenomena.
The report is organized around a presentation of our approach and findings based on this research design. Chapter 1 discusses the conceptual framework—focused on cultural ecology and social wellbeing—that was the foundation of the study. Chapter 2 documents the construction of a four-‐part database of cultural assets. Chapter 3 presents our indexes of social wellbeing, including cultural assets, and how advantage and disadvantage cluster in different neighborhoods across the five boroughs. Chapter 4 presents the analysis of the statistical relationship of cultural assets and social wellbeing at the neighborhood level. Chapter 5 discusses perceptions of the relationship between culture and social wellbeing based on interviews and field study. Finally, Chapter 6 recaps the conceptual framework, highlights major findings and implications for policy and research, and outlines ongoing work on the project.
SIAP views a successful project as one that generates two new questions for each one we tried to answer. By this metric, this has been a very successful project. In other words, no research project is ever really over, and in a city as dynamic as New York, that is certainly the case.
SIAP has accumulated many debts during the past two years. First, our partners at Reinvestment Fund, especially Ira Goldstein, have been critical to our ability to realize the project as it was proposed. Ira’s colleagues, including Bill Schrecker and Colin Weidig, have provided important methodological support for the project as well.
Commissioner Finkelpearl and his colleagues at the NYC Department of Cultural Affairs have made important contributions to the work. In particular, Deputy Commissioner Eddie Torres, Shirley Levy, and Kathi Hughes provided practical support during the course of the project. We especially want to thank David Andersson, who is no longer with the Department, for walking us through the nitty-‐gritty details of the Department’s
iii
data and for pushing us to clarify our analyses.
The NYC Mayor’s Office of Operations was critical to the development of the social wellbeing index. Director Mindy Tarlow, Morgan Monaco, and Vicky Virgin have been a pleasure to work with. We particularly want to thank Jintana Chiu. Whenever we hit a dead end finding data for one of our indexes, an email from Tina would put us back on the right path. Through Tina we made contact with a number of NYC staff members who facilitated our use of data from the Departments of Education and Health and Mental Hygiene and the Administration for Children’s Services.
Members of the nonprofit cultural community were generous with their time and data. The nonprofit cultural inventory, the cultural participation estimates, and of course our qualitative work in several neighborhoods would not have been possible without the cooperation of many directors and staff members of these organizations. We recognize them later in the report when we discuss these aspects of the research. All contributing organizations are listed in the Appendix.
The University of Pennsylvania, where SIAP is based, has provided a welcoming and supportive environment in which to conduct this work. The Urban Studies program crew, including Elaine Simon, Michael Nairn, and Vicky Karkov, experienced a blow-‐by-‐blow account of the project as it unfolded and provided material and emotional support. Dean John Jackson of the School of Social Policy and Practice has been supportive of the project, including facilitating a scholarly leave for Mark without which it would have been nearly impossible to complete the project.
In addition to Penn’s financial support, the project benefited from several grants from both the Surdna Foundation and the NYC Cultural Agenda Fund in the New York Community Trust. We want to thank Judilee Reed and Jess Garz at Surdna; Kerry McCarthy, Salem Tsegaye, and Michele Baer of the New York Community Trust; and Michelle Coffey of the Lambent Foundation.
In particular we want to thank Joan Shigekawa, who has been our cheerleader and wise advisor for more years than either she or we want to count.
Needless to say, we are solely responsible for any shortcomings in the present report.
Chapter 1—Conceptual Framework
Much of the research team’s energy over the past two years has been devoted to the minutia involved in gathering and analyzing mounds of data on culture and other dimensions of wellbeing in New York City. And indeed, a majority of the pages that follow are devoted to discussion of this pursuit.
However, it would be a mistake to perceive this study as primarily a technical task, “crunching data” as the saying goes. At its core, this project is animated by an interest in filling out the narrative of American cities like New York. As historian Michael Katz noted several years ago, the dominant narrative of American cities since World War II has been one of failure. In particular, it has been a story of government failure. Katz was startled to find that this story of government failure had its origins with progressive social analysts of the 1960s and 1970s who concluded that government’s efforts across many social institutions—schools, social welfare, housing and development—had too often served special interests rather than the public good. However, over time, the narrative of failure was appropriated by conservative commentators who have used it to justify cuts in government programs and increased reliance on markets.1
Katz called upon scholars to formulate a new and more balanced narrative, one that didn’t ignore the frequent failures of government policy but rather gave sufficient weight to its successes as well. The project described in the following chapters can be seen as an effort to provide a balanced account of some central features of social policy in New York. In particular, as Katz noted, a proper account of policy needs to take into account the strong pressure exerted on social policy by structural forces—notably, globalization and the concentration of economic power—as well as intentional social action, the willingness of groups and individuals to literally change the course of history.
One of the striking conclusions of the research team is that one reason we give too much weight to structural forces and too little weight to intentional social action is because we have much better data for the former than for the latter. Any undergraduate, with a few quick clicks on their computer, can produce maps that illustrate the deep social divisions that characterize our society.
1 Michael B. Katz, Why Don’t American Cities Burn? (Philadelphia, University of Pennsylvania Press, 2012), 151-‐162.

I-‐2
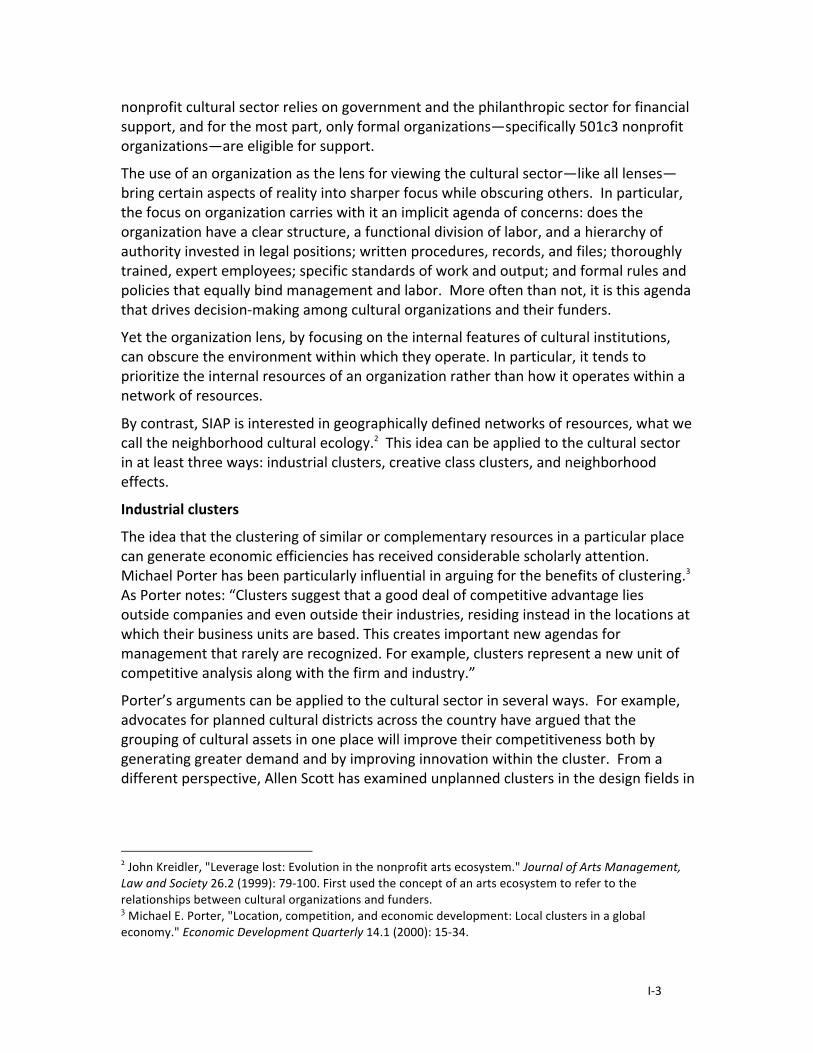
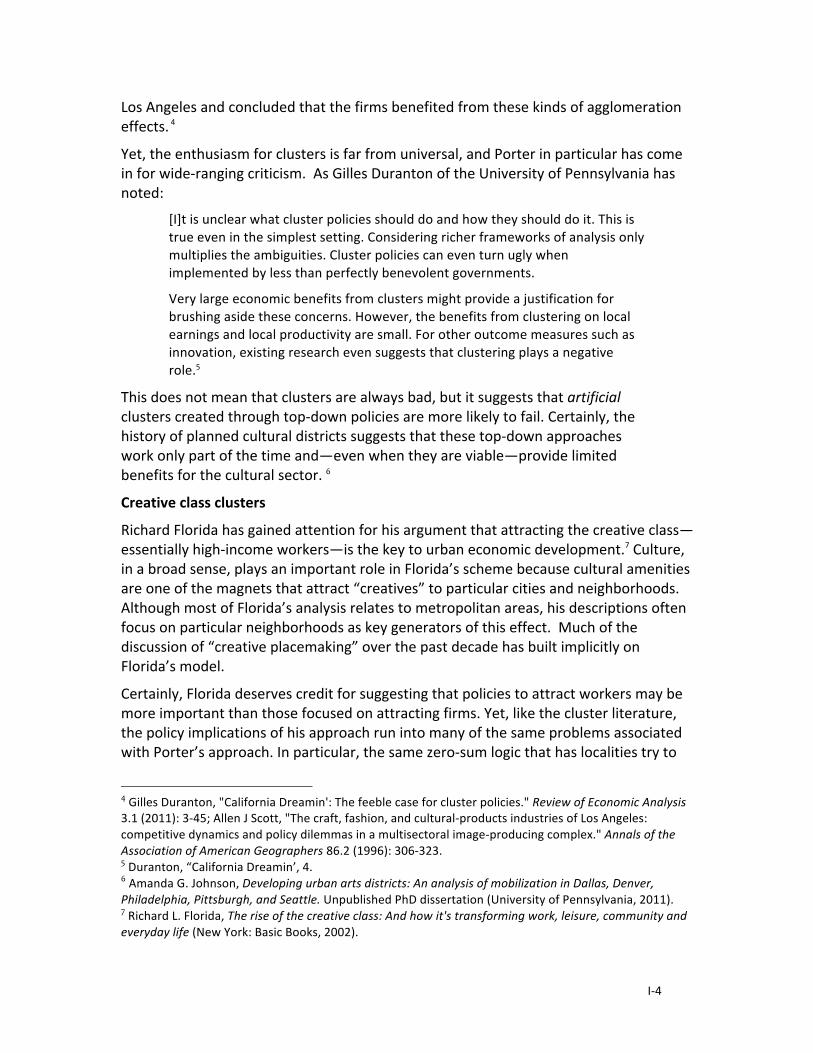
Poverty rate, New York City census tracts, 2011-‐2015. Source: Prepared by Social Explorer.
In contrast, the sources of data we have to understand the forces of intentional social action are quite limited. One contribution of this study is provide evidence of this kind of intentional action in one sphere, that of cultural engagement.
But the construction of this new balanced narrative requires more than just better data. Convincing narratives need good theories as well as solid data. We need ideas that allow us to capture the richness of the urban experience. Although the narrative of political and economic power is critical to understanding the contemporary city, if one starts only with stories of power, one will end with stories of power. Therefore, in this report, we’ve sought to balance a focus on the exercise of power by the powerful with two conceptual frameworks that take into account the actions of a wider range of the populace and civil society. This chapter focuses on the role of two sets of concepts —cultural ecology and social wellbeing—that help us make sense of their role and influence.
Neighborhood Cultural Ecology
Most studies of the cultural sector use the cultural organization as their “unit of analysis.” There are many good reasons for this. After all, cultural organizations are legal entities with officers, boards, and reporting requirements. Just as importantly, the
Poverty rate, New York City census tracts, 2011-‐15
I-‐3
nonprofit cultural sector relies on government and the philanthropic sector for financial support, and for the most part, only formal organizations—specifically 501c3 nonprofit organizations—are eligible for support.
The use of an organization as the lens for viewing the cultural sector—like all lenses—bring certain aspects of reality into sharper focus while obscuring others. In particular, the focus on organization carries with it an implicit agenda of concerns: does the organization have a clear structure, a functional division of labor, and a hierarchy of authority invested in legal positions; written procedures, records, and files; thoroughly trained, expert employees; specific standards of work and output; and formal rules and policies that equally bind management and labor. More often than not, it is this agenda that drives decision-‐making among cultural organizations and their funders.
Yet the organization lens, by focusing on the internal features of cultural institutions, can obscure the environment within which they operate. In particular, it tends to prioritize the internal resources of an organization rather than how it operates within a network of resources.
By contrast, SIAP is interested in geographically defined networks of resources, what we call the neighborhood cultural ecology.2 This idea can be applied to the cultural sector in at least three ways: industrial clusters, creative class clusters, and neighborhood effects.
Industrial clusters
The idea that the clustering of similar or complementary resources in a particular place can generate economic efficiencies has received considerable scholarly attention. Michael Porter has been particularly influential in arguing for the benefits of clustering.3 As Porter notes: “Clusters suggest that a good deal of competitive advantage lies outside companies and even outside their industries, residing instead in the locations at which their business units are based. This creates important new agendas for management that rarely are recognized. For example, clusters represent a new unit of competitive analysis along with the firm and industry.”
Porter’s arguments can be applied to the cultural sector in several ways. For example, advocates for planned cultural districts across the country have argued that the grouping of cultural assets in one place will improve their competitiveness both by generating greater demand and by improving innovation within the cluster. From a different perspective, Allen Scott has examined unplanned clusters in the design fields in
2 John Kreidler, "Leverage lost: Evolution in the nonprofit arts ecosystem." Journal of Arts Management, Law and Society 26.2 (1999): 79-‐100. First used the concept of an arts ecosystem to refer to the relationships between cultural organizations and funders. 3 Michael E. Porter, "Location, competition, and economic development: Local clusters in a global economy." Economic Development Quarterly 14.1 (2000): 15-‐34.
I-‐4
Los Angeles and concluded that the firms benefited from these kinds of agglomeration effects. 4
Yet, the enthusiasm for clusters is far from universal, and Porter in particular has come in for wide-‐ranging criticism. As Gilles Duranton of the University of Pennsylvania has noted:
[I]t is unclear what cluster policies should do and how they should do it. This is true even in the simplest setting. Considering richer frameworks of analysis only multiplies the ambiguities. Cluster policies can even turn ugly when implemented by less than perfectly benevolent governments.
Very large economic benefits from clusters might provide a justification for brushing aside these concerns. However, the benefits from clustering on local earnings and local productivity are small. For other outcome measures such as innovation, existing research even suggests that clustering plays a negative role.5
This does not mean that clusters are always bad, but it suggests that artificial clusters created through top-‐down policies are more likely to fail. Certainly, the history of planned cultural districts suggests that these top-‐down approaches work only part of the time and—even when they are viable—provide limited benefits for the cultural sector. 6
Creative class clusters
Richard Florida has gained attention for his argument that attracting the creative class—essentially high-‐income workers—is the key to urban economic development.7 Culture, in a broad sense, plays an important role in Florida’s scheme because cultural amenities are one of the magnets that attract “creatives” to particular cities and neighborhoods. Although most of Florida’s analysis relates to metropolitan areas, his descriptions often focus on particular neighborhoods as key generators of this effect. Much of the discussion of “creative placemaking” over the past decade has built implicitly on Florida’s model.
Certainly, Florida deserves credit for suggesting that policies to attract workers may be more important than those focused on attracting firms. Yet, like the cluster literature, the policy implications of his approach run into many of the same problems associated with Porter’s approach. In particular, the same zero-‐sum logic that has localities try to
4 Gilles Duranton, "California Dreamin': The feeble case for cluster policies." Review of Economic Analysis 3.1 (2011): 3-‐45; Allen J Scott, "The craft, fashion, and cultural-‐products industries of Los Angeles: competitive dynamics and policy dilemmas in a multisectoral image-‐producing complex." Annals of the Association of American Geographers 86.2 (1996): 306-‐323. 5 Duranton, “California Dreamin’, 4. 6 Amanda G. Johnson, Developing urban arts districts: An analysis of mobilization in Dallas, Denver, Philadelphia, Pittsburgh, and Seattle. Unpublished PhD dissertation (University of Pennsylvania, 2011). 7 Richard L. Florida, The rise of the creative class: And how it's transforming work, leisure, community and everyday life (New York: Basic Books, 2002).

I-‐5
outbid one another in seeking firms can result in a city trying to become cooler than its competitors without knowing the costs and benefits of that competition. What is more, as Florida acknowledges, his approach encourages cities to divert scarce resources to a relatively privileged part of the community, which implies reducing resources for less privileged households and neighborhoods.
Neighborhood effect
Although the two previously discussed perspectives on clustering are relevant for the study of the cultural sector, neighborhood effect is the only one with explicit links to social wellbeing. Thus we use the concept of cultural ecology to refer to the relationships and networks among cultural resources in a neighborhood-‐level geography and hypothesize that these geographically defined networks generate a set of spillover effects that enhance social wellbeing.
Social scientists have long recognized that one’s immediate surroundings exert powerful influences on individual behavior. Yet, for a number of decades, these influences were treated less as a phenomenon to study and more as a methodological flaw to overcome. Indeed, even today, many social investigators point to social experiments, in which subjects are randomly assigned to a treatment or control group, as the “gold standard” of evaluation research. In this context, investigators often treat the fact that urban residents are more likely to live in communities with people like themselves as a “selection bias” to be overcome.
Yet, at the same time that social experiments have gained stature, an alternative school of thought has returned to an older ecological tradition associated with the Chicago school of sociology. This tradition takes neighborhood ecology not as a problem to be overcome, but as a phenomenon to be explained. A number of sociologists—most notably Robert Sampson and his collaborators—have argued that the ecology of a neighborhood exerts a powerful effect on the wellbeing of its residents. Specifically, Sampson has argued that concentrated disadvantage and collective efficacy have significant predictive power on crime and other forms of anti-‐ and pro-‐social behavior.8
The ecological perspective is relevant not only to the cultural sector. Manuel Castells has noted that the emerging world economy is being driven by the networked enterprise. Across the global economy, integrated and bureaucratic organizations are being supplanted by flexible networks that respond quickly to changes in their environment. 9
A fuller understanding of the structure and functioning of the community cultural sector is a foundation on which to develop more effective intervention strategies. Understanding the sector’s dynamics enhances the potential for influencing its
8 Robert J Sampson, Great American city: Chicago and the enduring neighborhood effect (Chicago: University of Chicago Press, 2012. 9 Manuel Castells, The Rise of the Network Society (Malden, Mass. and Oxford, England: Blackwell Publishers, 1996), 151-‐200.

I-‐6
development and amplifying its impact on urban neighborhoods and the wider cultural community.
A shift from an organization–based paradigm of the cultural sector to an ecological model is more likely to value the substantial assets that cultural agents bring to their work. Rather than focusing on the organizational deficits of cultural providers, one is more likely to see their “lean” organizational structure as an asset that allows them to take advantage of shifting opportunities in an ever-‐changing environment. Rather than trying to change individual groups by holding them to a single standard of the “good” organization, one is more likely to focus on how the functioning of institutional networks could be improved by reducing structural holes and expanding the transfer of information and other intangible resources.
Conceptually, then, we see neighborhood cultural ecology as a system composed of the various agents who operate in the cultural sector and the relationships between them. Agents include formal nonprofit and for-‐profit organizations—both those focused primarily on the arts and culture and non-‐arts organizations that offer cultural opportunities—as well as informal cultural actors. Resident artists and cultural participants fill out the ecosystem. The ecosystem includes not only the links connecting neighborhood resources but also those between neighborhoods and the broader metropolitan or national field, including regional cultural providers and funders.
A focus on neighborhood cultural ecology also places the contribution of culture in a broader perspective. Ecologies are systems of interdependence, not one-‐way relationships. Rather than suggesting that cultural resources in a neighborhood “cause” particular outcomes, we argue that they are one ingredient of a healthy, connected community. At the same time, the presence of an active community cultural sector can be seen as one outcome of a livable neighborhood.
One challenge posed by this approach, however, is methodological. In contrast to the many measures we have of neighborhood divisions and deficits, we have relatively few measures of community strengths. Sampson, for example, required a massive research project to demonstrate the role of collective efficacy in the wellbeing of Chicago.

I-‐7
Measuring cultural assets, therefore, provides one additional means of taking the pulse of neighborhood vitality.
To operationalize the concept of neighborhood cultural ecology in New York City, we began by focusing on the core set of agents: nonprofits, for-‐profits, artists, and participants. We then used a set of illustrative case studies to provide a fuller understanding of the social networks and relationships that bind these entities to their communities and to the city as a whole.
Social Wellbeing and the Capability Approach
The other key concept on which this project is based is that of social wellbeing. We define social wellbeing as a set of objective opportunities available to individuals and families that enhance their life chances. Our conceptualization is indebted to a large body of international scholarship on the topic, much of which is associated with an economic theory called the capability approach.
The Capability Approach10
The capability approach grew out of the critique of a narrow economic definition of social welfare. It attempts to define welfare as neither an objective level of consumption nor a subjective level of satisfaction that an individual gains from a particular market basket. Instead, it focuses on the ability of individuals to pursue a particular type of functioning, whether or not they choose to take advantage of it. As economist Amartya Sen notes:
The well-‐being of a person can be seen in terms of the quality (the well-‐ness, as it were) of the person’s being. Living may be seen as consisting of a set of interrelated ‘functionings,’ consisting of beings and doings. . . . Closely related to the notion of functionings is that of the capability to function. It represents the various combinations of functionings (beings and doings) that the person can achieve. Capability is, thus, a set of vectors of functionings, reflecting the person’s freedom to lead one type of life or another.11
The distinction between capability and functioning puts particular focus on the issue of freedom. It is this ability to have a choice between different sets of “goods” (or sets of functionings) that differentiates the capability approach from the traditional focus on the market basket of goods that an individual actually achieves. For Sen, this freedom to choose is an additional “good” that adds to a person’s wellbeing.
10 Also referred to as the capabilities approach. Much of this section is based on Mark J. Stern and Susan C. Seifert, “Creative capabilities and community capacity,” in Hans-‐Uwe Otto and Holger Ziegler, eds. Enhancing Capabilities: The Role of Social Institutions (Opladen, Berlin, Toronto: Barbara Budrich Publishers, 2013), 179-‐196. 11 Amartya Sen, Inequality Re-‐examined. (New York and Cambridge, Mass.: Russell Sage Foundation and Harvard University Press, 1992), 39-‐40.
I-‐8
Capabilities and creativity
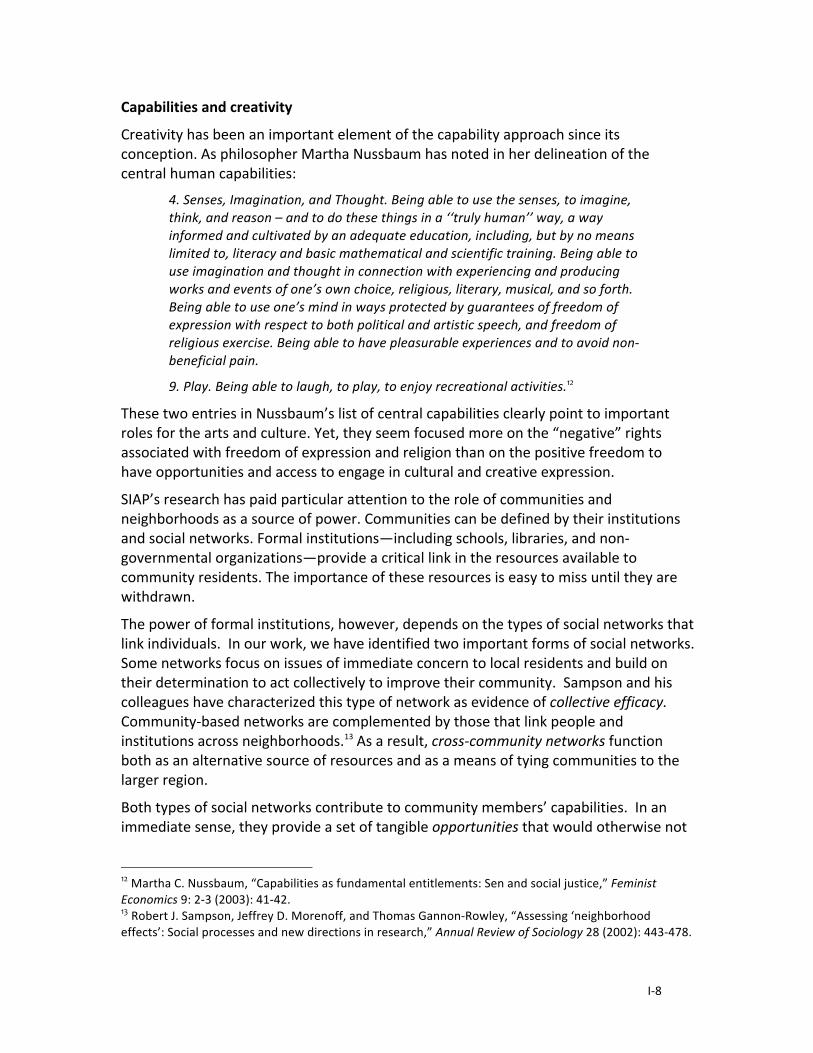
Creativity has been an important element of the capability approach since its conception. As philosopher Martha Nussbaum has noted in her delineation of the central human capabilities:
4. Senses, Imagination, and Thought. Being able to use the senses, to imagine, think, and reason – and to do these things in a ‘‘truly human’’ way, a way informed and cultivated by an adequate education, including, but by no means limited to, literacy and basic mathematical and scientific training. Being able to use imagination and thought in connection with experiencing and producing works and events of one’s own choice, religious, literary, musical, and so forth. Being able to use one’s mind in ways protected by guarantees of freedom of expression with respect to both political and artistic speech, and freedom of religious exercise. Being able to have pleasurable experiences and to avoid non-‐beneficial pain.
9. Play. Being able to laugh, to play, to enjoy recreational activities.12
These two entries in Nussbaum’s list of central capabilities clearly point to important roles for the arts and culture. Yet, they seem focused more on the “negative” rights associated with freedom of expression and religion than on the positive freedom to have opportunities and access to engage in cultural and creative expression.
SIAP’s research has paid particular attention to the role of communities and neighborhoods as a source of power. Communities can be defined by their institutions and social networks. Formal institutions—including schools, libraries, and non-‐governmental organizations—provide a critical link in the resources available to community residents. The importance of these resources is easy to miss until they are withdrawn.
The power of formal institutions, however, depends on the types of social networks that link individuals. In our work, we have identified two important forms of social networks. Some networks focus on issues of immediate concern to local residents and build on their determination to act collectively to improve their community. Sampson and his colleagues have characterized this type of network as evidence of collective efficacy. Community-‐based networks are complemented by those that link people and institutions across neighborhoods.13 As a result, cross-‐community networks function both as an alternative source of resources and as a means of tying communities to the larger region.
Both types of social networks contribute to community members’ capabilities. In an immediate sense, they provide a set of tangible opportunities that would otherwise not
12 Martha C. Nussbaum, “Capabilities as fundamental entitlements: Sen and social justice,” Feminist Economics 9: 2-‐3 (2003): 41-‐42. 13 Robert J. Sampson, Jeffrey D. Morenoff, and Thomas Gannon-‐Rowley, “Assessing ‘neighborhood effects’: Social processes and new directions in research,” Annual Review of Sociology 28 (2002): 443-‐478.
I-‐9
be available. In addition, the connections they foster provide a means through which residents can express their views and thus the potential for influence.
If institutions and networks are the “stuff” of community assets, then we would hypothesize that the availability of these assets—and the fact that not all communities have them in equal quantities—should influence individuals’ ability to translate their creative capabilities into functionings. Although the state might theoretically guarantee all residents the right to self-‐expression or a livelihood, it is only the presence of actual means of translating those rights into behavior that assures residents’ capabilities.
There is a further implication of this line of thought. If institutions and networks are critical to capabilities, then it makes sense that community context provides an important link between capabilities. Many of the institutions and networks that distinguish neighborhoods are tied to particular capabilities. Health and social service organizations promote health and bodily integrity. Recreational and cultural institutions promote affiliation as well as imagination. Social justice institutions contribute to control over one’s environment. If these institutions are concentrated in particular places, one could hypothesize that the presence of institutions that promote one type of capability could contribute as well to the realization of others. From an empirical standpoint, one would expect to find a statistical relationship between the various functionings—that is, neighborhoods with evidence of one functioning would be likely to display other benefits as well.
Frankly, scholars have been more successful at conceptualizing the capability approach than in translating those concepts into empirical research. However, over the past decade, several studies have sought to undertake this operationalization. For the present project, the 2009 report of the Commission on the Measurement of Economic Performance and Social Progress, convened by the president of France and headed by Amartya Sen and Joseph Stiglitz, has been particularly influential.14 Their report proposes eight dimensions on which wellbeing could be measured:
• Material living standards • Health • Education • Personal activity, including work • Political voice and governance • Social connection • Environment • Insecurity—both social and physical
14 Joseph E. Stiglitz, Amartya Sen, and Jean-‐Paul Fitoussi, Report by the Commission on the Measurement of Economic Performance and Social Progress (Paris: Commission on the Measurement of Economic Performance and Social Progress, 2009).
I-‐10
The current project, while inspired by the Sen and Stiglitz report, seeks to move beyond it in several ways. First, rather than seeing the arts and culture as an adjunct element, we see it as a central element of social connection. Second, rather than focusing on national level measurement, we seek to focus on a smaller geography, ideally a collection of a few city blocks that defines a census tract or block group.
The move from nations to neighborhoods posed a number of challenges for the research. First, whereas issues of inequality are central to the capability approach discussion, most inequality does not happen within block groups but rather between them. Second, we discovered that the eight-‐dimension model was difficult to operationalize at a small geography. Several dimensions in the Sen/Stiglitz model—political voice is the best example—are meaningful only at the national level. Talking about variation in freedom of expression across city blocks makes little sense. In addition, several dimensions of wellbeing were so strongly related—in particular, material standard of living, educational attainment, and labor force engagement—that we decided to treat them as a single dimension of economic wellbeing. We divided Stiglitz and Sen’s health dimension into two dimensions, one representing health access and a second incorporating the health conditions of the population. In addition, we added a measure of economic and ethnic diversity, because of the importance of economic and ethnic segregation and diversity in American cities. Finally, Stiglitz and Sen’s study did not identify housing as a separate dimension of wellbeing. For these reasons, the Sen/Stiglitz eight-‐dimension framework was transformed into the 10-‐dimension framework that we discuss in Chapter 3.
The two concepts proposed in this chapter—neighborhood cultural ecology and social wellbeing—provide the foundation for the following chapters. As we dive into the project’s empirical findings, however, it is important to keep in mind that their importance derives from how they illustrate and flesh out these concepts and how those implications might provide guidance for more effective policy by government and philanthropy.

Chapter 2—Measuring New York City’s Cultural Assets
The first task of the project was to develop a map of New York City’s cultural assets. SIAP conceptualizes cultural assets as consisting of four types of resources—nonprofit cultural providers, for-‐profit cultural firms, resident artists, and cultural participants.
We’ve given particular priority to nonprofit cultural providers because they serve as a critical link between neighborhoods and cultural engagement. Unfortunately, their importance has not been matched by comprehensive documentation of the sector. In particular, most data on nonprofit cultural providers are focused on those institutions that seek and receive government and philanthropic funding. As a result, much of the labor exerted by project staff was directed at pulling multiple sources together to develop a citywide nonprofit cultural inventory.
Estimating cultural participation was also a challenge. Most efforts to measure cultural participation have relied on surveys, like the National Endowment for the Arts’ Survey of Public Participation in the Arts. Surveys, however, rarely have the density of respondents necessary to make estimates below a county-‐ or city-‐level. Because of SIAP’s commitment to an ecological perspective, these sources are inadequate.
We therefore undertook a pilot project to develop estimates of cultural participation based on the administrative records of a sample of New York City’s cultural organizations, a laborious task. However, thanks to the cooperation of the participating organizations—and the availability of data associated with IDNYC—we made a first approximation of cultural participation at the neighborhood level. While far from perfect, these estimates give us an initial glimpse into how cultural participants are distributed across the five boroughs.
Construction of the other two cultural indexes—the for-‐profit inventory and estimates of resident artists—was less complicated in that we relied on existing data sources. Still, they required significant effort to clean the data and to convert them for spatial analysis.
The final steps of the analysis consisted of developing synthetic indexes of cultural assets. The Cultural Asset Index (CAI) used data reduction techniques to develop a single index to summarize an area’s cultural resources. We also developed a corrected CAI, which incorporated data on economic advantage in order to identify sections of the city that were “outperforming” their expected level of cultural resources.

II-‐2
Nonprofit Cultural Inventory
The major task of the project during 2015 was to develop an inventory of nonprofit cultural resources in the five boroughs. SIAP began with the IRS Master File of tax-‐exempt organizations and used a variety of sources to validate organizations’ continued existence and the accuracy of address information. These data were then supplemented with information from the NYC Department of Cultural Affairs, the borough art councils, and the Foundation Center. The data were further supplemented with web searches and other sources to identify embedded programs and “informal” cultural providers not captured by more standard sources.
Clearly, there are entire strata of cultural providers that our methods don’t capture. It doesn’t capture the cultural engagement of religious congregations or artists who perform in the city’s parks or subways, which would have required far more resources than we had at our disposal. Still, we see our inventory as a reliable estimate of the distribution of nonprofit cultural resources across the city’s neighborhoods.
The Department of Cultural Affairs (DCLA) database on applicants to the Cultural Development Fund (CDF) over the past three years (FY15, FY14, and FY13) provided an excellent starting point for this inventory. The data represent current information on approximately 1,250 active organizations known to DCLA that therefore did not require validation. Moreover, for CDF grantees, DCLA provided location information on home offices as well as program sites that allows for a level of analysis we have not been able to undertake in other cities.
As noted in the Culture section of OneNYC1, DCLA grantees tend to be concentrated in sections of Manhattan and Brooklyn. However, the data on program sites (see map below) provide quite a different picture of the distribution of cultural opportunities and of under-‐served neighborhoods. Many cultural programs occur at non-‐arts community organizations (e.g., schools and senior centers) as well as community-‐based arts spaces. During the next phase of our work, we plan to assess program sites by type of setting as well as depth of programming, differentiating sites with on-‐going programs from those that host only one or two programs a year.
Construction of the current nonprofit cultural database involved the following tasks: validation of 3,200 records from the IRS Master File of Exempt Organizations (2014); linking Cultural Development Fund grantees and applicants with the IRS data; and cross-‐checking the five borough arts councils’ organizational listings and Foundation Directory grantee data against the master list. The Foundation Directory file of grantees over the past four years (2012-‐2015) numbers just over a thousand. Its primary contribution was to identify non-‐arts organizations that received funding for an arts or cultural project. Unfortunately, the Foundation Directory data do not include address information, which
1 City of New York, OneNYC: The Plan for a Strong and Just City (New York: NYC Office of the Mayor, April 2015), 78-‐83. http://www.nyc.gov/html/onenyc/downloads/pdf/publications/OneNYC.pdf

II-‐3
required project staff to use a variety of sources to identify this information and add them to the master file.
The current nonprofit inventory includes approximately 4,700 cultural programs across the city. It provides a first look at the clustering of cultural resources in some neighborhoods as well as neighborhoods having very few resources.
NYC Department of Cultural Affairs, Cultural Development Fund grantees and program sites, by poverty rate, New York City census tracts, 2013-‐14. Source: SIAP calculation (see text).
II-‐4
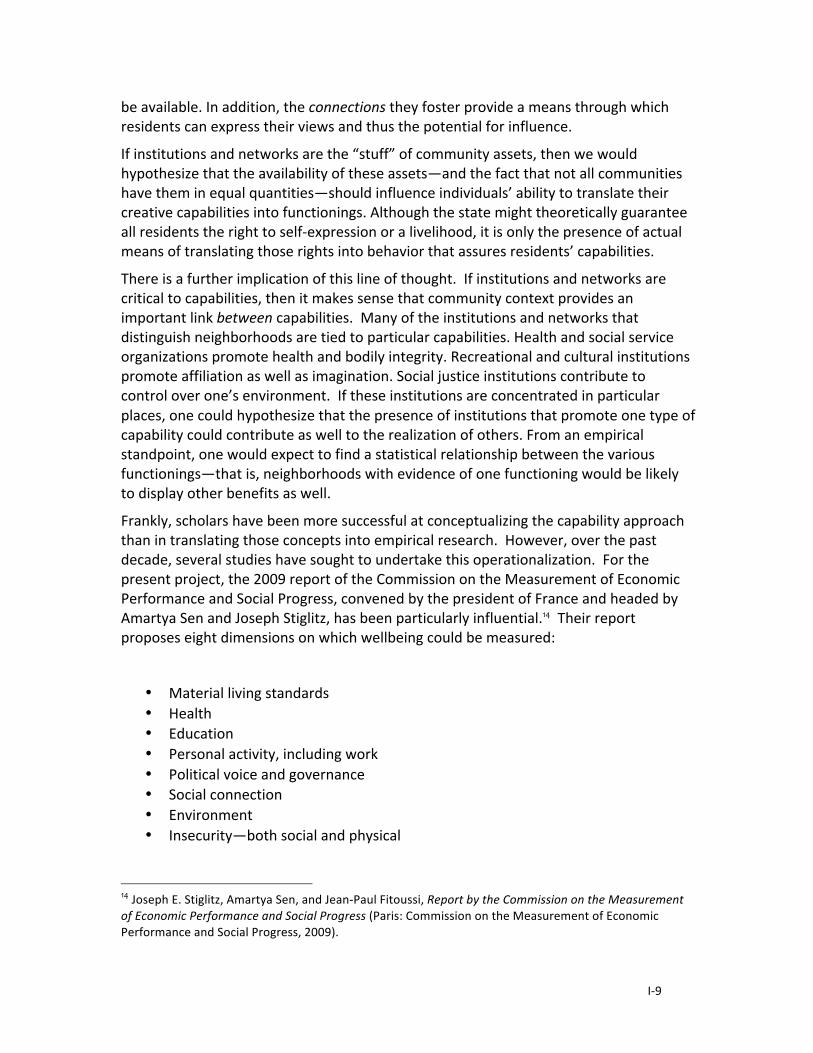
Total nonprofit cultural resources within a quarter mile, New York City block groups, 2013-‐15. Source: SIAP calculation (see text).
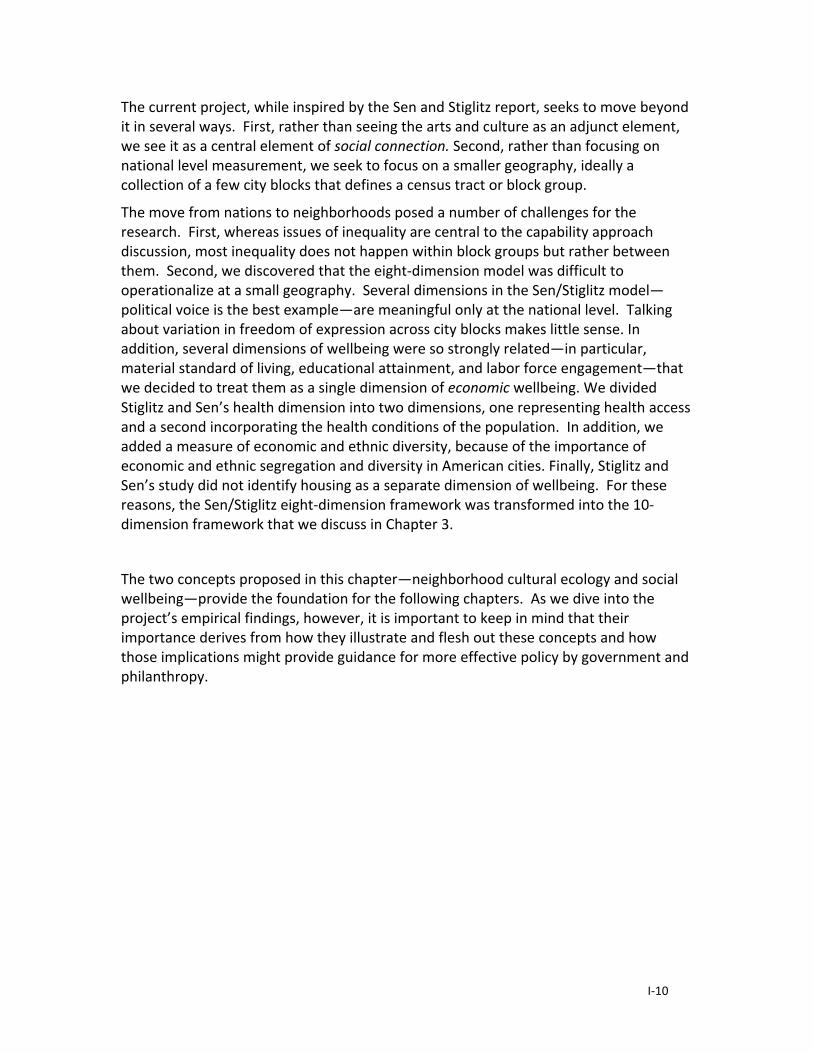
For-‐profit Cultural Firms
SIAP has used a proprietary database (ReferenceUSA) as the basis for its estimates of the presence of for-‐profit cultural resources in the city. This database of commercial culture, which numbers over seventeen thousand (17,000) businesses, has been crosschecked against the nonprofit database to eliminate duplicates.
The table below lists 23 classifications of cultural businesses and the number and percent of firms citywide in each category. The map that follows shows the relative density of for-‐profit cultural businesses within a quarter-‐mile (walking distance) of each block group across the city.

II-‐5
Type of cultural firm Number of
firms Percent
Audio-‐visual (e.g. recording studios, video production) 1,828 10.2
Photography 1,704 9.5
Architects 1,675 9.3
Galleries 1,567 8.7
Publishing 1,495 8.3
Interior design 1,306 7.3
Graphic designers 1,125 6.3
Music (dealers, instruction, arrangers) 1,082 6
Cultural business services (entertainment bureaus, agents, consultants) 880 4.9
Theater 872 4.8
Broadcasting 631 3.5
Craft (pottery, picture framing, fabric) 619 3.4
Book stores 537 3
Designers 343 1.9
Other entertainers 342 1.9
Dance 317 1.8
Printing 277 1.5
Visual arts 209 1.2
Broadcast, news 202 1.1
Literary arts 200 1.1
Antiques, collectors, art 171 1
Fabricators 166 0.9
Advertising 158 0.9
Total 17,981 100
For-‐profit cultural firms by type, New York City, 2014. Source: SIAP calculation from Reference USA.
II-‐6
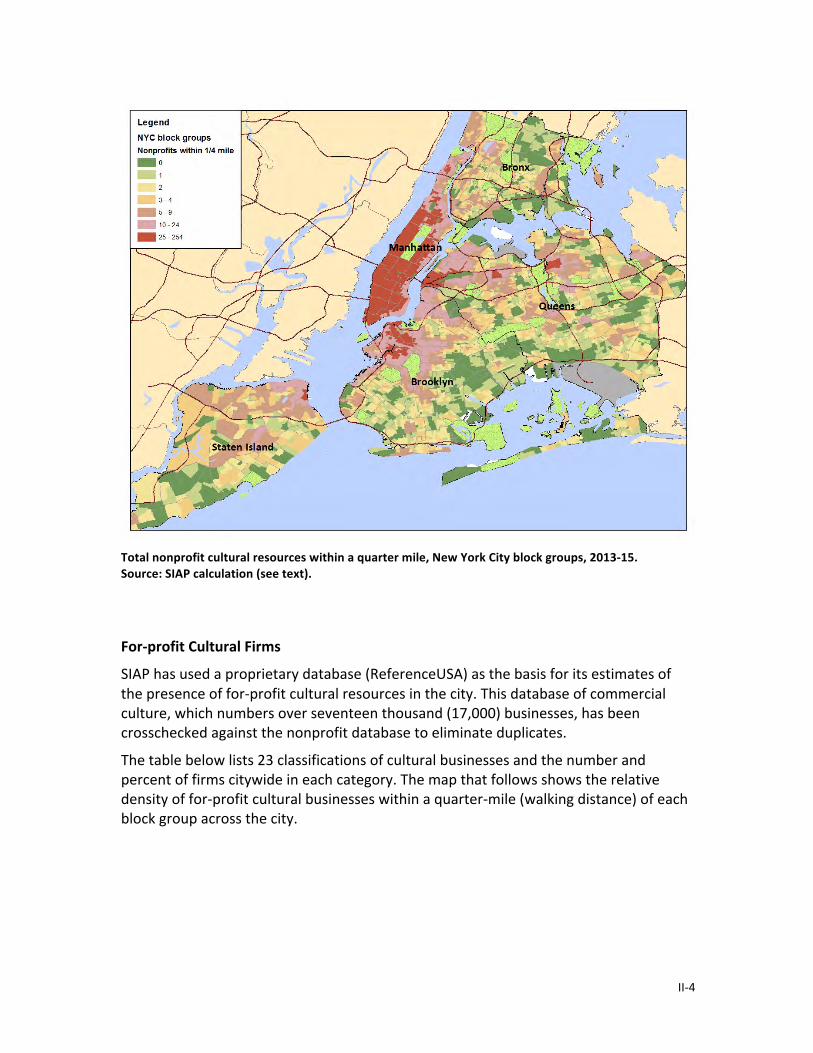
Total for-‐profit cultural firms within a quarter-‐mile, New York City block groups, 2014. Source: SIAP calculation from ReferenceUSA.
Resident Artist Estimates
SIAP had planned to use databases maintained by funders that make grants to artists as the foundation of its resident artist database. In previous studies, we had been able to collect street address and/or zip code information for applicants, which allowed us to locate artists in neighborhoods. However, after reviewing administrative data from several funders—which typically do not track place of residence—we concluded that these sources provide a less accurate picture of where artists live in New York City than do existing census data. We have therefore adopted a method of using aggregate and micro census data to make estimates of the presence of resident artists.

II-‐7
Artists as percent of civilian employment within a quarter mile, New York City block groups, 2009-‐13. Source: American Communities Survey, 2009-‐13.
Our estimates of resident artists derive from data at two different geographies: individual counts of artists’ occupations for “Public Use Microdata Areas” (PUMAs) and census tract and block group counts for a composite category—“arts, design, entertainment, sports, and media occupations.” The PUMAs are much larger areas than tracts or block groups, so although we know how many artists live in a PUMA, we don’t know precisely where in the PUMA they live. We could assume that the artists are evenly distributed across the PUMA, but that is likely to lead to overestimates in some tracts and under-‐estimates of artists in others. This is where the tract or block group information helps. Because we know the distribution of the composite category in each tract or block group, we can improve our estimate by assuming that the artists are likely to be distributed across the PUMA in the same pattern as the composite category. So, operationally, we estimate the number of artists in a particular tract or block group by multiplying the number in the composite category by the PUMA estimate of the percent of the composite category that are artists.

II-‐8
An example will make this easier to understand. PUMA 4006 in Brooklyn includes 26,341 residents employed in the broader category (arts, design, entertainment, sports, and media occupations) of which 18,716 (or 71 percent) are specifically in an artists’ occupation. Ninety-‐eight census block groups lie within this PUMA. In the western end of the PUMA (Prospect Heights), the percent of residents employed in arts, design, entertainment, sports, and media occupations ranges as high as one quarter of the employed labor force; while in the eastern section (Crown Heights North) these occupations represent less than 2 percent of workers in many block groups. To calculate the number of artists for a block group, we multiply the number employed in arts, design, entertainment, sports, and media occupations by the PUMA estimate of the percent in the composite category that are in a specific artists’ occupation (71 percent). The resulting percent of the employed population in an artists’ occupation ranges from zero to 14 percent.
Estimated artists as percent of civilian labor force, PUMA 04006, Brooklyn, New York City block groups, 2009-‐13. Source: American Community Survey, 2009-‐13.

II-‐9
In addition to the possible errors introduced by the estimation technique and by sampling error within the American Community Survey, the method is limited by its focus only on workers who list an artists’ occupation as their primary means of earning a living. Obviously, thousands of artists have a non-‐arts “day job,” which is how they would be enumerated by the census. The current utility of the census data is to identify clusters of workers in primary artists’ occupations and compare them with the geography of nonprofit and for-‐profit cultural resources. Cultural Participation in New York City
Cultural participation is a critical dimension of understanding the neighborhood cultural ecology of New York City. For our study, we used data gathered from over 50 cultural organizations in the City to look at the geography of cultural participation. By analyzing these data spatially, we are able to see where in the city cultural participants are most likely to reside and to examine the socio-‐economic profile of cultural participants.
In many ways, cultural participation in New York City is unique. Compared to other cities investigated by SIAP, New York is a national and international cultural destination. With respect to cultural offerings as well as the size and renown of its cultural venues, New York is more than a local cultural ecosystem. Given the goals of this project, however, we did not consider the tourist or visitor side of cultural participation. Rather we restricted ourselves to how New York City residents participate in nonprofit culture.
Data and methods
The data for this analysis came from two sources. The primary source is the cultural participation database developed by SIAP based on administrative data gathered from a sample of organizations that received grants from NYC Department of Cultural Affairs (DCLA). In addition, DCLA provided zip code level data on the uptake of IDNYC-‐related membership among the City-‐supported cultural organizations.2 These data were then distributed across the city’s block groups in proportion to the percent of the zip code’s population that lived in them.
SIAP cultural participation database
To estimate cultural participation, based on a methodology developed in Philadelphia, SIAP used administrative databases maintained by cultural organizations. By gathering data from a sample of organizations for members, subscribers, registrants, donors, and ticket-‐buyers with geographic identifiers, we were able to link the concentration of participation to specific geographies within the city. Ideally, these data would be full street addresses, but in some cases the data available identified only zip codes. Development of the participation database was a three-‐stage process:
2 “Museums and cultural institutions” https://www1.nyc.gov/site/idnyc/benefits/museums-‐and-‐cultural-‐institutions.page
II-‐10
• Selecting a sample of cultural organizations; • Contacting the organizations and seeking an agreement for sharing data; and • Geocoding and aggregating the data to census block groups.
Selecting an organization sample
Data for NYC participation estimates came from two groups of Cultural Affairs’ grantees: the Cultural Development Fund (CDF), which provides annual support to approximately one thousand New York City-‐based cultural organizations; and the Cultural Institutions Group (CIG), 33 cultural organizations that receive dedicated operating support from the City.
Obviously, this is not a representative sample of the more than four thousand cultural providers we’ve identified across the city. However, as a pilot project focused on testing a method of estimating cultural participation, the project team decided it was best to focus our efforts on established organizations that would be more likely to possess geographically-‐specific data on where their participants live. Indeed, several DCLA staff members expressed skepticism that even the more established groups would have data that would be useful to the project.
Cultural Development Fund (CDF) sample
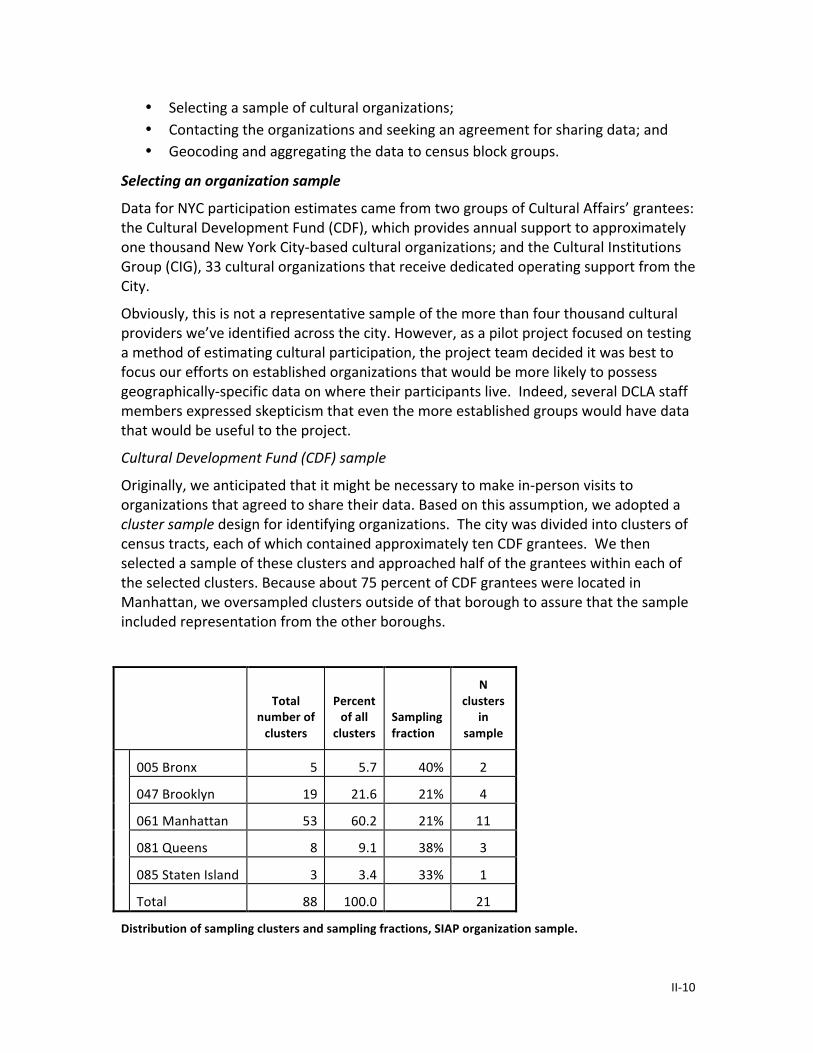
Originally, we anticipated that it might be necessary to make in-‐person visits to organizations that agreed to share their data. Based on this assumption, we adopted a cluster sample design for identifying organizations. The city was divided into clusters of census tracts, each of which contained approximately ten CDF grantees. We then selected a sample of these clusters and approached half of the grantees within each of the selected clusters. Because about 75 percent of CDF grantees were located in Manhattan, we oversampled clusters outside of that borough to assure that the sample included representation from the other boroughs.
Total number of clusters
Percent of all
clusters Sampling fraction
N clusters
in sample
005 Bronx 5 5.7 40% 2
047 Brooklyn 19 21.6 21% 4
061 Manhattan 53 60.2 21% 11
081 Queens 8 9.1 38% 3
085 Staten Island 3 3.4 33% 1
Total 88 100.0
21
Distribution of sampling clusters and sampling fractions, SIAP organization sample.
II-‐11
How representative was our sample
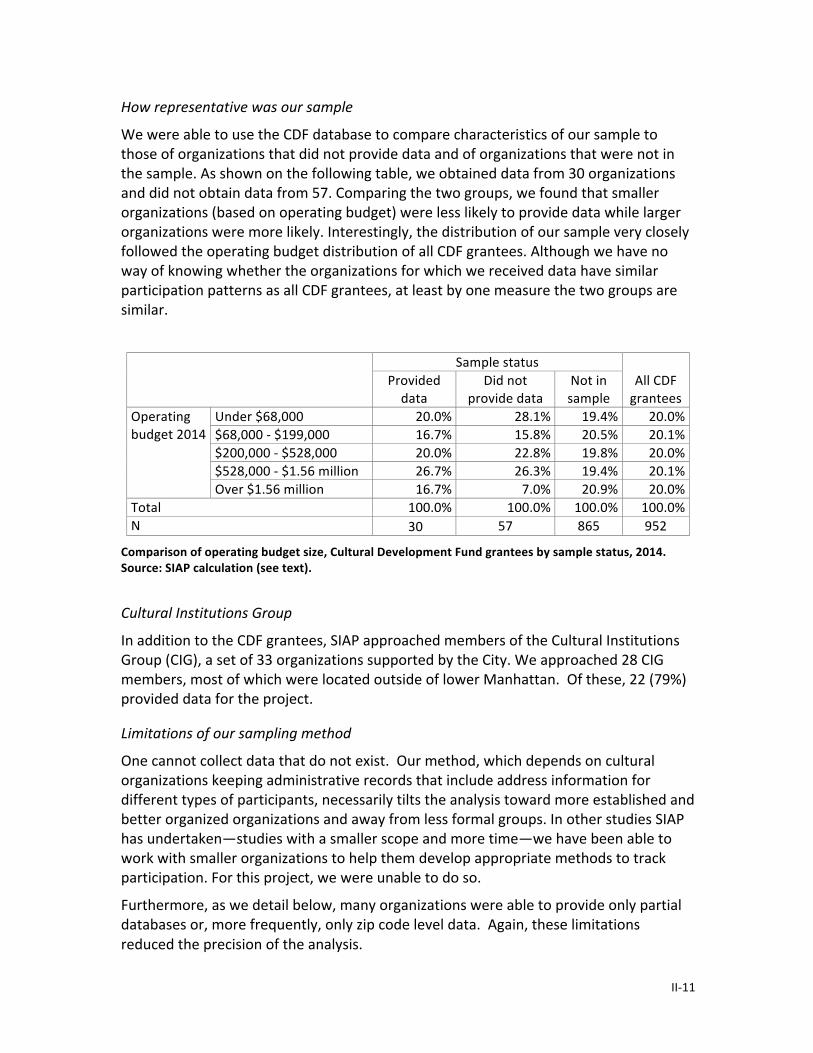
We were able to use the CDF database to compare characteristics of our sample to those of organizations that did not provide data and of organizations that were not in the sample. As shown on the following table, we obtained data from 30 organizations and did not obtain data from 57. Comparing the two groups, we found that smaller organizations (based on operating budget) were less likely to provide data while larger organizations were more likely. Interestingly, the distribution of our sample very closely followed the operating budget distribution of all CDF grantees. Although we have no way of knowing whether the organizations for which we received data have similar participation patterns as all CDF grantees, at least by one measure the two groups are similar.
Sample status All CDF grantees
Provided data
Did not provide data
Not in sample
Operating budget 2014
Under $68,000 20.0% 28.1% 19.4% 20.0% $68,000 -‐ $199,000 16.7% 15.8% 20.5% 20.1% $200,000 -‐ $528,000 20.0% 22.8% 19.8% 20.0% $528,000 -‐ $1.56 million 26.7% 26.3% 19.4% 20.1% Over $1.56 million 16.7% 7.0% 20.9% 20.0%
Total 100.0% 100.0% 100.0% 100.0% N 30 57 865 952
57 865 952
Comparison of operating budget size, Cultural Development Fund grantees by sample status, 2014. Source: SIAP calculation (see text).
Cultural Institutions Group
In addition to the CDF grantees, SIAP approached members of the Cultural Institutions Group (CIG), a set of 33 organizations supported by the City. We approached 28 CIG members, most of which were located outside of lower Manhattan. Of these, 22 (79%) provided data for the project.
Limitations of our sampling method
One cannot collect data that do not exist. Our method, which depends on cultural organizations keeping administrative records that include address information for different types of participants, necessarily tilts the analysis toward more established and better organized organizations and away from less formal groups. In other studies SIAP has undertaken—studies with a smaller scope and more time—we have been able to work with smaller organizations to help them develop appropriate methods to track participation. For this project, we were unable to do so.
Furthermore, as we detail below, many organizations were able to provide only partial databases or, more frequently, only zip code level data. Again, these limitations reduced the precision of the analysis.

II-‐12
Yet, our non-‐response analysis suggests that the data we were able to gather are a fair representation of the one thousand or so NYC nonprofit cultural organizations that receive funding through the Department of Cultural Affairs.
Contacting organizations and seeking an agreement for sharing data
Between February and May of 2016, each organization in the sample received an email letter from the Commissioner of Cultural Affairs inviting them to take part in a cultural participation study of New York City. SIAP staff followed up with emails and telephone calls. Typically, it took between two and five interactions to clarify the purpose of the project, identify the types of data requested, talk with additional staff involved with data management, and work out the logistics of transferring data to SIAP.
The focus of data-‐sharing discussions was to identify participant lists from the organization’s existing database that include household address. The request was for address listings only (dating from January 2013) with no need to share names and for use by SIAP only. In turn, during Spring 2017, SIAP plans to produce for each contributor an individualized report about where their participants live, demographic characteristics of those neighborhoods, and how the organizational profile compares to overall citywide patterns.
Geocoding and aggregating data to census block groups
Once data were acquired, SIAP staff reformatted the data to make records possible to geocode. The team then geocoded the data, that is, assigned a latitude and longitude to each case based on street address. SIAP used ESRI’s ArcMap standard geocoding software, which provided successful links for a majority of cases. With cases that were not successfully geocoded using ArcMap, Reinvestment Fund staff used a variety of other methods to increase the proportion of successful links. Reinvestment Fund staff were particularly helpful with Queens addresses that use a hyphenated street number and therefore are difficult to geocode with ArcMap.
Two types of data could not be geocoded, that is, they could not be assigned a precise map location: address listings that we could not locate in the valid, known New York City address listings and zip code only files. Listings in these two sets of files were distributed by block group across their zip code areas based on the proportion of the zip code’s population that resided in each block group.
IDNYC cultural membership database
The NYC Department of Cultural Affairs provided SIAP with figures on the number of IDNYC cardholders who signed up for free memberships at CIG institutions through May 2016. The IDNYC cultural membership database provided by the Department was aggregated to zip codes and included 386,000 memberships. In order to examine the two sets of data together, we distributed the IDNYC cultural memberships across the block groups within each zip code in proportion to the zip code’s population that lived in each block group. In addition, we aggregated these data to the 195 Neighborhood

II-‐13
Tabulation Areas used by the City of New York.3 The participation data were then converted into participation rates per 1,000 households based on 2010-‐14 estimates from the American Community Survey (ACS).
New York’s cultural participation in national perspective
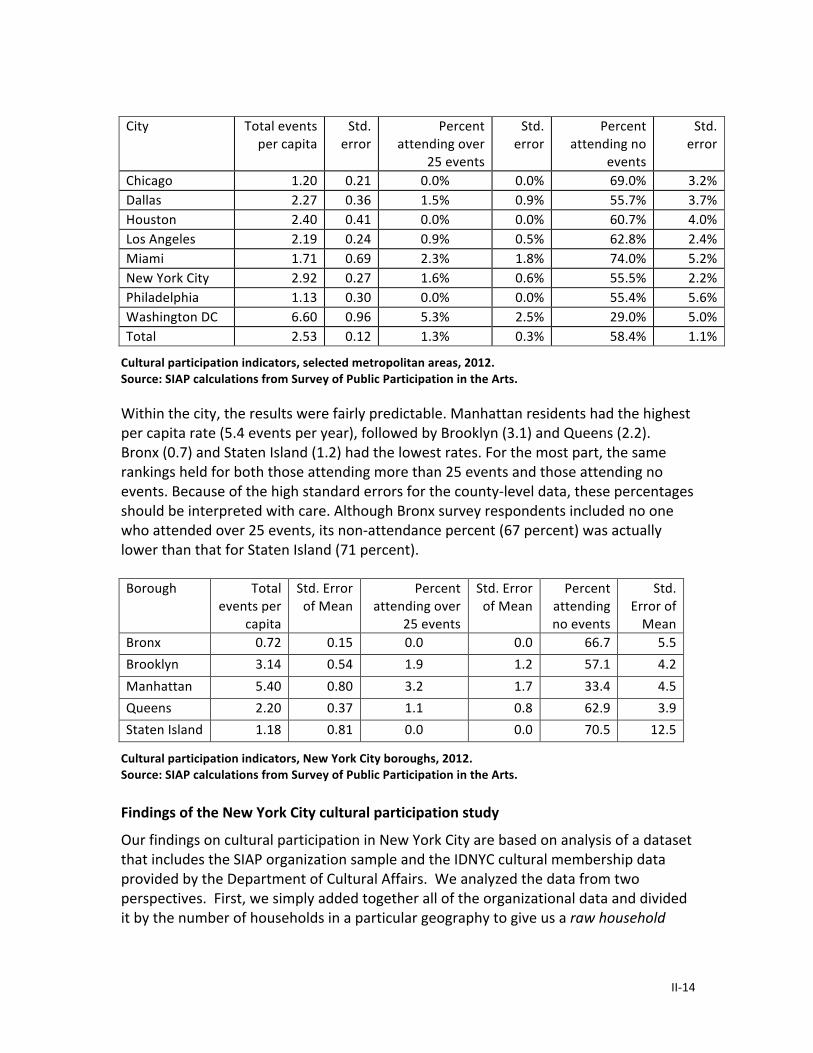
Our method of estimating cultural participation is focused on identifying relative differences in participation across the city’s neighborhoods, not on generating an estimate of the percent of residents who are cultural participants. To supplement our method, we turned to the National Endowment for the Art’s Survey of Public Participation in the Arts (SPPA) for 2012. Specifically, we used the SPPA12 data on attendance at core events, including live performances of jazz, Latin music, classical music, opera, musicals, ballet and other dance, as well as visiting art museums. We estimated three statistics—the number of events attended per capita, the percent of respondents who attended more than 25 events during the previous year, and the percent attending no events in the previous year. We estimated these statistics for the largest “principal cities” of major metropolitan areas and for the five boroughs of New York City.4
Generally speaking, these data indicate that New York City has somewhat higher cultural participation than most other large metropolitan areas in the United States. Washington DC, according to the survey, stands out in all categories. Its per capita attendance at events is more than twice the second highest city—New York—as is its rate for intensive attenders. Only 29 percent of adults in the principal cities of the metropolitan area failed to attend any events.
After Washington DC, New York has the highest per capita attendance, although Miami has a higher proportion of intensive attenders. The rate of non-‐attenders in New York—along with Dallas-‐Fort Worth and Philadelphia—was among the lowest (55 percent).
3 https://www1.nyc.gov/site/planning/data-‐maps/open-‐data/dwn-‐nynta.page 4 The survey identifies the “principal city” population within specified consolidated metropolitan areas. For many metropolitan areas, this will include more than one city. For example, the principal city population of Washington DC includes estimates for Arlington and Alexandria, Virginia as well. Because of sample size concerns, for many metropolitan areas, there is no way of differentiating the various principal cities at all. For New York, we’ve used county information to restrict our estimates to the five boroughs, but for other metropolitan areas, our estimates include all of the “principal cities” within the metro area. A description of the principal cities within these metropolitan areas can be found at: http://www.census.gov/population/metro/files/lists/2009/List2.txt
II-‐14
City Total events
per capita Std.
error Percent
attending over 25 events
Std. error
Percent attending no
events
Std. error
Chicago 1.20 0.21 0.0% 0.0% 69.0% 3.2% Dallas 2.27 0.36 1.5% 0.9% 55.7% 3.7% Houston 2.40 0.41 0.0% 0.0% 60.7% 4.0% Los Angeles 2.19 0.24 0.9% 0.5% 62.8% 2.4% Miami 1.71 0.69 2.3% 1.8% 74.0% 5.2% New York City 2.92 0.27 1.6% 0.6% 55.5% 2.2% Philadelphia 1.13 0.30 0.0% 0.0% 55.4% 5.6% Washington DC 6.60 0.96 5.3% 2.5% 29.0% 5.0% Total 2.53 0.12 1.3% 0.3% 58.4% 1.1%
Cultural participation indicators, selected metropolitan areas, 2012. Source: SIAP calculations from Survey of Public Participation in the Arts. Within the city, the results were fairly predictable. Manhattan residents had the highest per capita rate (5.4 events per year), followed by Brooklyn (3.1) and Queens (2.2). Bronx (0.7) and Staten Island (1.2) had the lowest rates. For the most part, the same rankings held for both those attending more than 25 events and those attending no events. Because of the high standard errors for the county-‐level data, these percentages should be interpreted with care. Although Bronx survey respondents included no one who attended over 25 events, its non-‐attendance percent (67 percent) was actually lower than that for Staten Island (71 percent). Borough Total
events per capita
Std. Error of Mean
Percent attending over
25 events
Std. Error of Mean
Percent attending no events
Std. Error of Mean
Bronx 0.72 0.15 0.0 0.0 66.7 5.5 Brooklyn 3.14 0.54 1.9 1.2 57.1 4.2 Manhattan 5.40 0.80 3.2 1.7 33.4 4.5 Queens 2.20 0.37 1.1 0.8 62.9 3.9 Staten Island 1.18 0.81 0.0 0.0 70.5 12.5
Cultural participation indicators, New York City boroughs, 2012. Source: SIAP calculations from Survey of Public Participation in the Arts. Findings of the New York City cultural participation study
Our findings on cultural participation in New York City are based on analysis of a dataset that includes the SIAP organization sample and the IDNYC cultural membership data provided by the Department of Cultural Affairs. We analyzed the data from two perspectives. First, we simply added together all of the organizational data and divided it by the number of households in a particular geography to give us a raw household

II-‐15
rate.5 Second, we calculated a cultural participation factor by conducting a factor analysis using each organization’s raw household rate to provide the optimal combination of the various organizations’ data. Among Neighborhood Tabulation Areas, the raw household score and participation factor had a correlation coefficient of .88, indicating that the two measures were closely related.
We analyze these participation indexes in three ways: the presentation of maps of the two indexes and listing of Neighborhood Tabulation Areas (NTAs) with the highest level of participation according to each; the use of correlation analysis to identify socio-‐economic variables associated with each index; and the comparison of participation factors with our other cultural indicators.
Cultural participation rates and factor scores by neighborhood
Overall, the analysis underlines the centrality of the cultural core—Manhattan below 125th Street and sections of Brooklyn and Queens near the East River—to the city’s cultural participation. In this respect, the analysis supports the conclusions reached in the analysis of the other cultural measures. Neighborhood Tabulation Area
Raw household rate
All neighborhoods 389 Brooklyn Heights-‐Cobble Hill 1536
Midtown-‐Midtown South 1497 Prospect Heights 1495
Park Slope-‐Gowanus 1412
Hudson Yards-‐Chelsea-‐Flatiron-‐Union Square 1411 DUMBO-‐Vinegar Hill-‐Downtown Brooklyn-‐Boerum Hill
1292
Windsor Terrace 1085 Stuyvesant Town-‐Cooper Village 1058
Upper East Side-‐Carnegie Hill 1025 Clinton Hill 992
East Village 964
Upper West Side 953
Cultural participation per 1,000 households, New York City Neighborhood Tabulation Areas with highest rates, 2013-‐15. Source: SIAP calculations (see text).
5 Because our rate is based on adding together households’ presence on a number of individual organizations’ lists, the household rate simply provides an index of the level of participation in a particular geography, not the proportion of households who were cultural participants.

II-‐16
Cultural participation raw household rate, New York City block groups, 2013-‐15. Source: SIAP calculations (see text).

II-‐17
Neighborhood Tabulation Area Participation factor
All neighborhoods 0.00
Morningside Heights 2.74
Prospect Heights 2.58
DUMBO-‐Vinegar Hill-‐Downtown Brooklyn-‐Boerum Hill 2.38
Park Slope-‐Gowanus 2.32
Brooklyn Heights-‐Cobble Hill 2.22
Clinton Hill 1.78
Queensbridge-‐Ravenswood-‐Long Island City 1.62
Midtown-‐Midtown South 1.57
Clinton 1.54
Lincoln Square 1.51
Upper West Side 1.50
Manhattanville 1.46
Fort Greene 1.37
New York City Neighborhood Tabulation Areas with highest cultural participation factor score, 2013-‐15. Source: SIAP calculation (see text).

II-‐18
Cultural participation factor score, New York City block groups, 2013-‐15. Source: SIAP calculations (see text)
Socio-‐economic associations with participation rates and factors
The following table shows the correlations between our participation rate and factor score and a variety of socio-‐economic characteristics of those areas. Although each participation rate or index has its own unique set of correlations, there are a number of clear patterns. The concentration of residents with a bachelor’s degree, professional occupations, nonfamily households, and higher incomes are consistently positively correlated with participation while low-‐income, percent of blacks and Hispanics, and distance from Midtown are all negatively correlated.

II-‐19
Socio-‐economic characteristic Factor score Raw household rate
Percent with bachelor’s degree 0.429 0.486
Percent nonfamily households 0.408 0.396
Professional occupations 0.344 0.377
Per capita income 0.302 0.427
Percent renter-‐occupied unit 0.277 0.068
Income over $150,000 0.276 0.382
Median family income 0.262 0.368
Economic wellbeing 0.256 0.401
Percent of workers in nonprofit employment 0.237 0.165
Household with interest, dividend, or rental income
0.230 0.344
Percent white 0.207 0.307
Median household income 0.188 0.312
Percent employed 0.104 0.159
Unemployment percent -‐0.104 -‐0.159
Percent of adults with less than high school diploma
-‐0.106 -‐0.260
Percent of adults not in labor force -‐0.119 -‐0.219
Median year housing unit was built -‐0.146 -‐0.058
Percent married couple family HH -‐0.178 -‐0.098
Percent black and Hispanic -‐0.197 -‐0.281
Average household size -‐0.226 -‐0.329
Percent under 18 years of age -‐0.227 -‐0.274
Housing burden factor -‐0.233 -‐0.306
Public sector employment -‐0.289 -‐0.172
Distance from Midtown -‐0.595 -‐0.467
Correlation of cultural participation indicators and socio-‐economic variables, New York City block groups, 2013-‐15. Source: SIAP calculation (see text).
II-‐20
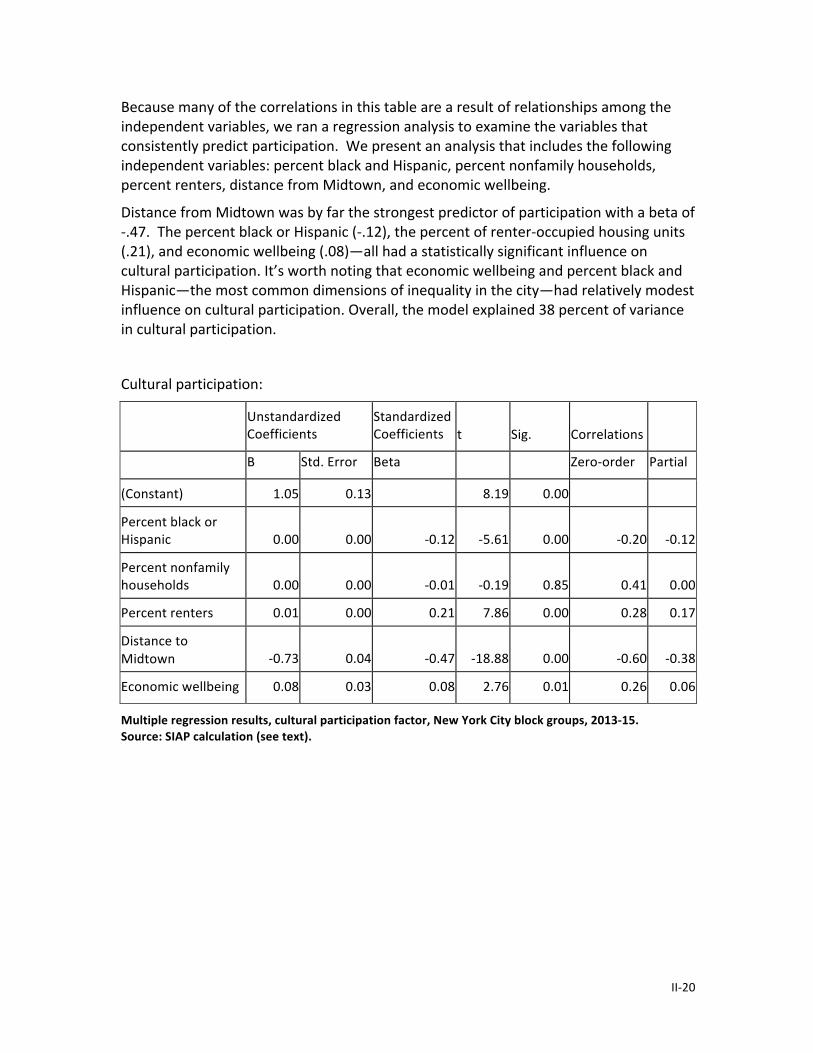
Because many of the correlations in this table are a result of relationships among the independent variables, we ran a regression analysis to examine the variables that consistently predict participation. We present an analysis that includes the following independent variables: percent black and Hispanic, percent nonfamily households, percent renters, distance from Midtown, and economic wellbeing.
Distance from Midtown was by far the strongest predictor of participation with a beta of -‐.47. The percent black or Hispanic (-‐.12), the percent of renter-‐occupied housing units (.21), and economic wellbeing (.08)—all had a statistically significant influence on cultural participation. It’s worth noting that economic wellbeing and percent black and Hispanic—the most common dimensions of inequality in the city—had relatively modest influence on cultural participation. Overall, the model explained 38 percent of variance in cultural participation.
Cultural participation:
Unstandardized Coefficients
Standardized Coefficients t Sig. Correlations
B Std. Error Beta
Zero-‐order Partial
(Constant) 1.05 0.13
8.19 0.00
Percent black or Hispanic 0.00 0.00 -‐0.12 -‐5.61 0.00 -‐0.20 -‐0.12
Percent nonfamily households 0.00 0.00 -‐0.01 -‐0.19 0.85 0.41 0.00
Percent renters 0.01 0.00 0.21 7.86 0.00 0.28 0.17
Distance to Midtown -‐0.73 0.04 -‐0.47 -‐18.88 0.00 -‐0.60 -‐0.38
Economic wellbeing 0.08 0.03 0.08 2.76 0.01 0.26 0.06
Multiple regression results, cultural participation factor, New York City block groups, 2013-‐15. Source: SIAP calculation (see text).

II-‐21
Relationship between participation indicators and other cultural resources
Cultural participation was modestly correlated with other cultural indicators. The strongest association was with artists as a percent of civilian employed labor force and with the number of nonprofits within one-‐quarter mile of the block group. The weakest association was with the number of for-‐profit cultural firms in the same block group.
For-‐profit cultural firms within block group
For-‐profit cultural firms within a quarter mile
Artists as percent of civilian employed
Nonprofit cultural organizations within block group
Nonprofit cultural organizations within a quarter mile
Cultural participation factor
0.149 0.278 0.585 0.284 0.476
Cultural participation rate
0.429 0.466 0.454 0.444 0.510
Correlation of cultural participation indicators with other cultural indicators, New York City, 2013-‐15. Source: SIAP calculation (see text). Analyzing Cultural Clusters In the previous sections, we analyzed four types of cultural assets—nonprofits, for-‐profits, employed artists, and cultural participants. In this section, we look at these four dimensions together. First, we construct a cultural asset index (CAI) to identify sections of the city that have concentrations of all four types of assets. We then statistically correct the CAI to identify neighborhoods that have more cultural assets than we would predict based on their economic wellbeing. We then combine the CAI and the corrected CAI to develop a typology of neighborhood cultural clusters.
II-‐22
Cultural Asset Index
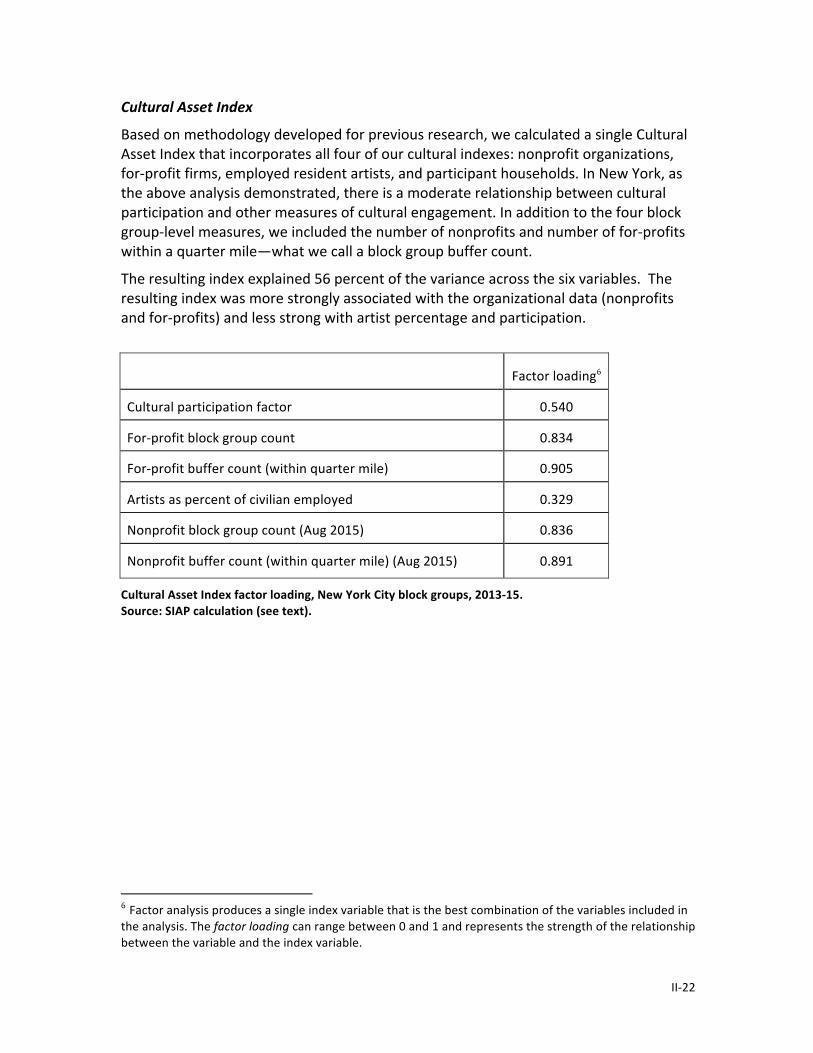
Based on methodology developed for previous research, we calculated a single Cultural Asset Index that incorporates all four of our cultural indexes: nonprofit organizations, for-‐profit firms, employed resident artists, and participant households. In New York, as the above analysis demonstrated, there is a moderate relationship between cultural participation and other measures of cultural engagement. In addition to the four block group-‐level measures, we included the number of nonprofits and number of for-‐profits within a quarter mile—what we call a block group buffer count.
The resulting index explained 56 percent of the variance across the six variables. The resulting index was more strongly associated with the organizational data (nonprofits and for-‐profits) and less strong with artist percentage and participation.
Factor loading6
Cultural participation factor 0.540
For-‐profit block group count 0.834
For-‐profit buffer count (within quarter mile) 0.905
Artists as percent of civilian employed 0.329
Nonprofit block group count (Aug 2015) 0.836
Nonprofit buffer count (within quarter mile) (Aug 2015) 0.891
Cultural Asset Index factor loading, New York City block groups, 2013-‐15. Source: SIAP calculation (see text).
6 Factor analysis produces a single index variable that is the best combination of the variables included in the analysis. The factor loading can range between 0 and 1 and represents the strength of the relationship between the variable and the index variable.
II-‐23
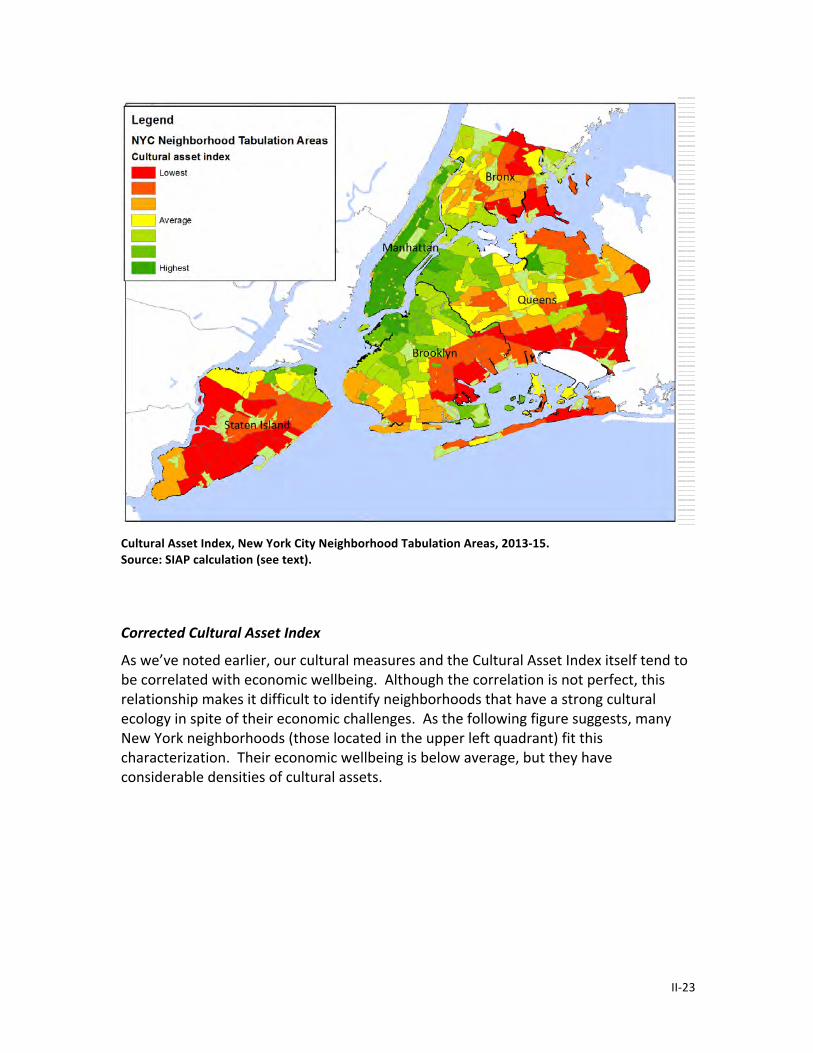
Cultural Asset Index, New York City Neighborhood Tabulation Areas, 2013-‐15. Source: SIAP calculation (see text).
Corrected Cultural Asset Index
As we’ve noted earlier, our cultural measures and the Cultural Asset Index itself tend to be correlated with economic wellbeing. Although the correlation is not perfect, this relationship makes it difficult to identify neighborhoods that have a strong cultural ecology in spite of their economic challenges. As the following figure suggests, many New York neighborhoods (those located in the upper left quadrant) fit this characterization. Their economic wellbeing is below average, but they have considerable densities of cultural assets.
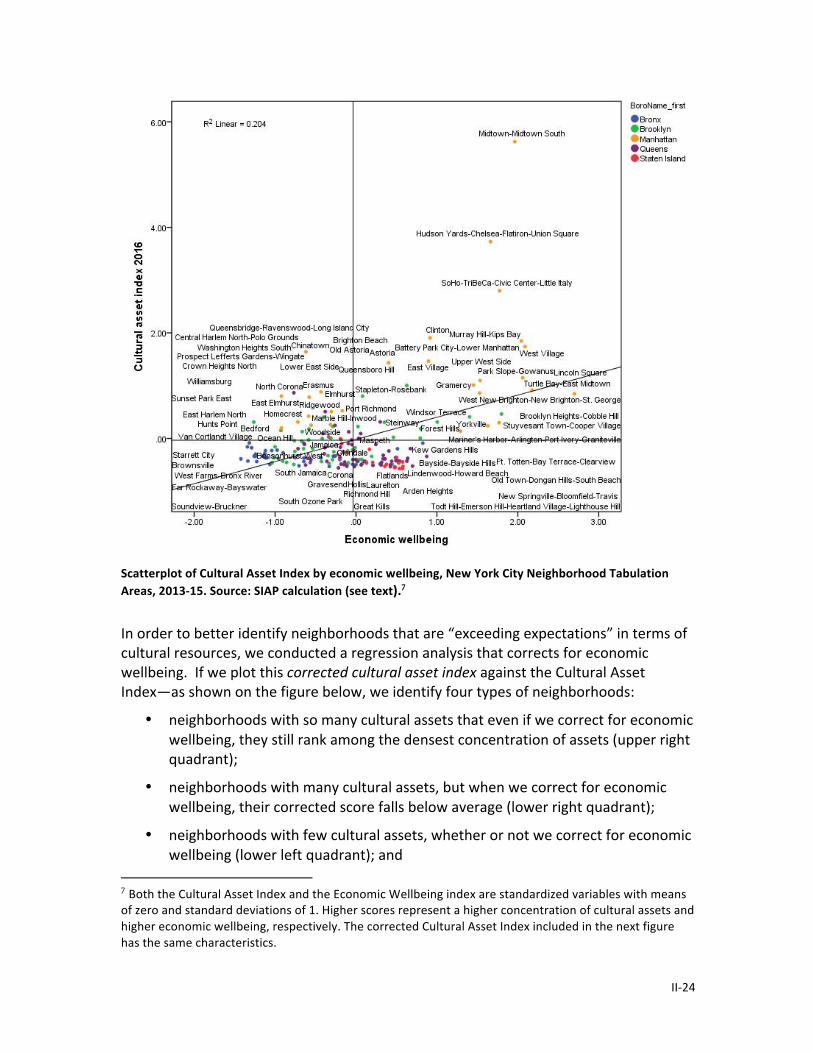
II-‐24
Scatterplot of Cultural Asset Index by economic wellbeing, New York City Neighborhood Tabulation Areas, 2013-‐15. Source: SIAP calculation (see text).7
In order to better identify neighborhoods that are “exceeding expectations” in terms of cultural resources, we conducted a regression analysis that corrects for economic wellbeing. If we plot this corrected cultural asset index against the Cultural Asset Index—as shown on the figure below, we identify four types of neighborhoods:
• neighborhoods with so many cultural assets that even if we correct for economic wellbeing, they still rank among the densest concentration of assets (upper right quadrant);
• neighborhoods with many cultural assets, but when we correct for economic wellbeing, their corrected score falls below average (lower right quadrant);
• neighborhoods with few cultural assets, whether or not we correct for economic wellbeing (lower left quadrant); and
7 Both the Cultural Asset Index and the Economic Wellbeing index are standardized variables with means of zero and standard deviations of 1. Higher scores represent a higher concentration of cultural assets and higher economic wellbeing, respectively. The corrected Cultural Asset Index included in the next figure has the same characteristics.
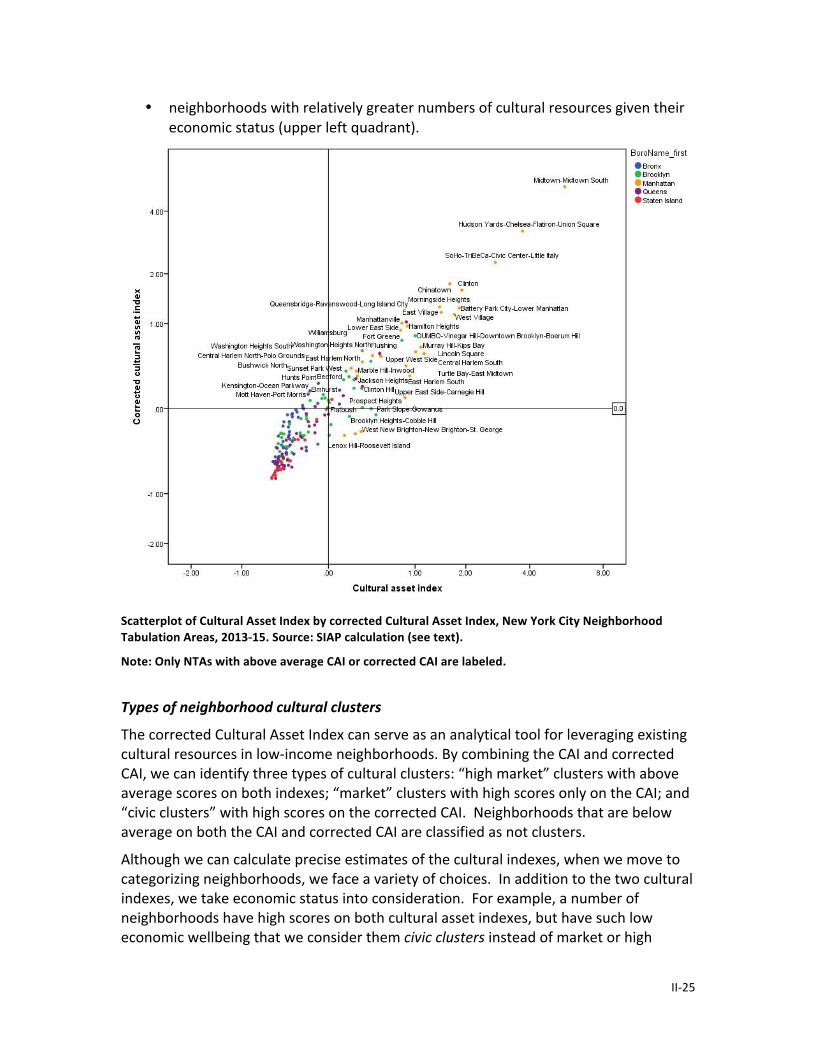
II-‐25
• neighborhoods with relatively greater numbers of cultural resources given their economic status (upper left quadrant).
Scatterplot of Cultural Asset Index by corrected Cultural Asset Index, New York City Neighborhood Tabulation Areas, 2013-‐15. Source: SIAP calculation (see text).
Note: Only NTAs with above average CAI or corrected CAI are labeled.
Types of neighborhood cultural clusters
The corrected Cultural Asset Index can serve as an analytical tool for leveraging existing cultural resources in low-‐income neighborhoods. By combining the CAI and corrected CAI, we can identify three types of cultural clusters: “high market” clusters with above average scores on both indexes; “market” clusters with high scores only on the CAI; and “civic clusters” with high scores on the corrected CAI. Neighborhoods that are below average on both the CAI and corrected CAI are classified as not clusters.
Although we can calculate precise estimates of the cultural indexes, when we move to categorizing neighborhoods, we face a variety of choices. In addition to the two cultural indexes, we take economic status into consideration. For example, a number of neighborhoods have high scores on both cultural asset indexes, but have such low economic wellbeing that we consider them civic clusters instead of market or high

II-‐26
market districts. Ideally, we would supplement the indexes with on-‐the-‐ground observation and validation to identify cultural clusters, something the project has been able to do for only a handful of neighborhoods.
This is to say that our categorization should be seen as the best estimate at this point in time, but as further research is completed, the categorization of particular neighborhoods could well change.
Cultural clusters, New York City Neighborhood Tabulation Areas, 2013-‐15. Source: SIAP calculation (see text).
This analysis suggests that cultural assets in the city are highly concentrated. Not surprisingly, Manhattan below 125th Street is dominated by high market and market districts. Brooklyn is the only other borough with a high market or market cluster. By contrast, civic clusters are present in all five boroughs.
Summary
New York City’s cultural sector is important to the city’s economy and workers, its social assets, its reputation as a creative engine, and its overall competitive advantage. Yet, much of this value derives from the economic benefits generated by non-‐New Yorkers who come to the city to partake of its cultural opportunities.
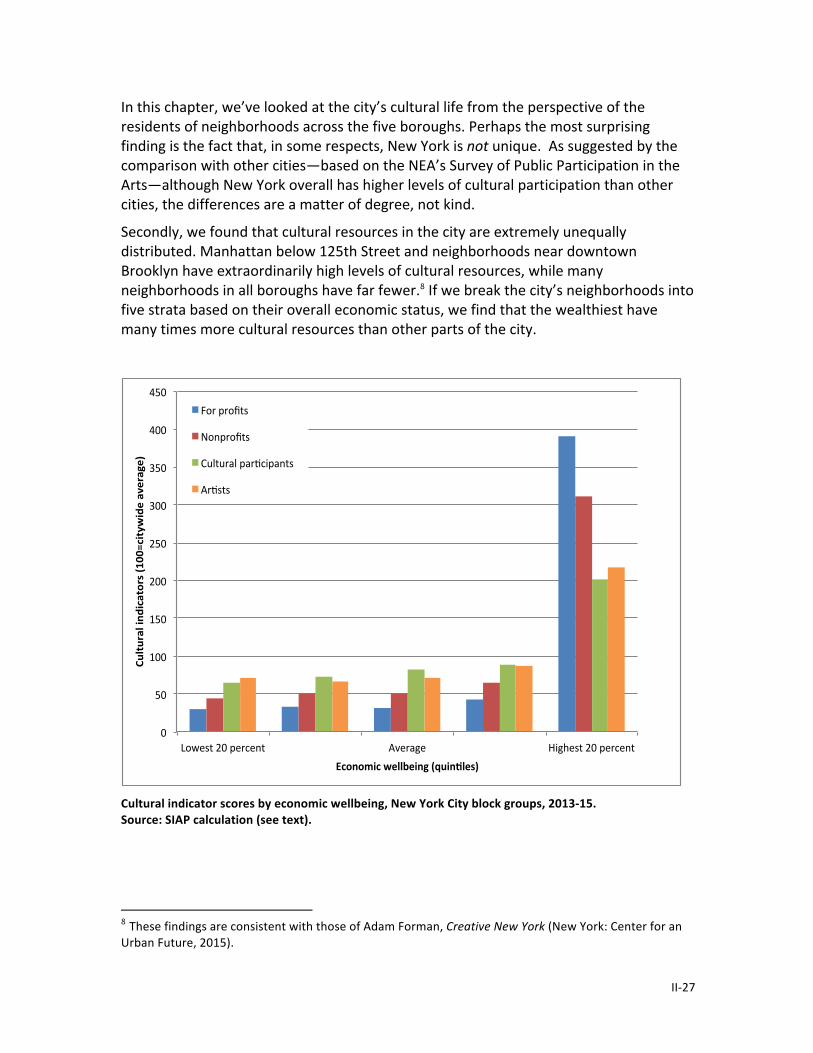
II-‐27
In this chapter, we’ve looked at the city’s cultural life from the perspective of the residents of neighborhoods across the five boroughs. Perhaps the most surprising finding is the fact that, in some respects, New York is not unique. As suggested by the comparison with other cities—based on the NEA’s Survey of Public Participation in the Arts—although New York overall has higher levels of cultural participation than other cities, the differences are a matter of degree, not kind.
Secondly, we found that cultural resources in the city are extremely unequally distributed. Manhattan below 125th Street and neighborhoods near downtown Brooklyn have extraordinarily high levels of cultural resources, while many neighborhoods in all boroughs have far fewer.8 If we break the city’s neighborhoods into five strata based on their overall economic status, we find that the wealthiest have many times more cultural resources than other parts of the city.
Cultural indicator scores by economic wellbeing, New York City block groups, 2013-‐15. Source: SIAP calculation (see text).
8 These findings are consistent with those of Adam Forman, Creative New York (New York: Center for an Urban Future, 2015).
0"
50"
100"
150"
200"
250"
300"
350"
400"
450"
Lowest"20"percent" Average" Highest"20"percent"
Cultu
ral'ind
icators'(100
=city
wide'average)'
Economic'wellbeing'(quin<les)'
For"profits"
Nonprofits"
Cultural"par?cipants"
Ar?sts"

II-‐28
Finally, although cultural resources are concentrated, many neighborhoods outside this cultural core have significant concentrations of cultural assets. Many of these—which we classify as civic clusters—we hypothesize could make significant contributions to the wellbeing of their communities. Before we examine those relationships, however, we must turn our attention to other measures of social wellbeing.
Chapter 3—Measuring Social Wellbeing in New York City
New York City has been at the center of the debate over social inequality during the past decade. Even before the housing bubble of the 2000s, housing affordability and supply have been central concerns for residents and policy makers. The high cost of housing also figures in the City’s estimates of its poverty rate. Because the official poverty rate does not take into consideration local variations in the cost of living, the official New York rate underestimates the level of need in the city. This is one reason why the City’s Center for Economic Opportunity (CEO) was among the leaders in developing improved poverty measures, which anticipated the Census Bureau’s Supplemental Poverty Measure.1
The CEO and Supplemental Poverty Measure represent a real advance in conceptualizing income poverty, but at the same time, they remain tied to narrow economic standards of need. In this chapter, we build on our discussion in Chapter 1 of the shift toward a multi-‐dimensional measure of social wellbeing. Our index of social wellbeing integrates ten dimensions and is based on the model proposed by Amartya Sen and Joseph Stiglitz in their 2009 report. In addition to the Cultural Asset Index, the tool includes measures of social connection, health, health access, economic wellbeing, economic and ethnic diversity, housing burden, personal security, school effectiveness, and environmental amenities.
In contrast to the cultural asset inventories discussed in Chapter 2, which required considerable effort by the research team to construct, our other measures of social wellbeing rely on existing sources of data. Several measures draw on federal government data, which are consistent across cities, but for the most part, we have relied on data available for New York. As a result, we’ve discovered a variety of inconsistencies across dimensions of wellbeing in terms of availability of data and the geography for which data are available. In this chapter, we discuss these issues as they pertain to the particular dimensions of social wellbeing.
One reason for using a multi-‐dimensional measure of wellbeing is to examine how different dimensions relate to one another. For this reason, we conclude this chapter with a classification of neighborhoods in the city by the concentration of social wellbeing advantages and disadvantages they experience.
As with the cultural measures, our indexes of wellbeing remain a work in progress. We are aware of the many shortcomings in the data and the distance between our conceptualization of wellbeing and our operationalization of those concepts. However, we are confident that our current work provides an important perspective on the current state of inequality in New York City.
1 City of New York, Office of the Mayor, The CEO Poverty Measure 2000-‐2014 (April 2016); Kathleen Short, “The Supplemental Poverty Measure, 2014” Current Population Reports P60-‐254 (September 2015).

III-‐2
Dimensions of Social Wellbeing—U.S. Census Bureau Data: Economic wellbeing, economic and ethnic diversity, housing burden, and health access
The most straightforward estimation of social wellbeing dimensions were those based on the Census Bureau’s American Community Survey: economic wellbeing (income, educational attainment, labor force participation); economic and ethnic diversity (distribution of household income, Gini coefficient, percent of residents from “non-‐majority” ethnic or racial group in tract); and housing burden (percent of income spent on housing, overcrowding, length of time to get to work).2 Beginning with the 2009-‐13 five-‐year files, health insurance status was added to the American Community Survey, which allowed us to compute a preliminary health access indicator.
Economic wellbeing
Although the goal of a multi-‐dimensional measure of wellbeing is to move beyond one-‐dimensional measures like the poverty rate, economic wellbeing remains a central feature of people’s ability to achieve a life they have reason to value. We used factor analysis to develop an index of economic wellbeing that integrates a variety of data on income, educational attainment, and labor force status. Some variables—like the percent of adults with a bachelor’s degree and per capita income are positively correlated with economic wellbeing, while others, including the percent of adults without a high school diploma and the poverty rate are negatively correlated with it. Many of the variables included are highly correlated with one another. As a result, the economic wellbeing index explains 60 percent of the variance in the variables and most variables have a strong factor loading.3
2 For a discussion of methodology and preliminary findings on these three dimensions of wellbeing, see the Appendix to SIAP’s August 2014 paper: Community, Culture, and Capabilities called “Estimating a neighborhood-‐based index of social wellbeing.” The Appendix compares findings on these three indexes for four cities under study—New York, Philadelphia, Austin, and Seattle. Data presented in the following three maps have been recalculated so that the “average” refers to New York City alone. 3 Factor analysis produces a single index variable that is the best combination of the variables included in the analysis. The factor loading can range between 0 and 1 and represents the strength of the relationship between the variable and the index variable.

III-‐3
Variable Factor loading
Percent of adults with a BA 0.875
Percent of adults with less than high-‐school diploma
-‐0.773
Percent in labor force 0.509
Unemployment rate -‐0.490
Per capita income 2013 0.863
Percent of households with interest, dividend, or rental income
0.805
Median household income 0.901
Median family income 0.897
Poverty rate -‐0.733
The map of the economic wellbeing index, which is based on all of the variables in the table above, underlines the existing state of economic inequality in the City. The highest economic wellbeing stratum is restricted, for the most part, to Manhattan below 110th Street and sections of Brooklyn west of Prospect Park. Large sections of Staten Island and Queens are in the middle of the economic wellbeing category, while the Bronx appears to be the most economically disadvantaged borough. Brooklyn is the most economically varied of the boroughs. While it includes some of the most prosperous sections of the city, Brooklyn also includes several of its poorest neighborhoods, especially in the area stretching from Bedford-‐Stuyvesant to East New York. Finally, southern Brooklyn includes a set of neighborhoods in the middle of the economic distribution.

III-‐4
Economic wellbeing index that integrates data on income, educational attainment, and labor force status. New York City Neighborhood Tabulation Areas, 2009-‐13. Source: SIAP calculations from the American Community Survey, five-‐year file.

III-‐5
Economic and ethnic diversity
American cities, including New York, have a long history of economic and racial segregation. Scholars have found that segregation reduces opportunities for residents of low-‐income black and Latino communities and contributes to persistent poverty.4 By the same token, living in an economically or ethnically diverse neighborhood improves the opportunities of its residents. Our economic and ethnic diversity index is based on measures of ethnic diversity, economic diversity, and the Gini coefficient.
Ethnic diversity index
Ethnic diversity measures the proportion of the population of a block group not a member of the largest group. In other words, the less dominant the largest group is, the higher our measure of ethnic diversity. In a block group that is 90 percent white, our measure would be 10 percent. In a block group where the largest group makes up only 30 percent of the population, our diversity measure would be 70 percent.
The map of the ethnic diversity measure illustrates the range of diversity across the city. The most segregated neighborhoods of the city include African American sections of Brooklyn with very low economic wellbeing as well as the Upper East Side and Upper West Side of Manhattan, among the city’s most affluent neighborhoods.
4 Douglas S. Massey and Nancy A. Denton, American Apartheid: Segregation and the Making of the Underclass (Cambridge, Mass.: Harvard University Press). More recently, Massey and his collaborators have found that American cities have become somewhat less racially segregated and more economically segregated. Douglas S. Massey, Jonathan Rothwell, and Thursto Domina, “The changing bases of segregation in the United States,” Annals of the American Academy of Political and Social Sciences 626 (November 2009): 74-‐90.
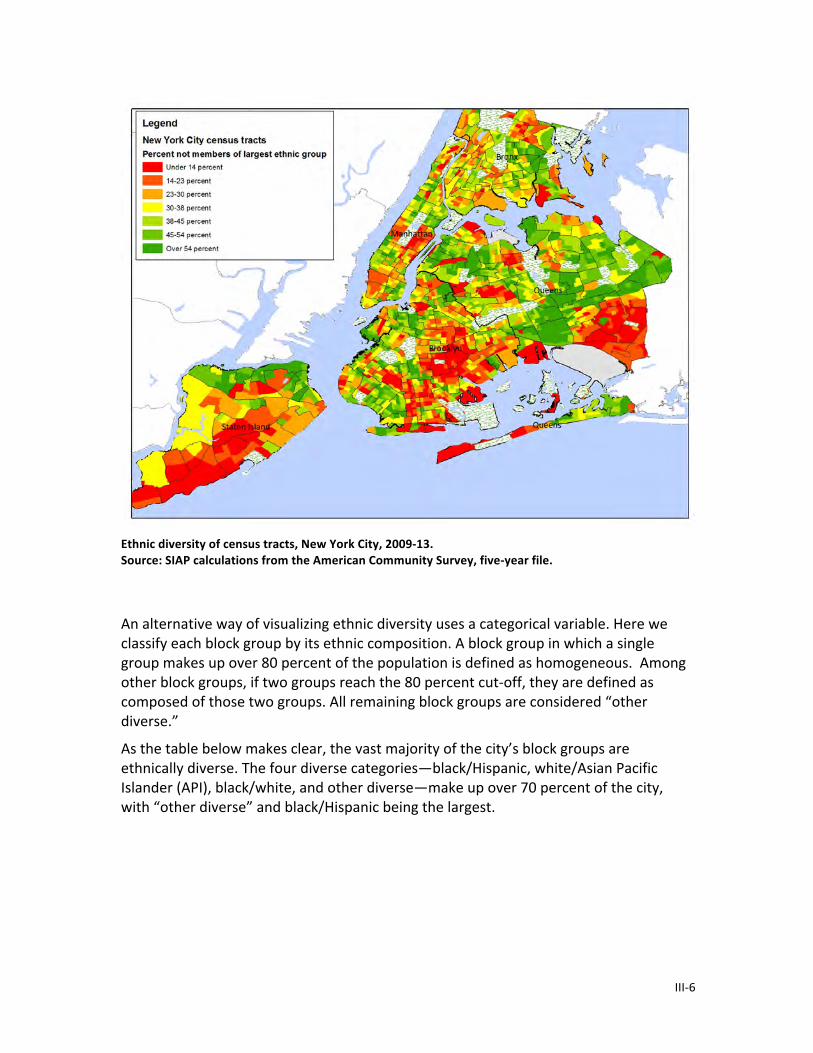
III-‐6
Ethnic diversity of census tracts, New York City, 2009-‐13. Source: SIAP calculations from the American Community Survey, five-‐year file.
An alternative way of visualizing ethnic diversity uses a categorical variable. Here we classify each block group by its ethnic composition. A block group in which a single group makes up over 80 percent of the population is defined as homogeneous. Among other block groups, if two groups reach the 80 percent cut-‐off, they are defined as composed of those two groups. All remaining block groups are considered “other diverse.”
As the table below makes clear, the vast majority of the city’s block groups are ethnically diverse. The four diverse categories—black/Hispanic, white/Asian Pacific Islander (API), black/white, and other diverse—make up over 70 percent of the city, with “other diverse” and black/Hispanic being the largest.

III-‐7
Number of block groups
Percent
Other diverse 2,149 34.5
Black/Hispanic 1,249 20.1
White/API 959 15.4
White 816 13.1
Black 550 8.8
Hispanic 281 4.5
Black/White 179 2.9
Asian Pacific Islander 38 0.6
Total 6,221 100
Ethnic composition of block groups, New York City, 2009-‐13. Source: SIAP calculation from the American Community Survey, five-‐year file.
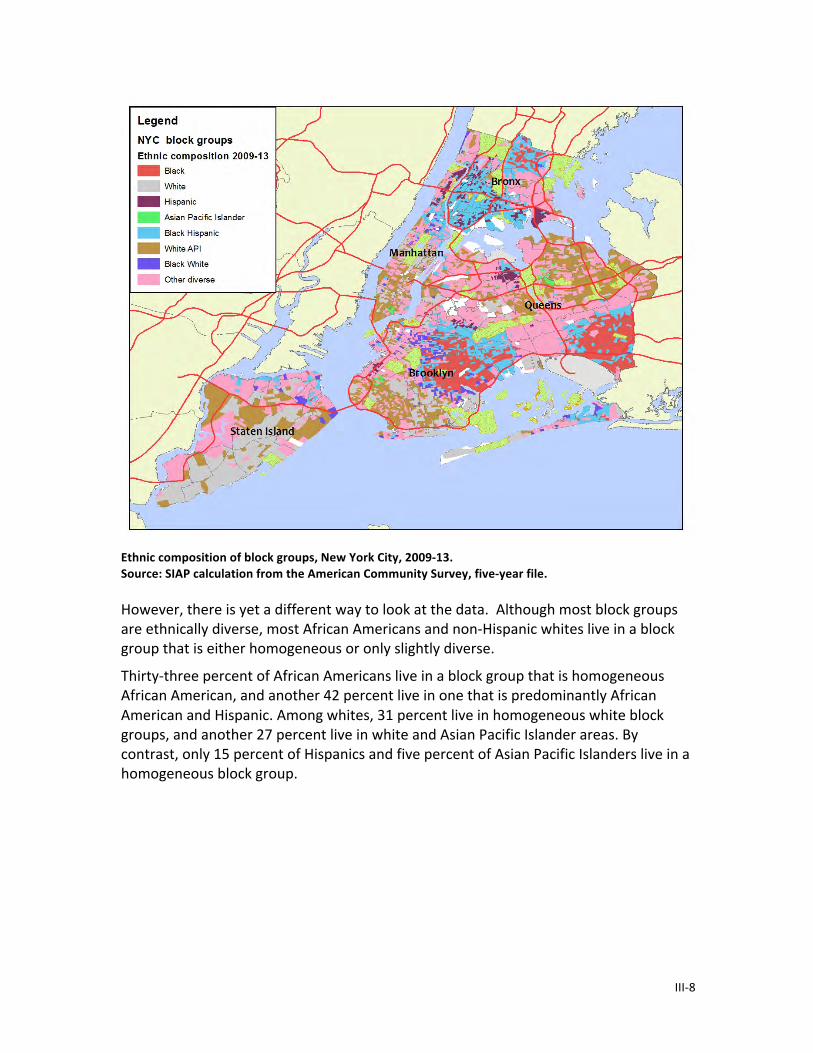
III-‐8
Ethnic composition of block groups, New York City, 2009-‐13. Source: SIAP calculation from the American Community Survey, five-‐year file. However, there is yet a different way to look at the data. Although most block groups are ethnically diverse, most African Americans and non-‐Hispanic whites live in a block group that is either homogeneous or only slightly diverse.
Thirty-‐three percent of African Americans live in a block group that is homogeneous African American, and another 42 percent live in one that is predominantly African American and Hispanic. Among whites, 31 percent live in homogeneous white block groups, and another 27 percent live in white and Asian Pacific Islander areas. By contrast, only 15 percent of Hispanics and five percent of Asian Pacific Islanders live in a homogeneous block group.

III-‐9
Number of residents
Ethnic composition 2009-‐13
Black residents
White residents
Hispanic residents
Asian Pacific Islander residents
All residents
Black block group 609,252 14,518 43,880 7,971 675,621
White block group 9,597 859,868 49,437 39,386 958,288
Hispanic block group 25,962 13,892 358,239 8,666 406,759
API block group 208 3,312 3,312 48,872 55,703
Black/Hispanic block group
785,343 67,004 819,148 38,762 1,710,256
White API block group 23,473 741,938 105,691 359,013 1,230,115
Black/white block group 89,653 97,020 17,936 6,735 211,344
Other diverse block group 333,637 936,691 973,406 563,758 2,807,493
Total 1,877,125 2,734,244 2,371,048 1,073,162 8,055,579
Percent of residents
Black block group 32.5 0.5 1.9 0.7 8.4
White block group 0.5 31.4 2.1 3.7 11.9
Hispanic block group 1.4 0.5 15.1 0.8 5.0
API block group 0.0 0.1 0.1 4.6 0.7
Black/Hispanic block group
41.8 2.5 34.5 3.6 21.2
White API block group 1.3 27.1 4.5 33.5 15.3
Black/white block group 4.8 3.5 0.8 0.6 2.6
Other diverse block group 17.8 34.3 41.1 52.5 34.9
Total 100.0 100.0 100.0 100.0 100.0
Distribution of residents by race/ethnicity and ethnic composition of block group, New York City, 2009-‐13. Source: SIAP calculation from the American Community Survey, five-‐year file.

III-‐10
Household income diversity index
There are two ways to think about economic diversity. On the one hand, diversity can be seen as a positive value. Living in a diverse neighborhood implies tolerance and the ability to reach across barriers of race, ethnicity, and social class. On the other hand, for larger geographic areas, like a metropolitan region or state, income diversity indicates a high level of economic inequality. At an early stage of our research, we realized that at a smaller geography like a neighborhood or census block group, income homogeneity has a different meaning. It indicates exclusion or marginalization. This fact stands inequality on its head. For a small geography, therefore, inequality is the same as diversity and suggests an area in which different types of people share a common space. As a result, we include the Gini coefficient—the standard measure of income inequality—in our diversity measure.
Income inequality can be measured in a variety of ways. We have included two metrics: a measure of the distribution of household income and the Gini coefficient. The American Community Survey’s grouped household income variable includes 16 categories, ranging from households earning under $10,000 to those earning $200,000 or more.
Our approach to estimating income diversity is quite simple conceptually. We define an area as income diverse if its household income profile is close to that of the entire United States, that is, if it has the same number of low, middle, and high-‐income households as the nation as a whole. To the extent that the income profile of the area diverges from that of the nation, either by having too many or too few households in each income strata, it is less diverse. An area could have low economic diversity for a variety of reasons. It could be homogeneous with most families in one stratum, or it could be polarized with many rich and poor people, but few in the middle.
In operational terms, therefore, for every income stratum we calculated the difference between the percent of households in that stratum in the block group and the percent for the entire nation. Because both under-‐ and over-‐representation of a stratum indicate less diversity, we took the absolute value of the difference. So if in a particular block group, 10 percent of households had an income of $200,000 or more, we would subtract 10 from the national figure (4.6%) and then take the absolute value, resulting in 5.4 percent. We then sum the differences across all strata and divide by the number of strata.
Originally, we calculated this figure for all 16 of the income strata. However, in reviewing the results, we decided that relatively small differences in the household composition of a block group could have a large impact on its diversity score.5 With so many strata, over-‐representation in the $20,000-‐$24,999 stratum and under-‐representation in the $25,000-‐34,999 category, for example, would contribute to the index even though these differences are rather trivial. Therefore, for the final index, we
5 The research team’s concerns about the relatively high margins of error associated with the American Community Survey estimates also led us to use broader income categories.

III-‐11
regrouped the census data into six household income groups: under $20,000, $20,000-‐$34,999, $35,000-‐$59,999, $60,000-‐$99,999, $100,000-‐$149,999, and $150,000 and over. The absolute value of the differences were then summed and divided by 6. The resulting figure increases as the profile of a block group diverges from that of the nation and can be interpreted as the average divergence of a stratum. Note that although this is a measure of diversity, the higher the value, the less diverse the neighborhood.
Gini coefficient
The final contributor to our diversity measure is the Gini coefficient. This coefficient compares the actual distribution of aggregate income in a census tract to the ideal of a totally equal distribution. This relationship is often illustrated using the Lorenz curve (shown below). The straight line (A) represents a perfectly equal society. Ten percent of the population receives 10 percent of the income, 50 percent receives 50 percent, etc. The curved line represents an actual society in which, in this case, the bottom 30 percent of the population receives 10 percent of the income and the top 10 percent receives 25 percent of all income. The more curve in the line, the greater the income inequality. The Gini coefficient ranges from zero for a society that is perfectly equal to one for a society in which all income is owned by the top stratum. The current figure for the United States as a whole is .42, which indicates that 42 percent of all income would have to be reallocated to achieve total income equality.
Schematic representative of the Gini coefficient—relationship of income earners (X) to cumulative personal income (Y)
!

III-‐12
Relationship of economic and ethnic diversity by neighborhood
The following scatterplot presents New York’s Neighborhood Tabulation Areas by the household income and ethnic diversity measures.
Recall that the household income diversity measure becomes less diverse as scores increase. The bottom right quadrant—dominated by sections of Queens—is diverse on both dimensions. The upper right quadrant—which includes neighborhoods as different as Chelsea, Fort Greene, and Mott Haven North—is ethnically diverse but less diverse economically. The bottom left quadrant, which includes many Brooklyn neighborhoods, includes neighborhoods that are ethnically homogeneous but economically diverse. Finally, neighborhoods in the upper left quadrant score poorly on both dimensions of diversity.
Scatterplot of economic and ethnic diversity, New York City Neighborhood Tabulation Areas, 2009-‐13. Source: American Community Survey, five-‐year file.
Economic and ethnic diversity factor
We have combined three measures—the ethnic diversity index, the household income diversity index, and the Gini coefficient—to construct a measure of economic and ethnic diversity. Each of the variables picks up a different element of diversity. The Gini
Economic and ethnically diverse
Not diverse
Only ethnically diverse
Only economic diverse

III-‐13
coefficient measures block groups in which income is most unequally distributed, that is, where the gap between rich and poor residents is greatest. The economic diversity measure focuses on how closely the distribution of household income diverges from the national distribution. Finally, ethnic diversity measures the predominance of non-‐majority groups within a block group.
Because each measure focuses on a different type of diversity, the correlations between the three are not particularly strong.
Household income diversity
Gini coefficient
Ethnic diversity
Household income diversity
1.000 -‐0.118 -‐0.147
Gini coefficient -‐0.118 1.000 0.080
Ethnic diversity -‐0.147 0.080 1.000
Correlation of economic and ethnic diversity variables, New York City block groups, 2009-‐13. Source: SIAP calculation from the American Community Survey, five-‐year file.
A single factor emerges from the analysis, which explains 41 percent of the variance in the three variables. The factor loads on three variables with absolute values of factor loadings between .63 and .70. The household income diversity variable has a negative factor loading because it rises as an area becomes less diverse.
Component
Factor loading
Household income diversity -‐.692
Gini coefficient .625
Ethnic diversity .636
Economic and ethnic diversity factor loading, New York City block groups, 2009-‐13. Extraction Method: Principal Component Analysis. Source: SIAP calculation from the American Community Survey five-‐year file.
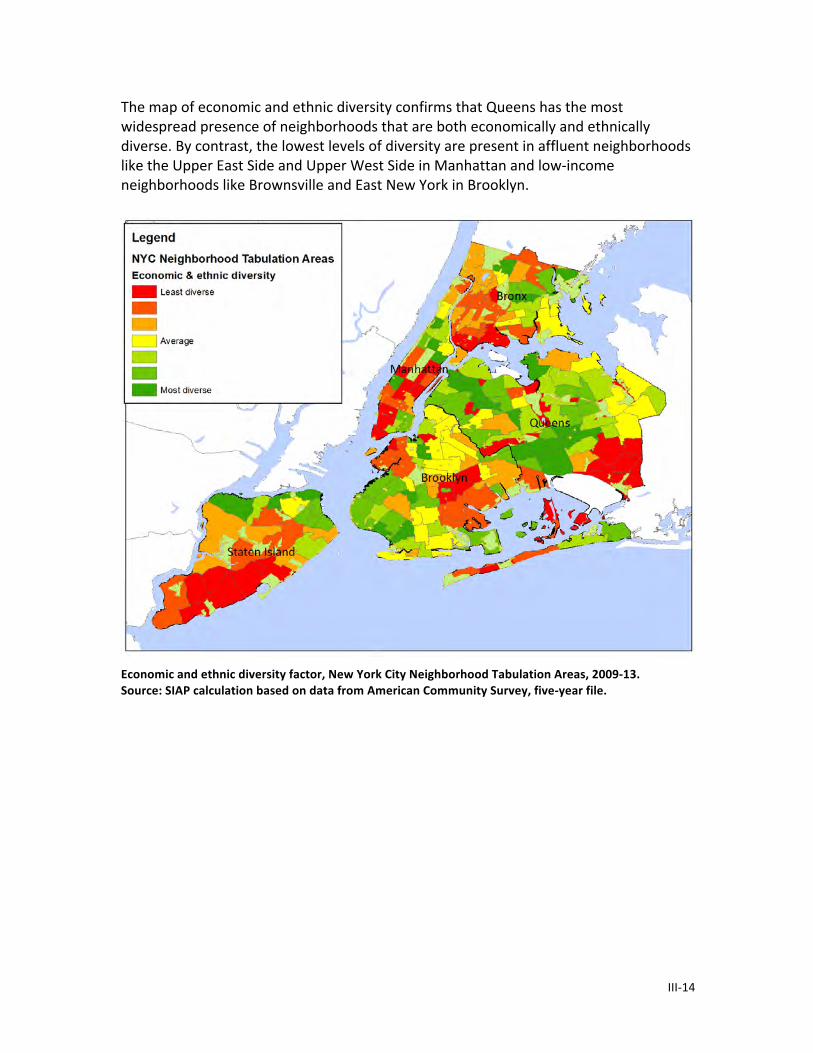
III-‐14
The map of economic and ethnic diversity confirms that Queens has the most widespread presence of neighborhoods that are both economically and ethnically diverse. By contrast, the lowest levels of diversity are present in affluent neighborhoods like the Upper East Side and Upper West Side in Manhattan and low-‐income neighborhoods like Brownsville and East New York in Brooklyn.
Economic and ethnic diversity factor, New York City Neighborhood Tabulation Areas, 2009-‐13. Source: SIAP calculation based on data from American Community Survey, five-‐year file.
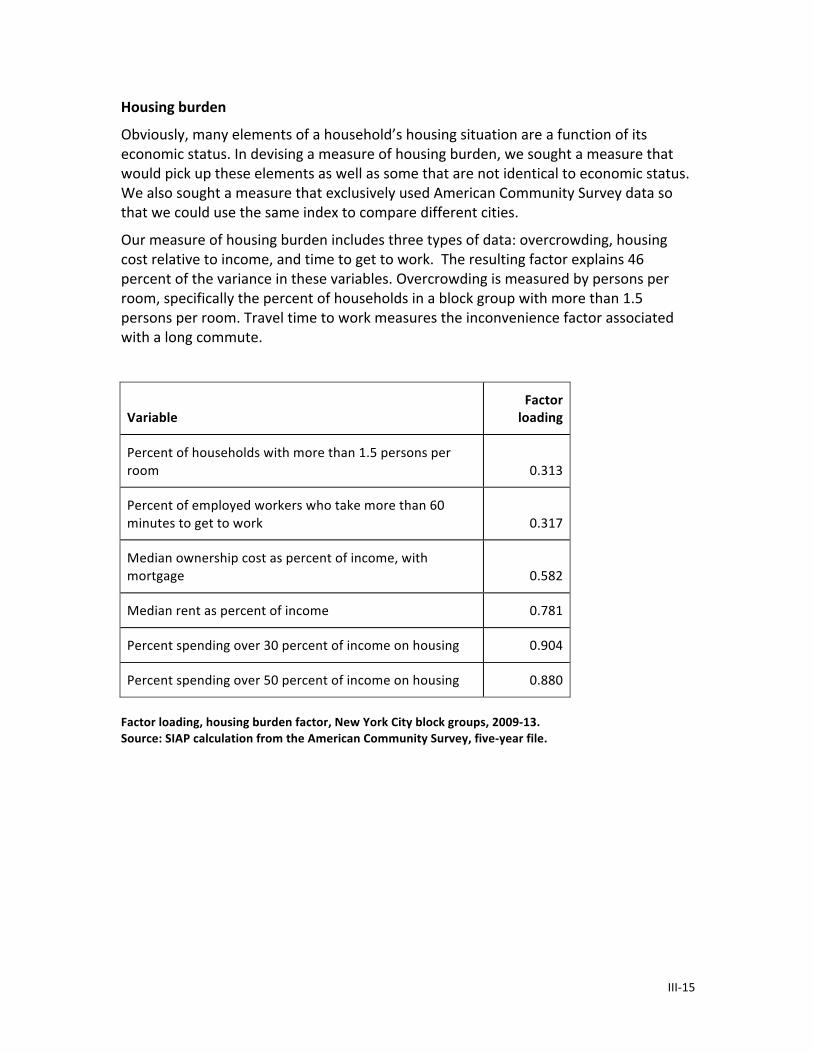
III-‐15
Housing burden
Obviously, many elements of a household’s housing situation are a function of its economic status. In devising a measure of housing burden, we sought a measure that would pick up these elements as well as some that are not identical to economic status. We also sought a measure that exclusively used American Community Survey data so that we could use the same index to compare different cities.
Our measure of housing burden includes three types of data: overcrowding, housing cost relative to income, and time to get to work. The resulting factor explains 46 percent of the variance in these variables. Overcrowding is measured by persons per room, specifically the percent of households in a block group with more than 1.5 persons per room. Travel time to work measures the inconvenience factor associated with a long commute.
Variable Factor loading
Percent of households with more than 1.5 persons per room 0.313
Percent of employed workers who take more than 60 minutes to get to work 0.317
Median ownership cost as percent of income, with mortgage 0.582
Median rent as percent of income 0.781
Percent spending over 30 percent of income on housing 0.904
Percent spending over 50 percent of income on housing 0.880
Factor loading, housing burden factor, New York City block groups, 2009-‐13. Source: SIAP calculation from the American Community Survey, five-‐year file.
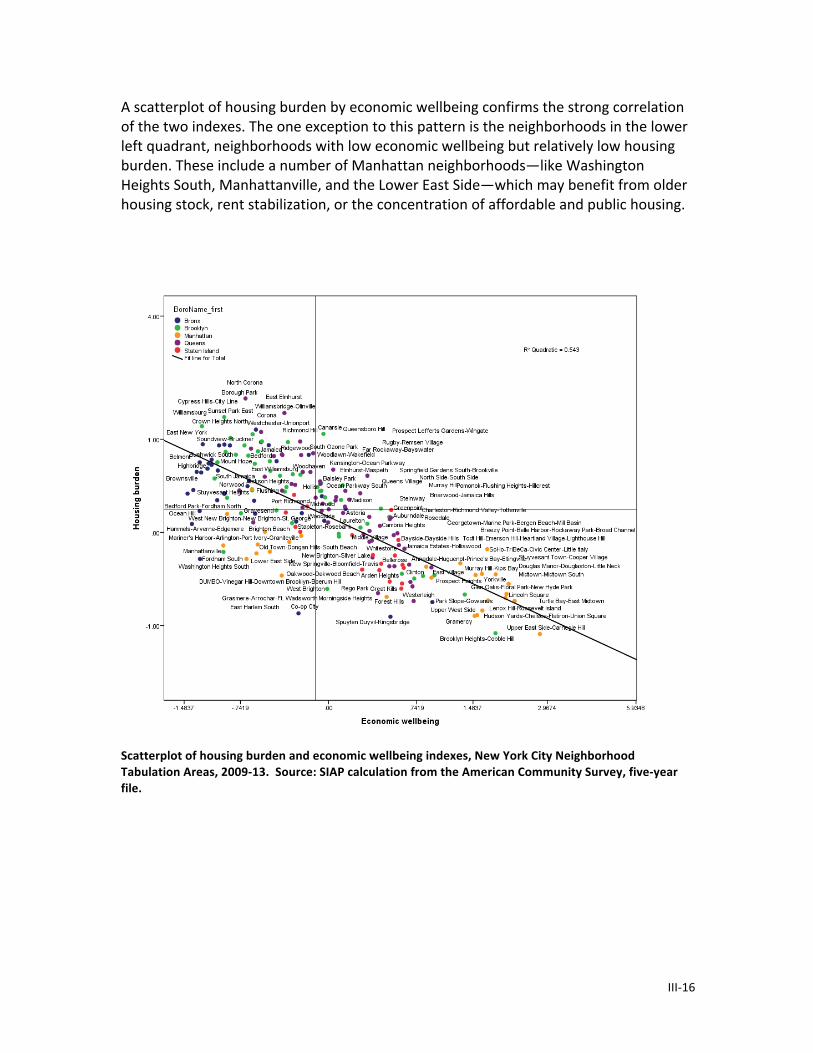
III-‐16
A scatterplot of housing burden by economic wellbeing confirms the strong correlation of the two indexes. The one exception to this pattern is the neighborhoods in the lower left quadrant, neighborhoods with low economic wellbeing but relatively low housing burden. These include a number of Manhattan neighborhoods—like Washington Heights South, Manhattanville, and the Lower East Side—which may benefit from older housing stock, rent stabilization, or the concentration of affordable and public housing.
Scatterplot of housing burden and economic wellbeing indexes, New York City Neighborhood Tabulation Areas, 2009-‐13. Source: SIAP calculation from the American Community Survey, five-‐year file.

III-‐17
Housing burden factor, New York City Neighborhood Tabulation Areas, 2009-‐13. Source: SIAP calculation from the American Community Survey five-‐year file.

III-‐18
Health access
Beginning in 2009-‐13, the American Community Survey incorporated the percent of adults with health insurance into its public five-‐year files. Data collected by the U.S. Census Bureau should provide a more reliable estimate than that based on community health surveys. These years, of course, span the implementation of the Affordable Care Act of 2010. The proportion of New York City residents without health insurance fell from 14.1 percent in 2009 to 13.5 percent in 2013. By 2015, the uninsured rate for the city had fallen to 9.3 percent, primarily because of the expansion of public health coverage, which increased from 36.7 in 2009 to 42.5 percent of the population in 2015.
As in other cities, health access does not have a straightforward relationship to economic status. Government health programs—including Medicaid, Medicare, and CHIP— disproportionately serve low-‐income populations. As a result, many residents without health insurance are in an income stratum somewhat above the poorest. They may also be immigrants who are either ineligible for government programs or choose not to enroll in them or young adults who choose to risk going without insurance.
Percent of residents without health insurance, New York City Neighborhood Tabulation Areas, 2009-‐13. Source: SIAP calculation from the American Community Survey, five-‐year file.
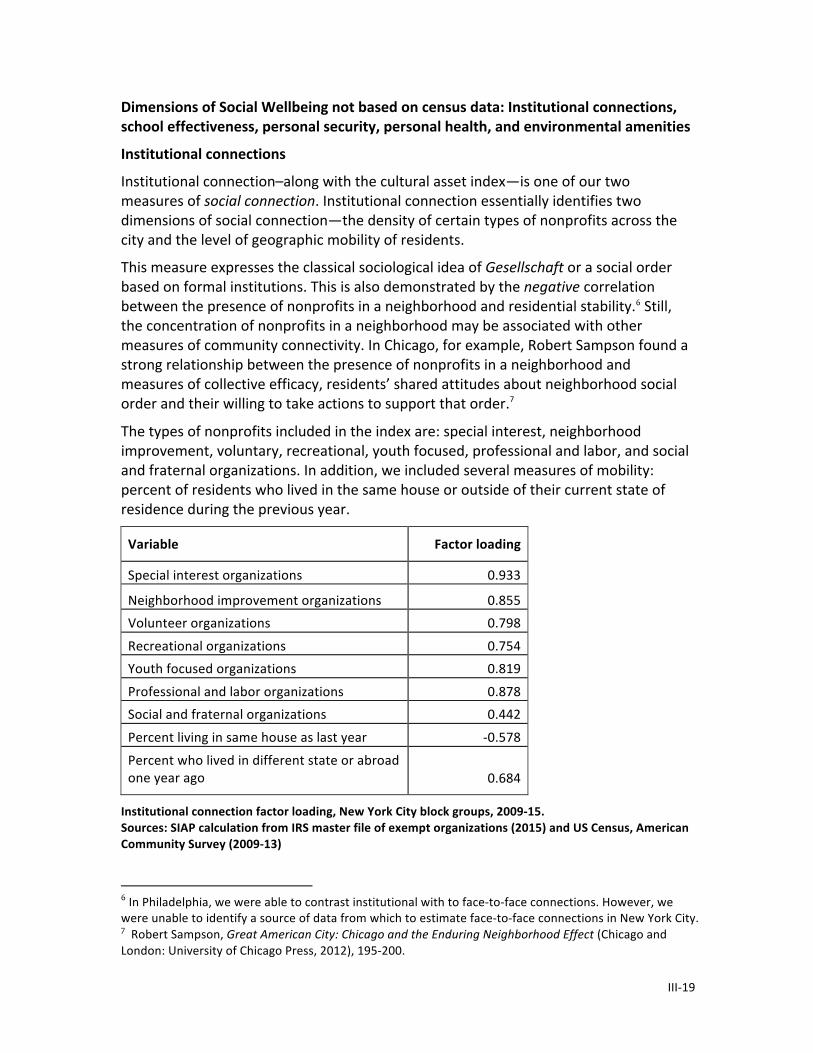
III-‐19
Dimensions of Social Wellbeing not based on census data: Institutional connections, school effectiveness, personal security, personal health, and environmental amenities
Institutional connections
Institutional connection–along with the cultural asset index—is one of our two measures of social connection. Institutional connection essentially identifies two dimensions of social connection—the density of certain types of nonprofits across the city and the level of geographic mobility of residents.
This measure expresses the classical sociological idea of Gesellschaft or a social order based on formal institutions. This is also demonstrated by the negative correlation between the presence of nonprofits in a neighborhood and residential stability.6 Still, the concentration of nonprofits in a neighborhood may be associated with other measures of community connectivity. In Chicago, for example, Robert Sampson found a strong relationship between the presence of nonprofits in a neighborhood and measures of collective efficacy, residents’ shared attitudes about neighborhood social order and their willing to take actions to support that order.7
The types of nonprofits included in the index are: special interest, neighborhood improvement, voluntary, recreational, youth focused, professional and labor, and social and fraternal organizations. In addition, we included several measures of mobility: percent of residents who lived in the same house or outside of their current state of residence during the previous year.
Variable Factor loading
Special interest organizations 0.933
Neighborhood improvement organizations 0.855 Volunteer organizations 0.798
Recreational organizations 0.754 Youth focused organizations 0.819
Professional and labor organizations 0.878 Social and fraternal organizations 0.442
Percent living in same house as last year -‐0.578
Percent who lived in different state or abroad one year ago 0.684
Institutional connection factor loading, New York City block groups, 2009-‐15. Sources: SIAP calculation from IRS master file of exempt organizations (2015) and US Census, American Community Survey (2009-‐13) 6 In Philadelphia, we were able to contrast institutional with to face-‐to-‐face connections. However, we were unable to identify a source of data from which to estimate face-‐to-‐face connections in New York City. 7 Robert Sampson, Great American City: Chicago and the Enduring Neighborhood Effect (Chicago and London: University of Chicago Press, 2012), 195-‐200.

III-‐20
Institutional connection index, New York City Neighborhood Tabulation Areas, 2009-‐15. Sources: IRS master file of exempt organizations (2015) and US Census, American Community Survey (2009-‐13).
School effectiveness
Most analyses of school data focus on individual children or schools as their unit of analysis. Our school effectiveness measure seeks to measure something else—the benefits for a neighborhood of having effective schools. Whether or not a household has children in a neighborhood school, we hypothesize, its residents benefit from living in an area with schools that are working. Effective schools may affect something as mundane as property values or as hard to measure as perception of neighborhood quality. It is this range of contributions to wellbeing that this indicator seeks to measure.
For the current analysis, we included the 2013-‐14 grades 3-‐8 English and Language Arts (ELA) and math test scores and level of proficiency for public and public charter schools. The analysis included average test scores as well as the percent of students who scored in the bottom level (level 1) and top two levels (levels 3 and 4). These data were supplemented with data from the School Quality Report, which rated schools on the

III-‐21
following dimensions8:
Dimension Description
Quality Review Rating Summary rating based on following elements
Progress Rating
The level of achievement by third-‐grade students on state exams, while accounting for their probability of achieving that proficiency based on demographic indicators of need. Higher scores on this metric reflect student performance exceeding the levels that would be expected based on demographic indicator.
Achievement Rating
This section rating reflects a school’s state test results, including student growth and performance, how students performed in core courses, how well students were prepared for their next level of school, and how students in higher-‐need groups performed.
Environment Rating
Includes data on school safety, classroom behavior, peer interactions, personal attention, and peer support.
Closing the Achievement Gap Rating
These metrics reflect the degree to which the school is helping high-‐need students succeed.
Source: NYC Department of Education School Quality Reports, November 2015 Individual school scores were aggregated to block group buffers. That is, scores were assigned to each block group based on all of the schools within a quarter mile. A factor analysis—which accounted for 62 percent of the variance in the included variables—was then conducted including the following variables and loadings.
8 New York City Department of Education, School Quality Reports: Educator Guide, November 2015. http://schools.nyc.gov/NR/rdonlyres/5347DA79-‐B985-‐4CBF-‐B56E-‐B05C8380C53B/0/201415EducatorGuideEMS11122015.pdf

III-‐22
Variable Factor loading
Average ELA score 0.955 Percent in ELA level 1 -‐0.952
Percent in ELA levels 3 & 4 0.944 Average math score 0.968
Percent in math level 1 -‐0.951
Percent in math level 3 & 4 0.959 Average quality review rating 0.552
Average achievement rating 0.706 Average environment rating 0.385
Average closing the achievement gap rating 0.675 Average progress rating 0.215
Factor loading, school effectiveness factor analysis, New York City block groups, 2013-‐14. Source: SIAP calculation based on NYC Department of Education data.
School effectiveness factor, New York City Neighborhood Tabulation Areas, 2013-‐14. Source: SIAP calculations based on NYC Department of Education.

III-‐23
Personal security
Sen and Stiglitz include personal insecurity as an important dimension of social wellbeing. Under this heading, they include “crime, accidents, natural disasters, and climate changes.”9 We examine the implications of natural disasters and climate change in our environmental amenities discussion later in this chapter. However, crime is certainly an important element of residents’ assessment of their quality of life.
Our estimates are based on reported serious crimes for the years 2009 to 2013 accessed through NYC Open Data. The dataset reported over one million crimes in seven categories: burglary, felony assaults, grand larceny, grand larceny of motor vehicle, murder and non-‐negligent manslaughter, rape, and robbery. Offenses occurring at intersections are represented at the X Coordinate and Y Coordinate of the intersection. Crimes occurring anywhere other than an intersection are geo-‐located to the middle of the block. 10 We mapped the data set and aggregated crimes to block group.
To calculate neighborhood crime rates, the number of crimes provided an estimate of the numerator, but New York City posed some challenges around the denominator. Conventionally, crime rates are calculated by dividing the total number of crimes by the population of a particular area. At broader geographies, for example a city or county, this makes sense. Although certainly some perpetrators and victims of crime live outside a particular city, most do not. However, if we try to drill down crime to small geographies, the same assumptions do not hold. The places where this problem is most apparent are central business districts, where the residential population may account for only a fraction of the number of people who are in the area at one time or another during the day and are therefore “at-‐risk” of becoming a crime victim.
Fortunately, we have other ways of estimating the population at risk. Using the Census Bureau’s Longitudinal Employer-‐Household Dynamics file, we are able to estimate the number of jobs in a particular geography (down to the census block) and the number of residents who work outside the area. As the following map makes clear, Midtown Manhattan, the Financial District, and some outer borough neighborhoods are net importers of workers while most of the city sends residents elsewhere to work. Therefore, we decided to use the sum of total residents and net jobs held by non-‐residents in the block group as our denominator.
9 Joseph E. Stiglitz, Amartya Sen, and Jean-‐Paul Fitoussi, Report by the Commission on the Measurement of Economic Performance and Social Progress (Paris, Commission on the Measurement of Economic Performance and Social Progress, 2009), 53. 10 https://data.cityofnewyork.us/Public-‐Safety/NYPD-‐Complaint-‐Map-‐Historic-‐/57mv-‐nv28

III-‐24
Ratio of jobs to residents, New York City block groups, 2009-‐13. Source: US Census Bureau, American Community Survey five-‐year file and Longitudinal Employer-‐Household Dynamics file (2013). Using the point data on felonies from NYC Open Data and our estimate of the resident and work population of small geographies, we calculated a crime rate for each category of felony. As with other dimensions, we conducted a factor analysis that included rates for individual categories as well as a total felony rate to produce a single index of crime. To provide more stable estimates, we entered both the crime rate for a particular census block group as well as that for quarter-‐mile buffers around each block group. The factor was most closely associated with more common crimes like burglary and robbery than with rarer crimes like rape and murder. Overall, the factor explained 58 percent of the variance across the variables included in the analysis.

III-‐25
Variable Factor loading
Burglary rate 0.794
Assault rate 0.759 Larceny rate 0.669
MV larceny rate 0.734 Murder rate 0.499
Rape rate 0.209
Robbery rate 0.868 Buffered burglary 0.917
Buffered assault 0.902 Buffered larceny 0.682
Buffered MV larceny 0.859
Buffered murder 0.786 Buffered rape 0.351
Buffered robbery 0.919 Felony rate 0.884
Buffered felony rate 0.926
Factor loading, security factor, New York City block groups, 2009-‐13. Source: SIAP calculations based on New York Police Department data. As shown on the map below, the security factor aligns with other dimensions that we’ve examined previously. Clearly, economic wellbeing is a good predictor of security. As with economic wellbeing, Bronx and a large section of Brooklyn displayed the lowest levels of security.

III-‐26
Personal security factor, New York City Neighborhood Tabulation Areas, 2009-‐13. Source: SIAP calculations based on New York Police Department.
Health
As the saying goes, you can’t buy good health. As we move “beyond GDP” in our measurement of social wellbeing, the health of the population is a key standard. In this report, we use data from a variety of sources to estimate the geography of health inequality in New York City. Three powerful, but not altogether surprising, conclusions follow from that analysis.
First, although you can’t buy good health, economic inequality is deeply etched into the geography of health. Living in a low-‐income neighborhood means that you are much more likely to have poor birth outcomes, higher rates of child abuse and neglect, and poor personal health overall. Second, the geography of health inequality is tied to race and ethnicity. Even taking into account economic status, black and Latino neighborhoods have health outcomes that are much worse than those in white or ethnically diverse sections of the city. Third, in the next chapter we find that the presence of cultural resources in a neighborhood—particularly in low-‐income neighborhoods—allows residents to beat the odds and enjoy better health.

III-‐27
This is not to say that cultural resources cause better health, like taking one’s vitamins or exercising regularly. Rather, we suggest that culture—that is, access to and opportunities for cultural engagement and creative expression—is one ingredient that contributes to a healthy environment. It is this ecology of health and its relationship to public investment and private actions that is the crux of this study.
Data and methods
This index uses a variety of data sources to construct our measure of the geography of health.
Department of Health and Mental Hygiene (DOHMH)
The NYC Department of Health and Mental Hygiene shared two datasets with the project: vital statistics for 2010-‐2014 and the Community Health Survey for 2009-‐13.
DOHMH vital statistics 2010-‐14
DOHMH maintains vital statistics aggregated to the census tract level. For New York, we were able to calculate birth rates for 15-‐17 year-‐olds and 18-‐19 year-‐olds using ACS estimates of the population for those ages. We then calculated a standardized teen birth rate that corrected for variations in the relative size of those two age groups. The DOHMH vital statistics data also included data on birth weight, from which we calculated low birth weight (under 2,500 grams) and very low birth weight (less than 1,500 grams).
Below are census tract maps of teen birth rate and percent low-‐weight births based on vital statistics data provided by DOHMH.
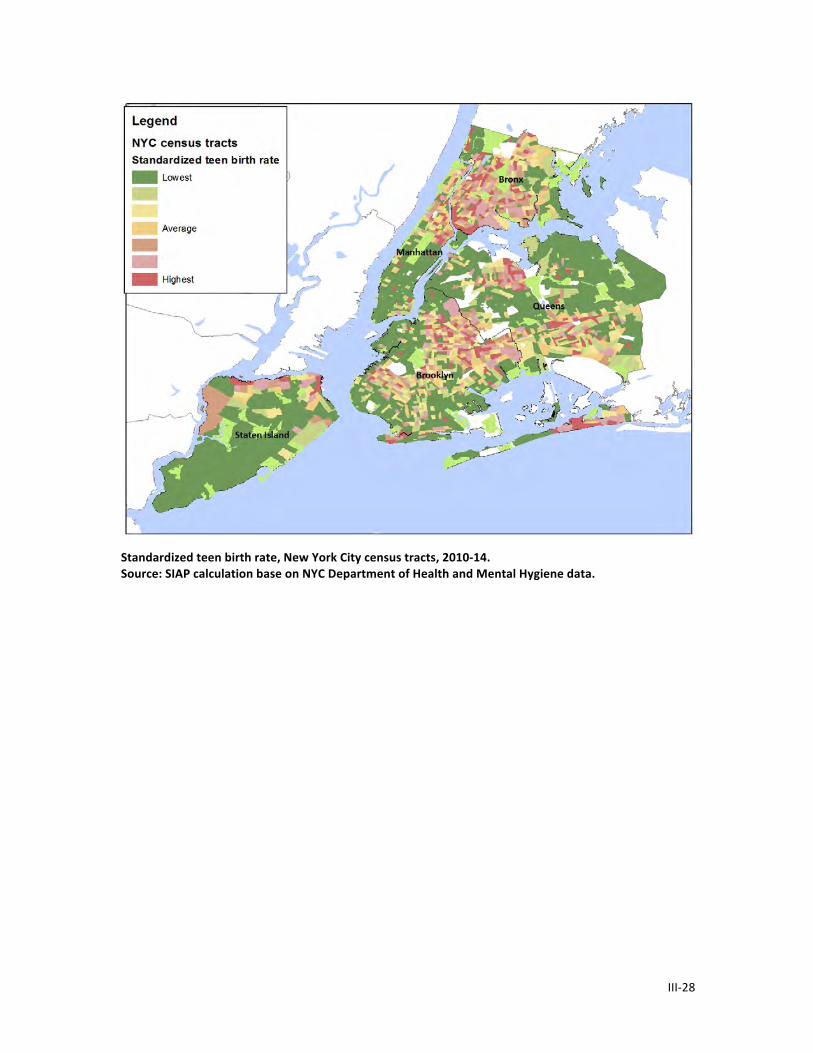
III-‐28
Standardized teen birth rate, New York City census tracts, 2010-‐14. Source: SIAP calculation base on NYC Department of Health and Mental Hygiene data.

III-‐29
Percent of low-‐weight births, New York City census tracts, 2010-‐14. Source: SIAP calculation base on NYC Department of Health and Mental Hygiene data. Community Health Survey 2009-‐13
Based on a DOHMH data use agreement, the Department made available to the project zip code level summary data from its Community Health Survey. According to the DOHMH website:
The Community Health Survey (CHS) has been conducted annually by the New York City Department of Health and Mental Hygiene since 2002. Data collected from the CHS are used to better understand the health and risk behaviors of New Yorkers and to track key indicators over time.
Target population
The target population of the CHS includes non-‐institutionalized adults aged 18 and older who live in a household with a landline telephone in New York City (the five borough area). Starting in 2009, adults living in households with only cell phones have also been included in the survey.
Health topics
Most years the CHS includes approximately 125 questions, covering the following health topics: general health status and mental health, health care access, cardiovascular health, diabetes, asthma, immunizations, nutrition and
III-‐30
physical activity, smoking, HIV, sexual behavior, alcohol consumption, cancer screening and other health topics. A core group of demographic variables are included every year to facilitate weighting and comparisons among different groups of New Yorkers.
Sampling
The CHS uses a stratified random sample to produce neighborhood and citywide estimates. Strata are defined using the United Hospital Fund's (UHF) neighborhood designation, modified slightly for the addition of new zip codes since UHF's initial definitions. There are 42 UHF neighborhoods in NYC, each defined by several adjoining zip codes.
Starting in 2009, a second sample consisting of cell-‐only households with New York City exchanges was added. This design is non-‐overlapping because in the cell-‐only sample, adults living in households with landline telephones were screened out.11
Because of sample size considerations, estimates for a number of zip codes contain too few cases to produce reliable estimates. DOHMH has dealt with this challenge in two ways. First, it combined a number of zip codes to create units that have sufficient numbers of cases. Second, the Department identified a number of zip code estimates that it considered unreliable because of the size of their standard error.
Administration for Children’s Services (ACS)
Indicated Investigations of Abuse and Neglect
The Administration for Children’s Services (ACS) provided three years of data on the number of “indicated investigations” of child abuse and neglect by census tract. When the agency receives a report of possible abuse and neglect, it initiates an investigation. Based on that investigation, it makes a determination that the investigation is “indicated” or “unfounded.” According to the ACS website:
Indicated means that: found enough evidence to support the claim that a child has been abused or neglected.12
There were approximately 19,500 cases in each of the three years of data that ACS provided (2013-‐2015). To produce an indicated investigation rate, we divided the census tract averages by the number of children under the age of 18 in each tract according to the 2010-‐14 American Community Survey. A map of our estimates is shown below.
11 https://www1.nyc.gov/site/doh/data/data-‐sets/community-‐health-‐survey-‐methodology.page 12 https://www1.nyc.gov/site/acs/child-‐welfare/parents-‐guide-‐child-‐abuse-‐investigation.page

III-‐31
Indicated cases of abuse and neglect, New York City census tracts, 2013-‐15. Source: SIAP calculations (see text) based on data provided by the Administration for Children’s Services. Computing the Health Factor
We calculated a health factor using the following variables: low weight births as percent of all births; very low weight births as percent of all births; average Apgar score below 7; the rate of indicated investigation of child abuse or neglect per 1,000 children 0-‐17 years of age; percent of CHS respondents reporting diabetes, hypertension, obesity, and fair or poor health; birth rate 18-‐19 year olds; and standardized teen birth rate. Most of the variables demonstrated a moderate or strong correlation with one another.
In Philadelphia, we discovered that our data on health broke down into two distinct factors: one that included data on birth outcomes, prenatal care, rates of abuse and neglect, and homicide death—which we labeled “social stress”—and a second that focused on survey data on morbidity or personal health. We originally calculated two distinct factors for New York City using preliminary data. However, after completing our data acquisition, we determined that the New York City data at the tract level did not break down into the same two factors.
As a result, for New York we have calculated a single health factor that incorporates elements of both morbidity and social stress. The following factor analysis displays the different variables included in the analysis and their relative importance. Overall, the

III-‐32
analysis explains 37 percent of the variance across the 10 variables. The loadings range from -‐.46 for percent with Apgar scores below 7 to -‐.79 for percent of residents reporting hypertension. Because the variables all have a negative factor loading, higher scores on the health index indicate better health.
Variable Factor loading
Birth rate, 18-‐19 year olds -‐0.570
Standardized teen birth rate -‐0.622
Percent very low birth weight -‐0.498
Percent low birth weight -‐0.529
Percent with Apgar score below 7 -‐0.460
Indicated investigation rate, abuse and neglect
-‐0.607
Percent with diabetes -‐0.539
Percent with high blood pressure -‐0.785
Obesity rate -‐0.773
Percent in fair or poor health (self-‐report) -‐0.598
The map of the health factor by Neighborhood Tabulation Area suggests that the highest levels of health distress are in the Bronx, upper Manhattan, and eastern Brooklyn—sections of the city with high poverty rates and a high proportion of African American and Hispanic residents.

III-‐33
Personal health index, New York City Neighborhood Tabulation Areas, 2009-‐14. Source: SIAP calculation (see text).
Correlates of good health
As we would expect, poor health is strongly related to economic wellbeing, educational attainment, and per capita income and is particularly correlated with the percent of African Americans and Hispanics in the census tract.

III-‐34
Variable Correlation coefficient
Percent black & Hispanic -‐0.736
Economic wellbeing 0.681
Percent with BA 0.628
Income below 2X poverty threshold
-‐0.588
Per capita income 0.561
Percent black -‐0.521
Poverty rate -‐0.517
Percent less than HS graduate -‐0.499
Percent Hispanic -‐0.439
Unemployment rate -‐0.413
Percent owner occupied 0.377
Correlation coefficients of personal health index, New York City census tracts, 2009-‐14. Source: SIAP calculation (see text).
The following two scatterplots exhibit the association of our health factor—healthier neighborhoods have a higher score—with our economic wellbeing factor and the percent black and Hispanic in the Neighborhood Tabulation Area.

III-‐35
Scatterplot, economic wellbeing and health indexes, New York City Neighborhood Tabulation Areas, 2009-‐14. Source: SIAP calculation (see text).

III-‐36
Scatterplot, percent black and Hispanic and health indexes, New York City Neighborhood Tabulation Areas, 2009-‐14. Source: SIAP calculation (see text).
Health factor summary
In this section we used data from a variety of sources to estimate the health status of New York City’s neighborhoods across the five boroughs. The key findings of the analysis are:
• Health is strongly correlated with economic status. Sections of the city with low economic standing are much more likely to have poor health, higher rates of abuse and neglect, and poor birth outcomes.
• This effect is reinforced by race. Black neighborhoods, in particular, have much more negative health outcomes than white or diverse neighborhoods with similar economic status.
Having noted these patterns, we need to close on a note of caution. The data on which this study is based leave much to be desired. Our estimates of morbidity, in particular, are dependent to a large extent on survey data for zip codes with a considerable amount of sampling error. However, it is likely that these data limitations exercise a
III-‐37
conservative influence on the analysis—making it less likely to find relationships rather than finding relationships that aren’t there.
Environmental amenities
The physical environment plays an important role in people’s wellbeing. The environment can pose hazards for humans, like extreme weather or exposure to harmful substances, which can threaten health or even survival. At the same time, the physical environment provides opportunities to interact with nature and other residents, in ways that improve quality of life. This explains why Sen and Stiglitz included it as an aspect of their wellbeing scheme.
However, as we move the scale of measuring wellbeing from a national or regional frame to a neighborhood focus, measuring environment’s contribution to wellbeing becomes more difficult. Hurricane Sandy demonstrated that cities are vulnerable to the effects of natural disasters and climate change. We examined the increasing flood risk associated with climate change below, but discovered that many of the neighborhoods facing that risk also had higher than average concentrations of positive amenities like high concentrations of trees and grass.
The research team doesn’t include environmental experts. This analysis of environment for New York City should be taken as preliminary. We reviewed three different types of data:
• land coverage data; • satellite data on thermal radiation; and • location of flood plains.
In reviewing the data, we discovered that flood plains were difficult to integrate into the factor because most flood plains are covered with park and grass. 13
Land coverage
As in Philadelphia, we were able to obtain a high-‐resolution land cover dataset for New York City via NYC OpenData. The analysis maps one-‐meter squares of land as covered by seven types of features: tree canopy, grass/shrubs, bare earth, water, buildings, roads, or other paved surfaces. 14
13 We originally analyzed a fourth type of environmental data—the Environmental Protection Agency’s Toxic Release Inventory. However, because the TRI was uncorrelated with our other environmental data, we decided not to include it in this analysis. 14 Methods were developed by the University of Vermont Spatial Analysis Laboratory, in collaboration with the New York City Urban Field Station, with funding from the USDA Forest Service. Funding to create dataset was provided by the National Urban and Community Forestry Advisory Council (NUCFAC) and the National Science Foundation (NSF). The following image was downloaded from NYC OpenData and did not include a legend.

III-‐38
Land coverage, one-‐meter data, New York City, 2010. Source: University of Vermont Spatial Analysis Laboratory.
We converted the above image into a block group file with the percent of different types of cover. Below, for example, are maps of tree coverage and grass coverage.

III-‐39
Tree coverage, New York City block groups, 2010. Source: SIAP calculation based on University of Vermont Spatial Analysis Laboratory.

III-‐40
Grass coverage, New York City block groups, 2010. Source: University of Vermont Spatial Analysis Laboratory.
The tree and grass coverage certainly identify a dimension of “the good life” that has been influential in the United States for the past three-‐quarters of a century. After all, one of the major rationales for the spread of suburbanization after World War II was to allow families to enjoy the benefits of the natural world, which was often defined as a green lawn. By this measure, Staten Island and eastern Queens are the most desirable parts of the city.
Heat vulnerability
Even before global warming made headlines, public health officials had become aware that extended heat waves during the summer were associated with elevated death rates, to say nothing of the less dramatic misery of living or trying to sleep in a sweltering apartment.15
15 Eric Klinenberg, Heat Wave: A Social Autopsy of Disaster in Chicago (Chicago: University of Chicago Press, 2015).

III-‐41
To measure variation in heat across the city, we have turned to the Landsat satellite, which provides a set of estimates of infrared radiation. We chose days during the late spring and summer when the sky was cloudless to identify temperature variation.
For example, the following satellite image was taken on August 26, 2015, a sunny day in the city on which the thermometer hit 85 degrees. The color frame moves from green for the coolest areas to brown for the hottest sections of the city.
Infrared radiation, New York City, August 26, 2015. Source: NASA.
On that day, one would have had to be on the water or flee to the Jersey suburbs to enjoy a cooler environment. Still, within New York City, we can detect the benefits of city parks—with Central Park clearly visible in the middle of Manhattan, Prospect Park in Brooklyn, and Corona Park in Queens.

III-‐42
We were able to translate these satellite images into census tract representations, as shown below.
Infrared radiation, New York City census tracts, August 2015. Source: SIAP calculation (see text). Flood plains
Since Hurricane Sandy hit New York City in October 2012, the risk of floods has been a major environmental concern for the city. FEMA has collaborated with the New York Panel on Climate Change to estimate impact of projected sea level rises of 11 inches (the 90th percentile projection) on the city’s neighborhoods. 16
16 New York Panel on Climate Change, Climate Risk Information 2013: Observations, Climate Change Projections, and Maps. (New York: NY Panel on Climate Change, 2013).

III-‐43
Estimated flood plain risk 2020, New York City. Source: New York Panel on Climate Change, 2013.
As in Philadelphia, we discovered that flood plain risk, which we think of as a negative environmental factor, is highly correlated with the presence of parks, trees, and grass and typically cooler temperatures. Although the increasing risk of floods is significant, we’ve chosen to emphasize the positive environmental role of parks, trees, grass, and cooler temperatures rather than the negative risk of floods.
Environmental amenities factor
Several of the individual variables discussed above—including the concentrations of trees, grass, and summer heat—were closely related with one another. As mentioned, the flood risk of neighborhoods was also related to these factors, but because the relationship was negative, we excluded it from the analysis.

III-‐44
The three-‐variable factor loaded most strongly on the concentration of trees in a block group. As expected, the concentration of heat was inversely related to that of trees and grass. Overall, the single factor explained 48 percent of the variance in the three variables.
Variable Environment index, Factor loading
Percent trees 0.858
Percent grass 0.698
Heat—average of 4-‐ day scores -‐0.474
Environmental amenities, factor loading, New York City block groups, 2010-‐14. Source: SIAP calculation (see text). The map of the environment amenities index closely matches those of the individual variables discussed above.
Environmental amenities index, New York City Neighborhood Tabulation Areas, 2010-‐14. Source: SIAP calculation (see text).

III-‐45
Social Wellbeing Clusters in New York City
A number of studies of social wellbeing have focused on the concepts of concentrated advantage and concentrated disadvantage in discussing individual wellbeing and capabilities.17 At the same time, there is a long tradition in American sociology examining the impact of concentrated disadvantage at the neighborhood level.18 Therefore, examining social wellbeing clusters provides an opportunity to link these two literatures.
Our approach was to conduct a cluster analysis using the K-‐Means approach. In essence, this approach seeks to cluster cases into groups that maximize the differences between groups and minimize the differences within groups based on the analytical variables. For this analysis, we included the nine dimensions of social wellbeing discussed earlier in this chapter—and the cultural assets index discussed in Chapter 2—for a total of ten dimensions of social wellbeing.
Economic wellbeing is strongly correlated with a number of other dimensions of wellbeing. It has strong correlations with insecurity, morbidity, health access, housing burden, school effectiveness, institutional connections, and cultural assets. These correlations suggest that we are likely to find significant social wellbeing clusters in the form of areas with concentrated advantage and disadvantage.
The individual social wellbeing indexes were entered into the ArcMap “Grouping Analysis” procedure without spatial constraints. Nevertheless, the results did cluster spatially, an indication of the extent to which social distance translates into physical distance between social strata.
We experimented with a number of alternatives in terms of number of clusters. Conceptually, we began with the idea that we would identify concentrations of advantage and disadvantage, with at least one intermediate group. In the end, we focused on a four-‐group analysis, to be discussed below.
We have used the following labels to differentiate the four clusters:
• Diverse and Struggling
• Concentrated Disadvantage
• Concentrated Advantage
• Midtown Advantage19.
17 Jonathan Wolff and Avner De-‐Shalit, Disadvantage (Oxford, Eng: Oxford University Press, 2007). 18 Robert J. Sampson, Great American City: Chicago and the Enduring Neighborhood Effect (Chicago: University of Chicago Press, 2012). Alice O’Connor, Poverty Knowledge: Social Science, Social Policy and the Poor in Twentieth-‐Century U. S. History (Princeton: Princeton University Press, 2001). 19 We recognize that the Midtown Advantage cluster includes several lower Manhattan neighborhoods as well as those in Midtown.

III-‐46
As we’ve noted, economic wellbeing is the strongest variable differentiating the four clusters. The average score for census tracts in the Concentrated Advantage cluster is 0.8 standard deviations above the mean, while the Concentrated Disadvantage cluster average was 0.7 standard deviations below the mean. Midtown Advantage, which represented only two percent of all of the city’s tracts, enjoyed the highest economic wellbeing mean (1.9 standard deviations above the citywide average).
Economic wellbeing often was associated with other dimensions of wellbeing. The two advantaged clusters had the most desirable scores on every index except economic and ethnic diversity, while Concentrated Disadvantage clusters had the least desirable scores on 7 of the 10 dimensions of wellbeing. Diverse and Struggling, perhaps, had the most notable combination of strengths and challenges. Its economic wellbeing score was well below the citywide average, although not nearly as low as the Concentrated Disadvantage sections of the city, and its housing burden factor was nearly as high as that of Concentrated Disadvantage neighborhoods. Still, Diverse and Struggling clusters showed surprising strength in terms of health, school effectiveness, and security, all of which were above the citywide average.
Social wellbeing clusters, New York City Neighborhood Tabulation Areas, 2013-‐15. Source: SIAP calculation (see text).

III-‐47
The demographics of the clusters reinforce these characterizations. As we would expect, 86 percent of the residents of the Concentrated Disadvantage neighborhoods were black or Hispanic. Although the poverty rate for Diverse and Struggling clusters was well below the figure for Concentrated Disadvantage neighborhoods, 39 percent of residents had incomes less than 200 percent of the poverty line.
Social wellbeing clusters
Variable Diverse & struggling
Concentrated disadvantage
Concentrated advantage
Midtown advantage
City average
Percent white 37.8 9.1 61.6 64.7 34.4
Percent black 12.3 42.0 10.0 3.5 21.8
Percent Asian 21.2 3.4 13.8 19.6 13.1
Percent Hispanic 25.6 43.5 12.4 8.7 28.1
Percent less than HS graduate
20.2 28.4 8.9 5.4 19.9
Percent with BA 32.5 18.7 50.0 77.2 33.0
Poverty rate 20.5 24.3 10.9 7.0 19.1
Percent less than 2x poverty threshold
39.0 54.4 20.0 17.9 39.1
Percent owners 36.4 19.9 56.4 25.0 35.4
Percent renters 63.6 80.1 43.6 75.0 64.6
Selected socio-‐economic variables by social wellbeing cluster, New York City Neighborhood Tabulation Areas, 2010-‐14. Source: American Community Survey, five-‐year file, and SIAP.
Our two types of neighborhood clusters—social wellbeing and cultural clusters—are strongly related. Only 51 Neighborhood Tabulation Areas enjoy Concentrated Advantage or Midtown Advantage status, but they constitute 75 percent of the neighborhoods in high market and 83 percent of market cultural clusters. Civic clusters are most associated with Struggling and Diverse clusters and Concentrated Disadvantage neighborhoods.
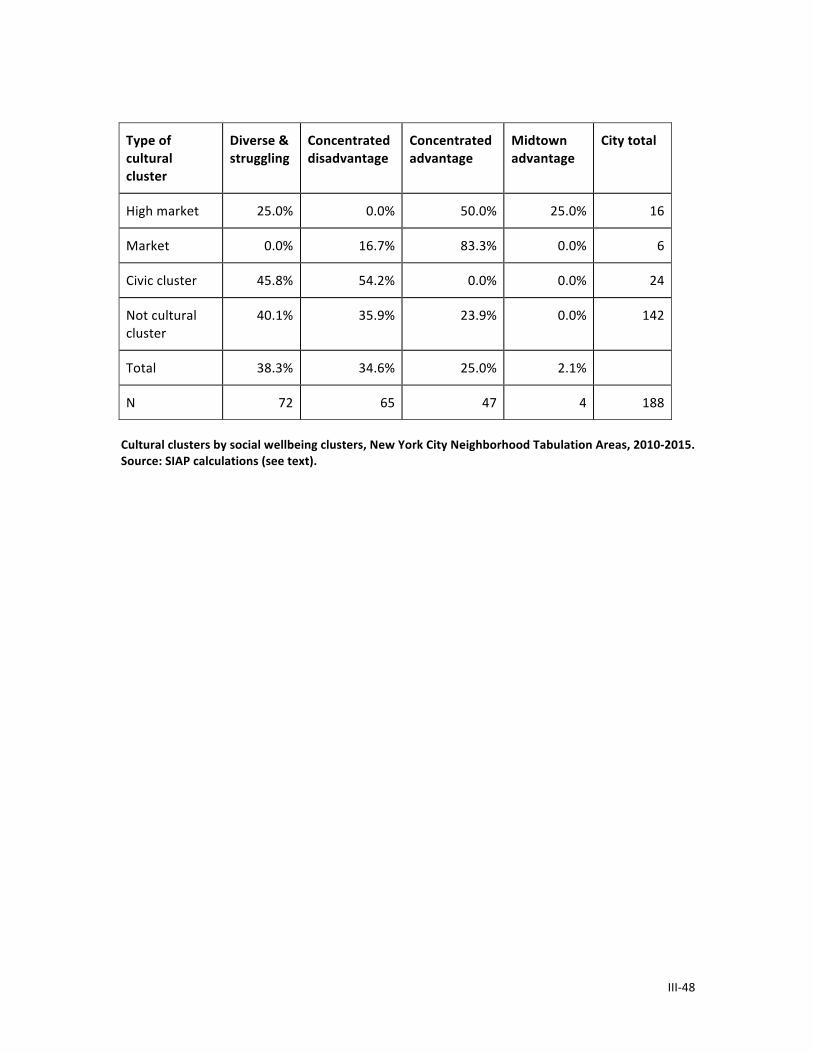
III-‐48
Type of cultural cluster
Diverse & struggling
Concentrated disadvantage
Concentrated advantage
Midtown advantage
City total
High market 25.0% 0.0% 50.0% 25.0% 16
Market 0.0% 16.7% 83.3% 0.0% 6
Civic cluster 45.8% 54.2% 0.0% 0.0% 24
Not cultural cluster
40.1% 35.9% 23.9% 0.0% 142
Total 38.3% 34.6% 25.0% 2.1%
N 72 65 47 4 188
Cultural clusters by social wellbeing clusters, New York City Neighborhood Tabulation Areas, 2010-‐2015. Source: SIAP calculations (see text).
III-‐49
Conclusion
Studying social wellbeing and inequality raises a fundamental contradiction for researchers. In an ideal world, the variation in inequality across the New York City neighborhoods would be smaller than what we have found. What is more, the strong relationship between different dimensions of wellbeing that we’ve discovered would not exist. Ideally, where you live would have no connection to your state of wellbeing.
Yet, if we are to do anything about the levels of inequality experienced by New Yorkers, we need better tools for documenting its current state and the connections between its different dimensions. The current analysis not only lays out the magnitude of the challenge but also suggests the variety of possible strategies that could address inequality.
At the center of New York’s inequality is economic opportunity, what we label economic wellbeing. Access to education, work, and income are the fundamental challenges faced by the city’s households, and the data underline how profound a challenge that is. The current mayoral administration has committed itself to reducing the number of New Yorkers living in poverty by 800,000. Our study suggests that a reduction of that magnitude would have significant ripple effects on other dimensions of wellbeing.
At the same time, a multi-‐dimensional view of social wellbeing points to other ways to improve the lives of New Yorkers. The successful effort to plant a million trees in the city could have an immediate impact, both aesthetically and in reducing the impact of heat on hot summer days.20 Even apart from the poverty reduction, efforts to expand prenatal care, prevent diabetes, and reform schools could all bring about measurable improvements in residents’ lives.
At its core, social wellbeing grows out of a quest for freedom and opportunity.21 In attempting to measure so many variables, it is easy to lose sight of this idea. The evidence from New York reveals that too many New Yorkers lack the freedom to choose and the opportunities to live the life they have reason to value. This is the fundamental challenge faced by the city, its government, and its residents.
20 http://www.milliontreesnyc.org/html/home/home.shtml 21 Economist Amartya Sen, in his 1999 book Development as Freedom, characterizes poverty as lack of freedom and explores the expansion of freedom as both the primary end and the principal means of development.
Chapter 4—Analytical Perspectives on Culture and Social Wellbeing in New York City
In the previous two chapters, we have described the construction of cultural asset and social wellbeing indexes for New York City. In this chapter, we use that data to address two questions: what aspects of the city’s neighborhood ecology are associated with concentrations of cultural resources and how is the presence of cultural resources, in turn, related to other aspects of social wellbeing.
Influence of Neighborhood on Cultural Assets
Neighborhoods with different concentrations of cultural resources possess distinct social profiles (see table below). For example, the neighborhoods with the highest cultural concentrations have per capita income nearly twice the citywide average, much lower poverty rates, and higher numbers of college graduates and nonfamily households. As we would expect, given the socio-‐economic profile of neighborhoods with the highest concentration of cultural resources, African Americans and Hispanics were under-‐represented in these parts of the city.
The importance of nonfamily households echoes a pattern we found in Philadelphia—that is, the importance of household diversity.1 It has been widely noted that the dominance of “traditional” families has declined in recent decades. Much of the political debate has centered on female-‐headed families with children and its link to poverty and welfare dependency. Yet, an even more widespread change in domestic life has been the expansion of households composed of members not related by marriage or birth. In earlier work, we have noted the association of household diversity to the concentration of cultural resources in Philadelphia.
The data confirm that in New York City, the nonfamily household percentage is strongly associated with the concentration of cultural assets. New York’s Cultural Asset Index is also related to neighborhoods with high concentrations of young adults. At the same time, these sections of the city have smaller proportions of married-‐couple families.
One pattern that we have not encountered in other cities is the relationship between housing unit vacancies and cultural assets. The New York block groups with the highest concentration of cultural assets have vacancy rates of housing units 49 percent higher than the citywide figure.
1 The Census Bureau defines a nonfamily household as one in which the members are not related by blood, marriage, or adoption. Historically, same-‐sex couples were classified as nonfamily households unless a child was present. Beginning in 2013, in recognition of the success of marriage equality, the census began to recognize married same-‐sex couples as families.

IV-‐2
Cultural Asset Index (quintiles)
Lowest 20
percent
20-‐39th percent
Average 60-‐79th percent
Top 20 percent
City average
Percent non-‐family household 26.1 28.9 32.5 42.1 50.3 36.0
Percent with BA 21.6 24.4 27.9 38.2 50.8 32.6
Per capita income 23,548 23,605 24,695 33,144 55,309 32,039
Percent black 41.2 22.9 18.5 18.3 12.4 22.7
Percent renter-‐occupied 54.4 60.8 66.1 77.2 77.2 67.1
Percent owner-‐occupied 45.6 39.2 33.9 22.8 22.8 32.9
Percent 18-‐34 years of age 24.1 24.9 25.6 30.5 32.4 27.5
Environmental factor 0.4 0.1 0.0 -‐0.2 -‐0.4 0.0
Percent non-‐Hispanic white 21.6 30.4 31.4 36.1 46.1 33.1
Percent married couple family household 39.8 42.3 41.4 34.6 31.1 37.8
Percent "other” vacant 4.3 4.2 4.4 5.4 7.8 5.2
Percent vacant 6.8 6.9 7.3 8.7 10.7 8.1
Percent not in labor force 61.4 61.6 61.7 65.8 66.3 63.4
Average values of selected socio-‐economic variables by Cultural Asset Index strata, New York City block groups, 2009-‐13. Source: SIAP calculation (see text).
Influence of neighborhood on cultural assets—predictors of Cultural Asset Index score
Based on these descriptive results, we conducted a series of regression analyses to determine the unique impact of different variables on the likelihood that a neighborhood would have a high or low Cultural Asset Index.
As a conceptual framework, we postulated that the results for higher-‐ and lower-‐income neighborhoods would be quite different, a hypothesis that was confirmed by the analysis. In operational terms, we decided to segment our data and conduct separate analyses on high-‐moderate and low-‐income sections of the city. To do so, we divided the file into block groups in the top 60 percent and bottom 40 percent in terms of per capita income (PCI). We used per capita income instead of household income because it

IV-‐3
corrects for the many one-‐ and two-‐person households in the city, for which household income might overestimate their economic challenges.
The map below shows the sections of the city that are classified as high-‐moderate income (top 60 percent PCI) and low-‐income (bottom 40 percent PCI) by this definition.2 Specifically, all block groups with per capita income below 21,516 dollars in the 2009-‐13 American Community Survey five-‐year file were in the bottom 40 percent and those above this figure were in the top 60 percent. This translates into an income of 64,548 dollars for a three-‐person household. As other analyses suggest, although lower income block groups are located in every borough, the Bronx and Brooklyn have the highest proportion.
Per capita income, New York City block groups, 2009-‐13. Source: American Community Survey five-‐year file. We conducted regression analyses with the Cultural Asset Index as the dependent variable and the following independent variables: economic wellbeing, environment amenities index, percent of 18-‐34-‐year-‐olds, ethnic composition, and percent of nonfamily households.
2 We will also refer to these as lower and higher income sections of the city.

IV-‐4
The model does a much better job of predicting the Cultural Asset Index (CAI) among higher income sections of the city, with an R-‐square of 39 percent. In lower income block groups, the model explains only 10 percent. Much of this difference is attributable to the surprisingly low power of economic wellbeing in predicting CAI within the low-‐income stratum.
Looking first at higher income parts of the city, we find, as expected, that economic wellbeing is a reliable predictor of a block group’s CAI score. Without considering other variables, it explains 20 percent of the variance in the CAI, a figure that falls to 9 percent when other variables are considered. Nonfamily household percentage is a strong predictor of the CAI, with an unadjusted eta-‐squared of .27 and an adjusted coefficient of .09. The environment index maintains its influence among higher-‐income block groups, with unadjusted and adjusted coefficients of .08 and .04 respectively. Ethnic composition remains only marginally significant, explaining less than 1 percent of the variance in the CAI among higher-‐income block groups.
The influences among lower-‐income block groups are quite different. First, economic wellbeing has no significant influence, explaining only two-‐tenths of one percent of the variance in the CAI. Both nonfamily household and young adult variables remain significant, with adjusted coefficients of .09 for nonfamily households and .01 for adults 18-‐34 years of age. Ethnic composition, which was barely significant for high-‐income sections of the city, is the strongest variable among lower-‐income block groups with an adjusted coefficient of .04.

IV-‐5
Top 60 percent F Sig. eta-‐squared beta-‐squared/R-‐squared
Model 33.83 0.00 0.391
Environment amenities 17.56 0.00 0.082 0.041
Nonfamily households 27.93 0.00 0.268 0.092
Economic wellbeing 29.31 0.00 0.196 0.090
Percent 18-‐34 2.66 0.03 0.133 0.008
Ethnic composition 2.03 0.05 0.063 0.007
Bottom 40 percent
Model 4.48 0.00 0.100
Environment amenities 0.79 0.53 0.002 0.003
Nonfamily households 12.15 0.00 0.047 0.052
Economic wellbeing 0.43 0.73 0.003 0.001
Percent 18-‐34 3.09 0.02 0.017 0.014
Ethnic composition 4.87 0.00 0.029 0.038
Multivariate analysis of Cultural Asset Index, New York City block groups, 2013-‐15. Source: SIAP calculation (see text). The relationships of the Cultural Asset Index to the independent variables are consistent with our expectations. Economic wellbeing and the household structure variable have a positive relationship to the CAI. Perhaps more surprising is the negative relationship between the CAI and the environmental amenities index: as the number of trees in a neighborhood increases, the presence of cultural resources declines. Although we wouldn’t want to conclude that the arts are attracted to less salubrious parts of the city, it may underline the importance of density for cultural ecology. Sections of the city with many cultural resources are denser and as a result have fewer trees and grass and are hotter in summer. Influence of Cultural Assets on Social Wellbeing
The rationale for this project has been the hypothesis that the arts and culture are not only an integral dimension of social wellbeing but that their presence has a measurable impact on other dimensions of wellbeing at the neighborhood level. In this section, we focus on three of our dimensions—health, school effectiveness, and personal security—and evaluate their association with our Cultural Asset Index, controlling for other influences.

IV-‐6
Method
In this section we use the data described in Chapters 2 and 3 to examine the relationship of cultural resources to variation in other dimensions of social wellbeing. If we examine the list of dimensions, it’s clear that several are unlikely to be influenced by cultural resources. In the previous section, we examined three—economic wellbeing, diversity, and environment—that we see as influencing culture rather than being influenced by culture. Others, like housing burden and health insurance access, seem to be so anchored in economic and political realties that it is hard to imagine making a plausible argument that culture influences them.
As a first estimate, we have focused on three dimensions of social wellbeing for which one could make a plausible case for influence: health, school effectiveness, and security. In all three of these cases, the argument is quite similar. Cultural opportunities can be seen as part of a neighborhood’s ecology and a contributor to social connection and civic engagement. In turn, this engagement would, as a spillover effect, promote activity and actions that foster community safety, avoidance of risky or unhealthy decisions, and involvement with local institutions.
Of course, given the overarching influence of economic wellbeing in higher-‐income neighborhoods and of race and ethnicity in lower-‐income neighborhoods, finding a relationship between culture and these three dimensions—health, school effectiveness, and security—without taking into consideration economic wellbeing, race, and ethnicity would be unconvincing.
This has led to our analytical strategy: conduct a set of statistical analyses to examine the relationship between these three dimensions of wellbeing and cultural assets controlling for the influence of economic wellbeing, race, and ethnicity. We’ve used a variety of regression-‐based methods to conduct these analyses.3 Here, we focus on the simple linear regression results.
In the following analyses, we have generally found the same relationships regardless of the method used, which reinforces the point that the findings are not an artifact of the method but are clearly present in the data.
Regression results
Our test of the relationship of cultural assets to health, school effectiveness, and security employs ordinary least-‐square regression. The block group file was split by per capita income (highest 60 percent and lowest 40 percent) and a separate analysis was conducted for each stratum. Three independent variables were included: the percent of
3 This analysis uses social wellbeing data that centers on 2009-‐13. Our cultural asset data for the most part are focused on 2009-‐15. See the previous two chapters for the specific years associated with each data source. These analyses use block group estimates. In cases where our data is measured at the tract level, we assigned the tract value to each block group. However, to reflect the point that some of the data are measured at the tract level, we’ve weighted them to approximate the roughly two thousand census tracts, instead of the six thousand block groups.

IV-‐7
the population that was black or Hispanic, the economic wellbeing score, and the Cultural Asset Index score.
Health
When controlled for race, ethnicity, and economic wellbeing, the Cultural Asset Index had a strong impact on our health index for lower-‐income block groups but was not statistically significant in the top 60 percent of the income distribution. Lower-‐income neighborhoods have a greater risk of poor health conditions and fewer economic resources to address them. In these sections of the city, the level of social connection, indicated by cultural assets, can partially compensate for these risks. Overall, the analyses predicted 21 percent of the variance in the health index for higher-‐income sections of the city and 16 percent for lower-‐income areas. Percent of population black or Hispanic was the strongest predictor of health, with partial correlations of -‐.53 for both higher and lower-‐income neighborhoods. In contrast, economic wellbeing was a weaker influence, particularly for lower-‐income neighborhoods, with partial correlations of .35 and .24. Finally, cultural assets’ association with health when controlled for the other two variables was not statistically significant among higher income neighborhoods but was stronger than economic wellbeing among lower income areas, with a partial correlation of .20.
Unstandardized Coefficients
Standardized Coefficients
t Sig. Correlations
Top 60 percent B Std. Error
Beta Zero-‐order
Partial
(Constant) 0.71 0.03 20.70 0.00
Percent black/ Hispanic
-‐0.01 0.00 -‐0.49 -‐21.87 0.00 -‐0.67 -‐0.53
Economic wellbeing index
0.33 0.02 0.33 13.13 0.00 0.60 0.35
Cultural Asset Index 0.03 0.02 0.03 1.54 0.12 0.33 0.04
Bottom 40 percent
(Constant) 0.70 0.06 11.88 0.00
Percent black/ Hispanic
-‐0.01 0.00 -‐0.51 -‐18.74 0.00 -‐0.61 -‐0.53
Economic wellbeing index
0.38 0.05 0.20 7.43 0.00 0.40 0.24
Cultural Asset Index 0.17 0.03 0.15 5.99 0.00 0.24 0.20
Regression results, health index by economic wellbeing, percent black or Hispanic, and Cultural Asset Index, stratified by per capita income, New York City block groups, 2009-‐15. Source: SIAP calculation (see text).

IV-‐8
School effectiveness
All three of the variables—economic wellbeing, percent black or Hispanic, and the Cultural Asset Index—had a statistically significant relationship with school effectiveness for both higher-‐ and lower-‐income neighborhoods. The model explained 41 percent of the variance in school effectiveness among higher income sections of the city and 44 percent among lower-‐income block groups.
Among higher-‐income neighborhoods, race and ethnicity remained the strongest influence with a partial correlation of -‐.51, followed by economic wellbeing (.16) and cultural assets (.07). Among lower-‐income sections of the city, percent black or Hispanic remained the strongest influence with a partial correlation of -‐.61, followed by economic wellbeing (.11), and cultural assets (.06).
Unstandardized Coefficients
Standardized Coefficients
t Sig. Correlations
Top 60 percent B Std. Error Beta Zero-‐order
Partial
(Constant) 0.858 0.029 30 .00
Percent black/ Hispanic
-‐0.017 0 -‐0.53 -‐34.04 .00 -‐0.621 -‐0.515
Economic wellbeing index
0.19 0.021 0.156 9.022 .00 0.446 0.157
Cultural Asset Index
0.067 0.018 0.058 3.726 .00 0.261 0.066
Bottom 40 percent
(Constant) 0.768 0.033 23.281 .00
Percent black/ Hispanic
-‐0.015 0 -‐0.617 -‐36.837 .00 -‐0.658 -‐0.606
Economic wellbeing index
0.152 0.027 0.092 5.569 .00 0.313 0.114
Cultural Asset Index
0.047 0.016 0.045 2.879 .00 0.159 0.059
Regression results, school effectiveness by economic wellbeing, percent black or Hispanic, and Cultural Asset Index, stratified by per capita income, New York City block groups, 2009-‐15. Source: SIAP calculation (see text).
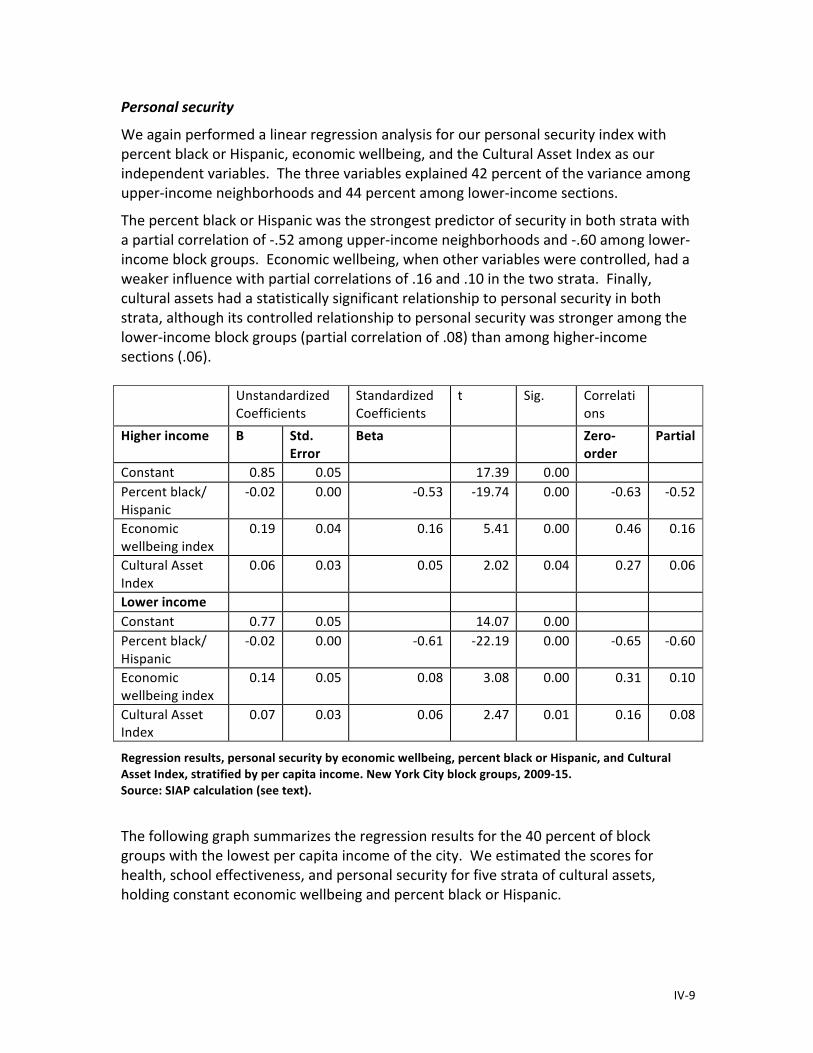
IV-‐9
Personal security
We again performed a linear regression analysis for our personal security index with percent black or Hispanic, economic wellbeing, and the Cultural Asset Index as our independent variables. The three variables explained 42 percent of the variance among upper-‐income neighborhoods and 44 percent among lower-‐income sections.
The percent black or Hispanic was the strongest predictor of security in both strata with a partial correlation of -‐.52 among upper-‐income neighborhoods and -‐.60 among lower-‐income block groups. Economic wellbeing, when other variables were controlled, had a weaker influence with partial correlations of .16 and .10 in the two strata. Finally, cultural assets had a statistically significant relationship to personal security in both strata, although its controlled relationship to personal security was stronger among the lower-‐income block groups (partial correlation of .08) than among higher-‐income sections (.06).
Unstandardized Coefficients
Standardized Coefficients
t Sig. Correlations
Higher income B Std. Error
Beta Zero-‐ order
Partial
Constant 0.85 0.05 17.39 0.00 Percent black/ Hispanic
-‐0.02 0.00 -‐0.53 -‐19.74 0.00 -‐0.63 -‐0.52
Economic wellbeing index
0.19 0.04 0.16 5.41 0.00 0.46 0.16
Cultural Asset Index
0.06 0.03 0.05 2.02 0.04 0.27 0.06
Lower income Constant 0.77 0.05 14.07 0.00 Percent black/ Hispanic
-‐0.02 0.00 -‐0.61 -‐22.19 0.00 -‐0.65 -‐0.60
Economic wellbeing index
0.14 0.05 0.08 3.08 0.00 0.31 0.10
Cultural Asset Index
0.07 0.03 0.06 2.47 0.01 0.16 0.08
Regression results, personal security by economic wellbeing, percent black or Hispanic, and Cultural Asset Index, stratified by per capita income. New York City block groups, 2009-‐15. Source: SIAP calculation (see text).
The following graph summarizes the regression results for the 40 percent of block groups with the lowest per capita income of the city. We estimated the scores for health, school effectiveness, and personal security for five strata of cultural assets, holding constant economic wellbeing and percent black or Hispanic.
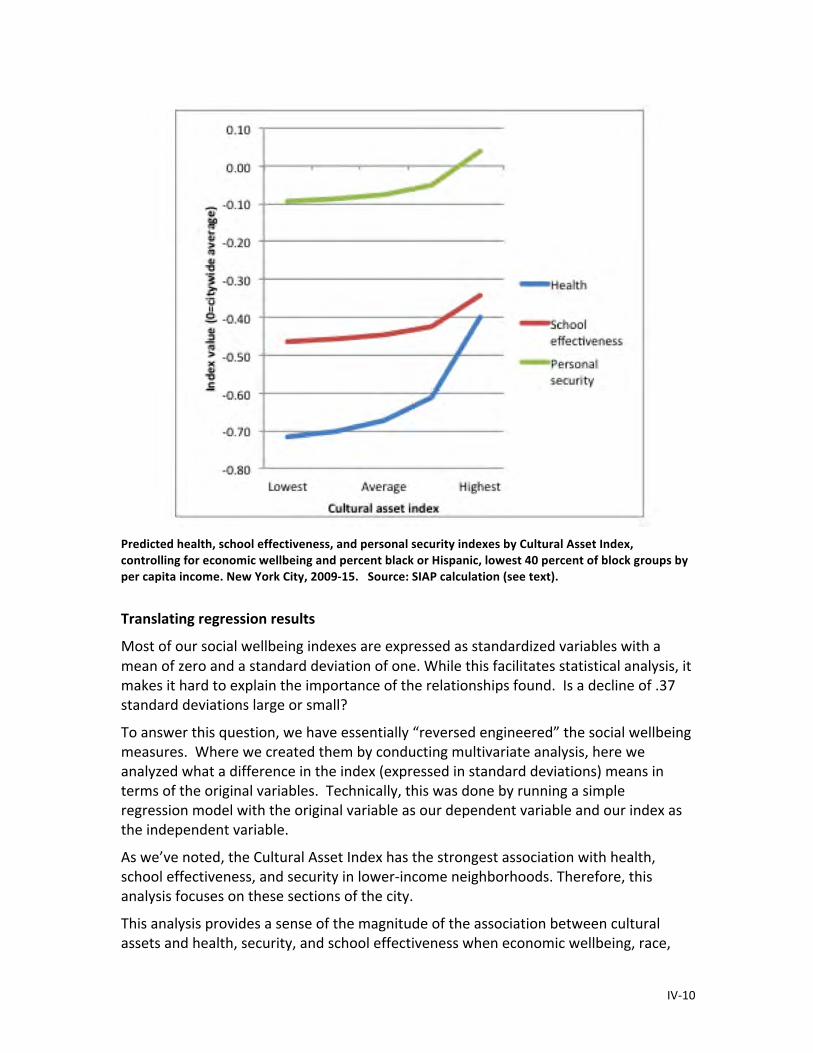
IV-‐10
Predicted health, school effectiveness, and personal security indexes by Cultural Asset Index, controlling for economic wellbeing and percent black or Hispanic, lowest 40 percent of block groups by per capita income. New York City, 2009-‐15. Source: SIAP calculation (see text).
Translating regression results
Most of our social wellbeing indexes are expressed as standardized variables with a mean of zero and a standard deviation of one. While this facilitates statistical analysis, it makes it hard to explain the importance of the relationships found. Is a decline of .37 standard deviations large or small?
To answer this question, we have essentially “reversed engineered” the social wellbeing measures. Where we created them by conducting multivariate analysis, here we analyzed what a difference in the index (expressed in standard deviations) means in terms of the original variables. Technically, this was done by running a simple regression model with the original variable as our dependent variable and our index as the independent variable.
As we’ve noted, the Cultural Asset Index has the strongest association with health, school effectiveness, and security in lower-‐income neighborhoods. Therefore, this analysis focuses on these sections of the city.
This analysis provides a sense of the magnitude of the association between cultural assets and health, security, and school effectiveness when economic wellbeing, race,

IV-‐11
and ethnicity are controlled. It suggests when we compare lower-‐income neighborhoods with the highest Cultural Asset Index to those with the lowest Cultural Asset Index, the higher CAI neighborhoods exhibit health benefits that range from declines of 3 to 5 percent in the proportion of the population reporting they suffer from diabetes, hypertension, or obesity; to declines of 25 percent for teen pregnancies; and declines of 14 percent for indicated investigation of child abuse and neglect. The security factor translates into an 18 percent decline in the felony crime rate. The school effectiveness factor suggests declines of around 5 percent in low performance on standardized tests and a 17 to 18 percent increase in the proportion of students scoring in level 4 (highest level) for both Math and English Language Arts.
Cultural Asset Index (quintiles)
Lowest 20th
percent 20-‐39th percent
40-‐59th percent
60-‐79th percent
Highest 20th
percent
Difference between lowest and highest
quintiles (percent)
HEALTH
Diabetes 12.65 12.61 12.50 12.50 12.19 -‐3.7%
Hypertension 31.78 31.70 31.47 31.46 30.79 -‐3.1%
Obesity 28.05 27.94 27.64 27.63 26.77 -‐4.5%
Fair/poor health 26.24 26.21 26.13 26.13 25.90 -‐1.3%
Teen birth rate 236.62 231.84 217.71 217.22 176.77 -‐25.3%
Low birth weight 7.80 7.76 7.62 7.61 7.22 -‐7.5%
Child abuse/neglect
456.66 451.66 436.89 436.38 394.12 -‐13.7%
SECURITY
Felony rate 11.94 12.42 11.93 11.70 9.85 -‐17.5%
SCHOOL EFFECTIVENESS
ELA level 1 42.08 40.41 39.17 39.60 40.20 -‐4.5%
ELA level 4 3.88 4.49 4.94 4.79 4.57 17.6%
Math level 1 40.85 38.80 37.27 37.80 38.54 -‐5.7%
Math level 4 8.03 9.28 10.20 9.88 9.44 17.4%
Estimated means of individual health, personal security, and school effectiveness variables by Cultural Asset Index (quintiles)—controlling for economic wellbeing and percent black or Hispanic. New York City block groups in the bottom 40 percent of per capita income, 2009-‐15. Source: SIAP calculation (see text).
IV-‐12
Conclusion
This chapter sought to take the measures of cultural resources and social wellbeing developed in earlier chapters to answer our core question: Is the presence of cultural resources in a neighborhood associated with improved social wellbeing? Our answer is inevitably in the form of “yes . . . but . . .”
We have incorporated a variety of data from various sources both in our estimates of cultural assets and in our social wellbeing indexes. Some measures are more reliable than others, either because of difficulties measuring a phenomenon or because of the sample size used to estimate it. We present these findings as suggestive, rather than definitive.
While acknowledging the preliminary nature of our data, the results are still notable. As a general rule, weak measures will have the tendency to attenuate relationships. In other words, the weaker your data, the less likely you are to find strong relationships. Yet, in our case, we’ve consistently found statistically significant relationships between New York City’s Cultural Asset Index and several social wellbeing indexes, particularly in low-‐income neighborhoods of the city.
How can we make sense of these findings? A careful reader will notice that although we’ve found that cultural assets predict a neighborhoods’ wellbeing, we’ve avoided using the word “cause” anywhere in this report. Culture is no magic bullet. We are not asserting that expanding cultural funding or building more cultural facilities is likely to lower crime or improve test scores. Most importantly, race, ethnicity, and economic status consistently are the most powerful influences on social wellbeing. Expanding culture but leaving barriers of social class and race in place will not bring about a miraculous transformation of society.
But what then IS the nature of the relationships that we have described? Our conclusion is a simple one: cultural assets are part of a neighborhood ecology that promotes wellbeing. At its base, our hypothesis is that social connection is the key to the improvements in social wellbeing that we’ve documented. A neighborhood’s cultural ecology is one means through which social connection is fostered, and our findings are the results of culture’s contribution to social connection.
The straightforward link—cultureàsocial connectionàsocial wellbeing—leaves several questions unanswered, if not unanswerable. First, is this a unique function of culture or might other types of community engagement foster the same types of social connection? Our hunch is that the answer to this question is yes and no. Certainly, other forms of engagement, like involvement in community or recreational groups, may promote broader social connection. At the same time, we know that the arts and culture create social networks among different sorts of people. For example, our findings in this chapter suggest that household diversity may be a stimulus to broader cultural engagement. Given that nonfamily households—single people, unmarried couples—are typically not connected to institutions like public schools and churches, the arts may be a more effective means of enhancing their social connection. In previous
IV-‐13
studies in other cities, SIAP has consistently found an association between clustering of cultural resources and other forms of social diversity in neighborhood communities.
A broader question relates to policy. To what extent can the relationships discussed in this chapter guide investments in the arts and culture? Would greater investments lead to even more dramatic results in terms of social wellbeing? It is these questions to which we will turn in the final chapter of the report.

Chapter 5—Community Perspectives on Culture and Social Wellbeing in New York City
The previous three chapters present the analysis of the relationship of culture and the arts to social wellbeing in New York City and discussion of the citywide findings by neighborhood across the five boroughs. They present the two multi-‐dimensional tools constructed for this project—the Cultural Asset Index and the Social Wellbeing Index—and examine the influence of neighborhood on cultural assets and the influence of cultural assets on social wellbeing at the neighborhood level.
To understand the culture-‐wellbeing connection on the ground, the project team complemented our quantitative, citywide analyses with qualitative study in several neighborhoods. The core of the qualitative study was interviews with cultural providers and other relevant individuals in these communities during the summer and fall of 2016.
The goal of the neighborhood studies was to explore how cultural clusters contribute to the wellbeing of residents, whether or not they’re involved in the arts. Our qualitative work—undertaken in East Harlem/Harlem (Manhattan), Fort Greene/Clinton Hill (Brooklyn), Corona and Flushing (Queens)—involved in-‐person interviews with cultural and community practitioners and artists; field validation of resources on the database; a scan of media and gray literature; and participant observation at programs and sites.
The purpose of the interviews was to understand the role of social networks in linking cultural practice to broader social wellbeing. We asked cultural workers about their experience working with cultural and community-‐based organizations in the neighborhood, about cross-‐neighborhood and citywide connections, and how cultural engagement could influence community wellbeing. We also asked about neighborhood change and its effects on their organization, the local cultural ecology, and the overall character of the community.
The sampling methodology was based on a network model. The “seed” interviewees were DCLA Community Development Fund grantees based in two neighborhoods—Fort Greene and East Harlem. Before closing, we asked each interviewee to refer two or three other cultural or community leaders or activists in the neighborhood who might be willing to participate in the study. During the summer and fall 2016, we conducted interviews with 48 individuals at 33 organizations (see Appendix).
Our conversations with community-‐based practitioners validated and amplified the hypothesis at the center of this research—that culture and the arts can and do make a contribution to social and community wellbeing. Several interviewees asked how we define culture. In fact, while we document indicators of engagement, we defer to practitioners to define the meaning of culture. A theater producer offered an expansive but not uncommon definition of culture: “Food, design, language—the broadest expression of human experience.”

V-‐2
Overall, the connection between culture and wellbeing resonated with practitioners representing a range of disciplines and traditions. On creative expression, one interviewee noted: “The personal need for creativity and self-‐expression is fulfilled through connections to others. That is to say, a person’s wellbeing depends on their ability to gain an identity and to gain a community.” On contemporary visual arts, another observed: “The arts and culture are one thing that makes us human. Their absence makes us distance from ourselves. … The arts facilitate social connection and communication as well as intuition and creativity. They are tools to unlock our human potential.” A third interviewee opined: “I’m a big believer that art and social wellbeing go hand in hand. An environment with art—a place that is visually stimulating—will have a positive influence on how people feel about [their conditions].”
Although our focus was on neighborhood wellbeing, the interviewees’ responses were often more expansive. One interviewee, referring to traditional performing arts, explained: “We don’t do those types of assessments—how has your life improved? … But in terms of wellbeing—community wellbeing, individual wellbeing, social wellbeing, political wellbeing, spiritual wellbeing—all the wellbeings under the sun—that’s the starting point … the purpose of practicing [our traditional arts] …”
Our fieldwork gave the research team a fresh perspective on how culture makes a difference in neighborhood communities by stimulating social interaction, amplifying community voice, animating the public environment, and shaping public culture. Thus the dimensions of wellbeing highlighted by the qualitative study—social connection, political voice, and environment—fill out those we were able to develop less fully through quantitative analysis using our social wellbeing index.

V-‐3
Social Connection
We're about connections: artist to audience, artist to community, community to community, audience to audience, artist to artist and organization to organization. … We're always looking to do that in ways that are meaningful and positive and move things forward for the people involved in the connecting. Ultimately, everybody wins. –Maurine D. Knighton, 651 Arts (1999).1 A museum is a school: The artist learns to communicate. The public learns to make connections. –Luis Camnitzer, El Museo del Barrio installation (2009).2
Culture is supported by network building and, in turn, helps to build social networks. In previous work, we conceptualized three dimensions of social connection: institutional connections, face-‐to-‐face connections, and cultural resource networks. Although we were able to capture two of these for New York, our quantitative data did not capture face-‐to-‐face. However, through our interviews, we came to an appreciation for how cultural practitioners in the city are involved in all three of these dimensions.
In this section, we describe what our interviewees told us about how neighborhood cultural ecology contributes to social connection. Several themes emerged from these conversations: cultural production, institutional connections, community building and rebuilding, and inclusion and civic engagement.
Cultural production
Cultural production is enabled by the networks developed by artists, cultural practitioners, and organizations. In the city, certain neighborhoods evolve and become known as places where aspiring and practicing artists can live and work and meet each other. Social interaction with other artists can be critical to the foundation and evolution of one’s work. An interviewee in East Harlem, for example, had been a classically trained working musician in Puerto Rico before he came to New York. Navigating New York’s Puerto Rican communities in the South Bronx and East Harlem in the early 1980s, he found himself in a milieu of musical artists and reconnected with “the old masters” he had met in Puerto Rico. It was these networks and the ecology generated by them that led to the start-‐up and success of his organization, its community following along with international tours, and the rise of similar groups
1 Jennifer Dunning, “On a Brooklyn Mission to be a Good Neighbor, The New York Times, Feb. 14, 1999. http://www.nytimes.com/1999/02/14/arts/dance-‐on-‐a-‐brooklyn-‐mission-‐to-‐be-‐a-‐good-‐neighbor.html
2 Luis Camnitzer, A Museum is a School, site-‐specific installation at El Museo del Barrio, 2009-‐present. Alexander Gray Associates. http://www.alexandergray.com/artists/luis-‐camnitzer/luis-‐camnitzer_1/
V-‐4
across the U.S.3
Although artists’ quarters often fit into the literature on production clusters, musicians bring a different perspective, captured by the notion of performance practice. Innovation in this system is not simply one cultural producer picking up an idea from another. For traditional arts practitioners—like Los Pleneros de la 21—innovation grows out of immersion in tradition, the professionals’ quest for the ‘authentic’ style of performance and approach to the music. In this way the ensemble found its unique sound, which allows their group to continue to innovate and at the same time connect with past as well as contemporary generations. Performance practice thus is a product of long-‐term interaction among the artists and of the artists with their audiences and communities.
People recount a similar story about Fort Greene and Clinton Hill, which spawned a network of black and Hispanic artists and intellectuals between the 1980s and early 2000s—what Spike Lee called “Brooklyn’s equivalent to the Harlem Renaissance.” The neighborhood was a haven for artist-‐residents—including musicians, writers, filmmakers, spoken word and poets, and performing artists—as portrayed in the 2011 documentary Brooklyn Boheme. The film shows Spike Lee’s early films as a product of collaboration among his friends and relatives who served as editors and investors as well as actors, musicians, and tech crew. Lee produced these films in the neighborhood, first at his residence and then at a firehouse where he set up his production company, 40 Acres and a Mule. Some twenty years later, Nelson George tapped the Fort Greene network to produce Brooklyn Boheme. He wanted “to capture the excitement and spirit of the brilliant artistic community I was so proud to be part of.”4
Several interviewees talked about other kinds of New York “cultural centers of innovation”—such as the Village, the East Village, SoHo, Long Island City, and Bushwick—which have risen and fallen over the years as a result of “demolition, money, and real estate.” Around 2000 a significant shift occurred with the relocation of “downtown arts” theater companies (off-‐Broadway, off-‐Lincoln Center, below 14th Street) from lower Manhattan to Brooklyn and, in particular, Fort Greene with the magnet of a BAM cultural district.
A theatre company in Fort Greene, founded as a “downtown theater company,” offers a distinctive perspective on social network building for cultural production. The purpose of each production is to create a performance experience that gets people to see things
3 Folkways Artist Spotlight, “Los Pleneros de la 21,” Smithsonian Folkways (Washington DC: Smithsonian Institute, 2016) http://www.folkways.si.edu/los-‐pleneros-‐de-‐la-‐21-‐afro-‐puerto-‐rican-‐traditions/latin/music/article/smithsonian 4 Celena Cipriaso, “When Brooklyn Was in Vogue,” The Root, posted October 20, 2011. http://www.theroot.com/articles/culture/2011/10/brooklyn_boheme_film_celebrates_brooklyns_artistic_renaissance/3/. Thanks to Deborah Schwartz of the Brooklyn Historical Society for steering us to the film.

V-‐5
differently. The company values difference socially as well as artistically—“the way we work, our programs, our casting, our tech crew.” They use art to represent not reality—but rather the gap between things, the spaces between—as a way to energize people and challenge sensibilities. “Difference is the generative principle of everything we do.”
Some organizations facilitate cultural production by nurturing artists, artistic communities, and artist-‐community exchange. A few have as their primary mission to develop and commission new work. One Fort Greene-‐based group mentors its Brooklyn writers by pointing them to Walt Whitman—Brooklyn boy turned America’s poet—for inspiration. “Do what Walt Whitman did—touch, feel, see—let the environment inform you. Make something you know in your backyard.” The group then “workshops” new work, where artists engage with community members in the development of a theatrical production. Its Fort Greene workshops attract a good mix of people—“artists and residents, old and new”—who are astute in their questions and critique.
A cultural movement, however defined, is a social phenomenon that is both product of and producer of social networks. In both East Harlem and Fort Greene, interviewees talked about place-‐based programs that are embedded in broader urban arts movements. Hip-‐hop theater, for example—according to theater scholar Daniel Banks— is a multi-‐ethnic, cross-‐disciplinary, cross-‐cultural art form based on principles of inclusion and social justice. It has evolved as a youth culture committed to self-‐expression and a way for marginalized people to take the stage.5 As one interviewee explained: “[Hip-‐hop theater] gives voice in a particular aesthetic. It gives people an aesthetic that’s on the same plane as high arts.” After years as a nomadic company, his group got a renovated storefront as a foothold and they now have a home in East Harlem where they hope not only to present but also “be part of creating that culture.”
AfroPunk, a cultural movement of the 2000s driven by an online community,6 has its roots and grounding in space and place—Fort Greene. The first Afro-‐Punk Festival, a spin-‐off of a documentary about “Black Punks in America,” was held in 2005 at two venues, BAM and Fort Greene Park. It was a “community-‐centric” festival that tapped the excitement generated by a film that gave voice to multi-‐cultural kids who feel like outsiders to urban culture. The annual Afro-‐Punk Festival has moved to Fort Greene’s Commodore Barry Park and closes down Myrtle Avenue for a weekend in August. Despite its national reputation, AfroPunk relies on local nonprofit partners—BAM and Myrtle Avenue Brooklyn Partnership—to actually produce the event.
5 Daniel Banks, “Introduction: Hip Hop Theater’s Ethic of Inclusion,” in Daniel Banks, ed., Say Word! Voices from Hip Hop Theater: An Anthology (Ann Arbor: University of Michigan Press, 2011) 6 AfroPunk, The Movement: http://www.afropunk.com/page/the-‐movement

V-‐6
Institutional connections
Many cultural organizations—particularly those with no home or a small staff—develop organizational partnerships of necessity to do their work. Some of these partnerships are best described as contractual relationships in which one organization provides a service for a fee. But often they involve more complicated reciprocal relationships. Itinerant presenters always need a space to perform. Each partnership is different—a production need, a shared interest, a new audience, or marketing—depending on the project. Program partnerships afford the opportunity to build on the strengths and capacity of individual organizations to offer the community something they could not do alone. Irondale Ensemble Project partners with Mark Morris Dance Group and BRIC to run a summer camp in Fort Greene where kids ages 10-‐14 are taught by theater, dance, visual arts, and film/media artists. The partnership grew out of the personal relationships kindled by membership in the Downtown Brooklyn Arts Alliance.
Large institutions have resources and talent that can make a big difference to small community-‐based organizations—especially if both are based in the same neighborhood. Myrtle Avenue Brooklyn Partnership (MABP), a business improvement district in Fort Greene, cultivates local relationships—ranging from large nonprofits like BAM and Pratt Institute to smaller shop-‐owners and community groups—to explore creative opportunities to animate the shopping street and bridge communities. MABP has a strong relationship with Pratt, with Pratt’s president having served as MABP’s board chair. They’ve had success doing a joint exhibition series in Myrtle Ave businesses and with a professor who ran a writing workshop series for older adults. MABP with Pratt Design Incubator launched a tree guard and bench project that features designs of local artists, designers, and K-‐12 students for street furniture along Myrtle Avenue. However, collaborating with large institutions can place a strain on staff resources. On occasion the lack of designated community liaison staff at Pratt means MABP can’t pursue every opportunity.
Some cultural organizations—having a belief that self-‐expression and belonging are essential to human flourishing—want to reach the hard-‐to-‐reach and pursue institutional relationships to do so. The NY Writers Coalition (NYWC) believes that everyone has a voice and a story and that a writer is anyone who writes. NYWC has developed a multi-‐tier network citywide of program partners to offer free writing workshops weekly in nonprofit and community spaces. Its outreach partners are social service organizations that host workshops for youth programs (after-‐school, homeless, juvenile); health and wellness programs (rehab, disabled, older adults); criminal justice programs (ever-‐incarcerated); programs for women and girls (exploited or abused); homeless (ever-‐homeless) writers; and LGBTQ writers. Public program partners—that provide space for drop-‐in workshops open to the general public, regardless of background or experience—Include branch libraries, cultural centers, and community centers around the city.
Many organizations want to reach the young as a way to transmit heritage and culture that’s missing from mainstream curricula. Among connections with non-‐arts institutions,
V-‐7
school partnerships are probably the most common. Many groups fondly point to the 1980s, 1990s, and early 2000s, when funding for the arts in the schools was more prevalent. For one ensemble, a lot of their work was going to schools all over the city (with kids from all over the world) to do performances presenting traditional Afro-‐Puerto Rican rhythms. An interviewee reminisced: “We brought our music, we brought our ways. The kids loved it. … A whole generation was touched by that experience, but this generation may not have that experience any longer.”
For the Irondale Ensemble, “creative learning” is an approach to theater as well as education. As their mission states: “Our theatre can become a classroom and classrooms we enter can become theatres.” The ensemble has done in-‐school programs with high school students (9th – 12th graders) for over 30 years, providing stability for the kids and a revenue source for the company. Their production process engages both the company—all actors are teaching artists—and the students in an exploration that involves research, project development, and improvisation. In the adaptation of a Shakespeare play, for example, “the essential question was—what’s wrong with the U.S. government?” In recent years, the company has built on its creative learning model to do partnerships with other cultural and community-‐based organizations.
Musica de Camara is a chamber ensemble founded in 1979 to introduce a classical concert series for Puerto Rican New Yorkers at El Museo del Barrio—seeking to bridge stereotyped divides of class and culture. During the ensuing decades, the group has presented Puerto Rican and Hispanic classical musicians at concert venues and community centers citywide and brought their musicians to public schools in five boroughs. Their lecture demonstration series is designed to teach about classical music with a technique called aural analysis—teach by ear. The weeklong workshop begins with bringing kids into the music by singing in harmony and then working with a string quartet to hear the instruments. The week closes with a fully staged professional concert. Two years ago, Musica de Camara returned to El Museo del Barrio to renew its concert series and explore the possibility of taking up permanent residence there.
Divides of social class are real with respect to the wellbeing of students and families. One interviewee observed that students participating in their in-‐school programs need social workers along with artists. The organization has developed “a deep relationship” with teachers (usually English or Art) in six Brooklyn high schools to run two programs: a literary series led by performing artists and a fellowship program where students interview artists. “Connecting artists to young people definitely has social wellbeing outcomes. Kids never get out of Brooklyn, and they never see live performance. But for kids to be part of the program—many are pregnant or homeless—there must be part that is social services.”
A small but established Brooklyn-‐based group has a long view on partnership. “Before we were a larger organization. We saw partnership as a commitment, especially to smaller black organizations with which we could be an adviser and mentor.” During the 1990s, the group helped found a community arts center in Flatbush and ran a neighborhood arts network that linked its artists-‐in-‐residence with organizations in eight
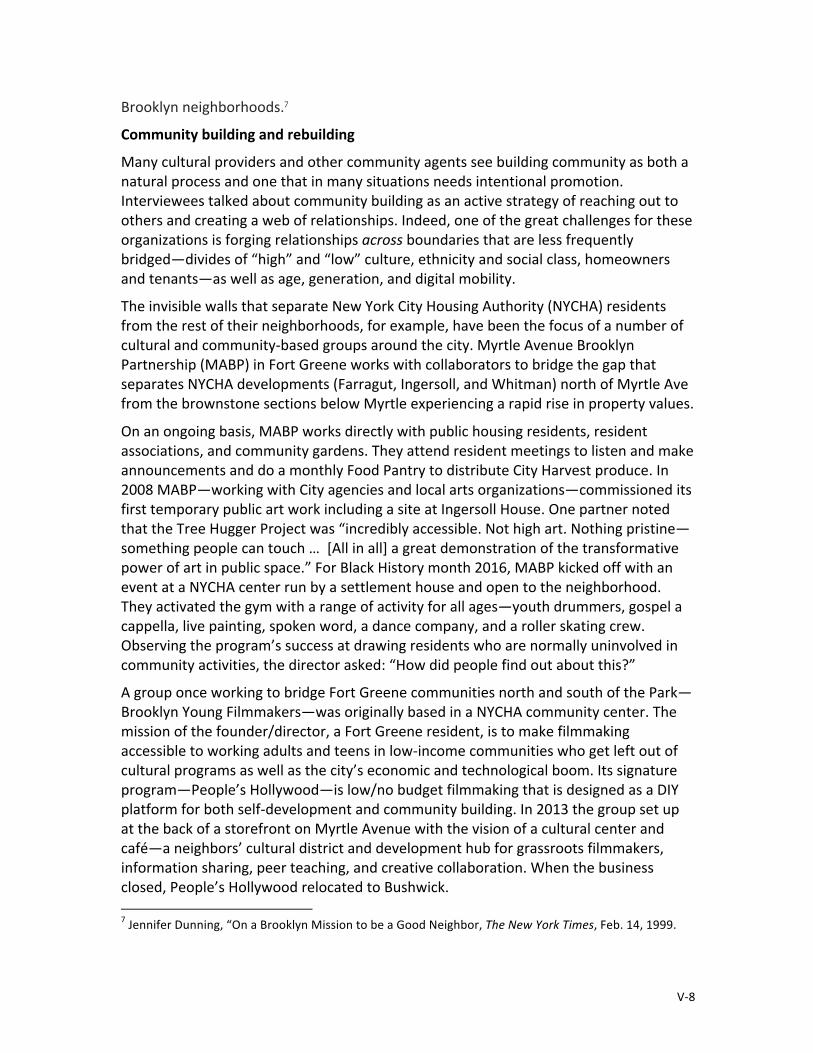
V-‐8
Brooklyn neighborhoods.7
Community building and rebuilding
Many cultural providers and other community agents see building community as both a natural process and one that in many situations needs intentional promotion. Interviewees talked about community building as an active strategy of reaching out to others and creating a web of relationships. Indeed, one of the great challenges for these organizations is forging relationships across boundaries that are less frequently bridged—divides of “high” and “low” culture, ethnicity and social class, homeowners and tenants—as well as age, generation, and digital mobility.
The invisible walls that separate New York City Housing Authority (NYCHA) residents from the rest of their neighborhoods, for example, have been the focus of a number of cultural and community-‐based groups around the city. Myrtle Avenue Brooklyn Partnership (MABP) in Fort Greene works with collaborators to bridge the gap that separates NYCHA developments (Farragut, Ingersoll, and Whitman) north of Myrtle Ave from the brownstone sections below Myrtle experiencing a rapid rise in property values.
On an ongoing basis, MABP works directly with public housing residents, resident associations, and community gardens. They attend resident meetings to listen and make announcements and do a monthly Food Pantry to distribute City Harvest produce. In 2008 MABP—working with City agencies and local arts organizations—commissioned its first temporary public art work including a site at Ingersoll House. One partner noted that the Tree Hugger Project was “incredibly accessible. Not high art. Nothing pristine—something people can touch … [All in all] a great demonstration of the transformative power of art in public space.” For Black History month 2016, MABP kicked off with an event at a NYCHA center run by a settlement house and open to the neighborhood. They activated the gym with a range of activity for all ages—youth drummers, gospel a cappella, live painting, spoken word, a dance company, and a roller skating crew. Observing the program’s success at drawing residents who are normally uninvolved in community activities, the director asked: “How did people find out about this?”
A group once working to bridge Fort Greene communities north and south of the Park—Brooklyn Young Filmmakers—was originally based in a NYCHA community center. The mission of the founder/director, a Fort Greene resident, is to make filmmaking accessible to working adults and teens in low-‐income communities who get left out of cultural programs as well as the city’s economic and technological boom. Its signature program—People’s Hollywood—is low/no budget filmmaking that is designed as a DIY platform for both self-‐development and community building. In 2013 the group set up at the back of a storefront on Myrtle Avenue with the vision of a cultural center and café—a neighbors’ cultural district and development hub for grassroots filmmakers, information sharing, peer teaching, and creative collaboration. When the business closed, People’s Hollywood relocated to Bushwick. 7 Jennifer Dunning, “On a Brooklyn Mission to be a Good Neighbor, The New York Times, Feb. 14, 1999.

V-‐9
The isolation of NYCHA residents from the cultural and community life of surrounding neighborhoods and the potential for “transformative arts and cultural work in public housing” was the subject of a July 2015 NOCD-‐NY roundtable and July 2016 report.8 The report calls for “having arts from the inside out in NYCHA, not just from the outside in”—including recognition of resident artists, inclusion of resident voices in cultural program development and neighborhood planning, and a holistic approach that integrates the arts with other aspects of people’s lives. Looking forward, a promising partnership could be Groundswell orchestrating collaborative public art projects with NYCHA residents, drawing on the organization’s extensive experience with government agencies and low-‐income communities and the current Public Art/Public Housing pilot project.
Cultural district planning in Fort Greene, which has redrawn the neighborhood into Downtown Brooklyn and Fort Greene/Clinton Hill, has complicated community building. Cultural organizations are trying to anticipate the diverse demands of a new well-‐off renter population as well as an imbalance of tenants vs. owners. Moreover, as an interviewee noted, “African Americans and Caribbean Americans have already been pushed out of the neighborhood except for those living in public housing.” There is a need for programming to break down barriers between “public housing residents and neighborhood gentrifiers.” Interviewees noted that big institutions (in Manhattan and Brooklyn) tend to focus on “easy barriers like ticket prices”—including free tickets to NYCHA for residents—“but the issue is to make spaces welcoming to all.”
BRIC (Brooklyn Information & Culture)—founded in 1979 as the Fund for the Borough of Brooklyn and presenter of a summer performing arts festival at the Prospect Park Bandshell—is an established public institution. With a mission to serve the people and neighborhoods of Brooklyn and a new facility in the cultural district, BRIC is committed to making BRIC House welcoming to all. Its multidisciplinary arts and media programs are now together under one roof in a building designed with social and studio spaces that function like a 21st century cultural center, public library, and Internet café. Its lobby/stoop and sunken gallery host noontime yoga, live performance, and monthly poetry slams; BRIC-‐TV draws local reporters and studio audiences; and the media center allows Brooklynites to borrow camera and audio equipment for free. BRIC has institutionalized community engagement with dedicated staff and an engagement plan developed in partnership with program directors and community members. The focus is on the near neighborhoods east to Bedford-‐Stuyvesant, in particular, the black and Latino communities that have been affected by downtown redevelopment. Staff take a proactive approach to outreach by connecting directly with branch libraries and neighborhood organizations, including churches and community gardens, based on experience as media education partner for the Brooklyn Public Library. BRIC’s
8 NOCD is an acronym for Naturally Occurring Cultural Districts. Nayantara Sen, Creative Transformation: Arts, Culture, and Public Housing Communities (New York: NOCD-‐NY, July 2016). https://nocdnydotorg.files.wordpress.com/2016/07/nocdny-‐creativetransformation-‐arts-‐culture-‐and-‐public-‐housing-‐communities-‐8-‐24-‐161.pdf
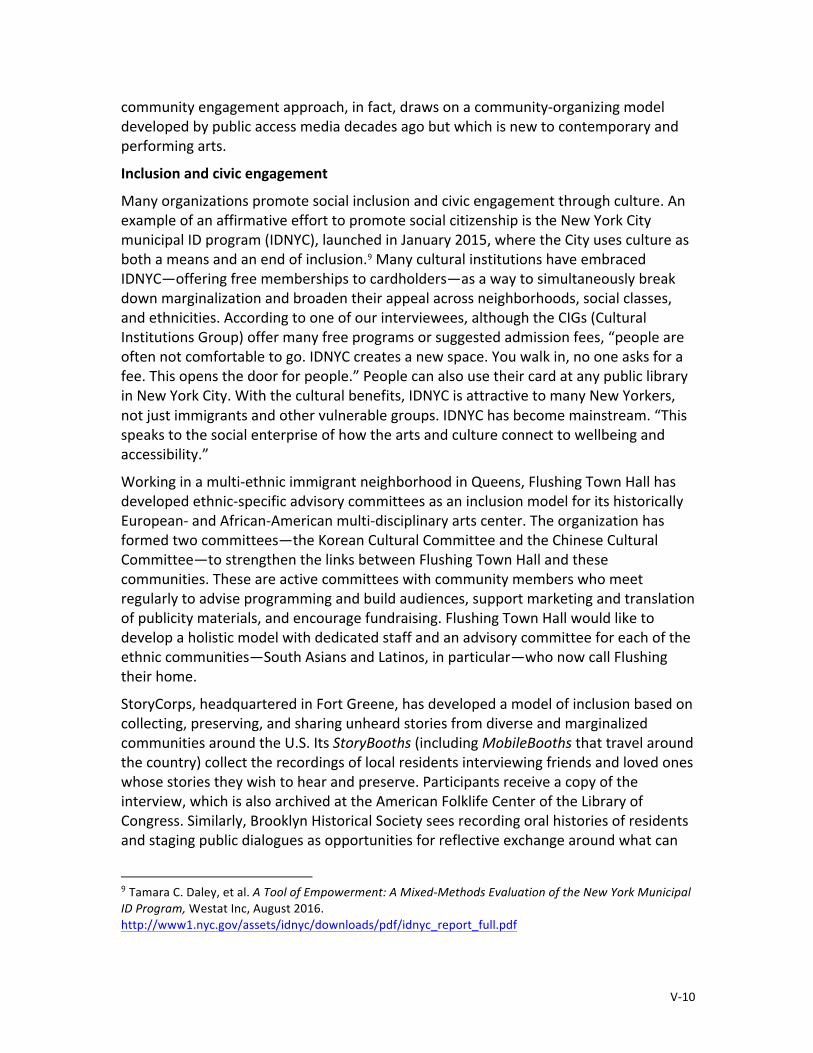
V-‐10
community engagement approach, in fact, draws on a community-‐organizing model developed by public access media decades ago but which is new to contemporary and performing arts.
Inclusion and civic engagement
Many organizations promote social inclusion and civic engagement through culture. An example of an affirmative effort to promote social citizenship is the New York City municipal ID program (IDNYC), launched in January 2015, where the City uses culture as both a means and an end of inclusion.9 Many cultural institutions have embraced IDNYC—offering free memberships to cardholders—as a way to simultaneously break down marginalization and broaden their appeal across neighborhoods, social classes, and ethnicities. According to one of our interviewees, although the CIGs (Cultural Institutions Group) offer many free programs or suggested admission fees, “people are often not comfortable to go. IDNYC creates a new space. You walk in, no one asks for a fee. This opens the door for people.” People can also use their card at any public library in New York City. With the cultural benefits, IDNYC is attractive to many New Yorkers, not just immigrants and other vulnerable groups. IDNYC has become mainstream. “This speaks to the social enterprise of how the arts and culture connect to wellbeing and accessibility.”
Working in a multi-‐ethnic immigrant neighborhood in Queens, Flushing Town Hall has developed ethnic-‐specific advisory committees as an inclusion model for its historically European-‐ and African-‐American multi-‐disciplinary arts center. The organization has formed two committees—the Korean Cultural Committee and the Chinese Cultural Committee—to strengthen the links between Flushing Town Hall and these communities. These are active committees with community members who meet regularly to advise programming and build audiences, support marketing and translation of publicity materials, and encourage fundraising. Flushing Town Hall would like to develop a holistic model with dedicated staff and an advisory committee for each of the ethnic communities—South Asians and Latinos, in particular—who now call Flushing their home.
StoryCorps, headquartered in Fort Greene, has developed a model of inclusion based on collecting, preserving, and sharing unheard stories from diverse and marginalized communities around the U.S. Its StoryBooths (including MobileBooths that travel around the country) collect the recordings of local residents interviewing friends and loved ones whose stories they wish to hear and preserve. Participants receive a copy of the interview, which is also archived at the American Folklife Center of the Library of Congress. Similarly, Brooklyn Historical Society sees recording oral histories of residents and staging public dialogues as opportunities for reflective exchange around what can
9 Tamara C. Daley, et al. A Tool of Empowerment: A Mixed-‐Methods Evaluation of the New York Municipal ID Program, Westat Inc, August 2016. http://www1.nyc.gov/assets/idnyc/downloads/pdf/idnyc_report_full.pdf
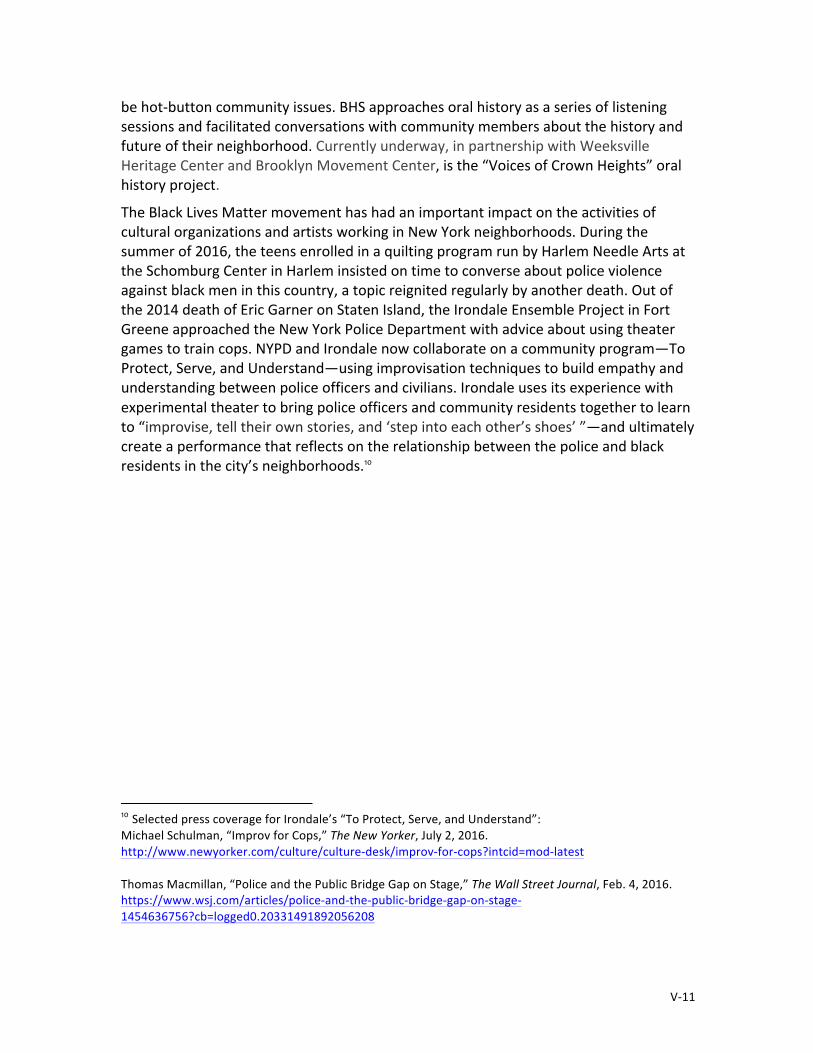
V-‐11
be hot-‐button community issues. BHS approaches oral history as a series of listening sessions and facilitated conversations with community members about the history and future of their neighborhood. Currently underway, in partnership with Weeksville Heritage Center and Brooklyn Movement Center, is the “Voices of Crown Heights” oral history project.
The Black Lives Matter movement has had an important impact on the activities of cultural organizations and artists working in New York neighborhoods. During the summer of 2016, the teens enrolled in a quilting program run by Harlem Needle Arts at the Schomburg Center in Harlem insisted on time to converse about police violence against black men in this country, a topic reignited regularly by another death. Out of the 2014 death of Eric Garner on Staten Island, the Irondale Ensemble Project in Fort Greene approached the New York Police Department with advice about using theater games to train cops. NYPD and Irondale now collaborate on a community program—To Protect, Serve, and Understand—using improvisation techniques to build empathy and understanding between police officers and civilians. Irondale uses its experience with experimental theater to bring police officers and community residents together to learn to “improvise, tell their own stories, and ‘step into each other’s shoes’ ”—and ultimately create a performance that reflects on the relationship between the police and black residents in the city’s neighborhoods.10
10 Selected press coverage for Irondale’s “To Protect, Serve, and Understand”: Michael Schulman, “Improv for Cops,” The New Yorker, July 2, 2016. http://www.newyorker.com/culture/culture-‐desk/improv-‐for-‐cops?intcid=mod-‐latest Thomas Macmillan, “Police and the Public Bridge Gap on Stage,” The Wall Street Journal, Feb. 4, 2016. https://www.wsj.com/articles/police-‐and-‐the-‐public-‐bridge-‐gap-‐on-‐stage-‐1454636756?cb=logged0.20331491892056208
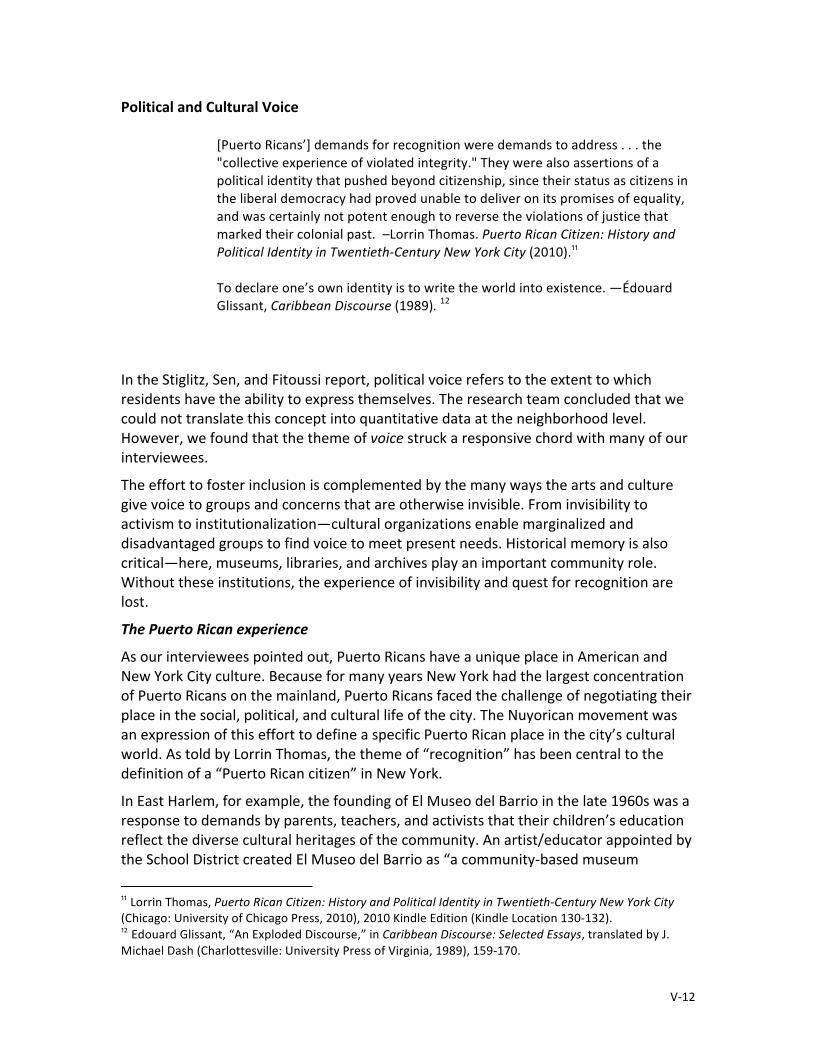
V-‐12
Political and Cultural Voice
[Puerto Ricans’] demands for recognition were demands to address . . . the "collective experience of violated integrity." They were also assertions of a political identity that pushed beyond citizenship, since their status as citizens in the liberal democracy had proved unable to deliver on its promises of equality, and was certainly not potent enough to reverse the violations of justice that marked their colonial past. –Lorrin Thomas. Puerto Rican Citizen: History and Political Identity in Twentieth-‐Century New York City (2010).11 To declare one’s own identity is to write the world into existence. —Édouard Glissant, Caribbean Discourse (1989). 12
In the Stiglitz, Sen, and Fitoussi report, political voice refers to the extent to which residents have the ability to express themselves. The research team concluded that we could not translate this concept into quantitative data at the neighborhood level. However, we found that the theme of voice struck a responsive chord with many of our interviewees.
The effort to foster inclusion is complemented by the many ways the arts and culture give voice to groups and concerns that are otherwise invisible. From invisibility to activism to institutionalization—cultural organizations enable marginalized and disadvantaged groups to find voice to meet present needs. Historical memory is also critical—here, museums, libraries, and archives play an important community role. Without these institutions, the experience of invisibility and quest for recognition are lost.
The Puerto Rican experience
As our interviewees pointed out, Puerto Ricans have a unique place in American and New York City culture. Because for many years New York had the largest concentration of Puerto Ricans on the mainland, Puerto Ricans faced the challenge of negotiating their place in the social, political, and cultural life of the city. The Nuyorican movement was an expression of this effort to define a specific Puerto Rican place in the city’s cultural world. As told by Lorrin Thomas, the theme of “recognition” has been central to the definition of a “Puerto Rican citizen” in New York.
In East Harlem, for example, the founding of El Museo del Barrio in the late 1960s was a response to demands by parents, teachers, and activists that their children’s education reflect the diverse cultural heritages of the community. An artist/educator appointed by the School District created El Museo del Barrio as “a community-‐based museum 11 Lorrin Thomas, Puerto Rican Citizen: History and Political Identity in Twentieth-‐Century New York City (Chicago: University of Chicago Press, 2010), 2010 Kindle Edition (Kindle Location 130-‐132). 12 Edouard Glissant, “An Exploded Discourse,” in Caribbean Discourse: Selected Essays, translated by J. Michael Dash (Charlottesville: University Press of Virginia, 1989), 159-‐170.

V-‐13
dedicated to the Puerto Rican diaspora in the United States.” 13
Many East Harlem organizations see a long-‐standing need to foster recognition of the Puerto Rican presence in the city. Indeed, the rapid increase in the city’s Hispanic population has often complicated this task as Puerto Ricans negotiate an identity that is both American and colonial, New Yorker and Caribbean. Since 1980 East Harlem has shifted from a predominantly Puerto Rican to a more broadly Latino community. In response, El Museo del Barrio expanded its mission to encompass the arts and culture of “all Latin Americans in the United States.” Several interviewees noted this change, not always with unalloyed approval.
Although part of an historical legacy, the search for recognition continues to challenge Puerto Ricans living in New York, elsewhere on the mainland, and on the island. As described by an interviewee: “Older Puerto Ricans, they have the experience of being American citizens but not treated as such. They see the open doors for other immigrant groups … who have achieved more political power with the electorate.” Indeed, the current fiscal crisis of the Puerto Rican state, the resulting influx of a new wave of Puerto Ricans to the mainland, and the much-‐criticized PROMESA14 passed by Congress in June 2016, have revived efforts to assert Puerto Rican identity.
For many Puerto Rican artists and cultural practitioners, their practice represents a form of political expression or voice. Los Pleneros de la 21 ensemble, for example, views its performance of distinctive Puerto Rican cultural forms of dance and music—bomba and plena—as a vehicle of voice for the group. Indeed, bomba and plena historically have been vehicles of affirmation, agency, and empowerment for their practitioners. Bomba is rooted in enslaved communities and connected to spiritual practices for healing and restoration. Plena emerged during the 20th century in the context of public manifestations and protests to fill the need for cultural and political expression. Plena ensembles continue to assemble for this purpose at political and significant community events.
Our interviewees pointed to Hunter College’s Center for Puerto Rican Studies (El Centro de Estudios Puertorriqueños) as the key agent in the institutionalization of Puerto Rican history and cultural recognition. Centro—public gallery, archive, and research center—has relocated to East Harlem and is still new to the neighborhood. In spring 2016 they held a Puerto Rican summit that drew a lively crowd who did not agree on politics but did agree that culture is the key to Puerto Rican identity. According to our interviewees, 13 El Museo del Barrio Timeline, New York, August 2013. Web access: Oct 31, 2016. http://elmuseo.org/wp-‐content/uploads/2013/08/Timeline.pdf 14 Puerto Rico Oversight, Management, and Economic Stability Act (PROMESA). Mary Williams Walsh and Liz Moyer, “How Puerto Rico Debt Is Grappling With a Debt Crisis,” The New York Times, July 1, 2016. https://www.nytimes.com/interactive/2016/business/dealbook/puerto-‐rico-‐debt-‐crisis-‐explained.html?_r=0
V-‐14
Puerto Rican New Yorkers look to Centro as “a home away from home” that values their stories, elevates their experience to academia, and gives a sense of legitimacy. Centro publishes an e-‐magazine Centro Voices, which covers culture and history as well as current affairs, and is building an online community.
Other African Diaspora experience
While some Puerto Ricans have tried to define for themselves a unique identity, many organizations across the city have worked to forge links around the idea of the African diaspora. They seek to form a bond around the common experience of African Americans, Caribbean Islanders, Latin Americans, and African immigrants—peoples of African origin living outside the continent of Africa. The concept, on the one hand, is a response to the migration patterns and changing demographic landscape of New York City over the past several decades. On the other hand, it suggests a distinction (and sometimes a tension) with organizations that focus on individual groups’ unique experience.
Development underway in the Downtown Brooklyn Cultural District, the neighborhood surrounding BAM, will incorporate space for two cultural organizations with a mission grounded in the African diaspora—651 ARTS and the Museum of Contemporary African Diasporan Arts (MoCADA). Both groups invest in emerging contemporary artists of African descent; 651 ARTS focuses on performing arts and MoCADA on visual artists.
For the City, according to several interviewees, this is a decision to anchor the African American cultural heritage of Fort Greene—“as well as a migration perspective and a jazz perspective”—in the Brooklyn cultural district. “The community has always been an epicenter for black cultural production, even in downtrodden days.” This is also a decision to anchor the cultural district in Brooklyn, given the significant role that African Americans have played in the history and culture of the borough. Moreover, black residents of Brooklyn have become increasingly international, in particular, with Islanders and Africans. “The African Diaspora is about international blackness,” an interviewee explained. “The Diaspora encompasses wherever there is an artist of African descent.”
In New York, since the late 1960s, cultural organizations have played an active role in shaping black identity, infusing arts with activism, and setting the stage for discourse about social issues in black communities. The National Black Theatre (NBT) was founded in Harlem in 1968 by an artist and entrepreneur to harness the power of theater to strengthen African American cultural identity and stimulate the economy along the 125th street corridor. Its visionary founder purchased property from the City; commissioned a Haitian-‐American architect to design a building with dramaturgical spaces that foster collaboration, dialogue, and community interaction; and brought traditional artists from Nigeria to create “New Sacred” artwork for the walls and spaces. NBT’s core program has been its playwright residency to develop and showcase African American artists. Last year NBT and Hi-‐ARTS co-‐produced Blood At The Root (inspired by the “Jena Six” case in Louisiana) with audience-‐artist talk back after each production.

V-‐15
Urban Bush Women (UBW), a dance company founded in the mid-‐1980s, explores the use of cultural expression as a catalyst for social change. In so doing, the company fuses contemporary music and dance with spiritual traditions of African Americans and the African diaspora. The philosophy behind its community engagement model is BOLD—Builders, Organizers, & Leaders through Dance—and grounded in the history of the place and people engaged. Based in Fort Greene, UBW has had a long-‐standing relationship with Cumbe: Center for African and Diaspora Dance and enjoyed the convenience of Cumbe’s studio in the Brooklyn cultural district until its lease was terminated. Cumbe was founded in 2012 with a mission to be a home for African and Diaspora dance and music and culture in the city. Cumbe’s Fort Greene studio had enabled the artists to promote community as part of their instruction. Forming a circle of dancers with a drummer, one person at a time goes into the circle and improvises a solo with the support of the circle. It’s about self and culture—an African tradition.
For Harlem Needle Arts (HNA), founded in 2007, its mission is grounded in “experiences of the African Diaspora” and its program in the rich history and culture of Harlem as a predominantly black community. HNA’s goal is to revolutionize, preserve and expand the fiber, textile, design, and needle arts with the intention of stimulating economic development and civic engagement. Like National Black Theater, Harlem Needle Arts asserts a belief in the power of the arts to promote wellbeing—to heal, to nourish, to provide safe space for dialogue, to sustain and elevate artists, to empower people to shape their lives, and to stimulate personal activism and community spirit among Harlem residents, old and new. Unlike National Black Theater, Harlem Needle Arts—self-‐described as a “cultural art institute”—is in fact an itinerant organization that brings its artists and programs to sites and spaces in Harlem and surrounding neighborhoods.
Activism and social movements
While many of our interviewees define voice as primarily an act of cultural recognition, several groups focus on explicit political uses. New York, of course, has a long tradition of cultural activism and social movements that reaches back to the 19th century. A number of cultural institutions have evolved both as an outcome of activism and as collectors and curators of that experience. Preserving historical memory is itself a political act because otherwise no one knows that it happened. It’s about not losing memory of historical actions—past social movements—that are an alternative way of viewing the world. Organizations as diverse as Centro, Taller Boricua, Schomburg Center, Brooklyn Historical Society, and Franklin Furnace define their mission as the cultural preservation of many of these stories.
Centro Library and Archives at Hunter CUNY collects and preserves resources that document the history and culture of Puerto Ricans—including collections of activists, artists, and writers—and provides access for the general public as well as scholars. Taller Boricua (Puerto Rican Workshop), a visual arts organization started in 1969 in East Harlem, is now working with Centro to document, present, and archive the history of its artists and their role in the Puerto Rican Art Movement in New York and its relationship

V-‐16
to the Young Lords Party advocacy of community empowerment.15
The Schomburg Center for Research in Black Culture, a Harlem branch of the New York Public Library, is an archive repository for information on people of African descent worldwide. Schomburg sponsors a summer institute that encourages scholarly study of “African and African Diasporan Transformations in the 20th Century.” For example, an article posted on its website discusses the Black Arts movement as one of the most lasting legacies of the Black Power movement.16
The Brooklyn Historical Society houses the Othmer Library and Archives, a comprehensive collection of materials related to Brooklyn’s history and culture, which feeds its museum education program for students and teachers around the city. Based on a public history project and new research, working with Weeksville Heritage Center and Irondale Ensemble Project, BHS has on long-‐term exhibit (January 2014 – Winter 2018) Brooklyn Abolitionists: In Pursuit of Freedom, the story of Brooklyn activists who fought for freedom and racial justice during the 19th century.
Franklin Furnace Archive, now in residence at Pratt Institute, is on a mission “to make the world safe for avant-‐garde arts” by presenting, preserving, and legitimating political arts movements. The Furnace was founded in 1976 to advocate for art forms—like performance art—that are vulnerable due to their ephemeral nature, cultural bias, or politically unpopular content. For over 30 years, the Franklin Furnace Fund has supported emerging performance artists, selected by peer review, to produce major performance art works in New York.
Recent social justice challenges have mobilized a new generation of groups working at the boundary of activism and culture. Naturally-‐Occurring Cultural Districts (NOCD-‐NY) emerged in 2010 as an alliance of artists, activists, organizations, and policymakers working to generate a citywide platform and commitment “for revitalizing New York City from the neighborhood up.” NOCD-‐NY supports cultural work and cultural organizing in neighborhoods through collaboration, advocacy, and research. A 2015 policy brief, Arts and Culture for a Just and Equitable City articulates their platform: “Because cultural change precedes and embodies political change, arts and culture are an essential part of the city’s progressive agenda.” 17
15 Yasmin Ramirez, “Taller Boricua and the Puerto Rican Art Movement in New York: History of Taller Boricua, 1969-‐2010.” (New York: Taller Boricua and El Museo del Barrio, 2012). https://tallerboricuatimeline.wordpress.com/2012/09/23/1970-‐puerto-‐rican-‐art-‐workers-‐establish-‐taller-‐boricuathe-‐puerto-‐rican-‐workshop-‐as-‐an-‐alternative-‐art-‐space-‐in-‐east-‐harlem-‐artists-‐collaborate-‐on-‐developing-‐an-‐ethnic-‐visual-‐language-‐based-‐on-‐puert/ 16 Komozi Woodward, “Rethinking the Black Power Movement” (New York: Schomburg Center for Research in Black Culture, 2011). Web: http://exhibitions.nypl.org/africanaage/essay-‐black-‐power.html#blackarts 17 Arts & Democracy Project, Groundswell, Naturally Occurring Cultural Districts-‐New York, “Policy Brief: Arts and Culture for a Just and Equitable City” (New York: NOCD-‐NY, 2015). https://nocdnydotorg.files.wordpress.com/2015/03/policy-‐brief-‐3-‐3-‐15.pdf

V-‐17
The Queens Museum started to experiment with arts-‐based community engagement in the early 2000s with the creation of a public programs and community engagement division. In 2006 the Museum shifted to a community-‐organizing model, decided to focus on a single neighborhood to maximize impact, and hired a full-‐time community organizer—a bold move for an art museum. Currently, the focus of the public programs and community engagement staff is Corona, a predominantly new immigrant neighborhood adjacent to the Museum, where they look for opportunities to integrate social development goals (issues related to schools, transportation, immigration) with cultural activity (ranging from dance to murals to protest signs). The Museum has mobilized organizations to do collaborative design for Corona Plaza, a public space adjacent to a subway stop, and helped negotiate a community benefits plan associated with expansion of the US Tennis Association stadium in Corona-‐Flushing Meadows Park. Increasingly, staff works directly with neighborhood groups—like Immigrant Movement International (IMI) and Mujeres en Movimiento (Women in Movement)—to expand their ability to participate in community activism and collaborate around local issues related to transportation, police, and public space. Mujeres, started by immigrant women as a dance/movement class, now does active organizing for immigrant rights and uses the arts to dramatize their agenda—including an exhibit at Queens Museum and walking tours/performance pieces with Elastic City. With Queens Museum, voice is expressed as cultural value, and engaging community means creating a cultural environment that leads to change.

V-‐18
Public Environment, Public Sphere
[Public culture] is produced by the many social encounters that make up daily life in the streets, shops, and parks—the spaces in which we experience public life in cities. The right to be in these spaces, to use them in certain ways, to invest them with a sense of our selves and our communities—to claim them as ours and to be claimed in turn by them—make up a constantly changing public culture. People with economic and political power have the greatest opportunity to shape public culture by controlling the building of the city’s public spaces in stone and concrete. Yet public space is inherently democratic. The question of who can occupy public space, and so define an image of the city, is open-‐ended. —Sharon Zukin, The Cultures of Cities.18
Our social wellbeing environmental amenities index focuses primarily on the physical features of the natural environment, including the presence of green space and heat vulnerability. However, from our interviews, we discovered that cultural and community organizations and artists play an active role in the social aspects of the physical and built environment, including activating the streetscape and commercial corridors and reshaping use of parks and public spaces.
Cultural space and streetscape
The public environment starts with space, and in a city like New York, competition around the use of space leads to conflict. As the economic fortunes of the city as a whole have changed since the 1970s, many districts that had been seen as marginal and left to low-‐income residents have attracted the attention of public officials and private interests. The transformation of Fulton Mall in downtown Brooklyn and 125th Street in Harlem were largely completed by the time we started our research, but the historical memory of loss came up repeatedly in our interviews.
More visible to us were current struggles over space. During the 1980s and ‘90s, the Fort Greene/Clinton Hill neighborhoods emerged as a Brooklyn-‐bred bohemian-‐artist district. During the 1980s, Fort Greene also became the focus of cultural planning when the Brooklyn Academy of Music (BAM) decided to become a presenter of international arts. As an interviewee recalled, BAM’s then-‐president Harvey Lichtenstein “wanted to become a place-‐maker. He didn’t want BAM to be viewed as an outpost in a desert, from where people would ‘come home’ to Manhattan to eat.” Since the late 1990s, realizing this vision has transformed the social geography and cultural ecology of Fort Greene and surrounding neighborhoods.
Around the turn of the century, BAM’s plan was to make Fort Greene a destination for the arts, a place for artists—visual, writing, performing—to live in studios. BAM recruited a range of distinctive artists and cultural organizations to locate in new or converted spaces all around BAM. As one interviewee noted: “He had enormous clout. … Who would like to be a partner?” The terrorist attacks of 9/11 accelerated the shift of 18 Sharon Zukin, The Culture of Cities (Cambridge, MA: Blackwell Publishers, 1995), 11.

V-‐19
“downtown arts” groups from Lower Manhattan to Brooklyn. “Now Brooklyn is the downtown arts scene.” Another interviewee called it out: “ ‘Brooklyn’—it’s the urban myth brand.”
The spiraling of real estate prices has led to a variety of outcomes for cultural organizations, dependent upon a variety of factors. In particular, the historical presence of subsidized spaces, like the Alliance of Resident Theatres’ Oxford Street building in Fort Greene, has allowed many cultural groups to remain in the neighborhood. The success of the Oxford Street building, which leased in three weeks, inspired BAM Local Development Corp to renovate the nearby building at 80 Hanson Place as affordable office space for small nonprofit cultural groups.
A second source of stable cultural spaces was provided by agreements between government and private developers, in which developers provide space for cultural groups in exchange for a variety of development concessions. The new home for Theatre for a New Audience (TFANA) and the planned move of both the Museum of Contemporary African Diasporan Art (MoCADA) and 651 ARTS (along with a public library branch) to locations near BAM are a result of these deals.
Yet, these arrangements have not accommodated all organizations. Many less-‐fortunate organizations and most of their employees (and freelance artists) have moved to Crown Heights, Bedford Stuyvesant, and beyond. “Two elements coexisted before—BAM and grassroots community culture,” according to one of our interviewees. “The neighborhood change over time will impact each of these, differentially. Now one has been pushed out.” A similar turnover has affected the Fulton Avenue commercial corridor as a number of African American-‐owned businesses have closed or moved and been replaced by entertainment and cultural businesses that appeal to the neighborhood’s shifting demographic.
In fact, MoCADA’s Soul of Brooklyn Festival, an annual weeklong series of events in August, “promotes African Diasporan arts and culture while supporting partnerships between local arts organizations and Black businesses.” Soul of Brooklyn was launched as a borough-‐wide arts and business partnership. Its purpose was to address the issue of “black-‐owned business going out of business.”
Of course, there are notable exceptions. The Brooklyn Moon Café, a Caribbean American Soul café and bar, opened in 1995 as a place for artists and poets to congregate and host open mic nights for spoken word, readings, and performances. Greenlight Bookstore—which opened in 2009 as a result of neighborhood survey19 —though not black-‐owned seeks to fill a niche that meets the literary interests of legacy residents, the literacy needs of young families, and the tastes of the modern reader.
19 Steve Sachs, “Fort Greene Indie Bookstore Initiative,” Clinton Hill Blog, August 28, 2008. http://www.clintonhillblog.com/2008/08/29/fort-‐greene-‐moving-‐towards-‐a-‐bookstore/

V-‐20
Overall, Fort Greene’s planned cultural district has affected not only the standing of individual cultural organizations but has profoundly changed the ecology of the neighborhood. “Now, and looking forward,” an interviewee noted, “we see tall buildings, more fancy apartments, less affordable housing, and a stadium.” At the same time, after years of worrying about attracting Manhattan residents to events in Brooklyn, the context has fundamentally changed. As observed by an interviewee: “Then the question was—how do we get people to come to Brooklyn? Now the question is—how do you engage with the people who are here? What is culture? Who is it for?”
In Harlem/East Harlem, we encountered organizations proud of the fact that their founders had the foresight to buy property before they were priced-‐out, like the National Black Theater on Fifth Avenue at 125th Street, and others that had received buildings from the City. We met groups housed in Julia de Burgos Latino Cultural Center, former P.S. 72 renovated as studio and performing space for Latino artists—a City-‐sponsored conversion that dates from the Puerto Rican artists’ activism of the late 1960s and ‘70s. We met groups housed in El Barrio Artspace PS109, a recent renovation of former P.S. 109 as affordable artist housing, offices, and shared space—that required complex collaborations of nonprofit developers, philanthropy, and public officials. We visited another public site of historic significance to the neighborhood that has attracted the attention of developers and the City for possible renovation. La Marqueta—a marketplace under the Metro-‐North tracks on Park Avenue—dates from the 1930s when the City converted a pushcart street to an open stall market and connected it more thoroughly with the East Harlem neighborhood. Over the years the site has fallen into disrepair and dwindled in size, but nowadays La Placita de la Marqueta is evolving as a multicultural venue where one can sample hot bread, fresh fruit, roast pork, and live music. The City and developers hope to recreate La Marqueta as a healthy food market and public place that serves the cultural, educational, and other community needs of the neighborhood.
At the same time, local cultural leaders with longer memories perceive much of the “new” Harlem Renaissance as lacking in authenticity or organic connections to neighborhood residents. As one noted: “This New Harlem Renaissance did not bring anything that was organic. What it brought was commercialism—new supermarkets, in some cases, chain stores, [and] restaurants. None of those entities have anything to do with something organic—meaning what’s original about it, what’s organic about it, what is the history in the making. That’s what I’m doing with my organization.”
In Fort Greene, non-‐arts players have stepped into the fray, identifying new ways to expand culture into public spaces. Myrtle Avenue Brooklyn Partnership (MABP) collaborates with Fort Greene Park Conservancy and the Parks Department to turn the northeast corner of Fort Greene Park, and other public spaces along Myrtle Avenue, into temporary exhibition sites for public art. Since 2000 MABP has partnered with South of the Navy Yard Artists (SONYA) on its annual SONYA Art Walk, where local artists activate businesses and public spaces in Fort Greene, Clinton Hill, and Bedford Stuyvesant. SONYA artists have helped MABP integrate arts programs—Myrtle Windows Gallery,
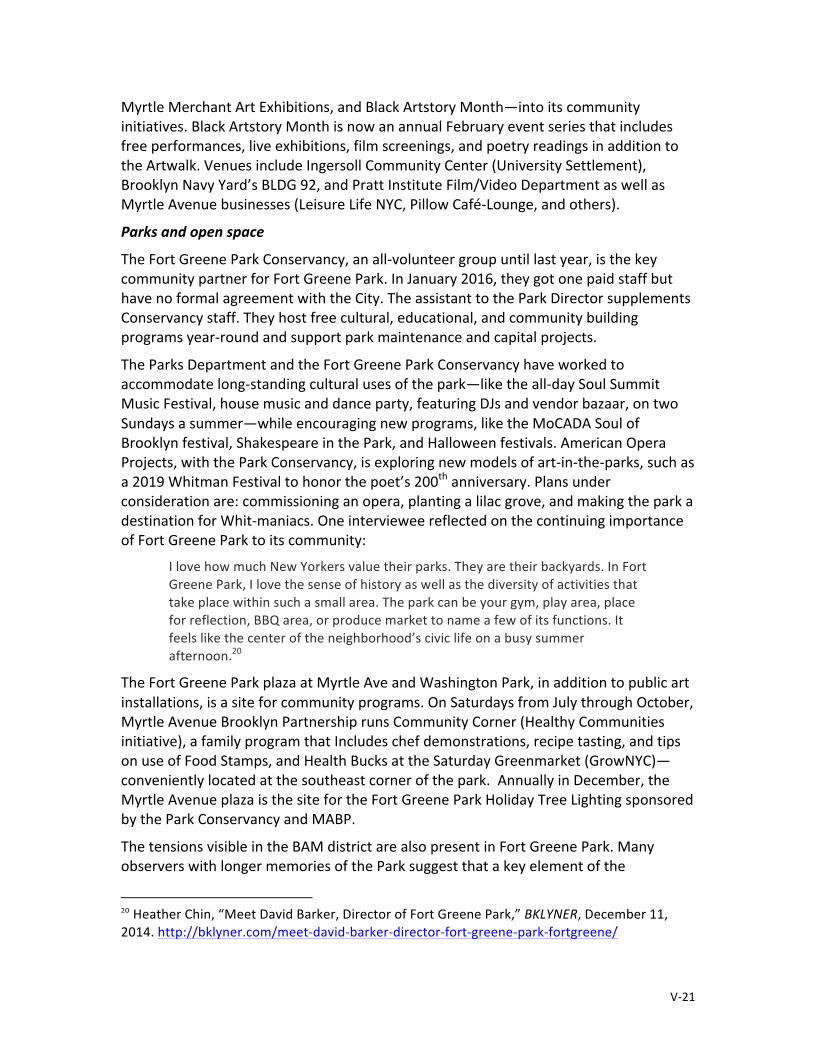
V-‐21
Myrtle Merchant Art Exhibitions, and Black Artstory Month—into its community initiatives. Black Artstory Month is now an annual February event series that includes free performances, live exhibitions, film screenings, and poetry readings in addition to the Artwalk. Venues include Ingersoll Community Center (University Settlement), Brooklyn Navy Yard’s BLDG 92, and Pratt Institute Film/Video Department as well as Myrtle Avenue businesses (Leisure Life NYC, Pillow Café-‐Lounge, and others).
Parks and open space
The Fort Greene Park Conservancy, an all-‐volunteer group until last year, is the key community partner for Fort Greene Park. In January 2016, they got one paid staff but have no formal agreement with the City. The assistant to the Park Director supplements Conservancy staff. They host free cultural, educational, and community building programs year-‐round and support park maintenance and capital projects.
The Parks Department and the Fort Greene Park Conservancy have worked to accommodate long-‐standing cultural uses of the park—like the all-‐day Soul Summit Music Festival, house music and dance party, featuring DJs and vendor bazaar, on two Sundays a summer—while encouraging new programs, like the MoCADA Soul of Brooklyn festival, Shakespeare in the Park, and Halloween festivals. American Opera Projects, with the Park Conservancy, is exploring new models of art-‐in-‐the-‐parks, such as a 2019 Whitman Festival to honor the poet’s 200th anniversary. Plans under consideration are: commissioning an opera, planting a lilac grove, and making the park a destination for Whit-‐maniacs. One interviewee reflected on the continuing importance of Fort Greene Park to its community:
I love how much New Yorkers value their parks. They are their backyards. In Fort Greene Park, I love the sense of history as well as the diversity of activities that take place within such a small area. The park can be your gym, play area, place for reflection, BBQ area, or produce market to name a few of its functions. It feels like the center of the neighborhood’s civic life on a busy summer afternoon.20
The Fort Greene Park plaza at Myrtle Ave and Washington Park, in addition to public art installations, is a site for community programs. On Saturdays from July through October, Myrtle Avenue Brooklyn Partnership runs Community Corner (Healthy Communities initiative), a family program that Includes chef demonstrations, recipe tasting, and tips on use of Food Stamps, and Health Bucks at the Saturday Greenmarket (GrowNYC)—conveniently located at the southeast corner of the park. Annually in December, the Myrtle Avenue plaza is the site for the Fort Greene Park Holiday Tree Lighting sponsored by the Park Conservancy and MABP.
The tensions visible in the BAM district are also present in Fort Greene Park. Many observers with longer memories of the Park suggest that a key element of the
20 Heather Chin, “Meet David Barker, Director of Fort Greene Park,” BKLYNER, December 11, 2014. http://bklyner.com/meet-‐david-‐barker-‐director-‐fort-‐greene-‐park-‐fortgreene/
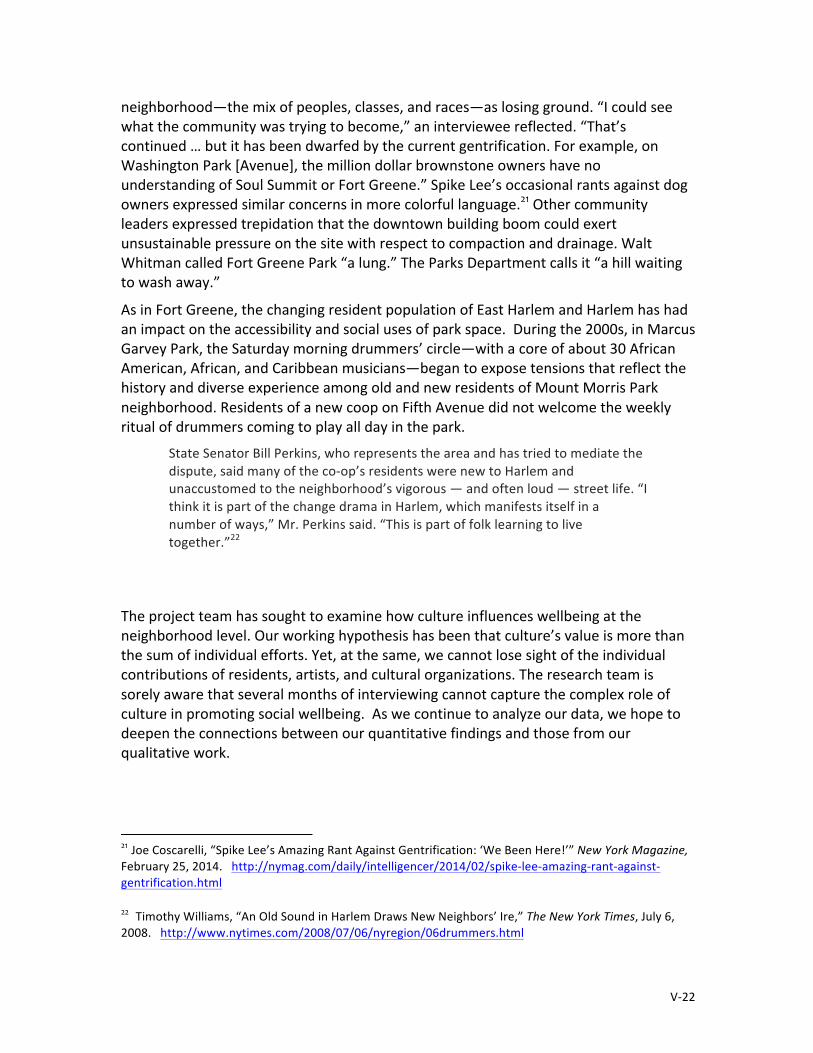
V-‐22
neighborhood—the mix of peoples, classes, and races—as losing ground. “I could see what the community was trying to become,” an interviewee reflected. “That’s continued … but it has been dwarfed by the current gentrification. For example, on Washington Park [Avenue], the million dollar brownstone owners have no understanding of Soul Summit or Fort Greene.” Spike Lee’s occasional rants against dog owners expressed similar concerns in more colorful language.21 Other community leaders expressed trepidation that the downtown building boom could exert unsustainable pressure on the site with respect to compaction and drainage. Walt Whitman called Fort Greene Park “a lung.” The Parks Department calls it “a hill waiting to wash away.”
As in Fort Greene, the changing resident population of East Harlem and Harlem has had an impact on the accessibility and social uses of park space. During the 2000s, in Marcus Garvey Park, the Saturday morning drummers’ circle—with a core of about 30 African American, African, and Caribbean musicians—began to expose tensions that reflect the history and diverse experience among old and new residents of Mount Morris Park neighborhood. Residents of a new coop on Fifth Avenue did not welcome the weekly ritual of drummers coming to play all day in the park.
State Senator Bill Perkins, who represents the area and has tried to mediate the dispute, said many of the co-‐op’s residents were new to Harlem and unaccustomed to the neighborhood’s vigorous — and often loud — street life. “I think it is part of the change drama in Harlem, which manifests itself in a number of ways,” Mr. Perkins said. “This is part of folk learning to live together.”22
The project team has sought to examine how culture influences wellbeing at the neighborhood level. Our working hypothesis has been that culture’s value is more than the sum of individual efforts. Yet, at the same, we cannot lose sight of the individual contributions of residents, artists, and cultural organizations. The research team is sorely aware that several months of interviewing cannot capture the complex role of culture in promoting social wellbeing. As we continue to analyze our data, we hope to deepen the connections between our quantitative findings and those from our qualitative work.
21 Joe Coscarelli, “Spike Lee’s Amazing Rant Against Gentrification: ‘We Been Here!’” New York Magazine, February 25, 2014. http://nymag.com/daily/intelligencer/2014/02/spike-‐lee-‐amazing-‐rant-‐against-‐gentrification.html 22 Timothy Williams, “An Old Sound in Harlem Draws New Neighbors’ Ire,” The New York Times, July 6, 2008. http://www.nytimes.com/2008/07/06/nyregion/06drummers.html

Chapter 6—Conclusion This report is part of an international conversation about the value of the arts and culture. A recent publication by the British Arts and Humanities Research Council1 reviewed much of the trans-‐Atlantic literature on cultural value and concluded that many of the truisms accepted by the cultural sector about the social benefits of the arts to individuals have little empirical support. The report called for scholarship to move beyond the debate about whether culture’s intrinsic value or its instrumental influence on other social factors—civic engagement, urban regeneration, economic growth, health and aging, education and learning—is more important.
As we noted in Chapter 1, the research team largely agrees with this perspective. By integrating culture and the arts into a conception of social wellbeing, we view culture as one of the elements of a life one has reason to value. At the same time, we are able to investigate if culture’s positive contribution is associated with other “goods,” like better health, school outcomes, or personal security. We depart from the British report in one respect. In our view, culture’s social value is best understood as an ecological—rather than an individual—phenomenon.
In Chapter 1 of this report, we outlined a theoretical framework based on two sets of concepts—cultural ecology and social wellbeing—that provide the rationale and approach for the research. In Chapters 2, 3, and 4, we presented detailed descriptions of the geographies of New York City’s cultural sector, nine other dimensions of social wellbeing, and the relationships among them from the point of view of the neighborhoods that comprise the City’s five boroughs. In Chapter 5, we discussed themes that emerged from our interviews about how cultural practice relates to neighborhood ecology and social wellbeing. In Chapter 6, to conclude the report, we undertake three tasks: revisit the conceptual framework, highlight major findings, and draw out implications for policy and research. Finally, we look ahead to ongoing work on the project.
Conceptual Framework Revisited
American cities, including New York, continue to face challenges. For many years, the core narrative of urban policy has focused on the negative impact of structural forces—globalization and rising inequality—on the quality of residents’ lives. Research on the impact of the arts has often reinforced this narrative by focusing on the economic impact of large cultural institutions on downtowns, while neglecting the cultural life of urban neighborhoods. Yet, if we are to formulate a more balanced narrative of cities in the twenty-‐first century, we need to conceptualize culture’s role more broadly. We must use a lens that examines culture’s social value as more than an ATM or cash register and examine that value for all neighborhoods. In pursuing this task, this report
1 Geoffrey Crossick and Patrycja Kaszynska, Understanding the value of arts & culture: The AHRC Cultural Value Project (Swindon, UK: Arts & Humanities Research Council, 2016).

VI-‐2
is based on two fundamental theoretical perspectives: the ideas of cultural and community ecology and of a multi-‐dimensional approach to social wellbeing.
The ecological perspective
Ecology is one of the founding concepts of American social science, most associated with the “Chicago” school of sociology. At its core, the ecological perspective grows out of a fundamental insight: that we are all both influenced by and, in turn, influence our social context.
Although central to 20th-‐century social research, the ecological perspective fell into disfavor in the last decades of that century. Critics, often justifiably, suggested that by focusing on the close encounters people have in their immediate surroundings, ecology often obscured the role of “distant” social forces—particularly the exercise of political and economic power by elites—that profoundly influence everyday life.
The ecological perspective also ran into methodological and political challenges. Ecologies don’t create programs, vote in elections, or use public facilities. From the standpoint of researchers and policymakers, individuals and organizations are more readily studied and influenced than neighborhoods. Indeed, as changing individual behavior became a preoccupation of social policy after the War on Poverty of the 1960s, neighborhood came to be seen as part of an “ecological fallacy” or “selection bias.” In other words, neighborhood was a factor to control for if we were to understand human behavior, not a phenomenon to study in its own right.
In recent years, ecology has made a comeback. Part of the reason probably lies with our increased sensitivity to the physical environment. As grade-‐schoolers began to study how their lunch sandwich wrappers are related to depletion of natural resources, the idea that “everything is connected to everything” became easier to understand.
Revival of the ecological perspective is also related to methodological innovations. The development of geographic information systems (GIS) has facilitated the analysis of data at a variety of levels and allowed researchers to consider the effects of data from different sources, with different geographies, on one another. This, in turn, has encouraged the development of hierarchical modeling of relationships—studying how individual, family, neighborhood, and national factors influence social outcomes.
For the study of the arts and culture, the ecological perspective provides a number of insights. Most cultural activity is not thoroughly institutionalized. For a sector like education—which is dominated by large bureaucratically organized systems—studying organizations and how people interact within them makes a certain amount of sense. In an imperfectly institutionalized sector like culture, however, formal institutions and the social roles they generate describe only a small share of the activity within the sector. Social networks, by contrast, play a much larger role in the arts world, and network structure provides a critical opening for employing ecology as an organizing concept.
In this report, we’ve used the concept of ecology in two senses. First, we are interested in cultural ecology, the way that different cultural entities—organizations, artists, and

VI-‐3
cultural participants—interact in cultural production and consumption. Second, we discuss neighborhood ecology, the way that different entities, including cultural agents, interact in the broader community.
The two concepts converge around the idea of a neighborhood cultural ecosystem. Where the idea of cultural ecology alone is not geographically bounded (it can encompass citywide or global networks), a neighborhood cultural ecology focuses on the role that culture plays in certain places. The discussion of our interview findings provides an example of how this plays out in particular neighborhoods.
Employing an ecological perspective, if one sees the critical force in a community as the interaction of different agents rather than as one factor influencing another, causality becomes more difficult to identify. In Chapter 4, we examine the association of cultural assets with several aspects of social wellbeing, but as we noted there, this should not be confused with a causal argument. Neighborhoods are like a big stew, a complex mix of diverse ingredients. A two-‐year study that aims to give a citywide perspective can only provide suggestive findings about how culture contributes to that stew. Knowing whether culture is a main ingredient (like meat, beans, or rice) or rather a distinctive herb or seasoning like cumin would take considerably more analysis.
Social wellbeing
If neighborhood ecology weren’t complicated enough, we’ve insisted on understanding the lives of neighborhoods and their residents across ten different dimensions. The social wellbeing lens has allowed us to place the arts and culture in their proper perspective. Certainly, culture is an economic activity, especially so in New York where commercial culture from Broadway to fashion design is central to employment and revenue. But a fuller understanding of culture’s social value demands a wider lens.
The capability approach discussed in Chapter 1 underscores wellbeing as a philosophy of social progress based on human development. Ultimately, wellbeing is about human freedom—that is, people’s ability to make choices about their lives and see those choices as opportunities to lead a life they have reason to value.
In this context, culture is not about jobs or taxes. It is a critical resource that people use as part of that quest for a life of value. It can provide tools for making sense of the world. It can provide opportunities to develop one’s abilities or to forge connections with people like themselves or not like themselves. Or it can simply provide enjoyment and satisfaction. This is why we’ve insisted that culture be seen as a central aspect of wellbeing that simultaneously has intrinsic value and contributes to other forms of social value.
Our ten-‐dimension model is hardly a last word. We see it as a developmental tool for improving how we think about and measure the wellbeing of neighborhoods and a city. Because of our commitment to not just propose dimensions of wellbeing but to actually measure them, we’ve stuck with these ten. We appreciate the efforts of city government in gathering these data. At the same time, we’d hope that by pointing out the current shortcomings in spatial data to measure these dimensions, we would inspire

VI-‐4
government and philanthropy to develop even better data systems and that, in turn, we as researchers would be able to do a better job of both conceptualizing and measuring social wellbeing.
Major Findings
New York City’s cultural sector is notable for its breadth, diversity, and dynamism.
That New York’s cultural sector is large and varied is hardly a “stop the presses” finding. Everyone knows that New York City is the cultural capital of the nation. Still, the research team was surprised by how large and varied and changeable it is.
We spent the better part of a year undertaking the discovery stage of the project—using any sources we could find to document the presence of nonprofit cultural resources across the five boroughs. Based on previous work in other cities, we had guesstimated that the city would have between two and three thousand nonprofit cultural providers.
However, when we wrapped up that phase of the project, we had over 4,700 cultural providers in our nonprofit inventory. Because of our commitment to complete other phases of the research, we had to quit at that point. Obviously, there are hundreds, if not thousands, of nonprofit groups and programs we did not uncover. In particular, several people with whom we’ve discussed the issue emphasize that neighborhoods have extensive networks of informal cultural providers, many of which have not yet incorporated. Still, given the goal of providing a citywide perspective at the neighborhood level, we are confident that the thousands of nonprofits we’ve identified, as well as the more than seventeen-‐thousand for-‐profit cultural entities, employed artists, and over a million cultural participants—that these data provide a good first estimation of the distribution of cultural resources across the five boroughs.
Cultural assets are distributed unequally across the city’s neighborhoods.
If we believe that culture is an intrinsic element of wellbeing, the unequal distribution of cultural resources stands out as a major challenge to social justice. This would be the case even if the unequal distribution were random. But of course it isn’t random. It is deeply etched into the contours of social class, racial, and ethnic inequality.
There are no “cultural deserts” in New York City. Thanks to the efforts of local artists, community activists, and cultural participants, even the most challenged neighborhoods support a cultural scene. The problem here is one of resources. Much of the cultural activity we’ve documented is a product of some agent—government, philanthropy, business, or private individuals—providing the resources necessary to open a cultural center or stage a performance or festival. To a great extent, what we are measuring is not differences in neighborhood interest in the arts, culture, or heritage; but rather the extent to which local residents and cultural workers have access to resources that can turn that interest into opportunity and engagement.
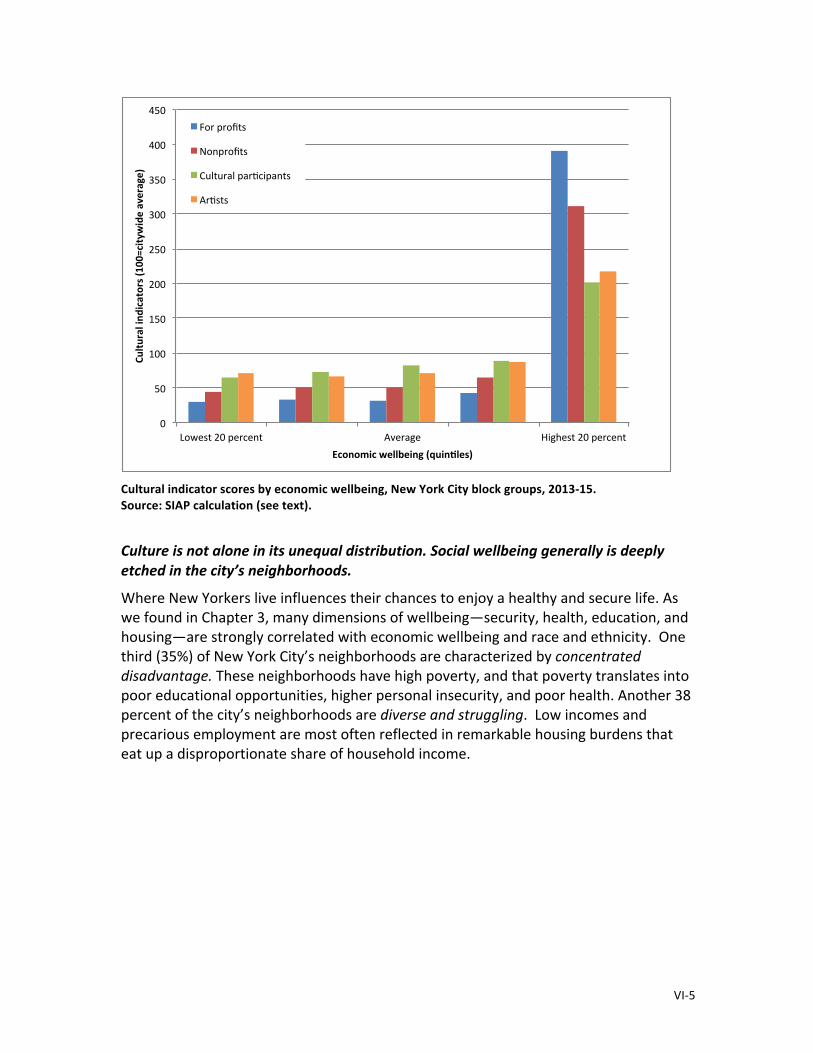
VI-‐5
Cultural indicator scores by economic wellbeing, New York City block groups, 2013-‐15. Source: SIAP calculation (see text).
Culture is not alone in its unequal distribution. Social wellbeing generally is deeply etched in the city’s neighborhoods.
Where New Yorkers live influences their chances to enjoy a healthy and secure life. As we found in Chapter 3, many dimensions of wellbeing—security, health, education, and housing—are strongly correlated with economic wellbeing and race and ethnicity. One third (35%) of New York City’s neighborhoods are characterized by concentrated disadvantage. These neighborhoods have high poverty, and that poverty translates into poor educational opportunities, higher personal insecurity, and poor health. Another 38 percent of the city’s neighborhoods are diverse and struggling. Low incomes and precarious employment are most often reflected in remarkable housing burdens that eat up a disproportionate share of household income.
0"
50"
100"
150"
200"
250"
300"
350"
400"
450"
Lowest"20"percent" Average" Highest"20"percent"
Cultu
ral'ind
icators'(10
0=citywide'average)'
Economic'wellbeing'(quin<les)'
For"profits"
Nonprofits"
Cultural"par?cipants"
Ar?sts"
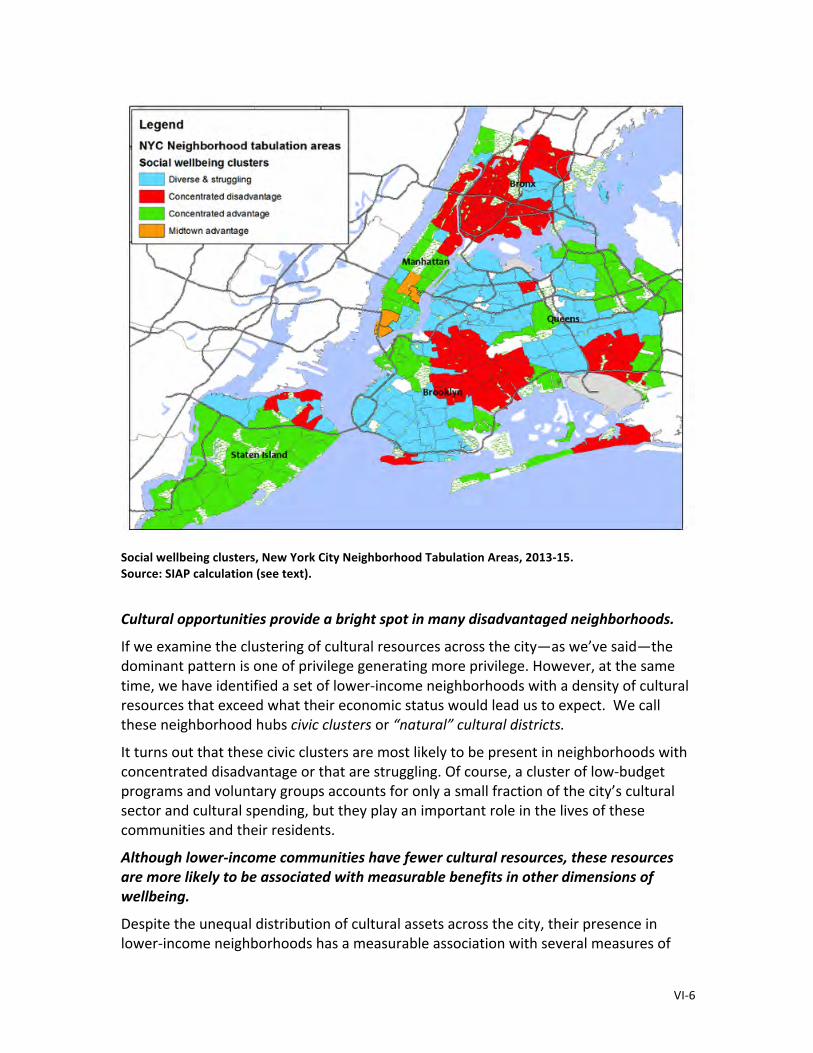
VI-‐6
Social wellbeing clusters, New York City Neighborhood Tabulation Areas, 2013-‐15. Source: SIAP calculation (see text).
Cultural opportunities provide a bright spot in many disadvantaged neighborhoods.
If we examine the clustering of cultural resources across the city—as we’ve said—the dominant pattern is one of privilege generating more privilege. However, at the same time, we have identified a set of lower-‐income neighborhoods with a density of cultural resources that exceed what their economic status would lead us to expect. We call these neighborhood hubs civic clusters or “natural” cultural districts.
It turns out that these civic clusters are most likely to be present in neighborhoods with concentrated disadvantage or that are struggling. Of course, a cluster of low-‐budget programs and voluntary groups accounts for only a small fraction of the city’s cultural sector and cultural spending, but they play an important role in the lives of these communities and their residents.
Although lower-‐income communities have fewer cultural resources, these resources are more likely to be associated with measurable benefits in other dimensions of wellbeing.
Despite the unequal distribution of cultural assets across the city, their presence in lower-‐income neighborhoods has a measurable association with several measures of

VI-‐7
social wellbeing. As we document in Chapter 4—if we control for economic wellbeing, race, and ethnicity—we find statistically significant relationships between the Cultural Asset Index and our indexes of health, personal security, and school effectiveness.
Predicted health, school effectiveness, and personal security indexes by Cultural Asset Index, controlling for economic wellbeing and percent black or Hispanic, lowest 40 percent of block groups by per capita income, New York City, 2009-‐15. Source: SIAP calculation (see text).
We might expect culture to exhibit the strongest relationship with social wellbeing in neighborhoods with the largest number of cultural assets, but this is not the case. We’ve found the most consistent relationships between culture and dimensions of social wellbeing in lower-‐income neighborhoods that, on average, have fewer cultural resources. Yet, if we consider that in higher-‐income neighborhoods, residents can use their economic resources to secure better health, better schools, or safer streets, the strength of these associations in lower-‐income neighborhoods makes sense. Social connection is a form of “capital.” In lower income neighborhoods, this form of capital substitutes for the financial capital that is available in higher-‐income areas. As discussed throughout this report, we do not see these as causal relationships. Culture does not “cause” better health or less crime. Rather, these findings suggest that cultural

VI-‐8
resources are integral components of a neighborhood ecology that promotes social wellbeing.
Cultural engagement is a form of intentional social action—that is, it represents an opportunity to develop counter-‐narratives to the structural forces that determine individual and community wellbeing.
As we noted in Chapter 1, this project is an effort to develop a counter-‐narrative of American cities that challenges a story of government failure and provides a balanced picture of how both structural forces and intentional social action working together have produced contemporary urban realties. As we have also discussed, this task is complicated by the fact that we have much better data for cities on those structural forces than we do on social action.
The development of our cultural asset inventories and indexes is a contribution to righting this balance by providing a quantitative portrait of cultural engagement. Our quantitative work, however, is just a beginning. When we turned to the task of linking culture to social wellbeing, we discovered that our community studies helped us better understand the variety of ways that the cultural community—and the support it receives from public policy and programs—contributes to that urban counter-‐narrative. In particular, our interviews with cultural practitioners in several New York neighborhoods gave the research team a fresh perspective on how culture makes a difference in these communities by enhancing social connection, amplifying community voice, and animating the public environment.
Implications for Policy and Research
Our project has primarily been devoted to documenting the critical connections between culture and social wellbeing in the city. However, as we complete this phase of the research, it seems reasonable to consider implications of the work for policy and future research.
Measuring community assets
Our first implication is perhaps the most obvious. There is a marked imbalance between available data on the structural inequalities present in urban neighborhoods and evidence of community assets. This study has benefited from government data gathered by federal and city agencies that document economic inequality and its consequences for the quality of life of residents across the city. We’ve discussed differences in economic wellbeing, educational attainment, personal health, school outcomes, and personal security—thanks to these data. However, when it comes to the forces that pull communities together—that foster social connection, civic engagement, and voice—we have had to rely on more impressionistic sources.
Indeed, we see one of the great contributions of the project as providing some quantitative measures of community engagement. The presence of cultural organizations and resident artists in a neighborhood provides markers of social

VI-‐9
engagement. In particular, the analysis of cultural participation in Chapter 2 provides a first-‐approximation of the sections of the city in which residents are most engaged in civic activity. It may be that this first-‐approximation is only a partial portrait of these phenomena, but that is our point. If social connection is to serve as a counterweight to the forces that divide New Yorkers, we will need more systematic effort devoted to documenting those forces. We hope that this study points out at least some ways in which the public and nonprofit sectors could promote better documentation of community assets.
Addressing the unequal distribution of cultural resources
The central finding of this report is something that most New Yorkers already know. The cultural resources in the city are overwhelmingly concentrated in relatively few neighborhoods. Although common knowledge, the research team was startled by the level of concentration and by the degree to which economic status, race, and ethnicity define those concentrations. Although every neighborhood possesses an informal cultural sector, many are bypassed by the flow of resources from government and philanthropy.
During our two years of research, we have heard from knowledgeable people inside and outside of city government that this is not a reason for concern. New York City residents, we are told, can easily get on public transit and in a matter of minutes access the city’s vast treasure of museums, theaters, and historic sites. Leaving aside the challenges of the transit system, we hope this study has demonstrated that a subway ride away cannot substitute for the spillover effect of having cultural resources grounded in one’s own neighborhood.
We have also heard something we readily admit—that we have not fully documented the wealth of informal cultural resources in the city’s neighborhoods. During our community study phase, we made an effort to augment our inventories of cultural resources with ground-‐level investigations. Our field work left no doubt that the 4,700 nonprofit cultural providers we’ve identified could be expanded if we had the resources and time to delve more deeply into the informal sector.
Yet, we don’t believe this acknowledgement would fundamentally change our conclusions. First, although lower-‐income communities undoubtedly have many resources we’ve failed to uncover, more affluent communities often have as many or more of these types of resources. For every musician or folk artist in a lower-‐income community, we would likely find one in a more affluent community—and all neighborhoods have church choirs. We doubt if the uncovering of more groups would change our conclusions about the relative inequality of cultural resources and opportunities across the city’s neighborhoods.
As a means of documenting this inequality, we used our database to identify the lower-‐income communities of the city with the lowest level of cultural assets relative to all city neighborhoods. Obviously there is no bright line between neighborhoods with the fewest and those with fewer resources. So the map below shows some lower-‐income
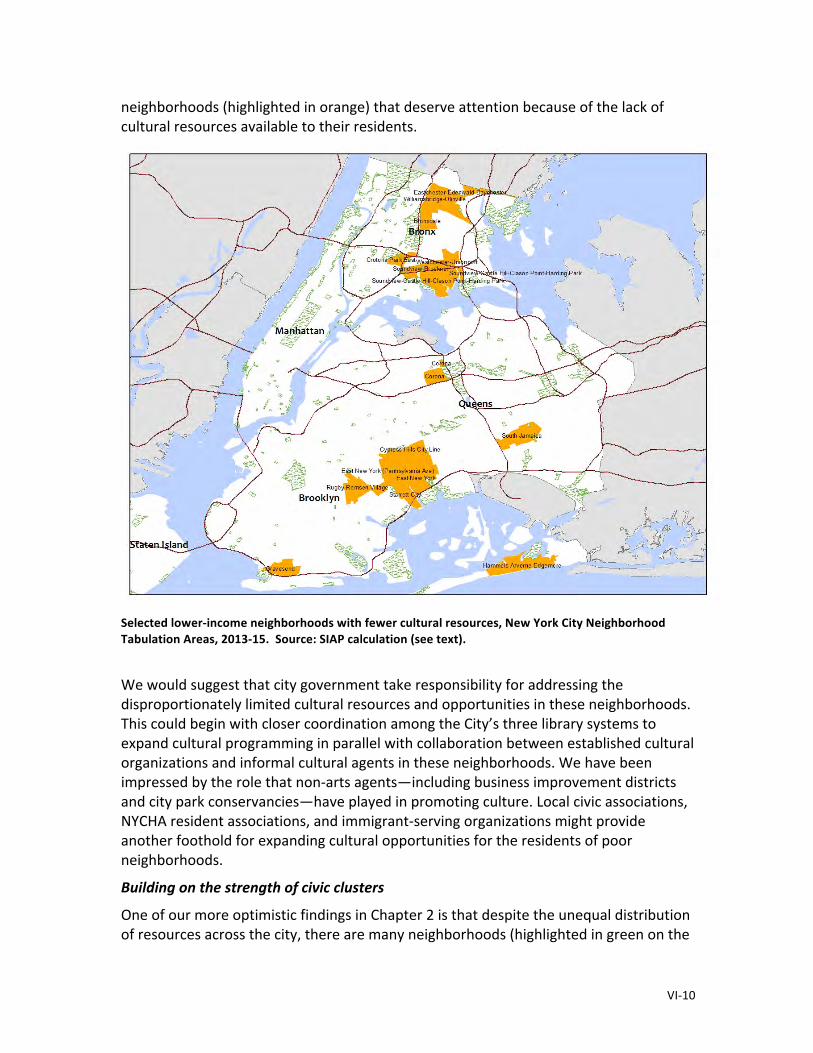
VI-‐10
neighborhoods (highlighted in orange) that deserve attention because of the lack of cultural resources available to their residents.
Selected lower-‐income neighborhoods with fewer cultural resources, New York City Neighborhood Tabulation Areas, 2013-‐15. Source: SIAP calculation (see text).
We would suggest that city government take responsibility for addressing the disproportionately limited cultural resources and opportunities in these neighborhoods. This could begin with closer coordination among the City’s three library systems to expand cultural programming in parallel with collaboration between established cultural organizations and informal cultural agents in these neighborhoods. We have been impressed by the role that non-‐arts agents—including business improvement districts and city park conservancies—have played in promoting culture. Local civic associations, NYCHA resident associations, and immigrant-‐serving organizations might provide another foothold for expanding cultural opportunities for the residents of poor neighborhoods.
Building on the strength of civic clusters
One of our more optimistic findings in Chapter 2 is that despite the unequal distribution of resources across the city, there are many neighborhoods (highlighted in green on the

VI-‐11
following map) that have more cultural assets than we would expect given their economic status. These civic cultural clusters deserve particular attention as the City formulates its plans for cultural investment.
Selected civic cultural clusters, New York City Neighborhood Tabulation Areas, 2013-‐15. Source: SIAP calculation (see text).
Here we build on the insight of our partners at Reinvestment Fund. In their community development work, they use the idea of building from strength as a mantra. What they mean is that it is often more effective to concentrate resources in places with some existing asset. A transportation hub or a block with a set of committed and active residents—for community developers and lenders—can serve as a point of strength.
From the perspective of the cultural sector, we suggest that civic clusters can serve as points of strength in two ways. First, given our findings on the culture/social wellbeing link, civic clusters could serve as demonstration projects to see if increasing resources can actually pay off in improved health, school outcomes, or personal security. Second, civic clusters could provide a fulcrum for leveraging existing cultural resources outward to surrounding communities. We hope to have more to say about cultural network building in a future report once we’ve analyzed patterns of off-‐site programming across the city.
VI-‐12
Philanthropy might take the lead in the sponsorship of civic cluster demonstration projects. As with any demonstration project, there are likely to be greater and lesser degrees of success in reaching anticipated outcomes. Philanthropy would be well positioned to commit to the evaluation necessary to learn from these initiatives and to disseminate their findings.
Expanding the civic reach of the cultural sector
The cultural sector itself has a role to play. Cultural organizations rarely feel secure, and the financial crisis of 2007-‐09 and its legacy have left many organizations vulnerable. As we would expect, this vulnerability has encouraged cultural leaders to focus their energy on strengthening their organizations and increasing their sustainability.
One of the surprises to emerge from our interviewing during 2016 was the extent to which questions about social networks and community connections elicited responses framed by concerns for organizational sustainability. We expected to hear about the extent to which a cultural organization might be reaching out to community-‐based organizations to expand participation. Instead, we more often learned about how cultural organizations worked with city agencies, city council members, philanthropies, and a range of government contracting agencies to secure funding and support. Linking to other community organizations often came up as an afterthought.
Certainly, cultural organizations outside of New York are envious of the variety of public and philanthropic support for the arts in the city. Yet, the day has only so many hours. If an organization leader spends her time meeting with city officials, council members, and foundation officers, it limits the time available to speak with community-‐based organizations and local residents. At a recent forum a city official noted that during budget hearings on public libraries, scores of local residents showed up to testify; but when nonprofit cultural funding was the topic, only executive directors attended. It suggests that even in their search for organizational sustainability, cultural leaders in New York would be wise to devote time to reaching out horizontally to neighborhood organizations and residents to complement the vertical networks they forge around funding and advocacy.
Next Steps
As of January 2017, the Culture and Social Wellbeing in New York City project has completed its core goals of documenting the City’s cultural resources, developing a multidimensional index of social wellbeing, and making sense of the relationship between the two. Yet, as in any good research project, for every question one answers, two more are generated. In this case, our work has led us to pursue two questions in the coming months. One, how can we discern the patterns and meanings of neighborhood change and to what extent is neighborhood change related to cultural ecology? Two, what is the nature of social networks within the city’s cultural ecosystem and to what extent are these cultural networks related to neighborhood social wellbeing?

VI-‐13
The relationship of cultural resources to neighborhood change
At the beginning of the project, the research team viewed neighborhood change as one of the background factors that we would need to take into consideration during our quantitative analysis. However, issues related to the causes and consequences of neighborhood change have permeated all aspects of the project. Efforts of the de Blasio administration to link the spiral of the City’s real estate market to the provision of affordable housing have provoked concerns not only from the private sector but also from housing advocates. Our interviews with practitioners, which raised a range of topics, often centered on the implications of neighborhood change for the wellbeing of the cultural sector as well as the community in rapidly changing neighborhoods.
Over the next several months, we plan to address the links between neighborhood change, culture, and wellbeing in several ways. First, we will pull together work by Reinvestment Fund and SIAP to document the dimensions of change in New York City neighborhoods since the turn of the twenty-‐first century. There is no single measure that captures all dimensions. Rapid change in median income, change in racial and ethnic composition, people forced out of their homes by foreclosure or eviction, and rates of population turnover in a neighborhood—these are just a few of the ways that the phenomenon can be charted. We plan to use a variety of these measures to identify places that are experiencing change over several dimensions. Second, we will use this analysis to examine the extent to which culture is a cause, a consequence, or a correlate of neighborhood change.
We will complement this quantitative investigation with continued mining of our interviews and fieldwork in several neighborhoods. As noted, neighborhood change was a constant theme during our conversations in 2016. We expect to gain additional insights as we proceed with analysis of completed interviews regarding the effect of neighborhood change on cultural ecology and of cultural ecology on neighborhood change.
Documentation of cultural networks and their relationship to neighborhood wellbeing
The project began with a commitment to an ecological approach to the study of communities and culture. While we have documented the geographic aspect of ecology—the presence of particular resources in particular neighborhoods—we have only begun to understand the non-‐geographic networks that link cultural resources.
Fortunately, the Department of Cultural Affairs has collected extensive data on the interactions between its grantees and other community organizations across the city. While the database is extensive, it is missing several pieces of information that would allow it to shed light on the within and between neighborhood links that comprise the cultural ecosystem. The research team began adding these fields to the dataset, but the size of the dataset (over eight thousand entries) and the need for individual validation required such a significant investment of time that we had to set aside the task to finish this report. With the cultural network database, we will be able to analyze both the nature of the networks within the city’s cultural ecosystem and the relationship of those

VI-‐14
networks to other dimensions of neighborhood wellbeing.
Again, we will complement the quantitative analysis of the city’s cultural networks with material drawn from our community studies. We’ve presented a set of themes and illustrations of the relationship of cultural practice to community networks and social wellbeing that emerged from our interviews and fieldwork. We will expand on this work as it relates to understanding the social networks within the city’s cultural ecosystem.
For researchers, there really is never an end. Every dataset could be more complete. Every analysis could be tried a different way. Every two-‐hour interview leaves us asking ourselves what other questions we should have asked.
Sometimes, it’s necessary to pause, pull together what you’ve learned, and let those who have supported you through the process share in that learning. Now is that time. Although the research team remains clear about the number of tasks ahead, this report gives a sense of what we have accomplished thus far.
As Scarlett noted: “Tomorrow is another day.”

A-‐1
APPENDIX The Culture and Social Wellbeing in New York City project could not have been undertaken without the contributions and cooperation of many individuals and organizations. Many people have provided data sets (occasionally creating them at the same time) and taken time to explain their perspective on culture and social wellbeing. We are grateful for all of their support. Organizations that contributed to our estimates of cultural participation
52nd Street Project
Afro-‐Latin Jazz Alliance
Ansonia Music Outreach/Phoenix Ensemble
Anti-‐Social Music
Apollo Theater
BAM/Brooklyn Academy of Music
BCT Brooklyn Children’s Theatre
Bronx Museum of the Arts
Bronx Opera Company
Brooklyn Botanic Garden
Brooklyn Center for the Performing Arts at Brooklyn College/CUNY
Brooklyn Children's Museum
Brooklyn Museum
Buglisi Dance Theatre [Threshold Dance Projects Inc]
Danspace Project
Elastic City
El Museo del Barrio
FIGMENT Project
Flushing Town Hall
General Society of Mechanics and Tradesmen of the City of New York
Gibney Dance
Greater Ridgewood Historical Society
Harlem Stage [Aaron Davis Hall Inc]
Historic Richmond Town [Staten Island Historical Society]

A-‐2
Irish Arts Center
Jamaica Center for Arts & Learning
[The] Laundromat Project
Lehman College Art Gallery
MoMA PS1 [P.S. 1 Contemporary Art Center]
[The] Moth [Storyville Center for the Spoken Word Inc]
Museum of the City of New York
Museum of the Moving Image
New York Botanical Garden
New York City Center
New York Hall of Science (NYSCI)
Pregones Theater/Puerto Rican Traveling Theater (Pregones PRTT)
[The] Public Theater [New York Shakespeare Festival]
Queens Botanical Garden
Sesame Flyers International
Snug Harbor Cultural Center & Botanical Garden
Sons of the Revolution in the State of New York/Fraunces Tavern Museum
South Asian Women's Creative Collective (SAWCC)
Staten Island Children's Museum
Staten Island Museum
Studio Museum in Harlem
Theatre Development Fund
Tribeca New Music
Variations Theatre Group/Chain Theatre
Vineyard Theatre
Wildlife Conservation Society
Women’s Housing and Economic Development Corporation (WHEDco)/ Bronx Music Heritage Center
[The] Wooster Group

A-‐3
Organizations that provided zip code counts of IDNYC cardholder memberships to the NYC Department of Cultural Affairs
American Museum of Natural History BAM (Brooklyn Academy of Music) BRIC (BRIC Arts l Media House) Bronx County Historical Society Bronx Museum of the Arts Brooklyn Botanic Garden Brooklyn Children's Museum Brooklyn Museum Carnegie Hall El Museo del Barrio Flushing Town Hall Guggenheim Museum Historic Richmond Town [Staten Island Historical Society] Jamaica Center for Arts & Learning Lincoln Center for the Performing Arts Metropolitan Museum of Art Metropolitan Opera MoMA PS1 Museum of Chinese in America Museum of Jewish Heritage Museum of Modern Art Museum of the City of New York Museum of the Moving Image New Museum New York Botanical Garden New York City Ballet New York City Center New York Hall of Science Pregones/Puerto Rican Traveling Theater Public Theater Queens Botanical Garden Queens Museum Queens Theatre Snug Harbor Cultural Center and Botanical Garden Station Island Children's Museum Staten Island Museum Staten Island Zoological Society Studio Museum in Harlem Theatre Development Fund Wave Hill Wildlife Conservation Society

A-‐4
Organizations that contributed information on cultural organizations, artists, program sites, and partners
Bronx Council on the Arts
Bronx Museum of the Arts
Brooklyn Arts Council
City Lore, Places that Matter NYC
[The] Field
Flushing Town Hall
Lower Manhattan Cultural Council
New York Botanical Garden
New York City Department of Cultural Affairs
New York Foundation for the Arts
Pregones/Puerto Rican Traveling Theater
Queens Council on the Arts
Staten Island Arts

A-‐5
Interviewees, Summer-‐Fall 2016 Brooklyn
651 ARTS—Shay Wafer
American Opera Projects—Charles Jarden
BAM (Brooklyn Academy of Museum)—Karen Brooks Hopkins
BRIC (BRIC Arts l Media House)—Leslie Schultz, Anthony Riddle, Jessica Sucher
Brooklyn Historical Society—Deborah Schwartz
Brooklyn Young Filmmakers/People’s Hollywood—Trayce Gardner
Cumbe: Center for African and Diaspora Dance—Jimena Martinez
Fort Greene Park (NYC Parks Dept)—David Barker
Fort Greene Park Conservancy—Charles Jarden
Franklin Furnace Archive—Martha Wilson
Greenlight Bookstore—Rebecca Fitting, Jessica Stockton Bagnulo, Alexis Akre
Groundswell—Claudie Mabry
Irondale Ensemble Project—Terry Greiss
Mark Morris Dance Group—Nancy Umanoff
Museum of Contemporary African Diasporan Arts (MoCADA)—James Bartlett
Myrtle Ave Brooklyn Partnership (MARP & BID)—Meredith Phillips Almeida
NY Writers Coalition—Aaron Zimmerman
Soul Summit Music—Leonardo Bellamy affectionately known as DJ Sadiq
South of the Navy Yard Artists (SONYA)—Brittan Blasdel, Daonne Huff
StoryCorps—Robin Sparkman
Target Margin Theater—David Herskovits
Theatre for a New Audience—Dorothy Ryan
Urban Bush Women—Lai-‐Lin Robinson, Tahnia Belle

A-‐6
Manhattan
Centro at Hunter College/CUNY, Centro de Estudios Puertorriquenos Center for Puerto Rican Studies, Library and Archives— Alberto Hernández-‐Banuchi, Anibal Arocho
Harlem Needle Arts—Michelle Bishop
Hi-‐ARTS—Raymond Codrington
Los Pleneros de la 21 (LP21)— Juango Juan J. Gutíerrez, Julia L. Gutiérrez-‐Rivera
Musica de Camara—Eva de La O
National Black Theatre—Sade Lythcott, Nabii Faison
Placeful—Eileen Reyes Arias, Shawn McLearen
Taller Boricua—Nitza Tufino
Queens
Flushing Town Hall—Sami Abu Shumays, Ellen Kodadek, Gabrielle Hamilton, Shawn Choi, Michael Liu
Queens Museum—Prerana Reddy, José Serrano-‐McClain