the sound and fury of patent activity
TRANSCRIPT

University of Minnesota Law School University of Minnesota Law School
Scholarship Repository Scholarship Repository
Minnesota Law Review
2019
The Sound and Fury of Patent Activity The Sound and Fury of Patent Activity
Robin C. Feldman
Mark A. Lemley
Follow this and additional works at: https://scholarship.law.umn.edu/mlr
Part of the Law Commons
Recommended Citation Recommended Citation Feldman, Robin C. and Lemley, Mark A., "The Sound and Fury of Patent Activity" (2019). Minnesota Law Review. 3279. https://scholarship.law.umn.edu/mlr/3279
This Article is brought to you for free and open access by the University of Minnesota Law School. It has been accepted for inclusion in Minnesota Law Review collection by an authorized administrator of the Scholarship Repository. For more information, please contact [email protected].

1793
Article
The Sound and Fury of Patent Activity
Robin C. Feldman† & Mark A. Lemley††
Introduction ........................................................................... 1794 I. Patent Enforcement and Innovation............................... 1798
A. The Debate Over NPEs ............................................. 1798 B. Evidence So Far; Our Pilot Study ............................. 1806
II. What We Did .................................................................... 1808 A. Data Sources and Partners ....................................... 1809 B. Survey Population ..................................................... 1809 C. Designing the Survey Instrument ............................ 1814
1. Pretest and Response Analysis ........................... 1814 2. Pretest Response Rate and Study
Modifications ....................................................... 1819 D. The Final Survey ....................................................... 1823 E. Weighting ................................................................... 1827
III. Results .............................................................................. 1830 A. Overall Descriptive Statistics ................................... 1830 B. Results by Type of Licensing Entity ......................... 1832 C. Bias in the Perception of Knowledge Transfer ......... 1841 D. Industry-Specific Results .......................................... 1845 E. Results Sorted by Respondent Job Description ........ 1848
IV. Implications ..................................................................... 1851 A. There Is No One Right Answer ................................. 1852
† Arthur J. Goldberg Distinguished Professor, University of California Hastings College of the Law; Visiting Professor UCLA Law. Copyright © 2019 Robin C. Feldman & Mark A. Lemley.
†† William H. Neukom Professor, Stanford Law School; Partner, Durie Tangri LLP. Thanks to the National Science Foundation for a grant that sup-ported this research, the Indiana Survey Center for fielding the survey, and Ramy Alsaffar, Jason Reinecke, Nick Thieme, and Connie Wang for outstanding research and design assistance. Thanks also to John Gray and Prianka Misra for additional research assistance and project management. Thanks to Rose Ha-gan, Tim Holbrook, Brian Love, Kent Richardson, Michael Risch, and Jonathan Stroud for comments on a prior draft. Copyright © 2019 Robin C. Feldman & Mark A. Lemley.

1794 MINNESOTA LAW REVIEW [103:1793
B. Patent Licensing Demands Don’t Drive Innovation .................................................................. 1856
Conclusion .............................................................................. 1860 Appendix A: Unweighted Results ......................................... 1861 Appendix B: Survey Question Tree ....................................... 1863
“It is a tale . . . full of sound and fury, signifying nothing.”1
INTRODUCTION
Patent reform is a hotly contested issue, occupying the at-tention of Congress, the Supreme Court, and many of the most innovative companies in the world.2 Most of that dispute centers on patent enforcement, and in particular on the role of non-prac-ticing entities (NPEs) or “patent trolls” – companies that don’t themselves make products but sue those that do.3 To technology companies, NPEs are a drag on innovation, taxing them tens of billions of dollars every year while achieving no social purpose.4 To NPEs and their supporters, they are enabling the first inven-tor to get paid and creating a working market for the transfer of technology.5
1. WILLIAM SHAKESPEARE, THE TRAGEDY OF MACBETH act. 5, sc. 5.
2. See, e.g., Stuart J.H. Graham et al., High Technology Entrepreneurs and the Patent System: Results of the 2008 Berkeley Patent Survey, 24 BERKELEY
TECH. L.J. 1256, 1260 (2009); Sannu Shrestha, Note, Trolls or Market-Makers? An Empirical Analysis of Nonpracticing Entities, 110 COLUM. L. REV. 114, 116 (2010).
3. That is possible because, unlike most IP rights, there is no requirement that the defendant copy the invention from the plaintiff, and indeed the vast majority of patent suits are filed against defendants who independently devel-oped the technology rather than copying it. See Christopher A. Cotropia & Mark A. Lemley, Copying in Patent Law, 87 N.C. L. REV. 1421, 1423 (2009) (“Patent law is virtually alone in intellectual property (“IP”) in punishing independent development.”).
4. James Bessen & Michael J. Meurer, The Direct Costs from NPE Dis-putes, 99 CORNELL L. REV. 387, 389 (2014) (estimating that the direct, accrued cost of NPE patent assertions totaled $29 billion in 2011); Mark A. Lemley et al., The Patent Enforcement Iceberg, 97 TEX. L. REV. (forthcoming 2019) (esti-mating that the total cost of patent assertions to assertion recipients in 2015 was between $77.7 billion and $122.2 billion). For a criticism of the Bessen study, see David L. Schwartz & Jay P. Kesan, Analyzing the Role of Non-Prac-ticing Entities in the Patent System, 99 CORNELL L. REV. 425 (2014); see also Christopher A. Cotropia et al., Unpacking Patent Assertion Entities, 99 MINN. L. REV. 649, 650–52 (2014). For an analysis that covers the total social cost of patent trolls, see James E. Bessen et al., The Private and Social Costs of Patent Trolls 20, 32 tbl.3 (Bos. Univ. Sch. of Law, Working Paper No. 11-45, 2011) (es-timating an aggregate cost of patent trolls around $500 billion, where most of this value is social loss, and little is transferred to inventors).
5. James F. McDonough III, Comment, The Myth of the Patent Troll: An

2019] SOUND AND FURY 1795
Which is it? Over the past several years, we have sought to answer this question. We began by modeling as a matter of eco-nomic theory the circumstances under which patent enforcement contributes to society.6 We then conducted a pilot survey, asking IP licensing lawyers at companies about their experiences with patent enforcement and the effects of patent licensing demands on subsequent innovation.7 The results were not encouraging; very few patent licensing demands seemed to be associated with any indicia of innovation or legitimate technology transfer.8 But the pilot study was also preliminary, and may well have been skewed by the focus on professionals who deal with patent law-suits licensing demands on a daily basis.
In this paper, we turn that pilot study into a full analysis of the effect of patent licensing demands on the economy. With the help of a National Science Foundation grant and experts in sur-vey design, we sent our survey out to every US-based business with at least one employee and revenue of $1 million or more—over 45,000 companies. Our results provide important insights into the nature and limits of patent licensing demands and their role (or lack thereof) in driving innovation.
First, our full survey of U.S. businesses validates and ex-tends our initial result that NPE licensing demands almost never lead to innovation by the target firm. None of the indicia we would expect of real technology transfer were common in pa-tent licensing demands. Moreover, NPE demands were particu-larly unlikely to be accompanied by the sharing of know-how or employees, the creation of joint ventures, or the development of new products.
Second, NPEs do not seem to be a monolithic group. The re-sults for certain types of NPEs were more promising. Federal labs that assert patents are the group most likely to transfer knowledge or drive new products when they license patents. In-terestingly, those labs are the ones that depend least on patents
Alternative View of the Function of Patent Dealers in an Idea Economy, 56 EMORY L.J. 189, 190 (2006); Michael Risch, Patent Troll Myths, 42 SETON HALL
L. REV. 457, 459 (2012); see also Shrestha, supra note 2, at 115–16.
6. See generally Mark A. Lemley & Robin Feldman, Patent Licensing, Technology Transfer, and Innovation, 106 AM. ECON. REV. 188 (2016) [herein-after Lemley & Feldman, Patent Licensing]; see also Mark A. Lemley & Robin C. Feldman, Essay, Is Patent Enforcement Efficient?, 98 B.U. L. REV. 649, 651
(2018) [hereinafter Lemley & Feldman, Efficient].
7. See generally Robin Feldman & Mark A. Lemley, Do Patent Licensing Demands Mean Innovation?, 101 IOWA L. REV. 137 (2015).
8. Id. at 139.

1796 MINNESOTA LAW REVIEW [103:1793
themselves as drivers of licensing.9 The results for universities are more mixed. University patent demands are more likely to drive innovation than demands by other sorts of NPEs, but most of them still don’t involve any indicia of technology transfer. That is consistent with the hybrid role university patenting plays. Sometimes university patents are in fact responsible for spinning new technologies out to the private sector. But at other times universities act as patent trolls, not disseminating new in-ventions but merely suing those who develop those inventions independently.10
Third, our results confirm prior literature finding that the patent system works differently in different industries.11 Patent licensing demands almost never result in technology transfer or new innovation in the computer industry, particularly when NPEs are doing the asserting. They are somewhat more likely to
9. Adam B. Jaffe & Josh Lerner, Reinventing Public R&D: Patent Policy and the Commercialization of National Laboratory Technologies, 32 RAND J. ECON. 167, 168 (2001); see Albert N. Link et al., Public Science and Public In-novation: Assessing the Relationship Between Patenting at U.S. National Labor-atories and the Bayh-Dole Act, 40 RES. POL’Y 1094, 1095 (2011) (explaining that research universities are more market focused and driven to commercialize in-tellectual property than national labs).
10. Mark A. Lemley, Are Universities Patent Trolls?, 18 FORDHAM INTELL. PROP. MEDIA & ENT. L.J. 611, 611 (2008).
11. DAN L. BURK & MARK A. LEMLEY, THE PATENT CRISIS AND HOW THE
COURTS CAN SOLVE IT 37–65 (2009) [hereinafter BURK & LEMLEY]; WILLIAM M. LANDES & RICHARD A. POSNER, THE ECONOMIC STRUCTURE OF INTELLECTUAL
PROPERTY LAW 316 (2003) (discussing that the drug industry provides the strongest case for patents in their present form); Dan L. Burk & Mark A. Lem-ley, Is Patent Law Technology-Specific?, 17 BERKELEY TECH. L.J. 1155, 1156 (2002) (determining that our seemingly unitary patent system actually varies by industry); Dan L. Burk & Mark A. Lemley, Policy Levers in Patent Law, 89 VA. L. REV. 1575, 1577 (2003) (finding that technology “displays highly diverse characteristics across different sectors” and that the patent system operates dif-ferently in these industries); Alan Devlin, Patent Law’s Parsimony Principle, 25 BERKELEY TECH. L.J. 1693, 1694–95 (2010); Stuart J.H. Graham et al., High Technology Entrepreneurs and the Patent System: Results of the 2008 Berkeley Patent Survey, 24 BERKELEY TECH. L.J. 1255, 1326 (2009); Amy Kapczynski et al., Addressing Global Health Inequities: An Open Licensing Approach for Uni-versity Innovations, 20 BERKELEY TECH. L.J. 1031, 1044–45 (2005) (“Many who accept [the notion that strong patent protection reduces social welfare] nonethe-less consider the pharmaceutical sector an exception.”); Lisa Larrimore Ouelette, How Many Patents Does It Take To Make a Drug? Follow-On Phar-maceutical Patents and University Licensing, 17 MICH. TELECOMM. TECH. L. REV. 299, 300 (2010) (“The pharmaceutical industry is the poster child for a strong patent system.”); Carl Shapiro, Navigating the Patent Thicket: Cross Li-censes, Patent Pools, and Standard Setting, 1 INNOVATION POL’Y & ECON. 119, 119 (2000); Ted Sichelman, Purging Patent Law of “Private Law” Remedies, 92 TEX. L. REV. 517, 523–25 (2014).

2019] SOUND AND FURY 1797
be productive in the life sciences, but the industry variation we observe doesn’t map neatly to the traditional life sciences versus computer divide that has dominated the last decades of patent reform debates.12 Instead, it is areas like energy that see the most new products resulting from patent assertions. That sug-gests both that patent policy experts need to acknowledge the reality of industry differences, and that we need to look beyond the one-dimensional debate between computer and life sciences firms, just as we need to look beyond the single dimension of op-erating companies versus NPEs.
Fourth, when we asked firms about the licensing of their own patents rather than licensing patents from others, we got a somewhat different story. Companies think their own patents drive innovation by others somewhat more than they think oth-ers’ patents drive their own innovation. While it is possible that the firms we surveyed happened to transfer a lot of technology out with their patents while taking in very little from other firms’ patents, we suspect that the survey responses show some bias. This could be bias in either direction. The data doesn’t tell us, though we think the most likely explanation is optimism bias: patentees think they are generating more innovation than licensees think they are, and licensees in turn think their own contributions are more important. Whichever way the skew cuts, this result also helps explain the very different perceptions of the patent system by patentees and defendants. They really do seem to see their contributions to the world differently.
Finally, and perhaps most important in the long run, a sig-nificant majority of respondents simply didn’t face patent licens-ing demands at all. It is true that those companies may be smaller and less innovative than the ones that do face licensing demands. But given the raging debates over the patent system and its role in driving the economy, it is important to recognize
12. See, e.g., BURK & LEMLEY, supra note 11, at 38–41; Dan L. Burk & Mark A. Lemley, Biotechnology’s Uncertainty Principle, 54 CASE W. RES. L. REV. 691, 706 (2004) (juxtaposing biotechnology and information technology (IT) patent cases); Graham et al., supra note 11, at 1268 (“Given the extensive writing, opinion, and theory about the differences in innovation and patenting charac-teristics between the life sciences and information technologies firms, we fo-cused primarily on companies in the biotechnology and software industries.”); Sichelman, supra note 11, at 523–24 (noting that while “the costs of invention and commercialization in the software industry are far below those in the phar-maceutical industry,” the “duration of software and pharmaceutical patents are exactly the same” and “the scope of software patents often exceeds the scope of pharmaceutical patents”).

1798 MINNESOTA LAW REVIEW [103:1793
that there are large swaths of American businesses that simply don’t deal with patent licensing demands at all.
To be clear, nothing in our data suggests that the patent system as a whole doesn’t matter or isn’t working. Patent acqui-sition and patent licensing remain important parts of the inno-vation ecosystem. And patent enforcement too can promote in-novation by giving operating companies exclusivity. But our study does belie claims that the patent enforcement system is it-self a driver of innovation. It isn’t.
In Part I we discuss the debate over the role of NPEs and prior work on patent enforcement by NPEs. In Part II we explain our methodology. We present our results in Part III and discuss some implications of those results in Part IV.
I. PATENT ENFORCEMENT AND INNOVATION
A. THE DEBATE OVER NPES13
The role of NPEs (aka patent trolls or “patent assertion en-tities” (PAEs)) is central to the debate over patent reform.14 Roughly half of the patent suits filed in the last few years have been filed by trolls.15 In some industries, notably computers and telecommunications, the percentage is much higher.16 NPEs are
13. Portions of Part I.A are adapted from our pilot study.
14. See, e.g., Mark A. Lemley & A. Douglas Melamed, Missing the Forest for the Trolls, 113 COLUM. L. REV. 2117, 2118–21 (2013).
15. See, e.g., Cotropia et al., supra note 4, at 651–52; Sara Jeruss, Robin Feldman & Joshua Walker, The America Invents Act 500: Effects of Patent Mon-etization Entities on US Litigation, 11 DUKE L. & TECH. REV. 357, 361 (2013). See generally Colleen Chien, Patent Trolls by the Numbers (Santa Clara Univ. Legal Studies Research, Working Paper No. 08-13, 2013). The measurement is complicated not only by different definitions of patent trolls, but by the fact that until September of 2011 a party could file suit against multiple defendants in a single case. Patent trolls tend to sue far more defendants than practicing enti-ties, often suing dozens at the same time. So, studies before 2011 of lawsuits filed—as opposed to the number of defendants sued—produced a misleadingly low measure of troll activity. Cotropia, Kesan, and Schwartz, using a restrictive definition of a patent troll, still find that roughly half of the assertions in both 2010 and 2012 were made by NPEs, though in 2010 many of those assertions were bundled into a single suit. Cotropia et al., supra note 4, at 655, 662, 687, 692–96.
16. See, e.g., John R. Allison et al., Patent Quality and Settlement Among Repeat Patent Litigants, 99 GEO. L.J. 677, 691–92 (2011). Allison, Lemley, and Schwartz completed a comprehensive study of how case outcomes differ between trolls and practicing entities. See generally John R. Allison, Mark A. Lemley & David L. Schwartz, How Often Do Non-Practicing Entities Win Patent Suits?, 32 BERKELEY TECH. L.J. 237 (2017).

2019] SOUND AND FURY 1799
controversial because they do not make products themselves.17 As a result, patent enforcement by NPEs represents a tax on in-novation because they file costly lawsuits and obtain substantial settlements from other innovative companies.18 Courts, Con-gress, and private organizations have sought to cut back on prob-lematic lawsuits by NPEs.19 Many of these efforts have been driven by concerns about the harm to innovation done by patent trolls.20
We know that actual technology transfer happens within the patent system in the ex ante context.21 Both practicing enti-ties and some NPEs engage in ex ante technology transfer. In particular, universities and inventors create alliances with com-panies that can more easily develop and commercialize their in-ventions through joint ventures and other types of technology and research sharing agreements.22 These agreements fre-quently occur before a patent issues or even before any of the parties file for a patent.23 Notably, these agreements involve technology transfer.24 Universities and other inventors in these deals provide new technology to those in a position to implement
17. See, e.g., Cotropia, supra note 4, at 651.
18. See, e.g., JAMES BESSEN & MICHAEL J. MEURER, PATENT FAILURE: HOW
JUDGES, BUREAUCRATS, AND LAWYERS PUT INNOVATORS AT RISK 144–47 (2008); FED. TRADE COMM’N, THE EVOLVING IP MARKETPLACE: ALIGNING PATENT NO-
TICE AND REMEDIES WITH COMPETITION 53 (2011); Tom Ewing & Robin Feld-man, The Giants Among Us, 2012 STAN. TECH. L. REV. 1, 25, 41 (2012); Charles Duhigg & Steve Lohr, The Patent, Used as a Sword, N.Y. TIMES (Oct. 7, 2012), https://www.nytimes.com/2012/10/08/technology/patent-wars-among-tech -giants-can-stifle-competition.html; Ashby Jones, Patent ‘Troll’ Tactics Spread, WALL STREET J. (July 8, 2012), http://online.wsj.com/article/SB1000142405270 2303292204577514782932390996.html; This American Life: When Patents At-tack!, WBEZ (July 22, 2011), https://www.thisamericanlife.org/441/when -patents-attack.
19. See, e.g., Leahy–Smith America Invents Act, Pub. L. No. 112-29, 125 Stat. 284 (2011) (codified as amended in scattered sections of 35 U.S.C.); Saving High-Tech Innovators from Egregious Legal Disputes Act of 2013, H.R. 845, 113th Cong. (2013).
20. See H.R. 845.
21. ASHISH ARORA, ANDREA FOSFURI & ALFONSO GAMBARDELLA, MARKETS
FOR TECHNOLOGY: THE ECONOMICS OF INNOVATION AND CORPORATE STRATEGY 116–17 (2001). See generally Colleen V. Chien, Software Patents as a Currency, Not Tax, on Innovation, 31 BERKELEY TECH. L.J. 1669 (2016) (documenting technology transfer in many software licenses, but also a large number of soft-ware patent licenses without technology transfer). For a discussion of what we mean by ex ante versus ex post licensing activity, see infra note 102 and accom-panying text.
22. Feldman & Lemley, supra note 7, at 155–56.
23. Id. at 139.
24. Id. at 155–56.
1800 MINNESOTA LAW REVIEW [103:1793
it.25 And that technology often includes trade secrets and know-how beyond the to-be-patented technology itself.26 Further, tech-nology transfer can occur informally, by the communication of information at scientific conferences, through journal articles, and even though commitments to open sharing of patented tech-nologies.27
Patent litigation and licensing demands for existing pa-tents, by contrast, tend to occur well after the defendant has de-veloped and implemented the technology. This is particularly true of NPE patent assertions and licensing demands, which some evidence suggests tend to happen in the last few years of a patent’s life or even after they expire.28 NPE licensing demands and litigation against companies that are producing products do not seem to involve technology transfer or other indicia of new innovation. Indeed, evidence suggests NPEs may buy patents with vaguely worded claims that are optimized for litigation but lacking in technical merit29 and that they may delay licensing of patents to increase revenue by targeting successful implement-ers after the fact.30
25. Id.
26. Id. at 155 n.40.
27. See generally Colleen V. Chien, Opening the Patent System: Diffusion-ary Levers in Patent Law, 89 S. CAL. L. REV. 793 (2016) (discussing ways patents can help diffuse knowledge).
28. See, e.g., Brian J. Love, An Empirical Study of Patent Litigation Tim-ing: Could a Patent Term Reduction Decimate Trolls Without Harming Innova-tors?, 161 U. PA. L. REV. 1309, 1312, 1355 (2013) (“NPEs . . . assert[ ] their pa-tents relatively late in the patent term and frequently continue to litigate their patents to expiration.”). But see Robin Feldman et al., The AIA 500 Expanded: The Effects of Patent Monetization Entities, 17 UCLA J.L. & TECH. 1, 8–9 (2013) (finding from litigation data that newer patents were asserted more frequently and that NPEs were more willing to assert patents of any age, and suggesting that studies showing NPEs asserting relatively late in a patent’s life may reflect historic changes during the time frame of the studies). Love agrees that his find-ings “could be inflated by the fact that fewer NPEs existed during the 1990s and early 2000s when, perhaps, they might have enforced younger patents.” Love, supra, at 1355.
29. See Josh Feng & Xavier Jaravel, Crafting Intellectual Property Rights: Implications for Patent Assertion Entities, Litigation, and Innovation 1, 24–31 (Dec. 11, 2018) (unpublished paper), https://papers.ssrn.com/sol3/papers.cfm? abstract_id=2838017.
30. See Erik Hovenkamp & Jonathan Masur, How Patent Damages Skew Licensing Markets, 36 REV. LITIG. 379, 405 (2017). For thoughts on how to break the “vicious cycle of excessive, socially harmful remedies,” see William F. Lee & A. Douglas Melamed, Breaking the Vicious Cycle of Patent Damages, 101 COR-
NELL L. REV. 385, 385 (2016).

2019] SOUND AND FURY 1801
Patent trolls may be collecting payments on patents that are invalid or not infringed.31 Given the economics of patent litiga-tion, a rational company may choose to pay a “nuisance-value settlement” and thereby avoid the costs and risks of a lawsuit.32 The patent in that case is not benefitting society at all but rather serving as a drag on innovation.33 While that nuisance-value set-tlement model is clearly socially unproductive, it is also reason-able to worry that patent enforcement itself is socially costly. Without some benefit in the form of innovation or technology transfer, patent enforcement by NPEs seems like a pure cost to society— one that runs to the tens of billions of dollars per year.34
Operating companies, by contrast, generally disseminate in-novations directly. The traditional justification for patent en-forcement—that enforcement increases the return to patented goods by restricting competition, and therefore gives more incen-tive to innovate—can work for those companies. Whether it works, and under what circumstances, is an empirical question beyond the scope of this paper. Our point is only that operating companies, unlike NPEs, don’t need to engage in technology transfer to licensees to disseminate innovations; they do so di-rectly by selling products. The traditional justifications for pa-tents have operating companies in mind.
Defenders of patent trolls argue that they can serve as busi-ness intermediaries between inventors and commercializers.35
31. See Lemley & Melamed, supra note 14, at 2126 (describing patent trolls that generate significant revenue by licensing patents with little or no actual litigation).
32. Robin Feldman, Intellectual Property Wrongs, 18 STAN. J.L. BUS. & FIN. 250 (2013) (describing the phenomenon and exploring case studies); Lemley & Melamed, supra note 14, at 2124 (noting the prevalence of this model).
33. See Feldman & Lemley, supra note 7, at 1 (discussing the tax that pa-tent trolls exact on innovation as a result of forcing companies to license patents without providing any technical knowledge with the patent or license).
34. Supra note 4.
35. Jennifer Kahaulelio Gregory, Comment, The Troll Next Door, 6 J. MAR-
SHALL REV. INTELL. PROP. L. 292, 306–09 (2007); Gerard N. Magliocca, Black-berries and Barnyards: Patent Trolls and the Perils of Innovation, 82 NOTRE
DAME L. REV. 1809, 1818 (2007); McDonough, supra note 5, at 190; Kristen Osenga, Formerly Manufacturing Entities: Piercing the “Patent Troll” Rhetoric, 47 CONN. L. REV. 435, 451 (2014); Shrestha, supra note 2, at 118; see also Ashish Arora & Robert P. Merges, Specialized Supply Firms, Property Rights and Firm Boundaries, 13 INDUS. & CORP. CHANGE 451, 470–72 (2004); Robert P. Merges, A Transactional View of Property Rights, 20 BERKELEY TECH. L.J. 1477, 1519–20 (2005). For discussion of this patent market idea, see, for exam-ple, Stéphanie Chuffart-Finsterwald, Patent Markets: An Opportunity for Tech-nology Diffusion and FRAND Licensing?, 18 MARQ. INTELL. PROP. L. REV. 335 (2014) (analyzing legal opportunities presented by patent markets that enable

1802 MINNESOTA LAW REVIEW [103:1793
The traditional theory of the patent system posits that patents encourage innovation by allowing inventors to exclude competi-tors from the market, thereby earning supracompetitive returns and recouping investment.36 A number of scholars have argued, however, that the patent system can encourage commercializa-tion of inventions by allowing the inventor to control who can develop the technology.37 And if the inventor is not in a position to commercialize the invention at all, in theory, patents can serve as a mechanism that allows the inventor to provide her new idea to someone who can make use of it. On this theory, pa-tent trolls can serve an intermediation function, helping to de-liver good ideas to companies who can put them to good use.38 One can think of this as the efficient middleman hypothesis—NPEs are making a market for transactions in patents, and
technology diffusion); Andrei Hagiu & David B. Yoffie, The New Patent Inter-mediaries: Platforms, Defensive Aggregators, and Super-Aggregators, 27 J. ECON. PERSP. 45, 53–56 (2013); Ryan T. Holte, Trolls or Great Inventors: Case Studies of Patent Assertion Entities, 59 ST. LOUIS U. L.J. 1 (2014); Michael Risch, Licensing Acquired Patents, 21 GEO. MASON L. REV. 979 (2014) (discuss-ing how “patent licensing might aid commercialization”).
36. See, e.g., LANDES & POSNER, supra note 11, at 319–26; Mark A. Lemley, The Economics of Improvement in Intellectual Property Law, 75 TEX. L. REV. 989, 993–96 (1997).
37. Michael Abramowicz, The Danger of Underdeveloped Patent Prospects, 92 CORNELL L. REV. 1065, 1067–69 (2007); accord Michael Abramowicz & John F. Duffy, Intellectual Property for Market Experimentation, 83 N.Y.U. L. REV. 337, 398–404 (2008); F. Scott Kieff, Property Rights and Property Rules for Com-mercializing Inventions, 85 MINN. L. REV. 697, 707–12 (2001); Ted Sichelman, Commercializing Patents, 62 STAN. L. REV. 341, 345 (2010).
38. Daniel A. Crane, Intellectual Liability, 88 TEX. L. REV. 253, 286–87 (2009) (“Troll defenders counter that trolls are socially useful intermediar-ies between small inventors and commercialization. Small inventors may not have the resources to engage in detecting infringers, licensing negotiations, or patent infringement lawsuits against infringers. By buying up patents from small inventors, trolls may ‘spur innovation by investing in undercapitalized projects and reducing transaction costs for small inventors who are routinely robbed by large corporations.’”); Daniel F. Spulber, Intellectual Property and the Theory of the Firm, in PERSPECTIVES ON COMMERCIALIZING INNOVATION 9, 31 (F. Scott Kieff & Troy A. Paredes eds., 2012) (“Specialized intermediaries began to create a market for patented technologies in the late 19th and early 20th century . . . . This important development ‘facilitated the emergence of a group of highly specialized and productive inventors by making it possible for them to transfer to others responsibility for developing and commercializing their in-ventions.’”); B. Zorina Khan, Trolls and Other Patent Inventions: Economic His-tory and the Patent Controversy in the Twenty-First Century, 21 GEO. MASON L. REV. 825, 832 (2014) (“Specialized intermediaries are especially valuable in new or emerging markets and in instances in which asymmetries of information and other transaction costs are significant.”).

2019] SOUND AND FURY 1803
those patents help the world when they are put in productive hands.39
For this theory to work, however, patent trolls must actually facilitate the use of the patented inventions by companies who were not otherwise using them. A patent market isn’t a good thing in and of itself. It is desirable only if it promotes innovation or technology transfer.40 Our study attempts to examine whether the activity of patent trolls does facilitate the development or use of new technology by licensees. As described below, the results are not encouraging.41
If patent trolls do not operate as efficient middlemen, trans-ferring new technology, perhaps they are serving the social good as tax collectors for small inventors whose ideas have been ap-propriated. Under this theory, the patent holder has properly contributed to learning and dissemination by publishing its ideas in the form of a patent, and the product company has simply taken the idea from the patent’s disclosure. The patent troll, therefore, would be operating as a tax collector to facilitate the transfer of an appropriate payment to the person who gave the idea to the world.
Several factors cast doubt on the appropriate payment the-ory, however. First, much of the patent troll activity occurs in fast-moving technologies such as computers and telecommunica-tions, where the patent is often on a technology that bears little resemblance to the defendant’s product.42 In these circum-stances, the patent troll asserts that the patent covers any means of solving a problem, even if the defendant’s implementa-tion looks nothing like the patentee’s original idea.43 The dis-tance between the patent disclosures in these cases and the ac-cused product makes it unlikely that the company making the product learned the idea from the patent’s disclosure. That delay
39. Mark A. Lemley & Nathan Myhrvold, How to Make a Patent Market, 36 HOFSTRA L. REV. 257, 258–59 (2007).
A separate argument is that patents serve as a currency, allowing other-wise-intangible ideas to have a realizable transaction value. See Chien, supra note 21; Mark A. Lemley, The Surprising Resilience of the Patent System, 95 TEX. L. REV. 1, 40–41 (2016). But for that to be true, there must be some under-lying technology transfer for which the patent serves as a marker.
40. Michael J. Burstein, Patent Markets: A Framework for Evaluation, 47 ARIZ. ST. L.J. 507, 514–20 (2015).
41. See infra Part III.
42. See, e.g., Mark A. Lemley, Software Patents and the Return of Func-tional Claiming, 2013 WIS. L. REV. 905, 907–08 (2013).
43. Id.

1804 MINNESOTA LAW REVIEW [103:1793
tends to be even greater when the patent is first sold to an NPE and then asserted.44 The hypothesis also assumes a level of qual-ity in patents and adequacy of patent disclosure that is generally not attributed to the modern patent system by scholars and com-mentators.45 Finally, the evidence suggests that the overwhelm-ing majority of patent cases do not involve alleged copying, but rather independent invention.46 If the parties taking patent li-censes are doing so to avoid being sued on technology they them-selves developed independently, the tax the patent system is im-posing is a tax on one set of inventors (those who actually put their inventions to good use) for the benefit of another set of in-ventors (those who did not). That is hard to justify.47
44. Love, supra note 28, at 1331.
45. See, e.g., U.S. Gov’t Accountability Office, GAO-13-465, Intellectual Property: Assessing Factors That Affect Patent Infringement Litigation Could Help Improve Patent Quality 45(2013); Colleen V. Chien, Contextualizing Pa-tent Disclosure, 69 Vand. L. Rev. 1849 (2016); Jeanne C. Fromer, Patent Disclo-sure, 94 Iowa L. Rev. 539 (2009) (arguing that patent disclosures of the modern patent system are underperforming); Timothy R. Holbrook, Possession in Patent Law, 59 SMU L. Rev. 123 (2006) (arguing that disclosures in patents do not serve the teaching function well); Mark A. Lemley, Rational Ignorance at the Patent Office, 95 Nw. U. L. Rev. 1495, 1500–01 (2001); Sean B. Seymore, The Teaching Function of Patents, 85 Notre Dame L. Rev. 621 (2010) (arguing that patents rarely communicate knowledge or technical information); cf. Brian T. Yeh, Cong. Research Serv., R42668, An Overview of the “Patent Trolls” Debate 9 (2013) (describing why “it is economically infeasible or irrational for [parties] to search through existing patents to avoid infringement”); Robin Feldman, Re-thinking Patent Law 52–53 (2012) (describing limitations of disclosure in the modern patent system).
46. There is no independent invention defense in patent law, and the vast majority of patent lawsuits are filed not against those accused of copying the invention from the patentee but against other inventors who came up with the same idea independently. See, e.g., Cotropia & Lemley, supra note 3, at 1424 (finding that allegations of copying are quite rare in patent cases).
47. If independent invention is widespread, it may suggest that the bar for obviousness is set too low within the patent system. In other words, if others can develop an idea without the benefit of the inventor’s wisdom, perhaps we are not seeing wisdom but rather an advance that is obvious to those in the art. Cf. Tun-Jen Chiang, A Cost-Benefit Approach to Patent Obviousness, 82 SAINT
JOHN’S L. REV. 39, 94–96 (2008) (noting that the Federal Circuit has looked disfavorably upon the idea that independent invention is relevant to an obvi-ousness determination); Mark A. Lemley, Should Patent Infringement Re-quire Proof of Copying?, 105 MICH. L. REV. 1525, 1534–35 (2007) (arguing that evidence of independent invention should be a factor pointing toward obvious-ness). Courts in a prior era had given more credence to this evidence. See, e.g., Concrete Appliances Co. v. Gomery, 269 U.S. 177, 185 (1925) (stating that independent inventions “within a comparatively short space of time . . . are in themselves persuasive evidence that this use . . . was the product only of ordi-nary mechanical or engineering skill”).

2019] SOUND AND FURY 1805
Under these circumstances, patent licensing does not bene-fit society by encouraging learning or dissemination of the pa-tentee’s invention. The dissemination of that technology was al-ready happening, no thanks to the patentee; the patent troll is just collecting a tax from people who not only came up with the idea on their own,48 but actually put the invention into practice.
One could argue that in its tax collector role, patent trolls are at least returning dollars to original inventors, thereby en-couraging innovation by facilitating the rewards that the patent system promises to those who invent and disclose.49 In the ab-sence of technology transfer, however, it is reasonable to ques-tion how much society wants to invest in moving money from one independent inventor to another. Further, studies suggest that such rewards are not flowing. In what economists are calling the “leaky bucket,” only an estimated twenty percent of the pay-ments to NPEs get back to the original inventor or into internal research and development by the NPE.50 And there is some evi-dence that the prospect of later patent licenses is not what moti-vates many inventors, particularly in universities.51
As we discuss elsewhere, patentees can benefit society in several possible ways: by making innovative products, by selling or licensing the new knowledge to those who do, by sharing that knowledge freely with those who learn from it, or even if others illegally copy the invention from them.52 But patent enforcement by NPEs against independent inventors (as opposed to those who copied from the patent owner) doesn’t achieve any of those goals
48. Some independent invention occurs after the patentee invents, but before the patent has issued. Other independent invention occurs even before the pa-tentee invents, but it may not bar the later inventor from patenting if the first inventor kept the idea secret. See, e.g., ROBERT PATRICK MERGES & JOHN FITZ-
GERALD DUFFY, PATENT LAW AND POLICY: CASES AND MATERIALS 507–11 (6th ed. 2013).
49. Trolls may be intermediaries in this very different sense—not transmit-ting new technology to licensees and defendants, but facilitating suit by indi-viduals or small companies who could not otherwise afford to sue. See, e.g., Ste-phen H. Haber & Seth H. Werfel, Patent Trolls as Financial Intermediaries? Experimental Evidence, 149 ECON. LETTERS 64 (2016) (finding evidence in con-trolled experiments to support this hypothesis).
50. See Bessen & Meurer, supra note 4, at 411; Fiona M. Scott Morton & Carl Shapiro, Strategic Patent Acquisitions, 79 ANTITRUST L.J. 463, 482–83 (2014). For challenges to this evidence, see Schwartz & Kesan, supra note 4.
51. See, e.g., Brian J. Love, Do University Patents Pay Off? Evidence from a Survey of University Inventors in Computer Science and Electrical Engineering, 16 YALE J.L. & TECH. 285, 286 (2014).
52. Lemley & Feldman, Patent Licensing, supra note 6, at 191; Lemley & Feldman, Efficient, supra note 6, at 649.

1806 MINNESOTA LAW REVIEW [103:1793
directly. If patent trolls are also not returning much to original inventors, it will be particularly important to see if their enforce-ment activity is leading to innovation by licensees. Otherwise, all this patent assertion and licensing activity may simply be a tax on current productivity with relatively little return to the in-novation ecosystem.
B. EVIDENCE SO FAR; OUR PILOT STUDY
In prior work we provided the first survey evidence of the direct measure of new product creation resulting from patent as-sertions by NPEs.53 We also tested commercialization effects by measuring other markers of potential innovation, such as tech-nology transfer beyond the patent.54 By including such markers, we create a more dynamic picture of the potential for future com-mercialization, even if that commercialization has yet to occur.
While some have argued that NPEs serve as efficient mid-dlemen—transferring inventions from creators to commercializ-ers—we found no such evidence in our 2015 study.55 We sur-veyed 191 in-house licensing attorneys at companies that produce products on the theory that these parties have direct knowledge of whether the company implemented new technol-ogy and because in-house counsel tend to negotiate licenses both as patent holders and as potential licensees.56 The survey exam-ined the effects of licenses that a company took after receiving a patent demand, which was defined to include calls or letters sug-gesting areas of mutual interest or joint ventures, offering to li-cense patents, threatening litigation, giving notice of intent to file an infringement lawsuit, or actually filing an infringement lawsuit.57 We asked whether those licenses led to any markers of innovation.58 Direct markers of innovation included the addi-tion of new products or features.59 Indirect markers of innovation included whether the patent holder transferred know-how, other technical knowledge, or personnel (including through a consult-ing agreement) along with the patent, and whether any joint
53. Lemley & Feldman, supra note 7.
54. Id.
55. See generally id.
56. Id. at 144–49 (describing methodology of 2015 study).
57. Id. at 149–55.
58. Id. at 155–66.
59. Id. at 160 fig.9, 161 figs.10 & 11.

2019] SOUND AND FURY 1807
ventures were created.60 Again, our survey considered only li-censes taken in response to unsolicited licensing requests.61
It did not look at the practice, particularly among university inventors, of entering into technology transfer agreements be-fore embarking on development of a new technology.62
The responses from our pilot study suggested that licensing requests from NPEs rarely lead to direct or indirect markers of innovation. Ninety-two percent of respondents reported that when they licensed technology from NPEs, they added new prod-ucts or features as a result of that licensing zero to ten percent of the time.63 The results were even stronger when respondents were asked about indirect markers of innovation, with respond-ents reporting with complete unanimity that they rarely re-ceived technical knowledge, transfer of personnel, or joint ven-tures along with a patent license.64 Thus, the results suggest that NPEs do not appear to be playing the role of efficient mid-dlemen. While it is certainly possible that a middleman role could be reflected in some other markers than the ones we exam-ined, we did not find such evidence in our preliminary work. Nor have other studies. To the contrary, Lauren Cohen, Umit Gurun, and Scott Duke Kominers find that NPE patent assertions are associated with less, not more, subsequent innovation by the tar-geted firm.65 And Brian Love, Kent Richardson, Erik Oliver, and Michael Costa find that less than one percent of patent portfolios offered for sale through brokers include any form of know-how or technology beyond the patents themselves.66
Interestingly, the evidence was also dismal when ex post li-censing requests came from those other than traditional NPEs.67 When product producing companies and universities made un-solicited approaches and those approaches resulted in a licens-ing agreement, the agreements were unlikely to lead to direct or
60. Id. at 162 figs.12 & 13, 163 figs.14 & 15, 164 figs.16 & 17, 165 figs.18 & 19, 166 fig.20.
61. Id. at 156.
62. Id.
63. Id. Zero to ten percent was the lowest category offered. See id. at 157 fig.5. We suspect, though we cannot prove, that for almost all of respondents the number was in fact zero.
64. Id. at 157.
65. Lauren Cohen et al., Patent Trolls: Evidence from Targeted Firms 4 (Harvard Bus. Sch., Working Paper No. 15-002, 2018).
66. Brian Love et al., An Empirical Look at the “Brokered” Market for Pa-tents, 83 MO. L. REV. 359, 371 (2018).
67. Feldman & Lemley, supra note 7, at 160.
1808 MINNESOTA LAW REVIEW [103:1793
indirect markers of innovation.68 Roughly three-quarters of re-spondents reported new products or features from zero to ten percent of the time,69 ninety-four percent reported transfers of personnel (including through consulting agreements) zero to ten percent of the time,70 and ninety-one percent reported joint ven-tures from zero to ten percent of the time.71 These observational results suggest that ex post patent licensing demands don’t ap-pear to lead to technology transfer or other markers of innova-tion, no matter what type of party initiates the unsolicited ap-proach.
But as we noted in that study, these results were prelimi-nary and subject to a number of limitations:
But before we conclude that the patent system is not work-ing, or that it is working only for practicing entities that want to exclude their competitors from the market, we should gather more data. Our survey is limited, both in the number of respond-ents and because of its low response rate. There may be other, underrepresented sectors of the economy in which patent-based technology transfer is significant. Or we may have found an un-representative subset of technology companies to survey. Our in-tent is to follow up with a more comprehensive survey in the near future.72
This paper reflects that broader effort.
II. WHAT WE DID
We set out to survey a wide range of American businesses about their experiences with patent assertion and enforcement and its relationship to innovation. We put together a series of questions about their experiences both with licensing demands received from outside and about licensing demands they made of other firms. We made clear that we were interested in patent licensing demands that related to existing products (what we called in the Iowa paper “ex post” licensing demands).73 We wanted to know what sorts of entities sent those requests, and what, if anything, happened as a result. In this Section we dis-cuss how we decided who to contact and how we designed the survey. We present the results in Part III.
68. Id. at 160–62.
69. Id. at 160 fig.9.
70. Id. at 164 fig.16.
71. Id. at 165 fig.18.
72. Id. at 177.
73. See id. at 139.

2019] SOUND AND FURY 1809
A. DATA SOURCES AND PARTNERS
In developing the methodology and carrying out the study, we worked closely with two organizations: the Indiana Univer-sity Center for Survey Research (CSR) and Dun & Bradstreet (D&B).74 We chose to partner with CSR to minimize methodolog-ical limitations encountered in the pilot study, as well as to pre-serve objectivity and confidentiality in data collection. CSR is an academic research facility that has been conducting research projects for over thirty years and is a founding member of the Association of Academic Survey Research Organizations.75 The senior methodologists at CSR have advanced training in quanti-tative and qualitative research methods and many years of ex-perience in survey design, implementation, and analysis.76 Our colleagues at CSR were primarily responsible for sending the survey communications and managing the survey site, pro-cesses, and data.
Our second partner, Dun & Bradstreet, served as the source of our survey sample. Specifically, we used Hoovers Inc., which is a subsidiary of Dun & Bradstreet that offers proprietary busi-ness information.77 Dun & Bradstreet Hoovers (D&B Hoovers) provides a database of over 120 million business records, repre-senting the most comprehensive commercially available reposi-tory for data on U.S. companies.78 We are grateful to the Na-tional Science Foundation (NSF) for funding that allowed us access to this proprietary database and permitted us to work with professional survey experts.
B. SURVEY POPULATION
Working with our colleagues at CSR, the first step we un-dertook was to develop a sampling design to guide selection of companies from the D&B Hoovers database. Our overall aim was to approximate a stratified, random sample of the U.S. business landscape. By consulting with individuals at Dun & Bradstreet,
74. Throughout the article, the Indiana University Center for Survey Re-search will primarily be referred to as “CSR.” Dun & Bradstreet will be identi-fied by its full name in most places, except when discussing its database, which we refer to in most places as the “D&B Hoovers database.”
75. See About: Center for Survey Research, IND. U. BLOOMINGTON, https:// csr.indiana.edu/about (last visited Mar. 11, 2019).
76. See Team: About: Center for Survey Research, IND. U. BLOOMINGTON, https://csr.indiana.edu/about/team/index.html (last visited Mar. 11, 2019).
77. See What Is D&B Hoovers?, D&B HOOVERS, http://hoovers.com/what-is -dnb-hoovers.html (last visited Mar. 11, 2019).
78. See id.

1810 MINNESOTA LAW REVIEW [103:1793
we determined the range of criteria that we could use in building sample lists of companies. Such criteria included industry sec-tors, firm size (by number of employees or revenue), and titles or type of employee.79 We included companies headquartered in the United States with at least one employee and annual sales of $1 million or more. To avoid the problem of including companies with multiple branches more than once, we chose to eliminate branches from our sample. To avoid including both parent com-panies and their subsidiaries, we established that if an identified subsidiary firm had a parent company within the same industry group, then the subsidiary firm would be removed from the sam-ple.80 As for the annual sales criterion of $1 million or greater, we decided relatively early on to exclude extremely small com-panies, as they might not experience much patent licensing ac-tivity and/or be large enough to have in-house counsel available to answer our survey. We were also concerned about the ability of surveyors to find all startups, let alone good contact infor-mation for those startups, which could have made our results unrepresentative. We considered several different exclusion cri-teria, such as the Small Business Association (SBA) definition of a “small business,”81 but we ultimately settled on annual sales of $1 million or greater. The large majority of firms with annual receipts of $1 million or less are likely to be non-employer firms (e.g., self-employed proprietorships) for which it would be ex-tremely difficult to obtain any sort of survey response. By apply-ing this sales minimum, we may be excluding small start-up companies, but we believe that $1 million is low enough of a threshold to capture a representative swath of the U.S. business landscape.82
79. For a full list of data fields available through the D&B Hoovers data-base, see Access Hoover’s Data Descriptions, D&B HOOVERS, http://images .hoovers.com/images/pdfs/Access_Hoovers_Data_Elements.pdf (last visited Mar. 11, 2019).
80. This was a judgment call. There are circumstances in which the subsid-iary might be the better choice. But we were not in a position to evaluate those decisions case-by-case, and we wanted to make sure we didn’t double count re-lated companies.
81. The definition is complicated and industry-specific. See 13 C.F.R. § 121.201 (2018).
82. This too was a judgment call. Arguably $1 million in revenue is too small for many companies to worry very much about the patent system. But startups do face patent threats, and we wanted to err on the side of over-inclu-siveness. For information on patent demands and startup companies, see Col-leen Chien, Startups and Patent Trolls, 17 STAN. TECH. L. REV. 461 (2014); Robin Feldman, Patent Demands & Startup Companies: The View from the Ven-ture Capital Community, 16 YALE J.L. & TECH. 236 (2014).

2019] SOUND AND FURY 1811
We aimed our survey at operating companies. But given this definition, it is possible some of the companies we surveyed are “hidden non-practicing entities” that began by generating prod-ucts or services but failed as businesses and switched to assert-ing patents against other companies as a business strategy. If those hidden NPEs are answering our survey questions hon-estly, however, they will most likely be directed into an ex-tremely abbreviated version of the survey via branching logic. They will not have inbound licensing demands and so will not reach most questions in the survey. The first screener question in the survey asks whether the respondent has received patent licensing demands in the past three years; if the company in question is in fact a hidden NPE, and they are not generating products or services, they are unlikely to receive patent demands and will be screened out of the rest of the survey.83
The next step was to identify the specific industries to in-clude. In the pilot study, we selected eleven industry sectors: Computers & Other Electronics; Semiconductor; Pharmaceuti-cal; Medical Devices, Methods & Other Medical; Biotechnology; Communications; Transportation; Construction; Energy; Goods & Services for Industrial & Business Uses; and Goods & Services for Consumer Uses.84 To ensure an adequate number of compa-nies per industry group in the current study, we chose to consol-idate the industry categories from eleven to five. The five we chose were: Computers & Related Fields (including other elec-tronics, communications, and semiconductors); Life Sciences & Related Fields (including pharmaceutical; biotechnology; and medical devices, methods, or other medical); Transportation; En-ergy; and Chemistry. We then mapped the five industries se-lected onto the more granular industry codes by which compa-nies are sorted in the D&B Hoovers database. Doing so allowed us to more efficiently search for and precisely target companies within the database.85
83. As with any survey, however, there is always a risk that a few respond-ents will answer dishonestly or try to distort the survey results.
84. Feldman & Lemley, supra note 7, at 145.
85. There were two different sets of industry codes that were available to us: the North American Industry Classification System (NAICS) and the Stand-ard Industrial Classification (SIC). SIC codes were four-digit numerical codes assigned to businesses by the U.S. government to identify the primary business of the establishment. See Frequently Asked Questions (FAQs) - NAICS, U.S. CENSUS BUREAU, https://www.census.gov/eos/www/naics/faqs/faqs.html (last updated Sept. 4, 2018); SIC Division Structure, OCCUPATIONAL SAFETY &
HEALTH ADMIN., https://www.osha.gov/pls/imis/sic_manual.html (last visited Mar. 11, 2019) (providing a list of SIC codes for various industries). NAICS was

1812 MINNESOTA LAW REVIEW [103:1793
To guarantee sufficient statistical power, we aimed to get responses from 400 companies per industry. From the pilot study, the pretest, and other research in patent assertion, we knew the difficulties involved in obtaining survey responses from companies.86 Thus, a generous response rate of ten percent would require us to sample at least 4000 companies per indus-try.87 With five industries, the total would be 20,000 companies. We decided to double that number to increase the buffer and en-sure enough responses, resulting in a total sample size of 40,000. Weighted by the number of companies in each industry in the D&B Hoovers database population, 40,000 survey targets broke down into 7272 companies from Computers & Related Fields, 8535 companies from Life Sciences & Related Fields, 18,735 companies from Transportation, 3262 companies from Energy, and 2196 companies from Chemistry.
However, some percentage of the email addresses in the D&B Hoovers database were likely to be outdated or inaccurate, resulting in bounce-backs. Further, D&B Hoovers only has email addresses for some of its company contacts.88 To account for pos-sible bounce-backs, we asked Dun & Bradstreet to increase the strata sizes, resulting in a total of 44,112 companies surveyed. And to account for the companies without email addresses in the D&B Hoovers database, we increased the sample size again, to 92,000 companies.89
adopted in 1997 to replace SIC and is similar in that it serves as a classification of business establishments. Frequently Asked Questions (FAQs) - NAICS, supra. NAICS is the standard used today by federal statistical agencies for collecting, analyzing, and publishing statistical data related to the U.S. business economy. Id. Given that NAICS was adopted more recently, and because U.S. census data is more readily available through NAICS at this point, we chose to use NAICS codes as opposed to SIC codes in identifying industries for our study. A full map-ping of NAICS codes onto our industries of interest is available from the au-thors.
86. See, e.g., Chien, supra note 82, at 470; Robin Feldman & Evan Frondorf, Patent Demands and Initial Public Offerings, 19 STAN. TECH. L. REV. 52, 68
(2015); Feldman, supra note 82, at 259–60; Lemley et al., supra note 4 (manu-script at 4–6).
87. These back-of-the-envelope calculations weren’t indicative of any sur-vey design but rather rough estimates of what we expected to see.
88. The number of companies with at least one email address out of the total 46,851 companies turned out to be 14,835 (or 31.66% of the total). Thus, we could expect only about one third of our sample to have email addresses listed in the D&B Hoovers database.
89. We made sure to request that Dun & Bradstreet not expunge the ap-proximately two-thirds of the companies without emails so that we could at-tempt to contact those companies through non-email means. Specifically, we asked Dun & Bradstreet to provide general firm contact information (e.g., front

2019] SOUND AND FURY 1813
Next, we had to specify which, and how many, individuals within each company should be selected for contact purposes. We established a goal of at least one personnel contact per firm. Many firms, however, have more than one personnel contact; in those cases, we decided to have Dun & Bradstreet deliver all con-tacts available up to a maximum of three per firm.
Within a firm, we believed that those within the legal de-partment of a company, especially patent or intellectual property counsel, would be most qualified to respond to a survey regard-ing patent licensing requests, so we prioritized legal job func-tions in our sampling design. The D&B Hoovers database sorts contacts by job title, such as “General Counsel” or “Chief Execu-tive Officer.”90 There were fourteen relevant job titles within the legal job function group in the database, including “Patent Law,” “Vice-President Legal,” “General Counsel,” and “Legal Execu-tive.”
One option was to have D&B Hoovers sort by companies that have a legal email contact in their database, essentially in-cluding legal job function as another one of the broad search cri-teria along with our location, annual sales, etc. requirements. This would have guaranteed a sample in which every company had a contact in its legal department for us to survey, which would have in turn increased our response rates and the likeli-hood that those answering the survey would be knowledgeable about patent licensing. The problem with this approach was that it would have created significant selection bias. There may be notable differences between the type of company that would
desk phone number and postal addresses) if a company had no email addresses available; this would allow us to supplement our email distribution of the survey by calling and sending mail to a subset of those companies without any emails listed in the D&B Hoovers database.
One limitation to quadrupling the strata sizes and then adding thirty per-cent on top was that it caused us to reach out to a larger percentage of compa-nies in some industries than others to ensure that we had enough positive re-sponses from each of the industries we tested. For example, the D&B Hoovers database only had 17,801 companies available in the life sciences industry (de-fined by our NAICS codes), and we had initially requested 8535. Doubling that initial request would result in 17,070 companies. Adding fifteen percent on top of that would result in approximately 19,630 companies requested from an over-all pool of 17,801 companies. As such, Dun & Bradstreet would have had to give us all of the companies in the life sciences industry, which would eliminate the possibility of pulling a random sample from the overall pool. We determined that the benefits of having a larger pool of companies included in the sample and thus increasing the number of companies with email contacts outweighed the concerns about randomization.
90. See Access Hoover’s Data Descriptions, supra note 79.

1814 MINNESOTA LAW REVIEW [103:1793
have a legal contact listed in the D&B Hoovers database and the type of company that would not, and by selecting for those with legal contacts up front, we could be skewing the data in unknown ways. Instead, we had Dun & Bradstreet search for companies meeting our specified criteria, whether they had a legal contact listed or not, and then provide us with all of those companies resulting from the randomized selection, separated into a file for those with legal contacts and a file for those without legal con-tacts. If a firm had fewer than three legal contacts, we deter-mined that the rest of the contacts should be made up by non-legal contacts. We had initially considered specifying a short list of non-legal job functions to include, such as “Chief Executive Officer” or “Managing Director,” but we ultimately decided to in-clude a broader range of non-legal job functions to increase our yield of potential email contacts. To that end, we had Dun & Bradstreet provide us with a full list of possible job functions, and we simply whittled out the ones that were clearly not worth-while, rather than hand-picking a few high-level, non-legal job functions. The intention was not necessarily to have these non-legal individuals take the survey, but rather to have them for-ward the email to the individual at their company who would be the ideal respondent, whether that person was in the legal de-partment or not.
C. DESIGNING THE SURVEY INSTRUMENT
1. Pretest and Response Analysis
We conducted a small-scale “pretest” before carrying out the full study to allow us to uncover and resolve methodological and execution problems prior to the main data collection period. We chose to limit the pretest to just three industries—Computers & Related Fields, Life Sciences & Related Fields, and Transporta-tion—and we set a target sample size of 3000 for the pretest. The specific strata sizes for the three industries were 632 companies for Computers & Related Fields, 741 for Life Sciences & Related Fields, and 1627 for Transportation. As with the full study sam-ple, we then chose to add fifteen percent on top of those figures to account for email bounce-backs. We then doubled the sample size for the pretest, as we did for the full study sample, to com-pensate for the fact that a significant percentage of the compa-nies listed in the D&B Hoovers database do not have any email contacts listed, resulting in a final sample size of approximately 6900 for the pretest.

2019] SOUND AND FURY 1815
Having already carried out a pilot version of the study, we had an existing questionnaire from which to build on at the start of our study.91 We conducted several iterations of revisions to the questionnaire, addressing issues such as wording, question type, data type, branching logic, visual design and formatting, usabil-ity, and other methodological issues.
After carrying out a first round of edits to our survey ques-tionnaire, we used cognitive testing to ensure the robustness and accuracy of the questionnaire. Cognitive interviewing, using a semi-structured interviewing protocol and special probing tech-niques, is an important method of identifying problems and lim-itations in the design of questionnaires.92 We approached four-teen individuals in the legal departments of companies including Google, Dropbox, LinkedIn, Cisco, and Amneal Pharmaceuticals. Though some of the cognitive interviewees may have been aware of the article published about the pilot study, we had no reason to believe that any of them had previously been exposed to the text of the questionnaire itself. Our colleagues at CSR conducted a total of six cognitive interviews. The cognitive interviews in-volved administering the revised questionnaire to the partici-pants and asking follow-up questions to assess the participants’ thoughts on the questionnaire and possible ways to improve it. The participants were sent the questionnaire in advance, and the follow-up questions were administered over the phone. Based on the feedback obtained through the cognitive inter-views, we made further revisions to the survey.
First, through the cognitive interviews, we learned that we needed to break up the questionnaire into clearly demarcated sections, so that participants would be able to grasp the flow of the questions earlier on in the survey. For the final version, we separated the questions into different sections and began each with a brief explanation describing the nature of that particular section with the hope that this would help respondents under-stand the structure of the questionnaire more easily.
Another common question we received from cognitive inter-viewees was whether we wanted them to provide top-of-the-mind responses or to look up company records in response to questions in our survey asking for percentage estimates. For instance, for
91. The pilot survey questionnaire was published at Feldman & Lemley, supra note 7, at 180–89.
92. For a comprehensive guide to cognitive interviewing techniques, see generally GORDON B. WILLIS, COGNITIVE INTERVIEWING: A TOOL FOR IMPROV-
ING QUESTIONNAIRE DESIGN (2005).

1816 MINNESOTA LAW REVIEW [103:1793
the question, “What percentage of licensing requests from non-practicing entities led your company to take a patent license?” with the options “None,” “1-10%,” “11-25%,” “26-50%,” “51-75%,” “76-99%,” and “All,” the cognitive interviewees expressed uncer-tainty about whether they were simply supposed to provide a best guess or were supposed to consult records to obtain a precise figure. Without specifying, we could encounter a situation in which some respondents were conducting external research while others were simply providing best guesses, which would create inconsistency in the data. We felt that it would be unrea-sonable to ask participants to invest the time and effort required to conduct research and provide answers with 100% certainty, so we revised the questionnaire to make explicit that we simply wanted participants to supply their “best approximation.”93
There were a few other comments that we received from the cognitive interview respondents that led us to change the con-tent of the questionnaire. We shortened the length of time we asked respondents to consider from five years to three. We clar-ified that the term “entities or individuals whose core activity involves licensing or litigating patents” meant “NPE” as that term is commonly used in the intellectual property sphere.94 And we clarified some of the language of the questionnaires.
Finally, many of the cognitive interview respondents noted to our colleagues at CSR that they would not have participated had they not known that the Principal Investigators (PIs) were involved. As such, we took steps to leverage name recognition to induce participation in the survey, such as including a “Note from the Researchers,” signed by both PIs, at the beginning of the survey.
In the pilot study, we had several unusable responses in which the participants began the survey but did not complete it in its entirety. To encourage a higher rate of complete responses and minimize the burden on participants, we streamlined the language of the questions and branching logic of the survey. For example, in the pilot study, we asked about how often patent li-censing requests from other companies led to transfer of tech-nical knowledge, transfer of personnel, and creation of a joint
93. At the beginning of the survey, we included a page stating: “Some ques-tions in this survey ask for frequency counts or percentages. Please feel free to answer simply using your best estimate or approximation.” Infra app. B. As a follow-up, with the first question asking participants to estimate a percentage, we included the language, “Please feel free to answer with your best approxi-mation, here and throughout the survey.” Id.
94. Id.

2019] SOUND AND FURY 1817
venture in three separate questions. For the current study, we compressed those three questions into one question which asked what portion of patent licensing requests “resulted in the oper-ating company transferring technical knowledge, personnel (e.g., through a consulting agreement), or creating a joint venture with your company . . . .”95 Furthermore, the language of the questions and the response options were revised to maximize clarity. In the pilot survey, one response option offered to partic-ipants when asked how often licenses from competitors resulted in new products was “0-10%” of the time.96 We split this response option up into categories of “None” and “1-10%” so that we would be able to distinguish between respondents for which licenses never led to new products and those for which licenses simply led to new products infrequently. We also revised the options offered in response to the question, “What parties initiated these [patent licensing] requests?”97 In the pilot study, the parties included were competitors, product-producing companies that are not competitors, entities or individuals whose core activity involves licensing or litigating patents, universities, and a “[n]ature of the party was unclear” option.98 In the revised survey, we chose not to make a distinction between competitors and non-competitors, compressing the two into a category for “[c]ompanies whose core activity is producing a product or service (i.e., operating compa-nies).” We also added the option “[f]ederal labs, federal facilities, federal research centers, and other federal government sources”99 in response to a request from the Government Ac-countability Office (GAO).
Additionally, we supplemented the questionnaire with a few new question banks. One concerned out-licensing requests, which are circumstances in which the participant’s company holds the patent and it is his/her company that approaches an outside party to request they take a patent license.100
Another branch of questions that was added during our re-vision process concerned the practice of ex ante patent licens-ing.101 As opposed to ex post licensing agreements, which are agreements formed after the technology in question has already
95. Id.
96. Feldman & Lemley, supra note 7, at 181.
97. Infra app. B.
98. Feldman & Lemley, supra note 7, at 180.
99. Infra app. B.
100. Infra app. B.
101. Infra app. B.

1818 MINNESOTA LAW REVIEW [103:1793
been invented and patented, ex ante licensing involves agree-ments that are formed at the beginning of the innovation pro-cess, granting patent rights to a technology that has yet to be invented or is in the process of being invented.102 Though our study is primarily focused on ex post licensing requests, collect-ing information on ex ante agreements allowed us to more fully assess the state of the patent licensing landscape, and how levels of innovation compare between ex ante and ex post situations. This addition was made in response to suggestions gathered dur-ing the NSF peer review process. Within this ex ante licensing question bank, we included two branches: one concerning collab-oration with universities and one concerning collaboration with federal labs or centers, such as Department of Energy national labs, NASA research centers, and NIH centers or institutes.103 The inclusion of questions about federal labs and centers was again prompted by a request from the GAO.
Once the questionnaire was finalized, staff at CSR pro-grammed it as a web survey through Qualtrics. Prior to launch-ing the pretest, we conducted several test runs of the online sur-vey instrument to catch any flaws that might not have been apparent before. We noticed that, in some cases, the email con-taining the link to the survey was directed to the spam or junk folder rather than the inbox. Our colleagues at CSR ran the email through a website that scores emails based on their likeli-hood of being flagged as spam—the email was rated as having a low likelihood of alerting spam filters. Filters for spam and junk mail are largely a black box controlled by proprietary email cli-ents and platforms, so it is impossible to know for sure what might have led our email to be directed into spam folders on oc-casion, but nevertheless, we took steps to reduce the likelihood of this occurring during the actual administration of the survey. For instance, the PIs received several responses to the email campaigns asking for confirmation that the survey that they re-ceived from CSR was legitimate and not a scam. In response, we decided to change the from line of the emails from “Indiana Uni-versity Center for Survey Research” to “Professor Mark Lemley, Stanford Law School,” because we felt that an email sent directly from one of the researchers, especially given his high name recognition in the field, would be less likely to raise unwarranted
102. See Ralph Siebert, What Determines Firms’ Choices Between Ex Ante and Ex Post Licensing Agreements?, 11 J. COMPETITION L. & ECON. 165, 167–69 (2015).
103. Infra app. B.

2019] SOUND AND FURY 1819
suspicion. We also put contact information for both of the PIs in the signature line of the emails. We also modified the language and tone of the emails to err more on the formal as opposed to casual side, with the hope that such language would help create the impression of legitimacy.104 Battling the spam misperception is a concern in any survey research administered by email, and there is only so much one can do to combat it. Given that we received only a handful of responses expressing concern that the email might be spam, out of over 34,000 advance notification emails and over 30,000 survey invitation emails sent out, we be-lieve that spam misperception is an important concern, but not one that would greatly impact our study. This field test also led us to make further minor modifications to the final question-naire.
A final version of the questionnaire can be found in Appen-dix B.
2. Pretest Response Rate and Study Modifications
The overall response rate for the pretest, as well as the per-centage of respondents with patent licensing activity, was lower than expected. Of the approximately 2700 companies contacted by email or phone, we received sixty-four complete survey re-sponses. Of the sixty-four complete responses, only eight compa-nies reported having received patent licensing requests within the past three years. Separate from the phone treatment, CSR also conducted follow-up calls for fifty companies who had been emailed to assess why people might be disinclined to participate. Apart from the general issue of not having enough time, those called cited low topic salience, especially those who came from companies with no patent activity. Respondents had a hard time understanding why they should take a survey about something entirely unrelated to them; this comment from those who were called was reinforced by responses we received to the email cam-paigns. This finding bolsters our hypothesis that the low re-sponse rate in the pretest was largely due to imprecise targeting of the most relevant population, resulting in low topic salience among many of those who were contacted.
Part of the problem was that we cast an extremely wide net to obtain a representative sample of the overall U.S. business landscape, so it was inevitable that for a large percentage of our
104. For instance, various exclamation points were replaced with periods and phrases like “This might be of interest on your Friday afternoon” were re-moved.

1820 MINNESOTA LAW REVIEW [103:1793
individuals, patent licensing would be an irrelevant topic. Addi-tionally, however, the failure to reach those for which the survey would have the highest topic salience was in large part due to problems with the sample supplied by Dun & Bradstreet, as it became clear that their database was lacking in contacts from legal departments. Rather, the large majority of the contacts we received from Dun & Bradstreet were miscellaneous individuals within random departments, who unsurprisingly, had no experi-ence with patent licensing. Of the approximately 2500 contacts supplied for the pretest, only sixty-six were classified by Dun & Bradstreet as legal contacts.105
The dearth of legal contacts was a problem in the main sur-vey sample as well—of the approximately 87,000 companies pro-vided for the main test, only 778 of them came with an email address of a legal individual from the company. Moreover, a sig-nificant number of the companies included were holding or liq-uidating companies. Given that such companies do not tend to be actual product or service generating businesses, they fall out-side the scope of the type of companies we had intended to target.
The pretest revealed other problems with the database as well. In the pretest, the number of email addresses that resulted in bounce-backs was higher than the estimate we were originally given by Dun & Bradstreet. In the pretest, approximately seven-teen percent of the companies emailed (426 of the 2477 compa-nies with email addresses) had a final disposition of bounced, meaning that all email addresses on file for that company had been tried and had bounced back.
Most of the methodological changes we made after the pre-test were aimed at re-directing our contact efforts toward indi-viduals within a company for which patent licensing would be a more salient topic, like those in legal departments. Inevitably, however, we would still be reaching many individuals from com-panies with very little to no patent licensing activity and for which patent licensing is thus a low salience topic. It is im-portant that we receive completed survey responses from those individuals as well, as such counterfactual cases are crucial to confirming or denying our original hypothesis. Although the study materials (emails, website, etc.) we used during the pre-test touched on this issue minimally, we decided to further em-phasize the necessity of participation even for those without pa-tent licensing activities in the full survey rather than risk
105. Of those sixty-six legal individuals contacted, only two completed the survey.

2019] SOUND AND FURY 1821
biasing the results towards those companies that had actually been the target of patent licensing demands.
Of the problems encountered in the pretest, the greater than anticipated number of bounce-backs had the most straightfor-ward solution. We had initially requested that Dun & Bradstreet increase the size of our samples by fifteen percent to account for email bounce-backs. Given that the percentage of bounce-backs was even higher than we had initially been led to believe, falling at approximately seventeen percent for the pretest, we requested that Dun & Bradstreet increase the percentage of additional companies for the main sample from fifteen to twenty percent.106
Given that one of the key problems from the pretest was not targeting the firms and individuals for which the survey would be most relevant with enough precision, we decided to identify a group of companies that we could presume would have a higher likelihood of patent licensing activity, and thus would be more likely to answer the survey. We decided that the primary varia-ble available in the D&B Hoovers database that would be corre-lated with a higher likelihood of patent licensing activity was firm size, with revenue as a proxy for size. Companies with higher revenues are more likely to be engaging in activities that would prompt other entities to request that they take patent li-censes. Moreover, those companies are more likely to be large enough to have a dedicated legal department to deal with patent licensing requests and litigation. We set various revenue bench-marks to separate out this “higher likelihood” subset—addi-tional measures would be targeted to the group with revenues of $25 million or greater, and certain resource-intensive efforts would be reserved for the group with revenues of $100 million or greater.
We also decided to establish an industry-based definition of companies with a higher likelihood of patent licensing activity. Specifically, we believed the Computers and Life Science indus-
106. After asking Dun & Bradstreet to increase the bump in the sample size for bounce-backs from fifteen to twenty percent, the number of companies re-quested in the Life Sciences and Transportation industries was large enough that Dun & Bradstreet provided us with all companies in those industries in its database. The same was almost true of Energy, with Dun & Bradstreet supply-ing 7829 companies out of 7846 available. We discuss the implications of receiv-ing all companies in a particular industry supra note 89. As we decided earlier, when this issue came up with Life Sciences after we decided to add fifteen per-cent and double the strata sizes, the benefits of having a larger sample size outweighed the possible randomization limitations in our view.
1822 MINNESOTA LAW REVIEW [103:1793
tries were the two most likely industries to see strong effects re-lated to patent licensing and innovation (or lack thereof). Thus, given our limited resources, we decided to target certain supple-mentary efforts aimed at increasing response rate at just those two industries.
Our final defining characteristic for companies we would consider to have a “higher likelihood” of having patent licensing activity and answering the survey was companies with a legal contact provided by Dun & Bradstreet. We expected that indi-viduals in legal departments would be most likely to take the survey, given their greater familiarity with the field of patent licensing. Additionally, we believed that those companies that were large enough to have a legal department for which Dun & Bradstreet was able to obtain contact information would be large enough to have experience with patent licensing requests.
One problem from the pretest was identifying those compa-nies for which patent licensing would be most relevant. Another related problem was identifying the individual within those companies for whom patent licensing would be most relevant. Ideally, the person answering the survey would be an intellec-tual property or patent lawyer at a company—the type of person who would have firsthand experience with patent licensing ac-tivities. If such an individual was not available, however, then any individual within the legal department (provided that they were high-ranking enough, and not just an intern or paralegal) would be preferred. If no legal individual was available, then our next priority would be senior management, such as CEOs and high-level managers. Much of our ability to reach the appropri-ate individual, however, was subject to the quality of the data provided by Dun & Bradstreet—if their database was not expan-sive enough to include a legal contact from a particular company, then we were stuck with contacting whatever non-legal individ-ual they did have listed and asking for the legal department.
Rather than rely solely on the Dun & Bradstreet contacts database, we used a variety of methods to find contact infor-mation for persons at the companies in our sample who were in legal departments or otherwise more qualified to take the sur-vey. These methods included having research assistants search for contact information online using LinkedIn, using the online search tool called Hunter to locate email addresses, and having staff at CSR place phone calls to companies. Phone calls and mailed letters are resource-intensive, however, at least com-pared to email communication. Thus, we could not target every

2019] SOUND AND FURY 1823
company included in our study with these supplemental modes of contact. We decided to focus these additional efforts on the “higher likelihood” subset, as we did the research assistant searches and other efforts at obtaining more useful contact in-formation. To be clear, we still surveyed the entire sample we received from Dun & Bradstreet using the email method from the pretest. With this new approach, we simply targeted a rele-vant subset with additional phone and mail communications. That may have increased their response rate compared to other companies, an approach that CSR used design and post-stratifi-cation weights to attempt to correct for.
D. THE FINAL SURVEY
The full survey was launched on May 22, 2017, with the ad-vance notification email going out to over 34,000 companies. The survey invitation email was sent out four days later, on May 25, 2017, to over 30,000 companies (the number is reduced because a certain percentage of the companies who received the advance notification emails bounced back or opted out).
As of June 7, 2017, we had received 414 responses to the survey, with the highest percentage of responses after sending out the survey invitation email and the second reminder email. At that point, we noted that some of the respondents were start-ing to show signs of email fatigue. Thus, we held off on sending the next reminder email to provide a break between campaigns. In the meantime, secondary and tertiary contacts, who were added as replacements to bounced primary contacts, were emailed, as they had yet to receive any additional reminders. Of the 414 responses we had received, seventy had answered “yes” to the preliminary screening question of, “In the last three years, has your company received patent licensing requests?”107
As of July 6, 2017, we had emailed 35,116 companies. At that point, we sent postal nudges to companies in two “higher likelihood” subsets: (1) all companies for which we had a legal contact, regardless of industry and revenue, and (2) Computers and Life Sciences companies with no legal contact, with revenues greater than $25 million, and who had been emailed with no re-sponse. Of those companies who had been sent the postal nudge,
107. As for the other primary questions about patent licensing activities, thirty-eight had answered yes to the question about out-licensing, fifty had an-swered yes to the question about ex ante collaboration with universities, and twenty had answered yes to the question about ex ante collaboration with fed-eral labs or centers.

1824 MINNESOTA LAW REVIEW [103:1793
357 had not been emailed simply because there was no email ad-dress on file. We contacted those companies via telephone to ob-tain an email address so that they could subsequently be sent the email campaigns.
A subsample of those companies that received the postal nudge also then received a phone nudge. The subsample for the phone nudge consisted of two “higher likelihood” subsets: (1) all companies for which we had a legal contact, regardless of indus-try and revenue, and (2) Computers and Life Sciences companies with no legal contact and with revenues greater than $100 mil-lion.
Throughout this process, CSR continued to call companies without an email contact to obtain updated contact information and to ask the screener questions. Companies for which the in-terviewers were able to obtain an email address were then sent the email campaigns unless they answered “no” to all of the screener questions.
As of July 6, 2017, we had received 539 completed responses, 103 of which had answered “yes” to the question, “In the last three years, has your company received any patent licensing re-quests?” We had also received 151 responses through the phone screenings, all of which answered “no” to the screener questions.
On July 10, 2017, to improve response rates further, we de-cided to expand the parameters of the phone nudge to match those of the postal nudge. Previously, we had planned on calling only non-respondent companies with a legal contact and non-re-spondent companies without a legal contact in Computers and Life Sciences with revenues greater than $100 million. We de-cided to lower the revenue criterion for the phone nudges from $100 million to $25 million ($25 million being the revenue crite-rion used for the postal nudges) to increase the scope of our phone contact efforts.
The total survey requests sent out by industry are detailed in Table 1.

2019] SOUND AND FURY 1825
Table 1
Total Contacts Available for Surveying
Industry Requested Strata
Increased by 20%
Doubled
Counts
Based on Availability in Database
Computers 7,272 8,726 17,453 17,453
Life Sciences 8,535 10,242 20,484 13,374
Transportation 18,735 22,482 44,964 42,942
Energy 3,262 3,914 7,829 7,829
Chemistry 2,196 2,635 5,270 5,270
TOTAL: 86,868
Table 2
Count of Units Sampled by Industry and Mode
Industry Total
Sampled for Email
Total
Sampled for Phone
Total Worked
Chemistry 2,580 1,734 4,314
Computer 9,161 1,287 10,448
Energy 3,140 2,802 5,942
Life Science 4,536 2,344 6,880
Transportation 14,910 1,618 16,528
All Industries 34,237 9,785 44,112
During the field period, CSR attempted contact with 44,112 businesses at a contact rate of 17.3%.108
The questionnaire was composed of a set of four preliminary, screener questions meant to gage the level of patent activity at the business followed by up to twenty-eight possible questions in the core questionnaire. Lastly, the questionnaire posed four es-tablishment-level and one respondent-level demographic ques-tions. In addition, an optional prompt for contact information was provided in case the respondent would like to be sent the findings of the study. The overall response rate to the survey as a whole, including the preliminary questions and core question-naire, was 4.5%. Response rate to the core questionnaire by com-panies deemed to be eligible by the screener questions was 100%. While we would have preferred a higher response rate, this is in
108. We sampled 34,327 by email and 9785 by follow-up phone survey.

1826 MINNESOTA LAW REVIEW [103:1793
line with other work using similar designs.109 Further, given the weighting scheme described below,110 it is unlikely the nonre-sponse rate significantly biased the sample in a way that made it unrepresentative of the population of interest.111
The full breakdown of responses to email and phone surveys is reported in Table 3:
Table 3
Survey Disposition Summary Results
Codes Disposition Label Disposition Definition Cases
Eligible, Interview
1.11 Complete screener
(eligible)
Respondent answered at
least one preliminary ques-
tion and screened into core
questionnaire
421
1.12 Complete screener
(ineligible)
Respondent answered all
preliminary questions and
screened out of core ques-
tionnaire
1,297
Eligible, Non-Interview
2.11 Refusal Informant or target re-
spondent refused to partic-
ipate in the survey on be-
half of the company
1,430
2.112 Implicit Refusal Email recipient logged on
to the Qualtrics instru-
ment but did not answer
any questions
25
2.2 Non-contact Direct contact could not be
made with the establish-
ment but the existence of
the listed company was
confirmed
1,218
109. See, e.g., Graham et al., supra note 11, at 1272 (obtaining a 7.0% uncor-rected and 8.4% corrected response rate for their Dun & Bradstreet sample); Lisa Larrimore Ouellette, Who Reads Patents?, 35 NATURE BIOTECHNOLOGY 421, 421 (2017) (reporting a ten percent response rate for industry respondents).
110. See infra Part II.D.
111. Robert M. Groves, Nonresponse Rates and Nonresponse Bias in House-hold Surveys, 70 PUB. OPINION Q. 646, 647–50 (2006).

2019] SOUND AND FURY 1827
2.3 Other eligible, non-
interview
Contact could be made
with the establishment but
not with the target re-
spondent. Existence of
listed establishment has
been confirmed.
3,370
Unknown Eligibility
3.11 No invitation sent Company was sampled but
not worked in any survey
component
4,907
3.19 Nothing ever re-
turned
No indication of whether
email recipient received
the survey invitation or
any subsequent reminders
26,089
3.3 Invitation returned
undeliverable
All emails were returned
undeliverable by all email
addresses
5,065
Ineligible
4.1 Out of sample Company was identified as
out of sample during the
survey field period (i.e. in-
formant confirmed that the
company no longer exists
in its sampled form)
290
Total: 44,112
E. WEIGHTING
The weighting process undertaken by CSR is simple in its aim and intuition but mathematically complex in practice. As such, we present the intuition and some simple justification. At its core, the goal of survey weighting is to make a sample of a population more representative of the population itself. It does this by inflating the influence of some observations in the sample on the results by increasing their weights and deflating the in-fluence of others by decreasing their weights. CSR performed this inflation and deflation based on the responding company’s industry, census region, and revenue.
After correcting for the possible bias introduced by email ad-dress and telephone restrictions, our survey experts tuned the

1828 MINNESOTA LAW REVIEW [103:1793
weights112 to make the sample representative of the U.S. busi-ness distribution of revenue and industry. We matched the U.S.
112. The mechanisms by which email addresses are located by Dun & Brad-street are likely not random. In such situations, the American Association of Public Opinion Research recommends estimating the probability of being in-cluded in an email panel using available information. REG BAKER ET AL., AA-POR, REPORT OF THE AAPOR TASK FORCE ON NON-PROBABILITY SAMPLING 41
(2013), https://www.aapor.org/AAPOR_Main/media/MainSiteFiles/NPS_TF_ Report_Final_7_revised_FNL_6_22_13.pdf. We used a method described by Sunghee Lee and Richard Valliant in which probabilities are estimated for both the email group and a reference group—in this case the portion not selected for the email/web component. Sunghee Lee & Richard Valliant, Estimation for Vol-unteer Panel Web Surveys Using Propensity Score Adjustment and Calibration Adjustment, 37 SOC. METHODS & RES. 319 (2009). To perform this estimation, CSR fit the following logistic regression model on auxiliary variables provided by Dun & Bradstreet for the entire sample:
𝑦 ̂ = 𝛼 + 𝛽1𝐼 + 𝛽2𝑅 + ln𝑅𝑣 (𝛽3𝐼 + 𝛽4𝑅) + 𝜀 where 𝑦 ̂, a binary indicator of whether the company had an email address avail-able, is regressed onto:
𝐼 = the industry group of the company (mapped by NAICS code as de-scribed in appendix A);
𝑅 = the U.S. census region (mapped by state of establishment ad-dress); and
ln𝑅𝑣 = the natural log of the company’s annual revenue in $U.S. mil-lions.
These covariates, which predicted the presence of an email within the pro-vided dataset with 70.2% accuracy, were chosen based not only on their per-ceived strength in explaining the independent variable but also their possible correlation with survey analysis variables. While other variables were available in the dataset, many either had missing data or added little additional explan-atory power. However, without knowing the full scope of Dun & Bradstreet’s methods for obtaining email addresses, the model could be subject to misspeci-fication.
Using these estimated probabilities, we followed guidance provided by Lee and Valliant of using propensity score classification to group like probabilities together such that each grouping matches establishments with and without an email address based on estimated likelihood of having an email address as de-termined by the covariates. Following the suggestion of Lee & Valliant and Cochran, we developed five classes. See id. at 321; see also W.G. Cochran, The Effectiveness of Adjustment by Subclassification in Removing Bias in Observa-tional Studies, 24 BIOMETRICS 295, 296–97 (1968). Each class is then provided a single adjustment factor that is equal to:
𝑓 𝑐 = ∑ 𝑑𝑒 𝑡 𝑒∈(𝑠𝑐 𝑡) /∑ 𝑑𝑒 𝑡 𝑒∈(𝑠𝑡) ∑ 𝑑𝑒 𝑚 𝑒∈(𝑠𝑐𝑚) /∑ 𝑑𝑒 𝑚 𝑒∈(𝑠𝑚)
where the proportion of class membership to entire subsample for the non-email, reference group is represented in the numerator and the proportion of class membership to entire subsample for the email group is represented in the denominator. This adjustment is then multiplied by the base weight to form an adjusted base weight. A similar adjustment was also made to the telephone screener subsample based on the estimated probability of not having an email.
In addition to the unknown probability of having an email, a significant portion of the worked sample were deemed to have an unknown eligibility to participate in the overall survey at the end of the field period. We could not

2019] SOUND AND FURY 1829
business population percentages exactly to the 2012 U.S. eco-nomic census.113
CSR’s weighting also addresses concerns that could have re-sulted from low response rates. A low response rate is problem-atic when the small sample of responders isn’t representative of the population. If the sample is representative of the population, however, the response sizes do not raise the same concerns. Our weighting makes our sample more representative of the popula-tion and thus reduces potential sample size concerns.
As an example, consider the transportation portion of our sample. In the weighted analysis, transportation companies make up forty-two percent of our sample. The large proportion of transportation companies is partly due to restrictions we put on the data. According to the U.S. census, when you restrict the pool of all companies to those within one of the five industry sec-tors we studied having a U.S. zip code, not a subsidiary, greater than $1 million in revenue, and having at least one employee, forty-seven percent of the resulting companies are transporta-tion companies. Put differently, when you only consider energy, computer, life science, chemistry, and transportation companies, transportation companies make up a large proportion of the
confirm those companies were still operating during the field period. The sam-ple weights for these cases were distributed equally among all other response types, including respondents, non-respondents, and ineligibles such that the weight of the “knowns” scale up to the aggregate weight of the contacted portion (i.e. known and unknown).
We then balanced the resultant weights for all respondent cases to approx-imate U.S. population proportions using a method referred to as raking. We used the survey package of the statistical programming language R. In balanc-ing the sample weights, we focused on two auxiliary variables: count of firms by case-level industry group (mapped by NAICS code, U.S. CENSUS BUREAU, https://www.census.gov/cgi-bin/sssd/naics/naicsrch?chart=2012 (last visited Mar. 11, 2019)) and count of firms by revenue class. Upon examining cell counts of respondent companies for each variable, we collapsed certain revenue classes to increase the number of units in each cell and facilitate more stable estimates.
Finally, after balancing the weights, we examined the distribution to iden-tify outliers with the potential to significantly increase the variance. According to a commonly used criterion, we trimmed weights to the value of the median weight plus six times the interquartile range and distributed the excess among all other weights to maintain the total population counts. Since redistribution has potential to increase weights, we repeated the process of trimming and re-distribution until all weights were within the bounding limit. SADEQ CHOW-
DHURY ET AL., WEIGHT TRIMMING IN THE NATIONAL IMMUNIZATION SURVEY
2652–55 (2007), https://www.researchgate.net/publication/260348642_Weight_ Trimming_in_the_National_Immunization_Survey.
113. See generally U.S. CENSUS BUREAU, 2012 SUSB ANNUAL DATASETS BY
ESTABLISHMENT INDUSTRY (2012), https://www.census.gov/data/datasets/2012/ econ/susb/2012-susb.html.

1830 MINNESOTA LAW REVIEW [103:1793
available respondents. Thus, weighting makes the sample more representative of the population.
Last, while the weighting changed the sample demographics from those recorded to ones matching the population de-mographics, it does not change the categorical conclusions we make. To confirm this conclusion, we show the unweighted num-bers in Appendix A.114 The Appendix demonstrates that the re-sults with unweighted data differed only in minor magnitude and not in direction or trend.
III. RESULTS
A. OVERALL DESCRIPTIVE STATISTICS
Our survey generated responses from 1718 companies. Of those, 1297, or 75.5%, were identified in the screener question-naire as having never received patent licensing demands. Com-panies with no experience with patent licensing demands an-swered only a few questions, since most questions did not apply to them.115
We report the breakdown by revenue and industry in Table 4, as well as the weighting we applied to match responses to the census data.
Table 4
Results by Industry
Industry Count
of
Cases
% of
total
Sum of
Balanced
Weights
% of
total
Count of
Firms in
U.S. Pop.
% of
total
Chemistry 222 12.9 6,233 5.5 6,233 5.5
Computer 433 25.2 20,635 18.2 20,635 18.2
Energy 185 10.8 9,257 8.2 9,257 8.2
Life Science 410 23.9 24,220 21.3 24,220 21.3
Transporta-
tion
468 27.2 53,167 46.8 53,167 46.8
Total 1,718 100 113,512 100 113,512 100
Companies in the transportation industry were less likely to respond to our survey at all than companies in the chemistry and
114. Because of the relatively complicated survey design involved in this pro-ject, we choose to exclude hypothesis tests based on unweighted data. To avoid biased estimates and inferences, we only present inference based on weighed data.
115. If companies answered only some but not all questions, we included them only in considering the questions they answered.

2019] SOUND AND FURY 1831
computer industries. That may well be because patents simply aren’t that important to many transportation businesses, partic-ularly small trucking or shipping firms, and firms with no con-nection to the patent system were naturally less likely to re-spond to our survey, despite our entreaties.
We did worry that while transportation companies make up forty-seven percent of our population, the patent system is dis-proportionately irrelevant to them when compared with other industries. If this were the case, we would be biasing the obser-vations on patent assertion toward companies that typically do not have patents asserted against them. It is unlikely that this is the case. We studied the “nonapplicability rate” by industry—the percentage of respondents who had never faced a patent as-sertion. We report the results in Table 5. The average nonap-plicability rate is around eighty percent. While it is slightly higher than average in transportation, transportation compa-nies were more likely to report patent assertions than the energy industry, and in any event the results are not dramatically dif-ferent by industry. The patent system may not affect a large por-tion of transportation companies, but it does not ignore them dis-proportionately.116
116. We cannot exclude the possibility that companies in certain industries were less likely to respond because the patent system was simply not relevant to them. Weighting should account for this in our substantive results.

1832 MINNESOTA LAW REVIEW [103:1793
Table 5
Non-applicability of Patent Assertion by Industry
In most of what follows, we report only data from the subset of companies within each industry that faced at least one patent licensing demand during the three-year study period.
B. RESULTS BY TYPE OF LICENSING ENTITY
The results of our broader study largely validates the results of our initial pilot survey. We find that patent licensing demands rarely lead to further innovation. We asked directly whether the presence of a patent license demand led to the creation of a new product, as that could be an indication that the patent license led to new innovation.117
117. Or maybe not. Some of the respondents who said yes may well have redesigned their products to avoid infringement without necessarily making those products better, and indeed possibly making them worse. Such a litiga-tion-induced design-around is innovation of a sort and will sometimes lead a company to valuable new avenues. See Matthew J. Conigliaro et al., Foreseea-bility in Patent Law, 16 BERKELEY TECH. L.J. 1045, 1050 n.17 (2001) (collecting sources). But sometimes it is just a wasteful expenditure to avoid having to pay a royalty on an existing product. See, e.g., Michael Abramowicz, Perfecting Pa-tent Prizes, 56 VAND. L. REV. 115, 190–93 (2003) (“[E]mpirical evidence indicates that inventing around is widespread and costly.”); Colleen V. Chien & Mark A.

2019] SOUND AND FURY 1833
When operating companies asserted patents, two-thirds of respondents indicated that they never or almost never changed their products or developed new products as a result of the pa-tent license request, even when they took a license to the patent. Only eleven percent of respondents indicated that they always did so.
Table 6
Percent of Firms whose Purchased Operating Company Patents Led to
New Products
Lemley, Patent Holdup, The ITC, and the Public Interest, 98 CORNELL L. REV. 1, 34–35 (2012) (calling designing around a patent to avoid litigation “wasted effort” because most patent suits fail); Louis Kaplow, The Patent-Antitrust In-tersection: A Reappraisal, 97 HARV. L. REV. 1813, 1869–70 (1984) (“Because in-venting around does not contribute to welfare when combinations are permit-ted, the resources devoted to the task are entirely wasted.”); Richard C. Levin et al., Appropriating the Returns from Industrial Research and Development, BROOKINGS PAPERS ON ECON. ACTIVITY: SPECIAL ISSUE ON MICROECONOMICS, 1987, at 783, 807–12; Edwin Mansfield et al., Imitation Costs and Patents: An Empirical Study, 91 ECON. J. 907, 913 (1981) (finding that sixty percent of stud-ied patented innovations were imitated within four years, generally at in-creased cost); Donald F. Turner, The Patent System and Competitive Policy, 44 N.Y.U. L. REV. 450, 455 (1969) (arguing that while duplicative research may “produce new net gains,” it is often “wasteful” because that same effort could have gone to addressing unsolved problems).

1834 MINNESOTA LAW REVIEW [103:1793
Compared to operating company assertions, patent licenses demanded by NPEs were even less likely to lead to new products or product changes. More than five in every six firms said they never or almost never changed their product or developed new products as a result of taking a license from an NPE; less than three percent indicated that they always did so.
Table 7
Percent of Firms Whose Purchased NPE Patents Led to New Products
Not all NPEs are created equal, however. Universities and federal labs are NPEs in the strict sense—they don’t make prod-ucts.118 In our study we defined NPEs more narrowly, to focus on those in the business of asserting patents.119 Licensing requests
118. Lemley, supra note 10, at 629–31 (contrasting universities with other NPEs because their licenses are generally not just forbearance from suit but instead include technology transfer and expertise).
119. We defined NPEs as those “whose core activity involves licensing or lit-igating patents.” That is a broader definition than what some would consider a pure PAE, because it includes companies and individuals who assert their own patents rather than acquiring those patents from outside. The follow-up ques-tions then asked about NPEs separately from universities and federal labs. It is possible that some people still lumped universities in when they were answer-ing about NPEs, but our questions should have guided them away from that.

2019] SOUND AND FURY 1835
by two types of NPEs—universities and federal labs—were much more likely to lead to new products. Still, more than half of re-spondents said university licensing requests almost never led to the creation of new products. The federal lab numbers are some-what better, but the small number of companies who got licens-ing requests from federal labs makes it hard to generalize. It is notable, however, that demands from both universities and fed-eral labs were more likely to generate new products than oper-ating companies, and certainly than other types of NPEs.120
120. We performed all statistical testing using two-sample z-tests for differ-ence in proportions and statistical significance was assessed at the .05 level. We used the survey weights and not the raw data. We performed a statistical test to determine whether federal labs patent assertions were more likely to lead to innovation than other forms of patent assertion and found a statistically signif-icant difference in most results. See Table 8.
Table 8
Statistical Tests Comparing Federal Labs to Other Entities
OC 0-10% pat: 36%
NPE 0-10% pat: 70%
Uni 0-10% pat: 33%
NPE 0-10% pat: 70% -34%
Uni 0-10% pat: 33% 3% 37% Fed 0-10% pat: 19% 17% 51% 14%
In the margins of the tables are the estimated percentages for the individ-ual variables. For example, in the first table the cell labeled “OC 0-10% pat” has “36%” below it. That means that the percentage of companies that responded 0-10% on converting purchased patents into products when the patent was as-serted by operating companies was 36%. The cells inside the table are the dif-ferences in the observed proportions subtracting the left margin from the top margin. Numbers are in bold when the difference is statistically significant at the p<0.05 level. Because we calculated a series of hypothesis tests, it was im-portant to take into account the issue of multiple comparisons. Statistics teaches us that by running enough tests, something will eventually come up significant purely by chance. In fact, running tests until significance is encoun-tered and generating many new hypotheses after inspecting the data are what constitute “p-hacking.” See Stephan B. Bruns & John P.A. Ioannidis, p-Curve and p-Hacking in Observational Research, PLOS ONE, Feb. 17, 2016, at 2, http:// europepmc.org/backend/ptpmcrender.fcgi?accid=PMC4757561&blobtype=pdf. To avoid both of these issues, we specified the hypotheses we were interested in testing prior to testing and used the Benjamini-Hochberg procedure to correct for multiple comparisons. See generally Yoav Benjamini & Yosef Hochberg, Con-trolling the False Discovery Rate: A Practical and Powerful Approach to Multiple Testing, 57 J. ROYAL STAT. SOC’Y 289 (1995).
A small number of respondents indicated patent licensing demands from “others” besides operating companies, NPEs, universities, or federal labs. That might include patent pools or individuals. Forty percent of those companies in-dicated that they almost never changed their products as a result, but the num-bers are too small to draw many conclusions.

1836 MINNESOTA LAW REVIEW [103:1793
Table 9
Percent of Firms Whose Purchased University Patents Led to New
Products
Table 10
Percent of Firms Whose Purchased Federal Patents Led to New Products

2019] SOUND AND FURY 1837
We also asked about various indicia that might indicate a patent license involved the transfer of knowledge. Specifically, we asked whether the patent license came with any trade secrets or other know-how, came with new employees, or was part of a joint venture. The economic literature emphasizes the im-portance of tacit knowledge in innovation.121 True innovation and learning is rarely accomplished by a written document alone; it often requires cooperation and the communication of in-formation learned on the job about how to make things work and solve particular problems.122 Thus, this complex of questions gets at indirect measures of knowledge transfer and might indi-cate a socially valuable transaction even if the recipient denied designing a new product as a result. It might also provide a way to distinguish between socially valuable new products and those created merely to avoid infringing a patent right.
The results for evidence of knowledge transfer associated with patents is dismal. Even fewer companies report any indicia of knowledge transfer than reported developing new products. When operating companies demanded patent licenses, more than seventy percent of firms told us that those demands were almost never accompanied by any sort of knowledge transfer, and only ten percent indicated that they always were.
121. See, e.g., Lemley, supra note 36, at 997–98 (using the example of de-signing an automobile). 122. This is likely to be truer in some industries than others and for some inventions than others. Some ideas are simple and can be learned from reading a patent. But in more complex industries reading a patent is not a common way to advance knowledge. See, e.g., Mark A. Lemley, Ignoring Patents, 2008 MICH. ST. L. REV. 19, 21–22 (2008) (describing how engineers and university research-ers in the IT industries intentionally avoid reading patents). But see Lisa Lar-rimore Ouellette, Do Patents Disclose Useful Information?, 25 HARV. J.L. &
TECH. 545, 548 (2012) (finding that sixty-four percent of surveyed nanotechnol-ogy researchers had read patents, and seventy percent of those did so for tech-nical information); Ouellette, supra note 109, at 421–23 (surveying who reads patents and their purposes for doing so across six industries).

1838 MINNESOTA LAW REVIEW [103:1793
Table 11
Percent of Firms Whose Purchased Operating Company Patents Led to
Knowledge Transfer
The results are even worse for NPEs. Nearly ninety percent of respondents told us they almost never got knowledge transfer from NPE patent license demands; only one respondent said they always did.
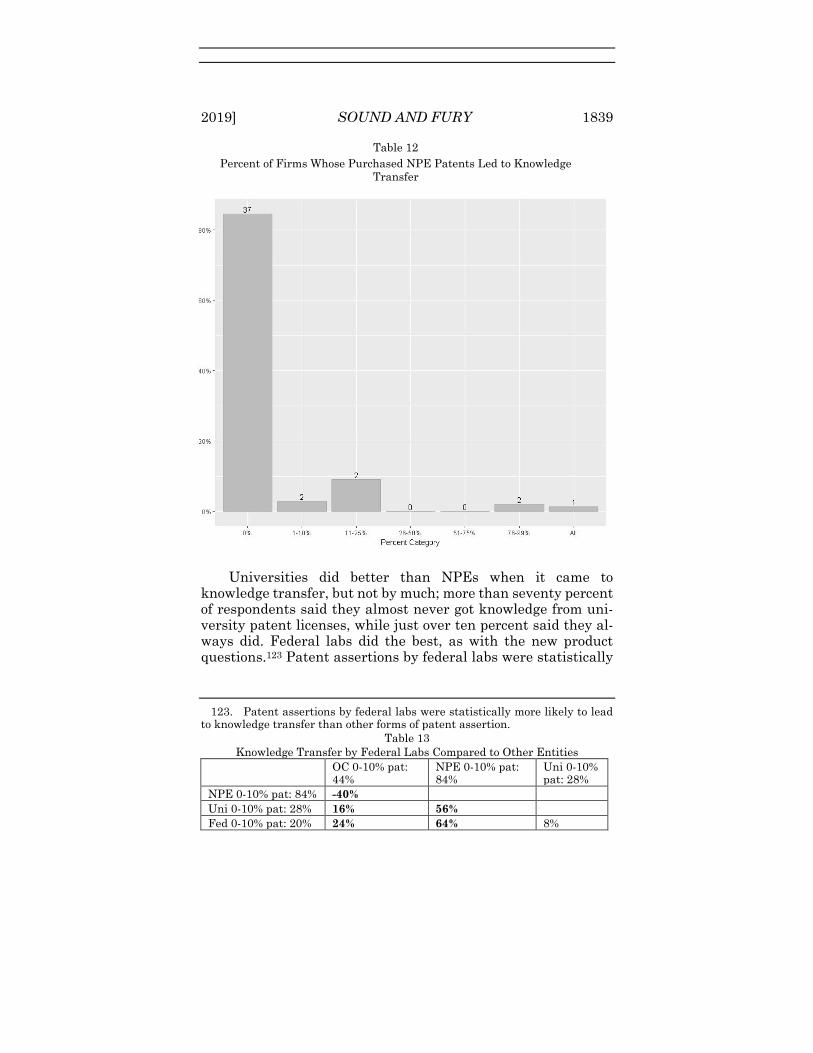
2019] SOUND AND FURY 1839
Table 12
Percent of Firms Whose Purchased NPE Patents Led to Knowledge
Transfer
Universities did better than NPEs when it came to knowledge transfer, but not by much; more than seventy percent of respondents said they almost never got knowledge from uni-versity patent licenses, while just over ten percent said they al-ways did. Federal labs did the best, as with the new product questions.123 Patent assertions by federal labs were statistically
123. Patent assertions by federal labs were statistically more likely to lead to knowledge transfer than other forms of patent assertion.
Table 13 Knowledge Transfer by Federal Labs Compared to Other Entities
OC 0-10% pat: 44%
NPE 0-10% pat: 84%
Uni 0-10% pat: 28%
NPE 0-10% pat: 84% -40%
Uni 0-10% pat: 28% 16% 56% Fed 0-10% pat: 20% 24% 64% 8%

1840 MINNESOTA LAW REVIEW [103:1793
more likely to lead to knowledge transfer than other forms of pa-tent assertion.
Table 14
Percent of Firms Whose Purchased University Patents Led to Knowledge
Transfer
Table 15
Percent of Firms Whose Purchased Federal Patents Led to Knowledge
Transfer

2019] SOUND AND FURY 1841
C. BIAS IN THE PERCEPTION OF KNOWLEDGE TRANSFER
While our focus was on companies that received patent li-censing demands, we also asked companies whether they made patent license demands of others and, if so, what happened with those demands. A significant share of our respondents did in fact report patent outlicensing efforts. Of those, just over half indi-cated that their patent license requests were unsuccessful—that almost no one took a patent license. Just fifteen percent reported that respondents always took a patent license.
Table 16
Percent of Outlicensing Requests that Led to Purchase
Interestingly, companies that outlicensed patents reported a significantly higher rate of technology transfer associated with their outlicenses than our respondents reported when licensing patents from others. While nearly sixty percent conceded that their outgoing patent licenses almost never led to technology transfer, almost a quarter said that their licensing demands to others always involved technology transfer.

1842 MINNESOTA LAW REVIEW [103:1793
The difference in these proportions is statistically signifi-cant at the .05 level,124 meaning that we can reject the claim that we would have observed a difference as great as the one observed if there was no difference in the true proportions of knowledge transfer with ninety-five percent certainty.
Table 17
Percent of Outlicensing Patents that Led to Knowledge Transfer
The outlicensing data confirms that most patent license de-mands don’t lead to technology transfer. But the disconnect be-tween what companies reported when being on the licensor side and what they reported on the licensee side is interesting, so we looked further into the data. In particular, we wanted to explore the extent to which egocentric bias might play a role.
124. Current statistical practice recommends against the use of blind statis-tical significance as an exact replacement for real-world significance. See supra note 112 and accompanying text. Statistical significance is one of many poten-tial indicators of real-world significance and we recommend considering effect sizes and trends when reading these results.

2019] SOUND AND FURY 1843
With egocentric bias, individuals value their own point of view more than that of others, in part due to greater familiar-ity.125 In the patent context, that may operate as a form of opti-mism in which patent owners think they are contributing more by licensing than licensees think they are receiving. Prior liter-ature suggests that IP owners overvaluing their own contribu-tions is a particular problem.126 But the bias could also move in the other direction, with licensees minimizing the contributions others make and overvaluing their own contributions. Which-ever way the bias cuts, evidence that patentees think they are contributing more than licensees think they are receiving could help explain some of the difficulty the two sides have had in en-gaging in a constructive conversation over patent reform.127
125. Psychology literature confirms the existence of an “egocentrism” bias, in which individuals view their own contributions as more important and the contributions of others as less important. See, e.g., Michael Ross & Fiore Sicoly, Egocentric Biases in Availability and Attribution, 37 J. PERSONALITY & SOC. PSYCHOL. 322, 323–325 (1979) (discussing four possible processes explaining egocentrism bias). 126. Christopher Buccafusco and Christopher Sprigman experimentally showed that there is “a substantial valuation asymmetry between authors of poems and potential purchasers of them,” suggesting that the IP owners tend to overvalue their contributions. Christopher Buccafusco & Christopher Sprig-man, Valuing Intellectual Property: An Experiment, 96 CORNELL L. REV. 1, 4 (2010). In making this finding, Buccafusco and Sprigman draw on a rich litera-ture in behavioral economics discussing the “endowment effect”—the notion that people ascribe more value to things merely because they own them. See, e.g., Daniel Kahneman et al., Anomalies: The Endowment Effect, Loss Aversion, and Status Quo Bias, 5 J. ECON. PERSP. 193, 194–97 (1991); Daniel Kahneman et al., Experimental Tests of the Endowment Effect and the Coase Theorem, 98 J. POL. ECON. 1325, 1342–43 (1990) (finding evidence of an endowment effect even when items are only possessed for a short time). Prior to Buccafusco’s and Sprigman’s work, the endowment effect had been shown for information, Daphne R. Raban & Sheizaf Rafaeli, The Effect of Source Nature and Status on the Subjective Value of Information, 57 J. AM. SOC’Y FOR INFO. SCI. & TECH. 321, 326 (2006), which, like IP, is a nonrival good. Previous studies also showed that people who believed that they received goods as a result of superior performance on a test valued the goods more highly than people who obtained the same goods by chance alone. George Loewenstein & Samuel Issacharoff, Source Dependence in the Valuation of Objects, 7 J. BEHAV. DECISION MAKING 157, 160–61 (1994). Buccafusco and Sprigman showed, for the first time, that the endowment effect extends to knowledge goods an owner creates. Buccafusco & Sprigman, supra, at 4–5. 127. For examples of extreme rhetoric on both sides, compare Neal Solomon, The Disintegration of the American Patent System, IP WATCHDOG (Jan. 26, 2017), http://www.ipwatchdog.com/2017/01/26/disintegration-american-patent -system/id=77594 (claiming that efforts to moderate abuses are causing the “dis-integration” of the U.S. patent system and threatening innovation), with Mike Masnick, When Patents Attack: How Patents Are Destroying Innovation in Sili-con Valley, TECHDIRT (July 25, 2011), https://www.techdirt.com/articles/

1844 MINNESOTA LAW REVIEW [103:1793
Thus, we wanted to determine the extent to which that form of bias might be influencing the responses.
To be sure, there is a scenario that would explain the results without any egocentrism bias, given two things that are evident in the data. First, we observe limited overlap between those who answered the licensor questions and those who answered the li-censee questions. Only about twenty percent of the participants responded that they had experience both with taking a license when approached by others and with getting others to take a li-cense in their own technology.
Further, if we think of success as the quality of leading to markers of innovation such as technology transfer, there is an uneven distribution of success among the companies who got others to take a license from them. Moreover, that uneven dis-tribution is much greater than among companies who took a li-cense when approached by others. Thus, it is possible a small number of highly successful outlicensors could cause the result we are seeing in that category of companies, which would not be mirrored in the category of those who took licenses when ap-proached. If so, rather than egocentric bias, it may be that a small number of companies have very good patents to offer for license.
To look further at the question of egocentric bias, we focused in on those respondents who answered both sides of the ques-tion—that is, those who reported experience on both the licensor and licensee side. With companies having experience on both sides of the fence, the reported markers of innovation on both sides were considerably more similar. Although respondents re-ported greater markers of innovation when they licensed their patents out to other companies than when they took a license, the difference was only about eight percent. Thus, at least for those who have experience on both sides, we are not seeing such a wide margin of egocentrism.
One cannot necessarily project those results onto the re-spondents who reported experience with only one side of the question. It is possible that the experience of sitting on both sides of the fence at different times could make some respondents more able to see the value from the other side, an experience that the one-sided respondents would not share. Nevertheless, the delta between the two sides appears likely to be less striking
20110724/22250715225/when-patents-attack-how-patents-are-destroying -innovation-silicon-valley.shtml (claiming that abuses by patent trolls are de-stroying innovation in Silicon Valley).
2019] SOUND AND FURY 1845
than at first glance. Most important, at the end of the day, the outlicensing data confirms that most patent license demands don’t lead to markers of innovation such as technology transfer. Coupled with other evidence, that suggests there is some egocen-trism bias at work.
D. INDUSTRY-SPECIFIC RESULTS
Prior work has found significant differences by industry in the functioning of the patent system.128 Our results provide fur-ther evidence for that divide. In addition to finding significant differences between the computer and life sciences industries, we also show that other industries have unique experiences with patent licensing.129
In Table 18, we report the percentage of responding compa-nies in each industry that developed a new product or modified an existing product more than ten percent of the time in re-sponse to a licensing request from each sort of patent owner. These results sum all the categories in our survey other than the 0–10% category. One thing that is notable is that there is much less variation in how respondents behave when the licensor is an operating company than in any of the other categories. For some categories—federal labs, other—that may be an artifact of the small number of responses, but the contrast with universities and NPEs is particularly remarkable. In the computer industry, not one respondent indicated that they made new or modified products in response to a licensing demand from an NPE or a university. By contrast, all other industries were much more re-sponsive to university licensing requests, and most industries were also much more responsive to NPE licensing requests.
Table 19 presents another way of looking at the same re-sults. For this table, we added up the responses in all columns and generated a mean percentage of times each group made or modified a product. For instance, if five companies responded, and four said they created a new product 0% of the time and one said they created a new product 100% of the time, we summed
128. See sources cited supra note 11. 129. For an argument that the decision to assert patents in licensing is in-dustry-specific, see Clark D. Asay, Patent Pacifism, 85 GEO. WASH. L. REV. 645, 667–702 (2017) (using the software, pharmaceutical, biotechnology, and semi-conductor industries as examples).

1846 MINNESOTA LAW REVIEW [103:1793
the percentages so that overall, the responding companies gen-erated new products 20% of the time.130 The results here are sim-ilar to those in Table 14. We see surprisingly little variation by industry when responding to demands from operating compa-nies, but quite a lot of variation in responses to NPE and univer-sity licensing demands.
The combination of NPEs and the computer industry—or, for that matter, university ex post licensing demands and the computer industry—seems particularly unlikely to drive product innovation. That may be a function of the nature of the patents asserted in those industries, the behavior of plaintiffs or defend-ants, or the speed with which technology moves in that industry compared to the others we studied. Regardless of the reason, it is an indication that patent licensing demands by NPEs may drive product changes in some industries, but not in computers. And it is notable that it does not seem to reflect a flat unwilling-ness on the part of the computer industry to deal with patents; computer companies are willing to change products or make new ones when faced with licensing demands from other operating companies.
130. This assumes that each company faced the same number of licensing assertions. That is unrealistic. But because we don’t know how many assertions each company faced, it provides a way of looking in a single number at the im-pact of the dispersion of all the answers, not just isolating one set.

2019] SOUND AND FURY 1847
Table 18
Share of Companies Generating New Products More than Ten Percent of
the Time by Industry and Patent Entity Type
Table 19
Summed Percentage of Times Companies Generated New Products by Indus-
try and Patent Entity Type

1848 MINNESOTA LAW REVIEW [103:1793
These differences are statistically significant for both oper-ating companies and NPEs in most cells.
Table 20
Statistical Significance of Industry Differences for OC’s:
Chem
know: 60%
Comp
know: 85%
Energy
know: 44%
Life Sci
know: 81%
Comp
know: 85% -25%
Energy
know: 44% 16% 41%
Life Sci
know: 81% -21% 4% -37%
Trans
know: 39% 21% 46% 5% 42%
For NPE’s:
Chem
know: 0%
Comp
know: 100%
Energy
know: 48%
Life Sci
know: 88%
Comp
know: 100% -100%
Energy
know: 48% -48%
Life Sci
know: 88% -88% 12% -40%
Trans
know: 72% -72% 28% -24% 16%
But, we emphasize that the differences are not all that great—no industry, including life sciences, exhibits all that much knowledge transfer or product improvement from patent assertions.
E. RESULTS SORTED BY RESPONDENT JOB DESCRIPTION
In addition to sorting by industry, we wanted to see whether the results differed based on whether respondents held legal or non-legal jobs in their companies.131 Out of the 1718 respond-ents, only about twelve percent specified that they held legal jobs in the company, as opposed to non-legal jobs or unspecified. Spe-cifically, 202 respondents held legal jobs; 1384 respondents held
131. For a description of job categories in the study, see supra notes 89–91 and accompanying text (methodology section).

2019] SOUND AND FURY 1849
non-legal jobs, and 132 were unknown. Given that the vast ma-jority of respondents held non-legal or unspecified jobs, we ana-lyzed the data to see if any of the results changed by looking only at those in the legal field. The alternate sorting, however, re-vealed little difference, and the results were unchanged for most questions.
The two exceptions arose in the university and out-licensing contexts. The first variation arose with the question related to whether patent licenses purchased from universities included a transfer of knowledge. Recall that with the group as a whole, universities did better than NPEs when it came to knowledge transfer, but not by much; more than seventy percent of respond-ents said they almost never got knowledge from university pa-tent licenses, while just over ten percent said they always did.
Looking at the respondents who specifically identified them-selves as holding non-legal jobs, the responses were spread more evenly. Roughly forty-three percent responded that the company almost never received knowledge transfer from a university pa-tent, almost thirty percent responded that the company always received knowledge from a university patent, and the remaining percentages were spread among the possible responses.
Those in the legal field were more pessimistic. All but one of the respondents in the legal field said that company almost never received knowledge transfer from a university patent. The remaining respondent said that the company always received knowledge transfer from a university.

1850 MINNESOTA LAW REVIEW [103:1793
Table 21
Legal Respondents to Percent of Firms Whose Purchased University
Patents Led to Knowledge Transfer
The other difference between legal and non-legal respond-ents occurred with one of the out-licensing questions—that is, whether their own companies made patent licensing demands of others and how those demands fared. In this context, those with legal jobs had a different perspective regarding whether those approaches led to purchase of a license. Recall that over half of the group as a whole indicated that their requests were unsuc-cessful—that almost no one took a patent license—and just fif-teen percent reported that respondents always took a patent li-cense.
In this case, those with legal jobs were more optimistic about their efforts. Only one-third indicated that their efforts were al-most always unsuccessful while almost twenty percent indicated that their efforts were always successful. The remaining re-sponses were spread among the other possible categories.132
132. Respondents who identified themselves as having non-legal jobs were more pessimistic about this category, with almost two-thirds indicating that their efforts were almost never successful. Only nine percent said that their ef-forts were always successful, and the remaining answers were spread among the other possible categories.
6
6
0 0 0
1
0%
20%
40%
60%
0% 1−10% 11−25% 26−50% 51−75% All
Percent Category
Legal Respondentsto Percent of Firms whose Purchased University Patents Led to Knowledge Transfer

2019] SOUND AND FURY 1851
Table 22
Legal Respondents to Percent of Outlicensing Requests that Led to
Purchase
It is possible that those with legal jobs have greater knowledge of whether efforts to sell licenses to others were suc-cessful. After all, the legal department had to negotiate those li-censes. And it is possible that companies with in-house counsel focused on IP issues are more likely to license technology that drives innovation. It is also possible, however, that lawyers over-estimated the success of their department. Nevertheless, we should note that responses from those with legal jobs to the re-maining out-licensing questions were consistent with the re-sponses from the full group. The large majority conceding that their outgoing licenses almost never led to technology transfer.
IV. IMPLICATIONS
Our results have significant implications for our under-standing of the patent system and for current debates over pa-tent reform. Two things stand out. First, our patent system is not monolithic. The experiences of different companies vary along every dimension. We may have a nominally unitary patent system, but the experiences of those who encounter that system
6
8
8
7
4
1
8
0%
5%
10%
15%
20%
25%
0% 1−10% 11−25% 26−50% 51−75% 76−99% All
Percent Category
Legal Respondentsto Percent of Outlicensing Requests that Led to Purchase

1852 MINNESOTA LAW REVIEW [103:1793
are anything but unitary. Second, patent licensing demands do not seem to drive innovation except in unusual circumstances. That has important lessons for the debates over patent trolls and patent reform.
A. THERE IS NO ONE RIGHT ANSWER
There is a natural tendency to generalize in policy debates about the patent system. To many of its defenders, the patent system is the main driver of innovation. Patents are good, so more and stronger patents must be better, regardless of the in-dustry, or who owns them, or what happens with them. To some on the other side, patents themselves are an impediment to in-novation. Patent litigation is associated with patent trolls who tax innovative companies.
Our results add to a growing data-driven literature that shows reality to be more complex.133
We begin with the patent troll problem. Underlying the de-bate over the social harm caused by patent trolls is debate over who constitutes a patent troll. For some, any NPE is a troll; for others, the definition is more limited, covering only companies in the business of buying patents to assert them (patent asser-tion entities or PAEs) or an even narrower group that asserts only bad patents.134 Prior work has shown that some NPEs, par-ticularly universities and startups, do much better in court than
133. For other work in that vein, see BESSEN & MEURER, supra note 18; BURK & LEMLEY, supra note 11; John R. Allison et al., Our Divided Patent Sys-tem, 82 U. CHI. L. REV. 1073 (2015). 134. Some commentators appear to label all NPE’s as patent trolls. See James Bessen, The Evidence Is In: Patent Trolls Do Hurt Innovation, HARV. BUS. REV. (Nov. 2014), https://hbr.org/2014/07/the-evidence-is-in-patent-trolls -do-hurt-innovation (defining patent trolls as “firms that make their money as-serting patents against other companies, but do not make a useful product of their own”); Schwartz & Kesan, supra note 4, at 426 (“Some pejoratively refer to some or all NPEs as ‘patent trolls,’ analogizing that these patent holders wait until another brings a product to market and then jump from under the bridge to demand a toll.”). This is essentially the definition given to patent trolls by Peter Detkin, the man generally credited with coining the term “patent troll.” Roger Kay, Where Did the Patent Troll Narrative Come From?, MEDIUM (Feb. 12, 2018), https://medium.com/@rogerkay/where-did-the-patent-troll-narrative -come-from-301b20072dac (defining patent trolls as “somebody who tries to make a lot of money from a patent that they are not practicing, have no inten-tion of practicing, and in most cases never practiced”). Others define trolls more narrowly, as encompassing only those who buy patents from others rather than inventing themselves (what we call PAEs), or, alternatively, limiting the term to the assertion of weak patents. Other commentators believe we should get rid of the term troll altogether. See, e.g., McDonough, supra note 5, at 200–01 (pre-ferring the term “patent dealer[ ] ” to patent troll in all cases).

2019] SOUND AND FURY 1853
others, particularly PAEs.135 Our data suggests that NPEs are not a monolithic group when it comes to patent licensing de-mands either. We defined NPEs in our study as entities or indi-viduals whose core activity involves litigating or licensing pa-tents, a broader definition than PAEs because it includes companies in the business of asserting patents developed in-house but narrower than some definitions, putting groups like
Most scholars appear to fall somewhere in-between. Many believe that pa-tent trolls are characterized by those NPEs that wait to assert their patents until after operating companies have already adopted the technology so that the trolls can attempt to charge excessive rents. See, e.g., Timo Fischer & Joachim Henkel, Patent Trolls on Markets for Technology – An Empirical Analysis of NPEs’ Patent Acquisitions, 41 RES. POL’Y 1519, 1520 (2012) (defining patent trolls as “firms that seek to generate profits” primarily from licensing patented technology to firms only after the firms are infringing the patent and pressured to reach a license agreement); Damien Geradin et al., Elves or Trolls? The Role of Nonpracticing Patent Owners in the Innovation Economy, 21 INDUS. & CORP. CHANGE 73, 74–75 (2011) (defining patent trolls as “those entities licensing their patents opportunistically ex post,” thereby “prey[ing] upon manufacturers and other downstream firms by charging ‘supra-competitive’ rates for their pa-tents”); Lemley, supra note 10, at 630 (arguing that we should abandon the search for companies to call patent trolls and instead modify legal rules to thwart socially suboptimal troll-like behavior: “the capture by patent owners of a disproportionate share of an irreversible investment.”); Patent Trolls, EFF.ORG, https://www.eff.org/issues/resources-patent-troll-victims (last visited Mar. 11, 2019) (“A patent troll uses patents as legal weapons, instead of actually creating any new products or coming up with new ideas. Instead, trolls are in the business of litigation (or even just threatening litigation).”). Still others de-fine patent trolls as those companies that assert patents in “bad faith,” which may include the assertion of low-quality patents. See, e.g., Marc Morgan, Stop Looking Under the Bridge for Imaginary Creatures: A Comment Examining Who Really Deserves the Title Patent Troll, 17 FED. CIR. BUS. J. 165, 178 (2008) (“Un-der a bad faith definition patent trolls could fall into three categories: (1) parties who try to hide owning a patent until a company unsuspectingly infringes it, waiting until the company has expended significant resources so that they can extract a settlement; (2) parties that acquire large patent portfolios solely for the offensive purpose of putting competitors out of business; and (3) parties who intentionally acquire low quality patents in order to enforce them against com-panies, hoping to receive a settlement because the companies want to avoid the high discovery costs.”). 135. Allison, Lemley & Schwartz, supra note 16, at 270–71 fig.5, tbl.6(a); Michael Risch, The Layered Patent System, 101 IOWA L. REV. 1535, 1544–47 (2016).

1854 MINNESOTA LAW REVIEW [103:1793
universities and federal labs in a different category.136 NPEs un-der that definition almost never generate new products or knowledge transfer when they license their patents.137
By contrast, the results for certain types of NPEs were more promising. Federal labs that assert patents are the group most likely to transfer knowledge or drive new products when they license patents, though the small number of instances in which federal labs asserted patents makes the data of questionable sig-nificance.138 Interestingly, those federal labs are the ones that depend least on patents themselves as drivers of licensing.139 So while their licensing may be driving innovation among licensees, it is not clear that the federal lab needs the incentive of patents to drive that innovation. The results for universities are more mixed. University patent demands are more likely to drive inno-vation than demands by other sorts of NPEs, but most of them still don’t involve any indicia of technology transfer.140 That is consistent with the hybrid role university patenting plays. Some-times university patents are in fact responsible for spinning new technologies out to the private sector. But at other times univer-sities act as patent trolls, not disseminating new inventions but suing those who develop those inventions independently.141
Second, our results confirm prior literature that finds that the patent system works differently in different industries.142 Patent licensing demands almost never result in technology transfer or innovation in the computer industry, particularly
136. See supra Part II.C.1. We asked about interactions with the following groups:
Companies whose core activity is producing a product or service (i.e., oper-ating companies)
Entities or individuals whose core activity involves licensing or litigating patents (i.e., NPEs)
Universities, faculty, or other individuals at universities Federal labs, federal facilities, federal research centers, and other federal
government sources (i.e., Department of Energy national labs, NASA research centers, NIH centers or institutes)
Other, please specify. 137. See supra note 119 and accompanying text. 138. See supra note 120 and accompanying text. 139. See supra note 9 and accompanying text. 140. See supra notes 120–23 and accompanying text. 141. See Ian Ayres & Lisa Larrimore Ouellette, A Market Test for Bayh-Dole Patents, 102 CORNELL L. REV. 271, 274 (2017) (providing an example of Boston University suing tech giants for patent infringing); cf. Lemley, supra note 10, at 629 (stating that although universities are not trolls, they share some charac-teristics with trolls). 142. See sources cited supra note 11.

2019] SOUND AND FURY 1855
when NPEs are doing the asserting. They are somewhat more likely to be productive in the life sciences, but there aren’t that many NPEs in those industries to begin with. Interestingly, there is less variation than we might have expected when it comes to operating company licensing demands. Patent licensing demands by operating companies in the computer industry were almost as likely as those in the life science industry to lead to new or modified products or knowledge transfer. So much of the computer versus life sciences divide does seem to be driven by the different prevalence and role of NPEs in the two industries.
A related finding regarding the industry differences is that the industry variation we observe doesn’t map neatly to the tra-ditional life sciences versus computer divide we have seen in the last decades of patent reform debates.143 Instead, it is areas like energy and transportation that see the most new products re-sulting from at least some kinds of patent licensing de-mands.144 That suggests both that patent policy experts and ad-vocates on both sides need to acknowledge the reality of industry differences, but also need to look beyond the one-dimensional de-bate between computer and life sciences firms, just as we need to look beyond the single dimension of operating companies ver-sus NPEs.
A third way in which the patent system seems differentiated has to do with whether the responding firm is acting as a licensor or a licensee. When we asked firms about the licensing of their own patents rather than licensing patents from others, we got a different story. Companies think their own patents drive inno-vation by others somewhat more than they think others’ patents drive their own innovation. While it is possible that the firms we surveyed happened to transfer more technology out with their patents than they receive from other firms’ patents, we suspect that the survey responses show some bias. This could be bias in either direction, though we think the most likely explanation is optimism bias: patentees think they are generating more inno-vation than licensees think they are.145 Whichever way the skew cuts, this result also helps explain the very different perceptions of the patent system by patentees and defendants. They really
143. See supra note 12. 144. See supra tbl.20. 145. See Buccafusco & Sprigman, supra note 126, at 28–30 (showing that creators are wildly optimistic when it comes to valuing their own contributions, suggesting that patent licensors may think they are contributing more to the world than they are).

1856 MINNESOTA LAW REVIEW [103:1793
do seem to see their contributions to the world differently. And that in turn makes it harder for parties to come to terms. It may not be simply that one side or the other is being greedy and de-manding too much; they may each see their position as reasona-ble given the different assessment they place on the contribution of the patent to the licensee’s product.
Finally, and perhaps most important in the long run, com-panies differ in whether they interact with the patent system at all. A significant majority of respondents in our study (seventy-five percent) simply didn’t face patent licensing demands at all.146 That number may be even higher, since many of the com-panies that did not respond may have done so because they didn’t think the survey pertained to them. It is true that the com-panies that have never faced patent licensing demands may be smaller and less innovative than the ones that do face licensing demands. And the fact that they didn’t face patent licensing de-mands doesn’t mean these companies had no interaction at all with the patent system. They might have their own patents, and they might enter into mergers or other business transactions that include patents. But given the raging debates over the pa-tent system and its role in driving the economy, it is important to recognize that there are large swaths of American business that simply don’t deal with patent licensing demands at all.
B. PATENT LICENSING DEMANDS DON’T DRIVE INNOVATION
The full survey of U.S. businesses validates and extends our initial result that NPE licensing demands almost never lead to innovation by the target firm.147 None of the indicia we would expect of real technology transfer were common in patent licens-ing demands, no matter who made those demands, but NPE de-mands were particularly unlikely to be accompanied by the shar-ing of know-how or employees, the creation of joint ventures, or the development of new products.148
To be clear, our data do not suggest—and we do not be-lieve—that the patent system as a whole doesn’t matter or isn’t working. Patent acquisition and patent licensing remain im-portant parts of the innovation ecosystem, particularly for prac-ticing companies. Patent enforcement too can promote innova-tion by giving operating companies exclusivity. But our study
146. See supra Part III.A. 147. Feldman & Lemley, supra note 7, at 139, 155–73 (discussing the results of the pilot survey). 148. See Lemley & Feldman, Efficient, supra note 6.
2019] SOUND AND FURY 1857
does belie claims that the patent enforcement system is itself a driver of innovation. It isn’t.
That provides important evidence for the ongoing debate over patent trolls and patent reform. Patents and patent licenses aren’t inherent goods in and of themselves. They are valuable if—but only if—they generate innovation or knowledge the world wouldn’t otherwise have.149 The traditional theory of patents is that they promote innovation by insulating their owners from competition, encouraging investment in invention to obtain that benefit.150 But that traditional theory benefits only companies that actually make products and compete in the marketplace. An inventor who doesn’t actually sell products doesn’t benefit di-rectly from the traditional justification for patents.
NPEs can nonetheless benefit from the patent system in ways that also benefit society. The exclusivity patents provide can be traded for money, and the prospect of that money may drive new innovation by those NPEs. The case for those who didn’t themselves invent anything, but bought patents for oth-ers, is less straightforward. The incentive story there depends on the revenue they pay to inventors in exchange for the patent.151 But unlike operating companies, who turn that new innovation into products that benefit the world, NPEs must find some way of sharing their innovations with the world if society is to benefit.
The traditional way we expect that sharing of knowledge is through the patent instrument itself. Because patents must teach one of ordinary skill in the art how to make and use the invention,152 NPEs in theory can invent something and teach others how to do it by the mere act of writing and publishing a patent. Unfortunately, that rarely works as hoped. The combi-nation of a slow patent examination process, artful drafting by patent owners, and fast-moving technologies mean that in most industries reading patents is not a productive way of advancing scientific knowledge.153 And while describing the invention in a patent could in some cases advance knowledge, the evidence sug-gests that very few companies accused of infringement actually
149. See Burstein, supra note 40, at 514–20 (discussing patents as not inher-ently valuable); Lemley & Feldman, Efficient, supra note 6 (discussing patent innovation and value). 150. See LANDES & POSNER, supra note 11, at 319–26; Lemley, supra note 36, at 993–96 (discussing the incentive theory of patents). 151. There is reason to believe PAEs pass relatively little of their revenue on to actual inventors. See Bessen & Meurer, supra note 4, at 410–11. 152. 35 U.S.C. § 112(a) (2012). 153. See supra note 122.

1858 MINNESOTA LAW REVIEW [103:1793
learned about the invention from the patentee, directly or indi-rectly. Rather, in over ninety percent of cases they independently invented the same thing.154 That doesn’t prevent them from be-ing sued; unlike copyright155 and trade secret law,156 independ-ent invention is not a defense to patent infringement.157 True, some people learn an invention by reading patents. And if they do, the patent has contributed to society. That is true whether the learner pays a license to use the patent or copies the inven-tion without paying. The world has benefited from the invention; enforcement of the patent in that case ensures that the inventor who contributed something to the world (albeit by proxy) gets paid for their contribution. Patent licensing in this case is good for the world, but only because the licensee got the invention
154. See Cotropia & Lemley, supra note 3, at 1424 (showing little evidence of copying despite significant incentives and ability to prove copying if it exists). But see Robert P. Merges, A Few Kind Words for Absolute Infringement Liability in Patent Law, 31 BERKELEY TECH. L.J. 1, 9 (2016) (asserting that Cotropia’s and Lemley’s estimate may be too low “[b]ecause lawyers do not have to estab-lish copying affirmatively, they seldom bother to try”); Sichelman, supra note 11, at 544–45 n.143 (arguing that Cotropia’s and Lemley’s estimate may be too low because (1) product copying is more common than patent copying, and prod-uct copying is “unlikely to find its way into the kinds of litigation documents Cotropia and Lemley examined;” and (2) evidence of copying is typically “scant”). Both Merges and Sichelman understate the incentives of trial lawyers to demonstrate copying if it exists. 155. See ROBERT P. MERGES ET AL., INTELLECTUAL PROPERTY IN THE NEW
TECHNOLOGICAL AGE 476–82 (4th ed. 2006) (discussing copying requirement); see also Arnstein v. Porter, 154 F.2d 464, 468–69 (2d Cir. 1946) (same). Some circuits allow copying to be established by a “striking similarity” between the protected work and infringing works, even if there is no evidence that the al-leged infringer had any access to the copyrighted work. Gaste v. Kaiserman, 863 F.2d 1061, 1067–68 (2d Cir. 1988). But see Selle v. Gibb, 741 F.2d 896, 901 (7th Cir. 1984) (requiring proof of access even with a finding of striking similarity). Under such a test, one might argue that copying is not practically required to establish copyright infringement in all cases. However, the rationale for relying solely on striking similarity is that such evidence “preclude[s] the possibility of independent creation.” Ferguson v. NBC, Inc., 584 F.2d 111, 113 (5th Cir. 1978). Thus, copying is still established by inference. 156. See RESTATEMENT (THIRD) OF UNFAIR COMPETITION § 40 (AM. LAW
INST. 1995); UNIF. TRADE SECRETS ACT § 1 CMT. (UNIF. LAW COMM’N 1985) (“Proper means include . . . [d]iscovery by independent invention . . . .”). 157. Cotropia & Lemley, supra note 3, at 1423; see also Lemley, supra note 47, at 1525 (acknowledging Samson Vermont’s proposition that independent in-vention should be a defense, but noting that it currently isn’t); Stephen M. Maurer & Suzanne Scotchmer, The Independent Invention Defence in Intellec-tual Property, 69 ECONOMICA 535, 535 (2002) (“Perhaps the most basic differ-ence between patents and other intellectual property such as trade secrets and copyright is that independent invention is not a defence to infringement.”).

2019] SOUND AND FURY 1859
from the patent and we want to encourage the acquisition of that knowledge to happen through markets rather than illegally.
Alternatively, NPEs can transfer knowledge directly to op-erating companies that incorporate it into a product. Sometimes the operating companies do so by acquiring the NPE.158 This is the theoretical basis for patent licensing—I give you the right to use an invention in exchange for money.159 But here too a patent license benefits the world only if the licensing transaction actu-ally gives new knowledge to the licensee. If it doesn’t, the licen-see is paying the patent owner for the right to use something the licensee itself invented independently. True, an inventor is likely to get paid (though less likely if the immediate beneficiary is an intermediary like a PAE). But another inventor is the one pay-ing, and that second inventor is the one actually sharing the in-vention with the world. And since that second inventor by hy-pothesis didn’t learn anything from the first, it’s hard to see why we would build a system to encourage that wealth transfer, es-pecially one as costly as our patent enforcement system.160
Patentees can benefit the world by making new products or by giving the world information they didn’t have that others can use to make new products. But if neither of those things is true, patent enforcement and licensing looks like an unproductive
158. For discussions of vertical integration and acquisition as a means of technology transfer, see, e.g., Jonathan M. Barnett, Intellectual Property as a Law of Organization, 84 S. CAL. L. REV. 785 (2011); John F. Coyle & Greg D. Polsky, Acqui-Hiring, 63 DUKE L.J. 281 (2013); Peter Lee, Innovation and the Firm: A New Synthesis, 70 STAN. L. REV. 1431 (2018). 159. Empirical evidence shows that patent licenses associated with know-how command higher rates than licenses for patents alone. Gaurav Kankanhalli & Alan Kwan, An Empirical Analysis of Bargaining Power in Licensing Con-tract Terms 12 (Aug. 1, 2018) (unpublished paper), https://papers.ssrn.com/sol3/ papers.cfm?abstract_id=3171920. 160. See supra note 4. Michael Risch argues that we should put up with the social waste of ex post licensing absent technology transfer because without the threat of that sort of enforcement we wouldn’t see ex ante licensing with tech-nology transfer. Michael Risch, Licensing Acquired Patents, 21 GEO. MASON L. REV. 979, 981 (2014). Perhaps. But there seem to be good reasons for companies on all sides to engage in real technology transfer without the threat of a lawsuit if they don’t. The entities we found to be most successful at technology trans-fer—federal labs and universities—are the ones who are least likely to file pa-tent lawsuits. See supra notes 9–10 and accompanying text. Companies negoti-ate technology transfer licenses without IP in many different circumstances. Burstein, supra note 40, at 514–20. And there is some reason to believe that the prevalence of NPE assertions against independent inventors makes it harder for start-ups to engage in technology transfer by encouraging potential licensees to avoid anyone with patents. See Lemley, supra note 122, at 32–33.
1860 MINNESOTA LAW REVIEW [103:1793
wealth transfer, not a benefit to society.161 The most significant finding of our study is that patent licensing demands by NPEs almost never seem to involve knowledge transfer. That doesn’t mean NPEs are always a burden on society. They occasionally transfer knowledge, and sometimes their inventions are copied. But it does indicate that they aren’t often transferring knowledge or promoting innovation through patent licensing de-mands. Coupled with evidence that there is very little copying of patents in the industries NPEs frequent162 and evidence that NPEs tend to assert patents at the end of their lives, well after any learning seems plausible,163 that means we should be quite skeptical of claims that NPEs are serving as efficient middlemen and promoting innovation.
CONCLUSION
This is the first comprehensive study of how American busi-nesses respond to patent licensing demands. The picture it paints is complex. Patent licensing is not a unitary phenomenon. It differs by the type of patentee, by industry, and by responding company. But one thing does stand out in the results: patent li-censing by NPEs doesn’t seem to promote innovation, knowledge transfer, or the development of new products. NPEs—the enti-ties responsible for most patent litigation in the United States in recent years—don’t seem to be contributing to society by licens-ing their patents.
161. Some would conclude that the problem is that patent law applies to in-dependent invention at all. Independent inventors, after all, didn’t benefit from access to the patent or the patented technology. See Carl Shapiro, Prior User Rights, 96 AM. ECON. REV. 92, 92 (2006) (discussing the inability for independ-ent inventors to use an independent invention defense); Samson Vermont, In-dependent Invention as a Defense to Patent Infringement, 105 MICH. L. REV. 475, 483–84 (2006) (discussing user rights and different rights afforded to the first and second investor). We wouldn’t go that far. Patentees who provide technology to the world at large can provide a social benefit even if the defendant didn’t obtain that benefit, and encouraging that technology transfer might require a patent right that forbids even independent invention. See Lemley, supra note 47, at 1532. 162. Cotropia & Lemley, supra note 3, at 1423–24 (finding copying only oc-curred in 1.76% of cases in the study). 163. See supra note 28.

2019] SOUND AND FURY 1861
APPENDIX A: UNWEIGHTED RESULTS
Table 23

1862 MINNESOTA LAW REVIEW [103:1793
Table 24

2019] SOUND AND FURY 1863
APPENDIX B: SURVEY QUESTION TREE164
<PATENT>
In the last THREE years, has your company received patent li-censing requests? These could be calls or letters from another party suggesting patents in which you may be interested, offering to li-cense patents to you, asserting a patent or threatening litigation, giving notice of intent to file an infringement lawsuit, or noticing the filing of an actual infringement lawsuit.
<1> Yes
<2> No
[DISPLAY IFF <PATENT> ≤1.]
<GUESS>
Some questions in this survey ask for frequency counts or per-centages. Please feel free to answer simply using your best estimate or approximation.
[PAGE BREAK]
[DISPLAY IF <PATENT> ≤1.]
<FREQP>
On average over the past THREE years, how often has your company received patent licensing requests?
<1> Less than once a year
<2> 1-5 times per year
<3> 6-10 times per year
<4> 11-50 times per year
<5> More than 50 times per year
<SOURCE>
What parties initiated these requests? Please select all that apply.
<1> Companies whose core activity is producing a product or service (i.e., operating companies)
<2> Entities or individuals whose core activity involves li-censing or litigating patents (i.e., NPEs)
<3> Universities, faculty, or other individuals at universi-ties
<4> Federal labs, federal facilities, federal research centers, and other federal government sources (i.e., Department of Energy na-tional labs, NASA research centers, NIH centers or institutes)
164. Note that not all respondents encountered every question. The survey they saw depended on previous answers they had given.

1864 MINNESOTA LAW REVIEW [103:1793
<5> Other, please specify: [ENTER SHORT TEXT; FORCE TEXT RESPONSE IF SELECTED]
[DISPLAY IFF AT LEAST ONE RESPONSE IS SE-LECTED IN <SOURCE>.]
<PERCENTR>
Indicate below the approximate percentage of the requests that came from each source. Please give a best estimation. Note that the total below should sum to 100%.
[DISPLAY RESPONSE CHOICE(S) IFF SELECTED IN <SOURCE>.]
<1> Companies whose core activity is producing a product or service: [ENTER NUMERIC TEXT]
<2> Entities or individuals whose core activity involves li-censing or litigating patents
<3> Universities, faculty, or other individuals at universi-ties: [ENTER NUMERIC TEXT]
<4> Federal labs, facilities, or research centers: [ENTER NUMERIC TEXT]
<5> {PIPED-IN TEXT FROM SOURCE=4}: [ENTER NUMERIC TEXT]
[DISPLAY NEXT SERIES IFF SOURCE=1 IS SELECTED.]
<OC>
Please think about patent licensing requests from companies whose core activity is producing a product or service (i.e., operating companies) in the last three years.
Approximately what portion of such requests led your company to take a patent license? Please feel free to answer with your best ap-proximation, here and throughout the survey.
<1> None
<2> 1-10%
<3> 11-25%
<4> 26-50%
<5> 51-75%
<6> 76-99%
<7> All
[DISPLAY IFF OC≥2.]
<OCNEW>
Of these requests from operating companies that led to a patent

2019] SOUND AND FURY 1865
license, approximately what portion resulted in your company creat-ing new products or features with the technology you licensed (e.g., as opposed to merely taking the license to cover existing products or features)?
<1> None
<2> 1-10%
<3> 11-25%
<4> 26-50%
<5> 51-75%
<6> 76-99%
<7> All
[DISPLAY IFF OC≥2.]
<OCTRANSF>
Of these requests from operating companies that led to a patent license, approximately what portion resulted in the operating com-pany transferring technical knowledge, personnel (e.g., through a consulting agreement), or creating a joint venture with your com-pany in addition to the patent license?
<1> None
<2> 1-10%
<3> 11-25%
<4> 26-50%
<5> 51-75%
<6> 76-99%
<7> All
[PAGE BREAK]
[DISPLAY NEXT SERIES IFF SOURCE=2 IS SELECTED.]
<NPE>
Please think about patent licensing requests from entities or individ-uals whose core activity involves licensing or litigating patents (i.e., NPEs) in the last three years.
Approximately what portion of such requests led your com-pany to take a patent license?
<1> None
<2> 1-10%
<3> 11-25%
<4> 26-50%
<5> 51-75%
<6> 76-99%

1866 MINNESOTA LAW REVIEW [103:1793
<7> All
[DISPLAY IFF NPE≥2.]
<NPENEW>
Of these requests from non-practicing entities that led to a pa-tent license, approximately what portion resulted in your company creating new products or features with the technology you licensed (e.g., as opposed to merely taking the license to cover existing prod-ucts or features)?
<1> None
<2> 1-10%
<3> 11-25%
<4> 26-50%
<5> 51-75%
<6> 76-99%
<7> All
[DISPLAY IFF NPE≥2.]
<NPETRANSF>
Of these requests from non-practicing entities that led to a pa-tent license, approximately what portion resulted in the NPE trans-ferring technical knowledge, personnel (e.g., through a consulting agreement), or creating a joint venture with your company in addi-tion to the patent license?
<1> None
<2> 1-10%
<3> 11-25%
<4> 26-50%
<5> 51-75%
<6> 76-99%
<7> All
[PAGE BREAK]
[DISPLAY NEXT SERIES IFF SOURCE=3 IS SELECTED.]
<UNI>
Please think about patent licensing requests from universities, fac-ulty, or other individuals at universities in the last three years.
Approximately what portion of such requests led your com-pany to take a patent license?
<1> None
<2> 1-10%
<3> 11-25%

2019] SOUND AND FURY 1867
<4> 26-50%
<5> 51-75%
<6> 76-99%
<7> All
[DISPLAY IFF UNI≥2.]
<UNINEW>
Of these requests from universities that led to a patent license, approximately what portion resulted in your company creating new products or features with the technology you licensed (e.g., as opposed to merely taking the license to cover existing products or features)?
<1> None
<2> 1-10%
<3> 11-25%
<4> 26-50%5> 51-75%
<6> 76-99%
<7> All
[DISPLAY IFF UNI≥2.]
<UNITRANSF>
Of these requests from universities that led to a patent license, approximately what portion resulted in the university or individual at the university transferring technical knowledge, personnel (e.g., through a consulting agreement), or creating a joint venture with your company in addition to the patent license?
<1> None
<2> 1-10%
<3> 11-25%
<4> 26-50%
<5> 51-75%
<6> 76-99%
<7> All
[PAGE BREAK]
[DISPLAY NEXT SERIES IFF SOURCE=4 IS SELECTED.]
<FED>
Please think about patent licensing requests from federal labs, fed-eral facilities, federal research centers, and other federal government sources in the last three years. Some examples of federal government sources include Department of Energy national labs, NASA re-search centers, and NIH centers or institutes.

1868 MINNESOTA LAW REVIEW [103:1793
Approximately what portion of such requests led your com-pany to take a patent license?
<1> None
<2> 1-10%
<3> 11-25%
<4> 26-50%
<5> 51-75%
<6> 76-99%
<7> All
[DISPLAY IFF FED≥2.]
<FEDNEW>
Of these requests from federal entities that led to a patent li-cense, approximately what portion resulted in your company creat-ing new products or features with the technology you licensed (e.g., as opposed to merely taking the license to cover existing products or features)?
<1> None
<2> 1-10%
<3> 11-25%
<4> 26-50%
<5> 51-75%
<6> 76-99%
<7> All
[DISPLAY IFF FED≥2.]
<FEDTRANSF>
Of these requests from federal entities that led to a patent li-cense, approximately what portion resulted in the federal lab, facil-ity, or research center transferring technical knowledge, personnel (e.g., through a consulting agreement), or creating a joint venture with your company in addition to the patent license?
<1> None
<2> 1-10%
<3> 11-25%
<4> 26-50%
<5> 51-75%
<6> 76-99%
<7> All
[PAGE BREAK]

2019] SOUND AND FURY 1869
[DISPLAY NEXT SERIES IFF SOURCE=5 IS SELECTED.]
<OTHER>
Please think about patent licensing requests from {PIPED-IN TEXT RESPONSE FROM <SOURCE>} in the last three years.
Approximately what portion of such requests led your com-pany to take a patent license?
<1> None
<2> 1-10%
<3> 11-25%
<4> 26-50%
<5> 51-75%
<6> 76-99%
<7> All
[DISPLAY IFF OTHER≥2.]
<OTHERNEW>
Of these requests from {PIPED-IN TEXT RESPONSE FROM <SOURCE>} that led to a patent license, approximately what portion resulted in you creating new products or features with the technology you licensed (e.g., as opposed to merely taking the license to cover existing products or features)?
<1> None
<2> 1-10%
<3> 11-25%
<4> 26-50%
<5> 51-75%
<6> 76-99%
<7> All
[DISPLAY IFF OTHER≥2.]
<OTHERTRANSF>
Of these requests from {PIPED-IN TEXT RESPONSE FROM <SOURCE>} that led to a patent license, approximately what portion resulted in the {PIPED-IN TEXT} transferring technical knowledge, personnel (e.g., through a consulting agreement), or creating a joint venture with your company in addition to the pa-tent license?
<1> None
<2> 1-10%
<3> 11-25%
<4> 26-50%

1870 MINNESOTA LAW REVIEW [103:1793
<5> 51-75%
<6> 76-99%
<7> All
[PAGE BREAK]
Please transition to thinking about out-licensing requests your company may have made in the last three years. These are circumstances in which your company holds the patent and it is your company that approaches an outside party to request they take a patent license from you.
<OUTL>
In the last THREE years, has your company approached another party to request that the other company take a patent license from you?
<1> Yes
<2> No
[DISPLAY IFF OUTL=1.]
<FREQO>
On average over the past THREE years, how often has your company made such patent licensing requests?
<1> Less than once a year
<2> 1-5 times per year
<3> 6-10 times per year
<4> 11-50 times per year
<5> More than 50 times per year
[DISPLAY IFF OUTL=1.]
<SOURCEO>
To which parties did your company make these requests to take a patent license from you? Please select all that apply.
<1> Companies whose core activity is producing a product or service (i.e., operating companies)
<2> Entities or individuals whose core activity involves li-censing or litigating patents (i.e., NPEs)
<3> Universities, faculty, or other individuals at universi-ties
<4> Federal labs, facilities, or research centers (i.e., Department of Energy national labs, NASA research centers, NIH centers or in-stitutes)
2019] SOUND AND FURY 1871
<5> Other, please specify: [ENTER SHORT TEXT; FORCE TEXT RESPONSE IF SELECTED]
[DISPLAY IFF SOURCEO=1 IS SELECTED.]
<OOC2>
Of the requests your company made to an operating company asking them to take a patent license from you, approximately what portion led that company to take a patent license?
<1> None
<2> 1-10%
<3> 11-25%
<4> 26-50%
<5> 51-75%
<6> 76-99%
<7> All
[DISPLAY IFF OOC2≥2.]
<OOCTRANS>
Of these out-licensing requests that led to a patent license, ap-proximately what portion resulted in your company transferring technical knowledge, personnel (e.g., through a consulting agree-ment), or creating a joint venture with the other company in addi-tion to granting a patent license?
<1> None
<2> 1-10%
<3> 11-25%
<4> 26-50%
<5> 51-75%
<6> 76-99%
<7> All
[PAGE BREAK]
Now please think about interactions your company has had with universities, faculty, or other individuals at universities in the past three years.
<OUNIP>
In the last THREE years, has your company approached or been approached by a university suggesting a research project prior to the patenting stage?
<1> Yes
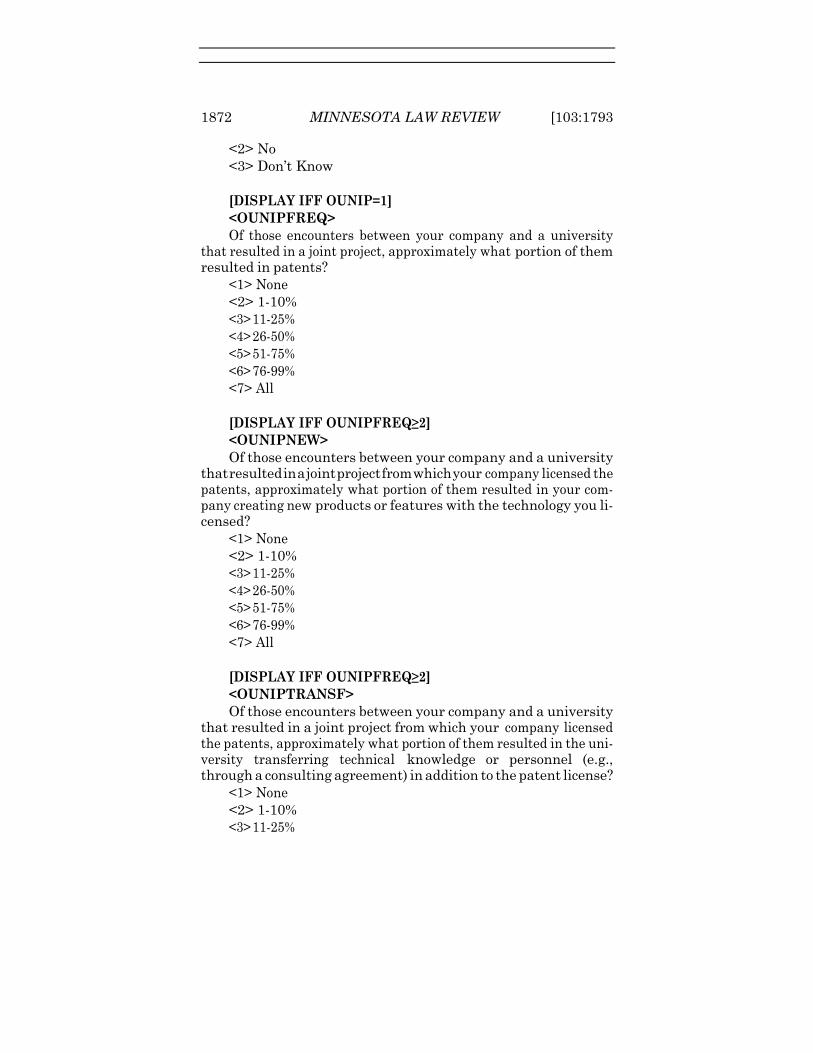
1872 MINNESOTA LAW REVIEW [103:1793
<2> No
<3> Don’t Know
[DISPLAY IFF OUNIP=1]
<OUNIPFREQ>
Of those encounters between your company and a university that resulted in a joint project, approximately what portion of them resulted in patents?
<1> None
<2> 1-10%
<3> 11-25%
<4> 26-50%
<5> 51-75%
<6> 76-99%
<7> All
[DISPLAY IFF OUNIPFREQ≥2]
<OUNIPNEW>
Of those encounters between your company and a university that resulted in a joint project from which your company licensed the patents, approximately what portion of them resulted in your com-pany creating new products or features with the technology you li-censed?
<1> None
<2> 1-10%
<3> 11-25%
<4> 26-50%
<5> 51-75%
<6> 76-99%
<7> All
[DISPLAY IFF OUNIPFREQ≥2]
<OUNIPTRANSF>
Of those encounters between your company and a university that resulted in a joint project from which your company licensed the patents, approximately what portion of them resulted in the uni-versity transferring technical knowledge or personnel (e.g., through a consulting agreement) in addition to the patent license?
<1> None
<2> 1-10%
<3> 11-25%

2019] SOUND AND FURY 1873
<4> 26-50%
<5> 51-75%
<6> 76-99%
<7> All
[PAGE BREAK]
Now please think about interactions your company has had with federal labs, federal facilities, federal research centers, and other federal government sources in the last three years. As noted earlier, some examples of federal government sources in-clude Department of Energy national labs, NASA research cen-ters, and NIH centers or institutes.
<OFEDP>
In the last THREE years, has your company approached or been approached by a federal lab, facility, or research center suggesting a research project prior to the patenting stage?
<1> Yes
<2> No
<3> Don’t Know
[DISPLAY IFF OFEDP=1]
<OFEDPFREQ>
Of those encounters between your company and a federal entity that resulted in a joint project, approximately what portion of them resulted in patents?
<1> None
<2> 1-10%
<3> 11-25%
<4> 26-50%
<5> 51-75%
<6> 76-99%
<7> All
[DISPLAY IFF OFEDPFREQ≥2]
<OFEDPNEW>
Of those encounters between your company and a federal en-tity that resulted in a joint project from which your company li-censed the patents, approximately what portion of them resulted in your company creating new products or features with the technol-ogy you licensed?

1874 MINNESOTA LAW REVIEW [103:1793
<1> None
<2> 1-10%
<3> 11-25%
<4> 26-50%
<5> 51-75%
<6> 76-99%
<7> All
[DISPLAY IFF OFEDPFREQ≥2]
<OFEDPTRANSF>
Of those encounters between your company and a federal en-tity that resulted in a joint project from which your company li-censed the patents, approximately what portion of them resulted in the federal entity transferring technical knowledge or personnel (e.g., through a consulting agreement) in addition to the patent li-cense?
<1> None
<2> 1-10%
<3> 11-25%
<4> 26-50%
<5> 51-75%
<6>76-99%
<7>All
[PAGE BREAK]
This final set of questions is for demographic purposes and is only in-tended for analyses in the aggregate, to give us a better sense of the busi-ness landscape.
<JOB>
Which of the following best describes your job position in your company?
<1> Counsel for patent or intellectual property
<2> Counsel for other specialized area
<3> General counsel
<4> Operations manager
<5> Director or other senior management (non-legal)
<6> CEO, owner, or other executive management (non-le-gal)
<7> Other, please specify: [ENTER TEXT]

2019] SOUND AND FURY 1875
<INDUSTRY>
What is your company’s primary business sector?
<1> Information technology, computers, and related fields (in-cluding other electronics, software, communications, and semicon-ductors)
<2> Chemistry (excluding life sciences)
<3> Energy
<4> Life sciences (including pharmaceutical, biotechnology, medical devices, methods, or other medical)
<5> Transportation
<6> Other, please specify: [ENTER TEXT]
<HQ>
Where is your company headquartered?
[DROPDOWN MENU RESPONSE CHOICES]
<1>Alabama
<2>Alaska
<3>Arizona
<4>Arkansas
<5>California (No.)
<6>California (So.)
<7>Colorado
<8>Connecticut
<9>Delaware
<10>District of Columbia
<11>Florida
<12>Georgia
<13>Hawaii
<14>Idaho
<15>Illinois
<16>Indiana
<17>Iowa
<18>Kansas
<19>Kentucky
<20>Louisiana
<21>Maine
<22>Maryland
<23>Massachusetts
<24>Michigan
<25>Minnesota

1876 MINNESOTA LAW REVIEW [103:1793
<26>Mississippi
<27>Missouri
<28>Montana
<29>Nebraska
<30>Nevada
<31>New Hampshire
<32>New Jersey
<33>New Mexico
<34>New York
<35>North Carolina
<36>North Dakota
<37>Ohio
<38>Oklahoma
<39>Oregon
<40>Pennsylvania
<41>Rhode Island
<42>South Carolina
<43>South Dakota
<44>Tennessee
<45>Texas
<46>Utah
<47>Vermont
<48>Virginia
<49>Washington
<50>West Virginia
<51>Wisconsin
<52>Wyoming
<REVENUE>
What is your company’s annual revenue? Please note that all sur-vey data are anonymous and analyzed in the aggregate only. No re-sponse will be associated with individual respondents.
<1> Less than $5 Million
<2> $6 Million - $10 Million
<3> $11 Million - $50 Million
<4> $51 Million - $100 Million
<5> More than $100 Million
[PAGE BREAK]
<COMM>

2019] SOUND AND FURY 1877
If you would like to elaborate on your answers to any of the ques-tions from the survey, please add your comments here: [ENTER LONG TEXT]
[PAGE BREAK]
<CONTACT>
If you would like a report of the study findings or other infor-mation once the study concludes, please enter your name and email address below.
Please note that all survey data are anonymous and your contact information will not be associated with individual survey responses.
FIRST NAME: [ENTER TEXT]
LAST NAME: [ENTER TEXT]
EMAIL ADDRESS: [ENTER TEXT, EMAIL VALIDATION]