"the spanish electricity system 2015 p34" - inicio spanish electricity system 2015 6...
TRANSCRIPT

THE SPANISH ELECTRICITY SYSTEM
2015
P.º del Conde de los Gaitanes, 17728109 Alcobendas (Madrid)
www.ree.es


1
presentation / 2
electricity transmission / 62
electricity markets / 80
european scope / 94
regulatory framework / 100
glossary of terms / 106
executive summary / 4
electricity generation / 26
international energy exchanges / 46
electricity demand / 12
THE SPANISH ELECTRICITY SYSTEM Table of contents

presentation

3
Red Eléctrica de España (REE) as the sole transmission agent and operator (TSO) of the Spanish electricity system, presents a new edi-tion of the Spanish Electricity System Report, which it has been pu-blishing annually since it was created as TSO in 1985. This publication provides an overview of the main operational statistics of the Spanish electricity system in 2015.
In this edition, compared to the previous report, Red Eléctrica has in-troduced changes in the approach, content and layout of the report so as to adapt it to current communication trends and media tools. The report has been drafted bearing in mind the desire for it to be-come a tool for the dissemination of information about the system and to reach a greater number of users without losing the rigor and quality of the information. The data tables have been removed from the printed version and greater emphasis has been placed on the descriptive part. Among the features of this new publication is the in-clusion of greater analytical content, including indicators of electricity consumption by sector as well as broader information regarding the Spanish electricity system as a whole.
This report is supplemented by Excel files that provide a more com-prehensive set of information and which allow data to be downloa-ded. These files and the digital version of this report can be acces-sed through the company website: www.ree.es.
With the aim of improving and providing a better quality of service for all users, we are making the following email address [email protected] available to you, through which you may send us your sugges-tions and comments.
THE SPANISH ELECTRICITY SYSTEM Presentation

executive summary

5
THE SPANISH ELECTRICITY SYSTEM Executive summary
Electrical energy demand in Spain recovered in 2015 after four consecutive years of decline. Specifically, gross demand grew by 1.9% over the previous year, with increases in all electricity systems except Ceuta.
In the peninsular system, which represents more than 94% of the total demand in Spain, electricity consumption was 1.8% higher than in 2014. After having factored in the effects of seasonal and working patterns, the demand mainly attributable to economic ac-tivity grew by 1.6%.
By large sectors of activity, according to the Red Eléctrica Index (IRE) which collects demand data from large consumers of electri-city, the industrial IRE, which represents about 30% of the electri-city demand, registered a growth of 2.9% (2.8% after factoring in the effects of temperature and working patterns), while the IRE for the services sector, which accounts for about 13% of the demand, grew just 0.3% (-0.5% after factoring in the effects of seasonal and working patterns).
By geographical areas, electricity demand year-on-year showed an overall growth in all autonomous communities, with the exception of the decreases of over 2% registered in Ceuta and Cantabria, and those registered in Castilla-La Mancha and Galicia which were less than 1%. In contrast, noteworthy is growth in demand of over 2% in autonomous communities in the South and in the Mediterranean coastal areas.
In relation to the maximum demand figures, the maximum peak de-mand in the Spanish peninsular system was set on 4 February at 7:56 pm registering 40,726 MW, the highest figure since 2013, but well be-low the all-time high of 45,450 registered in December 2007.

THE SPANISH ELECTRICITY SYSTEM 2015
6
www.ree.es
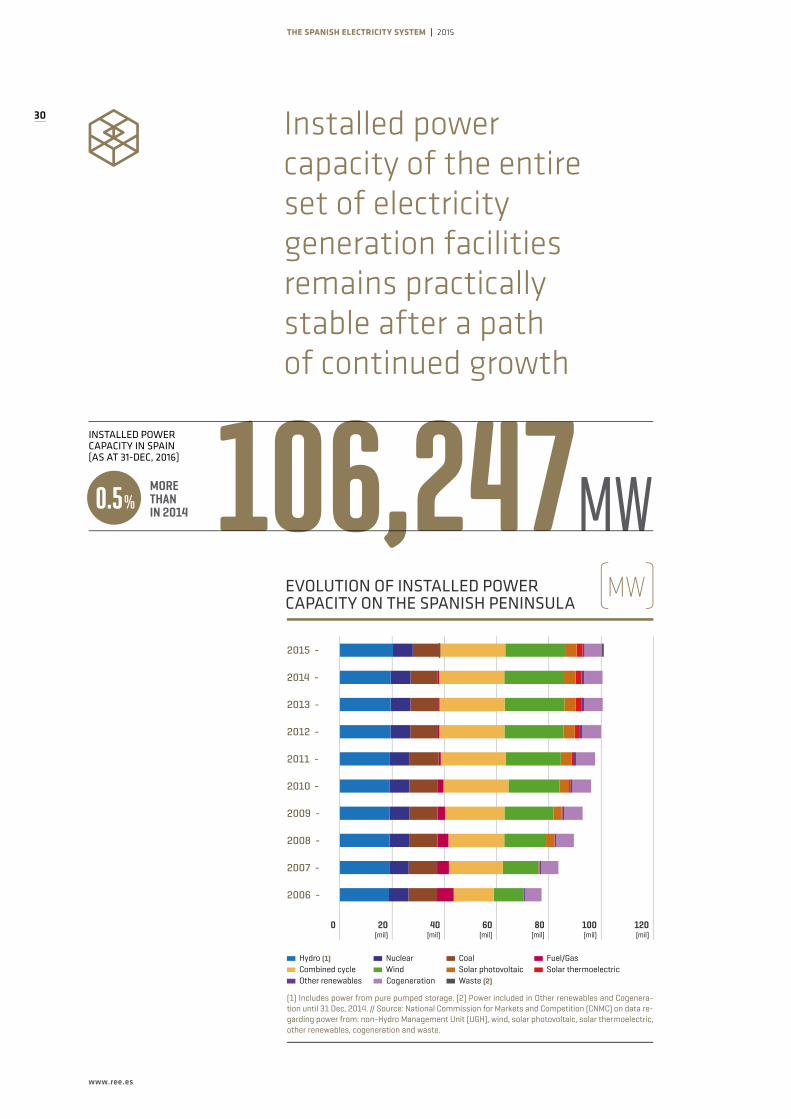
Installed power capacity of the entire set of generating facilities in Spain remained virtually stable at the end of the year with 106,247 MW, only 0.5 % more than in 2014. This increase is due mainly to the com-missioning of a new 878 MW pure pumped-storage hydroelectric power station and a new 23 MW hydroelectric power station, which has helped offset the closure of an existing 506 MW power station, which actually was the very last fuel-gas fired power station on the Spanish Peninsula.
As for electricity generation, renewable energy continued to maintain a prominent role within the entire set of generation facilities on the pe-ninsula, but its share in the generation mix dropped to 36.9% (42.8% in 2014). This decline is mainly due to the variability of hydroelectricity and wind power generation that have registered decreases compared to 2014 of 27.5% and 5.8%, respectively.
As a result, non-renewable energies on the peninsula have increased their share in the generation mix to 63.1 % (57.2 in 2014), with signi-ficant increases in coal-fired generation (23.8 %) and combined cycle (18.7 %) with regard to figures registered in the previous year.
NATIONAL DEMAND 2015 263 TWh
Demand for electrical
energy in Spain breaks
the downward trend
registered in the
last four years
ELECTRICITY CONSUMPTION LARGE CONSUMERS COMPARED TO 2014
+2.9% +0.3%
NATIONAL DEMAND COMPARED TO 2014
+1.9%
INDUSTRIAL / SERVICES

7
THE SPANISH ELECTRICITY SYSTEM Executive summary
36.9%
By technology, electricity production on the peninsula during 2015 was generated by the following technologies: 21.8% from nuclear power stations (22.0% in 2014), coal 20.3% (16.5% in 2014), 19% by wind power (20.3% in 2014), 11.0% by hydroelectric power stations (15.5% in 2014) and the remaining 27.9% was distributed across combined cycle (10.1%), cogeneration (10.1%), solar (5.1%) and other (waste and other renewable 2.6%).
CO2 emissions resulting from electricity generation in Spain increa-sed in 2015, mainly due to the need to offset the lower hydroelectric and wind power production by increasing generation using coal-fired and combined cycle power stations. Thus, the level of CO2 emissions from the Spanish electricity sector in 2015 stood at 77.4 million ton-nes, 15.1% higher than emissions in 2014.
RENEWABLE ENERGY
WITH REGARD TO TOTAL GENERATION ON THE PENINSULA
NUCLEAR
COAL
OTHER
HYDRO
ELECTRICITY GENERATION MIX - PENINSULAR SYSTEM 2015 (%)
CO2 emissions
rise due to lower
hydroelectric and
wind power generation
21.8 20.3 11.0 27.9
WIND
19.0

THE SPANISH ELECTRICITY SYSTEM 2015
8
www.ree.es
The net balance of the energy exchange programmes with other countries was again as an exporter, although this fell to 147 GWh, 95.7% lower than 2014 and the lowest value of all the historical series. Exports dropped to 11,725 GWh, 10.2% less than the previous year, while imports increased to 11,578 GWh, 20.0% more than in 2014.
By interconnection, for yet another year Spain was a net exporter with all neighbouring countries except for the interconnection with France, which recorded an importer balance of 7,320 GWh, a value 105.4% higher than in 2014. For the interconnections with Portugal and Andorra, with respect to the previous year, the export balance increased by 151.7% and 12.5%, respectively, while with Morocco it decreased by 14.4%.
The electricity transmission grid experienced a further boost in 2015 with the commissioning of 414 km of circuit, 136 new substa-tion bays and 855 MVA of transformer capacity. With this, at the end of the year the infrastructure of the Spanish grid stood at 43,124 km of circuit, 5,548 substation bays and 84,794 MVA.
Among the projects completed in 2015, noteworthy was the insta-llation of the first cable of the link connecting the islands of Major-ca and Ibiza, of which 118 km is a submarine section and 8 km is an underground land section. This link, whose submarine section runs at a depth of 800 metres, is the world's longest link in alterna-ting current and is a major project for the reliability and security of supply on the islands and that allows to reduce the current situation regarding Ibiza’s electrical isolation.
Similarly, noteworthy in 2015 was the bringing into service of the di-rect current line between Santa Llogaia (Spain) and Baixas (France). With this new interconnection the capacity between both countries has doubled up to 2,800 MW.
414BROUGHT INTO SERVICE IN 2015
KILOMETRES OF CIRCUIT
MAJORCA-IBIZA LINK
118 km
8 km
SUBMARINE SECTION
UNDERGROUND LAND SECTION

9
THE SPANISH ELECTRICITY SYSTEM Executive summary
Service quality indicators have shown for yet another year the good performance of the transmission grid. Continuity of supply indica-tors, which take into account actual supply disruptions to end users as a result of incidents in the transmission grid, have improved in all electricity systems. Specifically, ENS (Energy Not Supplied) in the Spanish peninsular system was 53 MWh, compared to 204 MWh in 2014. Similarly, ENS in the systems of the Balearic Islands and the Canary Islands were 7 MWh (13 MWh in 2014) and 29 MWh (64 MWh in 2014) respectively.
In relation with the above data, AIT (Average Interruption Time) in the Spanish Peninsula stood at 0.11 minutes, 0.62 minutes in the Balearic Islands and 1.76 minutes in the Canary Islands. In all cases these values were lower than the previous year’s and well below the reference value of 15 minutes set out in Royal Decree 1955/2000. These values and those regarding ENS are pending audit and there-fore are provisional.
Service quality indicators have improved in all electricity systems
AIT20150.11 Min20140.44 Min
AVERAGE INTERRUPTION TIME – PENINSULAR SYSTEM
53 MWh
204 MWh
ENSENERGY NOT SUPPLIED PENINSULAR SYSTEM
2015
2014
7MWh
29MWh
BALEARIC ISLANDS
CANARY ISLANDS
ENS OF THE BALEARIC ISLANDS’ SYSTEM AND THE CANARY ISLANDS’ SYSTEM IN 2015
64 MWh IN 2014
13 MWh IN 2014

THE SPANISH ELECTRICITY SYSTEM 2015
10
www.ree.es
Meanwhile, the grid availability index gauges the capacity or possi-bility of the system to use the various elements of the transmission grid. In 2015, the value of this index (provisional data pending audit) in the peninsular system was 97.94% (98.19% in 2014) and in the Balearic Islands’ and Canary Islands’ electricity system, values were 96.88% and 96.76% respectively (98.01% and 98.37% in 2014).
The Electricity Transmission Grid Planning 2015-2020, approved on 16 October 2015 by the Council of Ministers, envisages an inves-tment of 4.554 billion euros for the period. Among the planned ac-tions, noteworthy is the development of international interconnec-tions. With France, the installation of a phase shifting transformer in the Arkale-Argia 220 kV interconnection line is foreseen for 2017, that will help strengthen the cross-border network of the Basque Country, additionally a new interconnection project with Portugal is included in area of Galicia. Both projects are considered Projects of Common Interest (PCI) by the European Union.
Furthermore, the planning contemplates the development of in-sular interconnections, which include eight new links (five in the Balearic Islands and three in the Canary Islands) and a link between the Spanish Peninsula and Ceuta.
The planning
2015-2020 envisages
an investment of
4.554 billion euros
9 5 IN THE BALEARIC ISLANDS
3 IN THE CANARY ISLANDS
1 BETWEEN CEUTA AND THE PENINSULALINKS
NEW
PLANNEDACTIONINTERCONNECTION WITH FRANCE THAT WILL STRENGTHEN THE CROSS-BORDER NETWORK OF THE BASQUE COUNTRY

11
THE SPANISH ELECTRICITY SYSTEM Executive summary
Also noteworthy is that the Planning 2015-2020 includes a non-binding annex that covers a series of actions considered necessary with a post-2020 horizon, the most relevant being the development of new interconnections with France; a direct current submarine link via the Bay of Biscay and two more links through Navarra and Aragon. All these actions are projects classified as PCIs. This annex also includes other relevant projects such as a second Peninsula-Majorca link, the third Ibiza-Majorca link and the first Gran Canaria-Fuerteventura link.
The average final price for the acquisition of energy in the electri-city market was 62.9 €/MWh, 14.2% higher than the price in 2014. Similarly, the final energy contracted in the electricity market (refe-rence supply companies plus free market contracting) was 3.5% hig-her than the previous year.
During 2015, the combined price of the day-ahead and intraday mar-kets accounted for 82.2% of the final price, the system adjustment services 6.8%, capacity payments 8% and the interruptibility service the remaining 3%.
COMPONENTS OF THE PRICE ( )%
DAY-AHEAD AND INTRADAY MARKETS
82.2
ADJUSTMENT SERVICES
6.8CAPACITY
PAYMENTS
8 INTERRUPTIBILITY SERVICE
3

electricity demand

13
CHAP. 1 | Electricity demand
In 2015, the demand for electrical energy in Spain reached 262,931 GWh, an increase of 1.9% over the previous year. This is the first year that positive changes in electricity consumption have been re-gistered since 2010, when demand in Spain grew by 2.8%.
By systems, demand grew in all of them except Ceuta which regis-tered a fall of 3.2%. With regard to the peninsular system, which re-presents more than 94% of the total Spanish electricity demand, a total demand of 248,047 GWh was reached; representing a growth of 1.8% compared to 2014.
In 2015,
electricity
consumption
in Spain
recovered
a positive
growth rate
not seen
since 2010

14
www.ree.es
THE SPANISH ELECTRICITY SYSTEM 2015
Despite this growth, the peninsular electricity consumption in 2015 reached levels only slightly higher than those in 2005, when a level of 246,184 GWh was registered.
From the point of view of economic activity, this year showed a con-solidation in the evolution of the activity after the positive figure recorded in 2014. Thus, the Gross Domestic Product (GDP) in 2015 grew by 3.2% compared to 2014, maintaining an upward trend until the third quarter of the year and registering a slightly slower pace of growth in the last quarter.
EVOLUTION OF PENINSULAR DEMAND AT POWER STATION BUSBARS IN THE LAST 10 YEARS
230 235 240 245 250 255 260 265 270
255
262
265
253
261
256
252
246
244
2015 -
2014 -
2013 -
2012 -
2011 -
2010 -
2009 -
2008 -
2007 -
2006 -
( )TWh
248
DEMAND ON THE PENINSULAR SYSTEM COMPARED TO 2014
1.8%
ANNUAL VARIATION OF PENINSULAR DEMAND AND SPANISH GDP
6
4
2
0
-2
-4
-6
Adjusted demand % GDP
2006 2007 2008 2009 2010 2011 2012 2013 2014 2015
3.23.8
0.0
-2.6
4.6
0.7-1.0
-2.2
-0.1
-4.7
1.6
4.32.7
-1.8
4.21.1
-1.0-1.7
1.4
-3.6
( )%

15
CHAP. 1 | Electricity demand
The good performance of the activity of the Spanish economy has not translated into an increase in demand for electricity of equal magnitude. The adjusted peninsular electricity demand (after ha-ving factored in temperature and working patterns) grew by 1.6% over the previous year. This represents an elasticity with regard to GDP of 0.5, a value which is 0.8 lower than the average elasticity for the period 1991-2014 which stood at 1.3. In any case, the elasticity of this year contrasts with the situation last year in which there was an increase in economic activity while electricity demand still showed negative variations compared to the previous year.
Adjusted peninsular
electricity demand
grew by 1.6%
year-on-year
Effects
Demand at busbars Working patterns Temperature Adjusted
2006 3.6 -0.1 -0.9 4.6
2007 2.9 0.0 -1.3 4.3
2008 1.1 0.4 -0.1 0.7
2009 -4.7 -0.5 0.4 -4.7
2010 3.1 0.1 0.4 2.7
2011 -1.9 0.1 -1.0 -1.0
2012 -1.4 -0.3 0.7 -1.8
2013 -2.2 0.2 -0.3 -2.2
2014 -1.1 0.0 -1.0 -0.1
2015 1.8 -0.1 0.4 1.6
PENINSULAR DEMAND VARIATIONYEARLY BREAKDOWN
( )%
1.6%
ADJUSTED PENINSULAR DEMAND GROWTH COMPARED TO THE PREVIOUS YEAR
0.8 POINTS LESS THAN THE AVERAGE AVERAGE
1991-2014
ELASTICITY OF DEMAND 2015 0.5 1.3

16
www.ree.es
THE SPANISH ELECTRICITY SYSTEM 2015
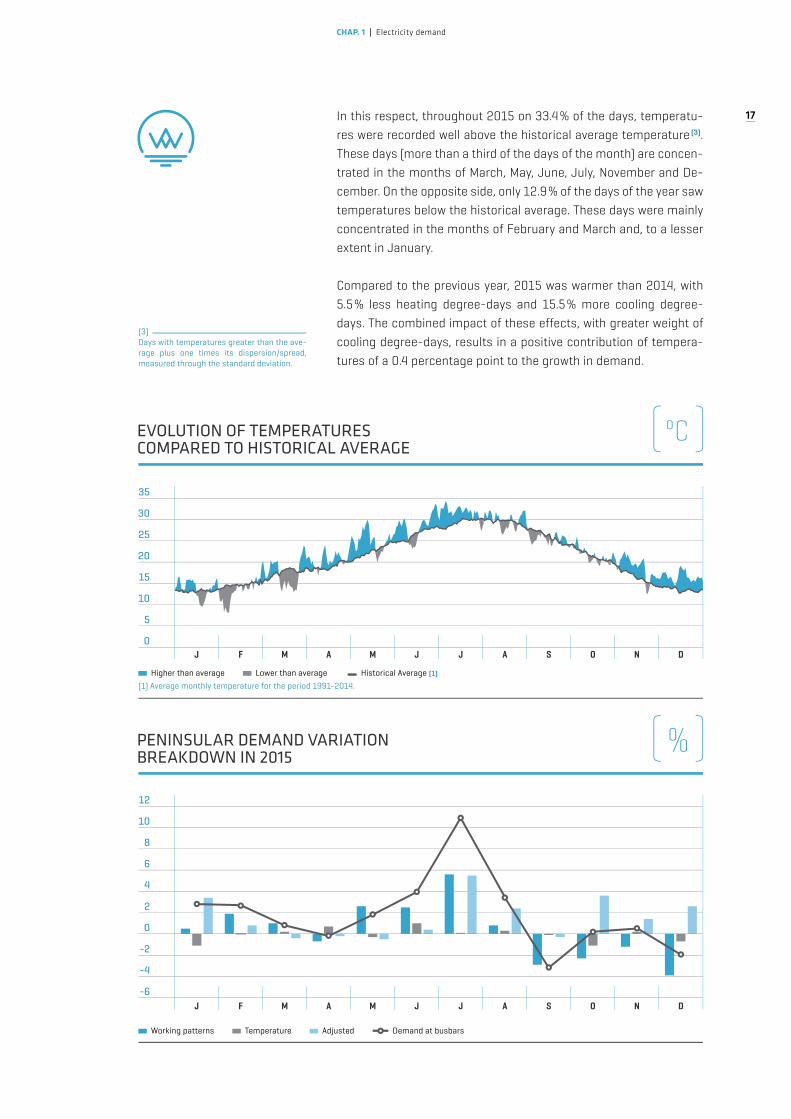
The trend of the adjusted peninsular demand throughout the year reflects two distinct periods. During the first half of the year, demand showed signs of stagnation with inter-year growth ranging between 0.0% and 0.3%. As of July, and throughout the second half of the year, the evolution of the demand accelerated to the end of the year with the previously indicated overall growth of 1.6%.
From the point of view of the influence of temperature on the de-mand, the same occurred as in 2014, throughout 2015 temperatures have been warmer than those corresponding to the historical avera-ge (1). The heating degree-days (2) were 16.6% lower than the average values and cooling degree-days were 30% higher than the average values of the period considered. That is to say, the year from a clima-te-electricity point of view has been milder in the winter and warmer in the summer.
(1) Average maximum daily temperatures in the pe-riod 1989-2013.
(2) Heating degree-days are defined as those days registering centigrade degrees below 20ºC, while cooling degree-days are defined as those days registering centigrade degrees above 23ºC.
HIGHTEMPERATURESCONTRIBUTED TO A POSITIVE VARIATION IN THE DEMAND
( )MONTHLY VARIATION IN ADJUSTED PENINSULAR DEMAND
% Month % Rolling year
10
8
6
4
2
0
-2
-4J F M A M J J A S O N D
%
MONTHLY EVOLUTION OF MAXIMUM TEMPERATURES
Historical Average (1) 2014 2015
(1) Average monthly temperature for the period 1991-2014.
35
30
25
20
15
10
5
0J F M A M J J A S O N D
( )ºC
17
CHAP. 1 | Electricity demand
In this respect, throughout 2015 on 33.4% of the days, temperatu-res were recorded well above the historical average temperature (3). These days (more than a third of the days of the month) are concen-trated in the months of March, May, June, July, November and De-cember. On the opposite side, only 12.9% of the days of the year saw temperatures below the historical average. These days were mainly concentrated in the months of February and March and, to a lesser extent in January.
Compared to the previous year, 2015 was warmer than 2014, with 5.5% less heating degree-days and 15.5% more cooling degree-days. The combined impact of these effects, with greater weight of cooling degree-days, results in a positive contribution of tempera-tures of a 0.4 percentage point to the growth in demand.
(3)Days with temperatures greater than the ave-rage plus one times its dispersion/spread, measured through the standard deviation.
( )ºCEVOLUTION OF TEMPERATURES COMPARED TO HISTORICAL AVERAGE
35
30
25
20
15
10
5
0
Higher than average Lower than average Historical Average (1)
(1) Average monthly temperature for the period 1991-2014.
J F M A M J J A S O N D
PENINSULAR DEMAND VARIATION BREAKDOWN IN 2015
Working patterns Temperature Adjusted Demand at busbars
12
10
8
6
4
2
0
-2
-4
-6J F M A M J J A S O N D
( )%

18
www.ree.es
THE SPANISH ELECTRICITY SYSTEM 2015
The Red Eléctrica Index (IRE) is a leading electricity indicator that shows the evolution of electricity consumption of companies whose volume of power consumption is medium/high (contracted power of over 450 kW). This index is published including data both at a general level and detailed by sector of activity (National Statistics Institute) and is available approximately 22 days after the end of the month.
In 2015, the IRE reached a value of 100.3 compared to the refe-rence year (2010), an increase of 2.3% over the previous year, this being the second consecutive year that IRE has showed positive rates of change. The value of the index reached in 2015 means that, after two years of growth, the levels (0.3% more) of the reference year would have been recovered.
Demand from large
consumers grew
throughout 2015 although
at a slower pace than the
previous year
COMPOSITION OF THE GENERAL IRE
INDUSTRY
SERVICES
OTHERS
63.1 9.727.2
( )%
ENERGY, WATER AND WASTE
MINING AND QUARRYING
PRIMARY SECTOR
CONSTRUCTION
5.7
1.5
1.5
1
RED ELÉCTRICA INDEX (IRE)
COMPANIESCONSUMPTIONLEVEL +450kW
CONTRACTED POWERMEDIUM
LOW
GROWTH OF THE GENERAL IRE COMPARED TO THE PREVIOUS YEAR
2.3%
HIGH
19
CHAP. 1 | Electricity demand
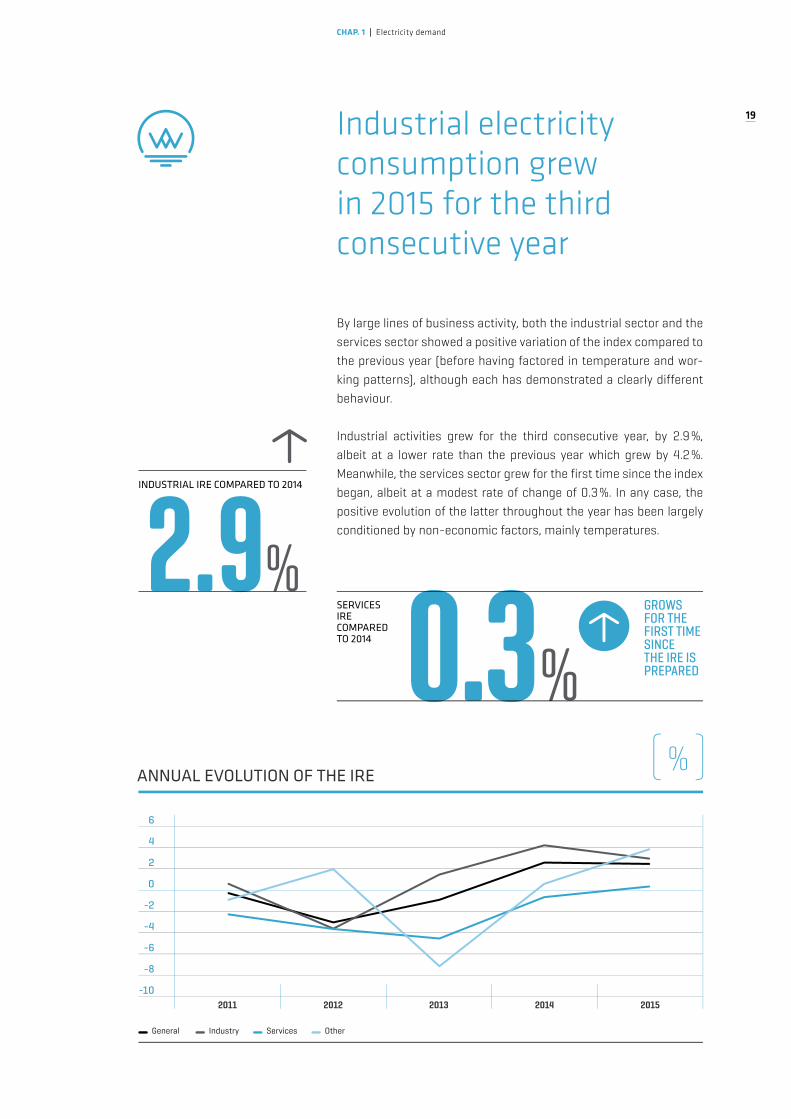
By large lines of business activity, both the industrial sector and the services sector showed a positive variation of the index compared to the previous year (before having factored in temperature and wor-king patterns), although each has demonstrated a clearly different behaviour.
Industrial activities grew for the third consecutive year, by 2.9%, albeit at a lower rate than the previous year which grew by 4.2%. Meanwhile, the services sector grew for the first time since the index began, albeit at a modest rate of change of 0.3 %. In any case, the positive evolution of the latter throughout the year has been largely conditioned by non-economic factors, mainly temperatures.
Industrial electricity
consumption grew
in 2015 for the third
consecutive year
INDUSTRIAL IRE COMPARED TO 2014
2.9%
%
GROWS FOR THE FIRST TIME SINCE THE IRE IS PREPARED
SERVICES IRE COMPARED TO 2014 0.3
ANNUAL EVOLUTION OF THE IRE
General Industry Services Other
6
4
2
0
-2
-4
-6
-8
-102011 2012 2013 2014 2015
( )%

20
www.ree.es
THE SPANISH ELECTRICITY SYSTEM 2015
Throughout the whole of 2015, both seasonal working patterns and the temperatures had a positive influence on the evolution of the IRE, jointly contributing 0.3% to its growth. This positive contribu-tion is mainly due to the influence of temperatures as the impact due to working patterns was less than one tenth. After deducting both effects, the general index rose 2.0% over the previous year, representing (the same as the gross value) the second consecutive year with a positive variation of the index, albeit showing a greater slowdown in the growth, being 0.6 percentage points lower than the growth registered in 2014.
For the first time ever
the adjusted IRE for the
services sector has had a
positive contribution to
the evolution of the index
In the monthly evolution of the two major sector groupings (in-dustry and services), the adjusted growth of the industrial sectors has been more than 2.0% in almost every month of the year (the minimum growth occurred in February with a value of 1.8%) and it has shown less volatility than in 2014, indicating a certain level of stabilisation in its evolution. The services sector, however, has shown high volatility, with variations over the previous year ranging from -3.9% in May and 3.6% in July, meaning that the consump-tion of these sectors this year has not yet finished breaking an upward trend.
The monthly evolution of the two large sector groupings indicated in the previous paragraph reflects that the evolution trend of both
2015 ADJUSTED MAXIMUM MONTHLY GROWTH OF THE SERVICES IRE
3.6%
IN THE MONTH OF JULY
Effects
IRE Working patterns Temperature Adjusted
General 2.3 0.0 0.3 2.0
Industry 2.9 0.0 0.0 2.8
Services 0.3 0.0 0.7 -0.5
Other 3.8 0.1 1.5 2.2
IRE: VARIATION BREAKDOWN IN 2015
( )%
ADJUSTED GENERAL INDEX COMPARED TO 2014
2.0%

21
CHAP. 1 | Electricity demand
figures in 2015 has shown signs of a slowdown in relation to the evolution shown in the previous year.
The industrial sectors reached a peak in adjusted demand growth of 4.3% in January. As of that month, it began a gradual downward trend in its growth rate till the end of the year, closing the year with a variation of 2.8% (1.4% less) compared to the previous year, showing a gradual slowdown as a sector grouping whose activity is considered revitalising in relation to consumption.
The services sector, which in 2014 showed, in a surprisingly fast manner, a progressive reduction in their rate of decline, has not confirmed this trend in 2015 as the rate of decline in consumption stabilised at values of around 0.5%.
MONTHLY EVOLUTION OF THE ADJUSTED IRE
8
6
4
2
0
-2
-4
-6
-8
General Industry Services
( )%
J F M A M J J A S O N D J F M A M J J A S O N D2014 2015
MONTHLY TREND OF THE ADJUSTED IRE
8
6
4
2
0
-2
-4
-6
-8
General Industry Services
2011 2012 2013 2014 2015
( )%

22
www.ree.es
THE SPANISH ELECTRICITY SYSTEM 2015
The evolution of the demand by geographical area compared to the previous year shows a high spread with a range between a po-sitive growth of 5.2% in the Region of Murcia and a maximum fall in demand of 3.2% in Ceuta and 2.6% in Cantabria.
Despite this high spread regarding the variation in demand, the highest growth is located along the Mediterranean coastal area and in the south where, due to the high temperatures in the sum-mer months, there have been increases in excess of 3 %, except in Catalonia, which registered a value of 2.1 %. Most of the autono-mous communities in the interior and in the north registered po-sitive growth, but below the average, except for Galicia, Cantabria and Castilla-La Mancha.
DEMAND BY AUTONOMOUS COMMUNITY AND VARIATION WITH REGARD TO THE PREVIOUS YEAR
>-3 % ≤-3% a < 0% ≥ 0% a ≤ 2% > 2%
GROWTHHIGHESTCOASTAL AREAS OF THE MEDITERRANEAN AND IN THE SOUTH
CASTILLA-LA MANCHA-0.7 % 11,567 GWh
ANDALUCÍA3.6 % 38,879 GWh
CASTILLA Y LEÓN1.4 % 13,752 GWh
ARAGÓN1.6 % 10,253 GWh
NAVARRA1.2 % 4,835 GWh
CATALUÑA2.1 % 46,569 GWh
BALEARES3.8 %
5,796 GWh
LA RIOJA1.4 %
1,714 GWh
GALICIA-0.7 % 19,615 GWh
ASTURIAS1.1 % 10,422 GWh
CANTABRIA-2.6 % 4,208 GWh
PAÍS VASCO0.6 % 16,890 GWh
COMUNIDAD VALENCIANA3.5 % 26,788 GWh
MADRID1.4 % 28,842 GWh
EXTREMADURA3.7 %
4,809 GWh
MURCIA5.2 % 8,905 GWh
CEUTA-3.2 % 205 GWh
MELILLA1.7 %213 GWh
CANARIAS1.0 % 8,669 GWh

23
CHAP. 1 | Electricity demand
The maximum instantaneous demand on the Spanish Peninsula during 2015 was recorded on 4 February at 7:56 pm at 40,726 MW. This value is higher, by just 534 MW, than the maximum for the summer months recorded on 21 July at 1:33 pm with 40,192 MW. Noteworthy is that the absolute maximum of the year was the hig-hest since 2012 and the summer maximum was the highest since 2010 when the all-time high was recorded in this season.
The maximum hourly demand figures for the cold and hot months have been higher than those recorded in 2014
MAXIMUM ANNUAL VALUES FOR INSTANTANEOUS DEMAND ON THE SPANISH PENINSULA
Summer (June-September) Winter (January-May / October-December)
2015 -
2014 -
2013 -
2012 -
2011 -
2010 -
2009 -
2008 -
2007 -
2006 -
0 10,000 20,000 30,000 40,000 50,000
( )MW
ALL-TIME HIGH
45,450
MW
MAXIMUM INSTANTANEOUS DEMAND ON THE PENINSULA 40,726 4-FEB/7:56 pm
COMPARISON
45,450MW
WITH ALL-TIME HIGH
RECORDED IN 2007
YEAR 2015
40,726MW
-10,4%
24
www.ree.es
THE SPANISH ELECTRICITY SYSTEM 2015
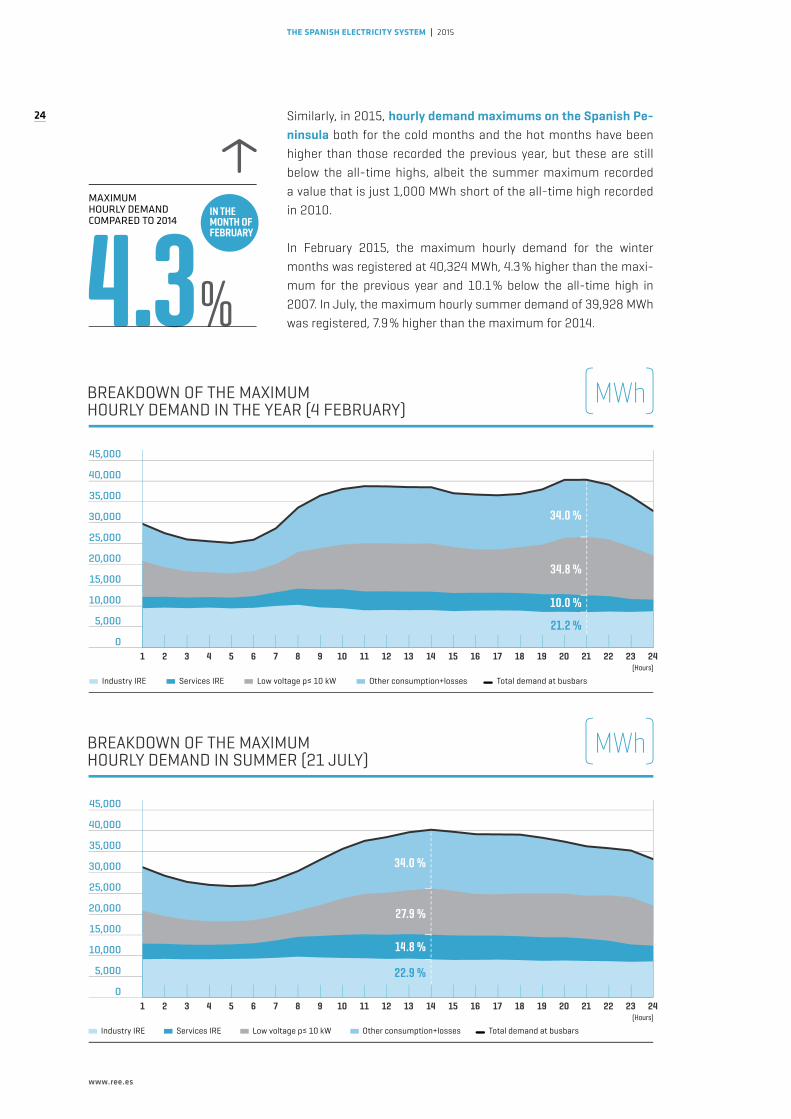
Similarly, in 2015, hourly demand maximums on the Spanish Pe-ninsula both for the cold months and the hot months have been higher than those recorded the previous year, but these are still below the all-time highs, albeit the summer maximum recorded a value that is just 1,000 MWh short of the all-time high recorded in 2010.
In February 2015, the maximum hourly demand for the winter months was registered at 40,324 MWh, 4.3% higher than the maxi-mum for the previous year and 10.1% below the all-time high in 2007. In July, the maximum hourly summer demand of 39,928 MWh was registered, 7.9% higher than the maximum for 2014.
MAXIMUM HOURLY DEMANDCOMPARED TO 2014
4.3%
IN THE MONTH OF FEBRUARY
45,000
40,000
35,000
30,000
25,000
20,000
15,000
10,000
5,000
0
45,000
40,000
35,000
30,000
25,000
20,000
15,000
10,000
5,000
0
Industry IRE Services IRE Low voltage p≤ 10 kW Other consumption+losses Total demand at busbars
1 2 3 4 5 6 7 8 9 10 11 12 13 14 15 16 17 18 19 20 21 22 23 24 (Hours)
21.2 %
110.0 %
334.8 %
334.0 %
Industry IRE Services IRE Low voltage p≤ 10 kW Other consumption+losses Total demand at busbars
1 2 3 4 5 6 7 8 9 10 11 12 13 14 15 16 17 18 19 20 21 22 23 24 (Hours)
BREAKDOWN OF THE MAXIMUM HOURLY DEMAND IN SUMMER (21 JULY)
( )MWh
22.9 %
1114.8 %
2227.9 %
3334.0 %
BREAKDOWN OF THE MAXIMUM HOURLY DEMAND IN THE YEAR (4 FEBRUARY)
( )MWh

25
CHAP. 1 | Electricity demand
It is worth noting that the difference between the maximum hourly winter demand and that for the summer has been less than 400 MW and variations in the annual maximums were higher than the growth in demand.
At the peak time of the day of maximum hourly demand(4) of the year, the residential sector(5) accounted for 34.8% of consumption, while industrial consumption in the IRE accounted for 21.2% and large consumers in the services sector in the IRE represented 10%. During the day of peak consumption, the greatest share of the in-dustrial sector occurred during the early morning, between 4:00 am and 5:00 am, when it reached a 37.7% share of the total demand (as measured at power station busbars), while for large consumers in the services sector, the time period of greatest share took place between 9:00 am and 4:00 pm.
(4) Including losses.
(5) Hourly profiles applied to the general tariff for low voltage with contracted power less than or equal to 10 kW.

electricity generation

27
CHAP. 2 Electricity generation
Renewable energy
maintains a prominent
role in the overall
generation mix of
electricity in Spain, but
this year its contribution
has fallen mainly due
to the decline in
hydroelectric generation
Royal Decree 413/2014, of 6 June, which regulates the activity for the production of electricity from renewable energy sources, cogeneration and waste, has brought changes affecting the structure of the balance of energy and power. The main new features are the following:
• New concepts are included such as ‘Waste’ and ‘Other renewables’ which group technologies based on biomass, biogas, geothermal and marine hydro.
• The concept of Cogeneration is maintained, but is used exclusively for this technology.• Generation obtained from hydro is grouped into a single concept, including hydroelectric ge-
neration previously classifi ed within the special regime.
In addition to these changes motivated by the legislation, production data will be net as a result of the disappearance of the ‘Consumption in generation’ concept.
As a result of these changes, the document 'The Spanish Electricity System 2015' has been adapted to be in line with the new electricity balance structure.

28
www.ree.es
THE SPANISH ELECTRICITY SYSTEM 2015
The national electricity generation, which encompasses the pro-duction of the Spanish Peninsula and the non-peninsular systems stood at 267,584 GWh, 0.3% higher than 2014, the first positive rate after two consecutive years of decline.
By technology, variations in production over the previous year have been very uneven. Renewable energy on the peninsula, although con-tinuing to maintain a prominent role in the structure of the peninsu-lar electricity generation mix with a share of 36.9%, fell compared to 2014 mainly due to the hydrological characteristics of the year which led to a noticeable drop in hydroelectric production (27.5%). In or-der to offset this drop, non-renewable energy increased its share to 63.1%, with significant increases in coal-fired (23.8%) and combined cycle (18.7%) generation.
VOLUME OF NATIONAL ELECTRICITY GENERATION IN 2015
RENEWABLES: PERCENTAGE OVER TOTAL PENINSULAR ELECTRICITY GENERATION
267,584 GWh
36.9%2015 -
2014 -
2013 -
2012 -
2011 -
2010 -
2009 -
2008 -
2007 -
2006 -
EVOLUTION OF RENEWABLE AND NON-RENEWABLE GENERATION ON THE SPANISH PENINSULA
0 20 40 60 80 100
Renewable: hydro, wind, solar photovoltaic, solar thermal and other renewables. Does not include pumped storage generation.
Non-renewable: nuclear, coal, fuel/gas, combined cycle and cogeneration and waste.
36.9
72.1
78.4
80.6
42.8
42.3
64.7
78.7
31.9
67.5
63.1
57.2
57.7
68.1
32.5
35.3
27.9
21.6
21.3
19.4
( )%

29
CHAP. 2 Electricity generation
BREAKDOWN OF INSTALLED POWER CAPACITY AS AT 31.12.2015 NATIONAL ELECTRICITY SYSTEM
Peninsular Non-peninsular National system system total
MW % 15/14 MW % 15/14 MW % 15/14
Hydro 20,352 4.6 1 0.0 20,353 4.6
Nuclear 7,573 0.0 - - 7,573 0.0
Coal 10,468 0.0 468 0.0 10,936 0.0
Fuel/gas 0 -100.0 2,490 0.0 2,490 -16.9
Combined cycle 24,948 0.0 1,722 0.0 26,670 0.0
Hydro-wind - - 11 0.0 11 0,0
Wind 22,864 0.0 156 0.0 23,020 0.0
Solar photovoltaic 4,420 0.4 244 0.3 4,664 0.4
Solar thermoelectric 2,300 0.0 - - 2,300 0.0
Other renewables (1) (2) 742 -24.5 5 0.0 747 -24.4
Cogeneration (2) 6,684 -5.2 44 -63.6 6,728 -6.2
Waste (3) 677 - 77 - 754 -
Total 101,027 0.5 5,220 0.0 106,247 0.5
(1) Includes biogas, biomass, marine energy and geothermal. (2) The increment values include waste until 31-Dec, 2014. (3) Power included in Other renewables and Cogeneration until 31 Dec, 2014). // Source: National Commission for Markets and Competition (CNMC) on data regarding power from: non-Hydro Manage-ment Unit (UGH), wind, solar photovoltaic, solar thermoelectric, other renewables, cogeneration and waste.
NATIONAL ELECTRICAL ENERGY BALANCE (1)
Peninsular Non-peninsular National system system total
GWh % 15/14 GWh % 15/14 GWh % 15/14
Hydro 30,815 -27.5 4 3.1 30,819 -27.5
Nuclear 54,755 -0.2 - - 54,755 -0.2
Coal 50,924 23.8 1,865 -14.7 52,789 21.9
Fuel/gas (2) 0 - 6,497 3.8 6,497 3.8
Combined cycle (3) 25,334 18.7 4,022 7.6 29,357 17.1
Hydro-wind - - 9 - 9 -
Wind 47,707 -5.8 402 1.6 48,109 -5.7
Solar photovoltaic 7,839 0.5 398 -1.9 8,236 0.3
Solar thermoelectric 5,085 2.5 - - 5,085 2.5
Other renewables (4) (5) 4,615 -2.2 10 -6.7 4,625 -2.2
Cogeneration (5) 25,076 -2.0 32 -89.1 25,108 -3.0
Waste (6) 1,886 - 311 - 2,196 -
Generation 254,036 0.2 13,548 2.0 267,584 0.3
Pumped storage consumption -4,520 -15.2 - - -4,520 -15.2
Peninsula-Balearic Islands’ link (7) -1,336 2.9 1,336 2.9 0 -
International exchange balance (8) -133 -96.1 - - -133 -96.1
Demand (b.c.-at power station busbars) 248,047 1.8 14,884 2.0 262,931 1.9
(1) Allocation of generation units based on primary fuel. (2) Generation from auxiliary generation units is included in the Balearic Islands’ electricity system. (3) Includes operation in open-cycle mode. The Canary Islands’ electricity system uses gas-oil as primary fuel. (4) Includes biogas, biomass, marine energy and geothermal. (5) The increment values include waste until 31-Dec, 2014. (6) Generation included in ‘Other renewables’ and in ‘Cogeneration’ until 31-Dec, 2014. (7) Positive value: incoming energy; negative value: outgoing energy. (8) Positive value: importer balance; negative value: exporter balance.
30
www.ree.es
THE SPANISH ELECTRICITY SYSTEM 2015
Installed power
capacity of the entire
set of electricity
generation facilities
remains practically
stable after a path
of continued growth
INSTALLED POWER CAPACITY IN SPAIN (AS AT 31-DEC, 2016) 106,247MW0.5%
MORETHAN IN 2014
EVOLUTION OF INSTALLED POWER CAPACITY ON THE SPANISH PENINSULA
Hydro (1) Nuclear Coal Fuel/Gas Combined cycle Wind Solar photovoltaic Solar thermoelectric Other renewables Cogeneration Waste (2)
(1) Includes power from pure pumped storage. (2) Power included in Other renewables and Cogenera-tion until 31 Dec, 2014. // Source: National Commission for Markets and Competition (CNMC) on data re-garding power from: non-Hydro Management Unit (UGH), wind, solar photovoltaic, solar thermoelectric, other renewables, cogeneration and waste.
0
20 (mil)
40 (mil)
60 (mil)
80 (mil)
100 (mil)
120 (mil)
2015 -
2014 -
2013 -
2012 -
2011 -
2010 -
2009 -
2008 -
2007 -
2006 -
( )MW

31
CHAP. 2 Electricity generation
As at 31 December 2015 the entire set of electricity generation fa-cilities in Spain had increased slightly over the previous year regis-tering an installed power capacity of 106,247 MW, 0.5% more than at the end of 2014. Most of the new power has corresponded to the commissioning of the 878 MW ‘La Muela II’ pure pumped storage hy-droelectric power station and the 23 MW ‘San Pedro II’ hydroelectric power station. This increase in power capacity, helped to offset the closure of the 506 MW ‘Foix’ power station, which was the very last fuel-gas fired power station in the peninsular electricity system. Va-riations in other technologies have been either nil or insignificant.
The minimum coverage index for the peninsula, calculated as the minimum value of the relationship between the power available in the system and the maximum power demanded from the system, stood at 1.37 in 2015.
ENTIRE SET OF ELECTRICITYGENERATING FACILITIES IN SPAIN
MINIMUM COVERAGEINDEX FOR THE PENINSULA
INSTALLED POWER CAPACITY
2014
INSTALLED POWER CAPACITY
2015
2015
2014
2013
2012
+0.5%INCREASE
VALUE SIMILAR TO THOSE REGISTEREDIN 2011 AND 2012
1.37
ICmin = Min (Pd/Ps)
ICmin: Minimum coverage index. Pd: Power available in the system.Ps: Peak power demanded to the system.
0.4 0.6 0.8 1.0 1.2 1.4 1.6
23 NOV
2O OCT
2 DIC
12 DIC
2015 -
2014 -
2013 -
2012 -
2011 -
2010 -
2009 -
2008 -
2007 -
9 NOV
11 JAN
15 JAN
27 NOV
12 DIC
1.37
1.45
1.43
1.38
1.39
1.34
1.25
1.23
1.19
EVOLUTION OF THE MINIMUM COVERAGE INDEX (ICMIN) FOR THE SPANISH PENINSULA

32
www.ree.es
THE SPANISH ELECTRICITY SYSTEM 2015
In the graphs showing the evolution of the production of renewable and non-renewable energy in the peninsular system in 2015, one can see a decline in the generation coming from renewable tech-nologies, breaking the upward trend of previous years, even surpas-sing the decline that occurred in 2011. The lower level of generation coming from renewable energy in 2015 was largely due to the fall in hydroelectric production.
In contrast, power stations that use fossil fuels as a primary energy source have increased production compared to the previous year, es-pecially coal-fired and combined cycle power stations.
Fall in hydroelectric and
wind power generation;
renewable technologies
with a greater weight
in the generation mix
ELECTRICITY GENERATION 2015
NON-RENEWABLES
RENEW-ABLES
EVOLUTION OF RENEWABLE AND NON-RENEWABLE ELECTRICITY GENERATION ON THE SPANISH PENINSULA
0 20 40 60 80 100 120
2015 -
2014 -
2013 -
2012 -
2011 -
2010 -
2009 -
2008 -
2007 -
2006 -
0 50 100 150 200 250
2015 -
2014 -
2013 -
2012 -
2011 -
2010 -
2009 -
2008 -
2007 -
2006 -
Hydro (1) Wind Solar photovoltaic Nuclear Coal Fuel/Gas Combined cycle Solar thermoelectric Other renewables Cogeneration Waste (2)
(1) Does not include pumped storage generation. (2) Generation included in Other renewables and Cogeneration until 31-Dec, 2014.
( )TWh
RENEWABLES NON-RENEWABLES
33
CHAP. 2 Electricity generation
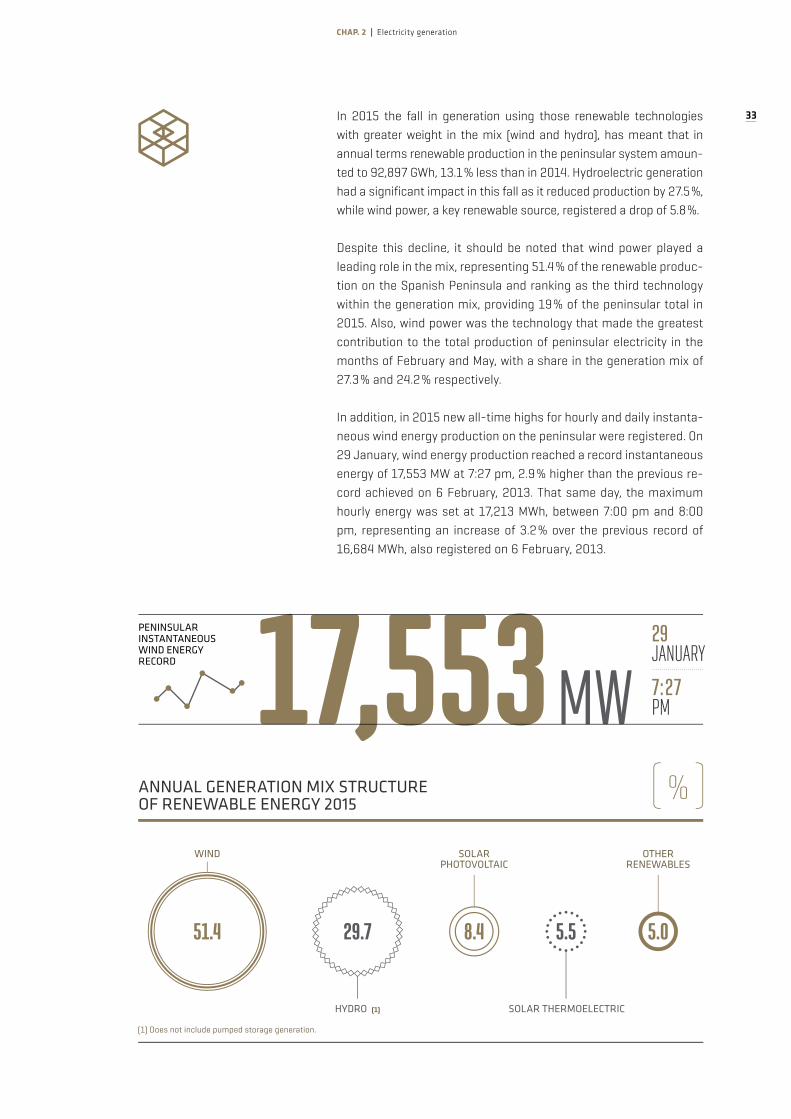
In 2015 the fall in generation using those renewable technologies with greater weight in the mix (wind and hydro), has meant that in annual terms renewable production in the peninsular system amoun-ted to 92,897 GWh, 13.1% less than in 2014. Hydroelectric generation had a significant impact in this fall as it reduced production by 27.5%, while wind power, a key renewable source, registered a drop of 5.8%.
Despite this decline, it should be noted that wind power played a leading role in the mix, representing 51.4% of the renewable produc-tion on the Spanish Peninsula and ranking as the third technology within the generation mix, providing 19% of the peninsular total in 2015. Also, wind power was the technology that made the greatest contribution to the total production of peninsular electricity in the months of February and May, with a share in the generation mix of 27.3% and 24.2% respectively.
In addition, in 2015 new all-time highs for hourly and daily instanta-neous wind energy production on the peninsular were registered. On 29 January, wind energy production reached a record instantaneous energy of 17,553 MW at 7:27 pm, 2.9% higher than the previous re-cord achieved on 6 February, 2013. That same day, the maximum hourly energy was set at 17,213 MWh, between 7:00 pm and 8:00 pm, representing an increase of 3.2% over the previous record of 16,684 MWh, also registered on 6 February, 2013.
WIND SOLAR PHOTOVOLTAIC
51.4 29.7 8.4 5.5
ANNUAL GENERATION MIX STRUCTURE OF RENEWABLE ENERGY 2015
( )%
SOLAR THERMOELECTRIC
OTHER RENEWABLES
HYDRO (1)
5.0
(1) Does not include pumped storage generation.
PENINSULAR INSTANTANEOUS WIND ENERGY RECORD 17,553 MW
29JANUARY
7:27PM

34
www.ree.es
THE SPANISH ELECTRICITY SYSTEM 2015
On 30 January 2015 the annual record for daily energy from wind power generation was set in the peninsular electricity system, a value 1.4% higher than that reached in March 2014.
Lastly, on 21 November at 4:50 am 70.4% of the electricity consumed on the Spanish Peninsula was covered with wind power energy. The integration of all this wind power generation has been a challenge for system operation, consolidating the Spanish electricity system as one of the world leaders in the integration of renewable energy.
During 2015, the daily wind power production had a share in the generation mix that ranged from a low of 2.7% on 7 January up to 51.5% on 21 November, making it the technology with the greatest weight in the generation mix on that day.
The great variability that wind generation has can be seen in the graph detailing the maximum and minimum coverage of renewable technologies: hydro, wind and solar.
The integration of wind
power generation has
consolidated the Spanish
electricity system as one
of the world leaders in
renewable energy
60
50
40
30
20
10
0E F M A M J J A S O N D
MAXIMUM
MINIMUM
MAXIMUM AND MINIMUM COVERAGE ON THE PENINSULAR IN 2015 USING HYDRO, WIND AND SOLAR
Hydro Wind Solar
( )%
PENINSULAR ELECTRICITY CONSUMPTION
70.4%
21 NOV/4:50 am
PERCENTAGE COVERED WITH WIND ENERGY

35
CHAP. 2 Electricity generation
With regard to solar technologies, solar photovoltaic facilities on the peninsula maintained the same growth path as it has done over the last decade, although in the last three years there has been a much lower growth rate than that observed in the early years. In 2015, ins-talled power capacity on the peninsula grew only 0.4%, while genera-tion increased by 0.5%. Meanwhile, solar thermal has not experien-ced variations in installed power throughout 2015 and its generation increased by 2.5% compared to 2014. These technologies together accounted for 5.1% of the total peninsular generation in 2015.
Hydroelectric power stations on the peninsula were the only type of facility with significant increases in installed power capacity, 4.6% during 2015 as a result of the four new generating units of the ‘Muela II’ and the ‘San Pedro II’ hydro power stations. Despite this increa-se in installed power capacity, hydroelectric generation fell by 27.5% compared to the previous year, reaching an annual production of 30,815 GWh. As shown in the graph, the production of these power stations was lower than in 2014 during almost every month of 2015. December saw the biggest difference in generation when only half of the amount was produced compared to the previous year.
Producible
hydroelectric stood
well below the
historical average value
WEIGHT OF SOLAR TECHNOLOGIES IN THE ELECTRICITY GENERATION MIX OF THE PENINSULAR SYSTEM
5.1%
(1) Average monthly hydroelectric generation in the period 1991-2014.
PENINSULAR HYDROELECTRIC GENERATION 2014-2015 COMPARED TO AVERAGE GENERATION
7 (mil)
6 (mil)
5 (mil)
4 (mil)
3 (mil)
2 (mil)
1 (mil)
0 (mil)
Hydroelectric generation in 2014 Hydroelectric generation in 2015 Average historical hydroelectric generation (1)
E F M A M J J A S O N D
( )GWh

36
www.ree.es
THE SPANISH ELECTRICITY SYSTEM 2015
In hydrological terms, 2015, on the whole, was a dry year, as was the case in 2012. The producible hydroelectric (maximum amount of electricity that could be produced in a year counting on the hy-droelectric reserves accumulated and recorded in reservoirs) was below the average historical value most months (only in February and March was it above the average), which resulted in this value closing the year at 18,949 GWh, 24% lower than the annual average historical value.
Hydroelectric reserves, for the complete set of reservoirs on the Spanish peninsula, closed the year with a level close to 46.6% of their total capacity, seventeen points below 2014 and below the average statistical value.
Hydroelectric reserves
ended the year
below the average
statistical value
DAILY PRODUCIBLE HYDROELECTRIC ENERGY DURING 2015 COMPARED TO AVERAGE HISTORICAL PRODUCIBLE (1)
( )GWh
300
250
200
150
100
50
0E F M A M J J A S O N D
Wet Dry Historical average producible Producible 2015
AVERAGE HISTORICAL
2015HYDROELECTRIC 18,949 GWh
PRODUCIBLE-24%
46.6%
HYDROELECTRIC RESERVES OF PENINSULAR RESERVOIRS COMPARED TO 2014
-17pp
(1) Does not include those facilities less than 50 MW that do not belong to a Hydro Management Unit (UGH).

37
CHAP. 2 Electricity generation
Non-renewable energies experienced a change in behaviour compa-red to 2014 by jointly registering an increase in peninsular production of 10.5%. Coal-fired and combined cycle power stations took centre stage in this significant increase in non-renewable generation.
Nuclear generation registered a decrease of 0.2% compared with the previous year. However, for the fifth consecutive year it remains the technology with the greatest share in the peninsular genera-tion mix representing 21.8%, slightly less than the 22% of 2014. The utilisation coefficient (ratio between actual production and the production that could have been produced if power stations had operated at their rated power for the whole time they were availa-ble) was 97.6%.
Coal-fired and combined
cycle generation increase
to offset the fall in
hydro and wind
97.6%100%
UTILISATION COEFFICIENT OF NUCLEAR POWER STATIONS
NUCLEARREPRESENTS21.8% OF THE TOTAL PENINSULAR GENERATION
ANNUAL ELECTRICAL ENERGY GENERATION MIX STRUCTURE OF THE PENINSULAR SYSTEM 2014-2015
Nuclear Coal Combined cycle Cogeneration Waste Wind Hydro (1)
Solar photovoltaic Solar thermoelectric Other renewables Renewable Non-renewable
( )%
(1) Does not include pumped storage generation.
2014
2.0
16.5
10.2
20.3
8.5
22.0
1.9 3.1 15.5
2015
21.8
1.8 3.1
20.3
10.1 10.1
2.0
11.0
19.00.8
57.242.8 36.9
63.1
GENERATION

38
www.ree.es
THE SPANISH ELECTRICITY SYSTEM 2015
Coal-fired power stations on the peninsula have again experienced an annual growth in production, as happened in 2014. Specifically, in 2015 this technology increased its generation by 23.8% over the previous year, which placed it as the second source of energy in the peninsular generation mix, increasing its share by almost 4% com-pared with the previous year. In addition, during the months of June, July, August, October and November, coal was the main source of generation with a monthly share of around 25%, coinciding with the months in which there were decreases in hydroelectric production. In line with the increased use of coal, the utilisation coefficient of this technology in 2015 was 61.8% higher than the values for the previous seven years.
Peninsular production from combined cycle power stations grew by 18.7% compared to 2014, which represents the first increase in ge-neration after the declines suffered during the last six years. Monthly generation registered a growth for ten months and in the month of July saw the largest increase coinciding with a heatwave that made it necessary to reactivate production from thermal power stations.
Despite this recovery, this technology still continues to have a mode-rate weight in the generation mix (10.1% in 2015), with an utilisation coefficient of 12.9%.
UTILISATIONCOEFFICIENT
INCREASE AFTER SIX YEARS OF DECLINES
GENERATION FROM COMBINED CYCLE
12.9%REACTIVATION
OF THERMAL POWER STATIONS
2015HEATWAVE
UTILISATION COEFFICIENT OF PENINSULAR THERMAL POWER STATIONS (1)
100
80
60
40
20
02006 2007 2008 2009 2010 2011 2012 2013 2014 2015
( )%
Nuclear Coal Combined cycle
(1) The utilisation coefficient is the quotient between actual production and the available production or maximum production that the power station could reach running at its rated power during the hours in which it is available.
UTILISATION COEFFICIENT OF COAL-FIRED POWER STATIONS
61.8%
IN THE LAST SEVEN YEARS
VALUE >

39
CHAP. 2 Electricity generation
Annual electricity generation in the set of non-peninsular systems ended 2015 at 13,548 GWh, 2% higher than the previous year, the first increase after six straight years of declines in production. By system, the Balearic Islands', Canary Islands' and Melilla's systems grew 4.0%, 1.0% and 1.7% respectively, while Ceuta's system fell by 3.2%.
The structure of the electricity generation mix of the Balearic Is-lands’ electricity system has undergone significant changes since the commissioning of the interconnection that links the Spanish Peninsula and the Balearic Islands in 2011.
In the first months of operation of the interconnection, the link con-tributed to covering 9.8% of the overall consumption of the Balearic Islands’ system in 2012, which resulted in a reduction in the gene-ration from combined cycle power stations. In the following years, the amount of energy exchanged through the link has continued to grow, covering 23% of the demand in the Balearic Islands in 2015,
After six straight
years of declines
in production, in 2015
the electricity generation
of non-peninsular
systems recovered
ELECTRICITY GENERATIONNON-PENINSULAR SYSTEMS
GROWTH BY SYSTEM
13,548 GWh
1.0%4.0%
3.2%
1.7%BALEARIC ISLANDS
CANARY ISLANDS
CEUTA
MELILLA

40
www.ree.es
THE SPANISH ELECTRICITY SYSTEM 2015
23%displacing coal-fired, diesel engines and combined cycle genera-tion technologies.
The link has largely achieved the objectives originally foreseen in terms of the quality and security of supply and cost reduction in the system on the islands of Majorca and Menorca (interconnected in turn by a submarine link). Also from an environmental point of view, this facility is contributing to significantly reducing emissions from electricity generation.
The Spanish
Peninsula-Balearic
Islands link has changed
the generation mix
on the Islands
ON THE BALEARIC ISLANDS
OF THE
EVOLUTION OF DEMAND COVERAGEIN THE BALEARIC ISLANDS
Coal Diesel engines Gas turbine Combined cycle (1) Auxiliary generation (2) Wind Solar photovoltaic Other renewables Cogeneration Waste (3) Peninsula-Balearic Islands’ link (4)
(1) Includes operation in open cycle mode. (2) Emergency generators installed temporarily in specific zones to cover a deficit in generation. (3) Genera-tion included in Other renewables and Cogeneration until 31 Dec, 2014. (4) Peninsula-Balearic Islands’ link working at minimum technical level until 13 August 2012.
2015 -
2014 -
2013 -
2012 -
2011 -
2010 -
2009 -
2008 -
2007 -
2006 -
0 1,000 2,000 3,000 4,000 5,000 6,000 7,000
( )GWh
SPANISH PENINSULA-BALEARIC ISLANDS LINK
DEMAND
COVERED

41
CHAP. 2 Electricity generation
100%
In the Canary Islands electricity system, noteworthy was the change in the structure of the generation mix on the island of El Hierro since, in July 2014, the Gorona del Viento power station was brought into service with a capacity of 11 MW. With this power station, known as hydro-wind technology, the installed power capacity of this island has almost doubled.
This project integrates a wind farm, a pumped-storage power sta-tion and a hydroelectric power station. The wind farm is capable of supplying electricity directly into the grid and simultaneously feed a pumped-storage power station to store water in an upper reservoir, as an energy storage system. Water is pumped up to the upper re-servoir from the lower reservoir using the surplus energy produced by wind turbines. In times of wind shortage, the volume of water accumulated in the upper reservoir is used to produce electrici-ty via a hydroelectric system. Thus, the hydroelectric power plant uses the stored potential energy, guaranteeing electricity supply and grid stability.
The aim of this new facility is to ensure that a significant part of consumption on the island of El Hierro is covered with generation from renewable sources. In this regard, since mid-2015, the Gorona del Viento power station has increased production, thereby increa-sing the integration of renewable energy into the electricity system of this island. Specifically, about 20% of the total annual genera-tion of the island of El Hierro came from renewable energy and on 9 August 2015 an integration of renewable energy covering 100% of demand was reached for the first time ever.
Increases in renewable
generation from the new
hydro-wind power station
on the Canary Islands
POWER 2015
POWER 2014
x2
EL HIERROHYDRO-WIND POWER STATION GORONA DEL VIENTO
ELECTRICITY GENERATIONISLAND OF ‘EL HIERRO’. INTEGRATION OF RENEWABLES
9 AUGUST 2015 OF DEMAND

42
www.ree.es
THE SPANISH ELECTRICITY SYSTEM 2015
In addition, pursuant to that set out by the Ministry of Industry on 28 April 2014, Endesa and Red Eléctrica signed the agreement for transfer of the Chira-Soria reversible hydroelectric power station project in the island of Gran Canaria. The project encompasses the construction of a reversible pumping station, which will not be used as a generation facility, but as a tool for the system operator to guarantee supply, the security of the system and the integra-tion on non-manageable renewable energy. It will be an essential infrastructure in order to contribute to a new energy model in the Canary Islands, one that is more environmentally sustainable and more economically efficient.
The Chira-Soria hydroelectric power station in the Canary Islands will contribute to a more sustainable and efficient energy model
GRANCANARIACHIRA-SORIA 200 MW REVERSIBLE HYDROELECTRIC POWER STATION PROJECT
Hydro Diesel engines Gas turbine Steam turbines Combined cycle (1) Auxiliary generation (2) Hydro-Wind Wind Solar photovoltaic Other renewables Cogeneration
(1) Includes operation in open cycle mode. Uses gas-oil as primary fuel. (2) Emergency generators installed temporarily in specific zones to cover a deficit in generation.
0 1,OOO 2,OOO 3,OOO 4,OOO 5,OOO 6,OOO 7,OOO 8,OOO 9,000 10,000
EVOLUTION OF DEMAND COVERAGE IN THE CANARY ISLANDS
( )GWh
2015 -
2014 -
2013 -
2012 -
2011 -
2010 -
2009 -
2008 -
2007 -
2006 -

43
CHAP. 2 Electricity generation
Changes in the technologies used in the national electricity genera-tion bring about variations in CO2 emissions in the electricity sector. Thus, the increase in coal-fired and combined cycle generation has resulted in a surge in CO2 emissions, situating the level of emissions throughout the national territory at 77.4 million tonnes in 2015, a va-lue 15.1% higher than in 2014.
CO2 emissions from
the electricity sector rise
due to the increase in
coal-fired and combined
cycle generation
NATIONAL EMISSIONS 2015 77.4 MILLION
TONNESCO2
Coal Fuel/gas Combined cycle Renewable thermal Cogeneration Waste Emission factor
(1) Includes Spanish Peninsula, Balearic Islands, Canary Islands, Ceuta and Melilla.
CO2 EMISSIONS AND EMISSION FACTOR ASSOCIATED TO NATIONAL ELECTRICITY GENERATION (1)
2007 2008 2009 2010 2011 2012 2013 2014 2015
160 0.40
140 0.35
120 0.30
100 0.25
80 0.20
60 0.15
40 0.10
20 0.05
0 0.00
(Millions of tCO2) (tCO2/MWh)

44
www.ree.es
THE SPANISH ELECTRICITY SYSTEM 2015
GENERATION RATIO/DEMAND (%) AND GENERATION (GW ) IN 2015 BY AUTONOMOUS COMMUNITY
COMUNIDADVALENCIANA69.8 % 18,700 GWh
CATALUÑA92,0 % 42.857 GWh
< 50% 50% to 99% 100% to 199% ≥ 200%
CANARIAS100 % 8,669 GWh CEUTA
100 % 205 GWh
MELILLA100 % 213 GWh
MURCIA55.1 % 4,909 GWh
GALICIA15 1 % 29,625 GWh
h
ASTURIAS161.4 % 16,820 GWh
CANTABRIA40.5 % 1,705 GWh
PAÍS VASCO35.1 % 5,937 GWh
NAVARRA109.0 % 5,269 GWh
ARAGÓN151.1 % 15,496 GWh
MADRID4.2 % 1,203 GWh
BALEARES77 % 4,461 GWh
ANDALUCIA91.8 %35,685 GWh
LA RIOJA108.7 %
1,863 GWh
EXTREMADURA438.8 % 21,101 GWh
CASTILLA-LA MANCHA187.0 % 21,626 GWh
CASTILLA Y LEÓN227.2 % 31,239 GWh
70% of the
electricity generated
in Navarra comes
from facilities using
renewable energy
sources
( )( )GWh%
45
CHAP. 2 Electricity generation
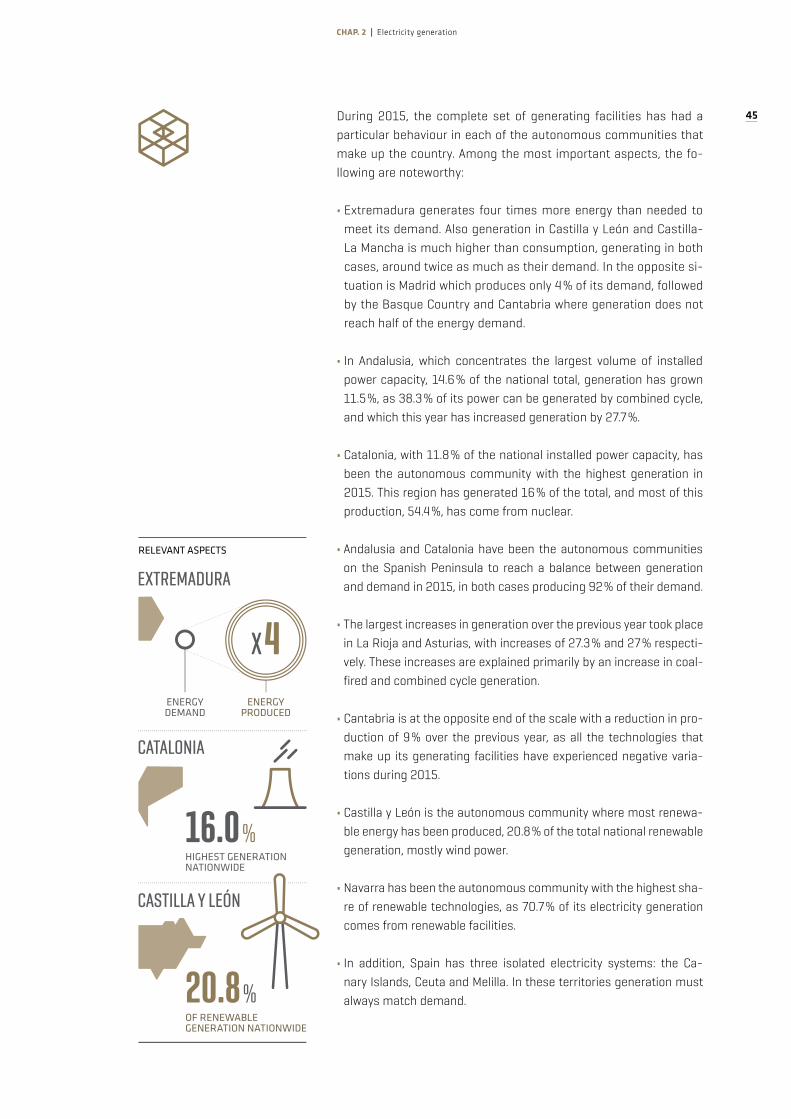
During 2015, the complete set of generating facilities has had a particular behaviour in each of the autonomous communities that make up the country. Among the most important aspects, the fo-llowing are noteworthy:
• Extremadura generates four times more energy than needed to meet its demand. Also generation in Castilla y León and Castilla-La Mancha is much higher than consumption, generating in both cases, around twice as much as their demand. In the opposite si-tuation is Madrid which produces only 4% of its demand, followed by the Basque Country and Cantabria where generation does not reach half of the energy demand.
• In Andalusia, which concentrates the largest volume of installed power capacity, 14.6% of the national total, generation has grown 11.5%, as 38.3% of its power can be generated by combined cycle, and which this year has increased generation by 27.7%.
• Catalonia, with 11.8% of the national installed power capacity, has been the autonomous community with the highest generation in 2015. This region has generated 16% of the total, and most of this production, 54.4%, has come from nuclear.
• Andalusia and Catalonia have been the autonomous communities on the Spanish Peninsula to reach a balance between generation and demand in 2015, in both cases producing 92% of their demand.
• The largest increases in generation over the previous year took place in La Rioja and Asturias, with increases of 27.3% and 27% respecti-vely. These increases are explained primarily by an increase in coal-fired and combined cycle generation.
• Cantabria is at the opposite end of the scale with a reduction in pro-duction of 9% over the previous year, as all the technologies that make up its generating facilities have experienced negative varia-tions during 2015.
• Castilla y León is the autonomous community where most renewa-ble energy has been produced, 20.8% of the total national renewable generation, mostly wind power.
• Navarra has been the autonomous community with the highest sha-re of renewable technologies, as 70.7% of its electricity generation comes from renewable facilities.
• In addition, Spain has three isolated electricity systems: the Ca-nary Islands, Ceuta and Melilla. In these territories generation must always match demand.
EXTREMADURA
CATALONIA
CASTILLA Y LEÓN
20.8 %
ENERGY DEMAND
ENERGY PRODUCED
X4
OF RENEWABLE GENERATION NATIONWIDE
HIGHEST GENERATION NATIONWIDE
16.0 %
RELEVANT ASPECTS

international energy exchanges

CHAP. 3 International energy exchanges
47
The volume of energy traded through exchange programmes with other countries stood at 23,303 GWh, 2.6% higher than in 2014. A total of 11,725 GWh was exported, 10.2% less than the previous year, and 11,578 GWh was imported, 20.0% more than in 2014. The net exchange balance was 147 GWh as an exporter, a value 95.7% lower than last year and the lowest exporter value since records began.
The annual balance
of Spain’s energy
exchange programmes
with other countries
was again as an
exporter, but has
dropped to the
lowest level since
records began

THE SPANISH ELECTRICITY SYSTEM 2015
48
www.ree.es
In 2015, the net monthly balance of energy exchanges in the Spanish interconnections was as an exporter for the first nine months of the year; except May and June, and as an importer in the last months of the year, with the maximum importer value being registered in December (907 GWh).
Andorra France Morocco Portugal Balance
15,000
10,000
5,000
0
-5,000
-10,000
-15,000
-20,0002005 2006 2007 2008 2009 2010 2011 2012 2013 2014 2015
IMPORT
EXPORT
EXPORTS AND IMPORTS BY INTERCONNECTION
Andorra France Morocco Portugal Balance
( )GWh
2,000
1,500
1,000
500
0
-500
-1,000
-1,500E F M A M J J A S O N D
IMPORT
EXPORT
MONTHLY EVOLUTION OF SCHEDULED INTERNATIONAL ENERGY EXCHANGES
( )GWh

49
CHAP. 3 International energy exchanges
Exchange programmes
with other countries
lead to a volume
of 23,303 GWh
of energy traded,
2.6% more than
in 2014
SCHEDULED ENERGY EXCHANGES BY INTERCONNECTION( )TWh
TOTAL SPAIN
EXPORTS
11.7
IMPORTS
11.6
BALANCE
0.1
FRANCE
PORTUGAL
ANDORRA
MOROCCO
4.5
2.0
4.9
2.3
9.3
0.3

THE SPANISH ELECTRICITY SYSTEM 2015
50
www.ree.es
France
The electricity exchange balance through the interconnection with France was as an importer with a total of 7,320 GWh, 105.4% higher than in 2014. Imports totalled 9,292 GWh, 43.7% higher than the pre-vious year, while exports fell to 1,972 GWh, down 32.1% on last year’s value. Except for February, all monthly balances were registered with importer values.
The coming into full operation of the new HVDC Santa Llogaia-Baixas line has allowed the target of doubling the exchange capacity values via this interconnection to be achieved, even exceeding it in some pe-riods, reaching capacity values of 2,950 MW. Furthermore, there has been an important use thereof in the direction of France to Spain, with congestions being observed in a significant part of the hours. This is because the day-ahead market prices in France were generally lower than those of Spain in almost every month.
7,320 GWh+105.4%
IMPORTER BALANCE
ENERGY EXCHANGE BALANCE WITH FRANCE
3,000
2,000
1,000
0
-1,000
-2,000
-3,000
Balance France (MWh) Import capacity (MW) Export capacity (MW)
E F M A M J J A S O N D
EXCHANGE CAPACITY AND NET BALANCE OF SCHEDULED EXCHANGES AT THE INTERCONNECTION WITH FRANCE
( )MWh/MW
IMPORT
EXPORT

51
CHAP. 3 International energy exchanges
The following chart shows how, except for the months of February and March, capacity has been more frequently congested as an im-porter, reaching 100% in many of the hours.
The bringing into full
service of the new
Santa Llogaia-Baixas
interconnection doubled
the exchange capacity
between Spain and France
in the last months of 2015
9,292 GWh
IMPORTS WITH FRANCE
€/MWh €/MWh<
PRICESDURING 2015
IN FRANCE WERE LOWER THAN THOSE IN SPAIN IN ALMOST EVERY MONTH OF THE YEAR
UTILIZATION RATE OF EXCHANGE CAPACITY AT THE INTERCONNECTION WITH FRANCE
100
90
80
70
60
50
40
30
20
10
0
Import Export
( )%
E F M A M J J A S O N D

THE SPANISH ELECTRICITY SYSTEM 2015
52
www.ree.es
The following graph 'Renewable generation in Spain and day-ahead market prices' shows the difference in the daily average prices between France and Spain and the effect that renewables have had on this over the last two years. You can also see that when pro-duction with renewables (mostly hydroelectric and wind) is high, the price in Spain is lower than that of France. This circumstance took place in the first quarter of 2014 and in the months of February and March in 2015.
NET BALANCE OF SCHEDULED EXCHANGES IN THE INTERCONNECTION WITH FRANCE AND WIND POWER GENERATION IN SPAIN (20 FEBRUARY-6 MARCH)
Balance France Wind Power Spain
20 F 21 F 22 F 23 F 24 F 25 F 26 F 27 F 28 F 1 M 2 M 3 M 4 M 5 M 6 M
IMPORT
EXPORT
( )MWh
RENEWABLE GENERATION IN SPAIN AND DAY-AHEAD MARKET PRICES
12,000 60
10,000 50
8,000 40
6,000 30
4,000 20
2,000 10
0 0
Hydro (GWh) Wind (GWh) Solar (GWh) Price in Spain (€/MWh) Price in France (€/MWh)
( )€/MWh( )GWh
2014E F M A M J J A S O N D
2015E F M A M J J A S O N D
1,500 15,000
1,000 10,000
500 5,000
0 0
-500 -5,000
-1,000 -10,000
-1,500 -15,000

53
CHAP. 3 International energy exchanges
In this regard, although to a lesser degree than in the border with Portugal, wind power production also influences the direction of ex-change. The second chart on the previous page details a fortnight in late February and early March. We can see that lower wind power pro-duction in a period of low rainfall, means the exchange balance with France is as an importer, while high production means the balance becomes as an exporter.
Regarding the utilization rate of the exchange capacity, congestion was recorded in 75% of the hours in the import direction as a result of higher prices in Spain compared with France. Only 12.7% of the interconnec-tion hours were not congested.
The increase in production
with renewables, such
as hydro and wind,
reduced the daily average
prices in Spain compared
with France
HOURS WITH AND WITHOUT CONGESTION AT THE INTERCONNECTION WITH FRANCE
HOURS WITH CONGESTION France Spain
74.60
HOURS WITHOUT CONGESTION
12.74
HOURS WITH CONGESTION Spain France
12.66
( )%
PRODUCTION
EXCHANGE WITH FRANCE
WIND POWEREXPORTER BALANCE
IMPORTER BALANCE
+-

THE SPANISH ELECTRICITY SYSTEM 2015
54
www.ree.es
100 50
90 45
80 40
70 35
60 30
50 25
40 20
30 15
20 10
10 5
0 0
-5
-10E F M A M J J A S O N D
Levels of congestion of the exchange capacity are greater in the di-rection France to Spain in every month except February, the month in which the day-ahead prices in Spain were lower than those of France.
Congestion rents generated in 2015 represented 143 million euros (125 million as an importer and 18 million as an exporter), 50% of this total corresponding to the Spanish electricity system. This value represents a 16% increase over rents generated in 2014.
M.143€125M. 18M.
CONGESTION RENTS AT THE SPAIN - FRANCE INTERCONNECTION
50%
50%
IMPORTER DIRECTION
EXPORTER DIRECTION
HOURS WITH AND WITHOUT CONGESTION AT THE INTERCONNECTION WITH FRANCE AND THE DIFFERENCE IN PRICES OF THE DAY-AHEAD MARKET
Hours with congestion (%) Hours with congestion %) S ∂ F Hours with congestion (%) F ∂ S Price in Spain - Price in France (€/MWh)
( )€/MWh( )%
M€
M€

55
CHAP. 3 International energy exchanges
As for the prices resulting from the exchange capacity auctions, the marginal price of the annual capacity auction 2015 in the direction Spain to France recorded a value of 3.82 €/MW, representing an in-crease of 11% on the price registered in the annual auction for 2014 (3.43 €/MW). In the direction France to Spain, the resulting marginal price was 8.09 €/MW, a value 15% lower than in the same direction in the annual auction for 2014 (9.48 €/MW).
The maximum price of allocated capacity in monthly auctions was recorded in August, in the direction France to Spain with a value of 23.11 €/MW. In the direction Spain to France the maximum price was reached in January with 5.04 €/MW.
16 GWh were imported at this border and 128 GWh were exported via the cross-border balance service.
In 2015, it was necessary for the electricity system operators in Spain and France to apply coordinated counter-trading actions (es-tablishment of exchange schedules, in a counter direction, when faced with reductions in capacity in order to guarantee already established commercial schedules) for a total value of 10,898 MWh in both directions of flow.
The counter-trading
actions at the
interconnection
with France reached
11 GWh
23.11 €/MW
5.04 €/MW
MAXIMUM PRICE OF THE CAPACITY ALLOCATED IN MONTHLY AUCTIONS
S ∂ F JAN/15
F ∂ S AUG/15

THE SPANISH ELECTRICITY SYSTEM 2015
56
www.ree.es
Portugal
The annual electricity exchange balance with Portugal was as an ex-porter with a total of 2,267 GWh, 151.7% higher than in 2014. Imports totalled 2,282 GWh, 28.3% lower than the previous year while exports reached 4,549 GWh, a value that is higher by 11.4% compared to the previous year.
UTILIZATION RATE OF EXCHANGE CAPACITY AT THE INTERCONNECTION WITH PORTUGAL
100
90
80
70
60
50
40
30
20
10
0
Import Export
( )%
EXCHANGE CAPACITY AND NET BALANCE OF SCHEDULED EXCHANGES AT THE INTERCONNECTION WITH PORTUGAL
4,000
3,000
2,000
1,000
0
-1,000
-2,000
-3,000
-4,000
Balance Portugal (MWh) Import capacity (MW) Export capacity (MW)
E F M A M J J A S O N D
E F M A M J J A S O N D
( )MWh/MW
IMPORT
EXPORT

57
CHAP. 3 International energy exchanges
The balance for every month of the year was as an exporter, except in February and October. In the full year, there were 3,238 hours with an importer balance, being October the month with more hours as an importer (492 hours), a value lower than the 600 hours recorded in January and February last year (2014).
Day-ahead market prices in Portugal were slightly higher than those in Spain. In February, the average prices of Spain and Portugal had the same value as a result of the fact they converged during most hours (672 hours).
While in 2014, the months with an importer balance were due mainly to the high hydroelectric production in Portugal; in 2015 these ba-lances were due to its high wind power generation. In February 2015, wind power in Portugal was very high, with production higher than the average for that month. In October, in addition to high wind power
The monthly balance
of scheduled exchanges
with Portugal has been
as exporter except in
February and October
3,238h
HOURS REGISTERED AS IMPORTER BALANCE
MONTH WITH MORE HOURS AS IMPORTER
OCT492h
NET BALANCE OF SCHEDULED EXCHANGES AND PRICE DIFFERENCES IN THE DAY-AHEAD MARKETS AT THE INTERCONNECTION WITH PORTUGAL
600 0.3
400 0.2
200 0.1
0 0,0
-200 -0.1
-400 -0.2
-600 -0.3
-800 -0.4
Balance Portugal (GWh) Price in Spain – Price in Portugal (€/MWh)
E F M A M J J A S O N D
( )€/MWh( )GWh
IMPORT
EXPORT

THE SPANISH ELECTRICITY SYSTEM 2015
58
www.ree.es
generation in Portugal, there was also high rainfall, so prices were lower in Portugal than in Spain and therefore the exchange balance with Portugal was as an importer.
Both hydroelectric production and wind power production signifi-cantly influence the direction of flow as an importer or exporter of the balances of scheduled exchanges at the interconnection with Portu-gal. For example, you can see how in a month with high wind power generation in the Portuguese system, the balance is as an importer, while months with low wind production are as an exporter or as a low importer balance.
MONTHS WITH IMPORTER BALANCE
HIGH
HIGH
2014
2015
HYDRO-ELECTRIC
WIND POWER
Importer and
exporter balances for
the interconnection
with Portugal are
determined largely
by its hydroelectric
and wind power
production
BALANCE OF SCHEDULED EXCHANGES AT THE INTERCONNECTION WITH PORTUGAL AND WIND POWER GENERATION IN PORTUGAL
5,000
4,000
3,000
2,000
1,000
0
-1,000
-2,000
-3,000
Balance Portugal Wind power generation Portugal
1 2 3 4 5 6 7 8 9 10 11 12 13 14 15 16 17 18 19 20 21 22 23 24 25 26 27 28JAN 2015
( )MWh
IMPORT
EXPORT
PRODUCTION
PRODUCTION

59
CHAP. 3 International energy exchanges
100
90
80
70
60
50
40
30
20
10
0E F M A M J J A S O N D
Regarding the utilization rate of the exchange capacity, at this border just a few hours of congestion were recorded (2.28% of the hours as an exporter, lower than the 2014 value, and 0.14% as an importer).
By months you can see how August was the month in which day-ahead market prices converged on more occasions, while December was the least.
Congestion rents were 1.3 million, 93% coming from the day-ahead market and the remaining 7% from the intraday market. Half of this amount corresponds to the Spanish electricity system.
HOURS WITHOUT CONGESTION
97.58
HOURS WITH CONGESTION
Spain Portugal
2.28
HOURS WITH CONGESTION
Portugal Spain
0.14
HOURS WITHOUT AND WITH CONGESTION AT THE INTERCONNECTION WITH PORTUGAL
( )%1.3€M.
CONGESTION RENTS AT THE SPAIN - PORTUGAL INTERCONNECTION
MONTHLY CONGESTION LEVELS AT THE SPAIN – PORTUGAL INTERCONNECTION
Hours without congestion Hours with congestion Spain ∂ Portugal Hours with congestion Portugal ∂ Spain
( )%

THE SPANISH ELECTRICITY SYSTEM 2015
60
www.ree.es
37 GWh were imported at this border and 110 GWh were exported via the cross-border balance service. In 2015, it was necessary for the electricity system operators in Spain and Portugal to apply counter-trading actions for a total value of 5,664 MWh of scheduled exchan-ges solely in the importer direction.
Morocco
The balance of scheduled exchanges with Morocco was as an expor-ter with a value of 4,936 GWh, 15.4% lower than last year. The average utilisation rate of the capacity in this interconnection was 63% as an exporter, a value 77% lower than the previous year. The balance of scheduled exchanges was as an importer for only 12 hours.
On 8 June, due to the unavailability of two lines belonging to the Mo-roccan grid, a reduction in capacity was recorded in the exporter di-rection. On the other hand, in the months of September and October, reductions were also recorded in the same direction as a result of work carried out in one of the two Puerto de la Cruz-Tarifa circuits.15.4%
EXPORTER BALANCE WITH MOROCCO COMPARED TO 2014
4,936 GWh
EXCHANGES WITH MOROCCOEXPORTER BALANCE
EXCHANGE CAPACITY AND NET BALANCE OF SCHEDULED EXCHANGES AT THE INTERCONNECTION WITH MOROCCO
800
600
400
200
0
-200
-400
-200
-800
-1,000
Balance Morocco (MWh) Import capacity (MW) Export capacity (MW)
E F M A M J J A S O N D
( )MWh/MW
IMPORT
EXPORT
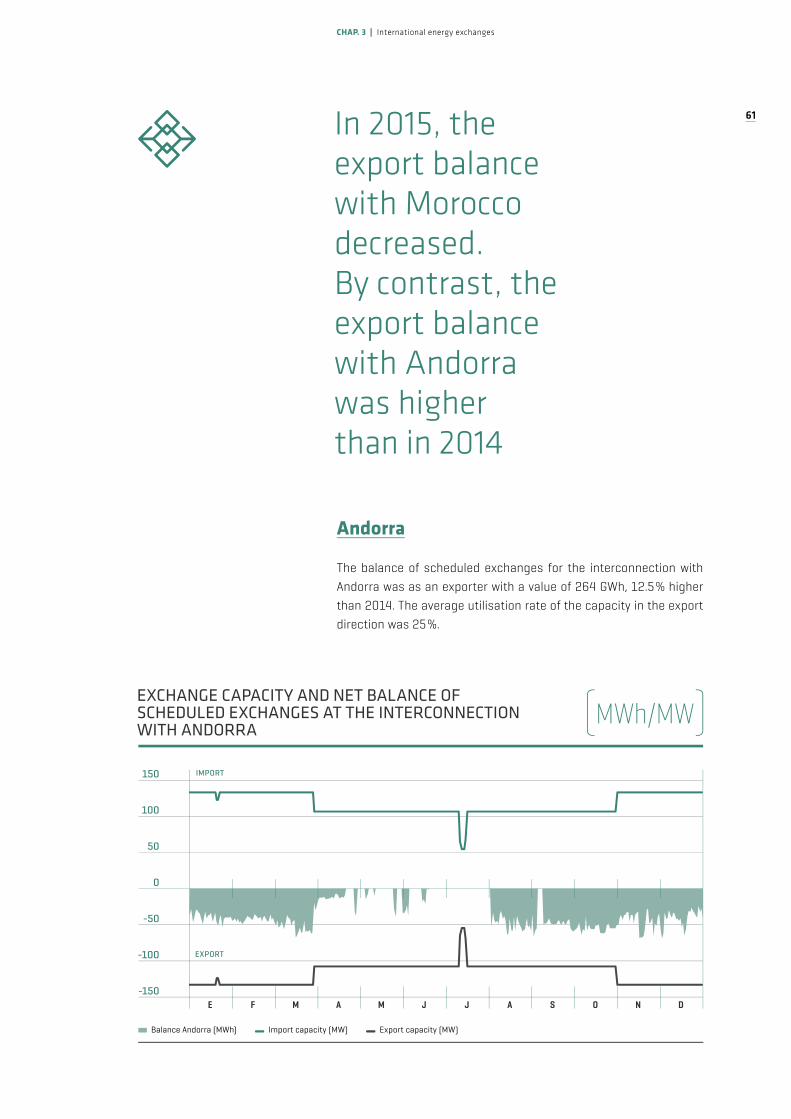
61
CHAP. 3 International energy exchanges
Andorra
The balance of scheduled exchanges for the interconnection with Andorra was as an exporter with a value of 264 GWh, 12.5% higher than 2014. The average utilisation rate of the capacity in the export direction was 25%.
In 2015, the
export balance
with Morocco
decreased.
By contrast, the
export balance
with Andorra
was higher
than in 2014
EXCHANGE CAPACITY AND NET BALANCE OF SCHEDULED EXCHANGES AT THE INTERCONNECTION WITH ANDORRA
150
100
50
0
-50
-100
-150
Balance Andorra (MWh) Import capacity (MW) Export capacity (MW)
( )MWh/MW
E F M A M J J A S O N D
IMPORT
EXPORT

electricity transmission

63
The development of the transmission grid received a new boost du-ring 2015 with the commissioning of facilities that enhance reliabili-ty, the degree of grid meshing and that allow more renewable energy to be incorporated. In 2015, 414 km of circuit and 136 substation bays were commissioned, which puts the total length of line in the national grid at year end at 43,124 km and in the case of substation bays, these totalled 5,548. Meanwhile, transformer capacity increa-sed by 855 MVA, bringing the national total of installed transformer capacity to 84,794 MVA.
By the end
of 2015, the
Spanish electricity
transmission grid
had reached
43,124 km in length,
a key development
for a safe and efficient
electricity supply
CHAP. 4 Electricity transmission

THE SPANISH ELECTRICITY SYSTEM 2015
64
www.ree.es
Noteworthy among the projects undertaken in 2015 are the following according to the geographical area of development:
Andalusia: the new Cristobal Colón 220 kV connection and the San-tiponce 220 kV and Torrearenillas 220 kV substations were brought into service, and work progressed on the new Berja 220 kV and Ca-ñuelo 220 kV substations, necessary for feeding demand and sup-porting the electricity distribution networks. Additionally, the power capacity of the Alhaurín-Cártama 220 kV line was increased and work continued to increase the capacity of a part of the 220 kV grid in An-dalusia, which will reduce the overloads that have taken place and the resulting generation redispatch required to eliminate them.
Aragón: a reactor at the 400 kV Peñaflor substation was brought into service. The installation of this new reactor will allow, on the one hand, to keep the voltage profile in the transmission grid of the area within the values established in the operating procedures, without having to resort to opening lines with the consequent loss of quality, reliability
43,000MORE THAN EXPANSE (IN km OF CIRCUIT) OF THE CURRENT ELECTRICITY GRID
400 kV ≤ 200 kV
Peninsula Peninsula Balearic Islands Canary Islands Total
Total lines (km) 21,179 18,924 1,674 1,347 43,124Overhead lines (km) 21,062 18,189 1,089 1,075 41,415Submarine cable (km) 29 236 423 30 718Underground cable (km) 88 499 162 242 991Transformer capacity (MVA) 79,208 63 3,273 2,250 84,794
(1) Provisional data pending audit (currently underway), Accumulated data for kilometres of circuit and on transformer capacity as at 31 December, 2015,
FACILITIES IN THE ELECTRICITY TRANSMISSION GRID IN SPAIN (1)
EVOLUTION OF THE ELECTRICITY TRANSMISSION GRID IN SPAIN
( )km
Peninsula <_ 220 kV Balearic Islands <_ 220 kV Canary Islands <_ 220 kV Peninsula 400 kV
(1) Provisional data pending audit (currently underway).
2015 -
2014 -
2013 -
2012 -
2011 -
0 5,000 10,000 15,000 20,000 25,000
43,124
42,710
42,115
41,311
40,502
(1)

65
CHAP. 4 Electricity transmission
and security of supply or increase system costs as a result of having to couple generating units due to voltage control.
Balearic Islands: progress has been made on the transmission grid meshing to improve the security and quality of supply. Noteworthy, for its importance in terms of reliability and security of supply, was the commissioning of the first Majorca-Ibiza 132 kV interconnection cable between the substations of Santa Ponsa and Torrent, which will enable the Balearic Islands’ electricity system to be exploited as a single system, connecting the Majorca-Menorca and Ibiza-Formen-tera subsystems. The cable is 126 km in length and consists of an underground stretch of 8 km and a submarine stretch of 118 km run-ning at a depth of 800 metres. In addition, in 2015 the Falca 66 kV substation input/output lines of the Rafal-Coliseo circuit and the new Falca-Catalina circuit were commissioned.
Canary Islands: work has continued on the improvement plan of the Canary Islands’ infrastructure in order to increase the security and qua-lity of supply. The following elements were commissioned: Los Realejos 66 kV substation input/output lines and the Arico II 66 kV substation input/output lines in the Candelaria-Tagoro circuit to support the inte-gration of renewable energies.
Castilla-León: construction work continued on the Tordesillas–Gala-pagar–San Sebastián de los Reyes (SUMA) 400 kV axis for the mes-hing between Castilla y León and Madrid, stretch corresponding to the Community of Madrid. Also commissioned were the new Valdecarre-tas, Pola de Gordón and Luengos 400 kV substations necessary for feeding the high-speed train.
Catalonia: work has continued on strengthening the transmission grid in the metropolitan area of Barcelona with the commissioning
The commissioning
of the fi rst Majorca-Ibiza
interconnection cable
will enable the Balearic
Islands’electricity system
to be exploited as a
single system
DEVELOPMENT OF THE TRANSMISSION GRID IN 2015
NEW LINE414km
855 MVA
TRANSFORMER CAPACITY

THE SPANISH ELECTRICITY SYSTEM 2015
66
www.ree.es
of the 220 kV Maragall-Trinitat 2 line and the strengthening of the electricity distribution network with an enlargement of the existing Perafort 220 kV substation. On the other hand, the new 320 kV Santa Llogaia substation was commissioned, a facility needed for the new alternating current interconnection with France, between the substa-tions of Santa Llogaia and Baixas (France). This new interconnection between Spain and France via the Eastern Pyrenees will double the current exchange capacity and reach capacities of up to 2,950 MW.
Castilla-La Mancha: work continued with the ambitious plan schedu-led for increasing line capacity and transformer capacity of the axes of the Autonomous Community of Castilla-La Mancha, as well as for the Loeches-José Cabrera 220 kV double circuit line.
Extremadura: support for the electricity distribution network in the region with the commissioning of the Plasencia 220 kV substation input/output lines, whose subsequent meshing was achieved by in-creasing from 132 kV to 220 kV the operation of the former Plasen-cia-Almaraz line.
Levante: a part of the scheduled transmission grid development was commissioned between the Catadau and Valle del Carcer subs-tations (change in voltage 132-220 kV) in order to improve the supply in the area.
Central zone: in Madrid the 220 kV transmission grid was strengthe-ned by changing certain elements of the transmission grid from the Villaverde 220 kV substation to the Villaverde Bajo 220 kV substation. On the other hand, support for the distribution network increased with the final commissioning of the Algete 220 kV substation.
North Zone: in order to increase the capacity of electricity evacuation and strengthen the transmission grid in the north, the 400 kV double circuit between Abanto and Güeñes in the Basque Country was com-missioned and work was performed in the Santurce 400 kV substa-tion to increase security of supply. Work progressed in the construc-tion of other stretches of the northern axis, especially the connection between the Boimente and Pesoz 400 kV substations. In Cantabria
320kV X2EXCHANGE CAPACITY
SFNEW SANTA LLOGAIA SUBSTATION

67
CHAP. 4 Electricity transmission
the Solorzano 400 kV and 220 kV substations, and the lines that con-nect to the Cicero 220 kV substation were commissioned.
Interconnections have a fundamental role in the integration of elec-tricity markets. This is the aim of what is known as the Internal Ener-gy Market (IEM) in Europe, which seeks to integrate all existing mar-kets in the European Union. The proper design of this market should allow electricity to flow freely to where it is most needed and when it is most needed, to obtain the maximum benefit for society arising from cross-border competition and provide appropriate incentives to allow for the necessary investment, while fully integrating an increa-sing share of renewable energies.
In Barcelona in 2002, the European Council established that Member States should have a level of electricity interconnection of at least 10% of their installed generating capacity by 2005. Later in 2014, the European Council again referred to the target of 10% electricity inter-connection by 2020 and welcomed the proposal of the Commission to set a new target of 15% electricity interconnection by 2030. Cu-rrently, the Spanish electricity system does not reach the minimum level of electricity interconnection recommended, so increasing inter-connections with Europe is the main challenge for the coming years, in order to avoid that in 2020 Spain be the only country in continental Europe below the recommended target.
International
interconnections are
key to the development
of the internal
electricity market
INTER-CONNECTION
IEM
EUROPETARGET2020
CAPACITY
10%INTERNAL ELECTRICITY MARKET IN EUROPE
INTEGRATE MORE
RENEWABLES
GREATER
COMPETITION
ENERGY WHERE IT IS MOST
NECESSARY
ASÍ LÉS ?

THE SPANISH ELECTRICITY SYSTEM 2015
68
www.ree.es
In addition, due to the geographical location of Spain, the possibili-ties of interconnection with the rest of Europe are very limited. The fact that only the interconnection with France allows us to exchange energy with other countries of the European Union, along with the low exchange capacity, practically makes the Iberian Peninsula an elec-tricity island.
In this context, increasing the Spain-France interconnection capa-city is key to achieving the European energy targets. In this regard, highlighted below are the recent electricity interconnection projects and those planned for the upcoming years.
Interconnection with FranceIn 2015, the double circuit interconnection line between Santa Llogaia (Spain) and Baixas (France) was brought into operation This direct cu-rrent interconnection using VSC (voltage source converter) technology and with a capacity of 2,000 MW, has represented an important step forward in strengthening international interconnections, doubling in-terconnection capacity between Spain and France, which in turn repre-sents an increase in commercial exchange capacity and system secu-rity regarding the previous situation. It should be noted that the new interconnection represents the largest investment by Red Eléctrica de España in a single project.
Although this interconnection strengthens flows from the eastern zone of the border, an increase in the exchange capacity with France re-quires strengthening the western zone in order to maintain a balance of east-west flows at the border. In this regard, the list of Projects of Common Interest (PCIs) of the European Union includes three new pro-jects for the Spanish-French border: > Phase shifting transformer in the 220 kV Arkale substation PCI project 2.8 Installation and coordinated operation of a phase shif-ting transformer in Arkale (Spain) to increase interconnection capacity between France and Spain.
A phase shifting transformer in the Arkale substation, connected to the 220 kV Arkale-Argia interconnection line, which will strengthen the cross-border network of the Basque Country and help balance the east-west flows at the border between Spain and France and, the-refore, will allow the commercial exchange capacity to be increased, especially from Spain to France.
DOUBLE-CIRCUIT INTERCONNECTION LINE WITH FRANCE 2,000MWVSC TECHNOLOGY
F
S
KEY OBJETIVE F
INTERCONNECTION WITH EUROPE
FRANCETO ACHIEVE THE EUROPEAN ENERGY TARGETS

69
CHAP. 4 Electricity transmission
Currently this project is in the permitting process and is expected to be commissioned in 2017.
> Project ‘Golfo de Vizcaya’PCI project 2.7 France-Spain interconnection between Aquitaine (Fran-ce) and the Basque Country (Spain).
After analysing different reinforcement alternatives along the entire border between Spain and France, joint analysis between RTE and Red Eléctrica concluded that the most appropriate project to reinfor-ce the border was a new interconnection between the Basque Country and the Aquitaine region in France, consisting of a 2 x 1,000 MW di-rect current link which will run mostly underwater. This project, called ‘Golfo de Vizcaya’, will allow the exchange capacity between Spain and France to be increased up to 4,000-5,000 MW. Currently the project is in undergoing feasibility studies, and is expected to be commissioned in the 2020-2022 horizon.
In addition to having the PCI classification, it has a double classifica-tion as it is also catalogued under the ‘electricity highways’ concept, which means it has a long-term strategic value.
The new project for the
installation of a phase
shifting transformer in
the Arkale substation will
increase the exchange
capacity between Spain
and France
‘GOLFO DE VIZCAYA’ PROJECT (2020-2022 HORIZON)
2x1,000MW
THE LINK SUBMARINE
INCREASE IN CAPACITY
5,000MWWILL BE MOSTLY
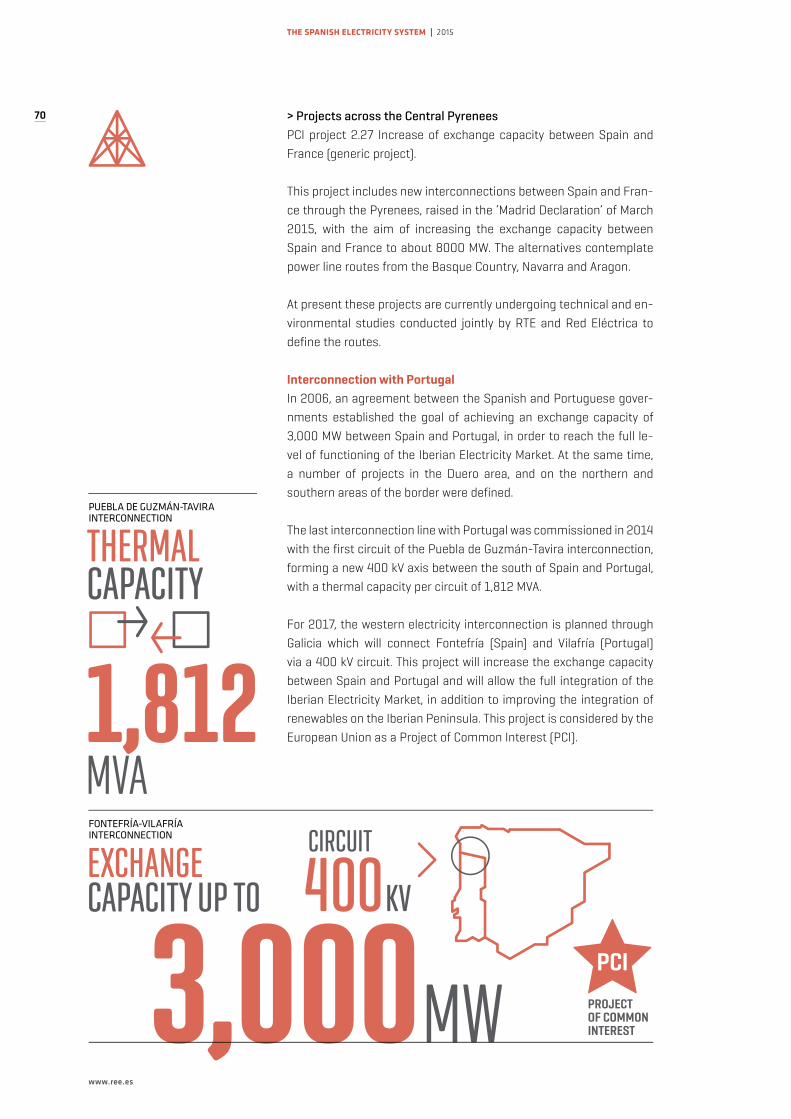
THE SPANISH ELECTRICITY SYSTEM 2015
70
www.ree.es
> Projects across the Central Pyrenees PCI project 2.27 Increase of exchange capacity between Spain and France (generic project).
This project includes new interconnections between Spain and Fran-ce through the Pyrenees, raised in the ‘Madrid Declaration’ of March 2015, with the aim of increasing the exchange capacity between Spain and France to about 8000 MW. The alternatives contemplate power line routes from the Basque Country, Navarra and Aragon.
At present these projects are currently undergoing technical and en-vironmental studies conducted jointly by RTE and Red Eléctrica to define the routes.
Interconnection with PortugalIn 2006, an agreement between the Spanish and Portuguese gover-nments established the goal of achieving an exchange capacity of 3,000 MW between Spain and Portugal, in order to reach the full le-vel of functioning of the Iberian Electricity Market. At the same time, a number of projects in the Duero area, and on the northern and southern areas of the border were defined.
The last interconnection line with Portugal was commissioned in 2014 with the first circuit of the Puebla de Guzmán-Tavira interconnection, forming a new 400 kV axis between the south of Spain and Portugal, with a thermal capacity per circuit of 1,812 MVA.
For 2017, the western electricity interconnection is planned through Galicia which will connect Fontefría (Spain) and Vilafría (Portugal) via a 400 kV circuit. This project will increase the exchange capacity between Spain and Portugal and will allow the full integration of the Iberian Electricity Market, in addition to improving the integration of renewables on the Iberian Peninsula. This project is considered by the European Union as a Project of Common Interest (PCI).
3,000MW
EXCHANGE CAPACITY UP TO 400KV
CIRCUIT
THERMAL CAPACITY
1,812MVA
PUEBLA DE GUZMÁN-TAVIRA INTERCONNECTION
FONTEFRÍA-VILAFRÍA INTERCONNECTION
PROJECT OF COMMON INTEREST
PCI

71
CHAP. 4 Electricity transmission
The most relevant problems regarding the operation of isolated or weakly interconnected systems, as in the case of non-peninsular electricity systems are: first, frequency control; as the stability of the system frequency must be guaranteed in the case of unforeseen dis-connections of generation or demand and on the other hand, high generation costs.
Interconnections in the Balearic Islands’ electricity systemIn order to continue solving the unique problems of this system, new links are planned that will help to strengthen the Balearic Islands’ system: a second 132 kV Majorca-Menorca link, the double 132 kV Majorca-Ibiza link and the double Ibiza-Formentera link. These links will result in a better management of generation and therefore redu-ced system costs.
After 2020, the new 500 MW link (using VSC technology) between the Spanish Peninsula and Majorca is planned, as well as a third Majorca-Ibiza link. The 132 kV Ibiza-Formentera 1 and 2 links are undergoing their permitting process.
Future interconnection
projects between islands
will provide greater
security, stability
and effi ciency for
the non-peninsular
electricity systems
2x500 MW
VSC TECHNOLOGY
NEW
BALEARIC ISLANDSLINKS
132 kV
132 kV
PENINSULA-MAJORCA LINK
AFTER 2020
THE SPANISH ELECTRICITY SYSTEM 2015
72
www.ree.es
Interconnections in the Canary Islands’ electricity systemThe electricity systems of the Canary Islands are vulnerable electricity systems as, due to their low inertia, the electrical and geographical proximity of the facilities and the greater relative size of system ele-ments with respect to the total, any incident is more critical than in larger, better interconnected systems.
In order to reduce the vulnerability of these systems, the transmission grid planning includes the development of interconnections between these systems that will help significantly improve security of supply, reducing energy not supplied due to incidents, as well as optimise ge-neration resources and improve the integration of renewable energy. Specifically, the development plan includes a new 132 kV submarine link between Lanzarote and Fuerteventura and a 66 kV double link between Tenerife and La Gomera.
A submarine link between the electricity subsystems of Gran Canaria and Fuerteventura-Lanzarote has also been planned, but after 2020, which will help strengthen both systems. Additionally, this link will lead to a better management of the generation of both systems and therefore a reduction in system costs.
Electricity interconnection between the Spanish Peninsula and CeutaThe Ceuta-Spanish Peninsula interconnection via a submarine 132 kV double link, is scheduled to be commissioned in 2020. This project will mean major cost savings for the system as a whole.
The Ceuta-Spanish
Peninsula interconnection
via a 132 kV submarine
link is scheduled to be
commissioned in 2020
CANARY ISLANDS. LANZAROTE-FUERTEVENTURA SUBSYSTEM 132 kV
NEWSUBMARINE LINK
REDUCTION OF SYSTEM COSTS
-€

73
CHAP. 4 Electricity transmission
Commitment to service quality
The service quality indicators for 2015 show the good performance of the peninsular transmission grid and in the non-peninsular systems of the Balearic Islands and the Canary Islands.
The essential performance indicators of overall quality of continuity of supply according to Royal Decree 1955/2000 are Average Interruption Time (AIT) and Energy Not Supplied (ENS).
In the peninsular electricity system, 18 supply disruptions were re-ported in 2015, 25% less than in 2014. This decline is reflected in the ENS which decreases significantly compared with the previous year (53 MWh in 2015 compared to 204 MWh in 2014). Similarly, the AIT with a value of 0.11 minutes (0.44 minutes in 2014), is well below the reference value of 15 minutes set out in Article 26.2 of Royal Decree 1955/2000. The main incident occurred in 220 kV Lucero line (Com-munity of Madrid) with an ENS of 20 MWh.
(Note) The supply continuity indicators shown do not include the potential influence of incidents that are pending classification due to the fact that they are subject to an administrative proceeding currently underway.
TRANSMISSION GRID QUALITY
ENS (MWh) AIT (minutes)
Peninsula Balearic Islands Canary Islands Peninsula Balearic Islands Canary Islands
2011 280 39 17 0,58 3,54 1,02
2012 133 7 10 0,28 0,68 0,61
2013 1,156 81 3 2,47 7,50 0,18
2014 204 13 64 0,44 1,21 3,94
2015 (1) 53 7 29 0,11 0,62 1,76
ENS: Energy not supplied. AIT: average interruption time. // Average interruption time (AIT) = Energy not supplied (ENS) // Average power of the system. // The supply continuity indicators shown do not include the potential influence of incidents that are pending classification due to the fact that they are subject to an administrative proceeding currently underway. (1) Provisional data pending audit (currently underway).
YEAR 20140.44 Min0.11Min
AITPENINSULAR ELECTRICITY SYSTEM
SUPPLY
-25%2015
2014
NUMBER OF DISRUPTIONS
15Min
REFERENCE TIMES ACCORDING TO ROYAL DECREE

THE SPANISH ELECTRICITY SYSTEM 2015
74
www.ree.es
In the Balearic Islands’ electricity system, quality supply indicators for 2015 showed significant improvement over the previous year. 4 supply interruption were recorded with an ENS of 7 MWh (13 MWh in 2014) and AIT of 0.62 minutes (1.21 minutes in 2014). In the Canary Islands’ electricity system, these values were 29 MWh (corresponding to 7 supply interruption) and 1.76 minutes, both lower than the pre-vious year and well below the reference value of 15 minutes.
The quality of the transmission grid is also evaluated based on the availability of the facilities it is composed of. The availability indica-tor measures the capacity or ability of the system to use the various elements of the transmission grid; these being electricity line cir-cuits, transformers and active or reactive (reactors and capacitors) power control elements. The availability rate is calculated as the difference between 100 and the non-availability rate of the trans-mission grid. The evolution of the indicator over the last five years is shown in the graphs.
In 2015, the electricity
systems of the Balearic
and the Canary Islands
have improved continuity
of supply indicators
AITBALEARIC ISLANDS
CANARY ISLANDS0.62 Min1.76 Min
AVERAGE INTERRUPTION TIME
ANNUAL EVOLUTION OF THE NON-AVAILABILITY RATE OF THE TRANSMISSION GRID
Programmed for predictive and preventative maintenance Programmed for causes not due to maintenance Non-programmed due to corrective maintenance Non-programmed due to fortuitous circumstances
Note: Classification according to RD 1955/2000. // The total non-availability rate of the transmission grid does not include non-availabilities due to force-majeure or third party actions.(1) Provisional data pending audit (currently underway).
( )%
2015 -
2014 -
2013 -
2012 -
2011 -
0 0.5 1 1.5 2 2.5
2.27
(1)
2.21
1.80
1.81
2.06

75
CHAP. 4 Electricity transmission
( )%
The availability rate of the peninsular transmission grid in 2015 rea-ched a value of 97.94%, slightly lower than value of 98.19% registered in 2014. In the systems of the Balearic Islands and the Canary Islands, grid availability was 96.88% (98.01% in 2014) and 96.76% (98.37% in 2014) respectively. The increase over the previous year in the non-availability rate in both the peninsular and the non-peninsular electri-city systems is mainly due to the work done in the field of construc-tion, renovation and improvement of grid assets and, in particular, for the electricity system of the Canary Islands, also for additional co-rrective maintenance.
AVAILABILITY RATE OF THE TRANSMISSION GRID
97.94%
96.88%
96.76%
PENINSULAR
BALEARIC ISLANDS
CANARYISLANDS
Programmed for predictive and preventative maintenance Programmed for causes not due to maintenance Non-programmed due to corrective maintenance Non-programmed due to fortuitous circumstances
Note: Classification according to RD 1955/2000. // The total non-availability rate of the transmission grid does not include non-availabilities due to force-majeure or third party actions.(1) Provisional data pending audit (currently underway).
ANNUAL EVOLUTION OF THE NON-AVAILABILITY RATE OF THE TRANSMISSION GRID OF THE BALERIC ISLANDS
( )%
2015 -
2014 -
2013 -
2012 -
2011 -
0 0.5 1 1.5 2 2.5 3 3.5
(1)
1.79
1.93
2.03
1.99
3.12
Programmed for predictive and preventative maintenance Programmed for causes not due to maintenance Non-programmed due to corrective maintenance Non-programmed due to fortuitous circumstances
Note: Classification according to RD 1955/2000. // The total non-availability rate of the transmission grid does not include non-availabilities due to force-majeure or third party actions.(1) Provisional data pending audit (currently underway).
ANNUAL EVOLUTION OF THE NON-AVAILABILITY RATE OF THE TRANSMISSION GRID OF THE CANARY ISLANDS
2015 -
2014 -
2013 -
2012 -
2011 -
0 0.5 1 1.5 2 2.5 3 3.5
(1)
1.05
1.09
1.70
1.63
3.24

THE SPANISH ELECTRICITY SYSTEM 2015
76
www.ree.es
R&D+i in order to achieve a safe, efficient and sustainable grid
Noteworthy among the projects completed in 2015 with a direct im-pact in the transmission grid are the following:
Sel-team: the project is aimed at improving the levels of integration of information, as well as the quality of the data collection system of transmission assets, enabling a rapid response of maintenance personnel. 200 devices have been installed that will capture infor-mation from the protection systems in 241 substations and subse-quently integrate them into the platform.
Power flow redirectors: an innovative power electronics device ca-pable of varying the power flow in an electricity transmission line in real-time has been designed, built and installed in the Torres del Se-gre 220 kV substation. Its application to avoid overloading of the line diverting part of the power flow to other less loaded parallel routes has been validated, hence avoiding the need to modify the topology of the grid or generation re-dispatching. The project was carried out in collaboration with the national industry sector.
Temperature sensing in underground cables: distributed tem-perature sensing of the Maragall-Vilanova 220 kV underground line has been undertaken in the Eixample 220 kV substation in order to conduct an analysis of the ability to withstand overloads and de-termine the influence of the cyclic-loading rate in the transmission capacity of the cable.
On-line monitoring of partial discharges from underground ca-bles: a monitoring system has been implemented in insulation of the Prado Santo Domingo-T Retamar 220 kV cable of the Leganés 220 kV substation to detect potential flaw points. The project was carried out in collaboration with the national industry sector.
PRADO SANTO DOMINGO-T DE RETAMAR CABLE
MARAGALL-VILANOVA UNDERGROUND CABLE
Tº FLAWS
SEL-TEAM
RAPIDOF MAINTENANCE TEAMS
RESPONSE
CONTROL OF
CONTROL

77
CHAP. 4 Electricity transmission
Electricity line visibility: a new methodology has been designed to qualitatively and quantitatively assess the visibility of overhead electricity lines, and a new functionality has been implemented in the corporate geographic information system. This tool allows three-dimensional maps to be drafted with this qualitative and quantitative information along with data of terrain orography, elec-tricity towers and up to 17 species of trees.
Substation switchyard 61850: prototypes and test models have been developed associated with the implementation of the IEC 61850 standard for communication networks command and con-trol systems in substation which have reached a sufficient testing and maturity stage so as to allow their deployment in an actual substation.
Ehighway 2050: in this European project a new methodology for the planning of a Pan-European electricity transmission system has been drafted, with a 2050 horizon.
Electricity transmission grid planning 2015-2020
The electricity transmission grid planning for the period 2015-2020, approved on 16 October 2015 by the Council of Ministers, was drafted by the Ministry of Industry, Energy and Tourism and aims to ensure the security of electricity supply, whilst respecting the environment and at the lowest cost to the consumer.
The Ministry of Industry, Energy and Tourism, on a proposal from Red Eléctrica de España, as System Operator, has developed the electricity planning with the participation of the autonomous com-munities and the cities of Ceuta and Melilla, requiring a report from the National Commission for Markets and Competition and the hearing process. In addition, electricity planning has undergone a strategic environmental assessment process which culminated in the EMAS Environmental Statement jointly signed by the Ministry of Industry, Energy and Tourism and the Ministry of Agriculture, Food and Environment.
As of this planning which covers a period of six years and is binding in nature, Red Eléctrica de España, in its capacity as sole transmis-sion agent and system operator has the responsibility to develop a safe, energy efficient and sustainable transmission grid. The total investment of planned infrastructure amounts to € 4,554 million.
As a new item in the document, the planning 2015-2020 includes a non-binding annex, for those facilities deemed necessary with a horizon after 2020, so that their administrative permitting process may be commenced.
ELECTRICITY TRANSMISSION GRID PLANNING
INVESTMENT 4,554 MILLION
€
6YEARS

THE SPANISH ELECTRICITY SYSTEM 2015
78
www.ree.es
PENINSULA
The planned actions in the electricity transmission grid for the 2015-2020 horizon according to their structural motivation or connection are summarised below:
Security of supply: new grid meshing is planned that will improve the quality of supply in large parts of the country, and 155 new support actions from the transmission grid to the distribution network and large consumers to improve quality of supply locally.
Technical constraints: strengthening has taken place in the trans-mission grid to eliminate or reduce the technical constraints asso-ciated to the evacuation of generation, thereby reducing the cost of these constraints.
MAIN ACTIONS SET OUT IN THE TRANSMISSION GRID PLANNING 2015-2020
Areas with planned actions
Security of supply Technical constraints Industrial demand High-Speed Train Interconnection Evacuation of renewables Demand (support for distribution) Strengthening of interconnection

79
CHAP. 4 Electricity transmission
Demand: 13 new substations and the enlargement of another 11 are planned in order to feed the new high-speed train lines. Also planned are new local developments in the transmission grid to provide sup-port for supplying electricity for industrial demand.
Interconnections: the strengthening of interconnections between is-lands and of Ceuta with the Spanish Peninsula will significantly improve the quality of supply and reduce the cost of generation. In this regard, the strengthening of international interconnections is also included.
Evacuation of generation: projects whose total power is adjusted to the forecast regarding demand coverage have been taken into ac-count. Additionally, priority has been given to those projects that have made greater progress in the administrative permitting process.
BALEARIC ISLANDS
CANARY ISLANDS
Areas with planned actions
Security of supply Technical constraints Interconnection Evacuation of renewables
electricity markets

81
CHAP. 5 Electricity markets
The average
price of
energy in the
electricity
market in 2015
reached the
highest value
since 2008
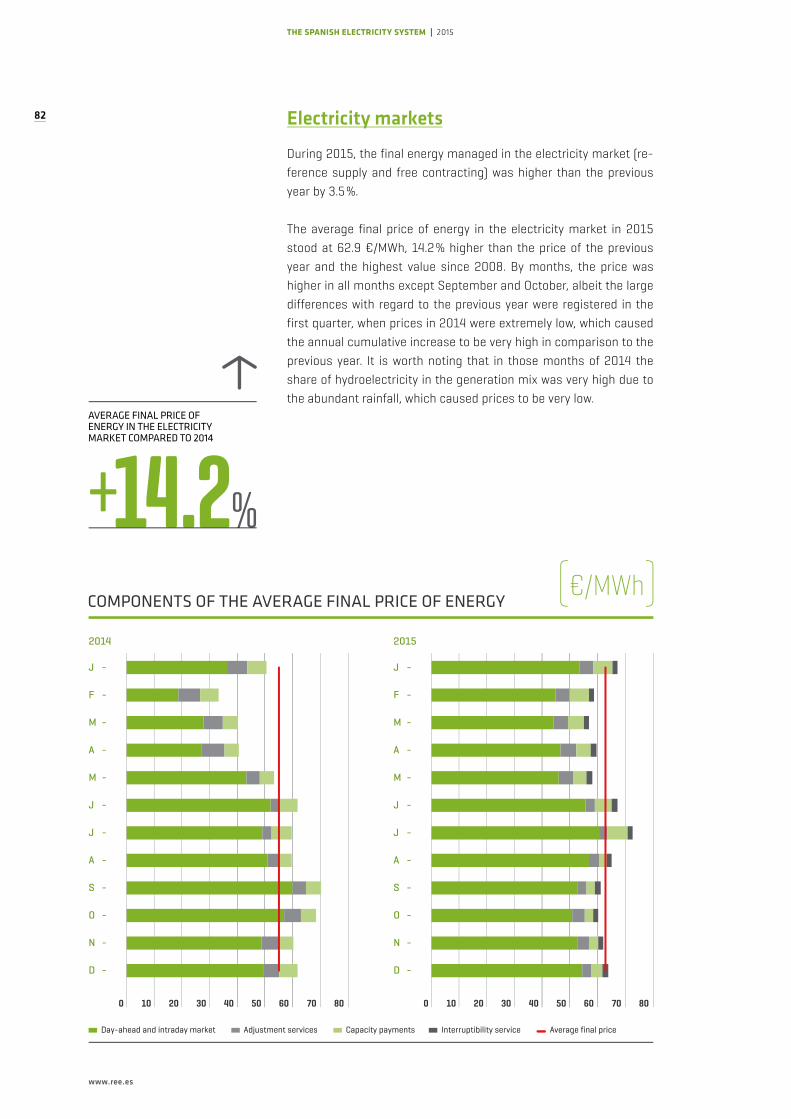
82
www.ree.es
THE SPANISH ELECTRICITY SYSTEM 2015
Electricity markets
During 2015, the final energy managed in the electricity market (re-ference supply and free contracting) was higher than the previous year by 3.5%.
The average final price of energy in the electricity market in 2015 stood at 62.9 €/MWh, 14.2% higher than the price of the previous year and the highest value since 2008. By months, the price was higher in all months except September and October, albeit the large differences with regard to the previous year were registered in the first quarter, when prices in 2014 were extremely low, which caused the annual cumulative increase to be very high in comparison to the previous year. It is worth noting that in those months of 2014 the share of hydroelectricity in the generation mix was very high due to the abundant rainfall, which caused prices to be very low.
+14.2%
AVERAGE FINAL PRICE OF ENERGY IN THE ELECTRICITY MARKET COMPARED TO 2014
Day-ahead and intraday market Adjustment services Capacity payments Interruptibility service Average final price
J -
F -
M -
A -
M -
J -
J -
A -
S -
O -
N -
D -
0 10 20 30 40 50 60 70 80
2014
J -
F -
M -
A -
M -
J -
J -
A -
S -
O -
N -
D -
0 10 20 30 40 50 60 70 80
2015
COMPONENTS OF THE AVERAGE FINAL PRICE OF ENERGY( )€/MWh

83
CHAP. 5 Electricity markets
System adjustment
services and capacity
payments decreased
by 25% and 15%
respectively, compared
to the increase in
the price component
of the day-ahead and
intraday market
During 2015, the components that made up the price of energy were the following: day-ahead and intraday markets 82.2%, system adjustment services 6.8%, capacity payments 8% and the remaining 3% was for interruptibility service. Compared to last year, an increase of 19% was seen in the price component of the day-ahead and intraday markets, while adjustment services and capacity payments decreased (25% and 15%, respectively). The decline in capacity payments component is due to the reduction established in Royal Decree-Law 9/2015 of 10 July. In 2015 the interruptibility service appears as a new component.
AVERAGE FINAL PRICE IN 2015
62.9€/MWh
ENERGYe
COMPONENTS OF THE FINAL PRICE 2015
DAY-AHEAD AND INTRADAY MARKETS
INTERRUPTIBILITY SERVICES
ADJUSTMENT SERVICES
82.2 6.8
4.4
1.5
0.951.7 €/MWh
CAPACITY PAYMENTS
8
5.0 €/MWh
1.9 €/MWh
4.3 €/MWh
PDBF TECHNICAL CONSTRAINTS
2.8 €/MWh
SECONDARY CONTROL BAND
0.9 €/MWh
OTHER
0.6 €/MWh
( )%
3

84
www.ree.es
THE SPANISH ELECTRICITY SYSTEM 2015
Day-ahead market
The energy on the day-ahead market stood at 247 TWh in 2015 (176 TWh on the spot market without bilateral contracts), represen-ting an increase of 0.2% compared to 2014. 72.7% of the energy was traded on the spot market (72% in 2014), and the remaining 27.3% through bilateral contracts, compared with 28% the previous year. These percentages have remained very similar since 2010, with an average value of 72.6% for the spot market and 27.4% for bilateral.
Energy supplied by traders/agents different to the reference traders/agents continued to increase, reaching a market share of 86.3% in 2015, compared with 84.3% the previous year.
ENERGY ON THE DAY-AHEAD MARKET IN 2015
247TWh
COMPARED TO 2014
+0.2 %
ENERGY PURCHASED ON THE DAY-AHEAD MARKET
( )%
72.7 27.3
2015 -
2014 -
2013 -
2012 -
2011 -
0 50 100 150 200 250 300
86.3% 13.7%
84.3% 15.7%
80.7% 19.3%
77.6% 22.4%
74.3% 25.7%
Trader-Bilateral Trader-Day-ahead RT-Bilateral RT-Day-ahead
EVOLUTION OF PURCHASES IN PDBF FROM REFERENCE TRADERS (RT) AND REMAINING TRADERS
( )TWh
SPOT MARKET
BILATERAL CONTRACTS

85
CHAP. 5 Electricity markets
The arithmetic average of the day-ahead market price stood at 50.32 €/MWh, a value 19.4% higher than the previous year and slightly lower than that of Portugal, (50.43 €/MWh).
If the structure of the generation mix in the day-ahead market is taken into account, representing an important factor in the price formation, one can see that in 2015 hydro reduced its share, while coal increased its share. In annual terms, coal increased its share by nearly 9%, while hydro and wind reduced their share by 6% and 3% respectively.
AVERAGE PRICE IN THE DAY-AHEAD MARKET COMPARED TO 2014 19.4%HYDRO COAL WIND
9pp -6pp -3pp
PRICEEVOLUTION OF THE GENERATION MIX SHARE COMPARED TO 2014
PERCENTAGE OF ENERGY SALES BY TECHNOLOGY IN THE SPOT MARKET
100
90
80
70
60
50
40
30
20
10
0
Hydro Nuclear Coal Combined cycle Wind Solar photovoltaic Solar thermal Other renewables Cogeneration Waste International
( )%
2014 2015
J F M A M J J A S O N D J F M A M J J A S O N D
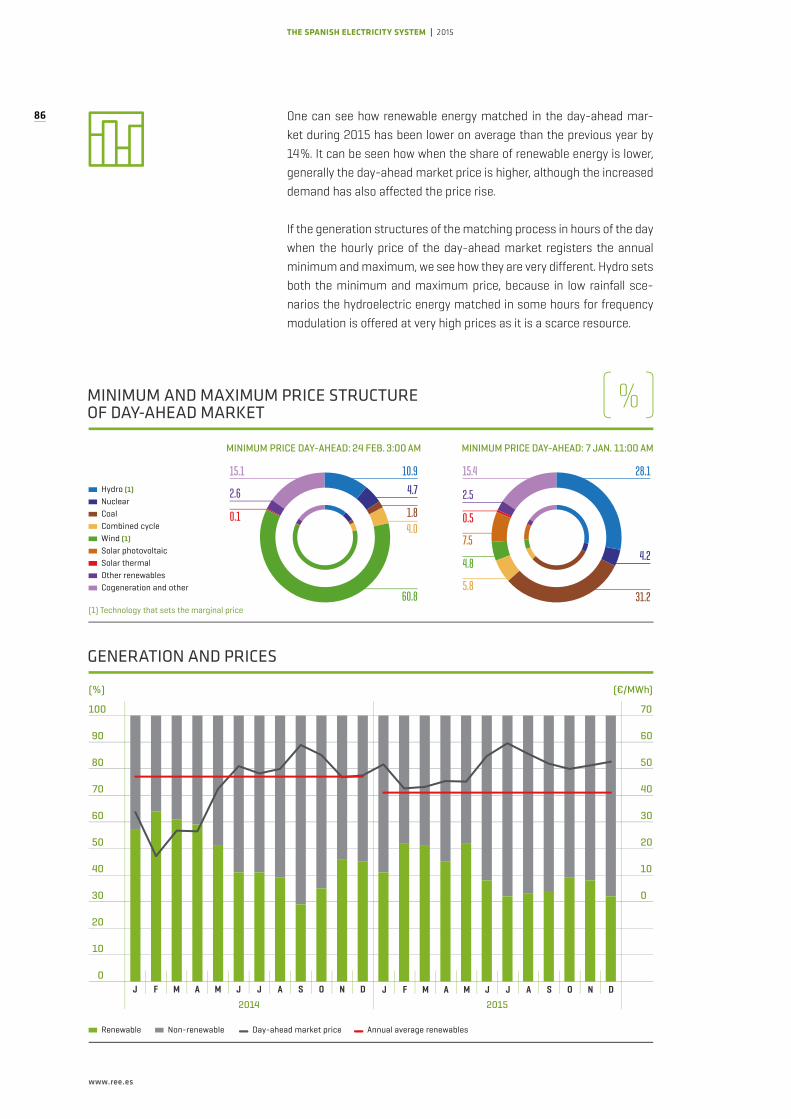
86
www.ree.es
THE SPANISH ELECTRICITY SYSTEM 2015
One can see how renewable energy matched in the day-ahead mar-ket during 2015 has been lower on average than the previous year by 14%. It can be seen how when the share of renewable energy is lower, generally the day-ahead market price is higher, although the increased demand has also affected the price rise.
If the generation structures of the matching process in hours of the day when the hourly price of the day-ahead market registers the annual minimum and maximum, we see how they are very different. Hydro sets both the minimum and maximum price, because in low rainfall sce-narios the hydroelectric energy matched in some hours for frequency modulation is offered at very high prices as it is a scarce resource.
100 70
90 60
80 50
70 40
60 30
50 20
40 10
30 0
20
10
0
(%) (€/MWh)
GENERATION AND PRICES
Renewable Non-renewable Day-ahead market price Annual average renewables
2014 2015
J F M A M J J A S O N D J F M A M J J A S O N D
MINIMUM PRICE DAY-AHEAD: 24 FEB. 3:00 AM MINIMUM PRICE DAY-AHEAD: 7 JAN. 11:00 AM
Hydro (1) Nuclear Coal Combined cycle Wind (1) Solar photovoltaic Solar thermal Other renewables Cogeneration and other
(1) Technology that sets the marginal price
MINIMUM AND MAXIMUM PRICE STRUCTURE OF DAY-AHEAD MARKET
( )%
0.1
15.1 10.94.72.6
60.8
4.01.8 0.5
15.4 28.1
4.2
2.5
4.8
5.831.2
7.5
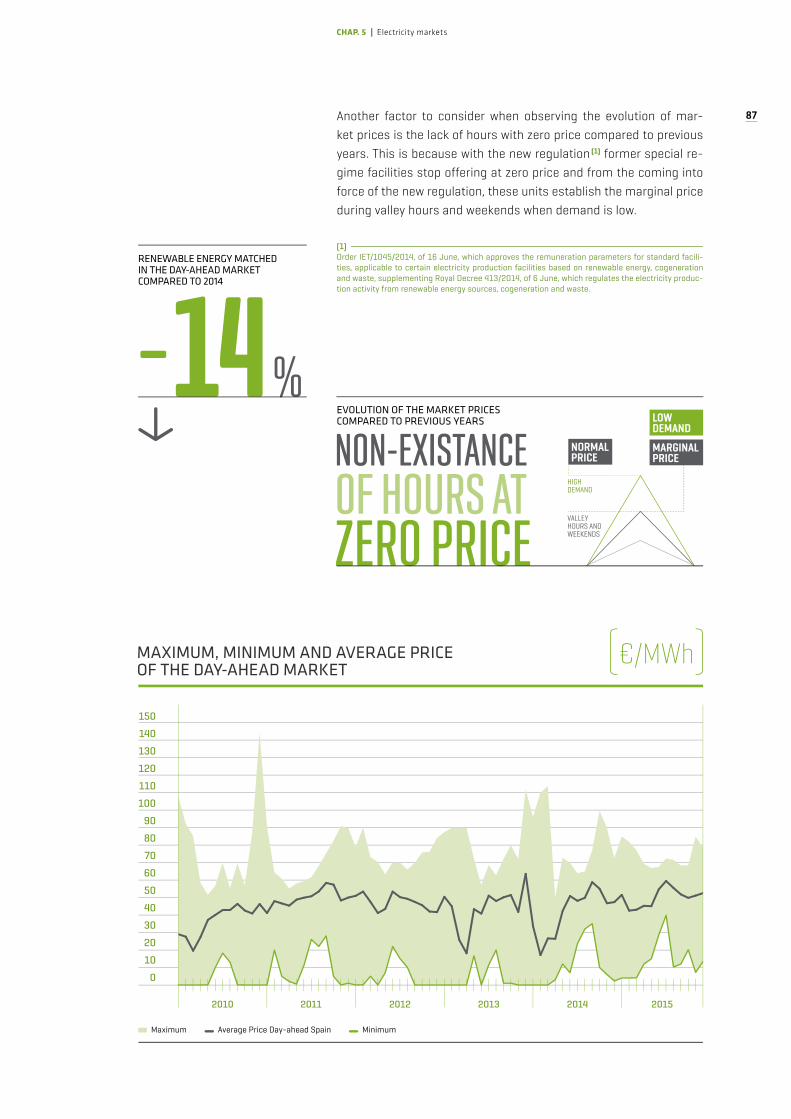
87
CHAP. 5 Electricity markets
MARGINAL PRICE
NORMAL PRICE
VALLEY HOURS AND WEEKENDS
HIGH DEMAND
LOW DEMAND
Another factor to consider when observing the evolution of mar-ket prices is the lack of hours with zero price compared to previous years. This is because with the new regulation (1) former special re-gime facilities stop offering at zero price and from the coming into force of the new regulation, these units establish the marginal price during valley hours and weekends when demand is low.
(1)Order IET/1045/2014, of 16 June, which approves the remuneration parameters for standard facili-ties, applicable to certain electricity production facilities based on renewable energy, cogeneration and waste, supplementing Royal Decree 413/2014, of 6 June, which regulates the electricity produc-tion activity from renewable energy sources, cogeneration and waste.
OF HOURS AT ZERO PRICE
EVOLUTION OF THE MARKET PRICES COMPARED TO PREVIOUS YEARS
NON-EXISTANCE
RENEWABLE ENERGY MATCHED IN THE DAY-AHEAD MARKET COMPARED TO 2014
-14%
150
140
130
120
110
100
90
80
70
60
50
40
30
20
10
0
Maximum Average Price Day-ahead Spain Minimum
MAXIMUM, MINIMUM AND AVERAGE PRICE OF THE DAY-AHEAD MARKET
2010 2011 2012 2013 2014 2015
( )€/MWh

88
www.ree.es
THE SPANISH ELECTRICITY SYSTEM 2015
If we compare the price of the Spanish day-ahead market with Euro-pean markets, it can be observed how since May 2014 the OMIE-Spain prices were, along with Italy, the highest in Europe.
Intraday market
Energy sales in the intraday market stood at 27.8 TWh, 10.5% lower than in 2014, 31.3% of sales corresponding to a net increase in de-mand and/or pumped-storage consumption.
The arithmetic average of the intraday market price in 2015 stood at 51.4 €/MWh, greater than the 50.3 €/MWh of the day-ahead market.
Adjustment services
The volume of energy managed in the system adjustment services in 2015 was 18,206 GWh, 26.5% lower than the previous year. During 2015, there were no incentives for production using domestic coal, therefore no energy was scheduled for resolution of security of supply
During 2015, the cost of
adjustment services was
€ 1,040 million, 31.5% lower
than last year
ENERGY CONTRACTED ON THE INTRADAY MARKET COMPARED TO 2014
-10.5%
70
60
50
40
30
20
10
0
PRICES OF EUROPEAN MARKETS
OMIE APX Netherlands IPEX Italy EPEX Germany NordPool EPEX France
( )€/MWh
2014 2015

89
CHAP. 5 Electricity markets
constraints. In the rest of the adjustment services, the energy schedu-led was reduced except for deviation management, which was up 13%, although the volume of energy in this market represented only 15% of the total. The decline in energy scheduled for resolving technical cons-traints of the Daily Base Operating Schedule (PDBF) was because in 2014 it was very high owing to the fact that a lot of hydroelectricity and wind power generation was matched, reducing thermal, so combined cycle units were not matched in the day-ahead market, having to be scheduled for resolving security of supply constraints.
During 2015, the cost of the adjustment services was € 1,040 million, 31.5% lower than last year. One can appreciate that the cost of de-viations is the value that has decreased the most. In this section the close of energy that disappeared from the settlement on 31 March 2015 due to regulatory change was considered, reducing the cost of deviations by about 100 million euros.
VOLUME OF ENERGY MANAGED IN THE SYSTEM ADJUSTMENT SERVICES COMPARED TO 2014
-26.5%
COST OF ADJUSTMENT SERVICES COMPARED TO 2014
-31.5%
ENERGY MANAGED IN THE SYSTEM ADJUSTMENT SERVICES
Jan-Dec 2014 Jan-Dec 2015
Security of -supply constraints
Technical - constraints (PDBF)
Secondary control -
Tertiary control -
Deviation management -
Real-time -technical constraints
0
2 (mil)
4 (mil)
6 (mil)
8 (mil)
10 (mil)
12 (mil)
( )GWh
COST OF ADJUSTMENT SERVICES
2014 2015
PDBF constraints 809 691
Real-time technical constraints 89 45
Technical constraints 898 736
Secondary control band 269 225
Additional upward energy reserve 144 49
Deviations 216 42
Deviations surplus -2 3
Power control factor -8 -15
Total Adjustment services 1,517 1,040
Δ 2015 / 2014 -31.5%
( )M€
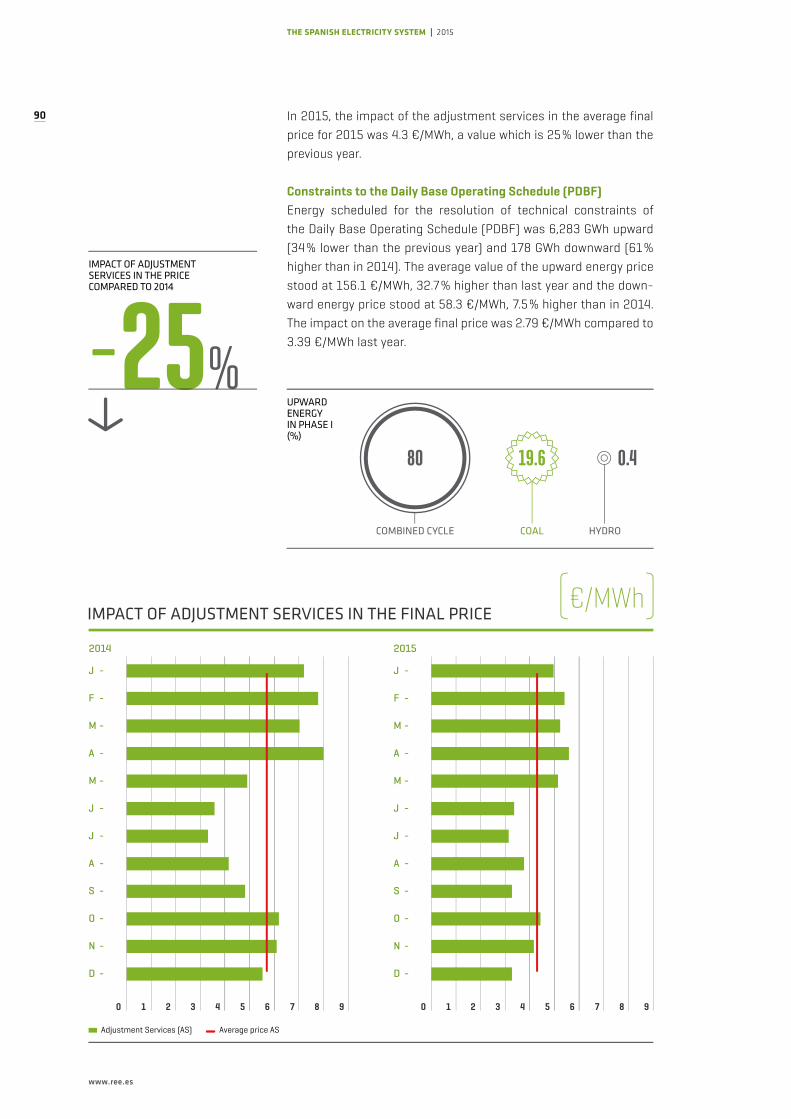
90
www.ree.es
THE SPANISH ELECTRICITY SYSTEM 2015
In 2015, the impact of the adjustment services in the average final price for 2015 was 4.3 €/MWh, a value which is 25% lower than the previous year.
Constraints to the Daily Base Operating Schedule (PDBF)Energy scheduled for the resolution of technical constraints of the Daily Base Operating Schedule (PDBF) was 6,283 GWh upward (34% lower than the previous year) and 178 GWh downward (61% higher than in 2014). The average value of the upward energy price stood at 156.1 €/MWh, 32.7% higher than last year and the down-ward energy price stood at 58.3 €/MWh, 7.5% higher than in 2014. The impact on the average final price was 2.79 €/MWh compared to 3.39 €/MWh last year.
UPWARD ENERGY IN PHASE I (%)
COMBINED CYCLE HYDROCOAL
80 0.419.6
-25%
IMPACT OF ADJUSTMENT SERVICES IN THE PRICE COMPARED TO 2014
IMPACT OF ADJUSTMENT SERVICES IN THE FINAL PRICE
Adjustment Services (AS) Average price AS
J -
F -
M -
A -
M -
J -
J -
A -
S -
O -
N -
D -
2015
( )€/MWh
J -
F -
M -
A -
M -
J -
J -
A -
S -
O -
N -
D -
2014
0 1 2 3 4 5 6 7 8 9 0 1 2 3 4 5 6 7 8 9

91
CHAP. 5 Electricity markets
The energy scheduled in phase I for resolution of technical constra-ints of the PDBF mainly corresponds to combined cycle and coal. The downward energy in phase I is practically negligible. The following chart shows the evolution of the last five years of upward energy of these technologies in Phase I of resolution of technical cons-traints of the PDBF.
Remainder of Adjustment ServicesIn the markets for secondary and tertiary control, deviation manage-ment and resolution of technical constraints in real-time a total of 2,559 GWh, 4,753 GWh, 2,763 GWh and 1,670 GWh, were managed res-pectively. Of this total, 74.2% corresponds to upward energy managed and the remaining 25.8% corresponds to downward energy.
Energy scheduled in phase I for constraints corresponds mostly to combined cycle and coal
-34%
61%
ENERGY SCHEDULED FOR RESOLUTION OF TECHNICAL CONSTRAINTS COMPARED TO 2014
UPWARD
DOWNWARD
1,400
1,200
1,000
800
600
400
200
0
300
250
200
150
100
50
0
2011 2012 2013 2014 2015
(GWh) (€/MWh)
Combined cycle (GWh) Coal (GWh) Upward price (€/MWh)
UPWARD ENERGY SCHEDULED IN PHASE I – COAL AND COMBINED CYCLE – AND UPWARD PRICE

92
www.ree.es
THE SPANISH ELECTRICITY SYSTEM 2015
Regarding power reserves, the volume of additional upward power re-serve that had to be allocated was 2,109 GW, a value 51% less than that allocated the previous year, with an impact of 0.19 €/MWh on the average final price of energy.
The average hourly secondary control band allocated was 1,197 MW, with an impact of 0.91 €/MWh, 19.2% lower than the previous year.
The weighted upward secondary and tertiary prices have remained fairly constant, while upward prices of real-time re-dispatches suffe-red a sharp rise in 2012, keeping in line with those values in 2013 and decreasing in the past two years. This decrease is a result of the mo-
AVERAGE HOURLY SECONDARY CONTROL BAND COMPARED TO 2014
-19.2% 250
200
150
100
50
0
ANNUAL EVOLUTION OF THE AVERAGE WEIGHTED PRICE OF THE ADJUSTMENT SERVICES
( )€/MWh
Day-ahead market Tertiary control Secondary control Real-time technical constraints
2010 2011 2012 2013 2014 2015
500
450
400
350
300
250
200
150
100
50
0J F M A M J J A S O N D J F M A M J J A S O N D J F M A M J J A S O N D
ANNUAL EVOLUTION OF THE AVERAGE WEIGHTED PRICE OF UPWARD ENERGY FOR RESOLUTION OF REAL-TIME CONSTRAINTS
( )€/MWh
2014 2015 2016

93
CHAP. 5 Electricity markets
dification implemented by the Resolution of 8 May 2014 of Operating Procedure 14.4 ‘Collection rights and payment obligations’ (P.O. 14.4 ‘Derechos de cobro y obligaciones de pago’) for system adjustment services, in which the methodology for settlements of real-time tech-nical constraints is amended.
In the graph of the annual evolution of the average weighted upward price for resolution of technical constraints in real-time shows in de-tail the evolution of the weighted upward prices for resolution of tech-nical constraints in real-time by month.
Voluntary Price for the Small Consumer (PVPC)
The voluntary price for the small consumer has been 6.6% higher than the previous year.
The highest PVPC price was recorded in July, 132.26 €/MWh, while the lowest was registered in October, 117 €/MWh.
Its evolution throughout 2015 has been conditioned by the increase in the day-ahead market price as the PVPC is indexed to it and therefore reflects its variations. The difference between the day-ahead market price and the PVPC decreased in the last months of the year. This was due to the fact that, as of the second half of the year, the part correspon-ding to the PVPC access tariffs was reduced, in particular, the amount foreseen for security of supply, which in 2015 had already disappeared.
HIGHEST AND LOWEST
117.0€/MWh
132.26€/MWh
JUL APR
ePVPC
82
78
74
70
66
62
58
54
140
120
100
80
60
40
20
0
Difference PVPC- Day-ahead market PVPC Day-ahead market
EVOLUTION OF THE PVPC COMPARED TO THE DAY-AHEAD MARKET PRICE (GENERAL TARIFF 2.0 A)
( )€/MWh
J F M A M J J A S O N D

european scope

95
In 2015, in the set countries that belong to ENTSO-E, electricity de-mand broke the downward trend of the past four years to register a growth of 1.2% over the previous year. The main reasons for this in-crease were the lower temperatures during winter and higher tempe-ratures in summer, as well as an improvement in economic conditions.
In 2015,
electricity
demand in
Europe
recovered a
positive
growth rate
not seen
since 2010
Note. Data available at ENTSO-E. Data Portal and Statistical Factsheet 2015 as at 25 May 2016.
CHAP. 6 | European scope

THE SPANISH ELECTRICITY SYSTEM | 2015
96
www.ree.es
The following map shows the evolution of the electricity demand in each country compared to 2014. Because of its importance in the overall contribution to demand, noteworthy were the falls registered in Germany (-1.7%) and Finland (-1%), as well as the increases in France (+ 2.2%), Spain (+ 1.9%) and Italy (+ 1.9%).
Growth in renewable energies
Regarding generation, energy from renewable sources (hydroelectric pumped-storage generation is excluded) represented 30.3% of the energy produced in the set countries that belong to ENTSO-E, 4.3% higher than the previous year. Spain ranks second behind Germany in volume of wind power plus solar power generation.
≥ 4% 3.9% to 2% 1.9% to 0.5% Stable -0.5% to -1.9% -2% to -3.9% ≤ -4%
Source: ENTSO-E. Data Portal and Statistical Factsheet 2015. Spain REE.
VARIATION IN ELECTRICITY DEMAND IN ENTSO-E MEMBER STATES 2015/2014
( )%
-2.8
0.6
5.11.9
2.9
4.9
1.4
1.3
2.8
3.12.8
-0.7
2.33.9
3.5
3.9
-1.0
0.3
2.2
3.3
0.3
-2.2
0.6
2.9
-1.7
6.53.5
1.9
1.51.8
3.7
1.4
0.4
-5.7
2.5

97
CHAP. 6 | European scope
The following map shows the contribution of renewable energies to cover total demand in each of the countries. It should be noted that Spain is in the group of countries with the highest coverage rate using renewables with 35% over total generation.
NET GENERATION 2015 (1)
( )%
NET GENERATION COMING FROM RENEWABLE SOURCES 30.3%
17.1
41.2
16.6
25.1
Hydro Fossil fuels Nuclear Other renewables
(1) ENTSO-E member states.Source: ENTSO-E. Data Portal and Statistical Factsheet 2015.
≥ 30% 29% to 20% 19% to 10% < 10%
Source: ENTSO-E. Data Portal and Statistical Factsheet 2015. Spain REE.
RENEWABLE ENERGY OVER TOTAL GENERATION OF ENTSO-E MEMBER STATES 2015
( )%
28.3
28.7
24.1
24.5
19.5
22.9
35.0
3.3
97.6
63.3
44.7
50.9
100.0
30.8 42.2
39.8
48.1 39.5 0.0
67.1
60.5
61.9
14.1
11.4
12.9
35.0
2.4
16.322.7
10.9
20.7
16.511.1
5.2
12.4
MORE THAN IN 2014
4.3%
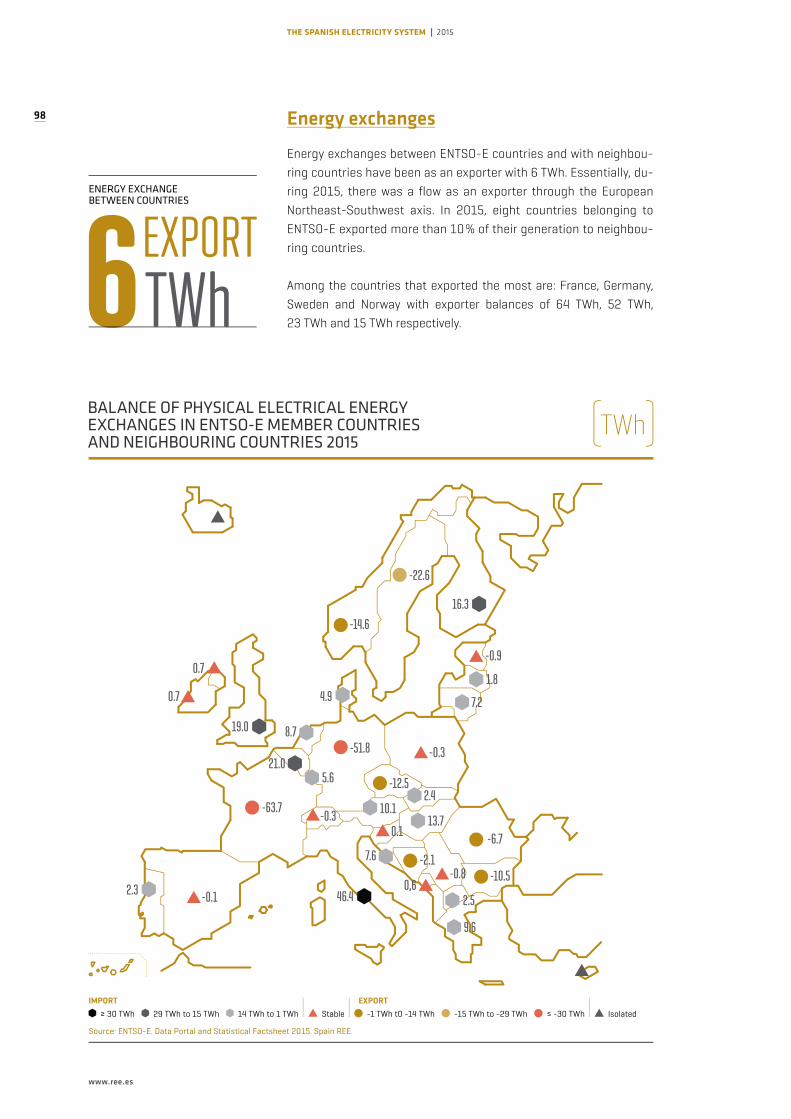
THE SPANISH ELECTRICITY SYSTEM | 2015
98
www.ree.es
Energy exchanges
Energy exchanges between ENTSO-E countries and with neighbou-ring countries have been as an exporter with 6 TWh. Essentially, du-ring 2015, there was a flow as an exporter through the European Northeast-Southwest axis. In 2015, eight countries belonging to ENTSO-E exported more than 10% of their generation to neighbou-ring countries.
Among the countries that exported the most are: France, Germany, Sweden and Norway with exporter balances of 64 TWh, 52 TWh, 23 TWh and 15 TWh respectively.6TWh
EXPORT
ENERGY EXCHANGE BETWEEN COUNTRIES
IMPORT EXPORT
≥ 30 TWh 29 TWh to 15 TWh 14 TWh to 1 TWh Stable -1 TWh t0 -14 TWh -15 TWh to -29 TWh ≤ -30 TWh Isolated
Source: ENTSO-E. Data Portal and Statistical Factsheet 2015. Spain REE.
-0.1
-63.7
-51.8
-0.3
-14.6
-12.5
-22.6
0.1
-2.1-10.5
-6.7
-0.9
-0.3
5.6
-0.8
2.50,62.3 46.4
9.6
7.2
1.8
2.4
13.710.1
8.7
21.0
19.0
16.3
4.9
7.6
0.7
0.7
BALANCE OF PHYSICAL ELECTRICAL ENERGY EXCHANGES IN ENTSO-E MEMBER COUNTRIES AND NEIGHBOURING COUNTRIES 2015
( )TWh
CHAP. 6 | European scope
99In 2015, countries
belonging to ENTSO-E
exported 6 TWh to
neighbouring countries,
and in eight of these
countries this exchange
accounted for more than
10% of their generation

regulatory framework

CHAP. 7 | Regulatory framework
101
2015 has been the year of consolidation of the regulatory reform pro-cess of the Spanish electricity sector started in 2013, as a result of the publication of the following rulings by which the essential regula-tory development of the new electricity sector normative framework coming from Law 24/2013, of 26 December, may be regarded as ha-ving been virtually completed:
• Royal Decree 900/2015, of 9 October, which regulates the admi-nistrative, technical and economic conditions of the modalities for electricity supply with self-consumption and generation with self-
The development
of the regulatory
framework,
approved in
2013, regarding
the Spanish
electricity sector
was completed
during 2015

102
www.ree.es
THE SPANISH ELECTRICITY SYSTEM | 2015
consumption. This is the first ruling that defines a specific regulation for this modality of supply in which the consumer generates electri-city for own consumption.
• Royal Decree 738/2015 which regulates the activity of electricity ge-neration and the dispatching procedure in the electricity systems of non-peninsular territories. This ruling revises the regulatory fra-mework for the remuneration of the activity of electricity generation and for the economic and technical management of these electricity systems, seeking a triple objective: reduce production costs in these systems, promote competition and incorporate efficient price sig-nals to consumers.
Similarly, as a development of that set out in Article 5 of Law 17/2013, of 29 October, for the security of supply and increased competition in the insular and extra-peninsular electricity systems, Royal Decree 738/2015 regulates specifically the administrative, economic and legal scheme for pumped storage facilities whose main objective is to ensure security of supply, safety of the system and the integration of non-manageable renewable energies in these electricity systems, which are characterised as assets that are managed as part of the system operation activity.
• Royal Decree 947/2015 of 16 October, which establishes a call for the granting of the specific remuneration scheme to new facilities pro-ducing electricity from biomass on the peninsular electricity system and to wind-technology facilities. This is a regulation that ends the moratorium on the promotion of premiums for renewable facilities in force since 2012, by the call for an auction of 500 MW of wind and 200 MW of biomass, which opens a new stage in the development of renewable energy in the Spanish electricity system.
500MW200MW
947/2015CALL FOR AUCTION
CALL FOR AUCTION
WINDBIOMASS
ROYAL DECREE

103
CHAP. 7 | Regulatory framework
In addition to the general provisions previously indicated, during 2015 numerous regulatory developments on the main provisions which make up the electricity sector reform were published, among which are Order IET / 2659/2015 and Order IET / 2660 / 2015, both of 11 December, which determine the standard reference values of investment and operation and maintenance for calculating the re-muneration for transmission and distribution activities, respectively.
Following the publication of these regulations, several resolutions required to complete the remuneration models for the transmission and distribution activities have been approved in the first half of 2016. This process has concluded with the publication of the rele-vant regulations which establish the recognised cost for these ac-tivities for 2016, calculated for the first time by applying their new remuneration models.
Another regulatory milestone worth noting was the approval of the Electricity Transmission Grid Planning for the period 2015-2020, for-malised by means of Order IET/2209/2015 of 21 October, that publis-hes the Agreement of the Council of Ministers of 16 October 2015 by which the document ‘Energy Planning. Electricity Transmission Grid Development Plan 2015-2020’ is approved.
In 2015, standard
reference values
were approved for
new remuneration
models for
electricity
transmission
and distribution
activities, which
will begin to be
applied as of 2016
IET/2209/2015
TRANSMISSION GRID PLANNING 2015-2020
ORDER
OK
ENERGY PLANNING DOCUMENT IS APPROVED

104
www.ree.es
THE SPANISH ELECTRICITY SYSTEM | 2015
The new Electricity Transmission Grid Development Plan 2015-2020 envisages a volume of investment for the planning horizon of € 4,554 M, and ends the suspension, established in Royal Decree-Law 13 / 2012 of 30 March, of the granting of new administrative authorisations for facilities contemplated in the previous planning.
At the European Community Union level, in 2015 noteworthy was the publication of the ‘European Union Energy Package' by the European Commission, which defines a new strategic framework to achieve the targets of the European Community’s policy on energy and the fight against climate change, and in particular for the new specific targets for 2030 (40% reduction in emissions compared to 1990, 27% share of renewables in the final energy generation mix, 27% energy saving compared to forecasts of consumption and 15% interconnection ca-pacity between member countries), which will require an in-depth transformation of the European energy system.
To promote and facilitate the achievement of these targets, this new legislative package confers great importance to increasing inter-connection capacity between member countries, including a spe-
The ‘European Union
Energy Package’,
approved by the
European Commission
in 2015, aims to meet
the goals of the energy
policy and combat
climate change
NEW TRANSMISSION GRID DEVELOPMENT PLAN
€4,554MINVESTMENT FORESEEN

105
CHAP. 7 | Regulatory framework
cific strategy to ensure the full integration of the internal electricity market through adequate levels of interconnection, requiring a large and renewed political impetus at a European level involving both the authorities of the connecting countries as well as the authorities of the European Community.
Consistent with its energy policy, during 2015 the EU has continued to develop regulatory tools to facilitate the completion of the internal energy market through the development of the necessary infrastruc-ture, publishing for this purpose the Commission Delegated Regula-tion (EU) 2016/89, of 18 November 2015, amending Regulation (EU) No 347/2013 of the European Parliament and of the Council concer-ning the Union’s list of Projects of Common Interest (PCI). Among the PCIs that make up this new list, for whose selection priority has been given to those that enable Member States to achieve the target of 10% interconnection in 2020, a new interconnection project, generic, between Spain and France via the Pyrenees has been incorporated.
The interconnection
between Spain and
France via the Pyrenees
is part of the PCIs of
the European Union
ENERGY POLICY. EUROPEAN COMMUNITY TARGETS
ENERGY SAVINGS
EMISSIONS REDUCTION REGARDING 1990
-40% 27% 15%27%
RENEWABLE SHARE IN FINAL ENERGY CONSUMPTION
INTERCONNECTION CAPACITY

glossary of terms

107
THE SPANISH ELECTRICITY SYSTEM Glossary of terms
Additional Upward Reserve Power. Is the upward power reserve value that may be required with respect to that available in the Provisional Daily Viable Schedule (PDVP) in order to guarantee the security of the electricity system on the Spanish peninsula. The contracting and ma-nagement of the additional upward power reserve is performed by the system operator, if and when the system conditions require it, through a specific market mechanism.
AIT (Average Interruption Time). Time, in minutes, which results from dividing the ENS (energy not supplied to the system due to interrup-tions of the service occurred in the transmission grid), by the average power of the peninsular system.
Balance Markets. Are those system adjustment services markets which allow the generation and demand to be balanced (deviation ma-nagement services and tertiary and secondary control energy).
Bilateral Contracts. The generators, traders, consumers or represen-tatives of any of the aforementioned, as participants in the production market may formalise bilateral contracts regarding physical electri-city delivery.
Capacity Auction. Process used to allocate interconnection capacity with France based on market mechanisms, through explicit auctions on different time horizons.

THE SPANISH ELECTRICITY SYSTEM 2015
108
www.ree.es
Capacity Payment. Regulated payment to finance the medium and long-term power capacity service, offered by the generation facilities to the electricity system.
Closed - Cycle Pumped Storage Generation. Production of electricity carried out by the hydroelectric power stations whose higher elevation reservoir does not receive any type of natural contributions of water, but uses water solely from the lower elevation reservoir.
Closing of Energy in the Market. Balance arising from the difference between the measured losses in transmission and distribution and the losses acquired by consumers on the peninsula who contract the energy with a trader/agent or directly on the market.
Cogeneration. The process through which electricity and useful ther-mal and/or mechanical energy is obtained simultaneously.
Combined Cycle. Technology for the generation of electricity in which two thermodynamic cycles coexist within one system: one involves the use of steam, and the other one involves the use of gas. In a power station, the gas cycle generates electrical energy by means of a gas turbine and the steam cycle involves the use of one or more steam turbines. The heat generated by combustion in the gas turbine is pas-sed to a conventional boiler or to a heat-recovery element to produce steam which is then used to move one or more steam turbines, incre-asing the yield of the process. Electricity generators are coupled to both the gas and steam turbines.
Commercial Exchange Capacity. Technical maximum import and ex-port capacity of the Spanish electricity system with that of a neigh-bouring country’s system and that is both compatible and which com-plies with the security criteria established for each system.
Congestion RentsRevenues derived from the management of the interconnection capa-city between electricity systems.
Congestion. A situation in which the link which interconnects two neighbouring electricity systems is not able to accept all the resulting physical flows of the international due to an insufficient interconnec-tion capacity of the interconnection elements and/or of the national transmission grids involved.
Consumers. Natural or legal persons who buy energy for their own use. Those consumers who acquire energy directly from the production mar-ket are known as Direct Market Consumers.
Control Deviations. Deviations which occur between two electricity sys-tems and are measured as the difference between the scheduled inter-national exchanges and the international physical energy exchanges.

109
THE SPANISH ELECTRICITY SYSTEM Glossary of terms
Counter-Trading. Schedule for exchanging energy between two elec-tricity systems. It is established in real time and is carried out in a coordinated way between both system operators. This is super-impo-sed on the pre-existing final exchange schedules, whilst maintaining these, in order to solve a congestion situation identified in real time in the interconnection.
Cross Border Balancing Services. Hourly scheduled energy balan-cing between two interconnected electricity systems through the coordinated action of the operators of the electricity systems, using vacant capacity after the intraday exchange markets.
Daily Base Operating Schedule (PDBF). Is the daily energy schedule, broken-down in scheduled periods for the different energy generation selling and purchasing agents/units within the Spanish peninsular electricity system. This schedule is established by the System Ope-rator based on the schedule resulting from matching the day-ahead market and the data regarding the execution of bilateral contracts with physical dispatch of energy.
Day-ahead Market. This is the market in which the purchasing and sales transactions of electricty for the following day are carried out.
Demand (Measured at Power Station Busbars). Energy injected in to the transmission grid from the power stations and imports, after de-ducting the consumption of pumps and exports. In order to transport this energy to the consumption points it would be necessary to sub-tract the losses originated in the transmission and distribution grid.
Demand in Reference Supply Market. Electricity demand of the con-sumers on the Spanish peninsula (measured at power station bus-bars after subtracting standard losses) who contract energy from a last resort trader/reseller.
Deviation Management. The mechanism of deviation management is an optional service managed and remunerated by market mecha-nisms. The objective is to resolve the deviations between generation and demand superior to 300 MWh which could appear in the period between the end of one intraday market and the beginning of the next intraday market horizon.
Distribution Network Technical Constraints. Are those technical cons-traints, corresponding to requests sent by the distribution network ma-nagers to the System Operator, to guarantee the security of the distri-bution network under its management.
Distributors. Those mercantile companies (or co-operative societies of consumers and users) have the function of distributing electricity, as well as to construct, maintain and operate the distribution facilities re-quired to transfer and distribute the energy to the consumption points.

THE SPANISH ELECTRICITY SYSTEM 2015
110
www.ree.es
Generation Market. This is comprised of the set of commercial purcha-se transactions and the sale of energy and other services related to the supply of electricity. It is structured on credit markets, day-ahead mar-ket, intraday market, non-organised markets and system adjustment services, understanding as such the resolution of technical restrictions of the system, ancillary services and deviation management.
Hydroelectric Reserves. The hydroelectric reserve of a reservoir is the quantity of electricity that could be produced in its own power station and in all the power stations situated downstream, with the total drai-nage of its current useable water reserves and providing that drainage occurs without natural contributions. The annual regime reservoirs are those in which complete drainage would take place in less than one year. Hyper-annual regime reservoirs are those in which the total drai-nage time takes more than one year.
Hydro Management Unit (HMU). Each set of hydropower stations be-longing to the same hydroelectric basin and the same individual agent.
Instantaneous Power. Instantaneous power is the energy absorbed by the demand at any given moment of time.
International Physical Exchange. The movements of energy which have taken place across lines of international interconnection during a certain period of time. It includes the loop flow of energy as a conse-quence of the grid design.
International Scheduled Exchanges. These are the schedules that are established between two electricity systems as a consequence of a set of scheduled individual transactions in the market by Market Par-ticipants, or by means of bilateral contracts.
Interruptibility. This is a demand-side management tool used to pro-vide rapid and efficient response to the needs of the electricity system according to technical criteria (system security) and economic (least cost for the system), that consist on the reduction of the demanded active power in response to an order issued by Red Eléctrica as Sys-tem Operator. According to the regulation on the competitive alloca-tion mechanism for the demand-side interruptibility service (Order IET/2013/2013 and subsequent amendments) the interruptible resou-rce is allocated through an auction procedure; it is the System Operator who is responsible for organizing and managing said auction system.
Intraday Market. The objective is to manage the adjustments occu-rring in the generation and demand of energy which may be produced after having fixed the day-ahead market.
Market Coupling. Mechanism for managing the exchange capacity which allows the prices and net positions of the coupled day-ahead markets to be obtained simultaneously and allowing the resulting

111
THE SPANISH ELECTRICITY SYSTEM Glossary of terms
energy flows to be determined implicitly while respecting the available exchange capacity.
Market Operator. A mercantile company which assumes the manage-ment of the bid system for the purchase and sale of electricity in the day-ahead and intraday market under the established regulations.
Measured Deviations. Difference between the energy measured at the power station busbars and the energy scheduled in the market.
Measured Downward Deviations. Measured downward deviations are those which result when the production measured at the power sta-tion busbars is less than that scheduled in the market, or when the consumption measured at the busbars is higher than that schedu-led in the market. Therefore, the system must manage that difference by increasing production or reducing pumped storage consumption through the adjustment markets in real-time.
Measured Upward Deviations. Measured upward deviations are those which result when the production measured at the power station bus-bars is greater than that scheduled in the market, or when the con-sumption measured at the busbars is lower than that scheduled in the market: Therefore, the system must manage that difference by redu-cing production or increasing pumped storage consumption through the adjustment markets in real-time.
National Demand in the Free Market. Electricity demand of the con-sumers on the Spanish peninsula (measured at power station bus-bars) who directly contract energy from a trader or in the market.
Non-renewable Energies. Includes nuclear, fuel/gas, combined cycle, cogeneration and waste.
Power Factor Control. Article 7, paragraph e), of Royal Decree 413/ 2014, of June 6, by which the electricity production activity from re-newable energy sources, cogeneration and waste is regulated, esta-blishes measures to control the power factor applicable for facilities within the scope of this Royal Decree.
Producible Hydroelectric Index. This is the quotient between the pro-ducible energy and the average producible energy, both related to the same period and to the same hydroelectric equipment.
Producible Hydroelectric. Maximum quantity of electricity that theo-retically could be produced considering the water supplies registe-red during a specific period of time, and once the supplies used for irrigation or uses other than the generation of electricity have been subtracted.
Programming Unit. Minimum element with capacity to bid in a market.

THE SPANISH ELECTRICITY SYSTEM 2015
112
www.ree.es
Pumped Storage Consumption. Electrical energy used by pumped storage hydroelectric power stations for elevating water from the lower to the upper reservoir for the generation of electricity.
Red Eléctrica Index (IRE). A preliminary electricity indicator that shows the evolution of electricity consumption of companies that have medium/high power consumption (with a contracted power ca-pacity greater than 450 kW). This index is published both at a general level and at a detailed level by sector of activity (CNAE) and is available around 22 days after the end of the month.
Reference Supply. Electricity supply scheme established for low-voltage consumers connected to the system, and whose contracted power is not greater than 10 kW.
Renewable Energies. Includes hydro, hydro-wind, wind, solar photo-voltaic, solar thermal, biogas, biomass, marine-hydro and geothermal.
Resolution of Real-Time Technical Constraints. The process carried out by the System Operator consisting of the resolution of the techni-cal constraints identified during real-time operation of the system by means of the limitation, or if deemed necessary, the modification of the schedules of the Programming Units.
Resolution of Security of Supply Technical Constraints. Process ma-naged by the System Operator that aims to introduce into the base daily operating schedule, modifications of schedules that may be ne-cessary to guarantee supply of the Spanish electricity system, sub-sequently proceeding to make the corresponding generation-demand rebalancing.
Secondary Capacity Market. A mechanism which allows the transfer and resale, on behalf of a participant, of acquired physical capacity rights in the annual and monthly auctions, or by means of transfers.
Secondary Control Band and Secondary Control. Secondary control is an optional ancillary service with the objective of maintaining the generation-demand balance, correcting deviations with respect to the anticipated power exchange schedules, and frequency deviations. Its temporary action horizon ranges from 20 seconds to 15 minutes. This service is remunerated by means of market mechanisms via two con-cepts: availability (control band) and usage (energy).
Solar Photovoltaic. Sunlight converted into electricity through the use of solar cells, generally made of semiconductor material that, when exposed to sunlight, generates electricity.
Solar Thermal. Heat produced by solar radiation that can be taken ad-vantage of for the production of mechanical energy and, subsequently, electricity.

113
THE SPANISH ELECTRICITY SYSTEM Glossary of terms
Support Exchanges. Schedules which are established between two electricity systems to guarantee the conditions for the security of supply of either of the two interconnected systems. This is done in case of emergency to solve a specific risk situation in the operation of one of the systems and with the previous agreement between the respective operators and in the absence of alternative means of reso-lution in the system requiring support.
Surplus/Deficit of Deviations. Difference between the amount of the settlements of the deviations and the energy used to maintain the generation-demand balance.
System Adjustment Services. Services managed by the System Ope-rator that are required to ensure the electricity supply under the ne-cessary conditions of quality, reliability and security. The adjustment services can be of an obligatory or optional character. Solving of cons-traints due to guarantee of supply, solving technical constraints of the system, ancillary services (additional upward power reserve, primary control, secondary control, tertiary control and voltage control of the transmission grid) and deviation management are all considered ad-justment services.
System Operator. A mercantile company whose main function is to guarantee the continuity and security of the electricity supply, as well as the correct coordination of the generation and transmission sys-tem. It carries out its functions in coordination with the operators and particpants of the Iberian Electricity Market under the principles of transparency, objectivity, independence and economic efficiency. The system operator shall be the manager of the transmission grid.
Technical Constraints PDBF Solution. A mechanism managed by the System Operator for the resolution of the technical constraints identified in the Daily Base Operating Schedule by means of the limi-tation, or if deemed necessary, the modification of the schedules of the Programming Units and the subsequent process of re-balancing generation-demand.
Tertiary Control. An optional ancillary service that, if subscribed to, is accompanied by the obligation to bid (for active units) and is managed and compensated by market mechanisms. Its objective is to resolve the deviations between generation and consumption and the restitution of the secondary control reserve used. This is done by means of the adap-tation of the operating schedules of the programming units correspon-ding to generation stations and pumped storage consumption facilities. The tertiary reserve is defined as the maximum variation of power ge-neration that a generation unit can carry out within a maximum of 15 minutes, and which can be maintained for at least 2 hours.
Thermal Line Rating. The maximum energy which can be transported by an electricity line without breaking the established safety distances.

THE SPANISH ELECTRICITY SYSTEM 2015
114
www.ree.es
This value depends on the characteristics of the line and on the envi-ronmental characteristics (temperature, wind and solar heating).
Traders/Retailers. Those mercantile companies or co-operative so-cieties of consumers and users that, accessing the transmission grid or distribution network, acquire energy to sell to consumers, to other system participants or to carry out international exchange transac-tions under the terms established in Law 24/2013, of 26 December.
Transmission Grid. The complete set of lines, facilities, transformers and other electrical elements with voltages greater than or equal to 220 kV, and those other facilities, regardless of their power, which fulfil transmission functions, international interconnections and the interconnections with the Spanish insular and non-peninsular elec-tricity systems.
Transmission Grid Availability Rate. Indicates the percentage of total time in which each element of the transmission grid has been available for service. It is calculated from the nominal power of each installation once the downtime due to preventive and corrective maintenance, unforeseen unavailability, or other causes (such as the construction of new facilities, renovations and improvements) have been subtracted.
Transmission Grid Technical Constraints. Are those technical cons-traints identified within the global system (generation-transmission grid), that require a modification to the schedules in order to comply with the operation and security criteria for operating the system.
Unavailability of the production units. A production unit is completely available if it can participate in production without any limitation in ge-neration capacity or, when applicable, pumped storage consumption. Otherwise, it is considered unavailable, such unavailability being of a partial or total nature.
Voltage control. This is an ancillary system service whose aim is to guarantee the suitable voltage control in the nodes of the transmis-sion grid, so that the operation of the system meets the establis-hed security and reliability requirements, to ensure that the energy supplied to the final consumers is in compliance with the required quality and that the generators can work in the established conditions for its normal operation.
115
THE SPANISH ELECTRICITY SYSTEM Glossary of terms

Information prepared with data as at 9 May 2016
Published byRED ELÉCTRICA DE ESPAÑAP.º del Conde de los Gaitanes, 17728109 Alcobendas – (Madrid), SpainTel. +34 91 650 85 00Fax. +34 91 640 45 42www.ree.es
Coordination of publicationCommunication and Corporate Image Department of RED ELÉCTRICA
Technical managementStatistics and Information Department of RED ELÉCTRICA
Graphic design and layoutdis_ñ[email protected]
Other data regarding this publicationPublished: June 2016Printing: EPES Industrias Gráficas, S.L.Legal Deposit No.: M-24138-2016
English translation byWayman English Internationalwww.waymanenglish.comThis English version is a translation of the original and authentic Spanish text found in the ‘EL SISTEMA ELÉCTRICO ESPAÑOL 2015’ report, originally issued in Spanish. In the event of discrepancy, the Spanish-language version shall prevail.
Red Eléctrica works on selecting the most legible typographical font for their publications. The typographical font Geogrotesque and Klavika has been used for the texts and graphics in this report.
a
