the spanish variant of the dutch disease · the spanish variant of the dutch disease ... antras and...
TRANSCRIPT
Princeton NJ, 19/04/2012
The Spanish Variant of
the Dutch Disease
Luis Garicano
London School of Economics

Figures without attribution taken from:
“Nada Es Gratis” (Destino 2011) by
Samuel Bentolila (CEMFI)
Antonio Cabrales (UC3M)
Jesus Fernandez Villaverde (Penn)
Luis Garicano (LSE)
Juan Rubio (Duke)
Tano Santos (Columbia)
and from NadaEsGratis blog.

Dutch disease here: Asymmetric, one
resource intensive sector growth
Gas Bricks
basic story
Jorge Juan 21/10/2011
0.8
0.9
1.0
08 2009 02 07 06 05 04 03 01 2000 99 98 97 96 1995
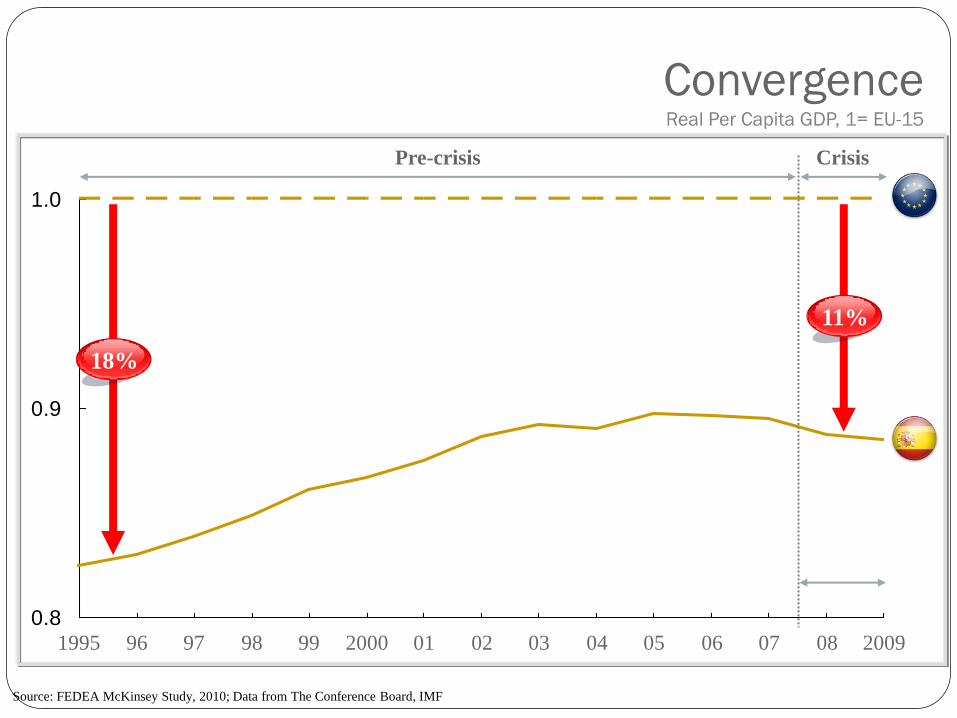
Convergence Real Per Capita GDP, 1= EU-15
Pre-crisis Crisis
18%
11%
Source: FEDEA McKinsey Study, 2010; Data from The Conference Board, IMF

Eurozone: Persistent Inflation
Divergence
80
100
120
140
160
80
100
120
140
160
Jan 96 Jan 00 Jan 04 Jan 08
12-Mo. Moving Average HCPI for Eurozone (1999=100)
Germany
Spain
Source: IMF, Stijn van Nieuwerburgh

-2
0
2
4
6
8
10
12
Jan-1980 Jan-1984 Jan-1988 Jan-1992 Jan-1996 Jan-2000 Jan-2004 Jan-2008
Real Interest Rate

Cheap financing, directed to what?
Demand
Spaniards traditionally have had their savings in real estate (second, third home “for the kids”) After wars, inflation and defaults, strong prior that bricks are the only safe assets
Supply
Large pool of unskilled unemployed workers
Institutional set up , with easy temp contracts, conducive to low skill segment Like Acemoglu’s directed technological change
Financing channel
Tiny margins (generally Euribor plus .25%) due to brutal competition from Cajas deregulated, growing out of their home territories
Only willing to make loans with collateral … RRE and CRE which can securitize in large, liquid, well functioning covered bond markets (like MBs but with recourse)
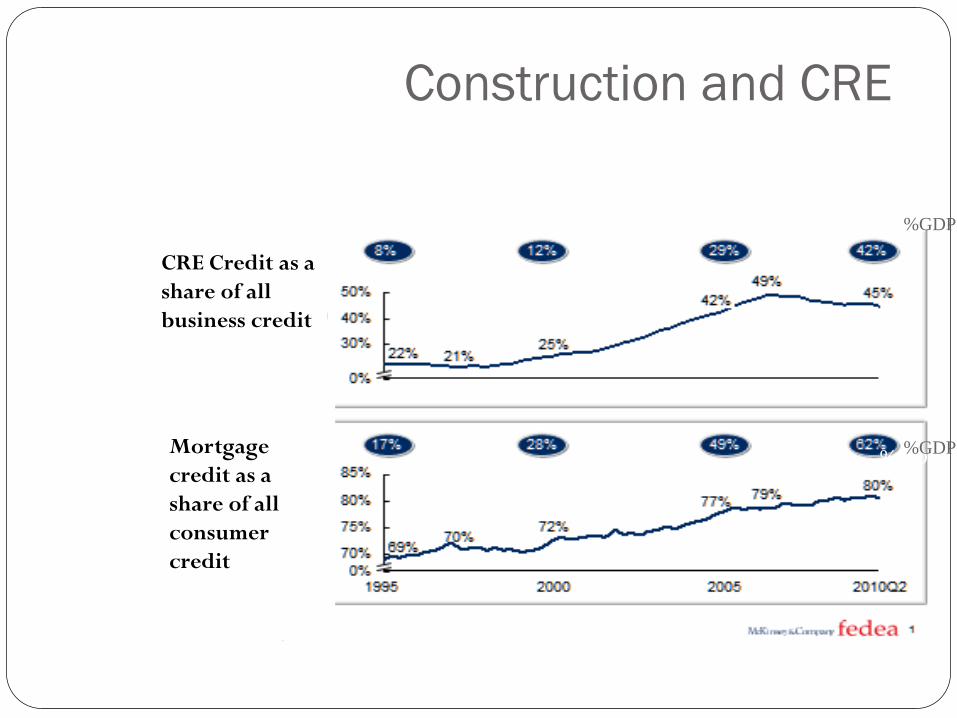
Construction and CRE
CRE Credit as a
share of all
business credit
Mortgage
credit as a
share of all
consumer
credit
%GDP
%GDP
%GDP
%GDP
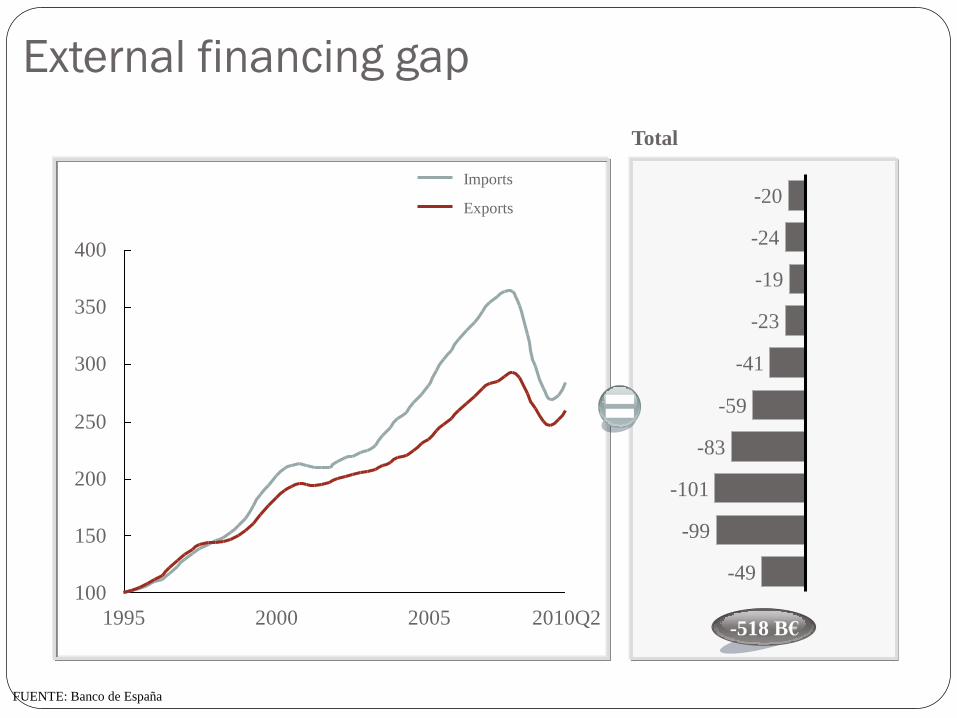
External financing gap
FUENTE: Banco de España
Total
-49
-99
-101
-83
-59
-41
-23
-19
-24
-20
-518 B€
400
350
300
250
200
150
100
2010Q2 2005 2000 1995
Exports
Imports

Private Debt
Jorge Juan 21/10/2011
0
50
100
150
200
250
300
350
400
450
Japan UK Spain France Italy USA Germany China India
Public Private
Private and Public debt as a percentage of GDP.
Source: McKinsey&Company, “Debt and Deleveraging: The Global Credit
Bubble and its Economic Consequences,” Enero 2010

Exports held up well
Source: Antras and Segura

Long term consequences
Princeton 19/04/2012
(1) Competitiveness, productivity, growth: reverting skill
biased tech change
(2) Deficit: tricky political economy
(3) Banks stuck with bad assets: Tano
1. Brick laying and bars bring little
TFP growth
and lowers incentives for
human capital investment
Princeton 19/4/2012
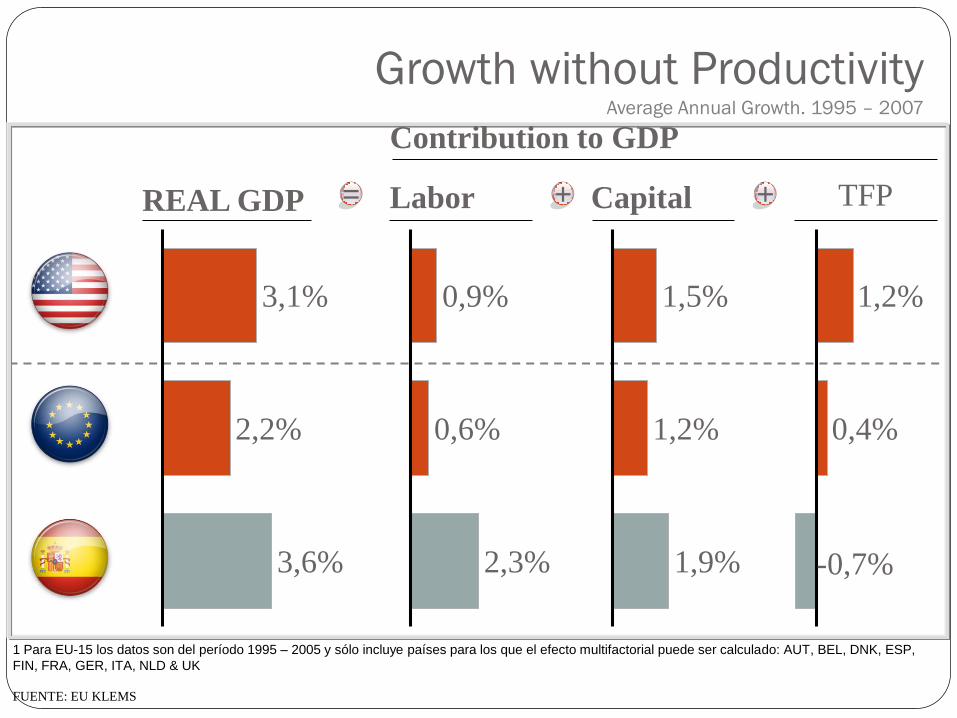
REAL GDP Labor Capital TFP
FUENTE: EU KLEMS
Contribution to GDP
3,6%
2,2%
3,1%
2,3%
0,6%
0,9%
1,9%
1,2%
1,5%
-0,7%
0,4%
1,2%
1 Para EU-15 los datos son del período 1995 – 2005 y sólo incluye países para los que el efecto multifactorial puede ser calculado: AUT, BEL, DNK, ESP,
FIN, FRA, GER, ITA, NLD & UK
= + +
Growth without Productivity Average Annual Growth. 1995 – 2007
Human Capital Investments
What is unusual of Spanish disease is distortion in human capital investment decisions
Bubble (sun and bricks) investments require very little human capital
Wage signals encourage dropping out of school
Huge share of Ni-Nis (no job, no education)
Great difficulty in solving employment dilemma.

Wage Premia
Princeton 19/4/2012 Source: NadaEsGratis: ¿Vale la pena estudiar? (VI) La inusual caída de la ganancia salarial resultante de la educación avanzada,
Garicano, Felguero, Jimenez, 9/12/2010
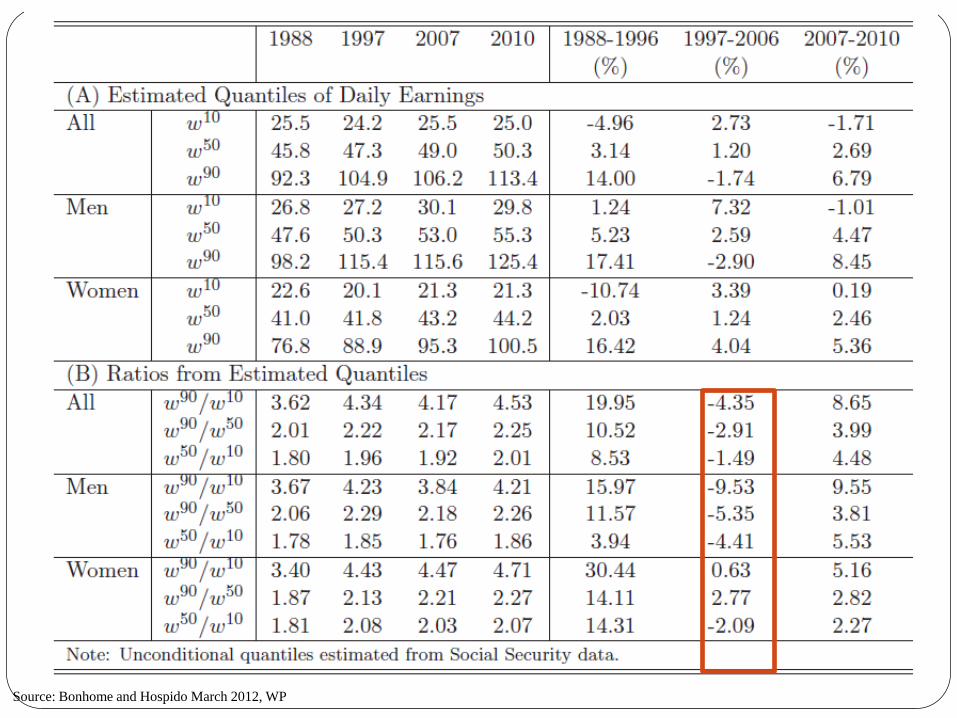
Ratios drop 97/2006
Princeton 19/4/2012
Source: Bonhome and Hospido March 2012, WP

Very unusual!!
Princeton 19/4/2012
Source: Bonhome and Hospido March 2012, WP

Large growth of labor prices and
quantities in construction
Source: Bonhome and Hospido March 2012, WP

Temporary Employment Rates
Princeton 19/4/2012 Source: NadaEsGratis: ¿Vale la pena estudiar? (VI) La inusual caída de la ganancia salarial resultante de la educación avanzada,
Garicano, Felguero, Jimenez, 9/12/2010
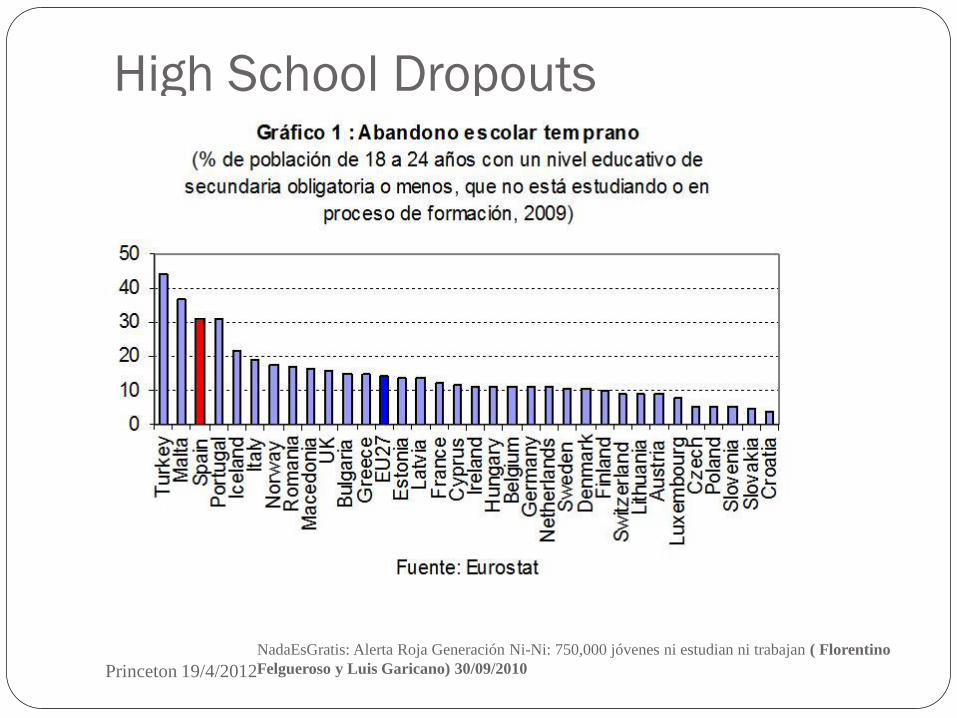
High School Dropouts
Princeton 19/4/2012
NadaEsGratis: Alerta Roja Generación Ni-Ni: 750,000 jóvenes ni estudian ni trabajan ( Florentino
Felgueroso y Luis Garicano) 30/09/2010
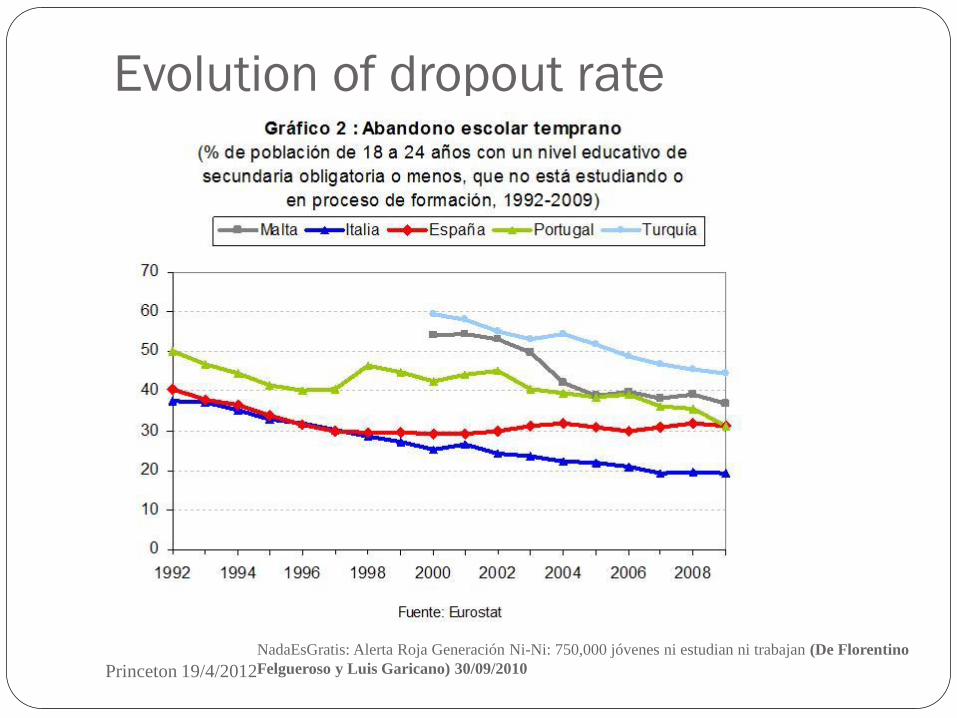
Evolution of dropout rate
Princeton 19/4/2012
NadaEsGratis: Alerta Roja Generación Ni-Ni: 750,000 jóvenes ni estudian ni trabajan (De Florentino
Felgueroso y Luis Garicano) 30/09/2010

2. Public deficit: hard to reverse collapse
in revenue

With little/ no public deficit
to start with
Eurostat
30.0
32.0
34.0
36.0
38.0
40.0
42.0
44.0
46.0
48.0
2001 2002 2003 2004 2005 2006 2007 2008 2009 2010
Expenditure
Revenue

Political Economy:
Pensions first!

1.0
2.0
3.0
4.0
5.0
2009 2014 2019 2024 2029 2034 2039 2044 2049
Tasa de dependencia
Dependency
Ratio

Regions account for large share of
expenditure

Total debt
Princeton 19/4/2012 Source: LA Caixa Research

Long Term Consequences (3):
Housing and land stock
Large unsold stock of housing
Large amount of real estate debt sitting in banks book: for Tano

Large housing inventory
(upper bound*)
NadaEsGratis: El mercado inmobiliario: ¿de dónde saca el ministerio evidencia de mejoría?
by LUIS GARICANO on 19/05/2011
(Thousands) 2004 2005 2006 2007 2008 2009 2010
Finished Housing
Units 564 592 659 647 632 424 276
Sales 295 336 410 412 333 241 200
Unsold 269 255 248 235 299 183 76
Inventory 269 524 772 1007 1306 1489 1565
*Unaccounted sales are promotions for own use or in cooperatives

Gigantic housing stock
US 12 months Spain: 100 months?
Lusi Garicano, NadaEsGratis: El mercado
inmobiliario: ¿de dónde saca el ministerio
evidencia de mejoría? (19/5/2011)
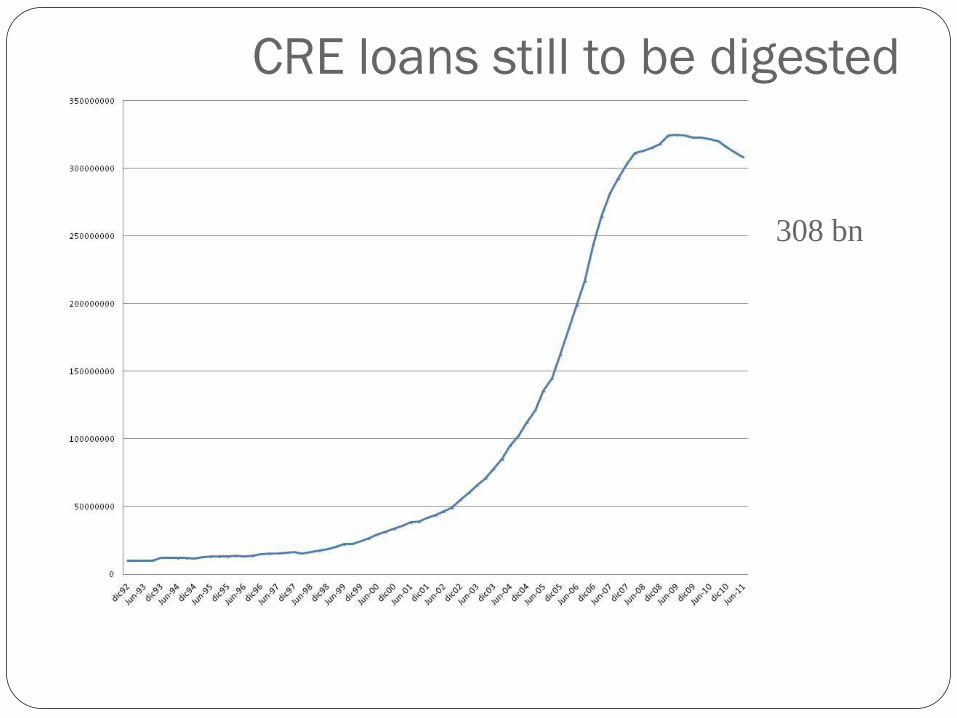
CRE loans still to be digested
308 bn

Conclusion
Princeton 19/04/2012
Spain needs inevitably help from the EU
A bad bank, worth 100bn euro
Some employment program . Maybe a new contract paid with
European union funds that has 0 termination costs but a firing
insurance (like th Austrian system) finance from Europe
(Jacques Delpla’s proposal)
This is peanuts compared to what is needed if things
continue to spin out of control.