the spatial statistics of structural magnetic …adni.loni.usc.edu/adni-publications/the...
TRANSCRIPT

Full Terms & Conditions of access and use can be found athttp://www.tandfonline.com/action/journalInformation?journalCode=yims20
The Imaging Science Journal
ISSN: 1368-2199 (Print) 1743-131X (Online) Journal homepage: http://www.tandfonline.com/loi/yims20
The spatial statistics of structural magneticresonance images: application to post-acquisitionquality assessment of brain MRI images
M. E. Osadebey, Marius Pedersen, Douglas Arnold, Katrina Wendel-Mitoraj &The Alzheimer's Disease Neuroimaging Initiative
To cite this article: M. E. Osadebey, Marius Pedersen, Douglas Arnold, Katrina Wendel-Mitoraj &The Alzheimer's Disease Neuroimaging Initiative (2017) The spatial statistics of structural magneticresonance images: application to post-acquisition quality assessment of brain MRI images, TheImaging Science Journal, 65:8, 468-483, DOI: 10.1080/13682199.2017.1369641
To link to this article: https://doi.org/10.1080/13682199.2017.1369641
Published online: 07 Sep 2017.
Submit your article to this journal
Article views: 74
View Crossmark data

The spatial statistics of structural magnetic resonance images: application topost-acquisition quality assessment of brain MRI imagesM. E. Osadebeya, Marius Pedersenb, Douglas Arnold c,d, Katrina Wendel-Mitoraje and The Alzheimer’sDisease Neuroimaging InitiativeaMRI Reader Group, NeuroRx Research Inc., Montreal, Canada; bDepartment of Computer Science, Norwegian University of Science andTechnology, Gjovik, Norway; cNeuroRx Research Inc., Montreal, Quebec, Canada; dMontreal Neurological Institute, McGill University,Montreal, Canada; eBrainCare Oy, Tampere, Finland
ABSTRACTThis report describes a new quality evaluation method for structural magnetic resonanceimages (MRI) of the brain. Pixels in MRI images are regarded as regionalized randomvariables that exhibit distinct and organized geographic patterns. We extract geo-spatial localentropy features and build three separate Gaussian distributed quality models upon themusing 250 brain MRI images of different subjects. The MRI images were provided byAlzheimer’s disease neuroimaging initiative (ADNI). Image quality of a test image is predictedin a three-step process. In the first step, three separate geo-spatial feature vectors areextracted. The second step standardizes each quality model using corresponding geo-spatialfeature vector extracted from the test image. The third step computes image quality bytransforming the standardized score to probability. The proposed method was evaluated onimages without perceived distortion and images degraded by different levels of motion blurand Rician noise as well as images with different configurations of bias fields. Based on theperformance evaluation, our proposed method will be suitable for use in the field of clinicalresearch where quality evaluation is required for the brain MRI images acquired fromdifferent MRI scanners and different clinical trial sites before they are fed into automatedimage processing and image analysis systems.
ARTICLE HISTORYReceived 20 June 2016Accepted 14 August 2017
KEYWORDSMagnetic resonance imaging;image quality; whole brainangular segment pixeldensity; transverse segmentpixel density; whole brainpixel density and Gaussiandistribution
1. Introduction
Evaluation of image quality is a preliminary post-acqui-sition step. The quality of image acquisition devices,the necessary post-acquisition processing procedures,performance evaluation of image processing andimage analysis algorithms and the level of utility ofan image are determined by the outcome of imagequality evaluation. Strategic imaging work-flowdecisions, such as choice of imaging device, algorithmsfor image processing and image analysis, re-scan, re-processing and re-analysis, are influenced by imagequality evaluation. The extent to which a trainedreader or an automated image analysis system canoptimally extract the information contained in animage is determined by the image quality. Thusimage quality assessment is a very important step inthe process of utilization of an image.
The first step in the evaluation of image quality isthe identification of manageable image quality attri-butes [1, 2]. These attributes expressed as quality fea-tures are then measured using different quality scoresto obtain a total quality score referred to as an imagequality index [3]. The goal of objective image qualityevaluation is to derive an image quality metric whichcorrelates with the evaluation by the human visual
system in terms of ‘fidelity’, ‘usefulness’ and ‘natural-ness’ [4]. Image quality can be evaluated by humansin what is referred to as a subjective method [5] or bya measuring device in what is referred to as an objec-tive method [2]. This paper focuses on how to quantifythe diagnostic information contained in structuralmagnetic resonance images of the brain without anyreference to an original image and such that the evalu-ation correlates with the human visual system.
Advances in image acquisition technology encour-aged increasing interest in the use of magnetic reson-ance imaging (MRI) system images for the study ofhuman anatomy [6, 7] diagnosis of diseases [8, 9] andthe clinical trials of drugs for the treatment of neuro-logical diseases [10–12]. The attractive feature of anMRI system is its potential to produce high-contrastimages of soft anatomical structures. This potential isan ideal expectation because of the imperfections ofthe system components, trade-offs in system operatingparameters, patient-induced artefact and operatorerror. The perceived visual quality of an MRI image ofthe brain is influenced by features that manifest inthe image. The features include noise at differentlevels, intensity non-uniformity, acquisition artefacts,blurring, geometric distortion, lesion load and
© 2017 The Royal Photographic Society
CONTACT M. E. Osadebey [email protected] MRI Reader Group, NeuroRx Research Inc, 3575 Parc Avenue, Suite # 5322, Montreal, Canada.
THE IMAGING SCIENCE JOURNAL, 2017VOL. 65, NO. 8, 468–483https://doi.org/10.1080/13682199.2017.1369641

extraneous artefacts introduced by image processingand image analysis algorithms [13]. These featuresinfluence each other as well as the classical terms ofperception such as sharpness, contrast and saturation,and thus makes image quality evaluation a nontrivialtask [2].
1.1. Literature review
Several objective image quality measures have beenproposed in the literature. They can be categorizedinto reference or reduced reference methods [13–19]and no-reference methods [20–25]. A detailed reviewof image quality evaluation for a general class ofimages and MRI images can be found in [26–33].Despite the several contributions on image quality,the popular quality assessment metrics for medicalimages are the age-old techniques: root-mean-squareerror (RMSE), signal-to-noise ratio (SNR) and structuralsimilarity index (SSIM) [14]. These metrics weredesigned to solve research problems that were notrelated to image interpretation but on efficient com-pression, storage and transmission of images. Weidentified six drawbacks in current automated imagequality assessment methods. They are explained asfollows:
(1) Generalization of Medical Images. The popularquality evaluation metrics assume that all classesof medical images and all other natural imageshave the same descriptive features. Medicalimages exhibit characteristics such as texture,grey-scale colour, noise and homogeneity that dis-tinguish them from each other and other classes ofnatural images.
(2) Globalization. Different structures of the brainrespond differently to the same level of distortion.Quality assessments in [14, 15, 22–24] take intoaccount the entire image and do not allow focustowards region-of-interest. In some clinical appli-cations, such as the study of disease progressionin multiple sclerosis, the focus is detection oflesions in the white matter region. The focuschanges to the cortical grey matter region in corti-cal grey matter atrophy measurement and to theventricle in ventricular atrophy measurement.With global quality measures, there is the risk ofnon-optimal quality measure in a region which isthe focus of the physician or a trained reader.
(3) Distortion-Specific Bias.Many current quality assess-ment methods, such as [20, 22], adopt specific typeof distortion, considered as common, to evaluatethe image under consideration. This approachcan be said to be biased towards specific distortion,because all possible distortions combine with idealfeatures to manifest as image attribute [21].
(4) Fidelity Bias. Image quality as viewed by the humanvisual system can be represented in three dimen-sions: fidelity, usefulness and naturalness.Researchers have argued that the use of referenceimages such as in [14] for quality evaluation is ameasure of fidelity and does not account for theother two attributes of image quality.
(5) Limitations of Classical Statistics. All the currentquality assessment metrics adopt the principles ofclassical statistics to describe quality attributes.Classical statistics does not account for the distinctgeographic patterns of the constituent anatomicstructures in medical images. The absence ofspatial dependence in the description of theseattributes excludes the naturalness of the imagein the evaluation of image quality. The inability ofpopular image quality measures to perceptuallydistinguish different images was reported in [16].The authors demonstrated that two images withthe same RMSE can be perceptually dissimilar.They proposed a technique called null space analy-sis for quality evaluation.
1.2. Importance of automated Objective qualitymeasures
There are many real-world applications where there islittle room to operate the human visual systemmethod for the evaluation of image quality. A typicalscenario is in clinical research organizations. Severalthousands of brain MRI images are delivered dailyfrom clinical trial sites around the globe to clinicalresearch organizations that manage clinical trials ofnew drugs for pharmaceutical organizations. Variationsin the quality of images acquired with different scan-ners from the different clinical trial sites need to bequantified to ensure conformity with the protocolsset out by sponsoring pharmaceutical organizations.The method of transmission from the clinical trialsites and the image analysis systems within the clinicalresearch organizations can introduce some amount ofdistortion or artefact into the images [13, 19]. Efficientmanagement of this large amount of data demandshigh level of automation in the methods of qualityassessment of the MRI images. There is little tolerancefor subjective quality measures, because they aremanual, time-consuming and lack repeatability. No-reference, objective and automatic quality measuresare preferred, because they can be computed in realtime and are repeatable. Objective quality measuresencourage efficient data management by the classifi-cation of images for assignment of real-time auto-mated processing, manual processing, furtherprocessing to improve image quality and the assess-ment of overall performance of image analysissystems [34].
THE IMAGING SCIENCE JOURNAL 469

1.3. Introduction to spatial statistics
Spatial statistics [35] is a branch of classical statistics. Itis a relatively new area in statistics. It became an activeresearch area because of the limitations of classicalstatistics to solve some real-world problems. Thereare three major techniques in spatial statistics. Theyare geostatistics, spatial point patterns and latticedata. For the purpose of this research, our interest isin the area of geostatistics. The Geostatistical techniquefocuses on fixed spatial region such as a geographicalregion for the modelling of continuous variables, dataprediction from the relationship between variablesand evaluation of spatial structures. It can distinguishthe visual perception of images by incorporating infor-mation about their spatial dependences. Data frombrain images acquired by MRI system have character-istics suitable for spatial analysis. Three-dimensionaldisplay of brain MRI image reveals clearly definedpattern in the spatial location and the spatial arrange-ment of the anatomical structures of the brain. Thedata are continuous variables describing different ana-tomic structures within a fixed spatial region. Thenomenclature adopted for the acquisition planes andsome of the constituent anatomic structures: axial,sagittal, coronal, left hemisphere, right hemisphereand mid-sagittal plane are borrowed from the field ofgeography to describe spatial locations within thebrain. The spatial arrangement is the most importantattribute of MRI image that is easily perceived by anobserver. Every trained reader has the knowledgethat the brain is approximately symmetrical withrespect to the mid-sagittal plane, the lateral ventricleis approximately centred on the mid-sagittal planeand farther from the brain surface than the corticalgrey matter [36, 37]. After a careful review of the litera-ture, we can say that, to the best of our knowledge,there is yet no proposed method on the applicationof the principles of spatial statistics to the evaluationof image quality.
1.4. Proposed quality metric
We propose a new fully automated, no-reference,objective method to evaluate the quality of MRIsystem images. It is based on encoding differentimage quality attributes with local entropy. Entropy isa direct measure of the classical image quality attri-butes such as luminous brightness, contrast, sharpness,noise and texture [38]. Our proposed method alsoexploits the similarity in the geometry of humananatomy across age, gender and race [39–41]. Thehuman brain is regarded to be located in a fixedspatial region that exhibits distinct and organized pat-terns. Three geographic regions are defined to extractspatial information from the whole brain, axial slices
and specific angular segments within slices in an MRIvolume data. Three spatial quality models were builtfrom brain MRI images of 250 subjects sourced fromAlzheimer’s disease neuroimaging initiative (ADNI)database.
1.5. Outline
This paper is organized as follows. The next sectiondescribes our methods forthe evaluation of imagequality. Performance evaluation of our proposedmethod is in Section 3. Experimental results are dis-cussed in Section 4. Section 5 concludes this report.
2. Methods
2.1. Data and sources of data
The proposed method utilized data from three differ-ent sources. They are T1-weighted MRI imagesacquired using three-dimensional magnetization-pre-pared rapid gradient echo (MPRAGE) images from theADNI database. The MPRAGE images constitute themodel database. The performance evaluation of ourproposed method was carried out using original MRIdata from NeuroRx research Inc and BrainCare Oy.
The ADNI (http://adni.loni.usc.edu/) was launched in2003 as a public–private partnership, led by the Princi-pal Investigator Michael W. Weiner, MD. The primarygoal of ADNI has been to test whether serial magneticresonance imaging (MRI), positron emission tomogra-phy (PET), other biological markers, and clinical andneuropsychological assessment can be combined tomeasure the progression of mild cognitive impairment(MCI) and early Alzheimer’s disease (AD). NeuroRx inc.(https://www.neurorx.com) is a clinical research organ-ization dedicated to working with the pharmaceuticalindustry to facilitate clinical trials of new drugs for mul-tiple sclerosis (MS) and other neurological diseases.BrainCare Oy (http://braincare.fi/) is a Tampere Univer-sity of Technology spin-off company founded in 2013to deliver personalized solutions to improve thequality of life of epilepsy patients. The organizationrecently concluded clinical trials for a novel mobileapplication and supporting solutions for long-termmonitoring for epileptic patient.
Two hundred and fifty high-quality, high-resolution,3D, T1-weighted MPRAGE MRI images were our choicefor the model database, because images acquiredusing MPRAGE pulse sequence exhibit superior grey-white matter contrast compared to the conventionalT1 and other structural brain MRI images [42–44].Each slice has a thickness of 1.2 mm and a dimensionof 190× 160. Details of ADNI acquisition protocoland the initial processing steps are available in [45].During data sourcing at ADNI website, we seek MRI
470 M. E. OSADEBEY ET AL.

data of patients with healthy and normal brains thatwere without lesions or with very mild lesions. Foreach MRI data, slices towards the most inferior andmost superior sections are discarded, because theyhighlight more of scalp and bone structures thanbrain structures. There are variations in the numberof useful slices for different patients. For each patientdata, the index of useful slices were coded in aspecial function which can be called up by the algor-ithm during the modelling experiment.
There are one original T1-weighted, one T2-weighted and one Fluid Attenuated Inverse Recovery(FLAIR) images from NeuroRx research Inc. All thedata from NeuroRx has same slice thickness of 2.4mm, dimension 256× 256 and consist of 60 slices.The images were without perceived distortion exceptthe T1-weighted images which were originallyacquired with intensity inhomogeneity. The data fromBrainCare Oy are one original T2-weighted data withhigh lesion load and dimension 240× 200 andanother original T2-weighted image with dimension480× 360. They have the same slice thickness of7.5mm and consists of 25 slices. Both data from Brain-Care are without perceived distortion.
2.2. Geo-spatial model of MRI volume data
The slices that constitute an MRI volume data areassumed to be enclosed in a hypothetical
geographic region (s) as described by a 3D cylindricalcoordinate system of unit radius and height T shownin Figure 1:
s = {r, u, t | 0 ≤ r ≤ 1,−p ≤ u ≤ p, 1 ≤ t ≤ T}[ R3 (1)
where r and θ are the radial and angular distances ofpixel locations in the foreground of each slice, respect-ively. The geographic region is regionalized as shownin Figure 2 by patching each slice into Q=4 equalangular segments
uq = −p+ (q− 1)2pQ
( )< u < p+ (q− Q) 2p
Q
( )( ){ },
(2)
where q = {1, 2, . . . ,Q}.
2.3. Modeling experiment
There are seven steps in the modelling experiment. Theoutcome of the modelling experiment shows threeseparate Gaussian distributed quality models. Graphi-cal description of the modelling experiment can beexplained using the flow chart in Figure 3.
2.3.1. Foreground extractionForeground function FR extracts foreground image FIfrom each slice image TIM in each of the 250 MRIvolume data.
2.3.2. Local entropy filteringLocal entropy feature image LEI is extracted from eachslice using local entropy filter ENF of size 3× 3.
Figure 1. Each MRI slice in an MRI volume is transformed fromthe original cartesian coordinate system to cylindrical coordi-nate system of unit radius r=1 and height T.
Figure 2. The red lines demarcate an MRI slice into four equalangular segments.
THE IMAGING SCIENCE JOURNAL 471

2.3.3. Binary transformationThe mean of the local entropy feature image is deter-mined and used as a global threshold which transformsBT the local entropy feature image to a binaryimage BEI
2.3.4. Local entropy classificationBinary classification BC extracts the high entropyfeature image HIGH which represents the structuralinformation in the slice. The pixel density in the highentropy region is determined from the ratio of thenumber of pixels in the high entropy region to thenumber of pixels in the foreground.
2.3.5. Coordinate transformationPixel locations in the high entropy feature image aretransformed CT from the classical cartesian coordinate
system to cylindrical coordinate system. The pixellocations are further segmented into four equalangular segments as shown in Figure 2. Angular pixeldensity is the ratio of the number of high entropypixels in each angular segment to the total numberof foreground pixels.
2.3.6. Feature extractionThree feature vectors FV are extracted from all theslices in each MRI volume data. They are whole brainangular segment pixel density X1, transversesegment pixel density X2 and whole brain pixeldensity X3.
(1) Whole Brain Angular Segment Pixel Density X1. Thisfeature vector is derived from each angularsegment in a slice. Specific angular pixel densitycorresponding to all the slices is summed and aver-aged to obtain a 1× 4 feature vector for each MRIvolume data.
(2) Transverse Segment Pixel Density X2. Variations inbrain size across subjects within a populationsuch as the ADNI database is the result of variationin the number of useful slices in each MRI volumedata. Transverse segment pixel density is invariantto these variations. Invariance property is attainedby arranging successive axial slices into four setswhere each set contains, as much as possible,equal number of slices. Pixel density derived fromthe high entropy region in each group issummed and averaged to obtain a 1× 4 transversesegment pixel density for an MRI volume data.
(3) Whole Brain Pixel Density X3. It is derived from thepixel density of the high entropy feature imagefor each slice. The pixel density for the highentropy region in all the slices in a volume dataare summed and averaged to obtain the wholebrain pixel density for a volume data.
2.3.7. Quality modelsEach feature vector extracted from an MRI volumedata are defined within a finite interval, {0 ≤ x ≤ 1}.Furthermore, each feature vector can be regarded asa random variable drawn from each of the 250 MRIvolume data in the model database. Their mean andvariance are finite. According to the central limittheorem, the distribution will tend to a Gaussian[46–48]. Figure 4 shows five histogram distributionsof the whole brain pixel density feature vector fittedwith normal data. Each distribution was derivedfrom 50, 100, 150, 200 and 250 MRI volume data.We choose to transform histogram distribution ofeach feature vector based on 250 MRI volume datainto quality model, because it potentially captures,as much as possible, the structural information
Figure 3. Flow chart of the modelling experiment. ForegroundFI of a model image TIM in the database is extracted FR. Anentropy filter ENF filters each image in the database. Thelocal entropy image LEI is thresholded and transformed BTinto a binary image BEI. The binary image is classified BC toextract the high HIGH entropy feature image. The highentropy feature image is transformed CT from its original car-tesian coordinate system to cylindrical coordinate system.Feature vectors extracted FEX from all the images in the data-base are classified into three feature vectors FV. The featurevectors are further transformed FT into Gaussian distributedquality models; global angular segment pixel density X1, trans-verse angular segment pixel density X2 and whole brainangular segment pixel density X3.
472 M. E. OSADEBEY ET AL.

across age, gender and race. The three quality modelswere named after the feature vectors: whole brainangular segment pixel density X1, transversesegment pixel density X2 and whole brain pixeldensity X3. The mean value for the low and the highentropy areas for the whole brain pixel density are0.4734 and 0.5471, respectively. This is in agreementwith the results reported in [49] for the grey matter,white matter and cerebrospinal fluids. The Gaussiandistributions for each feature model were centred atthe mean of the random variables. The standard
deviation was estimated using the principle of three-signal rule [50].
2.4. System operation
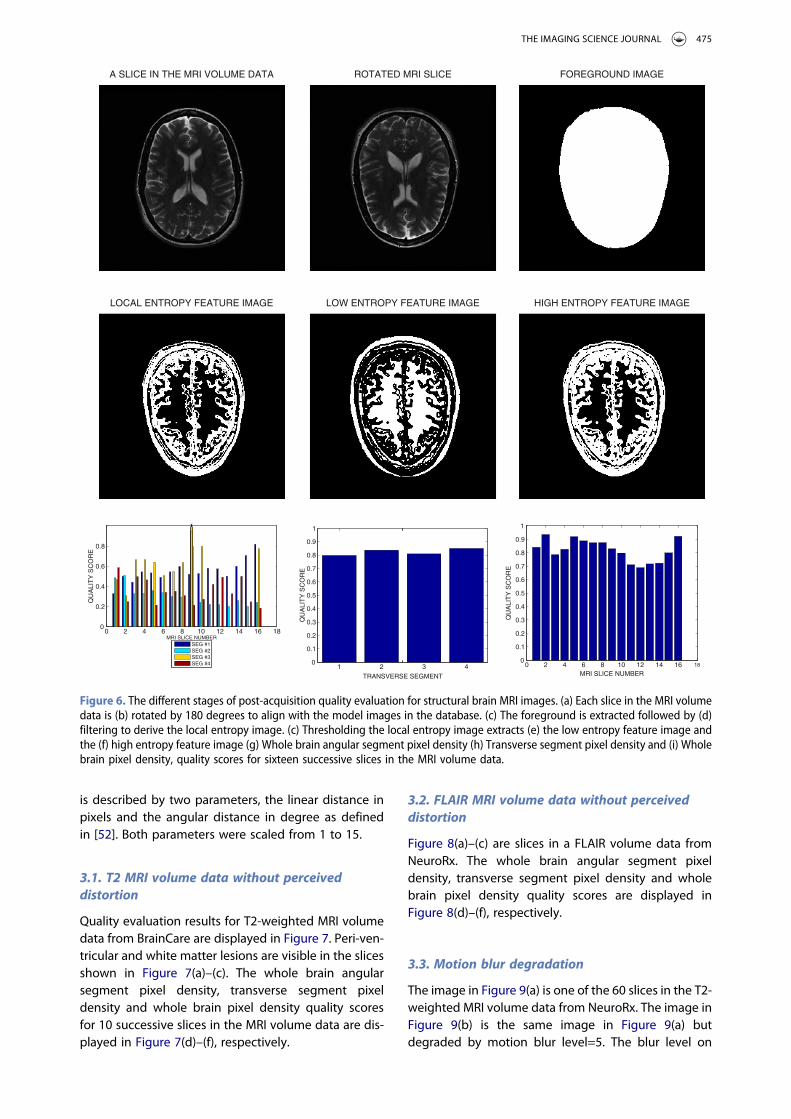
The algorithm was implemented in the MatLab com-puting environment. The flow chart in Figure 5 andthe images displayed in Figure 6 explain how our pro-posed method predicts image quality. The test imageTIM in Figure 6(a) is rotated by 180 degrees as shownin Figure 6(b) so as to be in the same orientation as
0 0.2 0.4 0.6 0.8 1
0 0.2 0.4 0.6 0.8 1 0 0.2 0.4 0.6 0.8 1
0 0.2 0.4 0.6 0.8 1
0 0.2 0.4 0.6 0.8 1
0
5
10
15
0
5
10
15
20
25
30
0
10
20
30
40
50
60
70
0
20
40
60
80
100
120
0
50
100
150
Figure 4. Histogram distribution of the feature vectors extracted from MRI volume data and fitted with normal distribution. Theplots were derived from (a) 50, (b) 100, (c) 150, (d) 200 and (e) 250 MRI volume data.
THE IMAGING SCIENCE JOURNAL 473

the model images in the image database. Foregroundextracted from the rotated image is shown inFigure 6(c). Local entropy feature image of the testimage computed using a 3× 3 local entropy filter isshown in Figure 6(d). Figure 6(e,f) show the low andthe high entropy regions extracted from the localentropy feature image by binarization using themean of the local entropy feature image as globalthreshold. Three geospatial feature vectors areextracted FEX from the high entropy feature imagesof the slices in the MRI volume data. The featurevectors are whole brain angular segment pixeldensity x1, transverse segment pixel density x2 andwhole brain pixel density x3. Each feature vector isused to standardize Z1, Z2, Z3 corresponding Gaus-sian distributed quality model X1, X2, X3 whichwere derived during the modelling experiment. Thisgives three corresponding standard scores S1, S2,S3 and normal distributions:
z1 = x1 − X1sX1
z2 = x2 − X2sX2
z3 = x3 − X3sX3
(3)
where sX1 , sX2 and sX3 are the estimate of the stan-dard deviation for each quality model.
Cumulative distribution function P1, P2, P3 for eachstandardized score gives corresponding three quality
scores Q1, Q2, Q3 of the test image:
Q1 = 2[P(z1 ≤ X1)] ifP(z1 ≤ X1) ≤ 0.52(1− [P(z1 ≤ X1)]) otherwise
{(4)
Q2 = 2[P(z2 ≤ X2)] ifP(z2 ≤ X2) ≤ 0.52(1− [P(z2 ≤ X2)]) otherwise
{(5)
Q3 = 2[P(z3 ≤ X3)] ifP(z3 ≤ X3) ≤ 0.52(1− [P(z3 ≤ X3)]) otherwise
{(6)
The whole brain angular segment pixel density qualityscore, transverse segment pixel density quality scoreand the whole brain pixel density quality score are dis-played in Figure 6(g)–(i). The whole brain pixel densityquality score expresses the quality score of individualslices in the MRI volume data.
3. Experimental results
Quality evaluation was carried out on the test images intheir original state and in their noisy and blurred ver-sions. Two separate and identical Gaussian noiselevels were generated to simulate the real and imagin-ary components in the complex plane of MRI acqui-sition process. Rician noise was added to the data bycomputing the magnitude of the complex data. TheRician noise level was based on the maximum pixelintensity level of the test image [51]. The noise levelsrange from 0 % to 9%. Motion blur was induced on adata by convolving it with a special filter that approxi-mates the linear motion of a camera. The linear motion
Figure 5. The flow chart of our proposed method for quality evaluation of brain MRI images. Feature vector FV extracted from a testimage is transformed FT to three separate random variable x1, x2 and x3. These random variables are used to standardize Z1, Z2,Z3 corresponding Gaussian distributed quality model X1, X2, X3 which gives normally distributed quality models S1, S2, S3. Cumu-lative probability distribution P1, P2, P3 for each standardized score gives corresponding quality scores Q1, Q2, Q3.
474 M. E. OSADEBEY ET AL.
is described by two parameters, the linear distance inpixels and the angular distance in degree as definedin [52]. Both parameters were scaled from 1 to 15.
3.1. T2 MRI volume data without perceiveddistortion
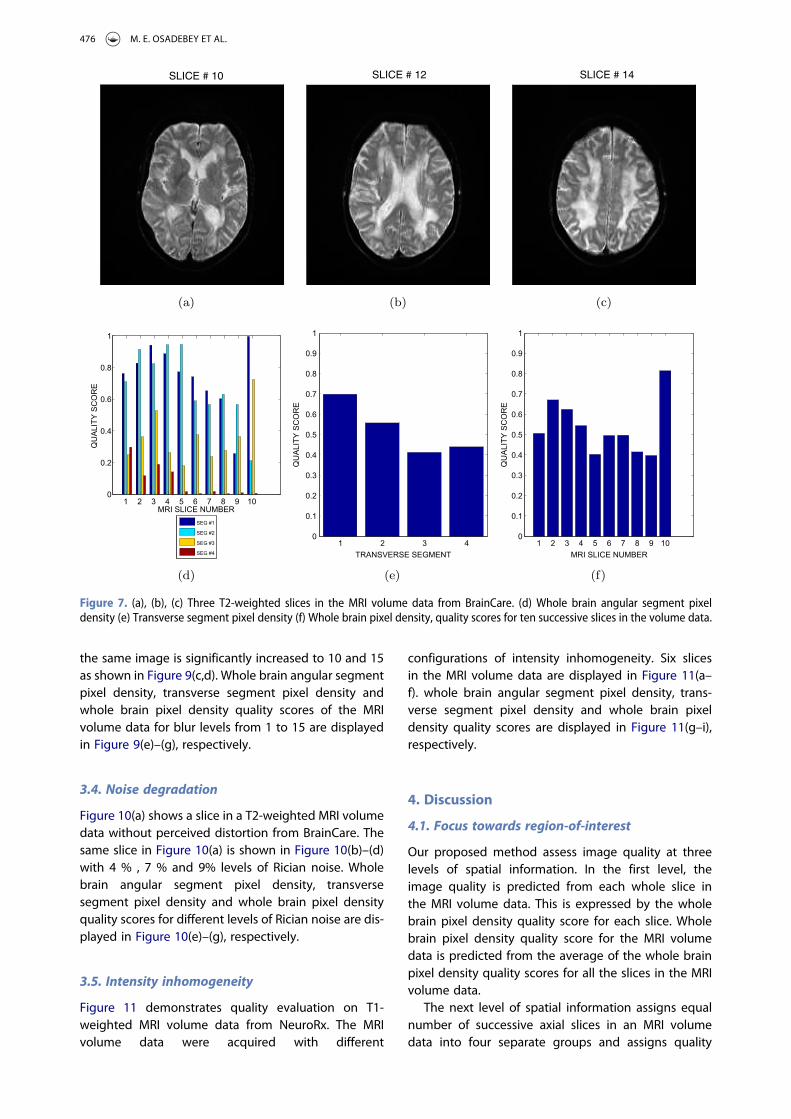
Quality evaluation results for T2-weighted MRI volumedata from BrainCare are displayed in Figure 7. Peri-ven-tricular and white matter lesions are visible in the slicesshown in Figure 7(a)–(c). The whole brain angularsegment pixel density, transverse segment pixeldensity and whole brain pixel density quality scoresfor 10 successive slices in the MRI volume data are dis-played in Figure 7(d)–(f), respectively.
3.2. FLAIR MRI volume data without perceiveddistortion
Figure 8(a)–(c) are slices in a FLAIR volume data fromNeuroRx. The whole brain angular segment pixeldensity, transverse segment pixel density and wholebrain pixel density quality scores are displayed inFigure 8(d)–(f), respectively.
3.3. Motion blur degradation
The image in Figure 9(a) is one of the 60 slices in the T2-weighted MRI volume data from NeuroRx. The image inFigure 9(b) is the same image in Figure 9(a) butdegraded by motion blur level=5. The blur level on
ROTATED MRI SLICEA SLICE IN THE MRI VOLUME DATA FOREGROUND IMAGE
LOCAL ENTROPY FEATURE IMAGE LOW ENTROPY FEATURE IMAGE HIGH ENTROPY FEATURE IMAGE
0 2 4 6 8 10 12 14 16 180
0.2
0.4
0.6
0.8
1
MRI SLICE NUMBER
QU
ALI
TY
SC
OR
E
SEG #1SEG #2SEG #3SEG #4 1 2 3 4
0
0.1
0.2
0.3
0.4
0.5
0.6
0.7
0.8
0.9
1
TRANSVERSE SEGMENT
QU
ALI
TY
SC
OR
E
0 2 4 6 8 10 12 14 16 180
0.1
0.2
0.3
0.4
0.5
0.6
0.7
0.8
0.9
1
MRI SLICE NUMBER
QU
ALI
TY
SC
OR
E
Figure 6. The different stages of post-acquisition quality evaluation for structural brain MRI images. (a) Each slice in the MRI volumedata is (b) rotated by 180 degrees to align with the model images in the database. (c) The foreground is extracted followed by (d)filtering to derive the local entropy image. (c) Thresholding the local entropy image extracts (e) the low entropy feature image andthe (f) high entropy feature image (g) Whole brain angular segment pixel density (h) Transverse segment pixel density and (i) Wholebrain pixel density, quality scores for sixteen successive slices in the MRI volume data.
THE IMAGING SCIENCE JOURNAL 475
the same image is significantly increased to 10 and 15as shown in Figure 9(c,d). Whole brain angular segmentpixel density, transverse segment pixel density andwhole brain pixel density quality scores of the MRIvolume data for blur levels from 1 to 15 are displayedin Figure 9(e)–(g), respectively.
3.4. Noise degradation
Figure 10(a) shows a slice in a T2-weighted MRI volumedata without perceived distortion from BrainCare. Thesame slice in Figure 10(a) is shown in Figure 10(b)–(d)with 4 % , 7 % and 9% levels of Rician noise. Wholebrain angular segment pixel density, transversesegment pixel density and whole brain pixel densityquality scores for different levels of Rician noise are dis-played in Figure 10(e)–(g), respectively.
3.5. Intensity inhomogeneity
Figure 11 demonstrates quality evaluation on T1-weighted MRI volume data from NeuroRx. The MRIvolume data were acquired with different
configurations of intensity inhomogeneity. Six slicesin the MRI volume data are displayed in Figure 11(a–f). whole brain angular segment pixel density, trans-verse segment pixel density and whole brain pixeldensity quality scores are displayed in Figure 11(g–i),respectively.
4. Discussion
4.1. Focus towards region-of-interest
Our proposed method assess image quality at threelevels of spatial information. In the first level, theimage quality is predicted from each whole slice inthe MRI volume data. This is expressed by the wholebrain pixel density quality score for each slice. Wholebrain pixel density quality score for the MRI volumedata is predicted from the average of the whole brainpixel density quality scores for all the slices in the MRIvolume data.
The next level of spatial information assigns equalnumber of successive axial slices in an MRI volumedata into four separate groups and assigns quality
SLICE # 10 SLICE # 12 SLICE # 14
Figure 7. (a), (b), (c) Three T2-weighted slices in the MRI volume data from BrainCare. (d) Whole brain angular segment pixeldensity (e) Transverse segment pixel density (f) Whole brain pixel density, quality scores for ten successive slices in the volume data.
476 M. E. OSADEBEY ET AL.

score to each group. The quality score is referred to astransverse segment quality score.
The third level of spatial information is the wholebrain angular segment pixel density. Each slice in anMRI volume data is partitioned into four equalangular segments. Quality score is assigned to eachsegment in a slice. Whole brain angular segmentquality score is predicted from the average of aspecific angular segment across slices in the MRIvolume data. The third level of spatial informationencourages focus towards region of interest, as com-binations of angular segments can describe specificgeographic region of the brain. The two angular seg-ments that lie from 180◦ through 270◦ to 360◦
describe the frontal lobe of the brain. The remainingtwo angular segments that lie between 0◦ and 180cover the region described by the parietal lobe ofthe brain. Furthermore, the two angular segmentsthat span 270◦ through 360◦ or 0◦ to 90◦ are theleft hemisphere of the brain, while the right hemi-sphere is the region described by the angular seg-ments from 90◦ through 180◦ to270◦.
4.2. Correlation across images with acceptablequality
The plots in Figures 6–8 show that our proposedmethod can fairly predict the quality of slices in anMRI volume data. The whole brain pixel densityquality score in Figures 6(i), 7(f) and 8(f) expresses thequality scores of individual slices in the MRI volumedata. Since these images under investigation arewithout any perceived distortion, our proposedmethod can be said to reveal the variations in imagequality between individual slices in an MRI volumedata. Average whole brain pixel density quality scoresof 0.9, 0.5 and 0.8 predicted for the MRI volume datain Figures 6–8 are in agreement with the status ofacceptable quality assigned to the test images.
4.3. Correlation with variations in image quality
Our proposed method can objectively differentiateimages having different levels of image quality.Quality prediction shown in Figure 9(e)–(g) for
Figure 8. (a), (b), (c) Three FLAIR slices in the MRI volume data from NeuroRx. d) Whole brain angular segment pixel density (e)Transverse segment pixel density (f) Whole brain pixel density, quality scores for sixteen successive slices in the volume data.
THE IMAGING SCIENCE JOURNAL 477

motion blur degradation and Figure 10(e)–(g) for Riciannoise degradation show correlation between qualityindex predicted by our proposed method and the
different levels of degradation. In Figure 9(g), the pre-dicted image quality varies from 0.9 to 0.3 for succes-sive blur degradation which varies from 1 to 15. The
Figure 9. (a) A slice in an MRI volume data from NeuroRx is without any perceived distortion. Each slice in the MRI volume isdegraded with 15 different levels of motion blur. Three degraded versions of the slice shown in (a); 5, 10 and 15 levels ofmotion blur are displayed in (b), (c) and (d), respectively. (e) Whole brain angular segment pixel density (f) Transverse segmentpixel density (f) Whole brain pixel density, quality scores for the different levels of motion blur.
478 M. E. OSADEBEY ET AL.

(a) (b) (c)
(d)
1 2 3 4 5 6 7 8 9 100
0.2
0.4
0.6
0.8
1
RICIAN NOISE LEVEL
QU
ALI
TY S
CO
RE
SEG #1
SEG #2
SEG #3
SEG #4
(e)
1 2 3 4 5 6 7 8 9 100
0.2
0.4
0.6
0.8
1
RICIAN NOISE LEVEL
QU
ALI
TY S
CO
RE
TRSEG #1
TRSEG #2
TRSEG #3
TRSEG #4
(f)
1 2 3 4 5 6 7 8 9 100
0.1
0.2
0.3
0.4
0.5
0.6
0.7
0.8
0.9
1
RICIAN NOISE LEVEL
QU
ALI
TY S
CO
RE
(g)
TEST IMAGE WITHOUT NOISE RICIAN NOISE LEVEL=4 PERCENT RICIAN NOISE LEVEL=7 PERCENT
RICIAN NOISE LEVEL=09 PERCENT
Figure 10. (a) A slice in an MRI volume data from BrainCare is without any perceived distortion. Each slice in the MRI volume data isdegraded with ten different levels of Rician noise. Three degraded versions of the slice shown in (a); 2%, 7% and 9% Rician noise areshown in (b), (c) and (d), respectively. (e) Whole brain angular segment pixel density. (f) Transverse segment pixel density. (g) Wholebrain pixel density, quality scores for the different levels of noise.
THE IMAGING SCIENCE JOURNAL 479

plots in Figure 10(g) also show correlation betweenpredicted quality scores that varies from 0.95 to 0.6and the different levels of Rician noise which variesfrom 0 to 9%.
4.4. Incorporation of fidelity, usefulness andnaturalness
The design philosophy behind our proposed methodincorporate fidelity, usefulness and naturalness. Theusefulness is derived from the use of brain MRI data
from subjects across age, gender and race to buildquality models. The fidelity property comes from com-paring a test data with the quality models. The natural-ness is derived by the use of local entropy filter todescribe spatial correlation between constituent ana-tomic structures.
4.5. Interpretation of proposed quality score
The interpretation of quality score predicted by ourproposed method is based on the probability scale.
(a) (b) (c)
(d) (e) (f)
1 2 3 4 5 6 7 8 9 10111213140
0.2
0.4
0.6
0.8
1
MRI SLICE NUMBER
QU
ALI
TY S
CO
RE
SEG #1SEG #2SEG #3SEG #4
(g)
1 2 3 40
0.1
0.2
0.3
0.4
0.5
0.6
0.7
0.8
0.9
1
TRANSVERSE SEGMENT
QU
ALI
TY S
CO
RE
(h)
1 2 3 4 5 6 7 8 9 10111213140
0.1
0.2
0.3
0.4
0.5
0.6
0.7
0.8
0.9
1
MRI SLICE NUMBER
QU
ALI
TY S
CO
RE
(i)
TEST IMAGE: SLICE # 1 TEST IMAGE: SLICE # 4 TEST IMAGE: SLICE # 6
TEST IMAGE: SLICE # 9 TEST IMAGE: SLICE # 11 TEST IMAGE: SLICE # 14
Figure 11. (a) Six slices in a T1-weighted MRI volume data from NeuroRx. The images were originally acquired with intensity inhom-ogeneity. (e) Whole brain angular segment pixel density. (f) Transverse segment pixel density. (g) Whole brain pixel density, qualityscores for 14 successive slices in the MRI volume data.
480 M. E. OSADEBEY ET AL.

Thus we recommend quality score threshold of 0.4 todetermine if a slice is of acceptable quality or withoutacceptable quality.
4.6. Absence of comparative performanceevaluation
Image quality evaluation methods proposed for ageneral class of images will require significant modifi-cation before they can be applied for quality evaluationof medical images including brain images [53]. Existingquality evaluation methods adopt different distortionmodels. Our proposed method is based on a qualitymodel that is different from the quality modelsadopted by existing quality evaluation methods forbrain MRI images. There are many definitions ofPSNR, SNR and MSE, which makes it difficult tocompare quality measures from different imagingsystems, modalities and researchers [54]. Performanceevaluation results reported in the literature are bothmodel and data dependent, because the different tech-niques are evaluated on different types of image data[55]. These factors make it difficult for us to carry outcomparative performance evaluation of our proposedmethod.
5. Conclusion
In this report, we propose a new method to evaluatethe quality of brain MRI images. It is based on the useof entropy to encode classical image quality attri-butes. Geo-spatial statistics of local entropy featuresexploit the geometric similarity of human anatomyacross age, gender and race to build three qualitymodels from model images provided by ADNI. AMRI image is evaluated based on how its extractedfeature compares with a corresponding qualitymodel. Our proposed method incorporates direc-tional information and spatial dependencies of ana-tomic structures and this encourages image qualityevaluation based on region-of-interest. Qualitymeasures account for structures such as the corticalgrey matter and the contrast between the constitu-ent anatomical structures. Based on the test dataand the performance evaluation of our proposedmethod, we are optimistic that our proposedmethod can be used for quality evaluation in clinicalresearch organizations to assess longitudinal brainMRI images acquired from different scanners anddifferent clinical trial sites. In the future, we intendto acquire more test data for performance evaluationon more types of distortion such as geometric distor-tion, slice thickness deviation, slice non-uniformityand high-contrast spatial resolution. Future work willalso include subjective evaluation by radiologists inthe performance evaluation.
Acknowledgments
ADNI is funded by the National Institute on Aging, theNational Institute of Biomedical Imaging and Bioengineering,and through generous contributions from the following:AbbVie, Alzheimer’s Association; Alzheimer’s Drug DiscoveryFoundation; Araclon Biotech; BioClinica, Inc.; Biogen; Bristol-Myers Squibb Company; CereSpir, Inc.; Cogstate; Eisai Inc.;Elan Pharmaceuticals, Inc.; Eli Lilly and Company; EuroImmun;F. Hoffmann- La Roche Ltd and its affiliated company Genen-tech, Inc.; Fujirebio; GE Healthcare; IXICO Ltd.; Janssen Alzhei-mer Immunotherapy Research & Development, LLC.; Johnson& Johnson Pharmaceutical Research & Development LLC.;Lumosity; Lundbeck; Merck & Co., Inc.; Meso Scale Diagnos-tics, LLC.; NeuroRx Research; Neurotrack Technologies; Novar-tis Pharmaceuticals Corporation; Pfizer Inc.; Piramal Imaging;Servier; Takeda Pharmaceutical Company; and TransitionTherapeutics. The Canadian Institutes of Health Research isproviding funds to support ADNI clinical sites in Canada.Private sector contributions are facilitated by the Foundationfor the National Institutes of Health(www.fnih.org). Thegrantee organization is the Northern California Institute forResearch and Education, and the study is coordinated bythe Alzheimer’s Therapeutic Research Institute at the Univer-sity of Southern California. ADNI data are disseminated by theLaboratory for Neuro Imaging at the University of SouthernCalifornia.
Marius Pedersen was supported by the Research Councilof Norway, project no. 247689 IQMED: Image Qualityenhancement in MEDical diagnosis, monitoring andtreatment.
Disclosure statement
No potential conflict of interest was reported by the authors.
Funding
Data collection and sharing for this project was funded by theAlzheimer’s Disease Neuroimaging Initiative (ADNI) (NationalInstitutes of Health Grant U01 AG024904) and DOD ADNI(Department of Defense award number W81XWH-12-2-0012). Norges Forskningsråd (247689).
Notes on Contributors
M. E. Osadebey obtained a master’s degree with distinction inbiomedical engineering from Tampere University of Technol-ogy, Finland in 2009 and a Ph.D. in engineering and computerscience from Concordia University, Montreal, Canada in 2015.His Ph.D. study focused on the processing of MRI images ofthe brain. Michael is an MRI reader at NeuroRx Research Inc,a Montreal-based clinical research organization. Michael Osa-debey duties at NeuroRx include application of advancedimage analysis software in the reading of MRI data of neuro-logical diseases patients undergoing clinical trial drugtreatment.
Marius Pedersen received his bachelor’s degree in ComputerEngineering in 2006, and MiT in Media Technology in 2007,both from Gjovik University College, Norway. He completeda Ph.D. program in colour imaging in 2011 from the Universityof Oslo, Norway, sponsored by Oce. He is currently employedas an associate professor at NTNU Gjovik, Norway. He is alsothe director of the Norwegian Colour and Visual Computing
THE IMAGING SCIENCE JOURNAL 481

Laboratory (Colourlab). His work is centred on subjective andobjective image quality.
Douglas Arnold is the Director of Magnetic Resonance Spec-troscopy Lab, McGill University, Montreal, Canada and thePresident/CEO of NeuroRx research Inc., a Montreal-basedclinical research organization. Arnold is a neurologist withspecial expertise in MRI. His personal research interests arecentred on the use of advanced neuro-imaging techniquesto assess the pathological evolution of multiple sclerosisand Alzheimer’s disease and to quantify the effects oftherapy on these diseases.
Katrina Wendel-Mitoraj obtained her Ph.D. in biomedicalengineering from Tampere University of Technology in2010. Her Ph.D. study focused on electroencephalography(EEG) electrode sensitivity distributions. Katrina is the CEOand founder of BrainCare Oy. BrainCare Oy (http://braincare.fi/) is a Tampere University of Technology spin-off companyfounded in 2013 to deliver personalized solutions toimprove the quality of life of epilepsy patients. The organiz-ation recently concluded clinical trials for a novel mobileapplication and supporting solutions for long-term monitor-ing for epileptic patients.
References
[1] Pedersen M, Zheng Y, Hardeberg J. Evaluation of imagequality metrics for color prints. In: Heyden A, Kahl F,editors. Image analysis. Berlin: Springer; 2011. p. 317–326. (Lecture Notes in Computer Science; Vol. 6688).
[2] Pedersen M, Bonnier N, Hardeberg JY, et al., Attributesof image quality for color prints. J Electron Imag.2010;19(1):011016.
[3] Wang Z, Bovik A. Modern image quality assessment.Morgan & Claypool; 2006. DOI:10.2200/S00010ED1V01Y200508IVM003
[4] Janssen R. Computational image quality. Society ofPhoto Optical. Bellingham, WA: SPIE Press; 2001. (PressMonographs).
[5] Mansoor AB, Anwar A, Khan S. Subjective evaluation ofimage quality measures for white noise and gaussianblur-distorted images. Imag Sci J. 2013;61(1):13–21.
[6] Duvernoy HM. The human brain: surface, three-dimen-sional sectional anatomy with MRI, and blood supply.Vienna: Springer Science & Business Media; 2012.
[7] Mori S, Wakana S, Van Zijl PC, et al., MRI atlas of humanwhite matter. Vol. 16. Amsterdam: American Society ofNeuroradiology; 2005.
[8] Frisoni GB, Fox NC, Jack CR, et al., The clinical use ofstructural MRI in alzheimer disease. Nat Rev Neurol.2010;6(2):67–77.
[9] Scheltens P, Leys D, Barkhof F, et al., Atrophy of medialtemporal lobes on MRI in ‘probable’ Alzheimer’s diseaseand normal ageing: diagnostic value and neuropsycho-logical correlates. J Neurol, Neurosurg Psychiatry.1992;55(10):967–972.
[10] Arnold DL, Calabresi PA, Kieseier BC, et al., Effect ofpeginterferon beta-1a on MRI measures and achievingno evidence of disease activity: results from a random-ized controlled trial in relapsing-remitting multiple scler-osis. BMC Neurol. 2014;14(1):777–0.
[11] Selmaj K, Kappos L, Arnold D, et al., Safety and tolerabil-ity results from the decide study: A phase 3 active-com-parator study of daclizumab hyp in relapsing-remittingmultiple sclerosis (p7.230). Neurology. 2015;84(14Supplement):P7.230.
[12] Comi G, Cohen J, Arnold D, et al., Efficacy results of thephase 2 portion of the radiance trial: a randomized,double-blind, placebo-controlled trial of oral rpc1063in adults with relapsing multiple sclerosis (p7.198).Neurology. 2015;84(14 Supplement):P7.198.
[13] Yalman Y, Akar F, Bayilmis C. A web-based digital analy-sis interface for image quality assessment. Imag Sci J.2014;62(3):149–160.
[14] Wang Z, Bovik AC, Sheikh HR, et al., Image qualityassessment: from error visibility to structural similarity.IEEE Trans Image Process. 2004;13(4):600–612.
[15] Narwaria M, Lin W. Objective image quality assessmentbased on support vector regression. IEEE Trans NeuralNetw. 2010 Mar;21(3):515–519.
[16] Prieto F, GuariniM, TejosC, et al.,Metrics for quantifying thequality of MR images. In: Proceedings of the 17th AnnualMeeting of ISMRM; Honolulu, Hawaii; 2009. p. 4696.
[17] Miao J, Huang F, Narayan S, et al., A new perceptualdifference model for diagnostically relevant quantitativeimage quality evaluation: A preliminary study. MagnReson Imag. 2013;31(4):596–603.
[18] Miao J, Huo D, Wilson DL. Quantitative image qualityevaluation of MR images using perceptual differencemodels. Med Phys. 2008;35(6):2541–2553.
[19] ul Haque MI, Qadri MT, Siddiqui N. Reduced referenceblockiness and blurriness meter for image qualityassessment. Imag Sci J. 2015;63(5):296–302.
[20] Woodard JP, Carley-Spencer MP. No-reference imagequality metrics for structural MRI. Neuroinformatics.2006;4(3):243–262.
[21] Mittal A, Moorthy AK, Bovik AC. No-reference imagequality assessment in the spatial domain. IEEE TransImage Process. 2012 Dec;21(12):4695–4708.
[22] Fang Y, Ma K, Wang Z, et al., No-reference quality assess-mentof contrast-distorted imagesbasedonnatural scenestatistics. IEEE Signal Process Lett. 2015 Jul;22(7):838–842.
[23] Mortamet B, Bernstein MA, Jack CR, et al., Automaticquality assessment in structural brain magnetic reson-ance imaging. Magn Reson Med. 2009;62(2):365–372.
[24] SaadMA, Bovik AC, Charrier C. Blind image quality assess-ment: a natural scene statistics approach in the DCTdomain. IEEE Trans Image Process. 2012;21(8):3339–3352.
[25] Kim WG, Kwon OJ, Pang HS. Wavelet-based distortionmeasure for binary images. Imag Sci J. 2013;61(5):408–418.
[26] Sinha N, Ramakrishnan AG. Quality assessment in mag-netic resonance images. Crit RevTM Biomed Eng. 2010;38(2):127–141.
[27] Pedersen M, Hardeberg JY. Full-reference image qualitymetrics: classification and evaluation. FoundationsTrends Comput Graph Vis. 2012;7(1):1–80.
[28] Pedersen M. Evaluation of 60 full-reference imagequality metrics on the CID: IQ. In: 2015 IEEEInternational Conference on Image Processing, ICIP2015, Quebec City, QC, Canada, September 27–30,2015; 2015. p. 1588–1592.
[29] Cavaro-Menard C, Zhang L, Le Callet P. Diagnosticquality assessment of medical images: challenges andtrends. In: 2010 2nd European Workshop on VisualInformation Processing (EUVIP); July; 2010. p. 277–284.
[30] Thung KH, Raveendran P. A survey of image qualitymeasures. In: 2009 International Conference forTechnical Postgraduates (TECHPOS); Kuala Lumpur,Malaysia; Dec; 2009. p. 1–4.
[31] Moraru L, Moldovanu SS, Obreja CD. A survey overimage quality analysis techniques for brain MRimages. Int J Radiol. 2015;2(1):24–28.
482 M. E. OSADEBEY ET AL.

[32] Chandler DM. Seven challenges in image quality assess-ment: past, present, and future research. ISRN SignalProcessing. 2013.
[33] Wang Z. Objective image quality assessment: facing thereal-world challenges. In: Society for Imaging Scienceand Technology, International Symposium onElectronic Imaging, Image Quality and SystemPerformance XII; 2016. p. 1–6.
[34] Lee JC, Su Y, Tu TM, et al., A novel approach to imagequality assessment in iris recognition systems. ImagSci J. 2010;58(3):136–145.
[35] Cressie N. Statistics for spatial data. New York: JohnWiley & Sons; 2015.
[36] Colliot O, Camara O, Dewynter R, et al., Description ofbrain internal structures by means of spatial relationsfor MR image segmentation. In: Fitzpatrick M, Sonka,M, editors. Medical Imaging 2004. San Diego, CA:International Society for Optics and Photonics; 2004.p. 444–455.
[37] Bowden DM, Martin RF. Neuronames brain hierarchy.Neuroimage. 1995;2(1):63–83.
[38] Osadebey M, Pedersen M, Arnold D, et al., Bayesian fra-mework inspired no-reference region-of-interest qualitymeasure for brain MRI images. J Med Imag. 2017;4(2):025504–025504.
[39] Wendel K, Osadebey M, Malmivuo J. Incorporating cra-niofacial anthropometry into realistically-shaped headmodels. In: Dössel O, Schlegel W, editors. World con-gress on medical physics and biomedical engineering;September 7–12, 2009; Munich, Germany. Berlin:Springer; 2010. p. 1706–1709. (IFMBE Proceedings; Vol.25/4).
[40] Osadebey M. Simulation of realistic head geometryusing radial vector representation of magnetic reson-ance image data [master’s thesis]. Tampereen teknilli-nen yliopisto. Julkaisu-Tampere University ofTechnology; 2009.
[41] Wendel KE. The influence of tissue conductivity andhead geometry on eeg measurement sensitivity distri-butions [dissertation]. Tampereen teknillinen yliopisto.Julkaisu-Tampere University of Technology; 2010.
[42] Shiee N, Bazin PL, Cuzzocreo JL, et al., Reconstruction ofthe human cerebral cortex robust to white matterlesions: method and validation. Human Brain Mapp.2014;35(7):3385–3401.
[43] Mugler JP, Brookeman JR. Three-dimensional magneti-zation-prepared rapid gradient-echo imaging (3d mprage). Magn Reson Med. 1990;15(1):152–157.
[44] Reimer P, Meaney JF, Parizel PM, et al., Clinical MRimaging. Berlin: Springer; 2010.
[45] Jack CR, Bernstein MA, Fox NC, et al., The alzheimer’sdisease neuroimaging initiative (adni): MRI methods. JMagn Reson Imag. 2008;27(4):685–691.
[46] Ruderman DL. The statistics of natural images. Network:Comput Neural Syst. 1994;5(4):517–548.
[47] Leon-Garcia A. Probability, statistics and random pro-cesses for electrical engineering. 3rd ed. Upper SaddleRiver (NJ): Prentice-Hall, Pearson Education Inc.; 2008.Chapter 3.
[48] Norman G, Streiner D. Biostatistics: the bare essentials.3rd ed. Hamilton: People’s Medical Publishing House;2008. Chapter 4.
[49] Lüders E, Steinmetz H, Jäncke L. Brain size and greymatter volume in the healthy human brain.Neuroreport. 2002;13(17):2371–2374.
[50] Grafarend EW. Linear and nonlinear models: fixedeffects, random effects, and mixed models. Berlin:Walter de Gruyter; 2006.
[51] Coupé P, Manjón JV, Gedamu E, et al., Robust Riciannoise estimation for MR images. Med Image Anal.2010;14(4):483–493.
[52] Deshpande AM, Patnaik S. A novel modified cepstralbased technique for blind estimation of motion blur.Optik-Int J Light Electron Opt. 2014;125(2):606–615.
[53] Chow LS, Paramesran R. Review of medical imagequality assessment. Biomed Signal Process Control.2016;27:145–154.
[54] Kupinski MA, Barrett HH. Small-animal spect imaging.Vol. 233. New York: Springer; 2005.
[55] Vovk U, Pernus F, Likar B. A review of methods for cor-rection of intensity inhomogeneity in MRI. IEEE TransMed Imag. 2007;26(3):405–421.
THE IMAGING SCIENCE JOURNAL 483