the spitzer c2d survey of large, nearby, interstellar ... · the spitzer c2d survey of large,...
TRANSCRIPT

THE SPITZER c2d SURVEY OF LARGE, NEARBY, INTERSTELLAR CLOUDS. V.CHAMAELEON II OBSERVED WITH IRAC
Alicia Porras,1,2
Jes K. Jørgensen,1Lori E. Allen,
1Neal J. Evans II,
3Tyler L. Bourke,
1Juan M. Alcala,
4
Michael M. Dunham,3Geoffrey A. Blake,
5Nicholas Chapman,
6Lucas Cieza,
3Paul M. Harvey,
3
Tracy L. Huard,1David W. Koerner,
7Lee G. Mundy,
6Philip C. Myers,
1Deborah L. Padgett,
8
Anneila I. Sargent,9Karl R. Stapelfeldt,
10Peter Teuben,
6Ewine F. van Dishoeck,
11
Zahed Wahhaj,7,12
and Kaisa E. Young3,13
Received 2006 August 1; accepted 2006 October 25
ABSTRACT
We present IRAC (3.6, 4.5, 5.8, and 8.0 �m) observations of the Chamaeleon II molecular cloud. The observedarea covers about 1 deg2 defined by AV > 2. Analysis of the data in the 2005 c2d catalogs reveals a small number ofsources (40) with properties similar to those of young stellar or substellar objects (YSOs). The surface density of theseYSO candidates is low, and contamination by background galaxies appears to be substantial, especially for sourcesclassified as Class I or flat spectral energy distribution (SED).We discuss this problem in some detail and conclude thatvery few of the candidate YSOs in early evolutionary stages are actually in the Cha II cloud. Using a refined set of cri-teria, we define a smaller, but more reliable, set of 24 YSO candidates.
Subject headinggs: stars: formation — stars: low-mass, brown dwarfs
1. INTRODUCTION
One of the goals of the Spitzer Legacy Program ‘‘From Mo-lecular Cores to Planet-Forming Disks’’ (c2d) is to observe asample of five molecular clouds (Chamaeleon II, Lupus, Perseus,Serpens, and Ophiuchus) selected to represent a wide range ofphysical conditions such as cloud mass, gas density, extent, struc-ture, and internal velocity dispersion (Evans et al. 2003). Thecomparison between star-forming environments in these nearbymolecular clouds through observations in the infraredwill providea better picture of the interplay of ambient conditions and localstar formation processes.
The molecular cloud complex in Chamaeleon (hereafter Cha)has three major clouds: Cha I, Cha II, and Cha III (Schwartz1977). These clouds are located somewhat below the Galactic
plane (�16� < b < �13�, see Fig. 7 in Lepine & Duvert 1994).CO observations have been presented by Vilas-Boas et al. (1994)andMizuno et al. (2001), while 13CO and C18O data are discussedby Mizuno et al. (1999). Comparisons of the CO column densityand extinction were made by Hayakawa et al. (2001), who char-acterized the clouds as being very close to virial equilibrium, al-thoughBoulanger et al. (1998) argued that Cha II has two velocitycomponents that may not be bound. The estimated virial mass ofCha II is 1:7 ; 103 M�, which is consistent with mass estimatesfrom 100 �m extinction maps (Boulanger et al. 1998).
Cha II is at a distance of 178 � 18 pc (Whittet et al. 1997). ItsGalactic coordinates of l ¼ 303
�, b ¼ �14
�place it considerably
off the Galactic plane; its high ecliptic latitude of � ¼ �60� im-plies that asteroids will be rare. The directions of Galactic andequatorial coordinates are very similar for Cha II.
Some low-mass cores are present in the Cha clouds (Vilas-Boaset al. 1994). These cores have lower column density than typicalcores in Taurus andOphiuchus, and the star formation efficiency islower as well (Vilas-Boas et al. 1994). Previous studies indicatedthat star formation activity decreases from Cha I to Cha III, withCha II intermediate. Cha II was chosen for the c2d survey to ex-emplify clouds with modest star formation activity, based on pre-vious data. The goal was to determine if the much more sensitivedata from Spitzer would change this picture.
A number of low-mass T Tauri stars have been observed in theCha II cloud. Nine of the Cha II T Tauri stars (Class II, or starswith disks) selected from their H� emission, have been observedat 1.3 mm (Henning et al. 1993), with three detected; their spec-tral energy distributions can be fitted by stars with disks with radiiof about 25 AU. This sample includes the only intermediate-massstar in the cloud, the Herbig Ae/Be star IRAS 12496�7650, alsoknown as DK Cha (Hughes et al. 1991). There is also a string ofHerbig-Haro objects, HH 52, 53, and 54, which move toward thenortheast direction (see x 7.1). The YSO population in Cha II hasbeen discussed by a number of authors, including Alcala et al.(2000), Vuong et al. (2001), Persi et al. (2003), and Young et al.(2005). In particular, Persi et al. (2003) used ISOCAM and JHKimages to study the population of young stars in an area centered
1 Harvard-Smithsonian Center for Astrophysics, Cambridge, MA; [email protected], [email protected], [email protected], [email protected], [email protected], [email protected].
2 Instituto Nacional de Astrof ısica, Optica y Electronica (INAOE), Tonantzintla,Pue., Mexico; [email protected].
3 Department of Astronomy, University of Texas at Austin, Austin, TX; [email protected], [email protected], [email protected],[email protected].
4 INAF-Osservatorio Astronomico di Capodimonte, Napoli, Italy; [email protected].
5 Division of Geological and Planetary Sciences, California Institute of Tech-nology, Pasadena, CA; [email protected].
6 Department of Astronomy, University of Maryland, College Park, MD;[email protected], [email protected], [email protected].
7 Department of Physics andAstronomy,NorthernArizonaUniversity, Flagstaff,AZ; [email protected], [email protected].
8 Spitzer Science Center, California Institute of Technology, Pasadena, CA;[email protected].
9 Division of Physics, Mathematics, and Astronomy, California Institute ofTechnology, Pasadena, CA; [email protected].
10 Jet Propulsion Laboratory, California Institute of Technology, Pasadena,CA; [email protected].
11 Leiden Observatory RA Leiden, The Netherlands; [email protected].
12 Institute for Astronomy, Honolulu, HI; [email protected] Department of Physical Sciences,Nicholls StateUniversity, Thibodaux, LA;
493
The Astrophysical Journal, 656:493Y504, 2007 February 10
# 2007. The American Astronomical Society. All rights reserved. Printed in U.S.A.

about 230 to the east of our coverage. A number of the Class IIsources were observed with the IRS instrument on the SpitzerSpace Telescope and show signs of grain growth (Kessler-Silacciet al. 2006).
We describe observations of Cha II from 3.6 to 8 �m, alongwith complementary data from other bands in x 2 and a descrip-tion of data reduction and photometry in x 3. The results are pre-sented in x4, and the identification and classification of candidateyoung stellar objects (YSOc) are in x 5. We discuss problems ofbackground contamination in x 6 and present a smaller, less con-taminated sample based on refined classification criteria.We com-pare our results to previous work in x 7 and summarize our resultsin x 8. This is a companion paper to one on c2d observations ofCha II at longer wavelengths (Young et al. 2005). It followsroughly the same plan as previous papers on IRAC data fromthe c2d survey of Serpens (Harvey et al. 2006) and Perseus(Jørgensen et al. 2006), in an attempt to provide a uniform setof statistics and diagnostic tools.
This paper does not present a complete list of YSOs associatedwithCha II. Analysis of the combined set of IRACandMIPS data,along with data from other studies, will be presented by Alcalaet al. (2007, in preparation). That study will include a completelist of YSOs, based both on our data and onwork that covers areasoutside our survey (e.g., Persi et al. 2003).
2. OBSERVATIONS
The Cha II molecular cloud was observed with the SpitzerSpace Telescope (Werner et al. 2004) with the Infrared ArrayCamera (IRAC) described by Fazio et al. (2004). We observed inthe four IRAC bands (with filters centered at about 3.6, 4.5, 5.8,and 8.0 �m) on 2004 April 4. The coverage is shown in detail inFigure 1. The area mapped in these four bands is shown on top of
the IRAS 100 �m image in Figure 2. It was selected based on thecriterion that AV > 2 mag in maps made by Cambresy (1999), asshown in Figure 1 of Evans et al. (2003).The entire area was observed twice. The first observation, or
epoch, was separated from the second epoch by about 6.5 hr. Thefirst epoch was observed in high dynamic range mode (HDR,
Fig. 1.—Left: Location of the IRAC coverage maps of Cha II, both on-cloud and the six fields off-cloud (OC). The smallest squares represent the IRAC FOVof�50 ; 50. Dotted line around the Cha II cloud coverage sketches the observed area by MIPS (24 �m) (Young et al. 2005). Right: Zoom that shows the areas surveyedby IRAC. Bands 1 and 3 boundaries are plotted with a dotted line, while bands 2 and 4 (slightly shifted to the west), are plotted with a dashed line. Small areas observedin only two bands are shown with arrows. The observations lying in the greater central region covered by all the 4 bands (band 1 ¼ 3:6 �m, band 2 ¼ 4:5 �m,band 3 ¼ 5:8 �m, and band 4 ¼ 8:0 �m), are presented in this article.
Fig. 2.—Coverage of the IRAC observations and the off-cloud fields, shownsuperimposed on a gray-scale IRAS map of emission at 100 �m. Some othernearby clouds are noted. The IRAC region indicated is the region where all fourbands overlap.
PORRAS ET AL.494 Vol. 656

alternate short and long time exposures) while the second epochwas observed in full array mode (FA, only one initial short timeexposure followed by several long time exposures). The integra-tion time per pointing, or frame time, was selected to be 12 s.HDR mode enables short integration time observations of 0.6 sfor complementary photometry of very bright sources that mightsaturate in the long exposure time observations of 12 s. Everypointing in both epochswas repeated twicewith a small positionalshift of�2000Y3000. The combination of these two dithered imagesper pointing not only increases the signal-to-noise ratio (S/N) ofthe observations but also facilitates the removal of some occa-sional bad pixels in the detector, as well as cosmic ray rejection.The exposure time (i.e., the effective integration time per pixel)was 10.4 s and 0.4 s for the long and short integrations, respec-tively. Thus, the total integration time of the combined epochs,with two dithers each, is at least�42 s and 0.4 s (HDR) through-out the surveyed region.
The observed Cha II cloud area was covered by three over-lapping grids of 9 ; 10, 8 ; 9, and 7 ; 7 pointings located in thenorthern, middle, and southern parts of the cloud, respectively(Table 1). Each individual IRAC pointing has a field of view(FOV) of�50 ; 50 (see the coverage scheme in Fig. 1); thus, thecomplete mosaic of 211 pointings embraces more than 1deg2,for each pair of bands, with the coverage for bands 1 and 3 off-set to the east from that of bands 2 and 4 (Fig. 1). The area coveredby all four IRAC bands was 1.04 deg2, or 10.0 pc2.
Six off-cloud (OC) regions were also observed with IRAC tocompare the stellar population found outside the molecular cloudregion. These were selected to have AV < 0:5 mag and little or noCO emission (Evans et al. 2003). The coordinates of the centralposition of these OC regions and the three in the Cha II cloud aresummarized in Table 1, and their locations are shown in Figure 1.All six OC regions were covered by grids of 3 ; 4 pointings. Theobservations were made in HDR mode with two repetitions onevery two dither positions, and the frame time was 12 s. This pa-rameter selection gives the same integration time for the off-cloudfields as for the on-cloud area. The locations of the off-cloud re-gions are shown in Figure 2.
All Cha II IRAC observations are available at the SSC archiveunder the PID number 176, as part of the IRAC campaign 6. TheAOR keys for Cha II in-cloud are 0005739520, 0005739776,0005740032, 0005740288, 0005740544, and 0005740800, andfor the OC regions are 0005741312, 0005741568, 0005741824,0005742080, 0005742336, and 0005742592.
3. DATA REDUCTION
A detailed description of the c2d pipeline can be found inthe data delivery document 14 (Evans et al. 2005), and a substan-tial description has been published by Harvey et al. (2006). Thesource extraction and photometry will be described by P. M.Harvey et al. (2007, in preparation). Consequently, we restrictourselves here to a summary that highlights points needed forlater discussion.
IRAC images were processed by the Spitzer Science Center(SSC) using a standard pipeline (S11) to produce Basic CalibratedData (BCD) images. The data were then processed through thestandard c2d pipeline. The BCD imageswere corrected by the c2dCalibration and Correction (CC) team for some instrumental sig-natures providing Improved Calibrated Data (ICD) to be mosaicedin every IRAC band. Sources were identified using the mosaics,but the individual images were used for the final source extractionand photometry. The short-exposure data were used for brightsources to avoid saturation. An outlier rejection algorithmwas usedto remove asteroids, which should be rare at the ecliptic latitudeof Cha II. Sources that did not fit a point-source profile wereidentified; most of the analysis in this paper is restricted to pointsources. The uncertainty in the flux calibration is conservativelyestimated to be 15%. Apparent magnitudes were calculated usingthe posted IRAC zero magnitude flux densities.15
A catalog of band-merged data with data quality flags wasproduced. The IRAC data weremerged withMIPS data at 24 �m(Young et al. 2005) and with the Two Micron All Sky Survey(2MASS) catalog (Cutri et al. 2003). For a source to be bandmerged across IRAC bands or with 2MASS, a position matchwithin 200 is required; for MIPS 24 �m, the match must be within400.
4. RESULTS
The results in this paper are based on the c2d data productsdelivered to the Spitzer Science Center in 2005 December (here-after 2005 products) and described by Evans et al. (2005).
4.1. Cloud Images
Figure 3 shows a color composite image in IRAC bands 1, 2,and 4 of the three overlapping regions of the Cha II molecularcloud. The gray-scale images for each band are shown in Fig-ure 4. The brightest source corresponds to IRAS 12496�7650,an Ae/Be star. A Herbig-Haro object, HH 54, (Reipurth & Bally2001) is also visible in Figure 3, and a blow up of the region ofthe HH object is shown. This object will be discussed later (seex 7.1).
Compared to both Serpens (Harvey et al. 2006) and Perseus(Jørgensen et al. 2006), Cha II shows less diffuse emission at8�m, indicative of a lower level of interstellar radiation or a lowerabundance of PAHs in Cha II, or both. TheMIPS images (Younget al. 2005) show strong diffuse emission around IRAS 12496�7650 and in a region to the east of it, which unfortunately lies justoff the edge of the IRAC images. This region, associated with theClass I source, IRAS 12553�7651 (also known as ISO-Cha II-28)is seen in the IRAS emission shown in Figure 2.
4.2. Source Statistics
Table 2 shows the number of sources detected in Cha II withS/N of at least 7. The vast majority of the 69,848 sources detectedin at least one band are background stars. This fact is illustrated in
TABLE 1
IRAC Coverage of the Cha II Molecular Cloud and Off-Cloud Fields
Central Positiona
Region R. A. (J2000.0) Decl. (J2000.0)
Areab
(deg2)
Cha II-1..................... 13 01 38.88 �78 01 11.98 0.48
Cha II-2..................... 13 01 11.52 �77 34 12.00 0.37
Cha II-3..................... 12 54 13.68 �76 58 48.01 0.22
OC-1.......................... 13 37 54.00 �75 58 48.01 0.05
OC-2.......................... 13 38 02.64 �77 58 48.01 0.05
OC-3.......................... 13 38 15.36 �79 58 48.01 0.05
OC-4.......................... 11 58 02.16 �77 30 36.01 0.05
OC-5.......................... 11 58 07.68 �78 30 36.01 0.05
OC-6.......................... 11 58 26.16 �81 00 36.01 0.05
Notes.—Units of right ascension are hours, minutes, and seconds, and unitsof declination are degrees, arcminutes, and arcseconds.
a Of IRAC 3.6 and 5.8 �m grids.b Area covered by all four IRAC bands.
14 See http://ssc.spitzer.caltech.edu/ legacy/.15 See http://ssc.spitzer.caltech.edu/irac/calib/overview.html.
SPITZER c2d SURVEY. V. 495No. 1, 2007

Table 3, where the number of sources per band is listed at variouslevels of S/N. The number of sources detected at each level ismuch greater in the shorter wavelength bands. The differentialsource counts per solid angle for each band, shown in Figure 5, in-dicate very similar surface densities in the on-cloud and off-cloudfields (gray and black lines, respectively). The counts also agreeclosely with predictions of a Galactic model by Wainscoat et al.(1992) until near the limiting magnitude, where an extra peak isseen in both the on- and off-cloud fields, most clearly in IRACbands 1 and 3. A similar effectwas seen in Perseus (Jørgensen et al.2006) and attributed to the distribution of background galaxies orstars. The limitingmagnitudes for a complete sample suggested byFigure 5 are 17.5, 16.5, 15.0, and 14.0 mag for 3.6, 4.5, 5.8, and8.0 �m, respectively. These are each about 0.5 mag higher thanour prelaunch predictions for the 5 � sensitivities (Evans et al.2003).
For further analysis, we restrict ourselves to the ‘‘high-quality’’catalog, which includes only sources with detections in all fourIRAC bands, excludes sources which were classified as extendedduring source extraction, and excludes sources without a qualityof detection of either ‘‘A’’ or ‘‘B’’ in at least one IRAC band (S/Ngreater than about 10 or 7 �, respectively). These criteria are dis-cussed by Harvey et al. (2006) and Evans et al. (2005); applyingthem leads to a drastically pruned sample of 6284 sources (Table 2).For comparison, 1532 sources were detected withMIPS at 24 �min the somewhat larger field (1.5 deg2) covered by that instrument(Young et al. 2005). The number of sources with 2MASS iden-tifications and detections in IRAC band 1 and band 2 is 4621(Table 2).Many on-cloud sources (2179)were detected by IRAC,but not 2MASS; a few sources (67) were detected (S/N at least 10in bothH andK ) by 2MASS, but not IRAC. Such sources are gen-erally located around the edges of the IRAC coverage, although a
�
�
Fig. 3.—Color composite image of the Cha II molecular cloud. Blue ¼ 3:6 �m, green ¼ 4:5 �m, and red ¼ 8:0 �m. The total area covered by IRAC observations isabout 1 deg2. Note the sparse distribution of stars that characterizes this dark cloud. The brightest mid-IR object corresponds to DKCha ( IRAS 12496�7650), which isrelated with the Herbig-Haro object HH 54 extended toward the northeast direction (see x 7.1).
PORRAS ET AL.496 Vol. 656

few correspond to sources that saturated the IRAC images. Thetwo brightest sources are not listed in our high-quality catalog be-cause they are saturated; these are IRAS 12496�7650 (DKCha)and IRAS 12580�7716 (CD�76 565).
In comparison to Perseus (Jørgensen et al. 2006), Cha II has asimilar number of four-band detections in an area that is smallerby nearly a factor of 4; this difference arises because Cha II issomewhat closer to the Galactic plane (b ¼ �14) than Perseus(b � �20), and closer to the Galactic center (l ¼ 303
�versus
l ¼ 160�). The number of four-band detections in Serpens (b �5�) is still greater than inCha II by a factor ofmore than 2 (Harveyet al. 2006).
5. CANDIDATE YOUNG STELLAR OBJECTS:2005 CATALOG
The sensitivity of the c2d survey is sufficient to detect em-bedded sources and young stars down to very low levels of lumi-nosity (L � 10�3 L�). We refer to such objects as Young StellarObjects (YSOs) whether they are in fact stellar or substellar,and we include all stages of evolution from deeply embedded
Fig. 4.—Gray-scale images of the entire regions covered by each of the four IRAC bands. A logarithmic stretch was used for bands 1 and 2, while a linear stretchwas used for bands 3 and 4.
TABLE 2
Detection of Sources with S/N �7 � toward Chamaeleon II
(Total Numbers)
Detection Type On Cloud Off Cloud
Detection in at least one IRAC band ........................ 69848 18483
Detection in all 4 IRAC bands.................................. 6476 1562
Detection in 3 IRAC bands....................................... 5460 1424
Detection in 2 IRAC bands....................................... 27506 7017
Detection in 1 IRAC band ........................................ 30406 8480
Detection in 2MASS onlya........................................ 67 0
Detection in IRAC only ............................................ 65139 17222
Detection in 4 IRAC bands and not 2MASSa.......... 2179 462
Excluding Extended Sources
Four band detections.................................................. 6284 1496
Four band detections with 2MASS associationa....... 4229 1086
Detected in IRAC1+2 and 2MASSa ......................... 4621 1248
a A source is counted as detected by 2MASS if it has a S/N of at least 10 inboth H and Ks.
SPITZER c2d SURVEY. V. 497No. 1, 2007

protostars to revealed stars, as long as they have a convincinginfrared excess over the stellar photosphere.
As was clear from the discussion in x 4.2 and from Figure 5,the vast majority of sources that we detect are background stars,while background galaxies represent a significant contaminant atlowflux levels. The question is how to separate thewheat from the
chaff. As discussed by Harvey et al. (2006) and Jørgensen et al.(2006), our 2005 catalogs (Evans et al. 2005) did not effect a com-plete separation. Instead, we used a combination of criteria basedon color-magnitude and color-color diagrams to produce samples‘‘enriched’’ in YSOs and ‘‘impoverished’’ in background starsand galaxies. We will explore this sample, discuss its limitations,
TABLE 3
Detection of Sources Toward Chamaeleon II (per Band)
Detection Type 3.6 �m 4.5 �m 5.8 �m 8.0 �m
Detections with:
—S/N of at least 7 ...................................................................... 61769 46221 11583 8219
—S/N of at least 10 .................................................................... 55742 39034 8204 5992
—S/N of at least 15 .................................................................... 39527 24636 4979 4248
Final sample (excluding extended sources) ................................ 60601 45935 11513 8003
—2MASS association (S/N at least 10 in H and Ks) ................ 4633 4642 4443 4453
Fig. 5.—Differential source counts for the on- and off-cloud regions (gray and black, respectively). The predictions from the Wainscoat models are shown with thedashed line.
PORRAS ET AL.498 Vol. 656

and then describe a more refined sample based on an improvedseparation procedure that is currently being tested.
5.1. Diagnostic Diagrams
Figures 6Y8 show color-magnitude or color-color diagramsfor Cha II, the off-cloud control region, and data from the SWIREobservations (Surace et al. 2004) of the European Large-Area ISOSurvey (ELAIS) N1 field (Rowan-Robinson et al. 2004).16 Onlythe ‘‘high-quality’’ sources, as defined above, are included. TheSWIRE field should not include any YSOs and should representthe background galaxy distribution. The SWIRE data were pro-cessed through our pipeline in the same way as the c2d data forconsistency. Then our SWIRE catalog was statistically extinctedwith the same distribution of extinction levels seen toward Cha IIand resampled to best match the limitingmagnitudes of our Cha IIobservations (P. M. Harvey 2007, in preparation). Several inde-pendent samples were made of the full 5.3 deg2 area to check forvariations, whichwere small. For the figures, the sources fromoneof these samples were again randomly sampled to simulate thesolid angle covered by our Cha II data.
Figure 6 shows a color-magnitude diagram for Cha II, the off-cloud control region, and the resampled version of the SWIREsample. Stars with no infrared excess occupy a band around zerocolor in [4.5]�[8.0]; sources to the right of the vertical dashed lineat ½4:5� � ½8:0� > 0:5 have significant infrared excess. This crite-rion is based onfinding aminimum in the distributions of stars andgalaxies from the SWIRE sample at this color (S. Lai et al. 2007,in preparation). At faint 8.0 �m magnitudes, a second distinctclump of faint sources appears. This clump is seen in both the off-cloud field and the SWIRE data aswell, and it is clearly composedprimarily of background galaxies. Analysis of the SWIRE dataindicates that 95% of the galaxies lie below a line correspondingto ½8:0� ¼ 14� (½4:5� � ½8:0�), as shown by the diagonal dashedline. In the 2005 catalog, we classified sources lying between thetwo dashed lines as ‘‘YSO candidates’’ (YSOc), as discussed inEvans et al. (2005) and S. Lai et al. (2007, in preparation), andthese are indicated by plus signs in Figure 6.
Some sources outside the dashed lines are also classified asYSOc; these have satisfied a similar set of criteria in another color-magnitude plot using the MIPS 24 �m data. That criterion typi-cally finds stars with infrared excesses that are significant only fork > 8�m, and provides only amodest increment to theYSOc cat-egory (�10 sources out of the total of 40 YSOc in the case ofCha II). Some relatively bright galaxies will be misclassified asYSOc in this process; based on the resampled SWIRE sample,there may be�17 such galaxies in the Cha II sample, but extinc-tion in the cloud might make this an upper limit. The extinctionvectors in Figure 6 show that extinction will tend tomove objectsbelow the diagonal line. It is also possible that we are excludingrealYSOs from theYSOc category because they are faint or highlyextincted. The Serpens data show evidence for a population ofsuch faint sources (Harvey et al. 2006).
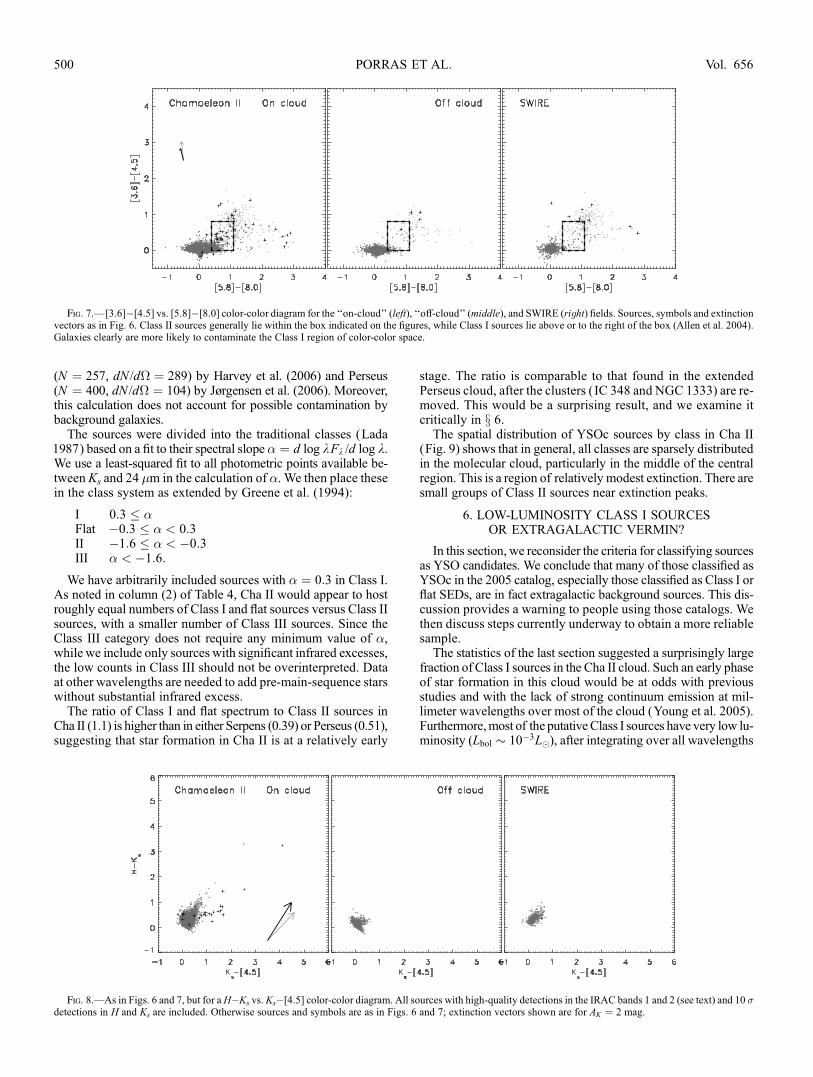
Figure 7 shows the color-color diagram with ½3:6� � ½4:5� vs.½5:8� � ½8:0� (Megeath et al. 2004; Allen et al. 2004), and Fig-ure 8 shows the H � Ks vs. Ks � ½4:5� (Gutermuth et al. 2004)color-color diagram. These diagrams have proven useful in sepa-rating YSOs from stars, and our classification of YSOc (againplotted as plus signs) is generally consistent. Clearly, the galax-ies cannot be excluded from the ½3:6� � ½4:5� vs. ½5:8� � ½8:0� dia-gram, as many occupy the same space as the YSOs. The H � Ks
vs.Ks � ½4:5� diagram ismuchmore effective in separating galax-ies, but the requirement for data at H and Ks might eliminate asubstantial number of YSOc sources, especially the most deeplyembedded, as long as only 2MASS data are available. For Cha II,only 22 of the 40 YSOc can be plotted. This diagram illustrateshow deeper near-infrared surveys could effect a cleaner separationof the YSOs and galaxies. However, extinction can have a biggerimpact on this diagram, as shown by the arrows.
5.2. Classification of YSO Candidates
Using the sample of YSO candidates selected in x5.1, we char-acterize sources in Cha II. In doing so, we must bear in mind thatthis sample only purports to be enriched in actual YSOs. We willexplore the effects of contamination in the next section.
Table 4 shows the number of YSO candidates and divides theminto classes. Both the total number (40) and the number per squaredegree (38.5) are much less than what was found toward Serpens
Fig. 6.—[8.0] vs. [4.5]�[8.0] color-magnitude diagrams based on the high quality catalogs (see text) with the Cha II ‘‘on-cloud’’ regions (left), ‘‘off-cloud’’ region(middle), and resampled SWIRE catalog (right). In each panel stars are indicated by dark gray dots, YSO candidates by black plus signs, and other sources by light graydots. The distinction between YSO candidates and other sources was predominantly made based on this diagram, with YSO candidates lying between the two dashedlines, with a few additional sources added based on their [8.0]�[24] colors (see discussion in text). Two extinction vectors are shown corresponding to AK ¼ 5mag. Thegray vector was derived for diffuse ISM regions by Indebetouw et al. (2005). The black vector, appropriate for the dense regions found in molecular clouds and cores,was derived from deep near-infrared and Spitzer observations of dense cores (T. L. Huard et al. 2007, in preparation).
16 VizieR Online Data Catalog, 2255, 0.
SPITZER c2d SURVEY. V. 499No. 1, 2007
(N ¼ 257, dN /d� ¼ 289) by Harvey et al. (2006) and Perseus(N ¼ 400, dN /d� ¼ 104) by Jørgensen et al. (2006). Moreover,this calculation does not account for possible contamination bybackground galaxies.
The sources were divided into the traditional classes (Lada1987) based on a fit to their spectral slope � ¼ d log kFk /d log k.We use a least-squared fit to all photometric points available be-tween Ks and 24 �m in the calculation of �. We then place thesein the class system as extended by Greene et al. (1994):
I 0:3 �Flat �0:3 � < 0:3II �1:6 � < �0:3III � < �1:6:
We have arbitrarily included sources with � ¼ 0:3 in Class I.As noted in column (2) of Table 4, Cha II would appear to hostroughly equal numbers of Class I and flat sources versus Class IIsources, with a smaller number of Class III sources. Since theClass III category does not require any minimum value of �,while we include only sources with significant infrared excesses,the low counts in Class III should not be overinterpreted. Dataat other wavelengths are needed to add pre-main-sequence starswithout substantial infrared excess.
The ratio of Class I and flat spectrum to Class II sources inCha II (1.1) is higher than in either Serpens (0.39) or Perseus (0.51),suggesting that star formation in Cha II is at a relatively early
stage. The ratio is comparable to that found in the extendedPerseus cloud, after the clusters ( IC 348 and NGC 1333) are re-moved. This would be a surprising result, and we examine itcritically in x 6.The spatial distribution of YSOc sources by class in Cha II
(Fig. 9) shows that in general, all classes are sparsely distributedin the molecular cloud, particularly in the middle of the centralregion. This is a region of relatively modest extinction. There aresmall groups of Class II sources near extinction peaks.
6. LOW-LUMINOSITY CLASS I SOURCESOR EXTRAGALACTIC VERMIN?
In this section, we reconsider the criteria for classifying sourcesas YSO candidates. We conclude that many of those classified asYSOc in the 2005 catalog, especially those classified as Class I orflat SEDs, are in fact extragalactic background sources. This dis-cussion provides a warning to people using those catalogs. Wethen discuss steps currently underway to obtain a more reliablesample.The statistics of the last section suggested a surprisingly large
fraction of Class I sources in the Cha II cloud. Such an early phaseof star formation in this cloud would be at odds with previousstudies and with the lack of strong continuum emission at mil-limeter wavelengths over most of the cloud (Young et al. 2005).Furthermore,most of the putativeClass I sources have very low lu-minosity (Lbol � 10�3L�), after integrating over all wavelengths
Fig. 7.—[3.6]�[4.5] vs. [5.8]�[8.0] color-color diagram for the ‘‘on-cloud’’ (left), ‘‘off-cloud’’ (middle), and SWIRE (right) fields. Sources, symbols and extinctionvectors as in Fig. 6. Class II sources generally lie within the box indicated on the figures, while Class I sources lie above or to the right of the box (Allen et al. 2004).Galaxies clearly are more likely to contaminate the Class I region of color-color space.
Fig. 8.—As in Figs. 6 and 7, but for aH�Ks vs.Ks�[4.5] color-color diagram. All sources with high-quality detections in the IRAC bands 1 and 2 (see text) and 10 �detections in H and Ks are included. Otherwise sources and symbols are as in Figs. 6 and 7; extinction vectors shown are for AK ¼ 2 mag.
PORRAS ET AL.500 Vol. 656

with available photometry from 1.2 to 70 �m. (Most are not de-tected at k < 3:6 �m.) Such low apparent luminosities for Class Isources, if real, would be very interesting in light of the emergingevidence for a class of very low luminosity objects (VeLLOs) insome of the small clouds in our study (Young et al. 2004; Bourke
et al. 2006;Dunham et al. 2006), although the establishedVeLLOshave Lbol � 0:05 to 0.1 L�, rather than Lbol � 10�3 L�.
A comparison to the table of YSO candidates in Young et al.(2005) foundmatches for only 2 of the 11 putative Class I sources.However, all but two of our sources do have detections at MIPS24�m; their absence from the candidate list of Young et al. (2005)is caused by a lack of 2MASS detections, which was required byYoung et al. (2005).
The Cha II cloud presents a good test case for checking forextragalactic contamination: the surface density of sources is low,making such contamination relatively more important; and thesmall number of sources allows careful examination. We focushere on the sources classified asClass I or flat SED, as thesewouldbe the most surprising. We will employ methods that do not re-quire careful examination of each object, so that these methodsmay be useful for other clouds.
We will first consider a statistical correction based on ourextincted and resampled SWIRE data from the ELAIS-N1 field.(The off-cloud data also suggest substantial contamination, butthe statistics are too poor to do a detailed correction.) We usea section of the SWIRE data covering 5.3 deg2 to obtain sourcecounts per solid angle. Then we normalize to the area covered in
Fig. 9.—Spatial distributions of sources in different classes in the Cha II molecular cloud. These are represented by different symbols plotted over an image of the4.5 �m emission and contours of visual extinction, with AV ¼ 2 up to 12 in steps of 2 mag. The extinctions are based on fits to extinction toward sources identifiedas stars. Two objects that are too bright to appear in our catalog are indicated by name. The filled symbols indicate objects that were classified as YSOc in the 2005catalog, but that are rejected by the new criteria. Most of the rejected sources lie in regions of low extinction. The exception is ISO-Cha II-28, which lies near thepeak of extinction east of DK Cha; as noted in the text, this is a legitimate YSO. The three new YSOc selected by the new criteria are shown without central dots.The interacting galaxies are the open ‘‘Class I’’ symbol near the top. The two legitimate YSOs are open ‘‘Class II’’ symbols near the top and in the cluster around thesouthern extinction peak.
TABLE 4
Statistics of YSO Candidates
Quantity
(1)
Cha IIa
(2)
OCa
(3)
SWIREb
(4)
Newc
(4)
Area (deg2) ............................... 1.04 0.3 5.3 1.04
YSO candidates ........................ 40 5 59 24
YSOc’s per square degree ........ 38.5 17 11.6 23.1
Class I ....................................... 11 (27.5%) 4 3.7 2 (8%)
Flat spectrum............................. 8 (20.0%) 0 5.9 0 (0%)
Class II ...................................... 17 (42.5%) 1 0.8 19 (79%)
Class III..................................... 4 (10.0%) 0 1.2 3 (13%)
a Based on 2005 criteria for YSO candidates; actual numbers for classes.b Based on 2005 criteria for YSO candidates; numbers for classes are nor-
malized to area of Cha II.c Based on new criteria for YSO candidates (see discussion in x 6).
SPITZER c2d SURVEY. V. 501No. 1, 2007

Cha II. We assume that all sources classified as YSOc in theSWIRE sample are in fact background contamination. The num-ber of sources classified as YSOc in the off-cloud and SWIREfields (also shown in Table 4) indicates that about 12 of the40 YSOc sources in Cha II could be background galaxies. Thepreponderance of Class I and flat SED sources among thesegalaxies is clearly seen in those entries in Table 4 and by thedistribution of ‘‘YSOc’’ in the SWIRE panel of Figure 7.
Focusing on the 19 putative Class I and flat SED sources, thestatistics of the SWIRE data suggest that only about 9 should ac-tually be embedded sources. Small-number statistics make thisnumber very uncertain. Can we decidewhich are bona fide Class Isources and which are extragalactic vermin? Only two have L >0:1 L�; both of these are IRAS sources and they are the two Class Isources also identified as YSOs by Young et al. (2005). Of theother 9 Class I sources, 7 have L < 3 ; 10�3 L�, assuming thedistance to Cha II. These are very unlikely to be actual Class Isources.
We conclude that extragalactic vermin are a substantial sourceof fake Class I and flat SED sources in Cha II. We caution thatextragalactic vermin can be a significant source of false YSOc inearly stages in fields with low surface densities of bona fidesources, leading to distortions in source counts and classificationschemes.
6.1. Toward a Cleaner Sample of YSOs
We are currently working on a set of criteria that will effect amuch cleaner separation between true YSOs and background gal-axies. These criteria will be described in detail by P. M. Harveyet al. (2007, in preparation). They use both IRAC andMIPS colorand magnitude criteria. When applied to the Cha II data and theextincted, resampled SWIREdata, these new criteria delivermuchsmaller numbers of YSO candidates: 24 in Cha II and 3 in the fullSWIRE sample covering 5.3 deg2. This would predict that only 0or 1 fake YSO should appear in the new sample of YSOc in Cha II,which covers only 1.04 deg2.
It is instructive to compare the old and newYSOc samples. The19 sources rejected by the new criteria are almost all the sourcesof apparent low luminosity (14 of 19 with L < 3 ; 10�3 L�) andearly (Class I or flat) SEDs (17 of 19). Only one reject is alegitimate YSO, ISO-Cha II-28, or IRAS 12553�7651 (Persi et al.2003; Young et al. 2005).
The YSOc selected by the new criteria include three sourcesnot included previously. Two of these are legitimate YSOs basedon otherwork: Sz54 (Hughes&Hartigan 1992) and IRAS 12535�7623 (J. Alcala et al. 2007, in preparation). They were previouslyexcluded by the apparent presence of a second source within 2.000
in the 4.5 �m band. This criterion has been relaxed in the newcriteria. The third new source is an interesting case study in theremaining problems. It was previously excluded because it wasfitted as an extended source in two bands. It is brighter at longwavelengths than any source in the larger SWIRE field, and ithas a steeply rising spectral index (1.66). It would have a lumi-nosity out to 70 �m of about 0.05 L�. It is either a VeLLO or anunusually bright background galaxy. Fortuitously, this objecthas been observed withHST in a study of putative edge-on disks(K. R. Stapelfeldt et al. 2007, in preparation). In that image, it isclearly a pair of interacting galaxies!
The YSOc rejected by the new criteria are shown as filled sym-bols in Figure 9; they mostly lie in regions of low extinction,although they are surprisingly clustered. The surviving YSOc cor-relate better with the extinction contours.
The new criteria seem to bemuchmore effective. They have in-cluded only one clear background galaxy (pair) and they have ex-cluded one legitimate YSO, a much better record. If we delete theknown contaminant and add the known left-out source, we getthe statistics in the ‘‘New’’ column in Table 4. Recall that thetwo brightest sources are not included because of saturation; ofthese, DK Cha would be a Class I YSO (Henning et al. 1993).Further analysis of the entire YSO population requires data at otherwavelengths and will be pursued in a follow-up paper (J. Alcala2007, in preparation). Early results from that work support thevalue of the new criteria in separating YSOs from backgroundgalaxies.
7. COMPARISONS TO OTHER STUDIESAND COMMENTS ON INDIVIDUAL OBJECTS
The two certain Class I sources (IRAS 12500�7658 and IRAS12553�7651, also known as ISO-Cha II-28) have been discussedby Young et al. (2005). Rather than discuss individual sources indetail, we engage in some comparison of our samples of YSOc tothose found in previous studies with the goal of illustrating thecomplementary nature of different surveys.The YSO population in Cha II has been analyzed by Vuong
et al. (2001), Persi et al. (2003), Alcala et al. (2000), and Younget al. (2005). A number of brown dwarfs with disks have beenidentified using deep near-infrared data and our c2d catalogs(Allers et al. 2006). Some of the sources discussed by these au-thors show up as YSOc sources in our catalogs, primarily in theclasses from ‘‘flat’’ to Class II. We briefly describe comparisonsto some of the previous catalogs.Six of our YSOc list are found in Table 1 of Vuong et al. (2001)
selected on the basis that I � J � 2. Only three of the objects inthe tables in Persi et al. (2003) are in our YSOc list; the overlapis small because the area covered by their study was smaller andabout half is off to the east of our coverage. Of the seven candidatebrown dwarfswith disks inCha II listed byAllers et al. (2006) fiveappear in our YSOc list. The two missing sources are too faint tobe included in the 2MASS catalog, and hence have insufficientwavelength coverage to be classified in our catalogs, even thoughthey are well detected. Allers et al. (2006) were able to classifythemusing deeper near-infrared data.Most of the objects found byAllers et al. (2006) have nowbeen confirmedwith spectroscopy tobe brown dwarfs (Alcala et al. 2006; Allers 2006; Jayawardhana& Ivanov 2006).
7.1. HH 54
The three color image in Figure 10 shows the Herbig-Haroobjects HH 54 (upper left) and HH 52/53 (lower right). HH 54 isa well studied region notable for its large abundance of watervapor (Liseau et al. 1996) and ratios of ortho-to-para H2 belowthose expected for the observed gas temperatures (>2000 K), asdiscussed by Gredel (1994) and Neufeld et al. (1998). Observa-tions of HH 54 with IRS aboard Spitzer (Neufeld et al. 2006)show that IRAC bands 3 and 4 are dominated by shocked rota-tional transitions of H2, tracing temperatures of 400Y1200 K,while H2 emission in IRAC band 2 traces somewhat higher tem-peratures and is a good tracer of shocked outflow emission with-out the possible confusion from PAH emission (Smith & Rosen2005;Noriega-Crespo et al. 2004). The bowshock of HH54 showsa mix of green and red emission (IRAC bands 2 and 4, respec-tively), while the region behind the bow and around HH 52/53 isdominated by green emission (IRAC band 2 only), indicative ofhigher temperatures and in broad agreement with the trends seen
PORRAS ET AL.502 Vol. 656

by Neufeld et al. (2006). HH 54 is also well detected at 24 �m byMIPS and IRS.
8. CONCLUSIONS
The Cha II molecular cloud has been surveyed with the IRACinstrument of the Spitzer Space Telescope. Among the nearly70,000 sources detected in at least one band in our 2005 catalogs,40 objects have been identified as candidates to be young stellaror substellar objects, collectively known as YSOc’s. The totalnumber and number per solid angle of YSOc’s are much smallerthan toward other c2d clouds analyzed so far, Serpens and Perseus.The number of the YSOc’s that were classified as Class I or flat-spectrum sources is comparable to the number in the Class II stage,unlike the situation in Serpens and Perseus. If real, these wouldindicate much more active star formation than previously knownin Cha II, concentrated on very low luminosity objects. However,many of these appear to be background galaxies; improvedcriteria yield only 24 objects classified as YSOc, mostly Class IIobjects. Care must be taken to avoid distortion of the statisticsof sources in various classes by background objects, especiallyin fields with low surface density of YSOs, such as Cha II. The
contaminating background galaxies are preferentially found in theearlier classes.
We thank the referee for suggestionswhich led to a clearer presen-tation. We are grateful to the staff at the Lorentz Center at LeidenUniversity for hospitality during a three week meeting in 2005 Julywhere a large part of this work was pursued. Support for this work,part of the Spitzer Legacy Science Program, was also provided byNASA through contracts 1224608, 1230782, and 1230779 issuedby the Jet Propulsion Laboratory, California Institute of Technol-ogy, under NASA contract 1407. The research of J. K. J. was sup-ported by NASA Origins grant NAG5-13050. Astrochemistryin Leiden is supported by a NWO Spinoza grant and a NOVAgrant. K. E. Y. was supported by NASA under grant NGT5-50401issued through the Office of Space Science. This publicationmakesuse of data products from the TwoMicron All Sky Survey, whichis a joint project of the University of Massachusetts and the In-frared Processing andAnalysis Center/California Institute of Tech-nology, funded by NASA and NSF. This research has made useof the SIMBAD database, operated at CDS, Strasbourg, France.
REFERENCES
Alcala, J. M., Covino, E., Sterzik, M. F., Schmitt, J. H. M. M., Krautter, J., &Neuhauser, R. 2000, A&A, 355, 629
Alcala, J. M., Spezzi, L., Frasca, A., Covino, E., Porras, A., Merın, B., & Persi, P.2006, A&A, 453, L1
Allen, L. E., et al. 2004, ApJS, 154, 363Allers, K. N. 2006, Ph. D. thesis, Univ. Texas, AustinAllers, K. N., Kessler-Silacci, J. E., Cieza, L. A., & Jaffe, D. T. 2006, ApJ, 644, 364Boulanger, F., Bronfman, L., Dame, T. M., & Thaddeus, P. 1998, A&A, 332,273
Bourke, T. L., et al. 2006, ApJ, 649, L37Cambresy, L. 1999, A&A, 345, 965Cutri, R. M., et al. 2003, 2MASS All Sky Point Source Catalog (Pasadena:IPAC), http://irsa.ipac.caltech.edu/applications/Gator/
Dunham, M. M., et al. 2006, ApJ, 651, 945Evans, N. J., II, et al. 2003, PASP, 115, 965———. 2005, Third Delivery of Data from the c2d Legacy Project: IRAC andMIPS (Pasadena: SSC)
Fazio, G. G., et al. 2004, ApJS, 154, 10Gredel, R. 1994, A&A, 292, 580
Greene, T. P., Wilking, B. A., Andre, P., Young, E. T., & Lada, C. J. 1994, ApJ,434, 614
Gutermuth, R. A., Megeath, S. T., Muzerolle, J., Allen, L. E., Pipher, J. L.,Myers, P. C., & Fazio, G. G. 2004, ApJS, 154, 374
Harvey, P. M., et al. 2006, ApJ, 644, 307Hayakawa, T., Cambresy, L., Onishi, T., Mizuno, A., & Fukui, Y. 2001, PASJ,53, 1109
Henning, T., Pfau, W., Zinnecker, H., & Prusti, T. 1993, A&A, 276, 129Hughes, J., & Hartigan, P. 1992, AJ, 104, 680Hughes, J. D., Hartigan, P., Graham, J. A., Emerson, J. P., & Marang, F. 1991,AJ, 101, 1013
Indebetouw, R., et al. 2005, ApJ, 619, 931Jayawardhana, R., & Ivanov, V. D. 2006, ApJ, 647, L167Jørgensen, J. K., et al. 2006, ApJ, 645, 1246Kessler-Silacci, J., et al. 2006, ApJ, 639, 275Lada, C. J. 1987, in IAU Symp. 115, Star Forming Regions, ed. M. Peimbert& J. Jugaku (Dordrecht: Reidel), 1
Lepine, J. R. D., & Duvert, G. 1994, A&A, 286, 60Liseau, R., et al. 1996, A&A, 315, L181
Fig. 10.—Color composite image of the interesting outflow HH 54. The coding is 3.6 �m as blue, 4.5 �m as green, and 8.0 �m as red.
SPITZER c2d SURVEY. V. 503No. 1, 2007

Megeath, S. T., et al. 2004, ApJS, 154, 367Mizuno, A., Yamaguchi, R., Tachihara, K., Toyoda, S., Aoyama, H., Yamamoto, H.,Onishi, T., & Fukui, Y. 2001, PASJ, 53, 1071
Mizuno, A., et al. 1999, PASJ, 51, 859Noriega-Crespo, A., et al. 2004, ApJS, 154, 352Neufeld, D. A., Melnick, G. J., & Harwit, M. 1998, ApJ, 506, L75Neufeld, D. A., et al. 2006, ApJ, 649, 816Persi, P., Marenzi, A. R., Gomez, M., & Olofsson, G. 2003, A&A, 399, 995Reipurth, B., & Bally, J. 2001, ARA&A, 39, 403Rowan-Robinson, M., et al. 2004, MNRAS, 351, 1290Schwartz, R. D. 1977, ApJS, 35, 161Smith, M. D., & Rosen, A. 2005, MNRAS, 357, 1370
Surace, J. A., et al. 2004, The SWIRE ELIASN1 Image Atlas and Source Catalogs(Pasadena: SSC), http://data.spitzer.caltech.edu/popular/swire/20041027
Vilas Boas, J. W. S., Myers, P. C., & Fuller, G. A. 1994, ApJ, 433, 96Vuong, M. H., Cambresy, L., & Epchtein, N. 2001, A&A, 379, 208Wainscoat, R. J., Cohen, M., Volk, K., Walker, H. J., & Schwartz, D. E. 1992,ApJS, 83, 111
Werner, M. W., et al. 2004, ApJS, 154, 1Whittet, D. C. B., Prusti, T., Franco, G. A. P., Gerakines, P. A., Kilkenny, D.,Larson, K. A., & Wesselius, P. R. 1997, A&A, 327, 1194
Young, C. H., et al. 2004, ApJS, 154, 396Young, K. E., et al. 2005, ApJ, 628, 283
PORRAS ET AL.504