the sports authority: from turnaround to focused growth · the sports authority: from turnaround to...
TRANSCRIPT

Retailing The Sports Authority Case
Copyright © Trustees of Columbia University in the City of New York For permission contact [email protected] 212-854-7173
1
The Sports Authority: From Turnaround to Focused Growth
Martin “Marty” Hanaka, Chairman and CEO of The Sports Authority (TSA), had just finished delivering his fiscal third quarter 2002 press release during an investor conference call. 1 While TSA reported a net loss in the seasonally soft third quarter with a 0.4% comparable store sales increase, year to date performance showed a 20-cent per share profit in 2002, vs. a 10-cent per share loss in 2001. Hanaka was pleased with the progress his company had made. After all, the company had come a long way since he took over in September 1998; the past two years for TSA had been profitable following the two-year period of net losses starting in fiscal year 1999. Still, Hanaka knew that there was still much work to be done. For instance, TSA had experienced higher than expected inventory shrink in the third quarter, and Hanaka knew he would have to address the issue at the upcoming TSA Leadership Conference, an annual meeting of all of TSA’s executive managers, store managers, and key vendors. “What else should we focus on this year?” he wondered. During the investor conference call, Hanaka mentioned how TSA had successfully reduced its debt levels to an expected 40% of capitalization by the end of the year from a high of 69%. The recent extension of the company’s borrowing facility in tight credit markets demonstrated bank confidence that TSA’s turnaround plan was on track. Furthermore, the improved working capital from reducing inventory levels throughout the stores and lower interest expenses meant that TSA had more funds to finance the planned store remodels. However, the fact that TSA’s stock price was stuck at $7.60 per share—in the lower half of the company’s 52 week range—meant that TSA still had to prove its ability to perform. Meanwhile, Hanaka was busy trying to think of how to keep up the morale of his employees at the upcoming Leadership Conference in Florida. Competition from other sporting goods retailers and discounters remained This case was researched and written in January 2003 by Alvaro Lopez, Keith Katz, and Eric Chen, MBA ’03, under the supervision of Professor Alan Kane as the basis for class discussion rather than to illustrate either effective or ineffective handling of a strategic situation.
1 The company has a fiscal year ending February 2nd. The third quarter ended November 2nd, 2002.

Retailing The Sports Authority Case
Copyright © Trustees of Columbia University in the City of New York For permission contact [email protected] 212-854-7173
2
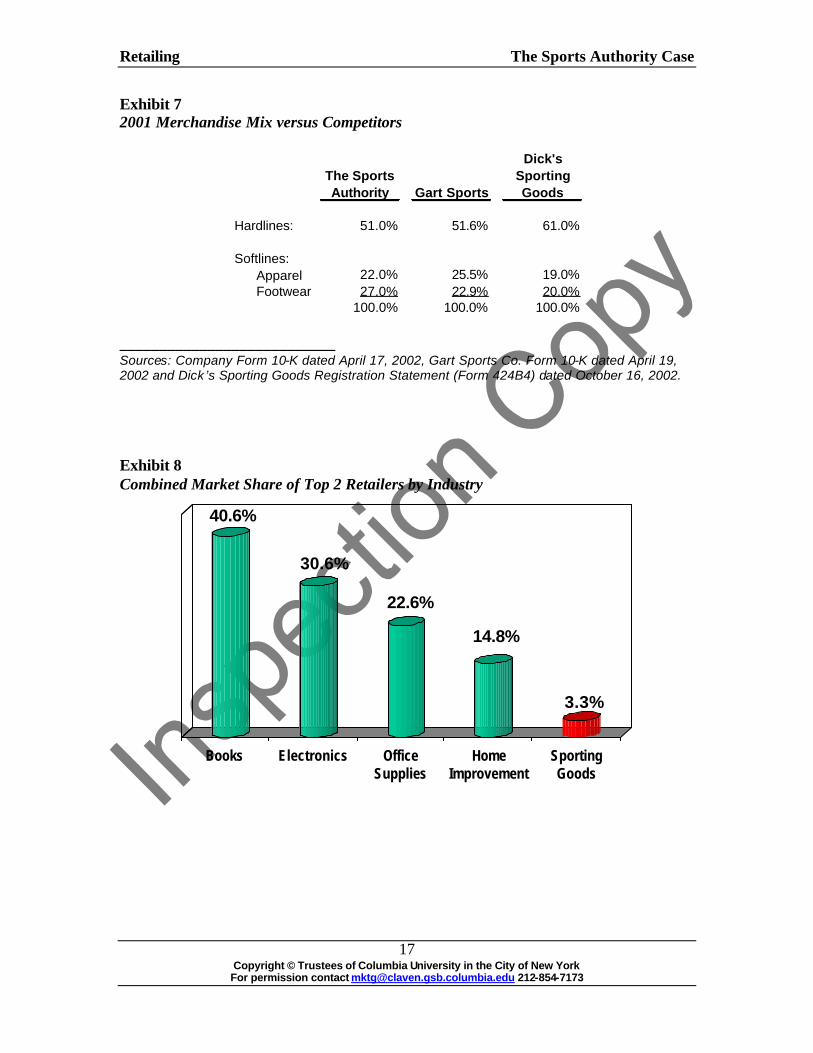
intense, and he knew that consolidation in the sector was bound to happen. He also knew that TSA needed to improve its performance in order to maintain its leadership position in the industry. The Company The Sports Authority, Inc. is a Ft. Lauderdale, FL based company that opened its first store in 1987. TSA is the largest full- line sporting goods retailer in the U.S., operating 204 stores in 33 states. 2 For the fiscal year 2001, TSA revenues were approximately $1.4 billion (Exhibits 1-5). The largest concentration of TSA locations is in the Northeast, where TSA operates 69 stores. In percentage terms, TSA’s store distribution is as follows: Northeast (34.7%), Southeast (36.2%), Midwest (14.6%), Southwest (6.5%), Northwest (2%), and West (6%) (Exhibit 6). The company operates large-format stores that are generally at least 40,000 square feet in both major metropolitan areas and in suburbs of these areas. Each TSA store offers roughly 40,000 SKU’s across 27 major departments. Approximately 27% of TSA’s sales are generated from footwear, 22% from apparel, and 51% from “hardline” goods such as golf clubs, camping gear, and bicycles (Exhibit 7). Additionally, an 19.9% company-owned joint venture with AEON Co, Ltd. operates 38 TSA stores in Japan. TSA also has a website (www.thesportsauthority.com) that is operated by Global Sports Interactive, Inc. (GSI) under a license and e-commerce agreement. The company’s goal is to serve its customers by providing extensive selections of brand name and private label sporting goods and athletic footwear and apparel in a customer-friendly environment. Its target customers are “everyday” athletes who value reliability, affordability, and variety. The company’s mission statement is as follows: “Through a commitment to a world class service culture, we equip everyone who wants to play with the right tools, information, and inspiration. We do this anytime, anywhere, and anyway we choose in order to generate optimal profits for our shareholders.” By 1990, TSA had grown to nine stores, at which point it was acquired by discount retailer Kmart. Under Kmart’s aegis, TSA pursued an aggressive growth strategy and, by January 1994, TSA’s annual sales had grown to $606.9 million with 80 store locations. In November 1994, TSA floated its stock through an initial public offering, and Kmart subsequently spun off its remaining stake in TSA through a secondary offering in 1995. TSA’s management continued to push for rapid expansion as an independent company. By the end of the fiscal year 1998, TSA operated 226 stores with $1.6 billion in sales. However, it suffered a net loss of $62.8 million ($2.01 per share) and a comp stores sales decline of 3.7%. In September 1998, TSA hired Marty Hanaka—who had never overseen a turnaround—as CEO. TSA’s Product Offering TSA’s merchandising strategy is focused on brand name products and an assortment of private label offerings. TSA purchases its merchandise from 650 vendors, 2 As of November 2002

Retailing The Sports Authority Case
Copyright © Trustees of Columbia University in the City of New York For permission contact [email protected] 212-854-7173
3
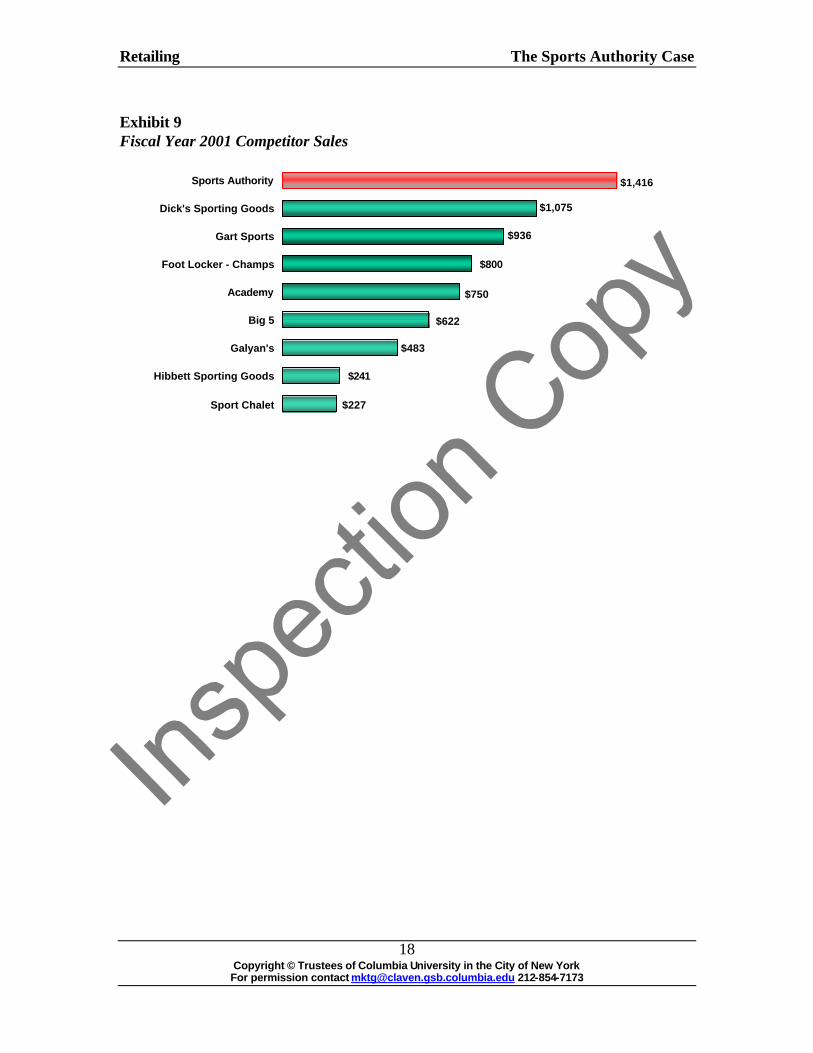
and its product mix includes the following top national brands: Nike, Adidas, New Balance, Reebok, Champion, Columbia, and Russell. Recent additions include Skechers, Birkenstock, Merrell, Diamondback, GT, Oxygen, Greg Norman, Bag Boy, Pro Select, Salomon, Rossignol, and Everlast. TSA relies heavily upon its private label brands, including Head (a well-known brand that is sold exclusively at TSA), Ocean Ridge, Parkside, Northpoint, Golf Day, Estero, ProV2, Masse, Woodbridge, and TSA. TSA is particularly strong in several hardline product categories including fitness, water sports (water ski’s, wave boards, etc.), tennis, and bicycles. Gross margins vary dramatically in hardlines, ranging from 60% for fitness equipment to 20-25% for fishing gear.3 The company has an 8% market share in rackets and tennis accessories, making it the dominant player in this category. In bicycles, the company has seen a better selection from its largest vendors and acquired the distribution rights for the best-selling offerings of GT Bikes and Diamondback bicycles. Golf equipment is the other hardline expansion opportunity for the company. TSA is enhancing its golf department by leveraging its Golf Day concept and expanding dedicated floor space from 1,200 to 2,000 square feet. The company acquired the Golf Day trademark from a former specialty retailer known for its premium golf products. Today, golf equipment represents approximately 5% of TSA’s sales. Competition and Marketplace According to the National Sporting Goods Association, total retail sales of sporting goods, athletic footwear, and apparel were approximately $75 billion for the fiscal year 2000. Annual growth in the category is about 2% to 3%. The sporting goods industry is tremendously fragmented, with the top two players in the space accounting for just 3.3% of the sector’s revenues (Exhibit 8). TSA is followed in sales by Dick’s Sporting Goods ($1.07 billion in sales for FY 2001), Gart Sports ($936 million), Foot Locker-Champs ($800 million) and Eastbay (Exhibit 9). While men are still the primary target for sporting goods retailers, demographic trends show that women and children are participating more and more in athletics and are therefore growing in importance to these retailers (See Exhibit 10 for a competitive profile). The retail sporting goods industry—characterized by vendor consolidation, intense competition among retailers, and growing competition from new channels like catalogs and e-commerce—can be segmented as follows: Traditional sporting goods retailers: These operators typically own stores ranging from 5,000 to 20,000 square feet. They are often located in shopping malls or strip centers and carry limited quantities of higher-priced SKU’s. Examples include Champs, Hibbett Sporting Goods, and Modell’s.
3 Morgan Keegan equity research, April 25th, 2002
Retailing The Sports Authority Case
Copyright © Trustees of Columbia University in the City of New York For permission contact [email protected] 212-854-7173
4
Specialty sporting goods retailers: This category includes specialty shops from 1,000 to 10,000 square feet in size. They are often located in malls, strip centers, and pro shops. Typically these retailers carry a wide assortment of one primary product category (e.g. golf equipment or athletic footwear). Examples include The Athlete’s Foot, West Marine, and Edwin Watts. Large format sporting goods retailers: Large format stores like TSA’s generally range in size from 30,000 to 70,000 square feet. They offer a broad selection of merchandise and tend to be either free-standing locations or anchor stores in strip malls. Large format specialty operators such as REI, a national retailer of high quality outdoor gear and clothing, compete with these sporting good retailers in certain product categories. Examples of large format stores include TSA, Academy Sports, Galyan’s, Gart Sports, Dick’s, and Oshman’s. Mass merchandisers: These stores (Wal-Mart, Kmart, and Target) range in size from 50,000 to 200,000 square feet, but typically devote only a relatively small portion of this space to sporting goods. Located in strip centers or in freestanding locations, mass merchandisers do not offer the selection and service that sporting good retailers provide and typically only compete at the low end of the price spectrum. Hanaka was concerned about the impact of these retailers:
We’ve had a lot of new competition come into the market. As we look at the world, it’s not just big box sporting goods people. The dynamic in sporting goods is that discounters play an enormous role in certain categories. If you look at Wal-Mart’s growth, Target’s growth, or even Kmart’s growth up to its bankruptcy, you saw that they were adding 400-500 discount stores per year—many overlapping with TSA store locations. They eat away at numbers of categories. In certain categories they have unit market shares in the 40-50% range. So, as goods go through the product life cycle and become more commodity related versus new technology related, these discounters have taken a lot of share. And it’s not because they have a better brand selection or better assortment, but because customers are there. People are in their stores shopping. - Martin Hanaka
Other retailers: A large variety of other retailers offer sporting goods—typically athletic footwear and apparel—as part of their product mix. TSA Prior to Hanaka’s Arrival
During TSA’s period of rapid growth from 1995 to 1998, the company initially experienced accelerating comparable store sales growth. At the same time, TSA experienced lower gross margins, higher occupancy costs, and higher levels of SG&A costs. The primary reason for increased SG&A costs was pre-opening expenses for new stores. (Pre-opening expenses consist principally of store payroll expenses for associate
Retailing The Sports Authority Case
Copyright © Trustees of Columbia University in the City of New York For permission contact [email protected] 212-854-7173
5
training and store preparation prior to a store opening, as well as advertising expenditures for the new store).
Another problematic area was declining comparable store sales related to poor
sales performance in key product categories such as footwear and fitness. Stores also had to address aged inventory through clearance sales, and improve in-stock positions as well as merchandise mix. One contributor to TSA’s stock outs was the challenging transition from direct store distribution to regional flow-thru centers. The company’s objective was to generate substantial operating efficiencies and cost savings in the future. However, productivity and allocation problems arose in 1998 when a new regional distribution center (DC) began receiving merchandise from all vendors to distribute to 90 stores. These problems contributed to sales declines since locations did not have sufficient supplies of product available for customers.
In January 1998, when Marty Hanaka was hired to manage TSA, the company
was paying for its lack of attention to the bottom line. As the new CEO recalled, “TSA was focused on shotgun growth, not profitable growth.” The reason behind TSA’s emphasis on growth was to please Wall Street analysts. The damage in 1998 included net losses of $63.8 million and same-store growth declines of 3.7% despite an increase in the store base. Furthermore, TSA began to take restructuring charges and provisions related to store closings. The company had financed its expansion up to that point with a credit facility, the issuance of convertible subordinated notes, and various operating leases. The increased financial leverage further exposed TSA to financial pressures due to declining performance. Overall, the company needed to address its declining growth and falling operating and net income.
The company’s troubles reached a low point when, in May 1998, TSA entered
into an agreement to merge with Venator (formerly Woolworth, owner of the Foot Locker and Champs Sports stores). However, the deal was shelved in September of the same year due to both companies’ underperforming stock prices. Even TSA rival Gart Sports made an offer to combine with TSA in July 1998. However, the board of TSA rejected the deal—even though it would have received 51% of the combined company—citing high financibility, financial leverage and challenging integration issues.
Marty Hanaka After graduating from Cornell University, Marty Hanaka joined Sears where he held 18 positions over a span of 20 years while working his way up to Vice President of Operations for Sears Brand Central, a prominent division representing all appliances, electronics and home office merchandise. After participating in 64 full day, offsite, senior team meetings in eight months, he became disillusioned with the company leadership, citing that it felt like a “deliberative body, not a business.” Hanaka left Sears in 1992 to head the marketing division of Lechmere, Inc, a major northeastern electronics and hardgoods discount retailer. Shortly thereafter he was appointed president and COO, but in 1994 he left Lechmere to serve as president and COO of Staples, Inc. Later, he left Staples and was appointed CEO of TSA in September 1998.

Retailing The Sports Authority Case
Copyright © Trustees of Columbia University in the City of New York For permission contact [email protected] 212-854-7173
6
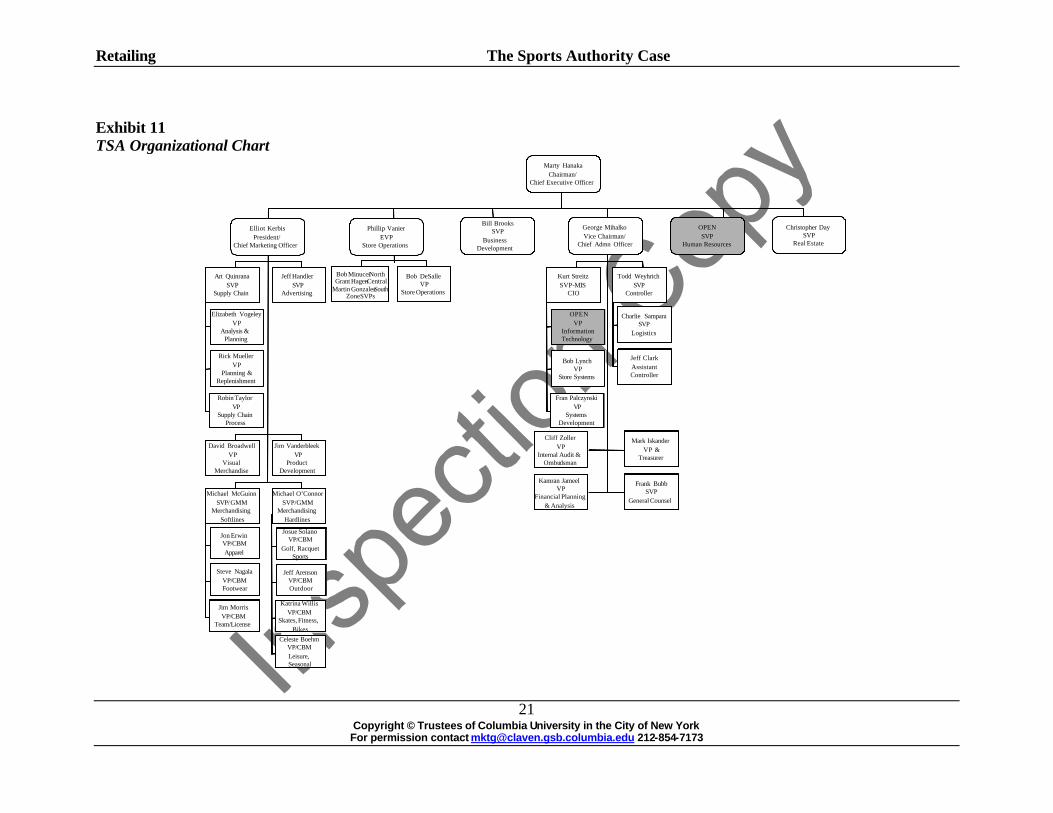
Hanaka as CEO The new CEO took immediate turnaround actions to put TSA back on a path toward profitability. He had to develop a realistic business plan to improve operations and cash flow with a minimal budget. At the same time, he had to focus TSA on paying down debt, improving store operations, merchandise assortments, information systems, customer service, and maintaining employee morale. He replaced 14 of the company’s 17 senior managers from 1998-2000 with a diverse group of new managers who had strong general retail experience. These new managers had worked for some of the most renowned retailers in the United States, including Pier 1 Imports, Office Depot, Macy’s, Federated Department Stores, and Saks (See Exhibit 11 for TSA’s organizational chart).
Hanaka also had to streamline some stores and put a stop to indiscriminate store
growth; he closed 28 stores, and added just eight stores from 2000 to 2001 (Exhibit 12). The store closures necessitated a $39 million restructuring charge in 1998 and an $88 million asset impairment charge in 1999. During TSA’s rapid expansion, many of its new stores were opened in markets where no prior TSA stores existed. Hanaka preferred to “backfill” markets in order to achieve significant market penetration through multi-store markets with economic leverage from shared distribution infrastructure and marketing expenses. He felt that this strategy was a more efficient use of TSA resources and would also strengthen the company’s presence in existing markets.
Also, in the first quarter of 1999, Hanaka changed TSA’s pricing policy from
“everyday fair”–neither High-Low nor EDLP–to High-Low in an effort to position TSA away from damaging head to head competition with mass merchandisers. He believed that TSA’s old strategy of everyday fair pricing “was neither fish nor fowl,” and thus had to be changed. In addition to curbing cash outflows, he had to raise cash in order to relieve some of TSA’s debt burden. He sold a large stake in TSA’s Japanese joint venture to raise this cash, and by the end of FY01, the company had reduced its total debt by $70 million.
Due to the company’s weak cash position, Hanaka choose to implement TSA’s e-
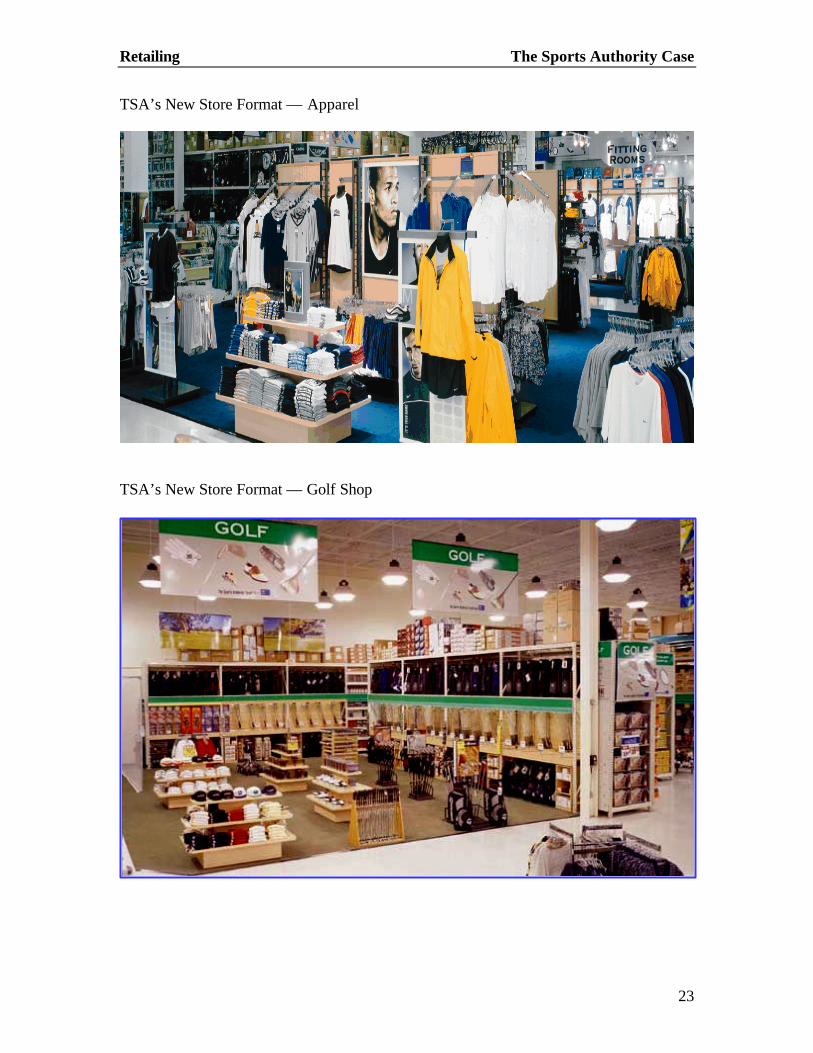
commerce initiative through a joint venture with GSI. While the Internet sales platform was important to Hanaka, he could not deploy an internal development strategy that would burn through cash. As a result, TSA retained a 19.9% equity stake in the joint venture, which generated $3,178,000 in royalties in 2001. Hanaka and his management team also began work on an improved store format that would move TSA away from a warehouse look and feel. The new format featured specialty “stores within a store” including full-service footwear departments, improved selections of fast-moving products, and the relocation of some departments for higher visibility. The new layout created improved product adjacencies that substantially aided

Retailing The Sports Authority Case
Copyright © Trustees of Columbia University in the City of New York For permission contact [email protected] 212-854-7173
7
cross-merchandise selling within and across each sports category. For example, TSA found that customers interested in the typically low-margin fishing category often cross-shopped in the high margin golf category if the departments were nearby. Hanaka was a huge proponent of the new stores and offered this opinion of the initiative: We really believe it is a good use of our capital, and we don’t have a choice. We have to do it. The stores just aren’t competitive unless we change. We’re going to keep losing customers because they’re going to go elsewhere to find other, more attractive environments and options. The new stores were also equipped with contemporary fixtures, better signage, and new power graphics (Exhibit 13). In addition to raising store productivity, management expected that the new format would enhance customer recognition of the TSA brand. The new store was also designed to provide greater in-store comfort to the increasingly important female consumer. For example, fitting rooms were installed on the apparel floor and the hunting category was moved away from the departments most visited by female customers. Finally, the more attractive store format allowed TSA to attain better product allocations of more fashionable higher-end products such as technical Nike footwear. As a result of its remodeling efforts, management witnessed an incremental 3-5% increase in sales in the first full year after a store had been remodeled compared to a similar set of older stores (See Exhibit 14 for remodel projections ). Of course, the new store look had to be accompanied by superior customer service to truly distinguish TSA from the other big-box competitors. To achieve higher levels of customer service, the company implemented training and certification programs to make sales associates more knowledgeable of the merchandise. Hanaka also refined hiring practices in such a way that TSA could look for employees who were “customer centric sports enthusiasts.” He also changed the company incentive plan to reflect customer service goals. Under the new system, 25% of all store managers’ bonuses were tied to a newly developed “customer perception index.” TSA measured customer satisfaction through the use of in-store comment cards, letters to store managers and corporate headquarters (positive letters counted five times as much as negative letters), and mystery shoppers. The target for each associate was five out of a possible six on the customer perception index. Hanaka drew upon his prior experiences at Staples and Lechmere by transforming the traditional buyer position into a category business manager (CBM). Each CBM was given responsibility for a merchandise category; responsibilities included overseeing purchasing, allocation, marketing, logistics, and replenishment. The CBM’s had responsibility for more than just the sales and margins on the merchandise they oversaw; they had substantial control over the total selling and profitability of specific categories. The CBM’s were compensated based on targets such as sales, margin, payroll, turnover, and shrink. The CBM’s reported to one of two general merchandising managers, who in turn reported to the president. New management added merchandise categories such as “Camping” and “Wheels” that were designed to attract both senior and younger shoppers. It also expanded the assortment of team sports items, such as basketballs and baseball

Retailing The Sports Authority Case
Copyright © Trustees of Columbia University in the City of New York For permission contact [email protected] 212-854-7173
8
bats. In addition, Hanaka and his team worked tirelessly to establish deep relationships across vertical categories with power brands like Adidas. Moreover, he worked to lower pricing on much of TSA’s merchandise. Specifically, he expanded the company’s private label offering, which represented a 30-35% saving over branded products. The improved economics that private label products provided gave TSA the choice to either pass the savings along to consumers or improve its overall margins. Perhaps the most sweeping change that Hanaka implemented involved TSA’s relationship with its suppliers. Under the new system, suppliers had to effectively “bid” for TSA’s shelf space. Elliot Kerbis, President and Chief Marketing Officer led this process. For example, TSA management would invite its suppliers in a specific category to an offsite location. It specified what products, price points, and terms it wanted for its stores. Anxious suppliers, who knew that their competitors were next door sharpening their pencils, would then proceed to make their best offer. This process continued for all of the attending suppliers until TSA had reached a decision about which suppliers would provide merchandise, what percentage of shelf space they would receive, etc. Despite the competitive nature of the bidding process, it was rare for TSA to go with just one supplier in any given category. Finally, TSA invested $40 million to upgrade its warehouse, merchandising, and allocation systems. The new system allowed TSA to allocate merchandise on a store-by-store basis as determined by the store’s prior sales trends, store-specific geographical and seasonal factors, and floor space. The management team also worked to improve efficiencies by opening a new 400,000-500,000 square foot distribution center, with optional hauling patterns, in the Northeast that would service 105 stores (Exhibit 15). This new facility would be costly but, they thought, would ease the pressure on the company’s primary flow thru center in Georgia, which would than be able to add reserve storage. Moreover, the new center would enable TSA to better service all stores – including DSD stores (direct store delivery) - that were a great distance from existing distribution centers.
By 2001, Hanaka and his team had returned TSA to profitability with nearly $1.5 billion in sales and $25 million in net income. They successfully accomplished the CEO’s first goal of taking TSA from restructuring to profitability. Strategic Options
One of Hanaka’s challenges was how to continue investing in the business as the company had emerged from survival mode and needed to strengthen its growth prospects. As part of this effort, TSA instituted a disciplined capital program to ensure improvements in existing stores and growth of TSA’s presence in its existing markets. In order to qualify for consideration, any project was required to meet a 15% internal hurdle rate. TSA’s priorities included continuing the successful store remodeling program, backfilling existing, contiguous markets, and rolling out smaller stores in targeted areas.

Retailing The Sports Authority Case
Copyright © Trustees of Columbia University in the City of New York For permission contact [email protected] 212-854-7173
9
For TSA, the primary way to reach its expansion goals was to increase its presence in existing markets. By increasing store concentration within a geographic territory (backfilling), TSA could increase its utilization of existing resources such as distribution centers and advertising expenditures. Backfilling was an efficient strategy that would increase the density of TSA’s networks. Furthermore, by spreading out costs over a larger, regional base, the new stores could break even more quickly. However, backfilling took time, and Hanaka knew that many on Wall Street would prefer to see TSA expand into new markets rather than build up old ones.
An additional twist to backfilling existing markets was the possibility of
establishing smaller store formats to serve smaller markets. Hanaka knew that the smaller stores could provide streamlined selections of TSA’s better-selling merchandise and could help increase the TSA national footprint without the massive investments in large-format stores. However, some of TSA’s top managers were concerned that smaller stores might damage the company’s reputation as a one-stop shop for sporting goods if customers could not find items they expected to find in other TSA locations. Yet, the appeal of new store formats was the ability to move beyond the somewhat myopic one-size-fits-all approach TSA had used in the past.
There were also other ideas for growth that were being explored. For example,
there could be opportunities to expand the store-within-a store concept to other vendors such as General Nutrition Company (GNC) to sell nutritional supplements at TSA. Adding other stores and new product offerings could expand TSA’s product mix and make it more of a destination store for its customers. Still, Hanaka was not sure if these benefits justified the loss of square footage that would be available to other TSA merchandise.
Another opportunity could be the broadening of assortments to include beachwear
and water sports equipment near busy beaches; Hanaka thought about giving his marketing department the new project idea for a Beach Authority. “Who knows,” he thought, “maybe TSA could expand into other areas like school campuses – perhaps a Campus Authority?” Challenges and Opportunities
Marty Hanaka sat back and wondered about the recent market competition. The stocks of all sporting goods retailers were under pressure. Wall Street was reacting negatively to the large amount of money available to the sporting goods retailing sector. Two recent IPO’s had provided two of TSA’s rivals with expansion funds and a public currency. In addition, TSA had canceled a $90 million secondary stock offering in the summer of 2002 that would have provided valuable capital for expansion because of its low stock price (Exhibit 16). Due to the cancellation of the public offering, TSA would have to rely upon cash flows to finance growth and reinvestment.
Despite TSA’s position as the largest chain of sporting goods retailers, Marty
Hanaka worried about his aggressive competitors. TSA had to be judicious about its use

Retailing The Sports Authority Case
Copyright © Trustees of Columbia University in the City of New York For permission contact [email protected] 212-854-7173
10
of funds, but further investments in brand differentiation were going to be increasingly important. Hanaka contended that he would need to put more emphasis on marketing in order to make sure that customers would be increasingly drawn to TSA stores: What we have is brand awareness because we have multiple locations, we
are in the newspaper all the time, and people shop us and spread word of mouth. But we need to do a much better job of building our brand. We are not selling sporting goods; we are selling access to fun. We want our message to consumers to be “Get out and play.” At the end of the day, the question is if customers will shop you versus someone else. We think that, in a world where we all have the same brands and similar prices, it’s going to come down to in-store experience and service to generate word of mouth.
His concern was legitimized by TSA’s research, which indicated that most consumers viewed full- line sporting good retailers as virtually identical; consumers would rarely pass by other big-box retailers in favor of TSA. The balance between smart spending and fending off competitors was certainly a tenuous one.
Another of Hanaka’s concerns was that most of the easy changes had already
been made. TSA had already successfully strengthened its product offering in terms of fitness and value-priced apparel. However, was the optimal strategy to continue targeting only “everyday” athletes, or should TSA slowly move into higher end sporting goods for more demanding sports enthusiasts? Was the inventory risk worth it, and could TSA manage the old customer perception that TSA was only a place for starter kits and fitness equipment?
TSA’s outsourced e-commerce effort had enabled the company to establish an
online presence and collect royalty payments from GSI. The benefit of this outsourcing agreement with a minority ownership stake was that it prevented the management distraction of maintaining the site and providing order fulfillment services. However, Hanaka had begun to notice that the TSA website had the same look and feel as many other sporting goods websites since GSI also provided its online technology to other stores. Was this something for him to worry about?
Finally, even if TSA could be successful with its gradual growth strategy, Hanaka
worried about consolidation amongst his competitors. Could TSA grow faster and maintain its top position by trying to acquire some of its smaller competitors? After the experiences of the past several years, he knew that his staff was seasoned enough to deal with managing change ; that would be vital to any acquisition integration. However, TSA stock as a currency was not yet at the level where acquisitions with stock were attractive. Meanwhile, TSA did not yet have the financial flexibility to pay for companies in cash. Hanaka understood that TSA had to continue performing in order to deliver on Wall Street’s demands for growth and/or consolidation, especially to counter the growing threat from discounters and strong regionals.
Retailing The Sports Authority Case
Copyright © Trustees of Columbia University in the City of New York For permission contact [email protected] 212-854-7173
11
Marty Hanaka knew that he would have to give serious thought to all of these options and eventually formulate a plan for his upcoming meeting with the Board of Directors. Right now, he had to set up an agenda for his Leadership Conference, and he didn’t even have a title for his opening address. What would rally his troops and prep them for another challenging year? Over the past four years, TSA had successfully restored its stability and ensured survival. But now was the time for something more. “Ah,” Hanaka thought as began typing the title of his speech, “I’ve got it.” Playing to Win: From Profitability to Focused Growth.

Retailing The Sports Authority Case
Copyright © Trustees of Columbia University in the City of New York For permission contact [email protected] 212-854-7173
12
Exhibit 1 5-Year Financial Overview
February 2, February 3, January 29 January 24, January 25,2002 2001 2000 1999 1998
Statement of Operations Data: ($000s)Sales $ 1,415,552 $ 1,485,839 $ 1,492,860 $ 1,599,660 $ 1,464,565 Gross margin 386,799 395,761 360,564 390,959 419,537 License fee income 3,446 2,748 1,829 841 3,345 Selling, general and administrative expenses 360,788 366,092 394,963 410,730 365,363 Pre-opening expense 5 2,131 1,609 11,194 10,570 Goodwill amortization - - 1,963 1,963 1,963 Store exit costs 5,553 2,763 8,861 39,446 4,302 Corporate restructuring 800 - (700) 3,930 - Impairment of long-lived assets - - 88,751 13,457 - Operating income (loss) 23,099 27,523 (133,054) (88,920) 40,684
Interest, net (13,332) (20,744) (15,287) (11,965) (5,952)Gain on sale of securities 2,538 - - - - Gain on deconsolidation of joint venture - - 5,001 - - Income (loss) before income taxes, extraordinary 12,305 6,779 (143,340) (100,885) 34,732 Income tax expense (benefit) - - 22,721 (35,028) 14,730 Minority interest - - - (2,066) (2,191)Income (loss) before extraordinary gain and 12,305 6,779 (166,061) (63,791) 22,193 Extraordinary gain, net of tax 548 18,647 5,517 - - Cumulative effect of accounting change (503) - - - - Net income (loss) $ 12,350 $ 25,426 $ (160,544) $ (63,791) $ 22,193
Percent of Sales Data:Gross margin 27.3% 26.6% 24.2% 24.4% 28.6%Selling, general and administrative expenses 25.5% 24.6% 26.5% 25.7% 24.9%Operating income (loss) 1.6% 1.9% -8.9% -5.6% 2.8%Income (loss) before income taxes, extraordinary 0.9% 0.5% -9.6% -6.3% 2.4%
Source: Company Form 10-K dated April 17, 2002.(1) The fiscal years ended February 3, 2001 and January 29, 2000 consisted of 53 weeks. All other fiscal years shown each consisted of 52 weeks.
Fiscal Year Ended (1)
Exhibit 2 5-Year Summary Statistics

Retailing The Sports Authority Case
Copyright © Trustees of Columbia University in the City of New York For permission contact [email protected] 212-854-7173
13
February 2, February 3, January 29 January 24, January 25,2002 2001 2000 1999 1998
Selected Financial and Operating Data:Stores at end of period 198 198 203 226 199 Comparable store sales change (2) -3.0% 1.5% -3.4% -3.7% -2.2%Inventory turnover 2.7 2.8 2.9 3.1 3.1 Weighted average sales per square foot $165 $175 $172 $177 $193
Weighted average sales per store (3) ($000s) 7,152 7,440 7,282 7,661 8,334 Average sale per transaction 46.03 47.68 45.67 46.53 46.54 End of period inventory net of accounts payable per store ($000s) 1,274 1,495 1,250 831 900 Capital expenditures ($000s) 20,486 35,879 31,640 84,561 114,271 Depreciation and amortization ($000s) 41,663 40,840 46,908 47,921 37,314
Balance Sheet Data - End of Period: ($000s)Working capital (4) $188,738 $160,200 $62,102 $30,545 $99,710 Total assets 601,157 662,547 643,003 897,454 807,990 Long-term debt 179,333 205,100 126,029 173,248 157,439 Stockholders' equity 155,123 142,317 116,110 272,912 333,551
Source: Company Form 10-K dated April 17, 2002.(1) The fiscal years ended February 3, 2001 and January 29, 2000 consisted of 53 weeks. All other fiscal years shown each consisted of 52 weeks.(2) Reflects comparabale store sales, excluding sales from stores closed in the respective fiscal years.(3) For fiscal 2000 and 1999, sales per store have been adjusted to reflect a comparable 52 week period.(4) The higher level of working capital in 2000 and 2001 reflect the reclassification of borrowings under the company's revolving credit facility from
short-term to long-term based on an amendment to the facility in August 2000.
Fiscal Year Ended (1)
Retailing The Sports Authority Case
Copyright © Trustees of Columbia University in the City of New York For permission contact [email protected] 212-854-7173
14
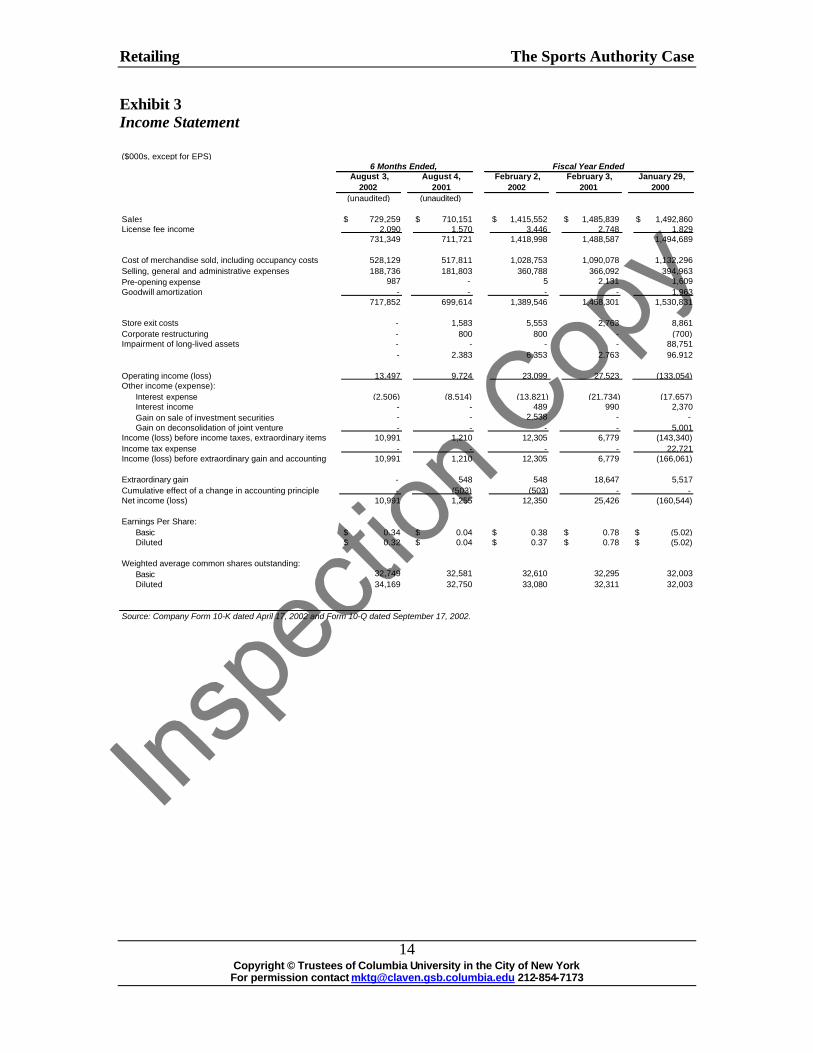
Exhibit 3 Income Statement ($000s, except for EPS)
August 3, August 4, February 2, February 3, January 29,2002 2001 2002 2001 2000
(unaudited) (unaudited)
Sales $ 729,259 $ 710,151 $ 1,415,552 $ 1,485,839 $ 1,492,860 License fee income 2,090 1,570 3,446 2,748 1,829
731,349 711,721 1,418,998 1,488,587 1,494,689
Cost of merchandise sold, including occupancy costs 528,129 517,811 1,028,753 1,090,078 1,132,296 Selling, general and administrative expenses 188,736 181,803 360,788 366,092 394,963 Pre-opening expense 987 - 5 2,131 1,609 Goodwill amortization - - - - 1,963
717,852 699,614 1,389,546 1,458,301 1,530,831
Store exit costs - 1,583 5,553 2,763 8,861 Corporate restructuring - 800 800 - (700)Impairment of long-lived assets - - - - 88,751
- 2,383 6,353 2,763 96,912
Operating income (loss) 13,497 9,724 23,099 27,523 (133,054)Other income (expense):
Interest expense (2,506) (8,514) (13,821) (21,734) (17,657)Interest income - - 489 990 2,370 Gain on sale of investment securities - - 2,538 - - Gain on deconsolidation of joint venture - - - - 5,001
Income (loss) before income taxes, extraordinary items 10,991 1,210 12,305 6,779 (143,340)Income tax expense - - - - 22,721 Income (loss) before extraordinary gain and accounting 10,991 1,210 12,305 6,779 (166,061)
Extraordinary gain - 548 548 18,647 5,517 Cumulative effect of a change in accounting principle - (503) (503) - - Net income (loss) 10,991 1,255 12,350 25,426 (160,544)
Earnings Per Share:Basic $ 0.34 $ 0.04 $ 0.38 $ 0.78 $ (5.02)Diluted $ 0.32 $ 0.04 $ 0.37 $ 0.78 $ (5.02)
Weighted average common shares outstanding:Basic 32,749 32,581 32,610 32,295 32,003 Diluted 34,169 32,750 33,080 32,311 32,003
Source: Company Form 10-K dated April 17, 2002 and Form 10-Q dated September 17, 2002.
6 Months Ended, Fiscal Year Ended

Retailing The Sports Authority Case
Copyright © Trustees of Columbia University in the City of New York For permission contact [email protected] 212-854-7173
15
Exhibit 4 Balance Sheet ($000s)
August 3, February 2, February 3,2002 2002 2001
(unaudited)AssetsCurrent Assets:
Cash and cash equivalents $ 9,387 $ 8,028 $ 7,535 Merchandise inventories 372,900 358,119 393,087 Receivables and other current assets 43,327 45,522 32,690
Total current assets 425,614 411,669 433,312 Net property and equipment 142,038 150,451 212,991 Other assets and deferred charges 38,292 39,037 16,244
Total Assets $ 605,944 $ 601,157 $ 662,547
Liabilities and Stockholders' EquityCurrent Liabilities:
Accounts payable - trade $ 124,775 $ 105,906 $ 97,097 Accrued payroll and other current liabilities 97,047 100,686 114,990 Current debt 622 999 45,756 Taxes other than income taxes 13,926 10,372 10,380 Income taxes 3,257 4,968 4,889
Total current liabilities 239,627 222,931 273,112
Long-term debt 156,329 179,333 205,100 Other long-term liabilities 43,051 43,770 42,018
Total liabilities 439,007 446,034 520,230
Stockholders' Equity:Common stock, $.01 par value 329 327 324 Additional paid-in capital 253,776 253,044 252,279 Deferred compensation (279) (395) (83)Accumulated deficit (86,342) (97,333) (109,683)Treasury stock (547) (520) (520)
Total stockholders' equity 166,937 155,123 142,317 Total Liabilities and Stockholders' Equity $ 605,944 $ 601,157 $ 662,547
Source: Company Form 10-K dated April 17, 2002 and Form 10-Q dated September 17, 2002.

Retailing The Sports Authority Case
Copyright © Trustees of Columbia University in the City of New York For permission contact [email protected] 212-854-7173
16
Exhibit 5 TSA Seasonality of Sales
2001 2000 1999
First Quarter 24.0% 23.6% 23.9%Second Quarter 26.2% 26.0% 25.8%Third Quarter 21.5% 22.4% 21.9%Fourth Quarter 28.3% 28.0% 28.4%
100.0% 100.0% 100.0%
Fiscal Year
__________________________________________ Sources: Company Form 10-K dated April 17, 2002, Form 10-K dated May 4, 2001 and Form 10-K dated April 23, 1999.
Exhibit 6 TSA Store Locations
The Sports Authority’s Stores (204 in 33 states)
Corporate Headquarters, Fort Lauderdale, FL
3
2
9
8
1
1
2
5
1
1
1 13
42
3
75
10
6
13
1
1
15 1
72 5
17
11
151
3
1
The Sports Authority’s Stores (204 in 33 states)
Corporate Headquarters, Fort Lauderdale, FL
3
2
9
8
1
1
2
5
1
1
1 13
42
3
75
10
6
13
1
1
15 1
72 5
17
11
151
3
1
Retailing The Sports Authority Case
Copyright © Trustees of Columbia University in the City of New York For permission contact [email protected] 212-854-7173
17
Exhibit 7 2001 Merchandise Mix versus Competitors
The Sports Authority Gart Sports
Dick's Sporting Goods
Hardlines: 51.0% 51.6% 61.0%
Softlines:Apparel 22.0% 25.5% 19.0%Footwear 27.0% 22.9% 20.0%
100.0% 100.0% 100.0% ___________________________ Sources: Company Form 10-K dated April 17, 2002, Gart Sports Co. Form 10-K dated April 19, 2002 and Dick ’s Sporting Goods Registration Statement (Form 424B4) dated October 16, 2002. Exhibit 8 Combined Market Share of Top 2 Retailers by Industry
40.6%
30.6%
22.6%
14.8%
3.3%
Books Electronics OfficeSupplies
HomeImprovement
SportingGoods
Retailing The Sports Authority Case
Copyright © Trustees of Columbia University in the City of New York For permission contact [email protected] 212-854-7173
18
Exhibit 9 Fiscal Year 2001 Competitor Sales
$227
$241
$483
$622
$750
$800
$936
$1,075
$1,416Sports Authority
Dick's Sporting Goods
Gart Sports
Foot Locker - Champs
Academy
Big 5
Galyan's
Hibbett Sporting Goods
Sport Chalet

Retailing The Sports Authority Case
Copyright © Trustees of Columbia University in the City of New York For permission contact [email protected] 212-854-7173
19
Exhibit 10 Competitor Profile Dick’s Sporting Goods, Inc.
• Started in 1948 by an 18-year-old as a modest bait and tackle shop in Binghamton, New York, Dick’s Sporting Goods’ is currently the second largest in terms of sales and the most profitable of the six largest, publicly traded, full- line sporting goods retailers. With 141 stores in 25 states, its mission is to be the #1 sports and fitness specialty retailer for all athletes and outdoor enthusiasts.
• Dick’s Sporting Goods operates two primary store prototypes of approximately 48,000 and 30,000 square feet carrying a wide variety of well-known brands (including Nike, Columbia, Adidas and Callaway) addressing the needs of sporting goods consumers from the beginner to the sport enthusiast. The company also sells performance-based products targeted to the sporting enthusiast for sale under brands such as Ativa, Walter Hagen, Stone Hill, Northeast Outfitters, PowerBolt, and DBX (available exclusively at its stores).
• Stores use the “store-within-a-store” concept to combine the convenience, broad assortment, and competitive prices of large format stores with the brand names, deep product selection, and customer service of a specialty store. Stores typically contain five stand alone specialty stores including: The Pro Shop (golf); The Footwear Center (high-performance athletic footwear); The Cycle Shop (cycling); The Sportsman’s Lodge (hunting, fishing and camping); Total Sports (seasonal sports equipment and athletic apparel). These specialty departments provide an interactive environment such as allowing customers to test golf clubs in an indoor driving range, shoot bows in the archery range, or run and rollerblade on the footwear track.
• Dick’s provides a high degree of service through knowledgeable and trained customer service professionals. For example, the company has active members of the PGA working in stores and bike mechanics to sell and service bicycles. Stores also provide support services such as golf club grip replacement, bicycle repair and maintenance, and home delivery and assembly of fitness equipment.
Gart Sports Company
• Gart Sports, established in 1928 and headquartered in Denver, is the largest full-line sporting goods retailer in the Western United States. The company believes that its stores offer the widest selection of ski and snowboard merchandise in the Western United States. Gart Sports appeals to both the casual sporting goods customer and the sports enthusiast, operating in 180 stores in 25 states under the Gart Sports®, Sportmart® and Oshman's® names. The company operates several formats including superstores (typically between 30,000 to 45,000 square feet), 27 non-superstore freestanding and strip center stores (average 18,000 square feet), and 16 stores in enclosed shopping malls (average 15,000 square feet) carrying a selection of merchandise that appeals to the mall-oriented shopper with a focus on apparel and footwear. The company is currently undergoing a remodeling program intended to integrate its acquisitions.

Retailing The Sports Authority Case
Copyright © Trustees of Columbia University in the City of New York For permission contact [email protected] 212-854-7173
20
• The company offers a wide selection of high-quality, brand name apparel and equipment at competitive prices in categories such as Footwear, In- line Skates, General Apparel, Team Sports, Exercise and Outdoor Recreation, Golf, Tennis, Cycling, Water Sports Hunting, Fishing and Camping Apparel and Equipment. A sample list of vendors includes Adidas, Armour Golf, Asics, Bauer, Browning, Burton, Champion, Coleman, Columbia, Easton, Everlast, Head, K2, New Balance, Nike, The North Face, Rawlings, Reebok, Salomon, Slumberjack, Spalding, Spyder, Timberland, and Wilson.
• In addition, the Company offers its customers special services including special order capability, equipment rental, bicycle repair, demo ski programs, custom boot fitting, ski mounting, snowboard repair, ski lift tickets, and hunting and fishing licenses.
Champs Sports
• Champs Sports, part of Foot Locker, Inc. (formerly Venator Group), is a chain of approximately 574 stores (average 5,700 square feet) with sales of approximately $800 million, representing the fourth largest competitor in the sporting goods retailing sector.
• Champs Sports is the largest mall-based retailer of sporting goods in the United States and Canada.
• The company specializes in footwear, fitness apparel, and professional licensed apparel, with a narrow selection of equipment and accessories. The sports for which Champs provides merchandise include basketball, lacrosse, running, track & field/cross-country, baseball, softball, football, soccer, cross training, tennis, cheerleading, volleyball, hiking, walking, and wrestling.
Academy Sports & Outdoors
• Academy Sports was founded in 1938 as a military surplus shop and evolved into a full- line sporting goods store.
• With approximately $750 million in sales, Academy Sports is the fifth largest full- line sporting goods retailer in the U.S.
• Academy Sports operates over 60 stores in seven states, mostly in Texas. • The stores employ everyday low pricing to provide the sports and outdoors
enthusiast a broad selection of equipment, apparel, and footwear. • Among the services the company provides are boresighting, scope mounting,
hunting and fishing licenses, line spooling, propane exchange programs, racquetball, and tennis racquet restringing.
Retailing The Sports Authority Case
Copyright © Trustees of Columbia University in the City of New York For permission contact [email protected] 212-854-7173
21
Exhibit 11 TSA Organizational Chart
Marty Hanaka Chairman/
Chief Executive Officer
George Mihalko Vice Chairman/
Chief Admn Officer Phillip Vanier
EVP Store Operations
Elliot Kerbis President/
Chief Marketing Officer Bill Brooks
SVP Catalog &
Commercial Sales OPEN SVP
Human Resources Christopher Day
SVP Real Estate
Art Quinrana SVP
Supply Chain Elizabeth Vogeley
VP Analysis &
Planning Rick Mueller
VP Planning &
Replenishment Robin Taylor
VP Supply Chain
Process
Jeff Handler SVP
Advertising
David Broadwell VP
Visual Merchandise
Jim Vanderbleek VP
Product Development
Michael McGuinn SVP/GMM
Merchandising Softlines
Michael O’Connor SVP/GMM
Merchandising Hardlines
Jon Erwin VP/CBM Apparel
Steve Nagala VP/CBM Footwear
Jim Morris VP/CBM
Team/License
Bob Minucci - North Grant Hagen - Central
Martin Gonzalez - South Zone SVPs
Bob DeSalle VP
Store Operations
Josue Solano VP/CBM
Golf, Racquet Sports
Jeff Arenson VP/CBM Outdoor
Katrina Willis VP/CBM
Skates, Fitness, Bikes
Celeste Boehm VP/CBM Leisure, Seasonal
Kurt Streitz SVP - MIS
CIO Todd Weyhrich
SVP Controller
OPEN VP
Information Technology Bob Lynch
VP Store Systems
Fran Palczynski VP
Systems Development
Charlie Sampara SVP
Logistics
Jeff Clark Assistant Controller
Cliff Zoller VP
Internal Audit & Ombudsman
Mark Iskander VP &
Treasurer Kamran Jameel
VP Financial Planning
& Analysis Frank Bubb
SVP General Counsel
Marty Hanaka Chairman/
Chief Executive Officer
George Mihalko Vice Chairman/
Chief Admn Officer Phillip Vanier
EVP Store Operations
Elliot Kerbis President/
Chief Marketing Officer Bill Brooks
SVP Business
Development
OPEN SVP
Human Resources Christopher Day
SVP Real Estate
Art Quinrana SVP
Supply Chain Elizabeth Vogeley
VP Analysis &
Planning Rick Mueller
VP Planning &
Replenishment Robin Taylor
VP Supply Chain
Process
Jeff Handler SVP
Advertising
David Broadwell VP
Visual Merchandise
Jim Vanderbleek VP
Product Development
Michael McGuinn SVP/GMM
Merchandising Softlines
Michael O’Connor SVP/GMM
Merchandising Hardlines
Jon Erwin VP/CBM Apparel
Steve Nagala VP/CBM Footwear
Jim Morris VP/CBM
Team/License
Bob Minucci - North Grant Hagen - Central
Martin Gonzalez - South Zone SVPs
Bob DeSalle VP
Store Operations
Josue Solano VP/CBM
Golf, Racquet Sports
Jeff Arenson VP/CBM Outdoor
Katrina Willis VP/CBM
Skates, Fitness, Bikes
Celeste Boehm VP/CBM Leisure, Seasonal
Kurt Streitz SVP - MIS
CIO Todd Weyhrich
SVP Controller
OPEN VP
Information Technology Bob Lynch
VP Store Systems
Fran Palczynski VP
Systems Development
Charlie Sampara SVP
Logistics
Jeff Clark Assistant Controller
Cliff Zoller VP
Internal Audit & Ombudsman
Mark Iskander VP &
Treasurer Kamran Jameel
VP Financial Planning
& Analysis Frank Bubb
SVP General Counsel

Exhibit 12 Store Openings/Closings
6 MonthsEnded
August 2, February 2, February 3, January 29,2002 2002 2001 2000
Beginning number of stores 198 198 201 226 Openings 6 - 5 3 Closings - - (8) (15)Deconsolidation of joint venture - - - (13)Ending number of stores 204 198 198 201
Fiscal Year Ended
Exhibit 13 Store Remodels TSA’s New Store Format — Footwear
Retailing The Sports Authority Case
23
TSA’s New Store Format — Apparel TSA’s New Store Format — Golf Shop

Retailing The Sports Authority Case
24
TSA’s New Store Format — Bike Shop
Exhibit 14 Percent of Store Base & Cumulative Stores in New Format
2% 5%9%
26%
49%
70%
88%
'99 '00 '01 '02E '03E '04E '05E
Targeted:Remodels 0 1 8 30 40 40 40
New Stores 3 5 0 6 12 15 15
215
160
105
53
1793
2% 5%9%
26%
49%
70%
88%
'99 '00 '01 '02E '03E '04E '05E
Targeted:Remodels 0 1 8 30 40 40 40
New Stores 3 5 0 6 12 15 15
215
160
105
53
1793

Retailing The Sports Authority Case
25
Exhibit 15 Supply Chain Redesign Exhibit 16 Three Year Stock Performance
$0.00
$2.00
$4.00
$6.00
$8.00
$10.00
$12.00
$14.00
$16.00
Oct
Dec
Feb
Apr Jun
Aug
Oct
Dec
Feb
Apr Jun
Aug
Oct
Dec
Feb
Apr Jun
Aug
Oct
-100%
0%
100%
200%
300%
400%
500%
600% TSA Stock Price
S&P Performance
Atlanta, GA150 to 75 Stores
Chino, CA
25 Stores
Existing Distribution Centers (DC)
New DC - FY ‘03
Northeast0 to 105 Stores
Atlanta, GA150 to 75 Stores
Chino, CA
25 Stores
Existing Distribution Centers (DC)
New DC - FY ‘03
Northeast0 to 105 Stores