the stack market - energyprospectus.com · the stack market presented by: ... - developed inside of...
TRANSCRIPT

Permits Completions Proppant Additives Production Forecasting
The STACK Market Presented by: Molly Swift, NavPort Data Analyst

What We Do
‘Born’ out of the industry
(and taking it by storm)
- Developed inside of a proppant company
- Industry association leveraged to obtain proprietary data
- Most granular completion data in the industry
- Built on a state-of-the-art technology platform (customizable, flexible, integrated)

Data Like You’ve Never Seen
110+ public & private data
sources
DATA
ENGINE
• Data updated DAILY • Unprecedented links between completion and production information
• Patent-pending production allocation model • Proprietary fields (frac job type, proppant per lateral foot, etc.)
UNIQUE to NavPort !
AGGREGATED
ANALYTICS

Who Needs NavPort Owners/Operators ■ Well Service Providers ■ Investment Professionals ■ Transload/Transportation ■ Proppant/Additive Suppliers ■ Other Oilfield
Services

Analyze & Export How YOU Want Flexible Dashboards – (all data is exportable!)

Well-Level Economics
Analyze & Export How YOU Want DUC Data
Decline Curves, by Top Operator Integrated Mapping

The STACK Market
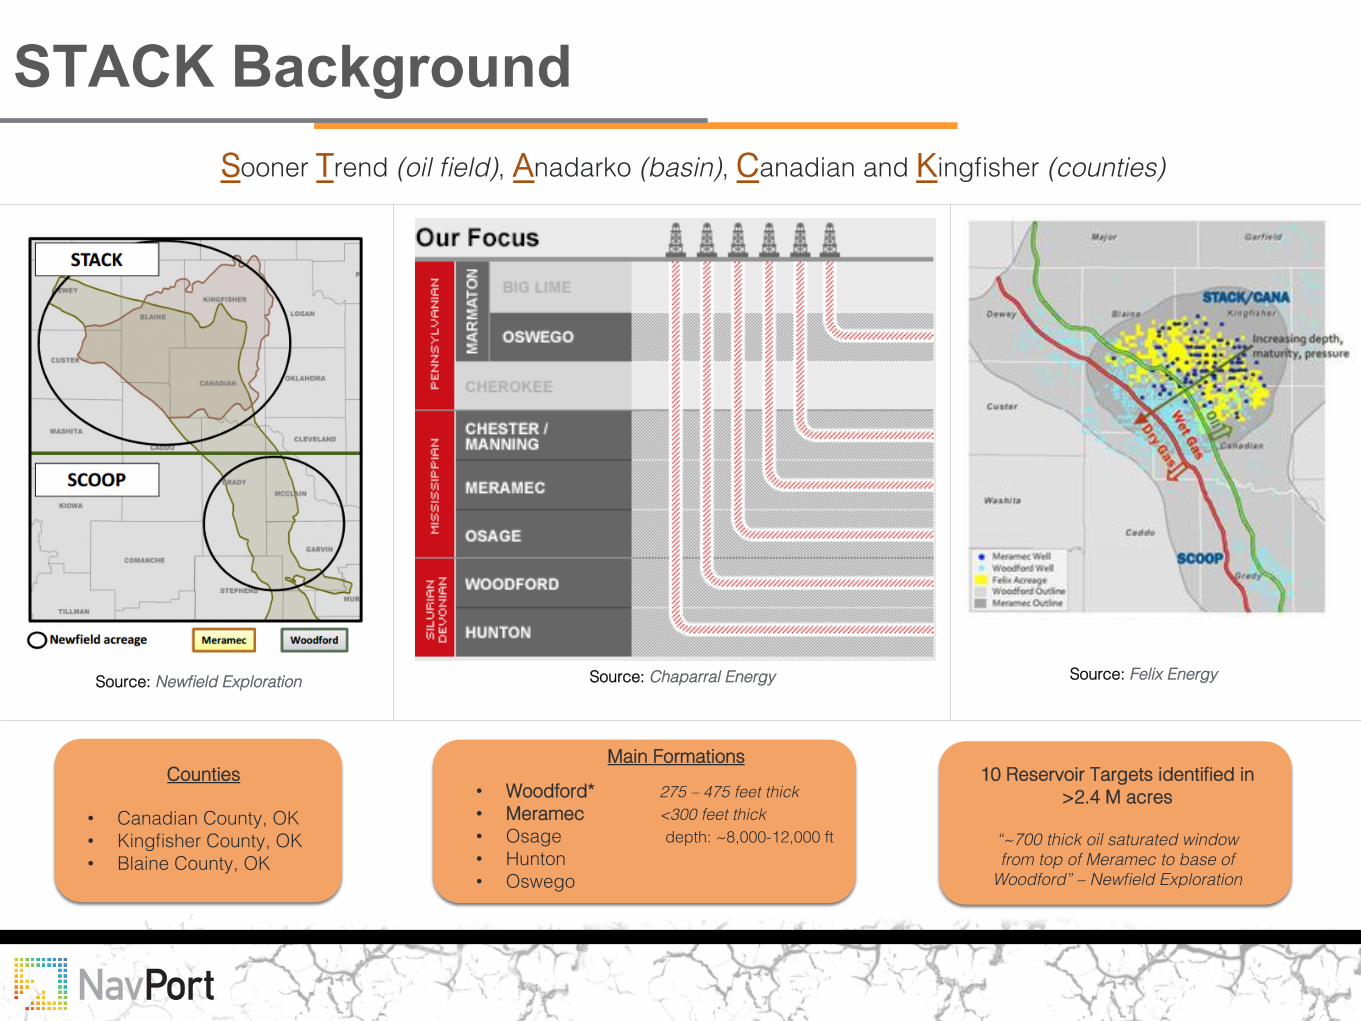
STACK Background
Source: Newfield Exploration! Source: Chaparral Energy! Source: Felix Energy!
Sooner Trend (oil field), Anadarko (basin), Canadian and Kingfisher (counties)!
Counties! !
• Canadian County, OK!• Kingfisher County, OK!• Blaine County, OK!
Main Formations !!
• Woodford* 275 – 475 feet thick!• Meramec <300 feet thick!• Osage depth: ~8,000-12,000 ft!• Hunton!• Oswego!
10 Reservoir Targets identified in >2.4 M acres!
!“~700 thick oil saturated window from top of Meramec to base of
Woodford” – Newfield Exploration!

What People are saying about STACK
• “STACK is one of the most economic resource plays in North America”!• 50% increase in drilling efficiency!• 40% increase in Woodford 30-day type curve!• 40% increase in Meramec 90-day cumulatives!
• Has seen a 69% uplift while experimenting with longer laterals of >10,000 ft. in Meramec!
• “STACK is one of the most undervalued assets in our portfolio”!• $36 Meramec break-even price!• $37 Oswego break-even price!
• 4Q15 Anadarko Basin net production > 50% of total domestic 4Q15 net production”!
• Added ~20,000 acres in 2015, totaling > 315,000 basin acreage (>210,00 in STACK)!

What People are saying about STACK
• “STACK wells are delivering some of the best rates of return in the Company.”!• 95% of acreage in over-pressured window!• Higher production rates and higher EURs!
• Eagle Ford $45!• Wolfberry $50!• Bone Spring $55!
• Three Forks $60!• Delaware Wolfcamp $75!• Miss Lime $95!
Break Even Approximations: !
• SCOOP $35!• Bakken $40!• STACK $40!
WTI Break Even Price!

Market Overview: U.S. vs. STACK
STACK: 2012-2016 YTD!U.S. Onshore: 2012-2016 YTD!
STACK: 2012-2016 YTD!U.S. Onshore: 2012-2016 YTD!
Perm
its!
Com
plet
ions
!
STACK Peaks in both permits and completions POST oil pricing decline!
-47%!
-74%!
+68%!
+81%!
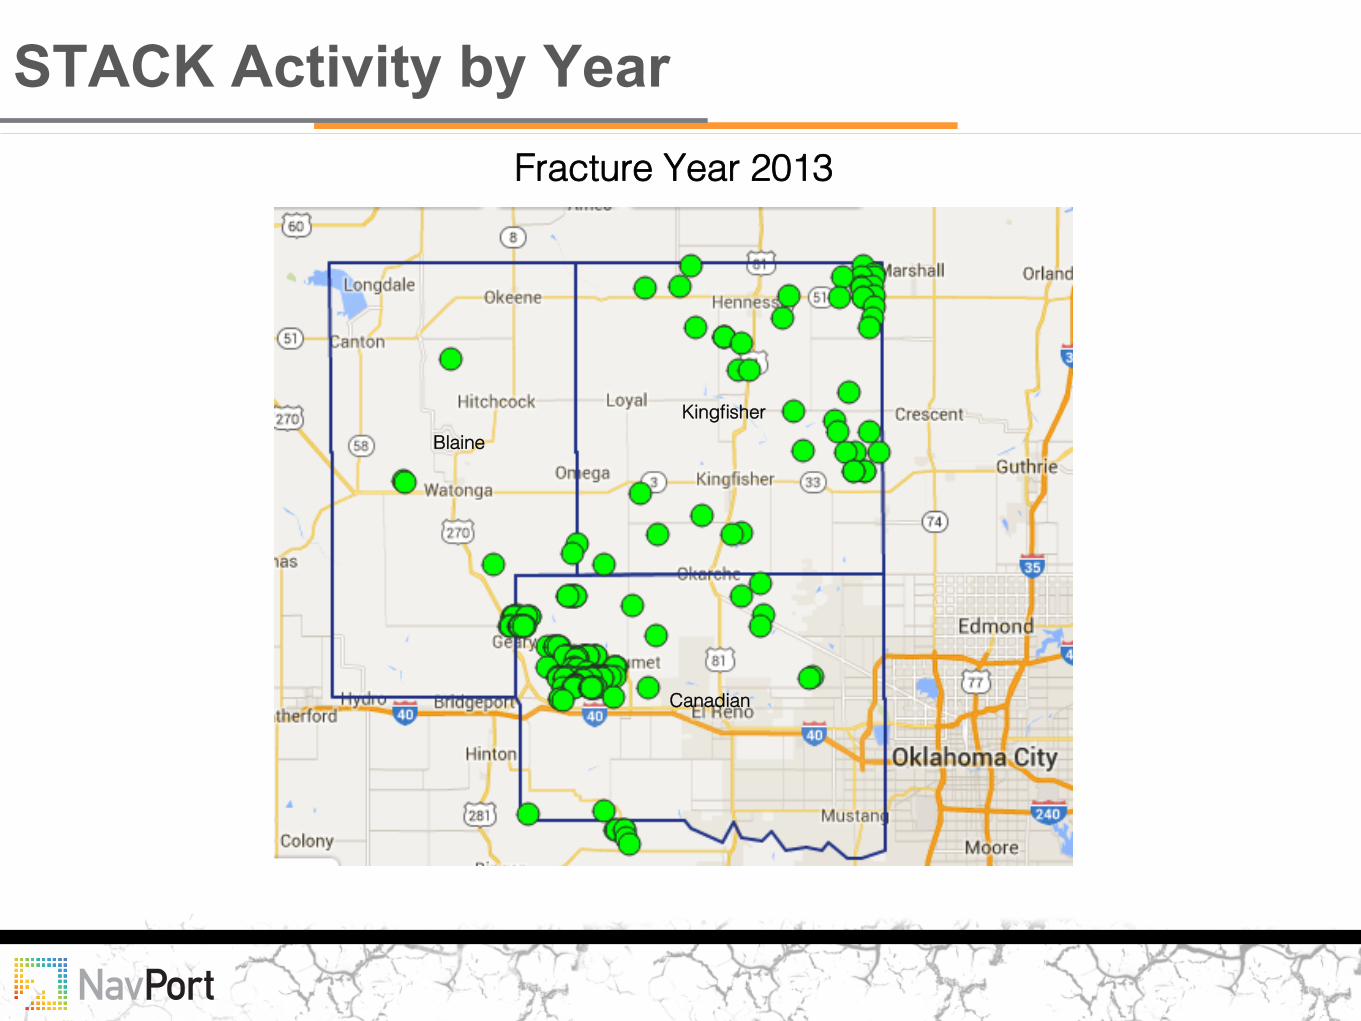
STACK Activity by Year Fracture Year 2013!
Kingfisher!Blaine!
Canadian!

STACK Activity by Year
Note: Data includes HZ Wells Only
Fracture Year 2014!
Kingfisher!Blaine!
Canadian!

STACK Activity by Year
Note: Data includes HZ Wells Only
Fracture Year 2015!
Kingfisher!Blaine!
Canadian!

County Completion Market Share Over Time!2014 – YTD 2016!
Largest !County Completion Market Share!
2014 – YTD 2016!
71%!
16%!
20%!
STACK Completion Market
• Canadian County drops share from 71% of STACK to 16%!• Blaine County grows from 0% to 20% of STACK market!• Continental Resources is driving Blaine County market growth!
64%!
29%!

STACK Completion Market
Large Operator Market Share Shifts YoY!
Alta Mesa Holdings +8% !Chaparral Energy -1% !Cimarex +9% !
Continental Resources +4%!Devon Energy +3%!Felix Energy +1%!
Husky Energy -14%!Newfield Exploration +6%!PayRock Energy +4%!

3 Month Cume Production by Frac Job Type: 2014-2016!
Frac Job Type Market Share Shifts: !2012-2016 YTD!
Average 3 Month BOE per Well!by Frac Job Type!
STACK Completion Details: Frac Job Type
• Crosslink +8% !• Slickwater -50% !• SW/CL Hybrid +37% !• SW/LG Hybrid +25% !
Growth in Completion Market Share:!
• Crosslink +31%!• Slickwater -21%!• SW/CL Hybrid +25% !• SW/LG Hybrid +14%!
Growth in 3 Month Avg. BOE per Well:!
Note: Data includes Horizontal Unconven9onal Wells Only

Proppant Mass Tracking: 2014-2016 YTD!
STACK Completion Details: Proppant Lateral Length & Proppant per Lateral Foot: !
2014-2016 YTD!Proppant Mass Tracking!
2014-2016 YTD!
Average 3 Month BOE per Well !by Proppant Type!
• Lateral length has increased 28%!• Avg. proppant per lateral foot has doubled!
Q4 ‘15 over Q1 ‘14:!
Important to Note: !Resin, typically costing up to 4 times the cost of sand, began being pumped in larger volumes in Q2 ‘15!
!Note: Data includes Horizontal Unconven9onal Wells Only

Production/ Proppant Correlation 3 Month BOE vs. Proppant per Lateral Ft.!
2014-2015!
• Cimarex Energy is pumping on average the highest proppant per lateral foot & getting the highest average 3 month BOE!
• Newfield Exploration appears to have optimized well completions, pumping a moderate volume of proppant (between 1K and 2K per lateral foot) and yielding one of the highest average BOE returns!
Note: Data includes Horizontal Unconven9onal Wells Only
Operator! Completion Count! Avg. Lateral Length! Avg. Proppant per Lateral Foot!
Avg. 3 Month Cumulative BOE!
Newfield Exploration! 105! 10,047! 1,387! 51,428!Cimarex Energy! 76! 4,911! 2,163! 57,209!

YoY Production 6 Month Cumulative
+4%!
+40%!
Note: Data includes Horizontal Unconven9onal Wells Only

YoY Production 3 Month Cumulative
+20%!+48%!
Note: Data includes Horizontal Unconven9onal Wells Only

STACK IP BOE/Day Colored by Operator 2014-2016 YTD!
DEWEY!
BLAINE!
KINGFISHER!
CANADIAN!
Note: Data includes Horizontal Unconven9onal Wells Only

STACK by 3 month BOE Colored by Operator 2014-2016 YTD!
DEWEY!
BLAINE!
KINGFISHER!
CANADIAN!
Note: Data includes Horizontal Unconven9onal Wells Only

STACK Future Impact
Q4 2014 – Q1 2015! Q4 2015 – Q1 2016!
Permit Market Shares!
Operator! 2014! 2015! 2016 YTD!Newfield Exploration! 27! 79! 13!
Continental Resources! 2! 21! 18!
Cimarex! 37! 58! 7!
Oklahoma Energy Acquisitions! 3! 35! 15!
PayRock Energy! 8! 30! 9!
Devon Energy! 27! 93! 8!
Chaparral Energy! 35! 17! 5!
Felix Energy! 16! 38! 1!
Approved Permit Counts!

STACK Differentiators
72%!
22%!
42%!
51%!
STACK - Resin Tracking!2014-2016 YTD!
U.S. - Resin Tracking!2014-2016 YTD!
Slickwater Market Shares: 2014-2016 YTD!
STACK is not your average play, it is showing unique trends to the marketplace and needs a unique set of data in order to
examine it.!!

Appendix
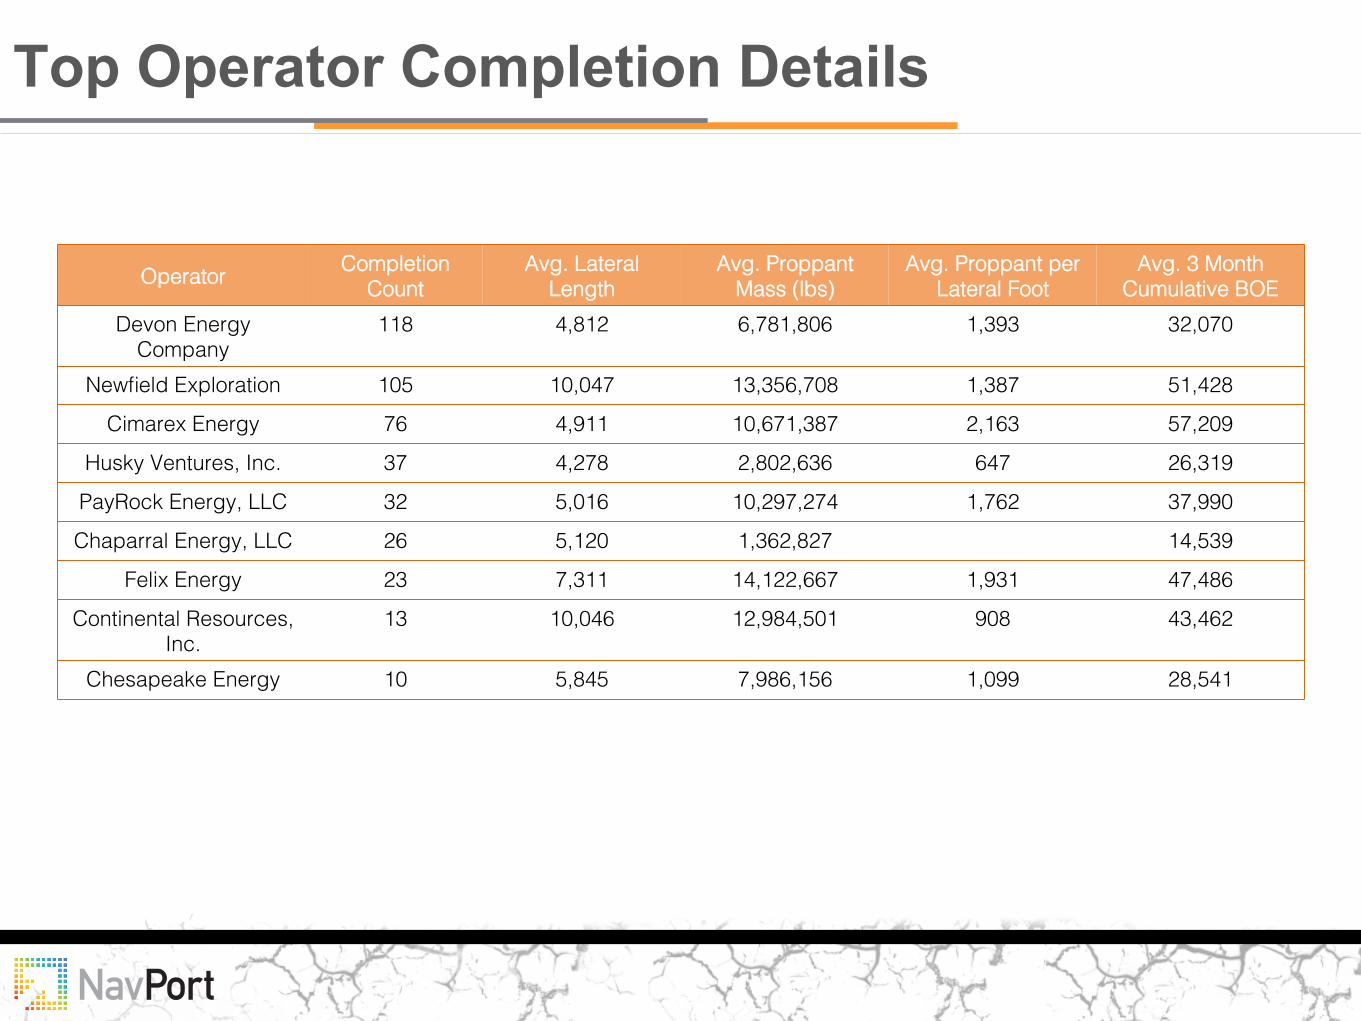
Top Operator Completion Details
Operator! Completion Count!
Avg. Lateral Length!
Avg. Proppant Mass (lbs)!
Avg. Proppant per Lateral Foot!
Avg. 3 Month Cumulative BOE!
Devon Energy Company!
118! 4,812! 6,781,806! 1,393! 32,070!
Newfield Exploration! 105! 10,047! 13,356,708! 1,387! 51,428!
Cimarex Energy! 76 ! 4,911! 10,671,387! 2,163! 57,209!
Husky Ventures, Inc.! 37 ! 4,278! 2,802,636! 647! 26,319!
PayRock Energy, LLC! 32 ! 5,016! 10,297,274! 1,762! 37,990!
Chaparral Energy, LLC! 26 ! 5,120! 1,362,827! 14,539!
Felix Energy! 23 ! 7,311! 14,122,667! 1,931! 47,486!
Continental Resources, Inc. !
13 ! 10,046! 12,984,501! 908! 43,462!
Chesapeake Energy! 10 ! 5,845! 7,986,156! 1,099! 28,541!
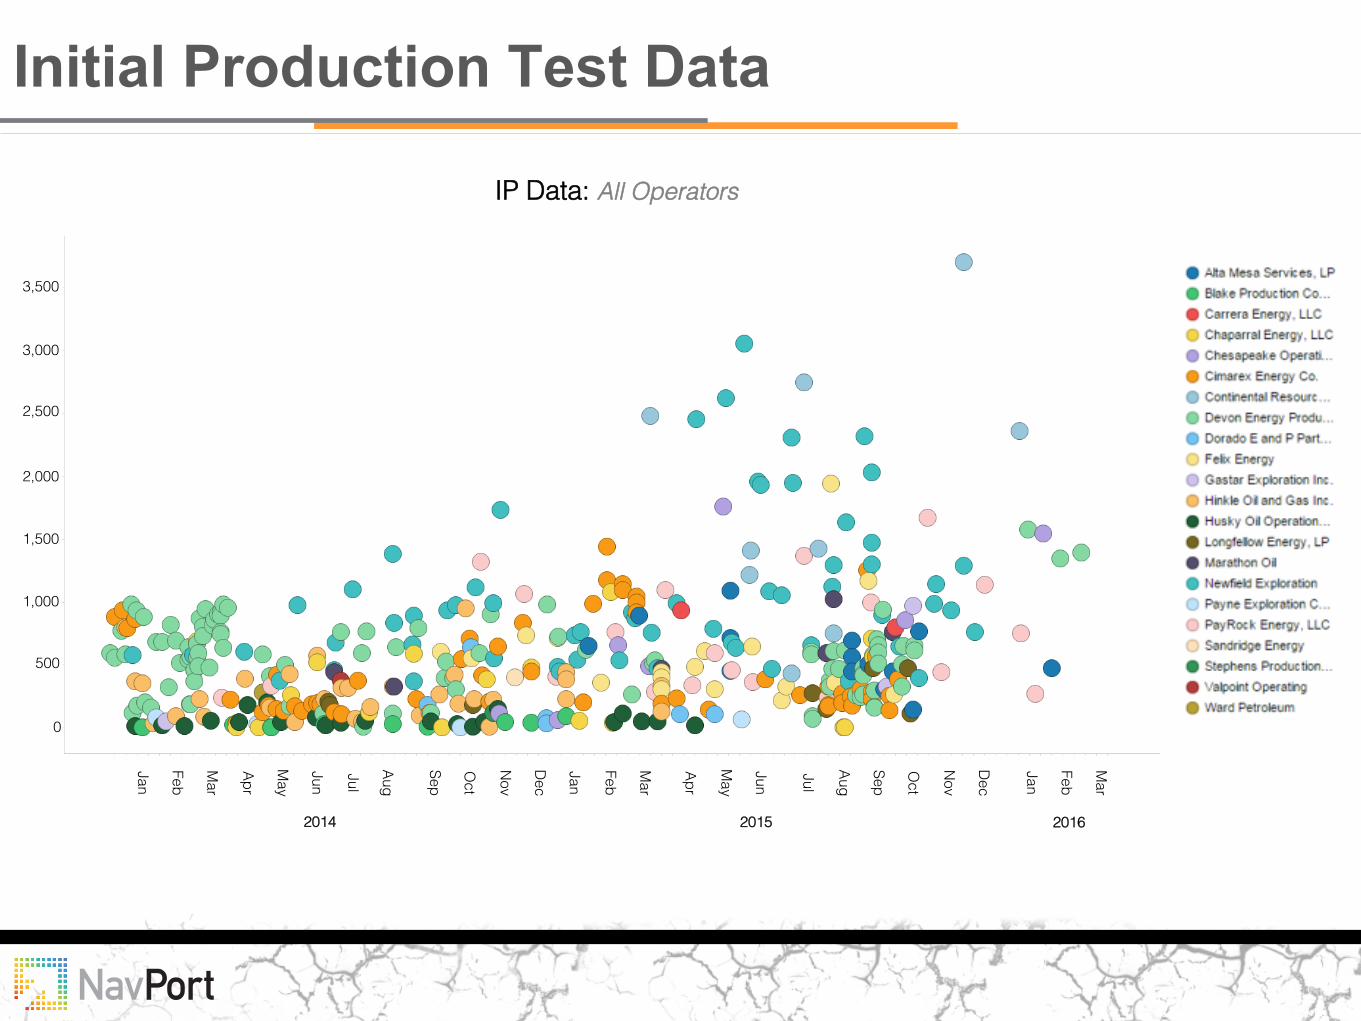
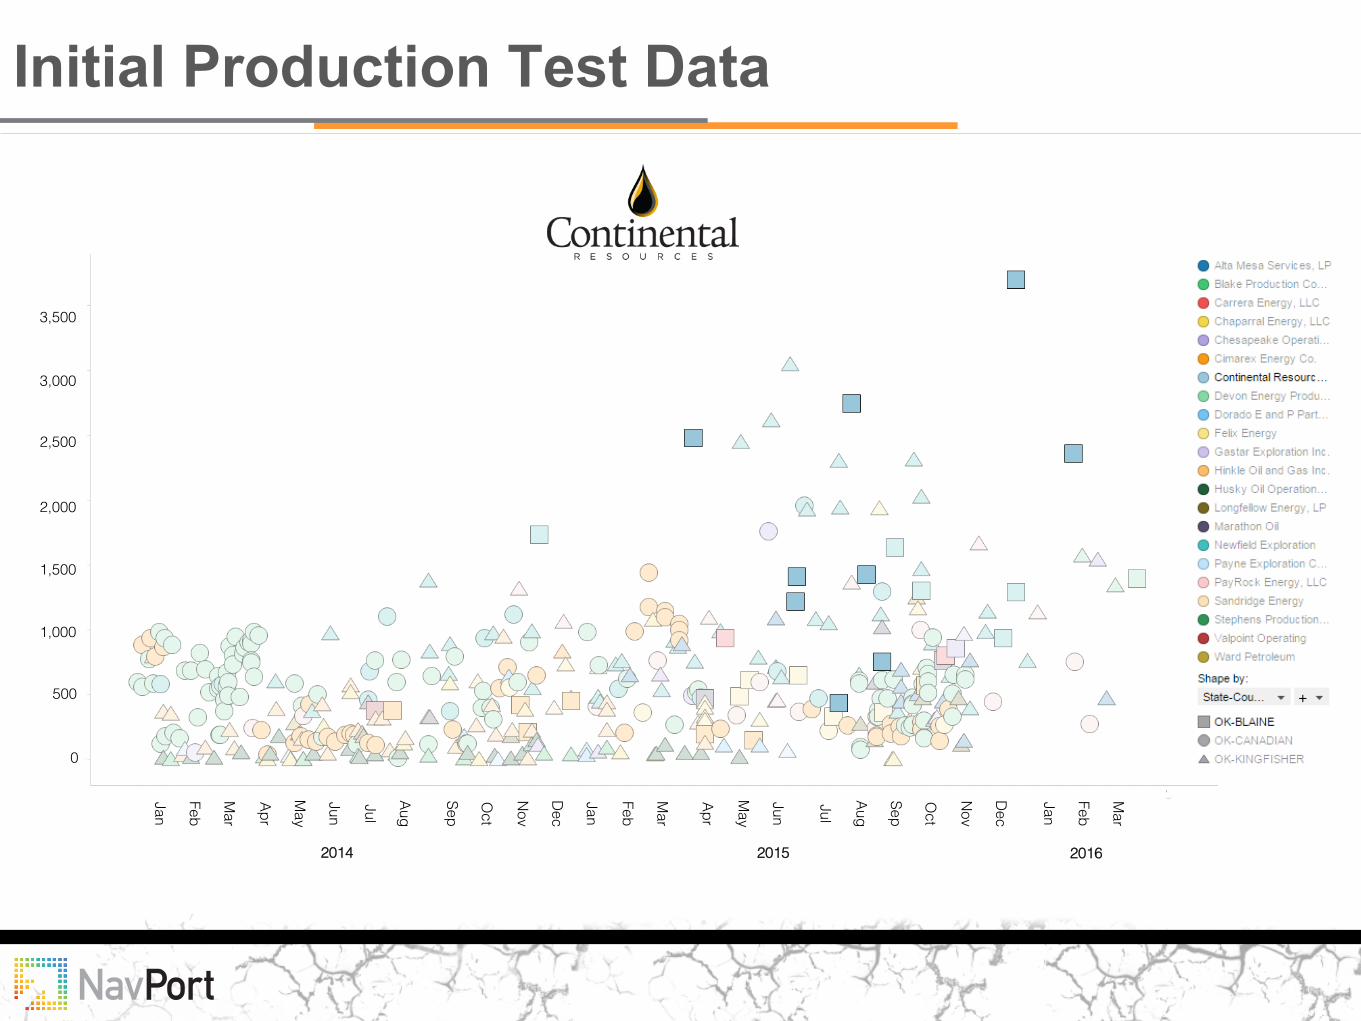
IP Data: All Operators!
Initial Production Test Data
!Aug!!Jul!!
Jun!!
May!!
Apr!!
Mar!!
Feb!!
Jan!! !
Mar!!
Feb!!
Jan!!
Dec!!
Nov!!
Oct!!
Sep!! !
Jun!!
May!!
Apr!
!D
ec!!
Nov!!
Oct!!
Sep!!
Aug!!Jul!
Mar!!
Feb!!
Jan!
2014! 2015! 2016!
3,500!
3,000!
2,500!
2,000!
1,500!
1,000!
500!
0!

!Aug!!Jul!!
Jun!!
May!!
Apr!!
Mar!!
Feb!!
Jan!! !
Mar!!
Feb!!
Jan!!
Dec!!
Nov!!
Oct!!
Sep!! !
Jun!!
May!!
Apr!
!D
ec!!
Nov!!
Oct!!
Sep!!
Aug!!Jul!
Mar!!
Feb!!
Jan!
2014! 2015! 2016!
3,500!
3,000!
2,500!
2,000!
1,500!
1,000!
500!
0!
Initial Production Test Data

Initial Production Test Data
!Aug!!Jul!!
Jun!!
May!!
Apr!!
Mar!!
Feb!!
Jan!! !
Mar!!
Feb!!
Jan!!
Dec!!
Nov!!
Oct!!
Sep!! !
Jun!!
May!!
Apr!
!D
ec!!
Nov!!
Oct!!
Sep!!
Aug!!Jul!
Mar!!
Feb!!
Jan!
2014! 2015! 2016!
3,500!
3,000!
2,500!
2,000!
1,500!
1,000!
500!
0!
Initial Production Test Data
!Aug!!Jul!!
Jun!!
May!!
Apr!!
Mar!!
Feb!!
Jan!! !
Mar!!
Feb!!
Jan!!
Dec!!
Nov!!
Oct!!
Sep!! !
Jun!!
May!!
Apr!
!D
ec!!
Nov!!
Oct!!
Sep!!
Aug!!Jul!
Mar!!
Feb!!
Jan!
2014! 2015! 2016!
3,500!
3,000!
2,500!
2,000!
1,500!
1,000!
500!
0!

Initial Production Test Data
!Aug!!Jul!!
Jun!!
May!!
Apr!!
Mar!!
Feb!!
Jan!! !
Mar!!
Feb!!
Jan!!
Dec!!
Nov!!
Oct!!
Sep!! !
Jun!!
May!!
Apr!
!D
ec!!
Nov!!
Oct!!
Sep!!
Aug!!Jul!
Mar!!
Feb!!
Jan!
2014! 2015! 2016!
3,500!
3,000!
2,500!
2,000!
1,500!
1,000!
500!
0!