the standard bank of south africa r1 016 billion total assets approximately 300 000 ucount users:...
TRANSCRIPT
Annual report 2013
The Standard Bank of South Africa
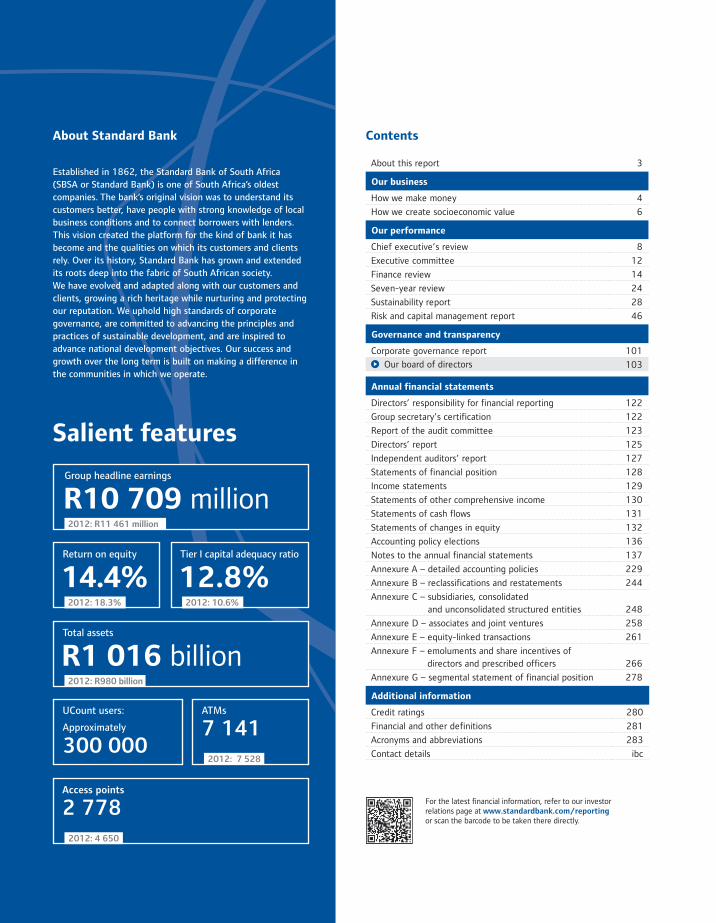
R1 016 billionTotal assets
Approximately
300 000
UCount users:
2012: R980 billion
14.4% Return on equity
2012: 18.3%
Access points
2 778 2012: 4 650
ATMs
7 1412012: 7 528
12.8%Tier I capital adequacy ratio
2012: 10.6%
About this report 3
Our business
How we make money 4
How we create socioeconomic value 6
Our performance
Chief executive’s review 8
Executive committee 12
Finance review 14
Seven-year review 24
Sustainability report 28
Risk and capital management report 46
Governance and transparency
Corporate governance report 101
Our board of directors 103
Annual financial statements
Directors’ responsibility for financial reporting 122
Group secretary’s certification 122
Report of the audit committee 123
Directors’ report 125
Independent auditors’ report 127
Statements of financial position 128
Income statements 129
Statements of other comprehensive income 130
Statements of cash flows 131
Statements of changes in equity 132
Accounting policy elections 136
Notes to the annual financial statements 137
Annexure A – detailed accounting policies 229
Annexure B – reclassifications and restatements 244
Annexure C – subsidiaries, consolidated and unconsolidated structured entities 248
Annexure D – associates and joint ventures 258
Annexure E – equity-linked transactions 261
Annexure F – emoluments and share incentives of directors and prescribed officers 266
Annexure G – segmental statement of financial position 278
Additional information
Credit ratings 280
Financial and other definitions 281
Acronyms and abbreviations 283
Contact details ibc
ContentsAbout Standard Bank
Established in 1862, the Standard Bank of South Africa
(SBSA or Standard Bank) is one of South Africa’s oldest
companies. The bank’s original vision was to understand its
customers better, have people with strong knowledge of local
business conditions and to connect borrowers with lenders.
This vision created the platform for the kind of bank it has
become and the qualities on which its customers and clients
rely. Over its history, Standard Bank has grown and extended
its roots deep into the fabric of South African society.
We have evolved and adapted along with our customers and
clients, growing a rich heritage while nurturing and protecting
our reputation. We uphold high standards of corporate
governance, are committed to advancing the principles and
practices of sustainable development, and are inspired to
advance national development objectives. Our success and
growth over the long term is built on making a difference in
the communities in which we operate.
Salient features
R10 709 millionGroup headline earnings
2012: R11 461 million
For the latest financial information, refer to our investor relations page at www.standardbank.com/reportingor scan the barcode to be taken there directly.
1
The Standard Bank of South Africa annual report (this report)
This report is the SBSA annual report and includes risk and capital managementand financial information.
www.standardbank.com/reporting
PG
In addition to this report, the Standard Bank Group (SBG) produces a full suite of reporting publications tailored to readers with specific information requirements.
Standard Bank Group annual integrated report
As SBG’s primary report, the annual integrated report (AIR) aims to present a balancedand succinct analysis of SBG’s strategy, performance and prospects.
www.standardbank.com/reporting
AIR
Standard Bank Group risk and capital management report
Provides a detailed discussion of the management of strategic risks related to SBG’s banking and insurance operations, including capital and liquidity management and regulatory developments.
www.standardbank.com/reporting
RCM
AFS
Standard Bank Group annual financial statements
Set out the full audited financial statements for SBG, including the report of thegroup audit committee.
www.standardbank.com/reporting
Sustainability report
Presents a balanced and comprehensive analysis of the group’s sustainability performance in relation to issues material to the group and our stakeholders.
www.standardbank.com/sustainability
SR
FeedbackWe welcome the views of our stakeholders on the annual reportand the way we approach our strategic priorities. Please contact us [email protected] with your feedback.
Reporting suite Cross-referencing tools
The icons below refer readers to information elsewhere in this report, or in other reports, that form part of the group’s suite of reporting publications.
Indicates that additional information is available online.
A Denotes text in the risk and capital management report that forms part of the group’s audited annual financial statements.
The financial results and commentary describe the consolidated results of The Standard Bank of South Africa group (the group or Standard Bank) unless otherwise indicated as relating to The Standard Bank of South Africa Limited (the company or SBSA). SBSA is a wholly-owned subsidiary of Standard Bank Group Limited and is incorporated in South Africa.

2 The Standard Bank of South Africa Annual report 2013

3
About this report
As a South African financial services group we have a fundamental role to play in the development of the society in which we operate. The success of our customers and stakeholders underpins our commercial sustainability and our ability to deliver returnsto our stakeholders over the long term.
Serving our customers
Growing our people
Delivering to our shareholder
Being proactive
Working in teams
Guarding against arrogance
Respecting each other
Upholding the highest levels of integrity
Our values
4 The Standard Bank of South Africa Annual report 2013
Our business
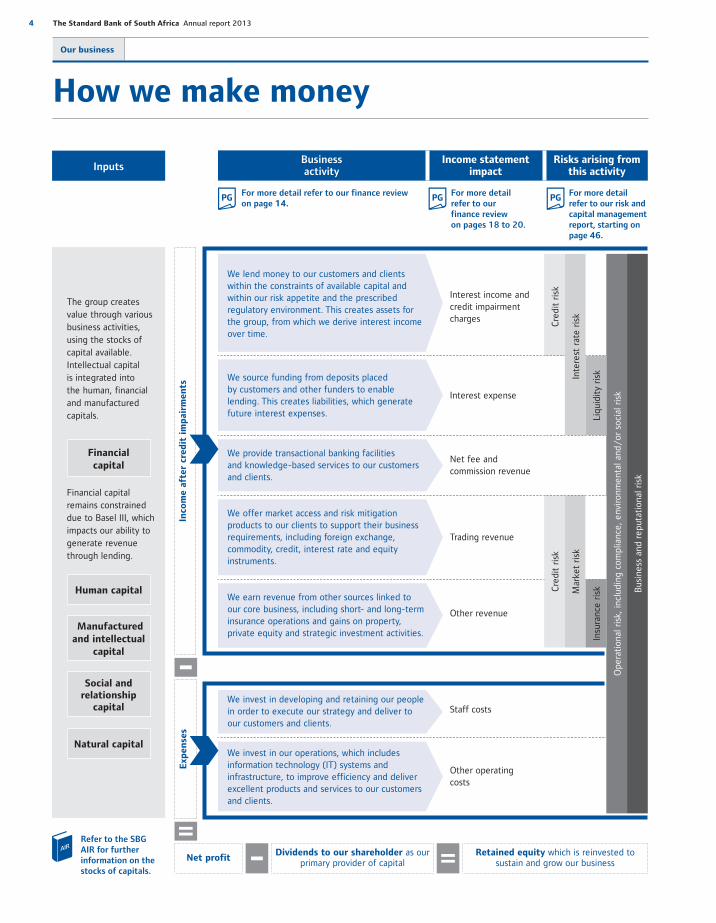
How we make money
Inco
me a
fter
cred
it i
mp
air
men
tsE
xp
en
ses
Inputs
For more detail refer to our finance reviewon page 14.
For more detail refer to ourfinance reviewon pages 18 to 20.
For more detail refer to our risk and capital management report, starting on page 46.
PGPGPG
Dividends to our shareholder as our primary provider of capital
Net profitRetained equity which is reinvested to
sustain and grow our business
Business activity
Income statement impact
Risks arising from this activity
Refer to the SBGAIR for further information on thestocks of capitals.
AIR
Financial capital remains constrained due to Basel III, which impacts our ability to generate revenue through lending.
Natural capital
Social and relationship
capital
Manufactured and intellectual
capital
Human capital
Financial capital
The group creates value through various business activities, using the stocks of capital available. Intellectual capitalis integrated intothe human, financial and manufactured capitals.
Ope
rati
onal
ris
k, in
clud
ing
com
plia
nce,
env
ironm
enta
l and
/or
soc
ial r
isk
Bus
ines
s an
d re
puta
tion
al r
isk
We lend money to our customers and clients within the constraints of available capital and within our risk appetite and the prescribed regulatory environment. This creates assets for the group, from which we derive interest income over time.
Interest income and credit impairment charges C
redi
t ri
sk
Inte
rest
rat
e ri
sk
We source funding from deposits placed by customers and other funders to enable lending. This creates liabilities, which generate future interest expenses.
Interest expense
Liqu
idit
y ri
sk
We provide transactional banking facilitiesand knowledge-based services to our customers and clients.
Net fee and commission revenue
We offer market access and risk mitigation products to our clients to support their business requirements, including foreign exchange, commodity, credit, interest rate and equity instruments.
Trading revenue
Cre
dit
risk
Mar
ket
risk
We earn revenue from other sources linked toour core business, including short- and long-term insurance operations and gains on property, private equity and strategic investment activities.
Other revenue
Insu
ranc
e ri
sk
We invest in developing and retaining our people in order to execute our strategy and deliver to our customers and clients.
Staff costs
We invest in our operations, which includes information technology (IT) systems and infrastructure, to improve efficiency and deliver excellent products and services to our customers and clients.
Other operating costs

5
Our business Our performance Governance andtransparency
Annual financialstatements
Additionalinformation
Our business structure, products and services
Global markets
Fixed income and currencies
Commodities
Equities
Transactional products and services (TPS)
Transactional banking
Investor services
Trade finance
Investment banking
Advisory
Debt products
Structured finance
Structured trade and commodity finance
Debt capital markets
Equity capital markets
Real estate
Real estate finance
Investments in real estate
Wh
at
we o
ffer
Corporate & Investment Banking(CIB)provides corporate and investment banking services to clients including governments, parastatals, larger corporates, financial institutions and international counterparties.
Includes the results of support functions (back office), which are either centralised or embedded in the business segments. The direct costs of support functions are recharged to the business segments, which enables the execution of their business strategies
Wh
at
we o
ffer
Centraland other
Mortgage lending
Residential accommodation loans to mainly personal market customers
Instalment sale and finance leases
Finance of vehicles for personal market customers
Finance of vehicles and equipment in the business market
Card products
Credit card facilities to individuals and businesses (credit card issuing)
Merchant transaction acquiring services(card acquiring)
Lending products
Lending products offered to both personal and business markets
Transactional products
Comprehensive suite of transactional, savings and investment products. This includes deposit taking activities, electronic banking and debit card facilities
Bancassurance and wealth
Short-term and long-term insurance comprising:
simple embedded products, including homeowners’ insurance, funeral cover, household contents and vehicle insurance, and loan protection plans sold in conjunction with related banking products
complex insurance products, including life, disability and investment policies sold by qualified intermediaries
Financial planning
Wealth management services
Wh
at
we o
ffer
Personal & Business Banking(PBB)provides banking and other financial services to individual customers and small- to medium-sized enterprises.

6 The Standard Bank of South Africa Annual report 2013
Our business
How we create socioeconomic value
We remain aware that, as a bank servicing the real economy, we are part of and facilitate the economic growth and social development of the economies we serve. We are commercially and morally bound to serve South Africa and her people well, in return for the long-term profitable growth we envisage as one of the country’s leading financial services providers.
We create value through our business activities using the stocks of capital available to us. Understanding our dependence on, and contribution to these capitals, is fundamental to our ability to continue creating value over the long term. Ultimately, the most significant outcomes of our business activities are in their contribution to socioeconomic development, which we can only achieve through remaining profitable and staying relevant to the societies we serve.
Basel III requires banks to allocate financial capital to meeting capital requirements, limiting the capital available for other activities. The transition of Standard Bank to Basel III in 2013 was successful, and the group is well positioned to continue lending responsibly into the future.
CSI spend R57,6 million (2012: R64 million)
South African customer satisfaction survey result 8.78 out of 10 for the branch channel (2012: 9.48 out of 10)
11,8 million retail and business customers (2012: 11,1 million)
R69 billion home loans granted (2012: R64 billion)
ATM availability 96.5% (2012: 96.6%)
Consumer education spend R20,2 million (2012: R15,1 million)
26 019 distressed customers assisted through our credit customer assist function (2012: 36 720)
R16,1 billion (2012: R11,7 billion)
Some 68% of our total procurement spend in South Africa is spent with our top 100 suppliers, 80% of whom have a level four BEE rating or better
Weighted procurement spend on BEE suppliers in 2013 of
Refer to the SBG AIR for further information on stocks of capitals, and socioeconomic outcomes for the year.AIR
7
Our business Our performance Governance andtransparency
Annual financialstatements
Additionalinformation
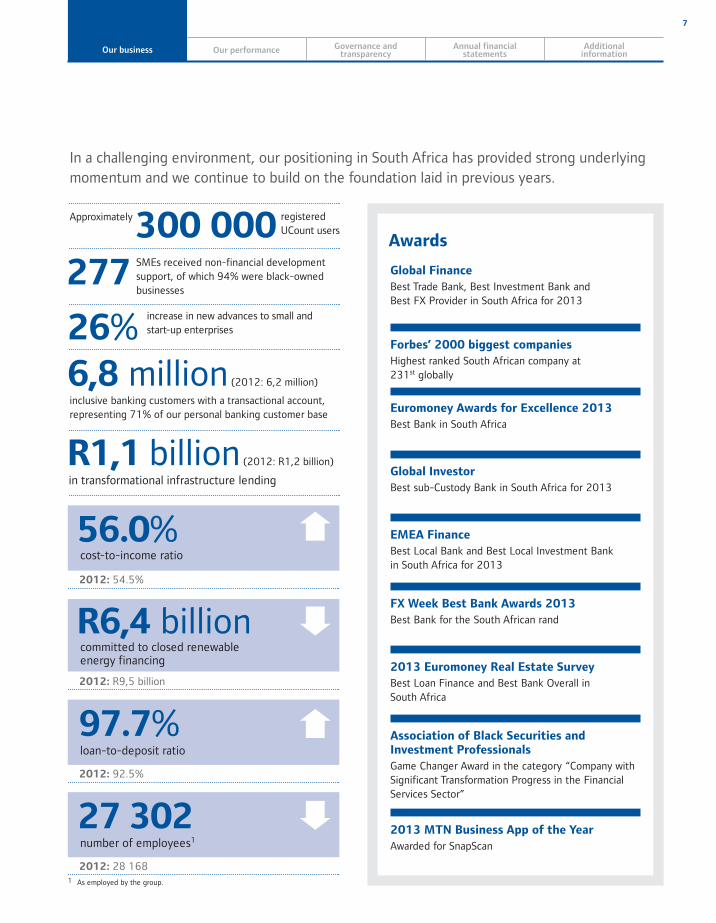
Global Finance
Best Trade Bank, Best Investment Bank and Best FX Provider in South Africa for 2013
Forbes’ 2000 biggest companies
Highest ranked South African company at 231st globally
Euromoney Awards for Excellence 2013
Best Bank in South Africa
Global Investor
Best sub-Custody Bank in South Africa for 2013
EMEA Finance
Best Local Bank and Best Local Investment Bankin South Africa for 2013
FX Week Best Bank Awards 2013
Best Bank for the South African rand
2013 Euromoney Real Estate Survey
Best Loan Finance and Best Bank Overall inSouth Africa
Association of Black Securities and Investment Professionals
Game Changer Award in the category “Company with Significant Transformation Progress in the Financial Services Sector”
2013 MTN Business App of the Year
Awarded for SnapScan
Awards
In a challenging environment, our positioning in South Africa has provided strong underlying momentum and we continue to build on the foundation laid in previous years.
277SMEs received non-financial development support, of which 94% were black-owned businesses
26% increase in new advances to small and start-up enterprises
300 000 registeredUCount users
6,8 million (2012: 6,2 million)
inclusive banking customers with a transactional account, representing 71% of our personal banking customer base
2012: 54.5%
56.0%cost-to-income ratio
2012: R9,5 billion
R6,4 billioncommitted to closed renewableenergy financing
2012: 92.5%
97.7%loan-to-deposit ratio
2012: 28 168
27 302number of employees1
R1,1 billion (2012: R1,2 billion)
in transformational infrastructure lending
Approximately
1 As employed by the group.

8 The Standard Bank of South Africa Annual report 2013
Our performance
R10 709 millionHeadline earnings
2012
R11 461 million
14.4%Return on equity
2012
18.3%
Chief executive’s review
“We will continue to focus on protecting and growing our share of markets in which we have a competitive advantage, and on seeking new revenue streamsin our rapidly changing domestic financial services environment. As the largest operating entity of the Standard Bank Group we will continue to supportthe sustainable growth of the group, specifically by sharing our universal banking expertise and providinga strong capital and liquidity base.”
Sim TshabalalaChief executive, The Standard Bank of South Africa
The Standard Bank of South Africa had a mixed performance in 2013. On the one hand, we showed good growth in revenues in both PBB and CIB as a result of the focus on customers and clients in our franchise. On the other hand, SBSA’s headline earnings fell 7% to R10,7 billion, due, in part, to a weaker credit performance and due to higher operating expenses which included the amortisation of IT development projects as these moved into production, particularly in relation to core banking platforms. We believe that our efforts to protect and grow market share in the domestic market are working and that SBSA maintained its reputation as a stable and trustworthy organisation in the global banking and investment communities. We continued to generate the majority of the capital required to fund SBG’s Africa-centred growth strategy.
Operating environmentThe macroeconomic environment for South African banks remains difficult. Challenges include a subdued economy with weak immediate gross domestic product (GDP) growth prospects, low interest rates relative to other emerging markets, ongoing constraints on investment by government, businesses and households, and intense competition. South African households remained burdened by high levels of debt, sluggish personal disposable income growth and rising inflation. Growth in spending has continued to slow in response to these adverse factors as well as to lower levels of unsecured lending to households as credit providers tightened their lending practices. Slow economic growth also constrained activity in the business banking environment. Lacklustre fixed investment growth and labour disruption contributed to a sub-par economic performance, with GDP growth reaching only 1.9% during 2013.

9
Our business Our performance Governance andtransparency
Annual financialstatements
Additionalinformation
OverviewThe changes in the regulatory environment since 2008 have been unprecedented in their scale, pace and volume. As we have adapted our business models to comply with the new regulatory reality, we are also transforming our core banking systems to serve the needs of our customers and clients in an increasingly digital world.
Strong growth in PBB’s headline earnings demonstrated the benefits of its focus on transactional banking and a reduced appetite for unsecured lending in the challenging domestic economic environment. PBB increased its focus on cost-effective and integrated multiple channels, including internet and mobile, to enable customers to conduct their banking with increased speed and convenience on a platform that best suits their needs.
CIB concluded major corporate issuances in South African bond markets for clients and recorded good growth in revenue from some of its major business clients that conduct business in the rest of Africa. Key features of CIB’s performance were improvements in customer engagement and the ongoing shift in its revenues from capital heavy complex derivative and private equity transactions to flow trades.
Strategy Standard Bank maintains a strong position in the domestic market and is able to leverage its size and scope to compete for opportunities ina transforming South African marketplace. Our strategy is to servethe full value chain of customers in our domestic operation – fromthe basic to the more sophisticated financial services needs – andto maintain high standards of customer service using cost-effective delivery channels.
Standard Bank is fully integrated with the rest of SBG and playsa key role in positioning SBG to capitalise on the exciting growth in the rest of the continent. Our South African operation is the head office for our African ambitions. As SBG’s largest business entity, SBSA holds the bulk of the capital resources required to execute its strategy in Africa. The South African operation also provides support to our operations in the rest of Africa, which are in different stages of development, through its deep universal banking knowledge and experience. This is done with full cognisance of the unique dynamics in each market.
Standard Bank, therefore, cannot be viewed as self-standing or directly comparable to some of its domestic competitors as it carries assets from entities outside South Africa on its balance sheet and bears costs on its income statement that are attributable to SBG.
Our business model, which is to operate PBB and CIB as integrated business units, also allows us to adapt valuable lessons learnedin other markets to the domestic market and apply specialist knowledge within SBG to international capital raising transactionsand major deals in Africa. These are all key elements of our competitive advantage.
We have made significant progress in our efforts to strengthen our tier I capital ratio in compliance with the Basel III requirements and achieved a ratio of 12.8% at the end of December compared to 10.6% in the prior year.
Standard Bank’s ongoing commitment to South Africa is based on our belief that the country offers growth potential and should return to a growth trend of approximately 3.5% per annum once the global economic environment stabilises. The development of gas reserves in South Africa offers the potential to strengthen this growth trend if supported by regulatory certainty and foreign investment.
Furthermore, under-penetration in non-banking financial services also offers considerable future opportunity. Standard Bank is generating increasing value from bancassurance, which grew revenues by 21% to R1,7 billion in South Africa in 2013. With only 15% of South Africans estimated to be making use of formal insurance products, compared to a market penetration of 75% in the banking industry, this trend is likely to gain momentum.
Delivering as a real economy bank As a major universal bank in South Africa we are able to play a significant part in supporting the real economic activity that underpins the country’s socioeconomic development. More specifically, in line with national development objectives, we are focused on achieving wider financial inclusion and the democratisation of finance. Some of our key focus areas in this regard are discussed below.
Responsible lendingWe extend credit to our customers to enable them to fulfil their needs for shelter, transport, health, basic appliances and education, and we create the opportunity for them to start or build their own businesses. To ensure that our lending practices are responsible, we comply with legislation and apply stringent affordability and credit-granting criteria.
The emphasis in PBB is on primary transaction and depositaccounts. The primary transaction account enables us to have good understanding of customer cash flows and risk profiles. This understanding allows us to extend credit responsibly. Unsecured credit extension was sensibly managed given the pressures on customers. In the middle market, unsecured revolving credit plan account balances grew by 22% and personal overdraft facilities by 24%, compared with 56% and 35% respectively in the prior year.The majority of these unsecured loan accounts are extended to our own transactional account holders.
In the inclusive banking segment, we introduced the AccessBanking suite of offerings, which offers fewer, easy to understand basic banking products that provide value for money with transparent pay-as-you-transact pricing. AccessAccount origination is fast, paperless and mobile and is therefore significantly cheaper than traditional origination. This provides an opportunity to improve profitability in the inclusive banking segment.
We recognise that, in the current socioeconomic environment, many of our customers are under financial pressure which limits their ability to repay their debts. We apply behaviour scoring to detect the early warning signs of customers in financial difficulty and we assist these customers by working with them to restructure their loansfor short-term relief. Where financial hardship requires amore sustainable long-term solution across multiple products, theCredit Customer Assist team takes a holistic view of the customer’s debt, income and expenditure, and then restructures and consolidates
10 The Standard Bank of South Africa Annual report 2013
Our performance Chief executive’s review continued
loan repayments across their secured and unsecured products.During the year we helped over 26 019 (2012: 36 720) distressed customers through our Credit Customer Assist function, with a total outstanding loan obligation of more than R12,9 billion. The majority of successful outcomes are in home loan restructures and unsecured debt consolidations.
During 2013, cabinet approved the credit information amnesty, which removed some of the detail from the credit bureau information that banks and other credit providers use to make risk-based lending decisions. We still have information on our own customers and will continue to price lending products using this information, making lending to our own customers, for whom we have a transactional history, even more important. However, risk-based scoring will have to take account of reduced information generally, and it is likely that the supply of unsecured credit by the industry may well be affected given the greater risk now present. This could potentially exacerbate an already slowing growth trend in credit extension.
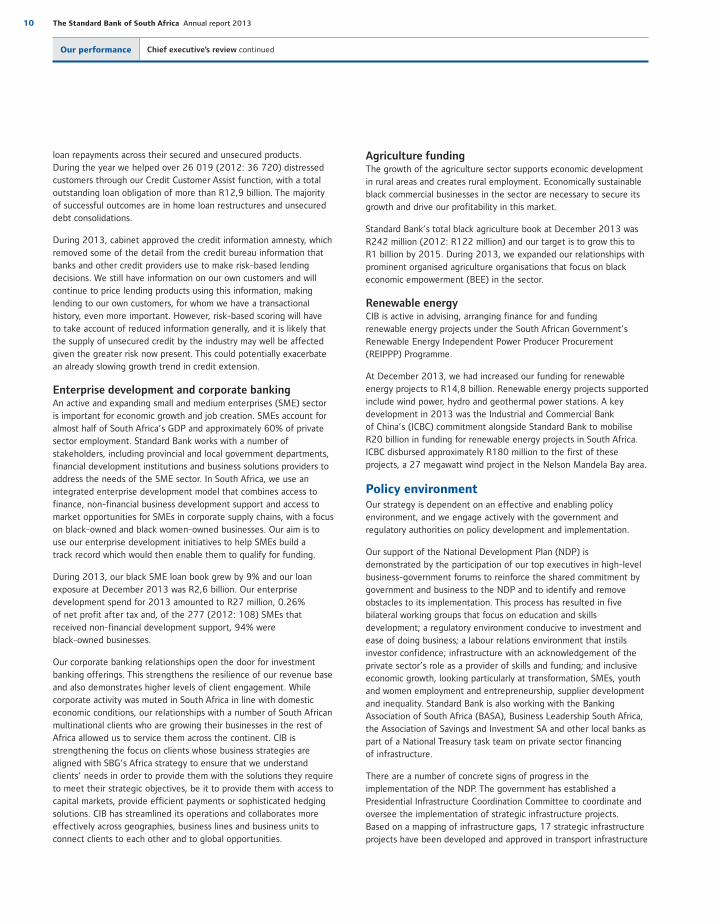
Enterprise development and corporate bankingAn active and expanding small and medium enterprises (SME) sectoris important for economic growth and job creation. SMEs account for almost half of South Africa’s GDP and approximately 60% of private sector employment. Standard Bank works with a number of stakeholders, including provincial and local government departments, financial development institutions and business solutions providers to address the needs of the SME sector. In South Africa, we use an integrated enterprise development model that combines access to finance, non-financial business development support and access to market opportunities for SMEs in corporate supply chains, with a focus on black-owned and black women-owned businesses. Our aim is to use our enterprise development initiatives to help SMEs build atrack record which would then enable them to qualify for funding.
During 2013, our black SME loan book grew by 9% and our loan exposure at December 2013 was R2,6 billion. Our enterprise development spend for 2013 amounted to R27 million, 0.26%of net profit after tax and, of the 277 (2012: 108) SMEs thatreceived non-financial development support, 94% wereblack-owned businesses.
Our corporate banking relationships open the door for investment banking offerings. This strengthens the resilience of our revenue base and also demonstrates higher levels of client engagement. While corporate activity was muted in South Africa in line with domestic economic conditions, our relationships with a number of South African multinational clients who are growing their businesses in the rest of Africa allowed us to service them across the continent. CIB is strengthening the focus on clients whose business strategies are aligned with SBG’s Africa strategy to ensure that we understand clients’ needs in order to provide them with the solutions they require to meet their strategic objectives, be it to provide them with access to capital markets, provide efficient payments or sophisticated hedging solutions. CIB has streamlined its operations and collaborates more effectively across geographies, business lines and business units to connect clients to each other and to global opportunities.
Agriculture fundingThe growth of the agriculture sector supports economic development in rural areas and creates rural employment. Economically sustainable black commercial businesses in the sector are necessary to secure its growth and drive our profitability in this market.
Standard Bank’s total black agriculture book at December 2013 was R242 million (2012: R122 million) and our target is to grow this to R1 billion by 2015. During 2013, we expanded our relationships with prominent organised agriculture organisations that focus on black economic empowerment (BEE) in the sector.
Renewable energy CIB is active in advising, arranging finance for and fundingrenewable energy projects under the South African Government’s Renewable Energy Independent Power Producer Procurement (REIPPP) Programme.
At December 2013, we had increased our funding for renewable energy projects to R14,8 billion. Renewable energy projects supported include wind power, hydro and geothermal power stations. A key development in 2013 was the Industrial and Commercial Bank of China’s (ICBC) commitment alongside Standard Bank to mobilise R20 billion in funding for renewable energy projects in South Africa. ICBC disbursed approximately R180 million to the first of these projects, a 27 megawatt wind project in the Nelson Mandela Bay area.
Policy environmentOur strategy is dependent on an effective and enabling policy environment, and we engage actively with the government and regulatory authorities on policy development and implementation.
Our support of the National Development Plan (NDP) isdemonstrated by the participation of our top executives in high-level business-government forums to reinforce the shared commitment by government and business to the NDP and to identify and remove obstacles to its implementation. This process has resulted in five bilateral working groups that focus on education and skills development; a regulatory environment conducive to investment and ease of doing business; a labour relations environment that instils investor confidence; infrastructure with an acknowledgement of the private sector’s role as a provider of skills and funding; and inclusive economic growth, looking particularly at transformation, SMEs, youth and women employment and entrepreneurship, supplier development and inequality. Standard Bank is also working with the Banking Association of South Africa (BASA), Business Leadership South Africa, the Association of Savings and Investment SA and other local banks as part of a National Treasury task team on private sector financingof infrastructure.
There are a number of concrete signs of progress in the implementation of the NDP. The government has established a Presidential Infrastructure Coordination Committee to coordinate and oversee the implementation of strategic infrastructure projects.Based on a mapping of infrastructure gaps, 17 strategic infrastructure projects have been developed and approved in transport infrastructure

11
and logistics and coal logistics. The REIPPP programme has approved 47 projects to date. Legislation has been introduced to incentivise the employment of young labour-market entrants and the Departmentof Home Affairs is working to improve administration of work permits for skilled foreign workers.
TransformationAll our business units are implementing clear action plans to achieve their internal transformation targets. Accredited BEE verification agencies and external auditors conduct independent assessments of Standard Bank’s BEE performance against the Financial Sector (FS) Codes. In 2013 we qualified as a level 2 BEE contributor in a nine-level model, with a verified overall score of 94.52, scoring particularly well for empowerment financing.
We continue to experience challenges in certain aspects of the employment equity requirements of the FS Codes, particularly with regard to black people with disabilities and black people in top and senior management positions. Our employment equity efforts, plan and targets will drive improved performance and, as we develop a new Employment Equity Plan in 2014, we will be able to assess past efforts and renew our focus on interventions that work.
PBB employs the largest staff complement in the group. 76% of junior staff, 64% of middle staff and 45% of senior staff are Black, Indian or Coloured. The PBB executive team remains the most transformed in the local banking sector with 60% being women and two-thirds being Black, Indian or Coloured executives.
Standard Bank concluded its BEE ownership transaction, Tutuwa, in October 2004, resulting in 10% direct ownership of our South African operations by the Tutuwa BEE consortium led by BEE investment companies Safika and Shanduka. In addition to Safika and Shanduka, the Tutuwa Scheme consists of the Tutuwa Managers’ Trusts for current and former black managers of SBSA, and the Tutuwa Community Trust which focuses on black SMEs and community development. In 2014, the scheme’s 10-year lock-in period will end and this may result in the dilution of our black ownership. The FS Codes note that, in the event of a dilution in the actual percentage of black ownership in a company due to black shareholders selling their shares and realising value, the dilution will not result in the dilution of the percentage of black ownership on the scorecard. However, we are actively seeking ways to facilitate the transfer of Tutuwa shares to new black investors to preserve, to the extent possible, black ownership levels beyond 2014.
The year aheadThe short-term outlook for the South African economy is subdued and we expect only a mild improvement in economic growth in 2014. The multiple pressures of competition, increased regulation and a slow economy are likely to continue to impact on the banking environment.
However, the longer-term outlook is somewhat brighter. There is growing evidence that the implementation of the NDP is gathering momentum. Empowerment transactions are creating wealth for a broad base of participants and the middle class continues to grow. There is significant future opportunity for growth in financial services as the global economy stabilises and credit growth supports banking growth, and as under-penetration in the insurance market contributes to the ongoing growth of bancassurance. Our view is that increasing competition in our political and labour environments, while disruptive in the short term, is a sign of a maturing democracy.
Standard Bank will continue to focus on protecting and growing our share of markets in which we have a competitive advantage, and on seeking new revenue streams in our rapidly changing domestic financial services environment. As the largest operating entityof SBG we will continue to support the sustainable growth, specifically by sharing our universal banking expertise and providing a strong capital and liquidity base.
Our business Our performance Governance andtransparency
Annual financialstatements
Additionalinformation

12 The Standard Bank of South Africa Annual report 2013
Our performance
Executive committeeas at 31 December 2013
Sim Tshabalala (46)
BA LLB (Rhodes), LLM(University of Notre Dame USA), HDip Tax (Wits), AMP (Harvard)
Joined the group in 2000, appointed to the executive committee in 2001.
Sim is group chief executive of SBG, chief executive of SBSA, chairman of Stanbic Africa Holdings, a director of Tutuwa Community Holdings and Stanbic IBTC Bank and the chairman of BASA.
Sim joined the group in 2000 in the project finance division of Standard Corporate Merchant Bank (SCMB). From 2001 to 2006 he was managing director of Stanbic Africa, and from 2003 he served concurrently as deputy chief executive of PBB. He was appointed chief executive of PBB in 2006. In June 2008, he was appointed chief executive of SBSA. In 2009, he was appointed deputy chief executive of SBG. In 2013, he was appointed group chief executive of SBG.
Board committee memberships
large exposure credit committee
Libby King (49)
Chief financial officer
BAcc (Wits), BCom (Wits), CA(SA)
Libby King joined the financial control department of SCMB in 1994, and was appointed head of the department in 1998. In 2008, she was appointed chief operating officer of CIB, South Africa. In 2011, Libby was appointed chief financial officer, SBSA.
Board committee memberships
large exposure credit committee
Isabel Lawrence (45)
Chief compliance officer
BA LLB (RAU), BA (Hons) (RAU), LLM in Banking Law (RAU)
Isabel Lawrence joined the group’s legal division in 1998, where she was responsible for legal risk and transacting for PBB. Isabel was appointed as head, group legal division in 2003. In January 2012, Isabel was appointed group chief compliance officer (GCCO).
Funeka Montjane (35)
Chief executive, PBB South Africa
BCom (Accounting) (Wits), BCom (Hons) (Wits), CA(SA), Masters of Commerce (University of Johannesburg)
Funeka Montjane joined SBSA in 2008 and was appointed chief financial officer of PBB South Africa. In 2010, she was appointed head of credit, PBB South Africa. In 2012, Funeka was appointed chief executive, PBB South Africa.
Funeka MontjaneIsabel LawrenceLibby KingSim Tshabalala

13
David Munro (42)
Chief executive, CIB
BCom PDGA (UCT), CA(SA), AMP (Harvard)
David Munro is the chief executive officer of CIB SBG and SBSA. In 2003, he was appointed deputy chief executive, CIB South Africa and in 2006 was appointed chief executive, CIB South Africa. He was appointed global head, investment banking in 2009 and chief executive, global CIB in 2011. In 2014, he was appointed director, Standard Bank London Holdings Limited.
Board committee memberships
large exposure credit committee
Paul Smith (59)
Chief risk officer
BCom (Natal), CA(SA), AMP (Wharton)
Paul Smith was appointed as chief risk officer (CRO) for SBG in August 2013. He reports to thechief executive and is a member of the group management committee.
He was previously the CRO of the CIB division of Standard Bank, a position he held from June 1997.
Board committee memberships
large exposure credit committee
Sharon Taylor (45)
Head, human capital
BCom (University of Natal), BCom (Hons) (Unisa)
Sharon Taylor joined the group’s education and training division in 1991. In 2002, she was appointedas head, human resources for business banking. In 2005, she assumed responsibility for the human resource partnership in South Africa. In 2011, her responsibilities increased to include human resources for global investment banking. She was appointed as head, human capital for South Africa in 2012.
David Munro Paul Smith Sharon Taylor
Our business Our performance Governance andtransparency
Annual financialstatements
Additionalinformation

14 The Standard Bank of South Africa Annual report 2013
Our performance
Finance review“The group maintained strong Basel III capital ratiosduring the year under review, attributable to internalcapital generation and a disciplined use of risk-weighted assets. The group is well placed to meet the phased-inrising capital adequacy ratios required by the SARBunder Basel III rules.”
Libby King
Chief financial officer
R10 709 millionHeadline earnings
2012
R11 461 million
12.8%Tier I capital adequacy ratio
2012
10.6%
Financial results and ratios
Change% 2013 2012*
Headline earnings Rm (7) 10 709 11 461Headline earnings per ordinary share cents (7) 17 849 19 103ROE % 14.4 18.3Tier I capital adequacy ratio1 % 12.8 10.6Net asset value per share cents 12 132 008 117 609Non-interest revenue to total income % 44.2 46.6 Credit loss ratio % 1.11 0.89Cost-to-income ratio % 56.0 54.5
* Restated.1 Tier I capital adequacy for SBSA company.
Results overviewIn an increasingly challenging economic and regulatory environment, the group has delivered a strong set of results in 2013, demonstrating our strength and resilience.
This review provides:
an analysis of the impact of the economic environment on key financial ratios
an overview of the key features of the 2013 financial results
an analysis of the group’s financial performance and financial position.

15
Impact of the economic environment on key financial ratiosThe table below sets out the key financial indicators (KFIs) that materially drive the earnings and ultimately the value of the group. The table also sets out the external economic factors influencing these value drivers (assuming no management action) and indicates how these economic factors influenced the group’s performance in 2013 and their expected impact in 2014.
KFIEconomic factors thatimpact the KFIs
Economic factor in
2013
Impact of economic
factor in 2013
Expected economic
factor in 2014
Expected impact of
economic factor on
2014 KFI
Growth in loans and advances
GDP growth
Debt-to-disposable income level –
Interest rates – –
Net interest margin Interest rates – –
Credit loss ratio
Debt-to-disposable income level –
Number of insolvencies and liquidations
Collateral values
Growth in fee and commissionrevenue
GDP growth
Inflation
Growth in trading revenueMarket trading volumes
Market price volatility
Growth in operating expenses
Average rand exchange rateagainst the USD 1 1 1 1
Inflation
Effective tax rate Corporate tax rates – – – –
Increase in economic factor/positive impact on group’s performance. Decrease in economic factor/negative impact on group’s performance.
– Neutral.1 Implies a depreciation in the exchange rate.
Our business Our performance Governance andtransparency
Annual financialstatements
Additionalinformation

16 The Standard Bank of South Africa Annual report 2013
Our performance Finance review continued
Growth in loans and advancesLoans and advances represent the largest asset class on the group’s balance sheet. They provide the group’s biggest source of revenue in the form of interest income and create cross-selling opportunities to earn transactional fees and insurance-related revenues. Growing loans and advances within the group’s accepted risk levels is, therefore, essential to increasing revenue.
Growth in loans and advances in the personal market in particular is dependent on our customers’ ability to repay debt. The debt-to-disposable income ratio measures the ability of households to service existing loans and assume further debt.
The graph below illustrates the rise in debt-to-disposableincome levels up to 2008, which drove strong growth in loans and advances.
Loans and advances Debt-to-disposable income
Loans and advances and debt�to�disposable income
800
600
400
200
2007 2008 2009 2010 2011 2012 2013
Rbn82
80
78
76
74
72
70
68
%
Since 2008, many customers have been rebuilding their balance sheets, evident from the gradual reduction in the debt-to-disposable income levels.
We do not expect debt-to-disposable income levels to reduce significantly over the short to medium term. However, a slow improvement should contribute to loan growth in 2014.
Net interest marginThe net interest margin represents the profit margin between the interest rate earned on lending products and investments, and the interest rate paid on deposits and other funding. The movement in benchmark lending rates, such as the prime interest rate, is a key factor that causes the net interest margin to vary.
When prime interest rates decline, banks charge lower rates on prime-linked lending products such as home loans, vehicle and asset finance and card products. However, the interest rate paid on deposits in transactional accounts is not prime-linked and
does not decline as much as the reduction in the interest rate earned on prime-linked lending products. This mismatch, referred to as a negative endowment impact, reduces the net interest margin.
When interest rates increase, the increase in the interestrate earned on the prime-linked lending products is greaterthan the increase in the interest rate paid on deposit balancesin transactional accounts. This results in an increase inthe net interest margin and is referred to as a positiveendowment impact.
Equity invested by ordinary shareholders is a second form of funding that gives rise to an endowment impact. As equity bears no interest cost, and equity funding is used to partially finance lending products that are prime-linked, the margin between the interest earned on lending products and the ‘free’ or equity funding will increase when interest rates rise and reduce when interest rates decline.
During 2013, interest rates were at their lowest levels in38 years, resulting in a negative endowment impact. Interest rates started to increase during 2014, which will have a positive endowment impact.
We will partially hedge the endowment risk as and when appropriate, using derivative instruments such as swaps and interest rate swaptions. Hedging strategies also factor in the partial offset of the endowment impact by a reduction in credit impairments due to lower interest rates. While low interest rates have negatively impacted net interest income, the group is well positioned for an increase in the interest cycle.
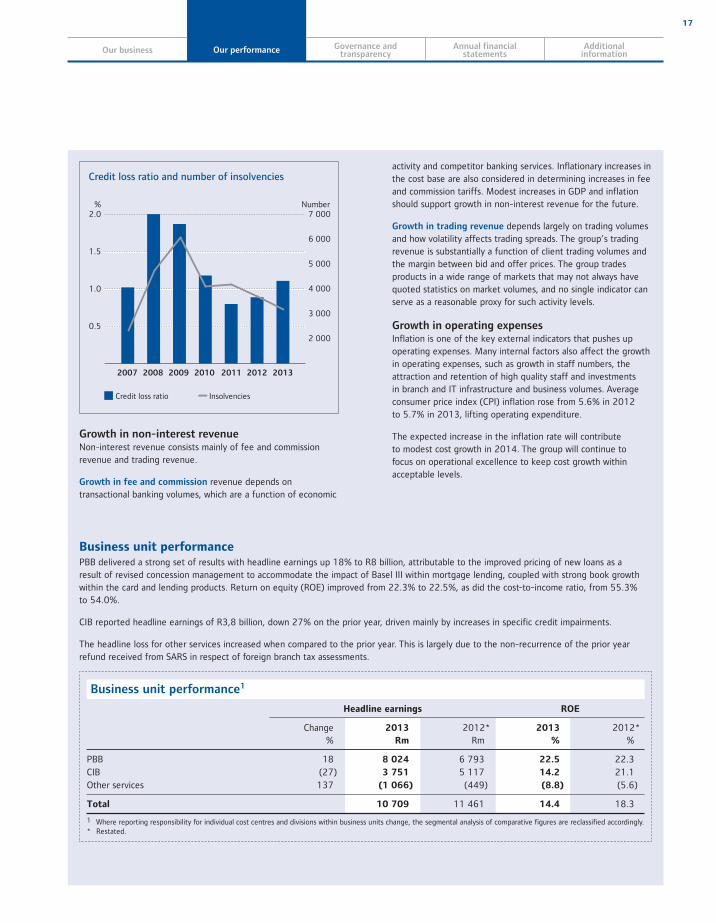
Credit loss ratioThe credit loss ratio is the credit impairment charge expressed as a percentage of the average group loans and advances balance. It indicates the loss to the group resulting from the inability of customers to repay loans. On average, in 2013, for every rand owed by customers, the group incurred a loss of 1,11 cents (2012: 0,89 cents).
Insolvencies and defaults recorded in the economy, as well as debt-to-disposable income levels described earlier, provide an indication of the stress that our customers and clients are experiencing. The graph on the following page illustrates the correlation between insolvencies and credit losses.
17
Credit loss ratio Insolvencies
Credit loss ratio and number of insolvencies
2.0
1.5
1.0
0.5
2007 2008 2009 2010 2011 2012 2013
7 000
6 000
5 000
4 000
3 000
2 000
% Number
Growth in non-interest revenueNon-interest revenue consists mainly of fee and commission revenue and trading revenue.
Growth in fee and commission revenue depends on transactional banking volumes, which are a function of economic
activity and competitor banking services. Inflationary increases in the cost base are also considered in determining increases in fee and commission tariffs. Modest increases in GDP and inflation should support growth in non-interest revenue for the future.
Growth in trading revenue depends largely on trading volumes and how volatility affects trading spreads. The group’s trading revenue is substantially a function of client trading volumes and the margin between bid and offer prices. The group trades products in a wide range of markets that may not always have quoted statistics on market volumes, and no single indicator can serve as a reasonable proxy for such activity levels.
Growth in operating expensesInflation is one of the key external indicators that pushes up operating expenses. Many internal factors also affect the growth in operating expenses, such as growth in staff numbers, the attraction and retention of high quality staff and investmentsin branch and IT infrastructure and business volumes. Average consumer price index (CPI) inflation rose from 5.6% in 2012to 5.7% in 2013, lifting operating expenditure.
The expected increase in the inflation rate will contributeto modest cost growth in 2014. The group will continue tofocus on operational excellence to keep cost growth within acceptable levels.
Business unit performancePBB delivered a strong set of results with headline earnings up 18% to R8 billion, attributable to the improved pricing of new loans as aresult of revised concession management to accommodate the impact of Basel III within mortgage lending, coupled with strong book growth within the card and lending products. Return on equity (ROE) improved from 22.3% to 22.5%, as did the cost-to-income ratio, from 55.3%to 54.0%.
CIB reported headline earnings of R3,8 billion, down 27% on the prior year, driven mainly by increases in specific credit impairments.
The headline loss for other services increased when compared to the prior year. This is largely due to the non-recurrence of the prior year refund received from SARS in respect of foreign branch tax assessments.
Business unit performance1
Headline earnings ROE
Change%
2013
Rm
2012*Rm
2013
%
2012*%
PBB 18 8 024 6 793 22.5 22.3CIB (27) 3 751 5 117 14.2 21.1Other services 137 (1 066) (449) (8.8) (5.6)
Total 10 709 11 461 14.4 18.3
1 Where reporting responsibility for individual cost centres and divisions within business units change, the segmental analysis of comparative figures are reclassified accordingly.* Restated.
Our business Our performance Governance andtransparency
Annual financialstatements
Additionalinformation
18 The Standard Bank of South Africa Annual report 2013
Our performance Finance review continued
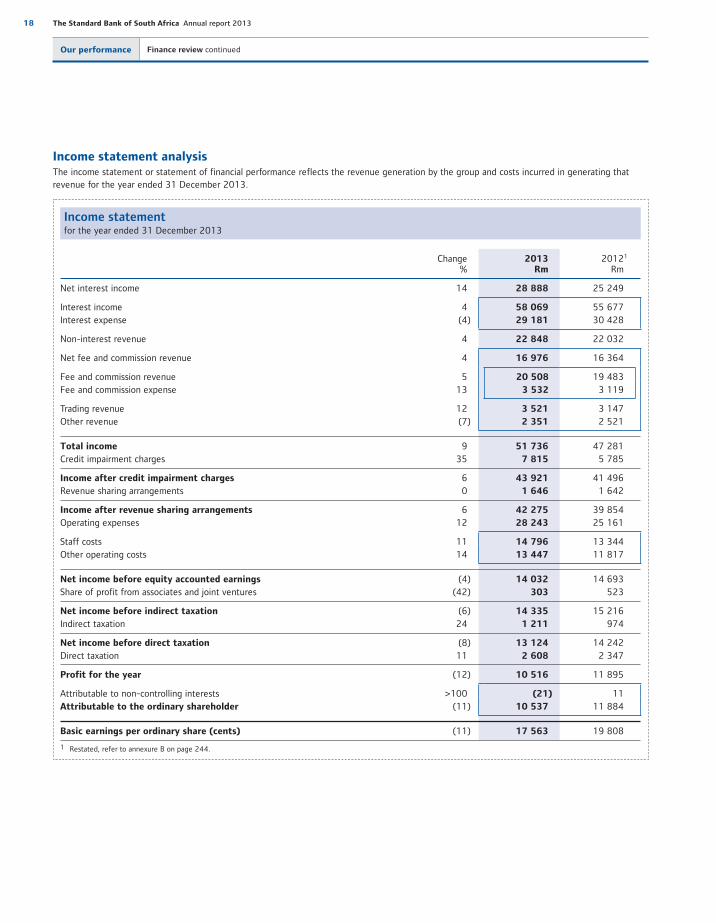
Income statement analysisThe income statement or statement of financial performance reflects the revenue generation by the group and costs incurred in generating that revenue for the year ended 31 December 2013.
Income statementfor the year ended 31 December 2013
Change%
2013Rm
20121
Rm
Net interest income 14 28 888 25 249
Interest income 4 58 069 55 677Interest expense (4) 29 181 30 428
Non-interest revenue 4 22 848 22 032
Net fee and commission revenue 4 16 976 16 364
Fee and commission revenue 5 20 508 19 483Fee and commission expense 13 3 532 3 119
Trading revenue 12 3 521 3 147Other revenue (7) 2 351 2 521
Total income 9 51 736 47 281Credit impairment charges 35 7 815 5 785
Income after credit impairment charges 6 43 921 41 496Revenue sharing arrangements 0 1 646 1 642
Income after revenue sharing arrangements 6 42 275 39 854Operating expenses 12 28 243 25 161
Staff costs 11 14 796 13 344Other operating costs 14 13 447 11 817
Net income before equity accounted earnings (4) 14 032 14 693Share of profit from associates and joint ventures (42) 303 523
Net income before indirect taxation (6) 14 335 15 216Indirect taxation 24 1 211 974
Net income before direct taxation (8) 13 124 14 242Direct taxation 11 2 608 2 347
Profit for the year (12) 10 516 11 895
Attributable to non-controlling interests >100 (21) 11Attributable to the ordinary shareholder (11) 10 537 11 884
Basic earnings per ordinary share (cents) (11) 17 563 19 808
1 Restated, refer to annexure B on page 244.
19
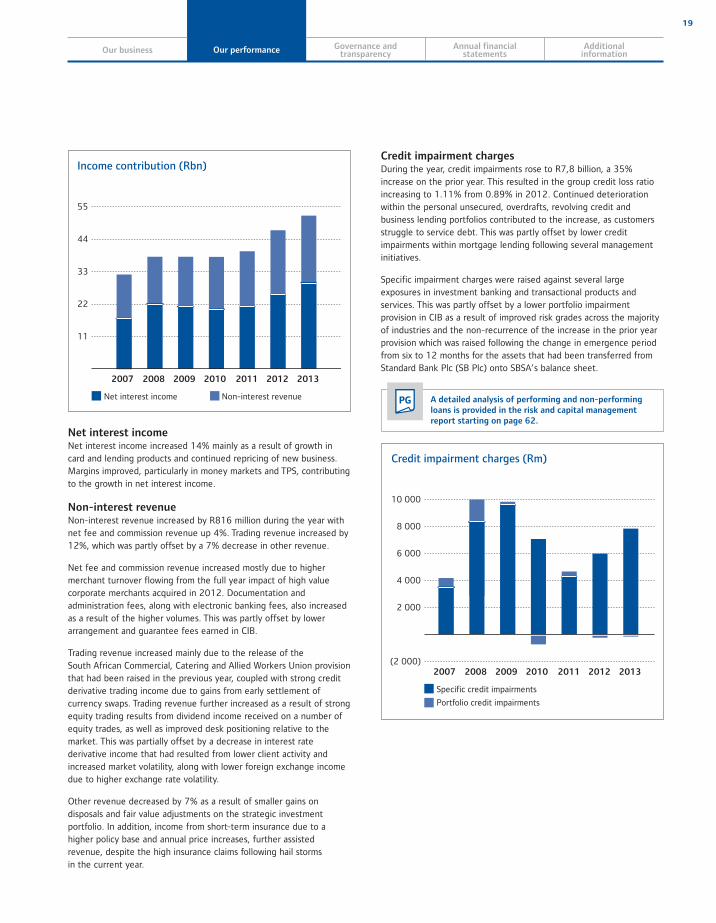
Income contribution (Rbn)
55
44
33
22
11
2007 2008 2009 2010 2011 2012 2013
Net interest income Non-interest revenue
Net interest incomeNet interest income increased 14% mainly as a result of growth in card and lending products and continued repricing of new business. Margins improved, particularly in money markets and TPS, contributing to the growth in net interest income.
Non-interest revenueNon-interest revenue increased by R816 million during the year with net fee and commission revenue up 4%. Trading revenue increased by 12%, which was partly offset by a 7% decrease in other revenue.
Net fee and commission revenue increased mostly due to higher merchant turnover flowing from the full year impact of high value corporate merchants acquired in 2012. Documentation and administration fees, along with electronic banking fees, also increased as a result of the higher volumes. This was partly offset by lower arrangement and guarantee fees earned in CIB.
Trading revenue increased mainly due to the release of theSouth African Commercial, Catering and Allied Workers Union provision that had been raised in the previous year, coupled with strong credit derivative trading income due to gains from early settlement of currency swaps. Trading revenue further increased as a result of strong equity trading results from dividend income received on a number of equity trades, as well as improved desk positioning relative to the market. This was partially offset by a decrease in interest rate derivative income that had resulted from lower client activity and increased market volatility, along with lower foreign exchange income due to higher exchange rate volatility.
Other revenue decreased by 7% as a result of smaller gains on disposals and fair value adjustments on the strategic investment portfolio. In addition, income from short-term insurance due to a higher policy base and annual price increases, further assisted revenue, despite the high insurance claims following hail storms in the current year.
Credit impairment chargesDuring the year, credit impairments rose to R7,8 billion, a 35% increase on the prior year. This resulted in the group credit loss ratio increasing to 1.11% from 0.89% in 2012. Continued deterioration within the personal unsecured, overdrafts, revolving credit and business lending portfolios contributed to the increase, as customers struggle to service debt. This was partly offset by lower credit impairments within mortgage lending following several management initiatives.
Specific impairment charges were raised against several large exposures in investment banking and transactional products and services. This was partly offset by a lower portfolio impairment provision in CIB as a result of improved risk grades across the majority of industries and the non-recurrence of the increase in the prior year provision which was raised following the change in emergence period from six to 12 months for the assets that had been transferred from Standard Bank Plc (SB Plc) onto SBSA’s balance sheet.
PG A detailed analysis of performing and non-performing loans is provided in the risk and capital management report starting on page 62.
Credit impairment charges (Rm)
10 000
8 000
6 000
4 000
2 000
(2 000)2007 2008 2009 2010 2011 2012 2013
Specific credit impairments
Portfolio credit impairments
Our business Our performance Governance andtransparency
Annual financialstatements
Additionalinformation

20 The Standard Bank of South Africa Annual report 2013
Our performance Finance review continued
Operating expensesThe group continues to invest in both staff and infrastructure in its quest to provide excellent customer service and deliver on our strategic priorities. We maintain a tight control on costs while investing for long-term growth.
Operating expenses
Change%
2013
Rm
2012Rm
Staff costs 11 14 796 13 344 Other operating expenses 14 13 447 11 817
Total operating expenses 12 28 243 25 161
Cost-to-income ratio (%) 56.0 54.5
The main contributor to the increase in operating costs was the impairment of intangible assets which is headline adjustable. Increased IT spend on software and hardware maintenance was also incurred on a number of new projects required to support business growth. Higher depreciation and amortisation costs arose due to the commissioning of several multi-year projects in 2013 to support business growth. Premises, and marketing and advertising costs also increased due to annual price increases in utilities, as well as higher operating lease costs and marketing costs incurred in respect ofthe new UCount Loyalty and Reward Programme, and groupmarketing initiatives.
Staff costs increased by 11% due to annual salary increases, an increased leave pay provision, higher incentive provisioning across the business areas and headcount growth within the branch and business channels to support customer service efficiencies.
Share of profit from associates and joint venturesThe share of profit from associates and joint ventures decreasedby 42% as a result of the non-recurrence of the prior year reversalof the RCS Investment Holdings Proprietary Limited (RCS) impairment. Lower equity accounted earnings also contributed to the decrease.
21
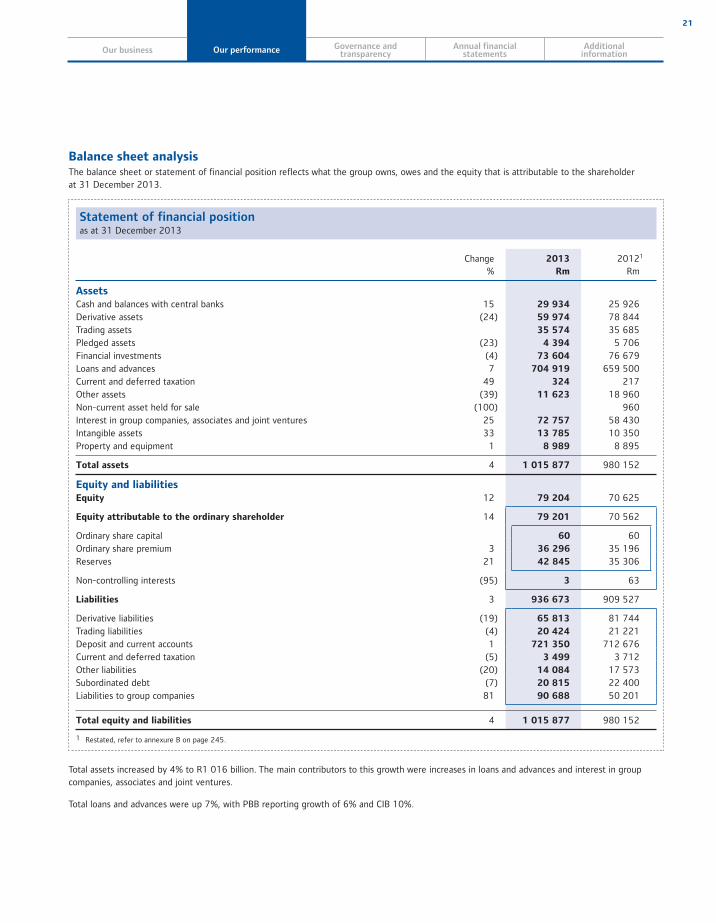
Balance sheet analysisThe balance sheet or statement of financial position reflects what the group owns, owes and the equity that is attributable to the shareholderat 31 December 2013.
Statement of financial positionas at 31 December 2013
Change%
2013
Rm
20121
Rm
AssetsCash and balances with central banks 15 29 934 25 926 Derivative assets (24) 59 974 78 844 Trading assets 35 574 35 685 Pledged assets (23) 4 394 5 706 Financial investments (4) 73 604 76 679 Loans and advances 7 704 919 659 500 Current and deferred taxation 49 324 217 Other assets (39) 11 623 18 960 Non-current asset held for sale (100) 960 Interest in group companies, associates and joint ventures 25 72 757 58 430 Intangible assets 33 13 785 10 350 Property and equipment 1 8 989 8 895
Total assets 4 1 015 877 980 152
Equity and liabilitiesEquity 12 79 204 70 625
Equity attributable to the ordinary shareholder 14 79 201 70 562
Ordinary share capital 60 60 Ordinary share premium 3 36 296 35 196 Reserves 21 42 845 35 306
Non-controlling interests (95) 3 63
Liabilities 3 936 673 909 527
Derivative liabilities (19) 65 813 81 744 Trading liabilities (4) 20 424 21 221Deposit and current accounts 1 721 350 712 676 Current and deferred taxation (5) 3 499 3 712 Other liabilities (20) 14 084 17 573 Subordinated debt (7) 20 815 22 400 Liabilities to group companies 81 90 688 50 201
Total equity and liabilities 4 1 015 877 980 152
1 Restated, refer to annexure B on page 245.
Total assets increased by 4% to R1 016 billion. The main contributors to this growth were increases in loans and advances and interest in group companies, associates and joint ventures.
Total loans and advances were up 7%, with PBB reporting growth of 6% and CIB 10%.
Our business Our performance Governance andtransparency
Annual financialstatements
Additionalinformation
22 The Standard Bank of South Africa Annual report 2013
Our performance Finance review continued
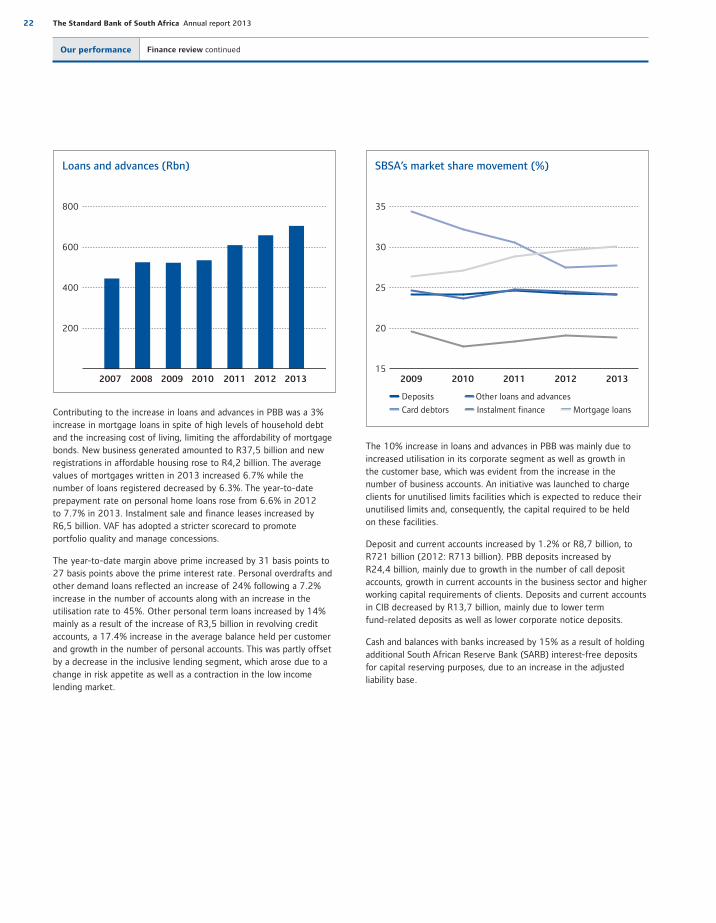
Loans and advances (Rbn)
800
600
400
200
2007 2008 2009 2010 2011 2012 2013
Contributing to the increase in loans and advances in PBB was a 3% increase in mortgage loans in spite of high levels of household debt and the increasing cost of living, limiting the affordability of mortgage bonds. New business generated amounted to R37,5 billion and new registrations in affordable housing rose to R4,2 billion. The average values of mortgages written in 2013 increased 6.7% while the number of loans registered decreased by 6.3%. The year-to-date prepayment rate on personal home loans rose from 6.6% in 2012to 7.7% in 2013. Instalment sale and finance leases increased by R6,5 billion. VAF has adopted a stricter scorecard to promoteportfolio quality and manage concessions.
The year-to-date margin above prime increased by 31 basis points to 27 basis points above the prime interest rate. Personal overdrafts and other demand loans reflected an increase of 24% following a 7.2% increase in the number of accounts along with an increase in the utilisation rate to 45%. Other personal term loans increased by 14% mainly as a result of the increase of R3,5 billion in revolving credit accounts, a 17.4% increase in the average balance held per customer and growth in the number of personal accounts. This was partly offset by a decrease in the inclusive lending segment, which arose due to a change in risk appetite as well as a contraction in the low income lending market.
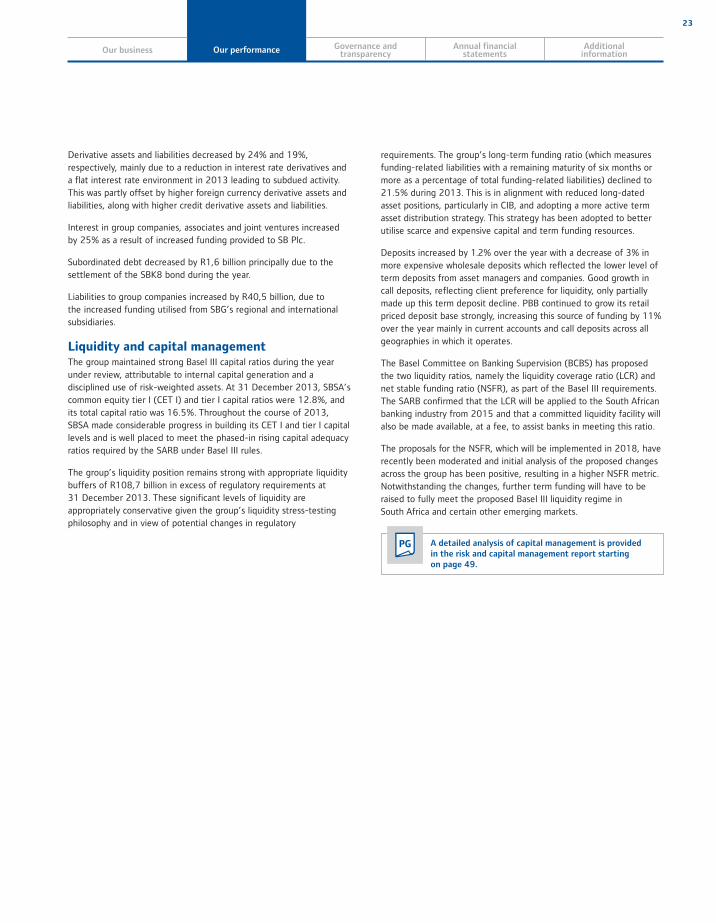
SBSA’s market share movement (%)
35
30
25
20
152009 2010 2011 2012 2013
Deposits Other loans and advances
Card debtors Instalment finance Mortgage loans
The 10% increase in loans and advances in PBB was mainly due to increased utilisation in its corporate segment as well as growth inthe customer base, which was evident from the increase in the number of business accounts. An initiative was launched to charge clients for unutilised limits facilities which is expected to reduce their unutilised limits and, consequently, the capital required to be heldon these facilities.
Deposit and current accounts increased by 1.2% or R8,7 billion, to R721 billion (2012: R713 billion). PBB deposits increased by R24,4 billion, mainly due to growth in the number of call deposit accounts, growth in current accounts in the business sector and higher working capital requirements of clients. Deposits and current accounts in CIB decreased by R13,7 billion, mainly due to lower term fund-related deposits as well as lower corporate notice deposits.
Cash and balances with banks increased by 15% as a result of holding additional South African Reserve Bank (SARB) interest-free deposits for capital reserving purposes, due to an increase in the adjusted liability base.
23
Derivative assets and liabilities decreased by 24% and 19%, respectively, mainly due to a reduction in interest rate derivatives and a flat interest rate environment in 2013 leading to subdued activity. This was partly offset by higher foreign currency derivative assets and liabilities, along with higher credit derivative assets and liabilities.
Interest in group companies, associates and joint ventures increased by 25% as a result of increased funding provided to SB Plc.
Subordinated debt decreased by R1,6 billion principally due to the settlement of the SBK8 bond during the year.
Liabilities to group companies increased by R40,5 billion, due tothe increased funding utilised from SBG’s regional and international subsidiaries.
Liquidity and capital managementThe group maintained strong Basel III capital ratios during the year under review, attributable to internal capital generation and a disciplined use of risk-weighted assets. At 31 December 2013, SBSA’s common equity tier I (CET I) and tier I capital ratios were 12.8%, and its total capital ratio was 16.5%. Throughout the course of 2013, SBSA made considerable progress in building its CET I and tier I capital levels and is well placed to meet the phased-in rising capital adequacy ratios required by the SARB under Basel III rules.
The group’s liquidity position remains strong with appropriate liquidity buffers of R108,7 billion in excess of regulatory requirements at31 December 2013. These significant levels of liquidity are appropriately conservative given the group’s liquidity stress-testing philosophy and in view of potential changes in regulatory
requirements. The group’s long-term funding ratio (which measures funding-related liabilities with a remaining maturity of six months or more as a percentage of total funding-related liabilities) declined to 21.5% during 2013. This is in alignment with reduced long-dated asset positions, particularly in CIB, and adopting a more active term asset distribution strategy. This strategy has been adopted to better utilise scarce and expensive capital and term funding resources.
Deposits increased by 1.2% over the year with a decrease of 3% in more expensive wholesale deposits which reflected the lower level of term deposits from asset managers and companies. Good growth in call deposits, reflecting client preference for liquidity, only partially made up this term deposit decline. PBB continued to grow its retail priced deposit base strongly, increasing this source of funding by 11% over the year mainly in current accounts and call deposits across all geographies in which it operates.
The Basel Committee on Banking Supervision (BCBS) has proposed the two liquidity ratios, namely the liquidity coverage ratio (LCR) and net stable funding ratio (NSFR), as part of the Basel III requirements. The SARB confirmed that the LCR will be applied to the South African banking industry from 2015 and that a committed liquidity facility will also be made available, at a fee, to assist banks in meeting this ratio.
The proposals for the NSFR, which will be implemented in 2018, have recently been moderated and initial analysis of the proposed changes across the group has been positive, resulting in a higher NSFR metric. Notwithstanding the changes, further term funding will have to be raised to fully meet the proposed Basel III liquidity regime inSouth Africa and certain other emerging markets.
PG A detailed analysis of capital management is provided in the risk and capital management report starting on page 49.
Our business Our performance Governance andtransparency
Annual financialstatements
Additionalinformation
24 The Standard Bank of South Africa Annual report 2013
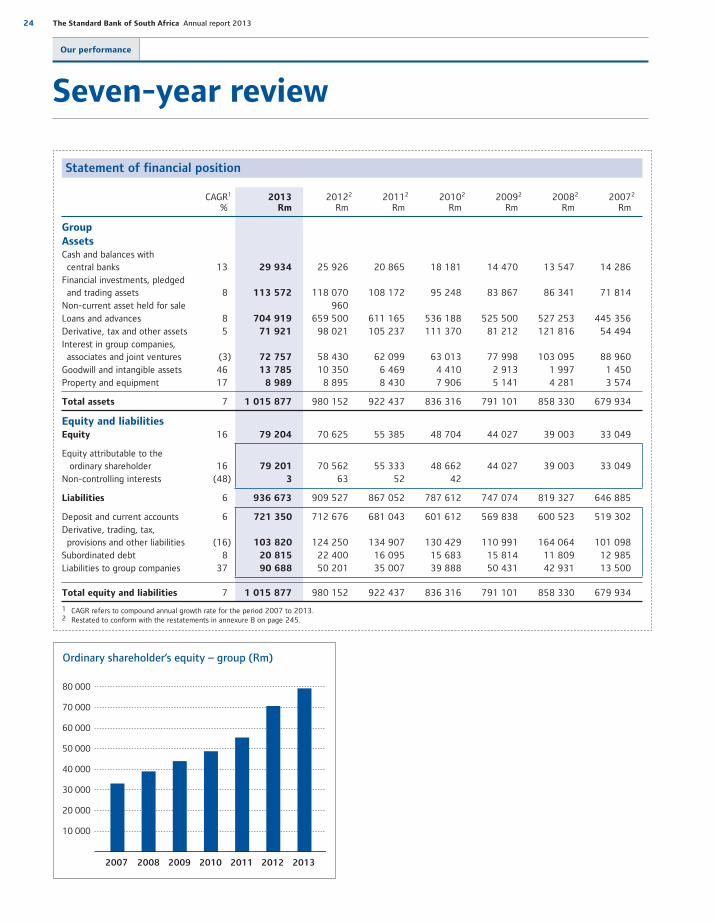
Statement of financial position
CAGR1
%2013
Rm20122
Rm20112
Rm20102
Rm20092
Rm20082
Rm20072
Rm
Group
AssetsCash and balances with central banks 13 29 934 25 926 20 865 18 181 14 470 13 547 14 286Financial investments, pledged and trading assets 8 113 572 118 070 108 172 95 248 83 867 86 341 71 814Non-current asset held for sale 960Loans and advances 8 704 919 659 500 611 165 536 188 525 500 527 253 445 356Derivative, tax and other assets 5 71 921 98 021 105 237 111 370 81 212 121 816 54 494Interest in group companies, associates and joint ventures (3) 72 757 58 430 62 099 63 013 77 998 103 095 88 960Goodwill and intangible assets 46 13 785 10 350 6 469 4 410 2 913 1 997 1 450Property and equipment 17 8 989 8 895 8 430 7 906 5 141 4 281 3 574
Total assets 7 1 015 877 980 152 922 437 836 316 791 101 858 330 679 934
Equity and liabilitiesEquity 16 79 204 70 625 55 385 48 704 44 027 39 003 33 049
Equity attributable to the ordinary shareholder 16 79 201 70 562 55 333 48 662 44 027 39 003 33 049Non-controlling interests (48) 3 63 52 42
Liabilities 6 936 673 909 527 867 052 787 612 747 074 819 327 646 885
Deposit and current accounts 6 721 350 712 676 681 043 601 612 569 838 600 523 519 302Derivative, trading, tax, provisions and other liabilities (16) 103 820 124 250 134 907 130 429 110 991 164 064 101 098Subordinated debt 8 20 815 22 400 16 095 15 683 15 814 11 809 12 985Liabilities to group companies 37 90 688 50 201 35 007 39 888 50 431 42 931 13 500
Total equity and liabilities 7 1 015 877 980 152 922 437 836 316 791 101 858 330 679 934
1 CAGR refers to compound annual growth rate for the period 2007 to 2013.2 Restated to conform with the restatements in annexure B on page 245.
Ordinary shareholder’s equity – group (Rm)
80 000
70 000
60 000
50 000
40 000
30 000
20 000
10 000
2013201220112010200920082007
Seven-year review
Our performance
25
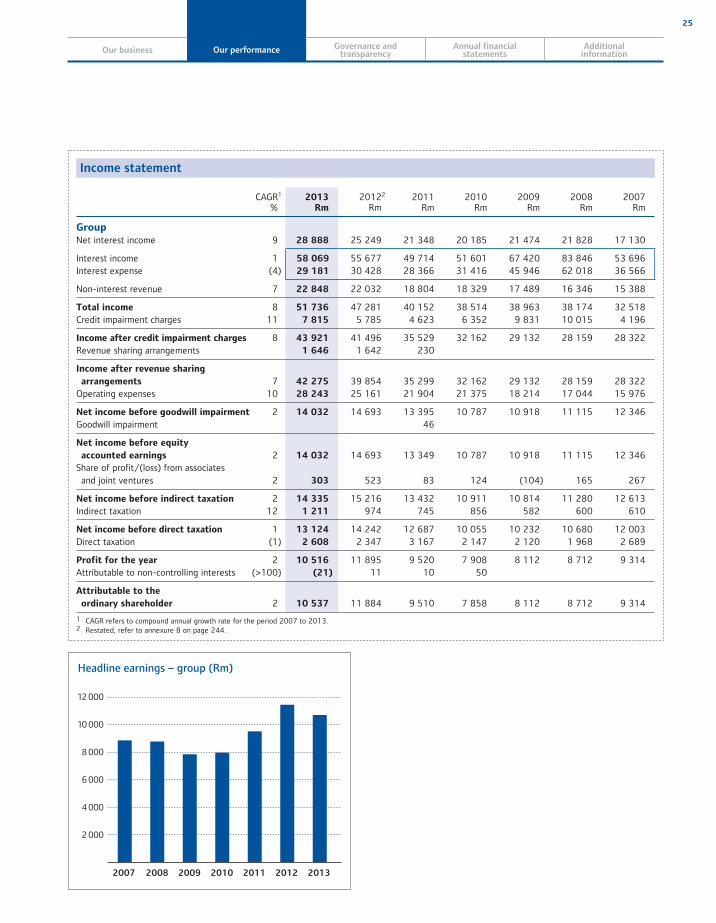
Income statement
CAGR1
%2013
Rm20122
Rm2011
Rm2010
Rm2009
Rm2008
Rm2007
Rm
GroupNet interest income 9 28 888 25 249 21 348 20 185 21 474 21 828 17 130
Interest income 1 58 069 55 677 49 714 51 601 67 420 83 846 53 696Interest expense (4) 29 181 30 428 28 366 31 416 45 946 62 018 36 566
Non-interest revenue 7 22 848 22 032 18 804 18 329 17 489 16 346 15 388
Total income 8 51 736 47 281 40 152 38 514 38 963 38 174 32 518Credit impairment charges 11 7 815 5 785 4 623 6 352 9 831 10 015 4 196
Income after credit impairment charges 8 43 921 41 496 35 529 32 162 29 132 28 159 28 322Revenue sharing arrangements 1 646 1 642 230
Income after revenue sharing
arrangements 7 42 275 39 854 35 299 32 162 29 132 28 159 28 322Operating expenses 10 28 243 25 161 21 904 21 375 18 214 17 044 15 976
Net income before goodwill impairment 2 14 032 14 693 13 395 10 787 10 918 11 115 12 346Goodwill impairment 46
Net income before equity
accounted earnings 2 14 032 14 693 13 349 10 787 10 918 11 115 12 346Share of profit/(loss) from associates and joint ventures 2 303 523 83 124 (104) 165 267
Net income before indirect taxation 2 14 335 15 216 13 432 10 911 10 814 11 280 12 613Indirect taxation 12 1 211 974 745 856 582 600 610
Net income before direct taxation 1 13 124 14 242 12 687 10 055 10 232 10 680 12 003Direct taxation (1) 2 608 2 347 3 167 2 147 2 120 1 968 2 689
Profit for the year 2 10 516 11 895 9 520 7 908 8 112 8 712 9 314Attributable to non-controlling interests (>100) (21) 11 10 50
Attributable to the
ordinary shareholder 2 10 537 11 884 9 510 7 858 8 112 8 712 9 314
1 CAGR refers to compound annual growth rate for the period 2007 to 2013.2 Restated, refer to annexure B on page 244.
Headline earnings – group (Rm)
12 000
10 000
8 000
6 000
4 000
2 000
2013201220112010200920082007
Our business Our performance Governance andtransparency
Annual financialstatements
Additionalinformation
26 The Standard Bank of South Africa Annual report 2013
Our performance Seven-year review continued
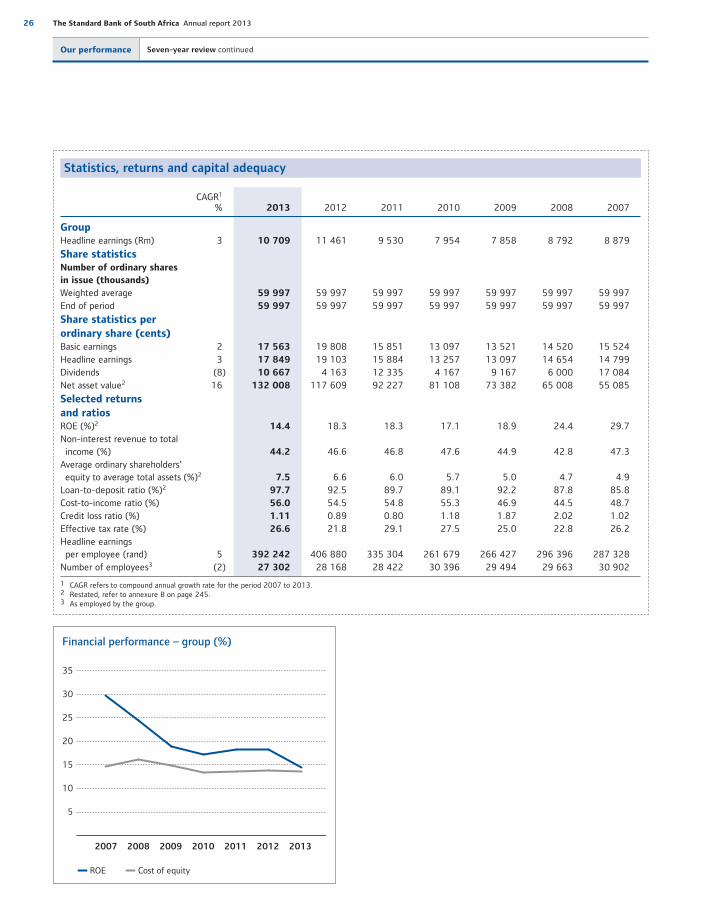
Statistics, returns and capital adequacy
CAGR1
% 2013 2012 2011 2010 2009 2008 2007
GroupHeadline earnings (Rm) 3 10 709 11 461 9 530 7 954 7 858 8 792 8 879
Share statisticsNumber of ordinary shares
in issue (thousands)
Weighted average 59 997 59 997 59 997 59 997 59 997 59 997 59 997End of period 59 997 59 997 59 997 59 997 59 997 59 997 59 997
Share statistics per
ordinary share (cents)Basic earnings 2 17 563 19 808 15 851 13 097 13 521 14 520 15 524Headline earnings 3 17 849 19 103 15 884 13 257 13 097 14 654 14 799Dividends (8) 10 667 4 163 12 335 4 167 9 167 6 000 17 084Net asset value2 16 132 008 117 609 92 227 81 108 73 382 65 008 55 085
Selected returns
and ratiosROE (%)2 14.4 18.3 18.3 17.1 18.9 24.4 29.7Non-interest revenue to total income (%) 44.2 46.6 46.8 47.6 44.9 42.8 47.3Average ordinary shareholders’ equity to average total assets (%)2 7.5 6.6 6.0 5.7 5.0 4.7 4.9Loan-to-deposit ratio (%)2 97.7 92.5 89.7 89.1 92.2 87.8 85.8Cost-to-income ratio (%) 56.0 54.5 54.8 55.3 46.9 44.5 48.7Credit loss ratio (%) 1.11 0.89 0.80 1.18 1.87 2.02 1.02Effective tax rate (%) 26.6 21.8 29.1 27.5 25.0 22.8 26.2Headline earnings per employee (rand) 5 392 242 406 880 335 304 261 679 266 427 296 396 287 328Number of employees3 (2) 27 302 28 168 28 422 30 396 29 494 29 663 30 902
1 CAGR refers to compound annual growth rate for the period 2007 to 2013.2 Restated, refer to annexure B on page 245.3 As employed by the group.
ROE Cost of equity
Financial performance – group (%)
35
30
25
20
15
10
5
2013201220112010200920082007

27
Statistics, returns and capital adequacy continued
CAGR1
% 2013 20122 2011 2010 2009 2008 2007
Company
Capital adequacy3
Risk-weighted assets (Rm) 6 489 045 528 266 430 484 368 262 367 839 358 752 340 929Tier I capital (Rm) 14 62 379 55 988 46 214 42 172 38 946 33 344 28 922Total capital (Rm) 12 80 680 72 694 58 284 54 965 51 853 43 826 40 042Tier I capital adequacy ratio (%) 12.8 10.6 10.7 11.5 10.6 9.3 8.5Total capital adequacy ratio (%) 16.5 13.8 13.5 14.9 14.1 12.2 11.7Headline earnings (Rm) 2 10 279 11 140 9 489 7 697 8 121 8 728 8 885Return on average
risk-weighted assets (%) 2.0 2.3 2.4 2.1 2.2 2.5 2.7
Rand exchange rates at
31 DecemberUSD 10,49 8,48 8,09 6,64 7,37 9,31 6,81GBP 17,36 13,71 12,48 10,29 11,88 13,64 13,64EUR 14,44 11,18 10,46 8,87 10,61 13,02 10,00
Market indicators at
31 DecemberSA prime overdraft rate (%) 8.5 8.5 9.0 9.0 10.5 15.0 14.5JSE4 All Share Index 8 46 256 39 250 31 986 32 119 27 666 21 509 28 958JSE4 Banks Index 8 57 745 53 362 41 178 40 985 36 675 30 566 35 876
1 CAGR refers to compound annual growth rate for the period 2007 to 2013.2 Restated, refer to annexure B on page 244.3 Basel II was implemented 1 January 2008. Capital adequacy for 2007 is on a Basel II pro forma basis. 2008 to 2011 are on a Basel II basis. Basel III was implemented
1 January 2013. 2012 is on a pro forma Basel III basis.4 JSE Limited, the licensed securities exchange in Johannesburg.
Total capital adequacy ratio – company (%)
18
15
12
9
6
3
2013201220112010200920082007
Our business Our performance Governance andtransparency
Annual financialstatements
Additionalinformation

28 The Standard Bank of South Africa Annual report 2013
Our performance
Sustainability report
Sustainability is an integral part of our business strategy
We proactively embed sustainability thinking and sustainable business practices at every level of our business. We believe that our most important contribution to sustainable development is to operate an effective and profitable bank.
recruiting, retaining and motivating our employees
delivering sustainable long-term financial performance.
Our analysis of how we manage these material issues and their
impact on our operations revealed the intricate and complex
inter-relationships that exist between them. By way of a simplified
example, managing the pace, volume and scale of regulatory change
requires that we have IT systems in place that are flexible enough
to enable adaptations to processes and procedures, and allow
for ongoing monitoring and compliance. This has implications
for the capabilities of our IT infrastructure and our investment
decisions in relation to systems renewal. Changes in processes and
procedures, and the underlying systems, also affect our customer
and employee relationships, for instance through potential
disruptions to customer service and the need for staff training.
All of these factors have material cost implications that affect
our financial performance.
We have attempted to illustrate these complex relationships in the
diagram on the following page.
Benchmarking
2013 Bloomberg Markets Magazine one of the world’s top 40 greenest banks
2013 JSE Socially Responsible
Investment Index Standard Bank was included in the index and has again been identified as a best performer and was the only company to retain its position in this category for the seventh consecutive year
2013 Dow Jones Sustainability Index score was 72% (2012: 70%)
2013 Carbon Disclosure Project
Standard Bank scored 71% (2012: 74%)
BEE transformation score 94.52 outof 107
By providing responsible access to credit, savings and insurance products, we enable individuals to improve their quality of life and enhance their financial security. By providing finance to large and small businesses we facilitate economic growth and job creation and, by financing infrastructure and the development of key sectors, we assist in resolving global challenges such as energy and food scarcity, resource depletion and climate change.
The very nature of our business positions us to help our customers and stakeholders manage social and environmental challenges and invest for the future, which in turn contributes to the viability and sustainable growth of local markets and national economies. The success of our customers, clients and stakeholders guarantees future business, which underpins our sustainability.
SR For more information refer to the SBG sustainability report available at www.standardbank.com/sustainability>approach>managing sustainable development
Our material issuesIn formulating our strategy and determining our strategic priorities,we consider the full range of issues that influence the sustainabilityof our business and the social, economic and physical environments we operate in and which, in turn, have a direct impact on ourfuture viability.
An issue is material when it impacts our ability to remain commercially viable and socially relevant to the societies we operate in. In particular, material issues are those that have a strong bearing on our stakeholders’ assessments and decisions about SBG’s long-term sustainability and its commitment to their needs. We also take into consideration those factors that affect the financial stability and growth of economies and, in turn, our business. Effectively managing our material issues is critical to achieving our strategic objectives.
During 2013, we undertook an extensive exercise to update our material issues. The process we followed produced the followingsix material issues that are interrelated and therefore not rankedin any particular order:
managing the opportunities and risks of our strategy
pace, volume and scale of regulatory change
establishing and maintaining cost-effective, efficient and relevant IT infrastructure
knowing our customers and doing the right business with them in the right way
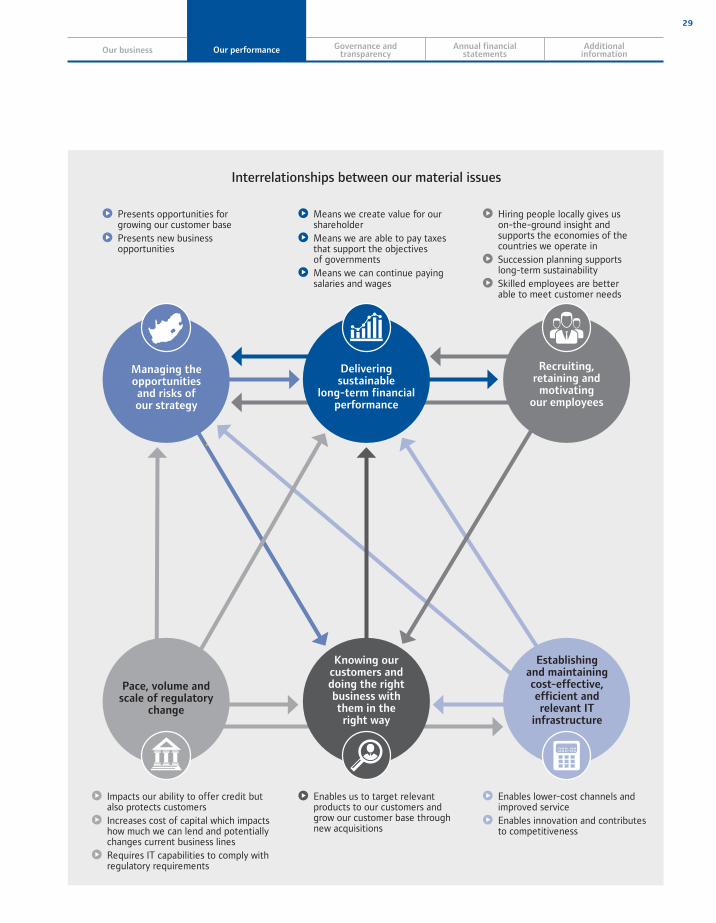
29
Interrelationships between our material issues
Means we create value for our shareholder
Means we are able to pay taxes that support the objectives of governments
Means we can continue paying salaries and wages
Presents opportunities for growing our customer base
Presents new business opportunities
Enables lower-cost channels andimproved service
Enables innovation and contributes to competitiveness
Enables us to target relevant products to our customers and grow our customer base through new acquisitions
Impacts our ability to offer credit but also protects customers
Increases cost of capital which impacts how much we can lend and potentially changes current business lines
Requires IT capabilities to comply with regulatory requirements
Hiring people locally gives uson-the-ground insight and supports the economies of the countries we operate in
Succession planning supportslong-term sustainability
Skilled employees are betterable to meet customer needs
Pace, volume and scale of regulatory
change
Delivering sustainable
long-term financial performance
Managing the opportunities and risks ofour strategy
Recruiting, retaining and
motivating our employees
Establishingand maintainingcost-effective, efficient and relevant IT
infrastructure
Knowing our customers and doing the right business with them in the right way
Our business Our performance Governance andtransparency
Annual financialstatements
Additionalinformation
30 The Standard Bank of South Africa Annual report 2013
Our performance Sustainability report continued
AssuranceThe Code of Corporate Practices and Conduct set out in the King report on Corporate Governance for South Africa 2009 (King Code) advocates that sustainability reporting and disclosure should be independently assured. SBG’s sustainability report has been independently assured since 2005. The 2013 sustainability report has been assured by KPMG services Proprietary Limited. Assurance was provided over 10 key performance indicators with six of these indicators assured at a reasonable assurance level and the remaining four at a limited assurance level. The full assurance report may be found in SBG’s sustainability report. The summarised sustainability information included on the following pages has been extracted from SBG’s sustainability report.
SR For a comprehensive understanding of the assurance performed and our sustainability performance, referto the SBG sustainability report.
Stakeholder engagementOur relationships with all our stakeholders impact directly and indirectly on our business activities and reputation. We proactively engage with stakeholders to inform our business strategy and operations, shape our products and services, manage and respond to social expectations, minimise reputational risk and influence the environment in which we do business.
The ways in which we engage with our stakeholders, and the frequency with which we do so, vary according to each stakeholder group. Engagement is based on identified issues and areas of concern that may impact our stakeholders. We use a decentralised stakeholder engagement model in which individual business units undertake stakeholder engagement appropriate to their areas and are responsible for identifying stakeholder concerns and taking appropriate action. At the centre, the SBG board of directors(SBG board), and in particular the SBG social and ethics committee, oversees all engagement and plays a key role in analysing relevant issues and concerns and providing guidance on appropriate responses.
We actively identify and respond to misalignments, conflicts and concerns between our actions and our stakeholders’ expectations.We aim to resolve such issues at the business unit or countrylevel, with coordination, support and oversight provided by the communications and stakeholder relations unit. Where appropriate, issues are escalated to executive level.
SR Refer to the detailed stakeholder engagement tablein the SBG sustainability report.
Helping to transform economies – transformation
We view transformation as an ongoing change process through which we seekto become relevant in, responsive to and reflective of the environments in whichwe operate.
The private sector plays a central role in the economic development of a nation. In addition to our role as a taxpayer, investor and employer, we contribute to the upliftment of marginalised communities through our business activities, including financing and supporting small businesses which in turn encourage growth and employment creation. In addition, we invest in infrastructure development, finance and advise governments and facilitate trade between markets. Our procurement spending and corporate social investment (CSI) also encourage economic and social development.
EmploymentOur research shows that the sectors that contributed the most to the total employment increase in the third quarter of 2013 were trade, community and social services; and finance and other business services. Standard Bank research indicates that the local financial and insurance sector in South Africa has a formal employment multiplier of approximately 3.2 which means that domestically for each R1 million in demand for the sector’s output; 3.2 formal jobs are sustained in the economy. This includes the sector’s impact through direct, indirect, and induced impacts. SBSA sustains, directly and indirectly, 87 900 (2012: 90 400) jobs in the broader South African economy. Assuming that each of these jobs supports a further four dependants, our activities could be seen to support approximately 351 600 (2012: 361 600) individuals.
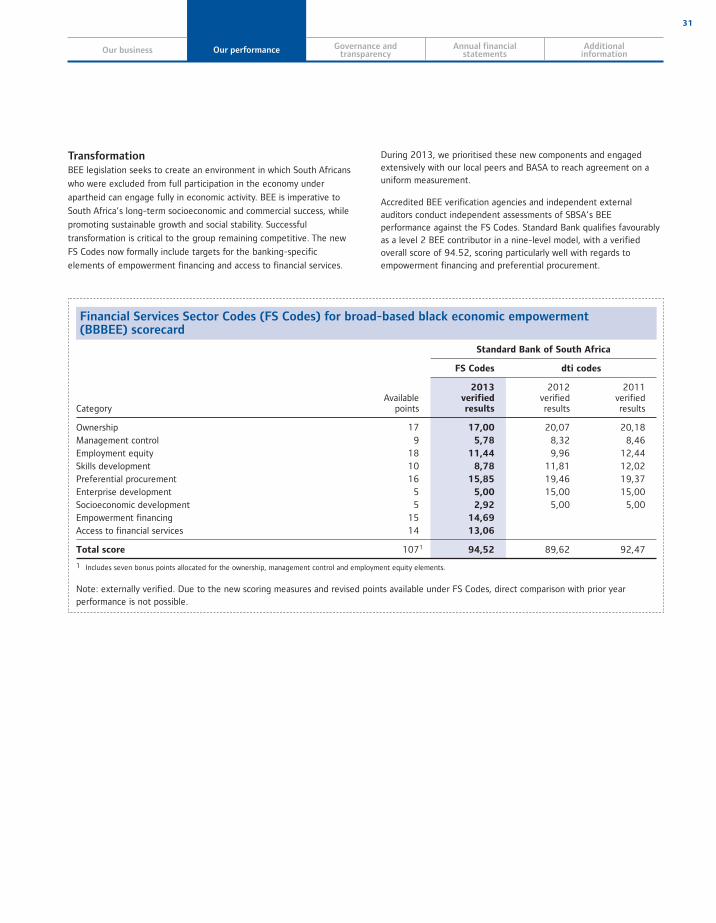
31
TransformationBEE legislation seeks to create an environment in which South Africans
who were excluded from full participation in the economy under
apartheid can engage fully in economic activity. BEE is imperative to
South Africa’s long-term socioeconomic and commercial success, while
promoting sustainable growth and social stability. Successful
transformation is critical to the group remaining competitive. The new
FS Codes now formally include targets for the banking-specific
elements of empowerment financing and access to financial services.
During 2013, we prioritised these new components and engaged extensively with our local peers and BASA to reach agreement on a uniform measurement.
Accredited BEE verification agencies and independent external auditors conduct independent assessments of SBSA’s BEE performance against the FS Codes. Standard Bank qualifies favourably as a level 2 BEE contributor in a nine-level model, with a verified overall score of 94.52, scoring particularly well with regards to empowerment financing and preferential procurement.
Financial Services Sector Codes (FS Codes) for broad-based black economic empowerment (BBBEE) scorecard
CategoryAvailable
points
Standard Bank of South Africa
FS Codes dti codes
2013 verifiedresults
2012verifiedresults
2011verifiedresults
Ownership 17 17,00 20,07 20,18Management control 9 5,78 8,32 8,46Employment equity 18 11,44 9,96 12,44Skills development 10 8,78 11,81 12,02Preferential procurement 16 15,85 19,46 19,37Enterprise development 5 5,00 15,00 15,00Socioeconomic development 5 2,92 5,00 5,00Empowerment financing 15 14,69
Access to financial services 14 13,06
Total score 1071 94,52 89,62 92,47
1 Includes seven bonus points allocated for the ownership, management control and employment equity elements.
Note: externally verified. Due to the new scoring measures and revised points available under FS Codes, direct comparison with prior year performance is not possible.
Our business Our performance Governance andtransparency
Annual financialstatements
Additionalinformation

32 The Standard Bank of South Africa Annual report 2013
Our performance Sustainability report continued
Employment equity targets are set annually for the representation of black people, women and people with disabilities at all occupation levels. Our progression is reported annually to the Department of Labour and is set out in the table below:
Summary of employment equity progress report 2013
Occupational levels
Male Female Foreign nationals
TotalA C I W A C I W Male Female
Top management 11 1 5 70 6 2 4 18 17 5 139
Senior management 192 102 279 922 135 64 166 444 113 48 2 465
Professionally qualified and experienced specialists and mid-management 1 168 413 739 1 284 1 074 561 829 1 259 128 86 7 541
Skilled technical and academically qualified workers, junior management, supervisors, foremen, and superintendents 2 230 887 567 549 4 571 2 440 1 447 2 049 29 98 14 867
Semi-skilled and discretionary decision-making 646 171 74 44 1 131 483 184 327 2 12 3 074
Total permanent 4 247 1 574 1 664 2 869 6 917 3 550 2 630 4 097 289 249 28 086Temporary employees 180 15 18 29 179 33 24 33 7 3 521
Grand total 4 427 1 589 1 682 2 898 7 096 3 583 2 654 4 130 296 252 28 6071
A = African C = Coloured I = Indian W = White1 Includes temporary staff and all Africa personnel located in South Africa and as measured at 30 September 2013.
A comprehensive and consolidated BEE report is available online at www.standardbank.com/sustainability>socioeconomic>
transformation
OwnershipStandard Bank concluded its BEE ownership transaction, Tutuwa, in October 2004, resulting in 10% direct ownership of our South African operations by the Tutuwa BEE consortium led by well-established BEE investment companies Safika and Shanduka. The Tutuwa Scheme also consists of the Tutuwa Managers’ Trusts for current and former black managers of SBSA, and the Tutuwa Community Trust which focuses on black SMEs and community development.
Since implementation and at the share price at end December 2013, Tutuwa has generated unrealised value of R6 billion together with cash distributions amounting to R1,8 billion. During 2013, our dividend payouts amounted to approximately R139 million to6 188 Tutuwa Managers Trusts beneficiaries and R43 million to the 261 black SMEs participating in the Tutuwa Community Trust. Of these black SMEs, 24 are 100% black women-owned and 39 have women ownership of 50% or higher.
Public sector bankingWe provide government with a comprehensive offering that includes transactional banking services, business lending and investments. We focus on understanding the needs of the public sector environment and developing innovative solutions that are relevant to all spheres of government.
Our technological and financial platforms enable us to provide administrative efficiencies that meet the large volumes of transactions required by our public sector clients without compromising the quality of our service.
Preferential procurementDuring 2013, we met our targets for preferential procurementand scored 15,85 points out of a possible 16. Standard Bank isa level 2 BEE contributor and is classified as a value-adding supplier,a benefit that accrues to those that utilise the bank as a supplier. Addressable spend refers to the third party spend with suppliers where we are able to influence spend through negotiation or other mechanisms. The addressable procurement spend in South Africa amounted to approximately R17,2 billion (2012: R16,0 billion). Standard Bank’s weighted procurement spend from BEE suppliersin 2013 amounted to R16,1 billion (2012: R11,7 billion), anincrease of 38% compared to 2012. Some 68% of our total procurement spend in South Africa is spent with our top 100 suppliers, 80% of whom have a level four BEE rating or better.

33
Black-owned Black women-owned
Procurement spend with black SMEs (Rm)
1 000
800
600
400
200
2011 2012 2013
Lending and investing responsibly
IndebtednessThe supply of credit is critical to economic development and growth, and is a fundamental service that banks provide. Our objective is to lend responsibly, in compliance with legislation and based on stringent affordability and credit-granting criteria. Changing global economic conditions and local socioeconomic conditions, such as rising unemployment, continued to put pressure on customers during 2013, impacting their ability to repay their debts.
In the FinScope South Africa 2013 financial survey it is estimated that around five million South Africans are battling with over-indebtedness. Of particular concern is that 19% of borrowers surveyed indicated that they borrow money to pay bills, monthly fees or unexpected personal expenses, indicating insufficient personal financial management.
Loan assessments
In South Africa we provide home loans, personal loans and business loans to retail and business clients. During the year, loss on bad debts increased by 18% compared to 2012. We have made our affordability calculations more conservative across all portfolios to counter the higher levels of debt in the market and to reduce losses. We use information from credit bureaus, our own records and customer-supplied information to determine whether a customer can afford a loan.
Home loans
The performance of our mortgage portfolio remained resilient despite economic pressure and the non-performing loan portion of the portfolio continued to reduce year-on-year. At December 2013,the total value of our home loan book was R295,9 billion(2012: R288,8 billion), of which R69 billion (2012: R64 billion)was granted during the year, a 7.8% increase in loans granted
compared to 2012. Non-performing loans stood at 4.6% andour credit loss ratio moved from 0.9% at the beginning of the yearto 0.8% at December.
Unsecured lending
Unsecured loans are used by individuals to build and renovate their homes, educate their children and provide for unforeseen events, among others. The growth in unsecured lending was again an area of concern in South Africa during 2013. Unsecured lending requires no security from a customer for a loan to be granted. Our unsecured lending includes overdrafts, revolving credit plans, personal term loans, credit cards, medium-term loans, advance accounts and student loans.
We comply fully with all legislation and banking codes of practicethat relate to unsecured lending. We do not undertake practicessuch as debt consolidation to extend further credit and re-advances which can lead to customer over-indebtedness. Around four outof five of our unsecured loans in South Africa are granted to customers that hold their primary transactional account with us.This enables us to better assess the customer’s unique circumstances and thereby offer better interest rates and terms for the loan, aswell as provide assistance should the customer encounter financial difficulties given our understanding of their financial behaviour.Our inclusive banking customers have been very hard hit by increasing costs of living. Having scaled back our lending to these customersand revising our risk appetite, a 7% decrease in impairmentcharges was achieved for this market segment compared to 2012with the loan book at R2,9 billion. Despite this marginal growth there was a 22% growth in the loan book for other personal unsecured lending in the middle-end of the market with products like our revolving credit plan. Together with BASA, the National Treasury, the SARB and the Financial Services Board (FSB), we have signed an industry Credit Accord agreement to promote responsible lending.
Customers in financial difficulty
We strive to proactively assist customers who find themselves in financial hardship where possible. Customers can request that their loan be restructured to provide them with access to short-term cash flow relief. Where financial hardship requires a longer-term and more sustainable solution across multiple products, the Credit Customer Assist team takes a holistic view of the customer’s debt, income and expenditure, and then restructures and consolidates loan repayments across their secured and unsecured products. The majority of successful outcomes facilitated are derived from home loan restructures and unsecured debt consolidations. During the year, we helped 26 019 (2012: 36 720) distressed customers through our Credit Customer Assist function, with a total outstanding loan obligation of greater than R12,9 billion (2012: R11,9 billion).
At December 2013, 81 531 (2012: 76 392) customers were under debt review, an increase of 7% from the start of the year. Of the customers who exited the debt review process during 2013, 39% (2012: 37%) were successfully rehabilitated while the remainder have been moved further along the legal process. We only take the route of legal foreclosure as a last resort. This takes place outside
Our business Our performance Governance andtransparency
Annual financialstatements
Additionalinformation

34 The Standard Bank of South Africa Annual report 2013
Our performance Sustainability report continued
the debt review process and after termination of accounts that continue to default.
Treating our customers fairly
Treating our customers fairly (TCF) is a core value of Standard Bank. The TCF regulatory regime being introduced by the FSB requires that we now take deliberate steps to demonstrate, through our processes and record keeping, our commitment to embedding fairness into our culture and decision-making as the right way for us to do business. TCF applies to all customer segments.
In 2013, we participated in the FSB’s TCF Baseline Study and we launched an internal TCF programme to create awareness, identify potential gaps in TCF practices and develop suitable measures, information management, governance, reporting and control mechanisms to assist us in meeting TCF requirements at every customer contact point and internally. TCF has far reaching consequences and employees from the product design phase through to the end use phase will be held accountable.
Protecting personal informationA number of regulations require banks to treat all personal information as private and confidential. Our policies and procedures provide internal organisational safeguards for data privacy aligned to regulatory requirements. Ongoing employee awareness campaignsand training initiatives re-emphasise the importance of confidentiality and privacy. The group privacy officer is responsible for overseeing our privacy activities across all our operations. During 2013, the total number of substantiated complaints received by PBB regarding breaches of customer privacy in South Africa was 319 (2012: 330).
CIB is a high risk area in so far as confidential information is concerned. Private and public information areas are kept separate to preventthe inappropriate flow of confidential information, price sensitive information or material non-public information. During 2013, no complaints were received from regulatory bodies.
PricingWe encourage our customers to transact using convenient and cost-effective self-service channels that enable us to reduce our costs and pass these savings on to our customers. We offer bundled pricing options which offer greater transparency as customers are aware of their monthly charges upfront. Further price reductions are also made possible through improving our processes through the efficiencies offered by our new core banking systems and more streamlined procedures such as paperless and remote account opening processes. Our employees are trained to explain our pricing options and are provided with tools to respond to price discussions, to ensure that we sell the most appropriate products to our customers based on affordability and need.
Customers are also able to use our online pricing calculators, our website and our electronic and physical brochures to help them choose the best pricing options to suit their needs. Our website and brochures provide advice on how to reduce bank charges, as well as
how to manage an account to avoid extra costs such as overdrawn or penalty fees.
We communicate consistently on price changes in advance through various mechanisms.
For 2014, we are increasing our fees for our Personal Banking transactional customers by an average inflationary increase of 5.2%, after reducing our fees in 2012 and keeping our fees unchanged in 2013. Business Banking fees will increase on average by 5.5%. As a result, the BizLaunch account for start-up businesses will increase from R3,00 to R4,50 a day and the Elite Plus Account from R99 to R104 per month. The Prestige Plus, Private Banking and Consolidator Plus accounts will now cost R179, R299 and R43 a month, respectively. Our inclusive banking customers can choose from two pricing options depending on their requirements and transactional behaviour – pay-as-you transact and the Access Account Plus bundle priced at R59 a month.
Socioeconomic development
Inclusive financial servicesAccording to our research, 67% of the adult population in South Africa
is unbanked. To effectively reach and engage this market we must
understand the needs and requirements of unbanked customers. As
affordability is a key requirement, we need to implement innovative
banking models and find ways to offer these products and services at
a low cost for our customers and the bank.
Our inclusive banking strategy is to make available banking products
and services that are simple, transparent, convenient and affordable to
financially active people who typically earn less than R8 000 a month.
Our AccessBanking suite of products includes transactional, savings,
loan and insurance products.
During 2013, we focused on places of employment as channels
to acquire new customers and open accounts. A clear acquisition
plan is in place and we have established a holistic value proposition
that is relevant to both employers and their employees.
Our mobile AccessAgents participated in formally arranged Bank Days
at places of employment.
During 2013, we acquired an average of 100 855 inclusive
banking customers per month, bringing the total number of inclusive
banking customers with a transactional account to 6,8 million
(2012: 6,2 million), representing 71% (2012: 71%) of our
Personal Banking customer base in South Africa. Some 69%
(2012: 80%) of AccessBanking transactional accounts are active.
We granted AccessLoans to 174 100 customers to the value of
R1,6 billion. Our loan exposure to this market is around R2,9 billion
(2012: R3,3 billion), of which 73% (2012: 80%) of our AccessLoan
customers hold an AccessAccount with us. The non-performing loan
rate was 21%. Having revised our risk appetite for lending to this
market, the number of our AccessLoan customers has decreased from
450 725 in 2012 to 377 989 in 2013.
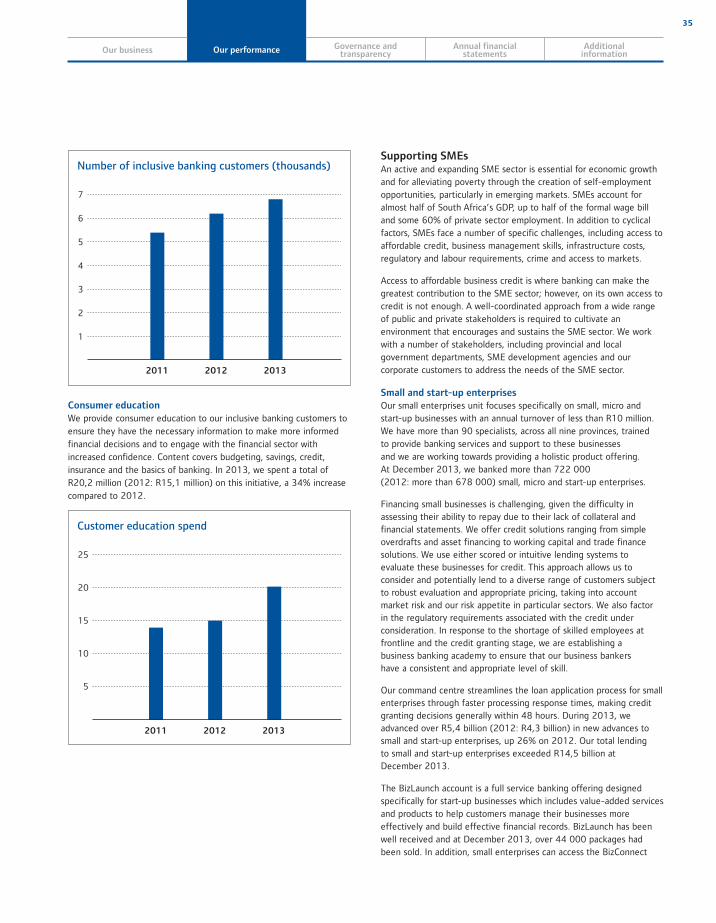
35
Number of inclusive banking customers (thousands)
7
6
5
4
3
2
1
201320122011
Consumer education
We provide consumer education to our inclusive banking customers to ensure they have the necessary information to make more informed financial decisions and to engage with the financial sector with increased confidence. Content covers budgeting, savings, credit, insurance and the basics of banking. In 2013, we spent a total of R20,2 million (2012: R15,1 million) on this initiative, a 34% increase compared to 2012.
Customer education spend
25
20
15
10
5
201320122011
Supporting SMEsAn active and expanding SME sector is essential for economic growth and for alleviating poverty through the creation of self-employment opportunities, particularly in emerging markets. SMEs account for almost half of South Africa’s GDP, up to half of the formal wage bill and some 60% of private sector employment. In addition to cyclical factors, SMEs face a number of specific challenges, including access to affordable credit, business management skills, infrastructure costs, regulatory and labour requirements, crime and access to markets.
Access to affordable business credit is where banking can make the greatest contribution to the SME sector; however, on its own access to credit is not enough. A well-coordinated approach from a wide range of public and private stakeholders is required to cultivate an environment that encourages and sustains the SME sector. We work with a number of stakeholders, including provincial and local government departments, SME development agencies and our corporate customers to address the needs of the SME sector.
Small and start-up enterprises
Our small enterprises unit focuses specifically on small, micro and start-up businesses with an annual turnover of less than R10 million. We have more than 90 specialists, across all nine provinces, trained to provide banking services and support to these businesses and we are working towards providing a holistic product offering. At December 2013, we banked more than 722 000(2012: more than 678 000) small, micro and start-up enterprises.
Financing small businesses is challenging, given the difficulty in assessing their ability to repay due to their lack of collateral and financial statements. We offer credit solutions ranging from simple overdrafts and asset financing to working capital and trade finance solutions. We use either scored or intuitive lending systems to evaluate these businesses for credit. This approach allows us to consider and potentially lend to a diverse range of customers subject to robust evaluation and appropriate pricing, taking into account market risk and our risk appetite in particular sectors. We also factorin the regulatory requirements associated with the credit under consideration. In response to the shortage of skilled employees at frontline and the credit granting stage, we are establishing abusiness banking academy to ensure that our business bankershave a consistent and appropriate level of skill.
Our command centre streamlines the loan application process for small enterprises through faster processing response times, making credit granting decisions generally within 48 hours. During 2013, we advanced over R5,4 billion (2012: R4,3 billion) in new advances to small and start-up enterprises, up 26% on 2012. Our total lending to small and start-up enterprises exceeded R14,5 billion at December 2013.
The BizLaunch account is a full service banking offering designed specifically for start-up businesses which includes value-added services and products to help customers manage their businesses more effectively and build effective financial records. BizLaunch has been well received and at December 2013, over 44 000 packages had been sold. In addition, small enterprises can access the BizConnect
Our business Our performance Governance andtransparency
Annual financialstatements
Additionalinformation
36 The Standard Bank of South Africa Annual report 2013
Our performance Sustainability report continued
small enterprise web platform which provides expert advice on how to manage a small business effectively and the dedicated call centre BizDirect Response Centre, that provides customers with faster and more convenient access to specialist consultants for service-related queries, as well as some transactional functions.
Enterprise development
Enterprise development is about ensuring that SMEs have meaningful opportunities to access markets, finance and long-term business development. We use an integrated enterprise development model that combines access to finance, non-financial business development support and access to market opportunities for SMEs in corporate supply chains, with a particular focus on black-owned and black women-owned businesses. Our enterprise development spend for 2013 amounted to R27 million, 0.26% of net profit after tax. The growth of our black SME loan book was 9% in 2013 and our loan exposure to this segment of the market at December 2013 was around R2,6 billion.
We facilitate market access by identifying opportunities in corporate supply chains and linking SMEs to our own procurement department and to our corporate clients that are seeking SME suppliers in their supply chains. We have developed a panel of accredited third party providers that act as advisors, strategists and mentors. We measure the success of these interventions by assessing whether the business development support has enhanced efficiencies in SMEs’ business operations as well as to what extent they can successfully access finance and corporate supply chains.
During 2013, 277 (2012: 108) SMEs received non-financial development support, of which 94% were black-owned businesses. To develop our own suppliers, the supplier development programme increases the capacity of our black-owned and black women-owned businesses to meet demand. A total of 22 suppliers are receiving 12 months of coaching and mentoring with a business development service provider appointed by the bank. These suppliers havea black ownership level of 50% or more and a BEE rating of level six or better.
We also have a preferential procurement enterprise development programme that targets black SME vendors or potential vendorswithin the cleaning, security, learning and development, and marketing and advertising service areas. A total of 13 SMEsare participating in this programme and the group vendor and procurement unit is working closely with the business development support provider to ensure the effective transfer of skills,knowledge and process to these businesses.
We also support projects which assist start-up entrepreneurs, particularly in rural and non-metropolitan areas, to grow into established and sustainable small enterprises. We identify entrepreneurs who show potential to be sustainable and help link them to appropriate markets. Business development service providers assist with financial management skills and compliance withrelevant legislative requirements such as taxation and value addedtax (VAT). We will introduce a debt rehabilitation programme to help
businesses with poor credit ratings to clear their names so thatthey become bankable.
In 2013, we supported the following programmes targeting small and micro enterprises:
Micro Enterprise Business Development Programme: 91 participants.
Entrepreneurial Skills Development and Job Placement for the Deaf and Hard of Hearing Programme: 34 deaf and hard of hearing people have graduated to date.
Mutale Agribusiness Development Support Programme: 50 farmers participating.
Market Access and Product Cluster Development Programmes: 125 farmers participating.
Agriculture financing
The growth of the agriculture sector supports economic development in rural areas by creating rural employment and halting themomentum of urban migration. We recognise the need for economically sustainable black commercial businesses in the sectorto secure its growth and drive our profitability in this market.Our total black agriculture book at December 2013 was R242 million (2012: R122 million) and our target is to grow this to R1 billion by 2015. To help smallholder farmers access credit, we ensure that the actual produce is properly ring-fenced during the production process and when it is ready for harvesting. We have committed a ring-fenced line of credit to finance black small and medium farming where funds are distributed between the livestock, citrus, grain and sugar industries over a three-year period from 2010. To date, we have approved finance to the value of R30,3 million and our target for 2014 is to increase this to R100 million.
To further support these farmers, a tripartite structure is put inplace for each deal that includes the farmer, Standard Bank and a management support agency which assists with production and business and value chain management. This approach has improved our understanding of how to lower the risk of financing this market, which has enabled us to increase our reach in the unbankedsegment of the agriculture market in all nine provinces. We also establish relationships with merchants in the agriculture valuechain to help emerging farmers gain greater market access. During 2013, we expanded our relationships with prominent organisedBEE agriculture organisations such as the African Farmers Associationof South Africa and the National Emergent Red Meat Producers Organisation.
Financing infrastructureA recent World Bank study estimates that the poor state of electricity‚ water‚ port‚ road‚ rail and communications infrastructure reduced economic growth in Africa by two percentage points a year andcut productivity by as much as 40%. This presents significant opportunities for providers of finance. The introduction of thethird Basel Capital Accord (Basel III), however, impacts the ability of financial institutions to finance such projects as it favours shorter-term loans of around five years meaning that banks carry higher costs
37
for long-tenure projects. Our strategic partner, ICBC, positions uswell to carry out major infrastructure transactions and our aim is to become a leader in funding infrastructure projects that create sustainable long-term solutions for Africa’s people.
We are providing finance for the construction of the R420 million Paardevlei Private Hospital. However, our financing experience in the energy sector positions us to help our clients meet their increasing energy demands through both conventional power generation (coal and gas-fired power) and renewables. Conventional power generation is critical to ensuring the reliability and security of energy required for economic development, particularly as the transition to new sources of energy will require time and considerable investment. Our challenge is to balance supporting our clients in the coal industry while financing other sources of energy such as natural gas, nuclear, hydroelectricand renewable energy.
PG Our financing of renewable energy projects is discussed on page 42 in the environment section of this report.
Empowerment financingTargeted investment refers to the financing of projects that address gaps or backlogs in South Africa’s economic development, through debt financing, credit extension or equity investment. At December 2013, our targeted investments amounted to R13,6 billion (2012: R7,4 billion). Included in this is the debt and equity financing we provide to public or private sector infrastructure projects that support social and economic activity in historically underserviced areas, increasing productivity and bringing them into the mainstream economy. Generally the infrastructure projects we finance facilitate access to electricity, construction of roads and rail links, large scale public transport, government head offices that often generate small enterprise trading activity in the vicinity, and water, sanitation and sewage works. Tendering authorities require that provision is made in transformational infrastructure deals for BBBEE and preferential procurement as necessary conditions for successful bids. At December 2013, our total transformational infrastructure lending amounted to R1,1 billion (2012: R156 million). BEE transaction financing is the supply of debt financing and equity investments in BEE companies other than SMEs. We have set a cumulative empowerment financing target of R8,8 billion by the end of 2015. Our weighted average balance for BEE transaction financing in 2013 amounted to R5,5 billion, 25% up from 2012 (R4,4 billion). We regularly review the performance of the finance granted to a targeted investment project. Where the facility is found to be underperforming, we consult with the relevant parties to revise the facility’s terms to ensure it meets its obligations and creates value for the BEE parties during and upon maturity of the financing granted.
Affordable housing
In the personal affordable housing market, our approach is to finance quality affordable housing units for households with income levels of between R5 500 and R18 000 a month. Our target is to grow our affordable housing home loan book in a responsible manner to R24 billion by 2015. We are on track to meet this target with a
current home loan book value of R17,9 billion (2012: R14,7 billion). We hold a 35% share of the affordable housing market in South Africa, financing one in every three houses. In 2013, we financed R4,0 billion (2012: R3,6 billion) in affordable housing loans through 12 220 (2012: 12 537) home loans. Some 81% of this finance was disbursed to first-time home buyers. Low-income earners who belong to pension and provident funds can enter into finance agreements with Standard Bank’s Pension-backed Lending unit to buy, build or renovate a home. In 2013, this unit issued loans to the value ofR370 million (2012: R413 million).
High levels of customer indebtedness is a particular challenge when providing housing finance to low-income earners. We consider factors such as combined household income and the contributions other family members make towards expenses. The implementation of regulatory capital requirements introduced by Basel III will impact our affordability calculations, and in response we are developing innovative ways to ensure that our customers in the low-income segment are able to access home loans. Our borrower education course is voluntary and provides first-time home buyers with information on the processes involved when buying a homeand the role players in a housing transaction and their respective obligations, as well as helping homeowners make sense of keyterms. During 2013, 848 (2012: 205) customers participated inthis programme.
During 2013, we signed a finance contract with the European Investment Bank which sets aside up to €30 million (about R433 million) for the financing of affordable housing developments. Not only will this improve housing for South Africans but it is expected to create around6 500 construction jobs. Selected housing schemes are expectedto be implemented by 2017. When involved in affordable housing developments, we screen for environmental risks and we promote environmental considerations such as the use of solar water heaters. During 2013, a total of 1 666 affordable housing units were funded and our financing for affordable housing developments amountedto R59 million (2012: R18 million).
Corporate social investmentAfter a rigorous review of our CSI strategy for South Africa, andtaking into account our past experience and the South African Government’s clearly identified priorities in the NDP, we have agreed that our focus going forward will be exclusively on projects that enhance educational outcomes.
During 2013, our CSI spend in South Africa amounted to R57,6 million (2012: R63,9 million). Of this, R37 million (2012: R42 million) was invested in education, reaching approximately 120 000 beneficiaries. Supporting education provides us with a number of opportunities including the end-goal of an improved economic climate which will positively impact our business and the possibility of recruiting the scholarship students we support into the bank on graduation.
The Standard Bank Adopt a School Scholarship Programme has awarded 71 full scholarships for university tuition since 2011, a total investment of R33 million. To date, no student has abandoned their
Our business Our performance Governance andtransparency
Annual financialstatements
Additionalinformation
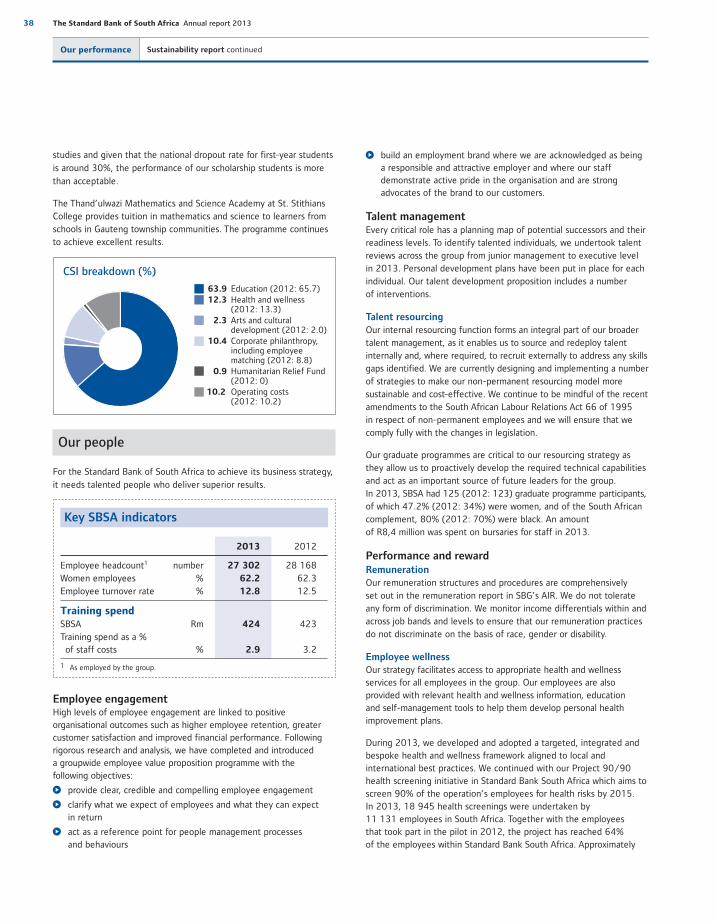
38 The Standard Bank of South Africa Annual report 2013
Our performance Sustainability report continued
studies and given that the national dropout rate for first-year students
is around 30%, the performance of our scholarship students is more
than acceptable.
The Thand’ulwazi Mathematics and Science Academy at St. Stithians College provides tuition in mathematics and science to learners from schools in Gauteng township communities. The programme continues to achieve excellent results.
CSI breakdown (%)
63.9 Education (2012: 65.7) 12.3 Health and wellness (2012: 13.3) 2.3 Arts and cultural development (2012: 2.0) 10.4 Corporate philanthropy, including employee matching (2012: 8.8) 0.9 Humanitarian Relief Fund (2012: 0)10.2 Operating costs (2012: 10.2)
Our people
For the Standard Bank of South Africa to achieve its business strategy, it needs talented people who deliver superior results.
Key SBSA indicators
2013 2012
Employee headcount1 number 27 302 28 168Women employees % 62.2 62.3Employee turnover rate % 12.8 12.5
Training spend SBSA Rm 424 423Training spend as a % of staff costs % 2.9 3.2
1 As employed by the group.
Employee engagementHigh levels of employee engagement are linked to positive organisational outcomes such as higher employee retention, greater customer satisfaction and improved financial performance. Following rigorous research and analysis, we have completed and introduceda groupwide employee value proposition programme with thefollowing objectives:
provide clear, credible and compelling employee engagement
clarify what we expect of employees and what they can expectin return
act as a reference point for people management processesand behaviours
build an employment brand where we are acknowledged as being a responsible and attractive employer and where our staff demonstrate active pride in the organisation and are strong advocates of the brand to our customers.
Talent managementEvery critical role has a planning map of potential successors and their readiness levels. To identify talented individuals, we undertook talent reviews across the group from junior management to executive levelin 2013. Personal development plans have been put in place for each individual. Our talent development proposition includes a numberof interventions.
Talent resourcing
Our internal resourcing function forms an integral part of our broader talent management, as it enables us to source and redeploy talent internally and, where required, to recruit externally to address any skills gaps identified. We are currently designing and implementing a number of strategies to make our non-permanent resourcing model more sustainable and cost-effective. We continue to be mindful of the recent amendments to the South African Labour Relations Act 66 of 1995 in respect of non-permanent employees and we will ensure that we comply fully with the changes in legislation.
Our graduate programmes are critical to our resourcing strategy as they allow us to proactively develop the required technical capabilities and act as an important source of future leaders for the group. In 2013, SBSA had 125 (2012: 123) graduate programme participants, of which 47.2% (2012: 34%) were women, and of the South African complement, 80% (2012: 70%) were black. An amount of R8,4 million was spent on bursaries for staff in 2013.
Performance and rewardRemuneration
Our remuneration structures and procedures are comprehensivelyset out in the remuneration report in SBG’s AIR. We do not tolerate any form of discrimination. We monitor income differentials within and across job bands and levels to ensure that our remuneration practices do not discriminate on the basis of race, gender or disability.
Employee wellnessOur strategy facilitates access to appropriate health and wellness services for all employees in the group. Our employees are also provided with relevant health and wellness information, educationand self-management tools to help them develop personal health improvement plans.
During 2013, we developed and adopted a targeted, integrated and bespoke health and wellness framework aligned to local and international best practices. We continued with our Project 90/90 health screening initiative in Standard Bank South Africa which aims to screen 90% of the operation’s employees for health risks by 2015. In 2013, 18 945 health screenings were undertaken by 11 131 employees in South Africa. Together with the employees that took part in the pilot in 2012, the project has reached 64% of the employees within Standard Bank South Africa. Approximately
39
70% (2012: 68%) of all employees screened elected to undergo
confidential human immuno deficiency virus (HIV) counselling and
testing. We monitor all our health interventions to facilitate ongoing
reporting and identify trends. We are seeing increasing levels of
personal relationship issues, personal and work-related stress and
absenteeism. To date, 1 871 employees have participated in
targeted training to empower them to better manage personal and
work-related stress. Our absenteeism rates for 2013 were 2.2%
(2012: 2.1%) for Standard Bank South Africa.
In South Africa, 86.4% (2012: 83.4%) of our permanent employees
are members of Bankmed, our medical aid provider, with the
remainder being dependants on other registered medical schemes.
We currently have 1 180 (2012: 1 158) South African employees
and their dependants registered on the Bankmed Special Care HIV
Programme, of which 880 (2012: 868) are women.
Independent Counselling and Advisory Services (ICAS) is a free and
confidential support service available to all Standard Bank employees,
their partners and immediate families. ICAS also offers financial
wellbeing solutions such as financial education, debt rehabilitation and
assistance with wealth creation using sound financial management
principles. Employees in South Africa requiring financial assistance are
also assisted by Credit Customer Assist, a dedicated unit that
undertakes confidential assessments leading to the rescheduling and
consolidation of customer debt.
Creating a safe place to work
During 2013, we completed an independent review of our
Operational Health and Safety (OHS) audit process, legal register and
baseline risk assessment. The identification of contractors and service
providers working in our premises at any given time is a challenge
given the number of facilities we run. We are engaging with relevant
stakeholders to determine how best to manage contractor incident
reporting and are working to embed OHS principles in the contractor
procurement process.
Our OHS training spend for Standard Bank South Africa amounted to
R1,9 million (2012: R2,2 million). We do not report on minor first aid
injuries but only those that require medical intervention by a doctor. We
count lost days from the day immediately following the incident. The
day of the incident is excluded. During 2013, our work-related injuries
in South Africa decreased by 19.8% compared to 2012. A total of
162 (2012: 202) injuries were reported, 102 (2012: 145) of these
resulted in lost time. 653 days were lost (2012: 989 days). The severity
rating is low and none of these injuries resulted in a permanent
disability. There were no employee or contractor fatalities during
the year.
Learning and developmentIn South Africa, Standard Bank’s skills development spend was
R424 million (2012: R423 million), of which R331 million
(2012: R299 million) was spent on black employees, in line
with our employment equity objectives.
Diversity and inclusionEmployment equity targets are set annually for the representation of black people, women and people with disabilities at all occupational levels. We submit an annual report covering race and gender to the Department of Labour, as required by the Employment Equity Act 55 of 1998.
PG Refer to the table on page 32 which sets out ourprogress against our employment equity targets at31 December 2013.
We met our executive and junior management targets for the representation of black people but did not meet the targets for black representation at senior and middle management levels. We were very close to meeting our targets set for the representation of women overall at all levels of management, however we did not meet our target for the representation of black women in senior management. Targeted recruitment is a key component of creating a more equitable workforce. During 2013, 75% of our external appointments at top management level were black South Africans, with 87%, 77% and 41% at junior, middle and senior management levels, respectively. In 2014, we will develop a new Employment Equity Plan for South Africa which will guide our employment equity performance from 2015 to 2017.
Gender equity
We strive for equal representation of women at all levels of the workforce. Currently, women are under-represented at the executive management level. Our initiatives to drive an environment more inclusive of women include development programmes and networking forums. The Women in Leadership Programme aims to teach effective leadership skills to women in middle management roles with the view to moving them into senior management roles.
Disability management
We are actively working to recruit and retain people with disabilities by incorporating disability considerations across our human resources processes and creating an environment in which people with disabilities can perform to their full potential. At December 2013, 1.2%(2012: 2.0%) of our South African workforce had declared a disability that had been verified in our internal processes. Measured as a percentage of our South African workforce, 0.8% (2012: 1.2%) were black employees that had declared a disability, against a target of 1.5%.
Information technology
IT is an integral part of the business of banking and is fundamental to the support, sustainability and growth of SBSA. The implementation and renewal of IT infrastructure is expected to drive revenue growth through improved business flexibility and the faster development, launch and distribution of products to market. To improve the customer experience, our systems are being designed to include an end-to-end customer relationship management capability to provide us with a single view of all interactions a customer has with the bank.
Our business Our performance Governance andtransparency
Annual financialstatements
Additionalinformation
40 The Standard Bank of South Africa Annual report 2013
Our performance Sustainability report continued
Information technology and infrastructure
2013 2012
IT spend (Rbn) 11,0 10,6Branches 726 721ATMs 7 141 7 528Internet banking customers 1 875 915 1 459 862Mobile banking customers 3 212 335 2 657 147
As a central enabler, IT will help us to increase our presence through technology platforms that allow for innovative ways to provide affordable and accessible banking to our customers, and will contribute to building the capacity to customers. Our IT infrastructure must, therefore, be flexible enough to constantly evolve to meet changing business needs and regulatory requirements, and our new core banking systems provide for this.
Our investment in this business enabler is critical to improving productivity and maintaining our competitive edge, and therefore is a significant part of our expense base. In 2013, we spent R11,0 billion (2012: R10,6 billion), representing 39.9% (2012: 43.1%) of total operating costs. Given the level of reliance that we have on IT, it is imperative that IT is effectively governed to ensure that it supports the group’s strategic objectives.
Our plans for 2014 to 2016 are to focus on implementing mobile banking technologies and provide our customers with alternative banking channels, improving how we manage information, optimising the core banking transitions so that we are able to decommission legacy systems and simplifying our infrastructure landscape. We will also focus on enhancing our competencies and skills with a particular focus on growing our IT line management and leadership pipeline.
ImplementationsThe first phase of the customer relationship model has been implemented in PBB and CIB, with the second phase scheduled for 2014. This will help our employees understand customer behaviour, offer tailored products and identify common queries, complaints and sales leads.
The Core Banking Transformation Programme will enable the modernisation of PBB through facilitating the creation and implementation of new business and operating models, supported by the new core banking system using SAP technology and the retiring of numerous legacy systems. The upgrade will continue to elevate IT costs through to 2016 and will be delivered through eight business releases, of which four have been completed to date. Cost containment and eventual cost reduction is expected through easier-to-maintain and relatively easily updated systems and processes. During 2013, we migrated 4,5 million accounts from legacy systems to the new SAP platform and in the second quarter of 2014 we will start migrating the balance of accounts held with us. We will then be in a position to start unlocking the value of a single customer view both from a customer and credit risk point of view. The programme is budgeted at R16 billion and to date we are on track to deliver within this cost commitment.
In 2013, CIB undertook a number of initiatives to improveefficiency, standardisation and product capability. These includeda globally-aligned equity derivatives trading and a core integrated interest rate derivatives platform, as well as a global market risk operating model and standardised credit risk workflow. Further straight through processes for our treasury management software were implemented in dealing rooms across the African continentfor seamless trading of foreign exchange, money market andfixed income.
New Business Online, operational in 14 countries, is a single integrated online cash management platform that allows our clients to view and transact on all their accounts across Africa and it consolidates payments, trade, liquidity management, foreign exchange and enquiry capability for global, regional and country-based corporates and institutions. We also launched the first phase of the Customer Engagement Programme which will ensure a greater focus on delivering technology according to client requirements and usage.
An area of focus for CIB during 2013 was implementing projects to comply with various pieces of regulation such as the European Market Infrastructure Regulation, Dodd Frank Act and Balance of Payments Reporting requirements.
Service deliveryStability and availability (uptime) are key aspects for any IT system. Availability in 2013 has been good despite the amount of change associated with the core banking system implementations.
Operating infrastructure
Our self-service channelsTechnology has made it possible for customers to manage their everyday banking online, on their mobile phones or through devices such as ATMs. These channels work well for undertaking everyday banking transactions, as is evidenced by the growing customer expectation that we deliver more capable electronic banking at a faster rate.
ATM network In 2011, we embarked on a four-year project to upgrade some 1 800 ATMs to the latest technology and at December 2013,1 300 ATMs had been upgraded. The upgrades allow for greater functionality such as automated note accepting, which removes the need for envelopes when depositing money, and domestic remittances enabling customers to send money to anyone in South Africa whocan subsequently withdraw this money by entering a pin andvoucher number.
Our average ATM uptime was 96.5% (2012: 96.6%) against a target of 97%. During the year, we processed more than 458 million(2012: 455 million) ATM transactions. Around 38% (2012: 34%)of our ATM network is situated in areas where people generally earn less than R5 000 per month, classified as living standard measures (LSM) 1 – 5 areas.
41
Internet and Mobile BankingOur average Internet Banking uptime for 2013 was 99.9%(2012: 99.9%) and our 1,9 million (2012: 1,5 million) registered users processed 991 million (2012: 975 million) transactions through this channel. Some 45% of registered customers undertook Internet Banking transactions during the month of December.
The Standard Bank Mobile Banking app for smartphones, launched towards the end of 2012, has maintained a four out of five-star rating in app stores since its launch and customers have highlighted the ease and simplicity of the interface. At December 2013, we had a total of 3,2 million (2012: 2,7 million) registered Cellphone Banking customers and the number of transactions on this channel amounted to 275,2 million (2012: 131,5 million).
Standard Bank achieves global award for innovative banking model
Standard Bank achieved global recognition for our pioneering efforts to ensure banking is easy and convenient for all South Africans. We won the prestigious BAI Finacle Global Banking Innovation Award 2013 for our AccessBanking suite of products.
We were the first bank in South Africa to create an alternative, pervasive and cost-effective model that supports banking services within the areas in which our customers live. AccessBanking is a mobile access money ecosystem consisting of transaction, savings and loan accounts underpinned by an in-community service model to ensure accessibility. We designed this offering after carefully listening to our customers’ requirements, including theneed to bring banking services right into the heart of their communities.
Our branchesBy moving low-value services to electronic platforms, we are able to focus on providing high-value personal services in our branches. They enable our customers to access advice and assistance through face-to-face interactions and can facilitate more complex transactions.
We have embarked on a project to reinvent our most prominent branches with a new cutting-edge store design. Our design team spent months physically working the floor to understand the challenges customers faced. A number of areas were redesigned, including the help desk, the enquiries counter and the self-service areas, so that customers can easily identify where to go when entering a branch. Our self-service areas enable customers to conduct Internet and Mobile Banking transactions, with a permanent staff member stationed in these lounges to provide assistance. While the new look of branches incorporate technological advances, they remain well placed to accommodate the human factor where our customers can interact with people when mobile and automated mechanisms are not sufficient to meet their needs. To date, seven branches have been overhauled, with another three branches earmarked for renovationin 2014.
Physical access in underbanked areas
During 2013, we had 143 (2012: 136) Standard Bank branches, service centres or AccessBanking Centres in underbanked areas
classified as LSM 1-5. Our AccessPoint distribution channel provides banking services to the low-income market and is accessible through retailers. Customers can withdraw, deposit, buy prepaid airtime or electricity, transfer money, conduct a balance enquiry or use their card to pay for purchases made in-store. At December 2013, we had 3 913 (2012: 6 813) AccessPoints across South Africa, of which 71% (2012: 85%) were active. The number of transactions facilitated through AccessPoints increased by 26% compared to 2012.
Our AccessBanking Centres offer AccessLoan, AccessAccount, AccessSave and Funeral Plan products to the low-income market, as well as banking services such as bank statements, PIN resets, card replacements, stop and debit orders and Cellphone Banking registrations. These outlets are essentially tellerless branches located in convenient locations and offer extended operating hours. They do not hold cash on the premises. At December 2013, we had 106 (2012: 100) AccessBanking Centres with this channel achieving a customer experience score of 8,99 out of 10 (2012: 9,57).
Green buildings
We implement green building principles where feasible to reduce our day-to-day operating costs and manage our buildings and branches in an environmentally sustainable way. Standard Bank Properties is a member of the Green Building Council of South Africa (GBCSA) and when designing new buildings, we consider the Green Star SA building
Our business Our performance Governance andtransparency
Annual financialstatements
Additionalinformation
42 The Standard Bank of South Africa Annual report 2013
Our performance Sustainability report continued
rating system that takes into account factors such as building management, indoor environmental quality, the building’s energy and water consumption, users’ transportation needs, materials used, land use and site emissions.
Our new office building in Rosebank, Johannesburg, was completed in 2013 and accommodates around 4 500 employees in customer-facing operations. It achieved a five-star preliminary design rating by the GBCSA and a five-star Green Star rating upon completion. Ratings range from four stars for best practice to six stars for world leadership. The 65 000m2 building, which cost R2,7 billion to build, is one of eight buildings in South Africa to have achieved a five-star rating on completion. It is estimated that attaining a Green Star five-star rating adds about 3% to the building’s overall costs.
Next year we plan to pilot the new Greening Building Interiors Tool for interior fittings with the intention of achieving a four-star Green Star rating in our branches, after which a roll out plan for the tool will be developed.
Environment
Highlights: Underwrote R6,4 billion for five solar and wind projects with
an installed renewable energy capacity of 353 megawattsin the second phase of South African Government’sREIPPP Programme.
Reduced our purchased electricity consumption by 4% in 2013.
Reduced the amount of paper statements sent to customers by approximately 200 tons.
Our new office building in Rosebank, Johannesburg, was completed in 2013 and accommodates around 4 500 employees in customer-facing operations. It achieved a five-star preliminary design rating by the GBCSA and a five-star Green Star ratingupon completion.
As we are a financial services group, our impact on the environment is both direct and indirect, because of the activities of the clients we finance. Our greatest opportunity for positive impact lies in our indirect impact.
Our indirect impactEnvironmental and social risk screeningAn important aspect of being a responsible lender is in ensuring that all possible risks of investments made with our business partners – our clients - are assessed adequately and management actions are put in place. This is to ensure that the investments made by the bank are sustainable and help clients to avoid costs that come with ignoring environmental and social risk.
All CIB transactions go through the pre-credit committee which is responsible for ensuring that environmental and social risks are correctly identified in the application phase. The upfront screening outcome determines whether to proceed with a transaction or notor whether further assessment is required. During 2013, no deals were declined at the assessment stage which is an indication that our efforts are working.
We use two approaches to screen and evaluate transactions; the Equator Principles and a transaction-specific process to assess transactions with no known use of proceeds and where the loan is not required to physically develop or expand a project. The Equator Principles are a set of standards for managing social and environmental risk and are applied to all new project finance loans of USD10 million (R96 million) or more, across all industry sectors. The Equator Principles process is also applicable to any advisory services we supply on project finance loans. The number of projects that were financed according to Equator Principles in South Africa in 2013, was five deals (2012: 12) and we played an Equator Principles advisory role in a further two (2012: five) projects.
We are developing an environmental and social risk management system for PBB similar to that employed by CIB. The implementation is supported by an e-learning training module.
Clean energy and energy efficiencyRenewable energy projects currently represent a significant part of our project finance energy portfolio and include wind, photovoltaic, hydro and geothermal power stations. For the past 17 years we have worked to understand and engage on the power requirements in South Africa. In the last two years, the power industry has moved forward at pace, and as a result of our efforts, we are well placedto take advantage of opportunities, such as the government’sREIPPP Programme.
In the first phase of the REIPPP Programme we underwrote R9,5 billion for 11 solar wind projects with a capacity of 607 megawatts and we have a R220 million equity stake in four of the projects. In the second phase of the programme, four of the five bids we supported were selected representing an installed renewable energy capacity of258 megawatts and financing of R5,3 billion. In the third phaseof the programme, we were awarded one bid with an underwriting value of R1,5 billion, pending further allocations to be made bythe Department of Energy. It is compulsory in these projects to include local communities as equity participants, funded by local development finance institutions.
The construction of projects selected under the first phase of the programme has begun and in Nelson Mandela Bay in the Eastern Cape Province the 27 megawatt MetroWind Van Stadens wind farm project is complete and already delivering power to the grid. The R550 million wind farm project is projected to have a 20-year life span and deliver 80 000 megawatt hours of electricity a year to supply between 5 000 and 6 000 households with power. Nearby communities of Shamrock and Witteklip have already benefited from the project through the installation of solar powered area lighting. The project is expected to meet almost 50% of the Nelson Mandela Bay municipality’s target of generating 10% of electricity from renewable energy and will offset 80 000 tons of carbon dioxide emissions a year. We were the authorised lead arranger in this transaction and ICBC made overR172,6 million (USD 17,9 million) available for the project.

43
Bid process
Bid submission Round 1 =
R33,7 billion
Standard Bank underwrote R9,5 billion for this round
Standard Bank was awarded 11 of the 28 projects
in the first round
Bid submission Round 2 =
R22,3 billion
Standard Bank underwrote R6,4 billion for this round
Standard Bank was awarded 5 of the 19 projects
in the second round
Bid submission Round 3
in progress
43% of the projects = 607MW
28 projects to produce
1 416MW
Standard Bank won
5 out of 8 wind projects awarded
Standard Bank won
6 out of 18 solar projects awarded
34% of the projects = 353MW
19 projects to produce
1 044MW
Standard Bank won
1 out of 7 wind projects awarded
Standard Bank won
4 out of 9 solar projects awarded
Standard Bank has committed R1,5 billion for this round
Standard Bank has been awarded 1 out of the 17 projects
in the third round
1 out of 2 concentrated solar power
17 projects to produce
1 365MW
7% of the projects = 100MW
Standard Bank won
1 out of 2 concentrated
solar powerprojects awarded
We are also the sole mandated lead arranger and underwriter on the 20 megawatt Herbert and 72,5 megawatt Kalkbult photovoltaic projects located in the Northern Cape Province. Kalkbult was connected to the grid in September 2013 and Herbert is expected to be online in April 2014.
Our business Our performance Governance andtransparency
Annual financialstatements
Additionalinformation
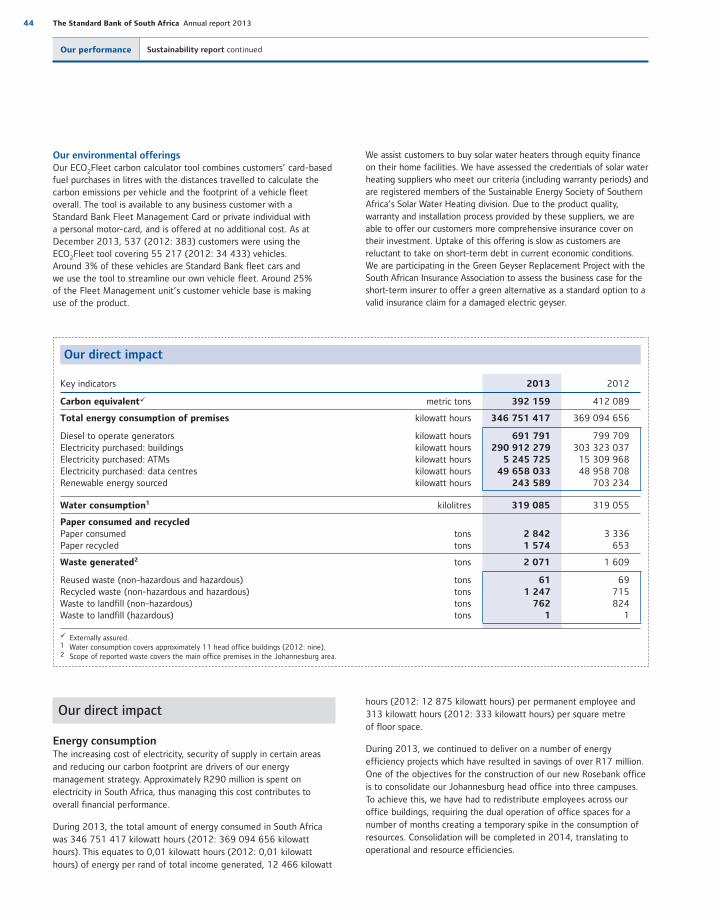
44 The Standard Bank of South Africa Annual report 2013
Our performance Sustainability report continued
Our direct impact
Key indicators 2013 2012
Carbon equivalentü metric tons 392 159 412 089
Total energy consumption of premises kilowatt hours 346 751 417 369 094 656
Diesel to operate generators kilowatt hours 691 791 799 709Electricity purchased: buildings kilowatt hours 290 912 279 303 323 037Electricity purchased: ATMs kilowatt hours 5 245 725 15 309 968Electricity purchased: data centres kilowatt hours 49 658 033 48 958 708Renewable energy sourced kilowatt hours 243 589 703 234
Water consumption1 kilolitres 319 085 319 055
Paper consumed and recycledPaper consumed tons 2 842 3 336Paper recycled tons 1 574 653
Waste generated2 tons 2 071 1 609
Reused waste (non-hazardous and hazardous) tons 61 69Recycled waste (non-hazardous and hazardous) tons 1 247 715Waste to landfill (non-hazardous) tons 762 824Waste to landfill (hazardous) tons 1 1
ü Externally assured.1 Water consumption covers approximately 11 head office buildings (2012: nine).2 Scope of reported waste covers the main office premises in the Johannesburg area.
Our environmental offeringsOur ECO2Fleet carbon calculator tool combines customers’ card-based fuel purchases in litres with the distances travelled to calculate the carbon emissions per vehicle and the footprint of a vehicle fleet overall. The tool is available to any business customer with aStandard Bank Fleet Management Card or private individual witha personal motor-card, and is offered at no additional cost. As at December 2013, 537 (2012: 383) customers were using theECO2Fleet tool covering 55 217 (2012: 34 433) vehicles. Around 3% of these vehicles are Standard Bank fleet cars andwe use the tool to streamline our own vehicle fleet. Around 25%of the Fleet Management unit’s customer vehicle base is makinguse of the product.
We assist customers to buy solar water heaters through equity finance on their home facilities. We have assessed the credentials of solar water heating suppliers who meet our criteria (including warranty periods) and are registered members of the Sustainable Energy Society of Southern Africa’s Solar Water Heating division. Due to the product quality, warranty and installation process provided by these suppliers, we are able to offer our customers more comprehensive insurance cover on their investment. Uptake of this offering is slow as customers are reluctant to take on short-term debt in current economic conditions. We are participating in the Green Geyser Replacement Project with the South African Insurance Association to assess the business case for the short-term insurer to offer a green alternative as a standard option to a valid insurance claim for a damaged electric geyser.
Our direct impact
Energy consumptionThe increasing cost of electricity, security of supply in certain areas and reducing our carbon footprint are drivers of our energy management strategy. Approximately R290 million is spent on electricity in South Africa, thus managing this cost contributes to overall financial performance.
During 2013, the total amount of energy consumed in South Africa was 346 751 417 kilowatt hours (2012: 369 094 656 kilowatt hours). This equates to 0,01 kilowatt hours (2012: 0,01 kilowatt hours) of energy per rand of total income generated, 12 466 kilowatt
hours (2012: 12 875 kilowatt hours) per permanent employee and313 kilowatt hours (2012: 333 kilowatt hours) per square metreof floor space.
During 2013, we continued to deliver on a number of energy efficiency projects which have resulted in savings of over R17 million. One of the objectives for the construction of our new Rosebank office is to consolidate our Johannesburg head office into three campuses. To achieve this, we have had to redistribute employees across our office buildings, requiring the dual operation of office spaces for a number of months creating a temporary spike in the consumption of resources. Consolidation will be completed in 2014, translating to operational and resource efficiencies.

45
In South Africa, we are prioritising waste practices such as minimisation, reuse, recycling and responsible disposal. During 2012, we introduced an internal recycling initiative where individual waste bins were removed from underneath desks and recycling stations introduced throughout the general office areasin certain buildings, forcing employees to sort their waste.In 2013, we completed the roll out of this recycling system inall main offices in South Africa, covering approximately 25 000 employees and achieving measurable reductions in waste sent to landfill. During 2013, we generated 2 071 tons (2012: 1 609 tons) of waste, of which 63% (2012: 49%) was recycled or reused.
Waste sorting in main Gauteng offices (%)
3 Reused60 Recycled37 Landfilled
SR More comprehensive detail on energy and carbonfootprint data can be found in the 2013 SBGsustainability report in the natural capital section.
Tri-generation plant in our new Rosebank green building
The new office building in Rosebank is the second building in South Africa to have a gas-powered tri-generation plant. The tri-generation plant generates about one megawatt of electricity, which is enough to power 2 500 homes a month based on an average household consuming 304 kilowatts hours a month, and is used to light, heat and cool the building. The gas generator powers the building’s lights at night and the heat generated from the gas plant provides a further 0,8 megawatts of energy which is filtered into the air-conditioning system and is used to heat and cool the building. Whilst the tri-generation plant cost R40 million, it makes commercial sense in terms of efficiency and in mitigating the sustained electricity price hikes currently experienced in South Africa.
Carbon footprintStandard Bank’s South African carbon dioxide (CO2) equivalent for 2013 was 392 159 metric tons (2012: 412 089 metric tons), 5% lower than 2012. In relation to Standard Bank South Africa’s total income of R50,9 billion in 2013 (2012: R46,6 billion), CO2 generated per rand equates to 7.0 grams (2012: 8.0 grams). CO2 generatedper permanent employee and per square metre of floor space equates to approximately 12.7 tons (2012: 13.0 tons) and 0.32 tons(2012: 0.34 tons), respectively.
Paper consumption and waste managementWe continue to look at ways in which we can innovate and improve resource use and efficiency with regards to resource consumption outside of energy management. We have continued to work towards reducing paper use in our operations. Over the past two years, over 7,3 million electronic statements have been delivered to customers by Standard Bank South Africa, reducing our consumption of statement paper. During 2013, our total paper consumption was 2 842 tons (2012: 3 336 tons), a 15% reduction year-on-year. Of this, the consumption of office paper alone amounted to 1 433 tons. We recycled a total of 1 574 tons (2012: 653 tons) of office paper during the year, with the move to Rosebank and the digital storage of old documents accounting for the 141% increase.
Our business Our performance Governance andtransparency
Annual financialstatements
Additionalinformation

46 The Standard Bank of South Africa Annual report 2013
Risk and capital management report
Risk types
The group’s activities give rise to various risks. These are:
credit risk (page 57)
country risk (page 72)
liquidity risk (page 75)
market risk (page 81)
operational risk (page 87)
business risk (page 91)
strategic risk (page 91)
post-retirement obligation risk (page 91)
reputational risk (page 92).
Each risk is defined within the relevant section, together with an explanation of the application of the governance framework, the approved regulatory treatment for capital requirements to be held against the risk in terms of Basel, and the portfolio characteristics analysed both in terms of prescribed disclosure and the group’s own business model.
Board responsibility 46
Risk types 46
Governance framework 47
Governance committees 47
Three lines of defence model 48
Governance documents 48
Board responsibility
The group’s board of directors (board) has the ultimate responsibility for the oversight of risk and capital management.
Various board and management committees, as set outon pages 47, 48 and 111 to 116, support the board inits oversight of the risks faced by the group, the effectiveness of the compliance function and the effectiveness with which the group manages risksand the group’s capital.
PG
For the year under review, the board is satisfied that the group’s risk, compliance and capital management processes generally operated effectively, that the group’s business activities have been managed within the board-approved risk appetite, and that the group is adequately capitalised to support the execution of the group’s strategy.
PG
Overview 46
Capital management 49
Risk appetite and stress testing 55
Credit risk 57
Country risk 72
Liquidity risk 75
Market risk 81
Operational risk 87
Business risk 91
Reputational risk 92
Restatements 93
Annexures 94
Overview
Our performance
Our business Our performance Governance andtransparency
Annual financialstatements
Additionalinformation
47
Governance framework
The group’s approach to managing risk and capital is set out in the RCCM governance framework approved by the group risk and capital management committee (GRCMC). The frameworkhas two components:
governance committees
governance documents such as standards, frameworks and policies.
Governance committeesGovernance committees within the RCCM governance frameworkare in place at both a board and management level. They haveclearly defined mandates and delegated authorities which are reviewed regularly.
Board committeesBoard subcommittees responsible for effective risk management comprise the group audit committee (GAC), the GRCMC, the SBSA large exposure credit committee and the group model approval committee. Key roles and responsibilities of these committees,as they relate to risk and capital management, are detailed in the sections that follow.
The group risk and capital management committeeThe GRCMC provides independent oversight of risk and capital management across the group by:
determining the group’s risk appetite as set out in the risk appetite framework and risk appetite statement (RAS)
monitoring the current and future risk profile of the group to confirm that it is managed within risk appetite
approving macroeconomic scenarios used for stress testing, and evaluating the results of these and other stress tests
reviewing and providing oversight of the adequacy and effectiveness of the group’s RCCM governance framework
approving governance standards, frameworks and policies in terms of the RCCM governance framework
reviewing the impact on capital of significant transactions entered into by the group
reviewing reports on the implementation of an IT governance framework and updates on significant IT investments
evaluating and approving significant outsourcing arrangements
assisting on such other matters as may be referred to it by the SBG risk oversight committee (GROC)
promoting a risk awareness culture within the group
reporting to the board any matters within its remit where actionor improvement is needed and making recommendations as to the steps to be taken.
The group audit committeeThe GAC reviews the group’s financial position and makes recommendations to the board on all financial matters, financial risks, internal financial controls, fraud and, to the extent they impact financial reporting, IT risks. In relation to risk and capital management, the GAC plays a role in assessing the adequacy and operating effectiveness of the group’s internal financial controls.
Minutes of the GRCMC meetings are tabled at the GAC meetings. In order to ensure the independence of the compliance and audit functions, the chairman of the GAC, who is also a member of the GRCMC, meets with the GCCO and the group chief audit officer without management being present. In addition, the CRO reports on significant matters discussed at the GRCMC and GROC meetings.
SBSA large exposure credit committeeThe SBSA large exposure credit committee is designated by theSBSA board to discharge the regulatory responsibility of ensuring compliance with the South African Banks Act 94 of 1990 (Banks Act) regulations in respect of large exposures. It meets as required and reports quarterly to the SBSA board through its chairman on all large exposures as defined in the regulations.
Group model approval committeeThe group model approval committee is designated by the board to discharge the regulatory responsibility of reviewing and approvingthe group’s material models for various risk types. This committee is supported by the PBB and CIB model approval subcommittees which approve less material models requiring approval in terms of the regulations. The committees also approve models for various risktypes used in their respective business lines which fall outside the regulatory approval requirements.
Management committeesGroup risk oversight committeeExecutive management responsibility for all material risk types has been delegated by the group management committee to GROCwhich, in turn, assists the GRCMC in fulfilling its mandate.
As is the case with the GRCMC, GROC calls for and evaluates in-depth investigations and reports based on its assessment of the risk profile and external factors.
GROC delegates authority to various subcommittees which deal with specific risk types or oversight activities. Matters are escalated to GROC, based on materiality, through reports or feedback from the subcommittee chairman.
The GROC subcommittees are as follows:
group stress testing and risk appetite committee
group equity risk committee
group regulatory and legislative oversight committee
group sanctions review committee
group country risk management committee
group compliance committee
intragroup exposure committee
group asset and liability committee (ALCO) (subcommittee: group capital management committee)
group operational risk committee (GORC)
group internal financial control governance committee
PBB credit governance committee
CIB credit governance committee.
48 The Standard Bank of South Africa Annual report 2013
Group IT steering committeeThe purpose of the committee is to provide assurance to the group management committee and the board that management has implemented an efficient IT governance framework that supports the effective management of resources, optimisation of costs and the mitigation of risk in a secure and sustainable manner.
Three lines of defence modelThe group uses the three lines of defence governance model which promotes transparency, accountability and consistency through the clear identification and segregation of roles.
The first line of defence is made up of the management of business lines and legal entities. The second line of defence functions provide independent oversight of RCCM. They have resources at the centre and embedded within the business lines. Central resources provide groupwide oversight of risks, while resources embedded within the business lines support management in ensuring that their specific risks are effectively managed as close to the source as possible. Central and embedded resources jointly oversee RCCM at a legal entity level.
The second line of defence functions implement governance standards, frameworks and policies for each material risk type to which the group is exposed. This ensures consistency in approach across the group’s
business lines and legal entities. All governance standards and frameworks are approved by the GRCMC. Compliance is ensured through annual self-assessments by the second line of defence and reviews by internal audit (IA).
IA is the third line of defence and reports to and operates under a mandate from the GAC. In terms of its mandate, the IA function’s role is to provide independent and objective assurance. IA has the authority to independently determine the scope and extent of work to be performed. All IA employees in the group report operationally to the group chief audit officer and administratively to management of their legal entity.
Governance documentsGovernance documents within the RCCM governance framework comprise standards, frameworks and policies which set out the requirements for the identification, assessment, measurement, monitoring, managing and reporting of risks, for effective oversightof compliance and effective management of capital.
Governance policies are approved by the relevant GROC subcommittee, GROC itself or, where regulations require board approval, by the board or relevant board committee.
Our performance Risk and capital management report > Overview continued
Our business Our performance Governance andtransparency
Annual financialstatements
Additionalinformation
49
Objectives
The group’s capital management functionis designed to ensure that regulatoryrequirements are met at all times and thatthe group and its principal subsidiaries arecapitalised in line with the group’s riskappetite and target ratios, both of whichare approved by the board.
The capital management division within treasury and capital management (TCM) comprises:
Strategic capital management function: Key responsibilities are raising capital to enable growth opportunities and to provide an optimal capital structure, advising on the dividend policy, facilitating capital allocation, risk-adjusted performance measurement (RAPM), and managing the internal capital adequacy assessment process (ICAAP) and capital planning process, including stress testing of capital supply and demand.
Portfolio analysis and reporting function: Key responsibilities are measurement and analysis of regulatory and economic capital, internal and external reporting and implementation of new regulatory requirements.
CIB and PBB capital management functions: Key responsibilities are providing support on deal pricing, balance sheet utilisation and management of capital consumption against budgets.
Objectives 49
Governance committees 49
Basel III 49
Objectives of Basel III 50
Regulatory capital 51
Economic capital 54
Risk-adjusted performance measurement 54
Governance committees
The primary GROC subcommittees that oversee the risks associated with capital management are the group ALCO and its subcommittee, the group capital management committee.
Basel III
The SARB adopted the Basel III regulatory framework (Basel III) introduced by the BCBS from 1 January 2013 and the group hasbeen compliant with the minimum requirements from that date.The group is well positioned to comply with the requirements thatare subject to phase-in rules when they become effective.
A
A
Capital management
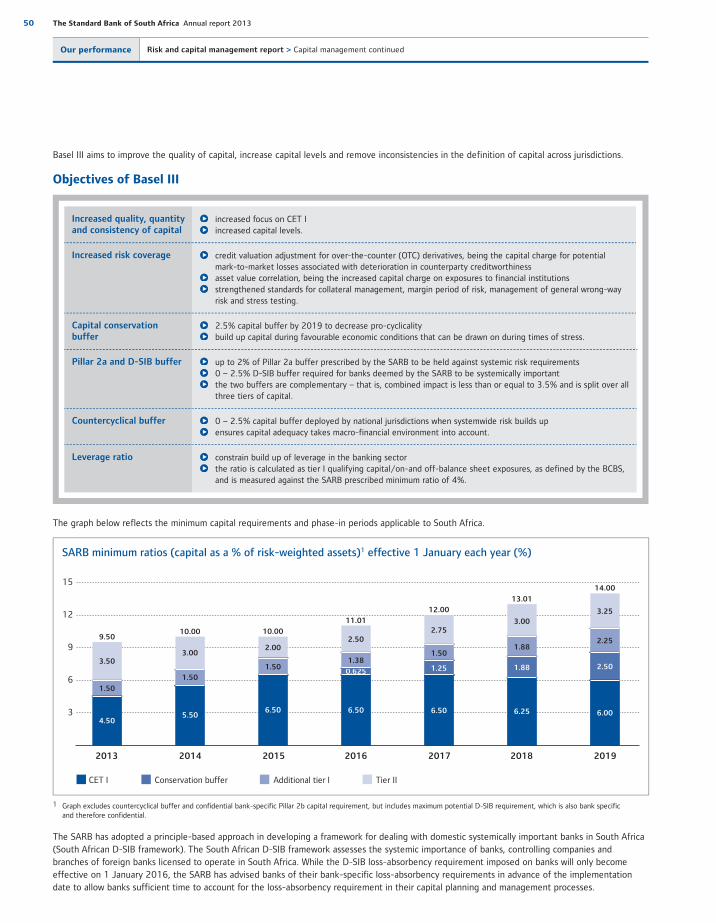
50 The Standard Bank of South Africa Annual report 2013
Basel III aims to improve the quality of capital, increase capital levels and remove inconsistencies in the definition of capital across jurisdictions.
Objectives of Basel III
Increased quality, quantity and consistency of capital
increased focus on CET I increased capital levels.
Increased risk coverage credit valuation adjustment for over-the-counter (OTC) derivatives, being the capital charge for potential mark-to-market losses associated with deterioration in counterparty creditworthiness
asset value correlation, being the increased capital charge on exposures to financial institutions strengthened standards for collateral management, margin period of risk, management of general wrong-way
risk and stress testing.
Capital conservation buffer
2.5% capital buffer by 2019 to decrease pro-cyclicality build up capital during favourable economic conditions that can be drawn on during times of stress.
Pillar 2a and D-SIB buffer up to 2% of Pillar 2a buffer prescribed by the SARB to be held against systemic risk requirements 0 – 2.5% D-SIB buffer required for banks deemed by the SARB to be systemically important the two buffers are complementary – that is, combined impact is less than or equal to 3.5% and is split over all
three tiers of capital.
Countercyclical buffer 0 – 2.5% capital buffer deployed by national jurisdictions when systemwide risk builds up ensures capital adequacy takes macro-financial environment into account.
Leverage ratio constrain build up of leverage in the banking sector the ratio is calculated as tier I qualifying capital/on-and off-balance sheet exposures, as defined by the BCBS,
and is measured against the SARB prescribed minimum ratio of 4%.
The graph below reflects the minimum capital requirements and phase-in periods applicable to South Africa.
CET I Conservation buffer Additional tier I Tier II
15
12
9
6
3
2013 2014 2015 2016 2017 2018 2019
4.50
1.50
3.50
9.50
6.00
2.50
3.25
14.00
2.25
6.25
1.88
3.00
13.01
1.88
6.50
1.25
1.50
12.00
2.75
6.50
1.38
11.01
6.50
2.00
10.00
1.50
5.50
1.50
10.00
3.00
0.625
SARB minimum ratios (capital as a % of risk�weighted assets)1 effective 1 January each year (%)
2.50
1 Graph excludes countercyclical buffer and confidential bank-specific Pillar 2b capital requirement, but includes maximum potential D-SIB requirement, which is also bank specific and therefore confidential.
The SARB has adopted a principle-based approach in developing a framework for dealing with domestic systemically important banks in South Africa (South African D-SIB framework). The South African D-SIB framework assesses the systemic importance of banks, controlling companies and branches of foreign banks licensed to operate in South Africa. While the D-SIB loss-absorbency requirement imposed on banks will only become effective on 1 January 2016, the SARB has advised banks of their bank-specific loss-absorbency requirements in advance of the implementation date to allow banks sufficient time to account for the loss-absorbency requirement in their capital planning and management processes.
Our performance Risk and capital management report > Capital management continued
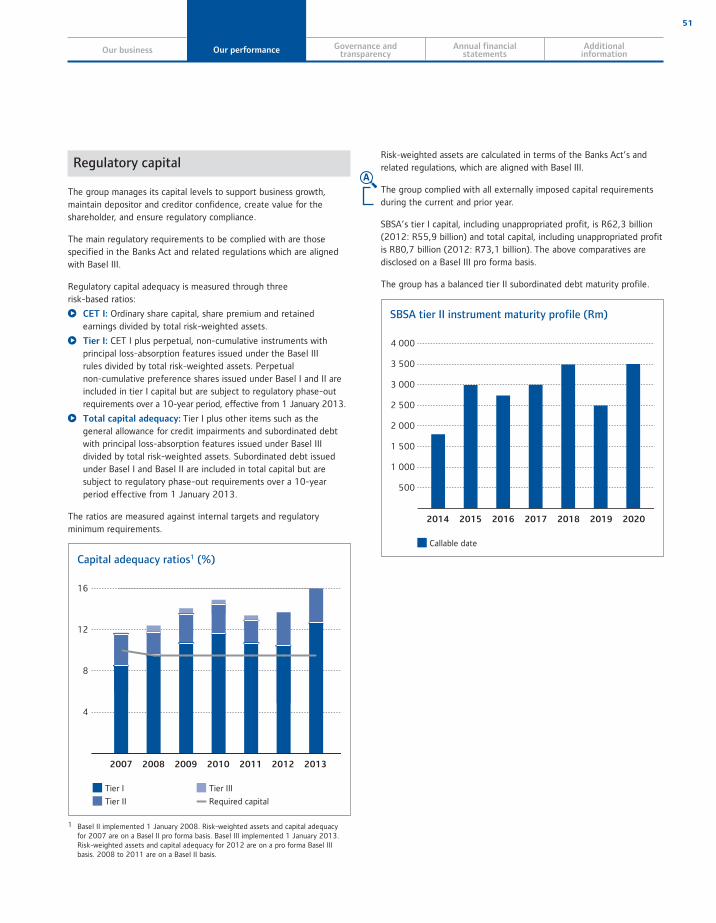
Our business Our performance Governance andtransparency
Annual financialstatements
Additionalinformation
51
Regulatory capital
The group manages its capital levels to support business growth, maintain depositor and creditor confidence, create value for the shareholder, and ensure regulatory compliance.
The main regulatory requirements to be complied with are those specified in the Banks Act and related regulations which are aligned with Basel III.
Regulatory capital adequacy is measured through threerisk-based ratios:
CET I: Ordinary share capital, share premium and retained earnings divided by total risk-weighted assets.
Tier I: CET I plus perpetual, non-cumulative instruments with principal loss-absorption features issued under the Basel IIIrules divided by total risk-weighted assets. Perpetualnon-cumulative preference shares issued under Basel I and II are included in tier I capital but are subject to regulatory phase-out requirements over a 10-year period, effective from 1 January 2013.
Total capital adequacy: Tier I plus other items such as the general allowance for credit impairments and subordinated debt with principal loss-absorption features issued under Basel III divided by total risk-weighted assets. Subordinated debt issued under Basel I and Basel II are included in total capital but are subject to regulatory phase-out requirements over a 10-year period effective from 1 January 2013.
The ratios are measured against internal targets and regulatory minimum requirements.
Tier I
Tier II
Tier III
Required capital
Capital adequacy ratios1 (%)
16
12
8
4
2013201220112010200920082007
1 Basel II implemented 1 January 2008. Risk-weighted assets and capital adequacy for 2007 are on a Basel II pro forma basis. Basel III implemented 1 January 2013. Risk-weighted assets and capital adequacy for 2012 are on a pro forma Basel III basis. 2008 to 2011 are on a Basel II basis.
Risk-weighted assets are calculated in terms of the Banks Act’s and related regulations, which are aligned with Basel III.
The group complied with all externally imposed capital requirements during the current and prior year.
SBSA’s tier I capital, including unappropriated profit, is R62,3 billion (2012: R55,9 billion) and total capital, including unappropriated profit is R80,7 billion (2012: R73,1 billion). The above comparatives are disclosed on a Basel III pro forma basis.
The group has a balanced tier II subordinated debt maturity profile.
Callable date
SBSA tier II instrument maturity profile (Rm)
4 000
3 500
3 000
2 500
2 000
1 500
1 000
500
2020201920182017201620152014
A

52 The Standard Bank of South Africa Annual report 2013
Basel III qualifying capital excluding unappropriated profits
2013Rm
20121,2
Rm
Share capital and premium 36 356 35 256 Retained earnings 42 303 35 097 Other reserves 542 209 Less: regulatory adjustments (16 822) (14 574)
Goodwill (40) (40)Other intangible assets (12 815) (9 846)Deferred tax asset (35) Shortfall of provisions to expected losses (2 714) (2 755)Other adjustments (1 218) (1 933)
Less: regulatory exclusions – unappropriated profit (5 082) (4 645)
Tier I capital 57 297 51 343
Qualifying tier II subordinated debt 19 395 19 395 General allowance for credit impairments 186 295 Less: regulatory adjustments – investment in tier II instruments in other banks (1 280) (2 984)
Tier II capital 18 301 16 706
Total regulatory capital 75 598 68 049
Total capital requirement 46 459 50 185
Total risk-weighted assets 489 045 528 266
1 Pro forma Basel III basis (unaudited). The Basel II tier I and tier II December 2012 capital amounts were R53 388 million and R16 864 million, respectively.2 Restated, refer to page 93.
Capital adequacy ratios
2013 SARB
minimumregulatory
requirement%
Internaltarget ratios
%
Including unappropriated profits
Excluding unappropriated profits
2013%
20121,2
%2013
%20121,2
%
Total capital adequacy ratio 9.5 12.5 – 15.0 16.5 13.8 15.5 12.9Tier I capital adequacy ratio 6.0 10.5 – 12.5 12.8 10.6 11.7 9.7CET I capital adequacy ratio 4.5 9.0 – 10.5 12.8 10.6 11.7 9.7
1 Pro forma Basel III basis.2 Restated, refer to page 93.
A
Our performance Risk and capital management report > Capital management continued

Our business Our performance Governance andtransparency
Annual financialstatements
Additionalinformation
53
Basel III risk-weighted assets and associated capital requirements
2013 20121
Risk-weightedassets
Rm
Capitalrequirement2
Rm
Risk-weightedassets
Rm
Capitalrequirement2
Rm
Credit risk 376 950 35 810 400 300 37 510
Portfolios subject to the standardised approach3 17 760 1 687 22 350 2 123
Corporate 13 847 1 315 19 650 1 867 Sovereign 112 11 Banks 343 33 129 12 Retail mortgages 326 31 41 4 Retail other4 2 970 282 2 121 201 Securitisation exposure 274 26 297 28
Portfolios subject to the advanced internal ratings-based (AIRB) approach 344 821 32 758 363 585 34 022
Corporate 144 947 13 771 157 183 14 673 Sovereign 8 044 764 9 426 895 Banks 18 570 1 764 23 166 1 942 Retail mortgages 81 978 7 788 77 129 7 327 Qualifying retail revolving exposure (QRRE) 47 163 4 480 52 135 4 953 Retail other4 41 527 3 945 41 640 3 956 Securitisation exposure 2 592 246 2 906 276
Other assets 14 369 1 365 14 365 1 365
Counterparty credit risk 14 951 1 420 22 268 2 634
Portfolios subject to the standardised approach3 1 678 159 1 366 1 057
Corporate 1 677 159 1 275 255 Sovereign 64 6 Banks 1 27 796
Portfolios subject to the AIRB approach 13 273 1 261 20 902 1 577
Corporate 6 299 599 7 209 810 Sovereign 171 16 494 47 Banks 6 803 646 13 199 720
Equity risk in the banking book 12 094 1 149 10 500 997
Portfolios subject to the market-based approach 5 612 533 2 059 195
Listed 222 21 160 15 Unlisted 5 390 512 1 899 180
Portfolios subject to the probability of default (PD)/loss given default (LGD) approach 6 482 616 8 441 802
Market risk 15 885 1 509 21 099 2 005
Portfolios subject to the standardised approach3 7 148 680 6 537 621
Interest rate risk 6 523 620 5 925 563 Equity position risk 38 4 61 6 Foreign exchange risk 554 53 528 50 Commodities risk 33 3 23 2
Portfolios subject to the internal models approach 8 737 829 14 562 1 384
Value-at-risk (VaR) based 8 737 829 14 562 1 384
Interest rate risk 6 769 643 10 000 950 Equity position risk 7 647 726 11 996 1 140 Foreign exchange risk 3 214 305 6 158 585 Commodities risk 25 2 1 084 103 Diversification benefit (8 918) (847) (14 676) (1 394)
Operational risk 65 243 6 198 70 327 6 681
Portfolios subject to the standardised approach3 15 158 1 440 70 327 6 681 Portfolios subject to the advanced measurement approach (AMA) 50 085 4 758
Risk-weighted assets for investments in financial entities 3 922 373 3 772 358
Total risk-weighted assets/capital requirement 489 045 46 459 528 266 50 185 1 Pro forma Basel III basis.2 Capital requirement at 9.5% excludes bank-specific add-ons and capital floor.3 Portfolios on the standardised approach relate to low volume structured products, interest rate-specific risk and new products recently traded for which application to adopt the
internal models approach has not been submitted, and entities not on the internal models approach.4 Retail other includes retail SMEs, vehicle and asset finance, and term lending exposures.

54 The Standard Bank of South Africa Annual report 2013
Economic capital
Economic capital adequacy is the internal basis for measuring and reporting all quantifiable risks on a consistent risk-adjusted basis. The group assesses its economic capital adequacy by measuring its risk profile under both normal and stress conditions.
Economic capital of R47,9 billion (2012: R47,8 billion) is the amount of permanent capital that is required to support the group’s banking operations’ economic risk profile. For potential losses arising from risk types that are statistically quantifiable, economic capital reflects the worst-case loss commensurate with the group’s target rating of A- translating to a confidence level of 99.92%.
Available financial resources refers to capital supply as defined by the group for economic capital purposes. It represents permanent capital (ordinary shareholders’ equity) adjusted for items such as future dividend payments and insurance-related reserves. The available financial resources exceed the minimum economic capital requirement.
Risk�adjusted performance measurement
RAPM supports the maximisation of shareholder value by optimally managing financial resources within the board-approved risk appetite.
Capital is centrally monitored and allocated, based on usage and performance, in a manner that enhances overall group economic profit and ROE. Business units are held accountable for achieving their RAPM targets.
RAPM is calculated on both regulatory and economic capital measures.
ICAAP considers the qualitative capital management processes within the organisation and includes the organisation’s governance, risk management, capital management and financial planning standards and frameworks. Furthermore, the quantitative internal assessments of the organisation’s business models are used to assess capital requirements to be held against all risks the group is or may become exposed to, in order to meet current and future needs as well as to assess the group’s resilience under stressed conditions.
Economic capital utilisation by risk type at end of the year
2013Rm
20121
Rm
Credit risk 33 888 34 084 Equity risk 3 564 3 436 Market risk 619 707 Operational risk 4 676 4 859 Business risk 3 808 3 315 Interest rate risk in the banking book (IRRBB) 1 299 1 389
Banking activities – economic capital 47 854 47 790
Available financial resources 74 901 68 800
Capital coverage ratio (times) 1,57 1,44
1 Restated, refer to page 93.
Our performance Risk and capital management report > Capital management continued
Our business Our performance Governance andtransparency
Annual financialstatements
Additionalinformation
55
Risk appetite and stress testing activities are undertaken by teams at the centre, in business lines and at a legal entity level within the risk appetite and stress testing governance frameworks.
The group operated within risk tolerance throughout 2013.
Approach to risk appetite
DefinitionsThe group has adopted the following definitions, where entity refers to a business line or legal entity within the group, or the group itself:
Risk appetite: An expression of the amount of risk an entity is generally willing to take in pursuit of its financial and strategic objectives, reflecting its capacity to sustain losses and continue to meet its obligations as they fall due, under both normal and a range of stress conditions. The metric is referred to as the risk appetite trigger.
Risk tolerance: The maximum amount of risk the entity is prepared to tolerate above risk appetite. The metric is referred to as the risk tolerance limit.
Risk capacity: The maximum amount of risk the entity is able to support within its available financial resources.
Risk appetite statement (RAS): The documented expression of risk appetite and risk tolerance which has been approved by the entity’s relevant governance committee.
Risk profile: The amount or type of risk the entity is currently exposed to (current risk profile) or will be exposed to under both expected and stressed economic conditions (forward risk profile).
ProcessThe group’s risk appetite governance framework provides guidance on the following:
the approach to setting risk appetite triggers and risk tolerance limits
responsibilities for monitoring risk profile
the escalation and resolution process where breaches occur.
Executive management is responsible for drafting the RAS which is then approved by the GRCMC on behalf of the board. In developing the RAS, executive management considers group strategy and the desired balance between risk and return. The GRCMC reviews the group’s current risk profile on a quarterly basis and forward risk profile at a minimum on an annual basis.
RASs at business line and legal entity level are congruent with the group RAS.
Risk appetite statement dimensions Each RAS is made up of RAS dimensions. These may be either qualitative or quantitative and include stressed earnings, liquidity, regulatory capital and economic capital.
The quantitative dimensions are translated into portfolio limits, for example concentrations, credit loss ratios and value-at-risk (VaR), and operational limits, for example, facilities by borrower or counterparty.
Approach to risk appetite 55
Definitions 55
Process 55
Risk appetite statement dimensions 55
Approach to stress testing 56
Governance committee 56
Risk appetite and stress testing
56 The Standard Bank of South Africa Annual report 2013
Approach to stress testing
The group’s stress testing governance framework sets out the responsibilities for and approach to stress testing activities. Stress tests are conducted at group, business line and material legal entity level. The output supports a number of business processes, including:
the ICAAP
the strategic planning and budgeting process
capital planning and management
the setting of risk appetite and risk tolerance
the assessment of the impact of stress conditions on the current and forward risk profile
the development of risk mitigation or contingency plans across a range of stressed conditions
the assessment of the plausibility and adequacy of recovery actions in the group’s recovery and resolution plan.
Groupwide stress testing is conducted across all major risk types using a number of macroeconomic stress scenarios. This groupwide stress testing is augmented by portfolio-specific stress testing and sensitivity analyses to identify the drivers of the group’s risk profile.
The appropriateness of the macroeconomic stress scenarios and the impact of these scenarios on the RAS dimensions are confirmed and approved by the GRCMC for use in the ICAAP and the broader capital planning process.
In addition to the stress tests conducted internally, the group has participated in stress testing exercises conducted by SARB on an industrywide basis.
Governance committee
The primary governance committee overseeing risk appetite and stress testing is the group stress testing and risk appetite committee. It is chaired by the group CRO and is a subcommittee of GROC.
Our performance Risk and capital management report > Risk appetite and stress testing continued
Our business Our performance Governance andtransparency
Annual financialstatements
Additionalinformation
57
Definition
Credit risk is the risk of loss arising outof failure of client counterparties to meet their financial or contractual obligations when due. Credit risk is composed of counterparty risk (including primary,pre-settlement, issuer and settlement risk) and concentration risk.
Approach to managing credit risk
The group’s credit risk comprises mainly wholesale and retail loans and advances, together with the counterparty credit risk arising from derivative contracts entered into with our clients and market counterparties.
The group manages credit risk through:
maintaining a strong culture of responsible lending and a robust risk policy and control framework
identifying, assessing and measuring credit risk clearly and accurately across the group, from the level of individual facilities up to the total portfolio
defining, implementing and continually re-evaluating our risk appetite under actual and stress conditions
monitoring the group’s credit risk relative to limits
ensuring that there is expert scrutiny and independent approval of credit risks and their mitigation.
Primary responsibility for credit risk management resides within the group’s business lines. This is complemented with an independent credit risk function embedded within the business units, which is in turn supported by the overarching group risk function.
Definition 57
Approach to managing credit risk 57
Governance committees 58
Basel: Approved regulatory capital approaches 58
Basel: Use of internal estimates 58
Basel: Standardised approach 58
Basel: Internal ratings-based approach 58
Probability of default 59
Loss given default 59
Exposure at default 59
Corporate, sovereign and bank portfolios 59
Specialised lending portfolio 59
Equity portfolio 59
Retail portfolio 60
Credit portfolio characteristics and metrics in
terms of the Basel reporting framework 60
Basel: Credit risk mitigation 60
Basel: Concentration risk 61
Basel: Counterparty credit risk 61
Basel: Securitisation 61
Credit portfolio characteristics and metrics
in terms of IFRS 62
Analysis of loans and advances 62
IFRS: Maximum exposure to credit risk 62
Renegotiated loans and advances 68
IFRS: Collateral 68
Analysis of the group’s residential mortgage
portfolio balance-to-value ratios 71
Credit risk
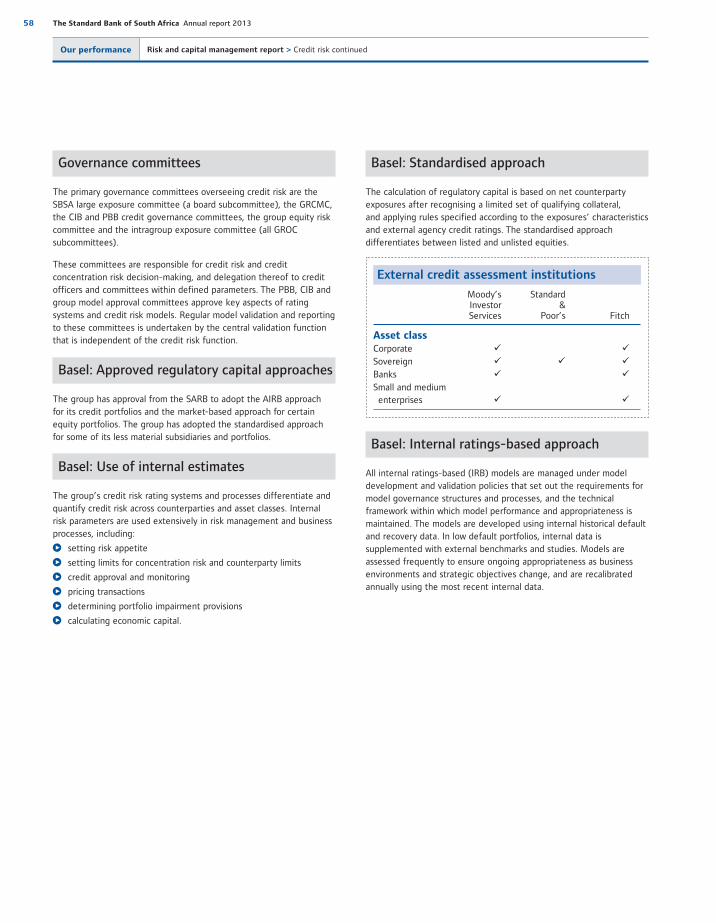
58 The Standard Bank of South Africa Annual report 2013
Governance committees
The primary governance committees overseeing credit risk are the SBSA large exposure committee (a board subcommittee), the GRCMC, the CIB and PBB credit governance committees, the group equity risk committee and the intragroup exposure committee (all GROC subcommittees).
These committees are responsible for credit risk and credit concentration risk decision-making, and delegation thereof to credit officers and committees within defined parameters. The PBB, CIB and group model approval committees approve key aspects of rating systems and credit risk models. Regular model validation and reporting to these committees is undertaken by the central validation function that is independent of the credit risk function.
Basel: Approved regulatory capital approaches
The group has approval from the SARB to adopt the AIRB approach for its credit portfolios and the market-based approach for certain equity portfolios. The group has adopted the standardised approach for some of its less material subsidiaries and portfolios.
Basel: Use of internal estimates
The group’s credit risk rating systems and processes differentiate and quantify credit risk across counterparties and asset classes. Internal risk parameters are used extensively in risk management and business processes, including:
setting risk appetite
setting limits for concentration risk and counterparty limits
credit approval and monitoring
pricing transactions
determining portfolio impairment provisions
calculating economic capital.
Basel: Standardised approach
The calculation of regulatory capital is based on net counterparty exposures after recognising a limited set of qualifying collateral, and applying rules specified according to the exposures’ characteristics and external agency credit ratings. The standardised approach differentiates between listed and unlisted equities.
External credit assessment institutions
Moody’s Investor Services
Standard&
Poor’s Fitch
Asset classCorporate ü üSovereign ü ü üBanks ü üSmall and medium enterprises ü ü
Basel: Internal ratings�based approach
All internal ratings-based (IRB) models are managed under model development and validation policies that set out the requirements for model governance structures and processes, and the technical framework within which model performance and appropriateness is maintained. The models are developed using internal historical default and recovery data. In low default portfolios, internal data is supplemented with external benchmarks and studies. Models are assessed frequently to ensure ongoing appropriateness as business environments and strategic objectives change, and are recalibrated annually using the most recent internal data.
Our performance Risk and capital management report > Credit risk continued
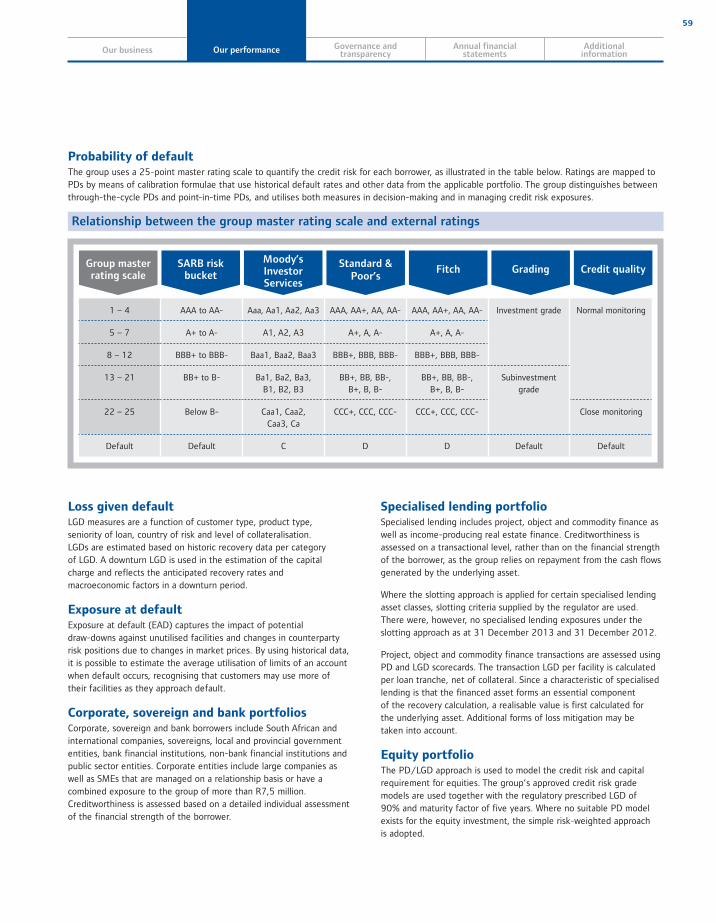
Our business Our performance Governance andtransparency
Annual financialstatements
Additionalinformation
59
Probability of defaultThe group uses a 25-point master rating scale to quantify the credit risk for each borrower, as illustrated in the table below. Ratings are mapped to PDs by means of calibration formulae that use historical default rates and other data from the applicable portfolio. The group distinguishes between through-the-cycle PDs and point-in-time PDs, and utilises both measures in decision-making and in managing credit risk exposures.
Relationship between the group master rating scale and external ratings
1 – 4 AAA to AA- Aaa, Aa1, Aa2, Aa3 AAA, AA+, AA, AA- AAA, AA+, AA, AA- Investment grade Normal monitoring
5 – 7 A+ to A- A1, A2, A3 A+, A, A- A+, A, A-
8 – 12 BBB+ to BBB- Baa1, Baa2, Baa3 BBB+, BBB, BBB- BBB+, BBB, BBB-
13 – 21 BB+ to B- Ba1, Ba2, Ba3, B1, B2, B3
BB+, BB, BB-, B+, B, B-
BB+, BB, BB-, B+, B, B-
Subinvestment grade
22 – 25 Below B- Caa1, Caa2,Caa3, Ca
CCC+, CCC, CCC- CCC+, CCC, CCC- Close monitoring
Default Default C D D Default Default
Group master rating scale
SARB risk bucket
Moody’s Investor Services
Standard & Poor’s
Fitch Grading Credit quality
Loss given defaultLGD measures are a function of customer type, product type, seniority of loan, country of risk and level of collateralisation. LGDs are estimated based on historic recovery data per category of LGD. A downturn LGD is used in the estimation of the capital charge and reflects the anticipated recovery rates and macroeconomic factors in a downturn period.
Exposure at defaultExposure at default (EAD) captures the impact of potential draw-downs against unutilised facilities and changes in counterparty risk positions due to changes in market prices. By using historical data, it is possible to estimate the average utilisation of limits of an account when default occurs, recognising that customers may use more of their facilities as they approach default.
Corporate, sovereign and bank portfoliosCorporate, sovereign and bank borrowers include South African and international companies, sovereigns, local and provincial government entities, bank financial institutions, non-bank financial institutions and public sector entities. Corporate entities include large companies as well as SMEs that are managed on a relationship basis or have a combined exposure to the group of more than R7,5 million. Creditworthiness is assessed based on a detailed individual assessment of the financial strength of the borrower.
Specialised lending portfolioSpecialised lending includes project, object and commodity finance as well as income-producing real estate finance. Creditworthiness is assessed on a transactional level, rather than on the financial strength of the borrower, as the group relies on repayment from the cash flows generated by the underlying asset.
Where the slotting approach is applied for certain specialised lending asset classes, slotting criteria supplied by the regulator are used. There were, however, no specialised lending exposures under the slotting approach as at 31 December 2013 and 31 December 2012.
Project, object and commodity finance transactions are assessed using PD and LGD scorecards. The transaction LGD per facility is calculated per loan tranche, net of collateral. Since a characteristic of specialised lending is that the financed asset forms an essential componentof the recovery calculation, a realisable value is first calculated forthe underlying asset. Additional forms of loss mitigation may betaken into account.
Equity portfolioThe PD/LGD approach is used to model the credit risk and capital requirement for equities. The group’s approved credit risk grade models are used together with the regulatory prescribed LGD of 90% and maturity factor of five years. Where no suitable PD model exists for the equity investment, the simple risk-weighted approach is adopted.
60 The Standard Bank of South Africa Annual report 2013
Retail portfolioRetail mortgage exposures relate to mortgage loans to individuals and are a combination of both drawn and undrawn EADs. Qualifying revolving retail exposures (QRRE) relate to cheque accounts, credit cards and revolving personal loans and products, and includes both drawn and undrawn exposures. Retail other covers other branch lending and vehicle finance for retail, retail small and retail medium enterprise portfolios. Branch lending includes both drawn and undrawn exposures, while vehicle and asset finance only has drawn exposures.
Internally developed behavioural scorecards are used to measure the anticipated performance for each account. Mapping of the behaviour score to a PD is performed for each portfolio using a statistical calibration of portfolio-specific historical default experience. The behavioural scorecard PDs are used to determine the portfolio distribution on the master rating scale. Separate LGD models are used for each product portfolio and are based on historical recovery data. EAD is measured as a percentage of the credit facility limit and is based on historical averages. EAD is estimated per portfolio and per portfolio-specific segment, using internal historical data on limit utilisation.
Credit portfolio characteristics and metrics in terms of the Basel reporting framework
Basel: Credit risk mitigationCollateral, guarantees, derivatives and on- and off-balance sheet netting are widely used to mitigate credit risk. Credit risk mitigation policies and procedures ensure that credit risk mitigation techniques are acceptable, used consistently, valued appropriately and regularly, and meet the risk requirements of operational management for legal, practical and timely enforcement. Detailed processes and procedures are in place to guide each type of mitigation used.
The main types of collateral taken are:
mortgage bonds over residential, commercial and industrial properties
cession of book debts
bonds over plant and equipment
the underlying movable assets financed under leases and instalment sales.
Reverse repurchase agreements are underpinned by the assets being financed, which are mostly liquid and tradable financial instruments. Guarantees and related legal contracts are often required, particularly in support of credit extension to groups of companies and weaker counterparties. Guarantor counterparties include banks, parent companies, shareholders and associated counterparties. Creditworthiness is established for the guarantor as for other counterparty credit approvals.
For derivative transactions, the group typically uses internationally recognised and enforceable international swaps and derivatives association (ISDA) agreements, with a credit support annexure, where collateral support is considered necessary. Other credit protection terms may be stipulated, such as limitations on the amount of unsecured credit exposure acceptable, collateralisation if mark-to-market credit exposure exceeds acceptable limits, and termination of the contract if certain credit events occur, for example, downgrade of the counterparty’s public credit rating.
Wrong-way risk arises where there is a positive correlation between counterparty default and transaction exposure, and a negative correlation between transaction exposure and the value of collateral at the point of counterparty default. This risk is addressed by taking into consideration the high correlation between the default event and exposure to the counterparty when calculating the potential exposure and security margin requirements on these transactions. The group monitors and manages its concentrations to credit risk mitigation types, for example, residential property collateral.
To manage actual or potential portfolio risk concentrations in areas of higher credit risk and credit portfolio growth, the group implements hedging and other strategies from time to time. This is done at individual counterparty, subportfolio and portfolio levels through the use of syndication, distribution and sale of assets, asset and portfolio limit management, credit derivatives and credit protection.
A
A
Our performance Risk and capital management report > Credit risk continued
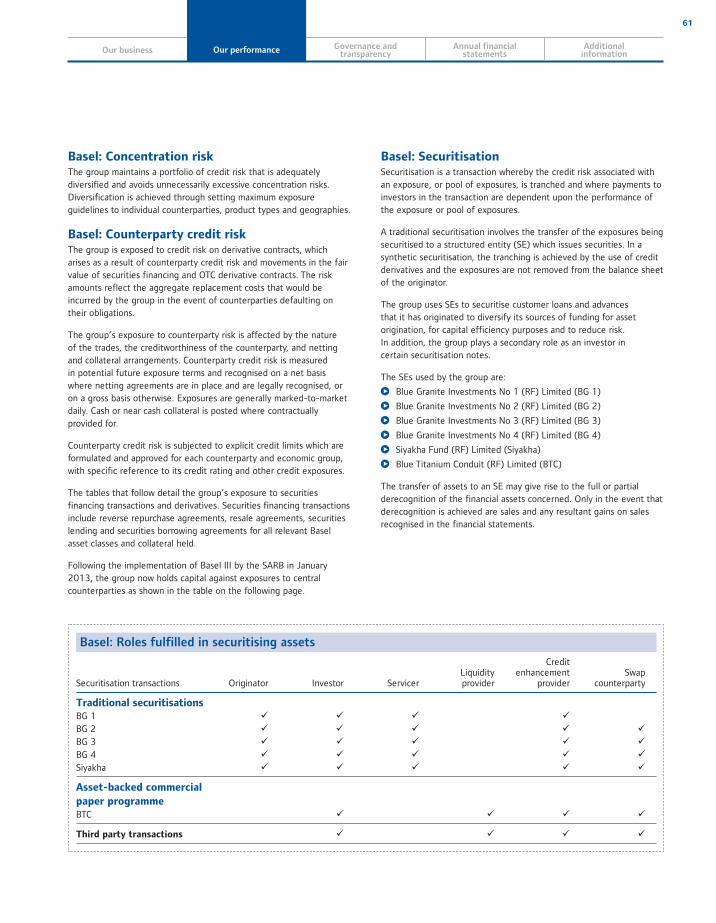
Our business Our performance Governance andtransparency
Annual financialstatements
Additionalinformation
61
Basel: Concentration riskThe group maintains a portfolio of credit risk that is adequately diversified and avoids unnecessarily excessive concentration risks. Diversification is achieved through setting maximum exposure guidelines to individual counterparties, product types and geographies.
Basel: Counterparty credit riskThe group is exposed to credit risk on derivative contracts, which arises as a result of counterparty credit risk and movements in the fair value of securities financing and OTC derivative contracts. The risk amounts reflect the aggregate replacement costs that would be incurred by the group in the event of counterparties defaulting on their obligations.
The group’s exposure to counterparty risk is affected by the natureof the trades, the creditworthiness of the counterparty, and netting and collateral arrangements. Counterparty credit risk is measuredin potential future exposure terms and recognised on a net basis where netting agreements are in place and are legally recognised, or on a gross basis otherwise. Exposures are generally marked-to-market daily. Cash or near cash collateral is posted where contractually provided for.
Counterparty credit risk is subjected to explicit credit limits which are formulated and approved for each counterparty and economic group, with specific reference to its credit rating and other credit exposures.
The tables that follow detail the group’s exposure to securities financing transactions and derivatives. Securities financing transactions include reverse repurchase agreements, resale agreements, securities lending and securities borrowing agreements for all relevant Basel asset classes and collateral held.
Following the implementation of Basel III by the SARB in January 2013, the group now holds capital against exposures to central counterparties as shown in the table on the following page.
Basel: SecuritisationSecuritisation is a transaction whereby the credit risk associated with an exposure, or pool of exposures, is tranched and where payments to investors in the transaction are dependent upon the performance of the exposure or pool of exposures.
A traditional securitisation involves the transfer of the exposures being securitised to a structured entity (SE) which issues securities. In a synthetic securitisation, the tranching is achieved by the use of credit derivatives and the exposures are not removed from the balance sheet of the originator.
The group uses SEs to securitise customer loans and advancesthat it has originated to diversify its sources of funding for asset origination, for capital efficiency purposes and to reduce risk. In addition, the group plays a secondary role as an investor in certain securitisation notes.
The SEs used by the group are:
Blue Granite Investments No 1 (RF) Limited (BG 1)
Blue Granite Investments No 2 (RF) Limited (BG 2)
Blue Granite Investments No 3 (RF) Limited (BG 3)
Blue Granite Investments No 4 (RF) Limited (BG 4)
Siyakha Fund (RF) Limited (Siyakha)
Blue Titanium Conduit (RF) Limited (BTC)
The transfer of assets to an SE may give rise to the full or partial derecognition of the financial assets concerned. Only in the event that derecognition is achieved are sales and any resultant gains on sales recognised in the financial statements.
Basel: Roles fulfilled in securitising assets
Securitisation transactions Originator Investor ServicerLiquidity provider
Creditenhancement
providerSwap
counterparty
Traditional securitisationsBG 1 ü ü ü üBG 2 ü ü ü ü üBG 3 ü ü ü ü üBG 4 ü ü ü ü üSiyakha ü ü ü ü ü
Asset-backed commercial
paper programmeBTC ü ü ü ü
Third party transactions ü ü ü ü
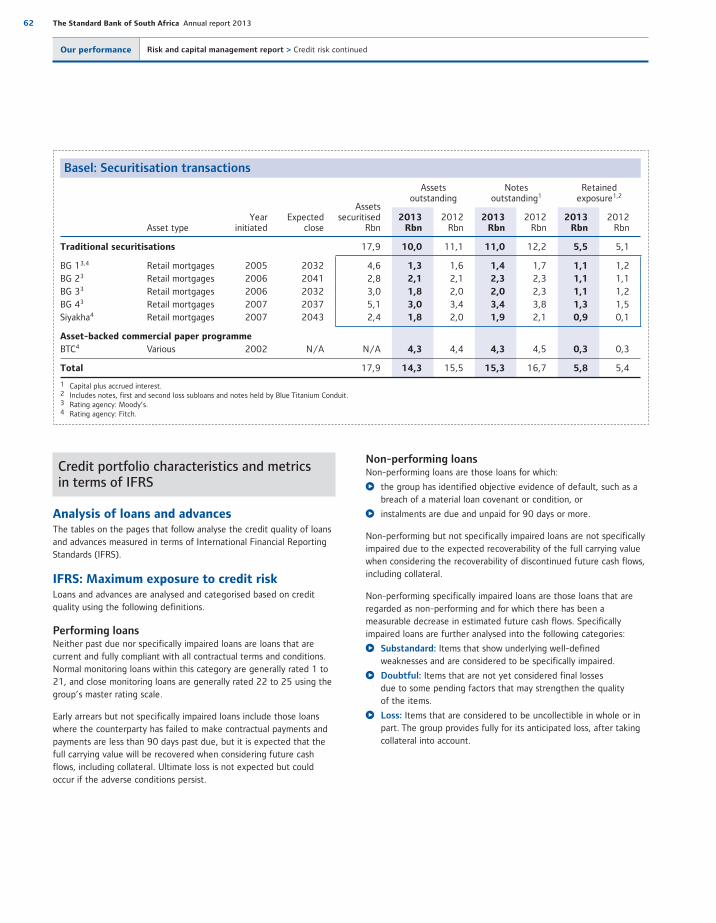
62 The Standard Bank of South Africa Annual report 2013
Credit portfolio characteristics and metricsin terms of IFRS
Analysis of loans and advancesThe tables on the pages that follow analyse the credit quality of loans and advances measured in terms of International Financial Reporting Standards (IFRS).
IFRS: Maximum exposure to credit riskLoans and advances are analysed and categorised based on credit quality using the following definitions.
Performing loansNeither past due nor specifically impaired loans are loans that are current and fully compliant with all contractual terms and conditions. Normal monitoring loans within this category are generally rated 1 to 21, and close monitoring loans are generally rated 22 to 25 using the group’s master rating scale.
Early arrears but not specifically impaired loans include those loans where the counterparty has failed to make contractual payments and payments are less than 90 days past due, but it is expected that the full carrying value will be recovered when considering future cash flows, including collateral. Ultimate loss is not expected but could occur if the adverse conditions persist.
Non-performing loansNon-performing loans are those loans for which:
the group has identified objective evidence of default, such as a breach of a material loan covenant or condition, or
instalments are due and unpaid for 90 days or more.
Non-performing but not specifically impaired loans are not specifically impaired due to the expected recoverability of the full carrying value when considering the recoverability of discontinued future cash flows, including collateral.
Non-performing specifically impaired loans are those loans that are regarded as non-performing and for which there has been a measurable decrease in estimated future cash flows. Specifically impaired loans are further analysed into the following categories:
Substandard: Items that show underlying well-defined weaknesses and are considered to be specifically impaired.
Doubtful: Items that are not yet considered final losses due to some pending factors that may strengthen the quality of the items.
Loss: Items that are considered to be uncollectible in whole or in part. The group provides fully for its anticipated loss, after taking collateral into account.
Basel: Securitisation transactions
Asset typeYear
initiatedExpected
close
Assets securitised
Rbn
Assets outstanding
Notes outstanding1
Retained exposure1,2
2013Rbn
2012Rbn
2013Rbn
2012Rbn
2013Rbn
2012Rbn
Traditional securitisations 17,9 10,0 11,1 11,0 12,2 5,5 5,1
BG 13,4 Retail mortgages 2005 2032 4,6 1,3 1,6 1,4 1,7 1,1 1,2BG 23 Retail mortgages 2006 2041 2,8 2,1 2,1 2,3 2,3 1,1 1,1BG 33 Retail mortgages 2006 2032 3,0 1,8 2,0 2,0 2,3 1,1 1,2BG 43 Retail mortgages 2007 2037 5,1 3,0 3,4 3,4 3,8 1,3 1,5Siyakha4 Retail mortgages 2007 2043 2,4 1,8 2,0 1,9 2,1 0,9 0,1
Asset-backed commercial paper programme
BTC4 Various 2002 N/A N/A 4,3 4,4 4,3 4,5 0,3 0,3
Total 17,9 14,3 15,5 15,3 16,7 5,8 5,4
1 Capital plus accrued interest.2 Includes notes, first and second loss subloans and notes held by Blue Titanium Conduit.3 Rating agency: Moody’s.4 Rating agency: Fitch.
Our performance Risk and capital management report > Credit risk continued
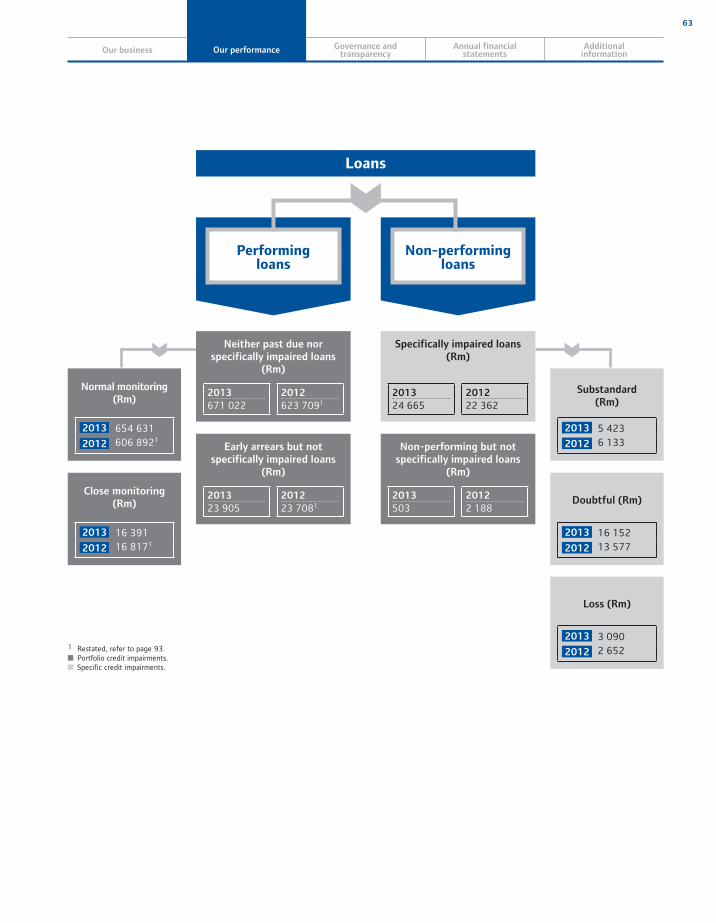
Our business Our performance Governance andtransparency
Annual financialstatements
Additionalinformation
63
Loans
Performing loans
Non-performing loans
Neither past due nor specifically impaired loans
(Rm)
2013
671 0222012
623 7091
Specifically impaired loans (Rm)
2013
24 6652012
22 362
Normal monitoring (Rm)
2013 654 631
2012 606 8921
Substandard (Rm)
2013 5 423
2012 6 133Early arrears but not specifically impaired loans
(Rm)
2013
23 9052012
23 7081
Non-performing but not specifically impaired loans
(Rm)
2013
5032012
2 188
Close monitoring (Rm)
2013 16 391
2012 16 8171
Doubtful (Rm)
2013 16 152
2012 13 577
1 Restated, refer to page 93. Portfolio credit impairments. Specific credit impairments.
Loss (Rm)
2013 3 090
2012 2 652
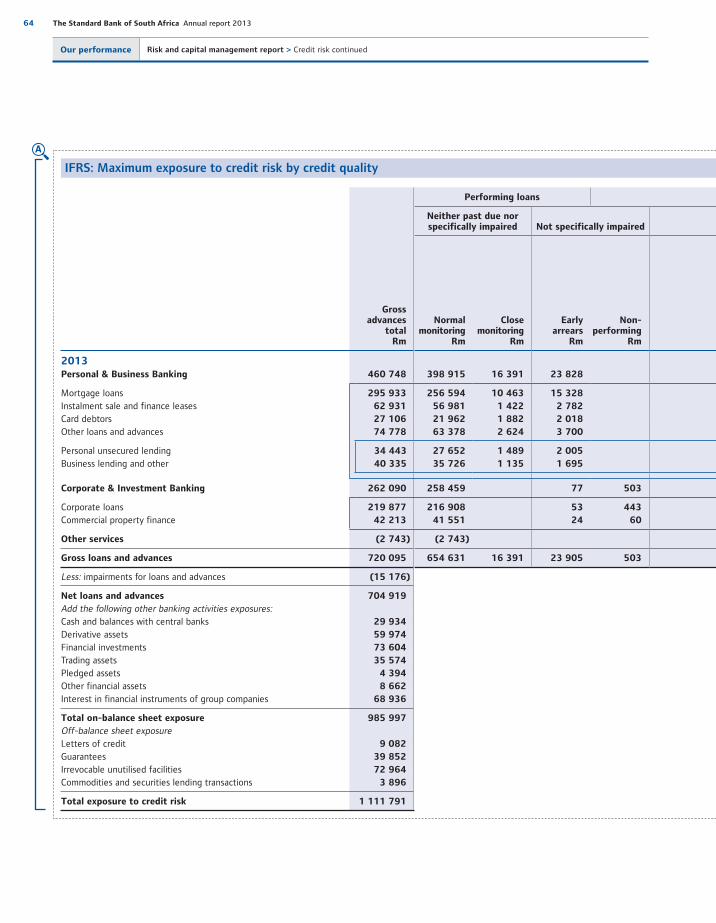
64 The Standard Bank of South Africa Annual report 2013
IFRS: Maximum exposure to credit risk by credit quality
Gross advances
totalRm
Performing loans
Neither past due nor specifically impaired Not specifically impaired
Normalmonitoring
Rm
Close monitoring
Rm
Early arrears
Rm
Non-performing
Rm
2013Personal & Business Banking 460 748 398 915 16 391 23 828
Mortgage loans 295 933 256 594 10 463 15 328
Instalment sale and finance leases 62 931 56 981 1 422 2 782
Card debtors 27 106 21 962 1 882 2 018
Other loans and advances 74 778 63 378 2 624 3 700
Personal unsecured lending 34 443 27 652 1 489 2 005
Business lending and other 40 335 35 726 1 135 1 695
Corporate & Investment Banking 262 090 258 459 77 503
Corporate loans 219 877 216 908 53 443
Commercial property finance 42 213 41 551 24 60
Other services (2 743) (2 743)
Gross loans and advances 720 095 654 631 16 391 23 905 503
Less: impairments for loans and advances (15 176)
Net loans and advances 704 919
Add the following other banking activities exposures:Cash and balances with central banks 29 934
Derivative assets 59 974
Financial investments 73 604
Trading assets 35 574
Pledged assets 4 394
Other financial assets 8 662
Interest in financial instruments of group companies 68 936
Total on-balance sheet exposure 985 997
Off-balance sheet exposureLetters of credit 9 082
Guarantees 39 852
Irrevocable unutilised facilities 72 964
Commodities and securities lending transactions 3 896
Total exposure to credit risk 1 111 791
A
Our performance Risk and capital management report > Credit risk continued

Our business Our performance Governance andtransparency
Annual financialstatements
Additionalinformation
65
Non-performing loans
Specifically impaired loans
Total non-
performing loans
Rm
Non-performing
loans %
Sub-standard
RmDoubtful
RmLossRm
TotalRm
Securitiesand
expectedrecoveries
onspecifically
impairedloans
Rm
Net after securities
and expected
recoveries on
specifically impaired
loansRm
Balance sheet
impair-ments
for non-performing specifically
impaired loans
Rm
Gross specific
impairment coverage
%
4 678 14 158 2 778 21 614 12 500 9 114 9 114 42 21 614 4.7
3 671 9 496 381 13 548 9 696 3 852 3 852 28 13 548 4.6
134 995 617 1 746 851 895 895 51 1 746 2.8
219 329 696 1 244 371 873 873 70 1 244 4.6
654 3 338 1 084 5 076 1 582 3 494 3 494 69 5 076 6.8
411 2 228 658 3 297 1 061 2 236 2 236 68 3 297 9.6
243 1 110 426 1 779 521 1 258 1 258 71 1 779 4.4
745 1 994 312 3 051 1 235 1 816 1 816 60 3 554 1.4
446 1 779 248 2 473 817 1 656 1 656 67 2 916 1.3
299 215 64 578 418 160 160 28 638 1.5
(2) 2 2
5 423 16 152 3 090 24 665 13 733 10 932 10 932 44 25 168 3.5
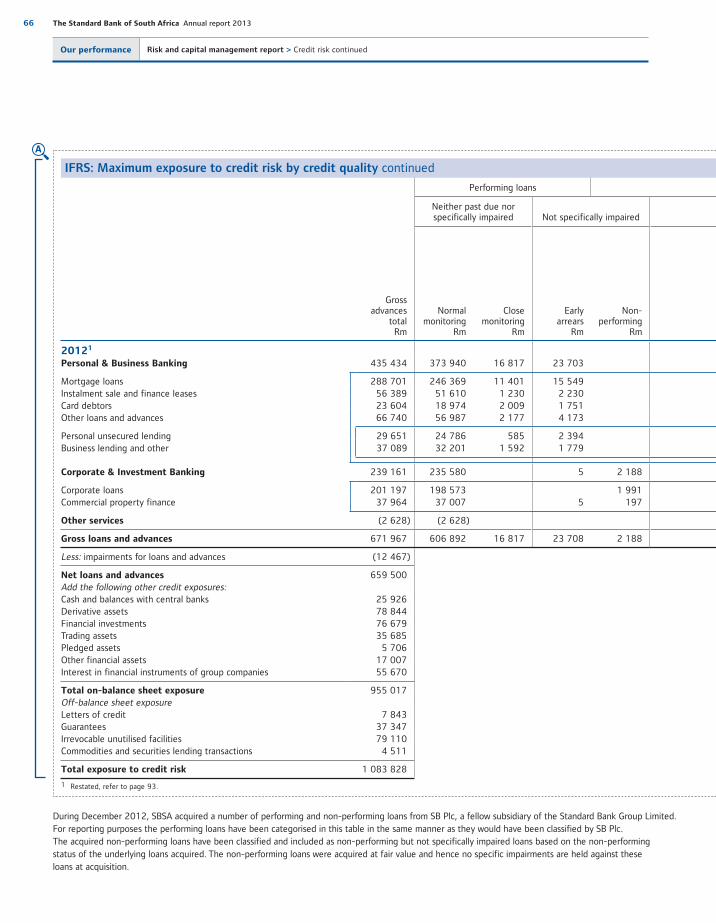
66 The Standard Bank of South Africa Annual report 2013
IFRS: Maximum exposure to credit risk by credit quality continued
Gross advances
totalRm
Performing loans
Neither past due nor specifically impaired Not specifically impaired
Normal monitoring
Rm
Closemonitoring
Rm
Early arrears
Rm
Non-performing
Rm
20121
Personal & Business Banking 435 434 373 940 16 817 23 703
Mortgage loans 288 701 246 369 11 401 15 549 Instalment sale and finance leases 56 389 51 610 1 230 2 230 Card debtors 23 604 18 974 2 009 1 751 Other loans and advances 66 740 56 987 2 177 4 173
Personal unsecured lending 29 651 24 786 585 2 394 Business lending and other 37 089 32 201 1 592 1 779
Corporate & Investment Banking 239 161 235 580 5 2 188
Corporate loans 201 197 198 573 1 991 Commercial property finance 37 964 37 007 5 197
Other services (2 628) (2 628)
Gross loans and advances 671 967 606 892 16 817 23 708 2 188
Less: impairments for loans and advances (12 467)
Net loans and advances 659 500 Add the following other credit exposures:Cash and balances with central banks 25 926 Derivative assets 78 844 Financial investments 76 679 Trading assets 35 685 Pledged assets 5 706 Other financial assets 17 007 Interest in financial instruments of group companies 55 670
Total on-balance sheet exposure 955 017Off-balance sheet exposureLetters of credit 7 843 Guarantees 37 347 Irrevocable unutilised facilities 79 110Commodities and securities lending transactions 4 511
Total exposure to credit risk 1 083 828
1 Restated, refer to page 93.
During December 2012, SBSA acquired a number of performing and non-performing loans from SB Plc, a fellow subsidiary of the Standard Bank Group Limited.For reporting purposes the performing loans have been categorised in this table in the same manner as they would have been classified by SB Plc.The acquired non-performing loans have been classified and included as non-performing but not specifically impaired loans based on the non-performingstatus of the underlying loans acquired. The non-performing loans were acquired at fair value and hence no specific impairments are held against theseloans at acquisition.
A
Our performance Risk and capital management report > Credit risk continued

Our business Our performance Governance andtransparency
Annual financialstatements
Additionalinformation
67
Non-performing loans
Specifically impaired loans
Total non-
performing loans
Rm
Non-performing
loans%
Sub-standard
RmDoubtful
RmLossRm
TotalRm
Securities and
expected recoveries
on specifically
impaired loans
Rm
Net after securities
and expected
recoveries on
specifically impaired
loansRm
Balance sheet
impairments for non-
performing specifically
impaired loans
Rm
Gross specific
impairment coverage
%
5 793 12 737 2 444 20 974 13 174 7 800 7 800 37 20 974 4.8
4 863 9 966 553 15 382 11 287 4 095 4 095 27 15 382 5.3 127 597 595 1 319 622 697 697 53 1 319 2.3 157 230 483 870 310 560 560 64 870 3.7 646 1 944 813 3 403 955 2 448 2 448 72 3 403 5.1
341 1 154 391 1 886 456 1 430 1 430 76 1 886 6.4 305 790 422 1 517 499 1 018 1 018 67 1 517 4.1
340 840 208 1 388 997 391 391 28 3 576 1.5
16 594 23 633 422 211 211 33 2 624 1.3 324 246 185 755 575 180 180 24 952 2.5
(2) 2 2
6 133 13 577 2 652 22 362 14 169 8 193 8 193 37 24 550 3.7
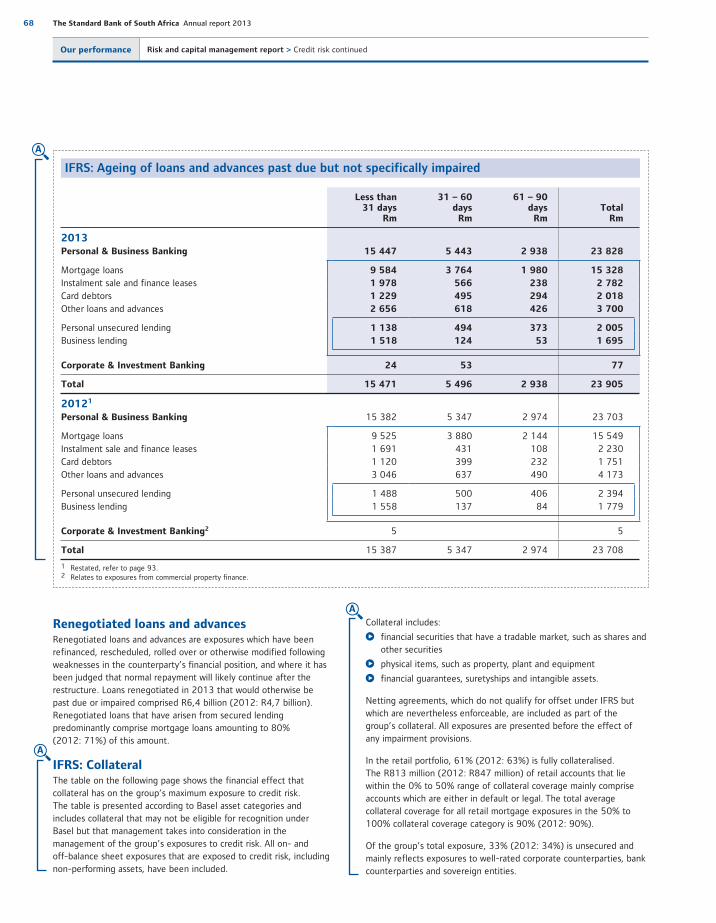
68 The Standard Bank of South Africa Annual report 2013
IFRS: Ageing of loans and advances past due but not specifically impaired
Less than 31 days
Rm
31 – 60 days
Rm
61 – 90 days
RmTotal
Rm
2013Personal & Business Banking 15 447 5 443 2 938 23 828
Mortgage loans 9 584 3 764 1 980 15 328
Instalment sale and finance leases 1 978 566 238 2 782
Card debtors 1 229 495 294 2 018
Other loans and advances 2 656 618 426 3 700
Personal unsecured lending 1 138 494 373 2 005
Business lending 1 518 124 53 1 695
Corporate & Investment Banking 24 53 77
Total 15 471 5 496 2 938 23 905
20121
Personal & Business Banking 15 382 5 347 2 974 23 703
Mortgage loans 9 525 3 880 2 144 15 549 Instalment sale and finance leases 1 691 431 108 2 230 Card debtors 1 120 399 232 1 751 Other loans and advances 3 046 637 490 4 173
Personal unsecured lending 1 488 500 406 2 394 Business lending 1 558 137 84 1 779
Corporate & Investment Banking2 5 5
Total 15 387 5 347 2 974 23 708
1 Restated, refer to page 93. 2 Relates to exposures from commercial property finance.
Renegotiated loans and advancesRenegotiated loans and advances are exposures which have been refinanced, rescheduled, rolled over or otherwise modified following weaknesses in the counterparty’s financial position, and where it has been judged that normal repayment will likely continue after the restructure. Loans renegotiated in 2013 that would otherwise bepast due or impaired comprised R6,4 billion (2012: R4,7 billion). Renegotiated loans that have arisen from secured lending predominantly comprise mortgage loans amounting to 80% (2012: 71%) of this amount.
IFRS: CollateralThe table on the following page shows the financial effect that collateral has on the group’s maximum exposure to credit risk. The table is presented according to Basel asset categories and includes collateral that may not be eligible for recognition under Basel but that management takes into consideration in the management of the group’s exposures to credit risk. All on- and off-balance sheet exposures that are exposed to credit risk, including non-performing assets, have been included.
Collateral includes:
financial securities that have a tradable market, such as shares and other securities
physical items, such as property, plant and equipment
financial guarantees, suretyships and intangible assets.
Netting agreements, which do not qualify for offset under IFRS but which are nevertheless enforceable, are included as part of the group’s collateral. All exposures are presented before the effect of any impairment provisions.
In the retail portfolio, 61% (2012: 63%) is fully collateralised. The R813 million (2012: R847 million) of retail accounts that lie within the 0% to 50% range of collateral coverage mainly comprise accounts which are either in default or legal. The total average collateral coverage for all retail mortgage exposures in the 50% to 100% collateral coverage category is 90% (2012: 90%).
Of the group’s total exposure, 33% (2012: 34%) is unsecured and mainly reflects exposures to well-rated corporate counterparties, bank counterparties and sovereign entities.
A
A
A
Our performance Risk and capital management report > Credit risk continued
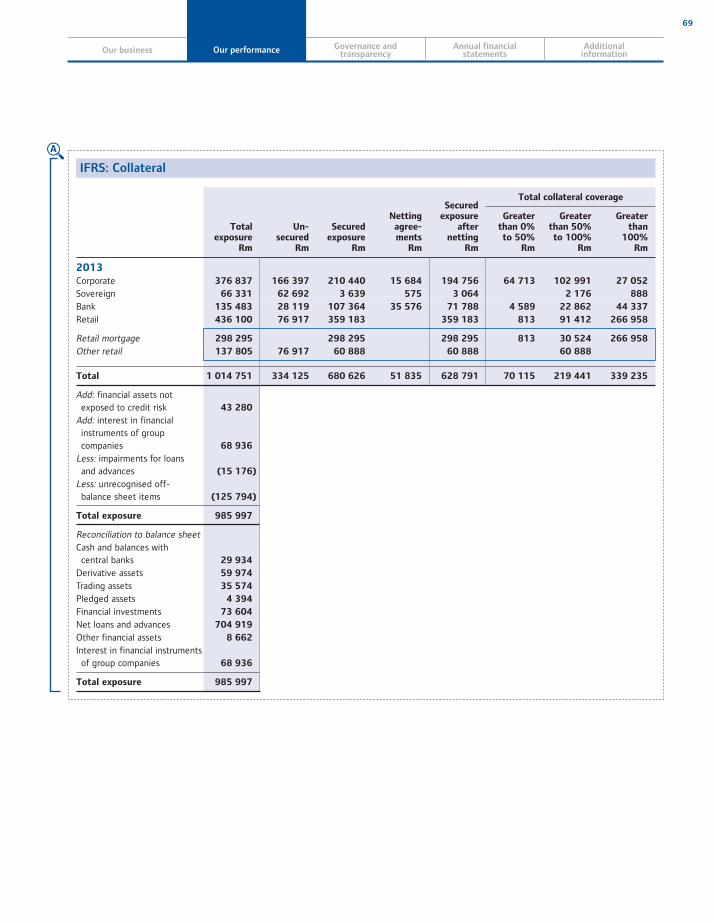
Our business Our performance Governance andtransparency
Annual financialstatements
Additionalinformation
69
IFRS: Collateral
Total exposure
Rm
Un-secured
Rm
Secured exposure
Rm
Netting agree-ments
Rm
Secured exposure
after netting
Rm
Total collateral coverage
Greater than 0% to 50%
Rm
Greater than 50% to 100%
Rm
Greater than
100%Rm
2013Corporate 376 837 166 397 210 440 15 684 194 756 64 713 102 991 27 052
Sovereign 66 331 62 692 3 639 575 3 064 2 176 888
Bank 135 483 28 119 107 364 35 576 71 788 4 589 22 862 44 337
Retail 436 100 76 917 359 183 359 183 813 91 412 266 958
Retail mortgage 298 295 298 295 298 295 813 30 524 266 958
Other retail 137 805 76 917 60 888 60 888 60 888
Total 1 014 751 334 125 680 626 51 835 628 791 70 115 219 441 339 235
Add: financial assets not exposed to credit risk 43 280
Add: interest in financial instruments of group companies 68 936
Less: impairments for loans and advances (15 176)
Less: unrecognised off- balance sheet items (125 794)
Total exposure 985 997
Reconciliation to balance sheetCash and balances with central banks 29 934
Derivative assets 59 974
Trading assets 35 574
Pledged assets 4 394
Financial investments 73 604
Net loans and advances 704 919
Other financial assets 8 662
Interest in financial instruments of group companies 68 936
Total exposure 985 997
A
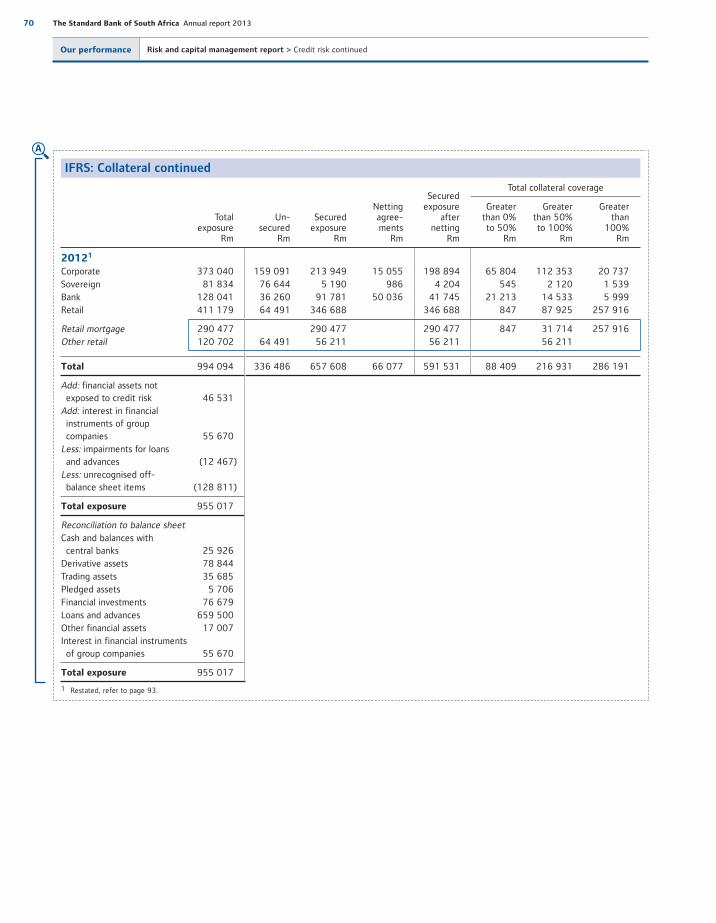
70 The Standard Bank of South Africa Annual report 2013
IFRS: Collateral continued
Total exposure
Rm
Un-secured
Rm
Secured exposure
Rm
Netting agree-ments
Rm
Secured exposure
after netting
Rm
Total collateral coverage
Greater than 0% to 50%
Rm
Greater than 50% to 100%
Rm
Greater than
100%Rm
20121
Corporate 373 040 159 091 213 949 15 055 198 894 65 804 112 353 20 737 Sovereign 81 834 76 644 5 190 986 4 204 545 2 120 1 539 Bank 128 041 36 260 91 781 50 036 41 745 21 213 14 533 5 999 Retail 411 179 64 491 346 688 346 688 847 87 925 257 916
Retail mortgage 290 477 290 477 290 477 847 31 714 257 916Other retail 120 702 64 491 56 211 56 211 56 211
Total 994 094 336 486 657 608 66 077 591 531 88 409 216 931 286 191
Add: financial assets not exposed to credit risk 46 531Add: interest in financial instruments of group companies 55 670
Less: impairments for loans and advances (12 467)Less: unrecognised off- balance sheet items (128 811)
Total exposure 955 017
Reconciliation to balance sheetCash and balances with central banks 25 926 Derivative assets 78 844 Trading assets 35 685 Pledged assets 5 706 Financial investments 76 679Loans and advances 659 500 Other financial assets 17 007 Interest in financial instruments of group companies 55 670
Total exposure 955 017
1 Restated, refer to page 93.
A
Our performance Risk and capital management report > Credit risk continued
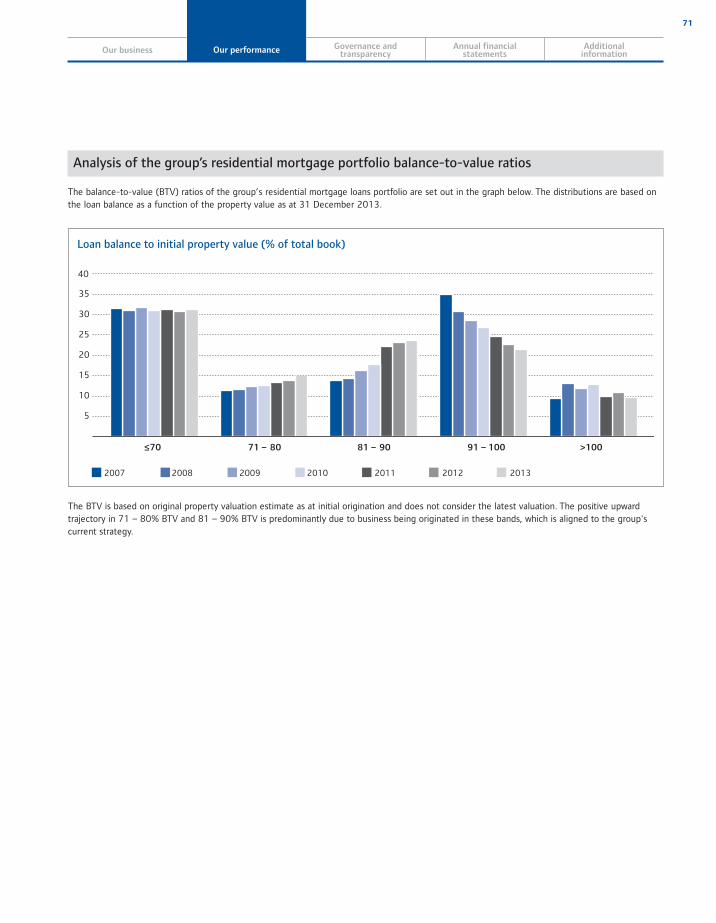
Our business Our performance Governance andtransparency
Annual financialstatements
Additionalinformation
71
Analysis of the group’s residential mortgage portfolio balance�to�value ratios
The balance-to-value (BTV) ratios of the group’s residential mortgage loans portfolio are set out in the graph below. The distributions are based on the loan balance as a function of the property value as at 31 December 2013.
2007 2008 2009 2010 2011 2012 2013
Loan balance to initial property value (% of total book)
5
10
15
20
25
30
35
40
≤70 71 – 80 81 – 90 91 – 100 >100
The BTV is based on original property valuation estimate as at initial origination and does not consider the latest valuation. The positive upward trajectory in 71 – 80% BTV and 81 – 90% BTV is predominantly due to business being originated in these bands, which is aligned to the group's current strategy.

72 The Standard Bank of South Africa Annual report 2013
Definition
Country risk, also referred to as cross-border transfer risk, is the uncertainty that a client or counterparty, including the relevant sovereign, will be able to fulfil its obligations to the group due to political or economic conditions in the host country.
Approach to managing country risk
All countries to which the group is exposed are reviewed at least annually. For each country to which the group has exposure, internal rating models are employed to determine ratings for country, sovereign and transfer and convertibility risk. In determining the ratings, extensive use is made of the group’s network of operations, country visits and external information sources. These ratings are also a key input into the group’s credit rating models, with credit loan conditions and covenants linked to country risk events.
The model inputs are continuously updated to reflect economic and political changes in countries. The model outputs are internal risk grades that are calibrated to a country risk grade (CR) from CR01 to CR25, or sovereign risk grade, transfer and convertibility (SB) rating scale from or SB01 to SB25. Countries rated CR08 and higher, referred to as medium- and high-risk countries, are subject to increased analysis and monitoring.
Country risk is mitigated through a number of methods, including:
political and commercial risk insurance
co-financing with multilateral institutions
structures to mitigate transferability and convertibility risk such as collection, collateral and margining deposits outside the jurisdiction in question.
Governance committees
The primary governance committee overseeing this risk type is the group country risk management committee. It is chaired by the group CRO and is a subcommittee of GROC.
Approved regulatory capital approaches
There are no regulatory capital requirements for country risk. Country risk is, however, incorporated into regulatory capital for credit in the IRB approaches through the country risk rating’s impact on credit grades.
Country risk portfolio characteristics and metrics
The risk distribution of cross-border country risk exposures is weighted towards European and North American low-risk countries, as well as sub-Saharan African medium- and high-risk countries. Exposure to troubled Eurozone peripheral countries is limited and closely managed by the country risk function.
Definition 72
Approach to managing country risk 72
Governance committees 72
Approved regulatory capital approaches 72
Country risk portfolio characteristics and metrics 72
Country risk
Our performance Risk and capital management report continued
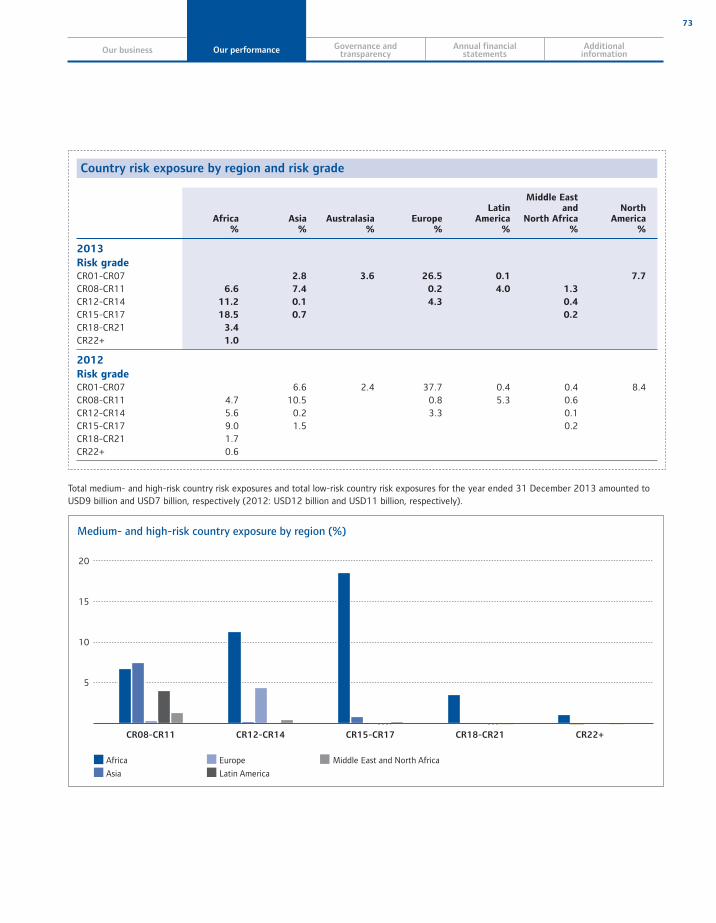
Our business Our performance Governance andtransparency
Annual financialstatements
Additionalinformation
73
Country risk exposure by region and risk grade
Africa%
Asia%
Australasia%
Europe%
LatinAmerica
%
Middle East and
North Africa%
North America
%
2013
Risk gradeCR01-CR07 2.8 3.6 26.5 0.1 7.7
CR08-CR11 6.6 7.4 0.2 4.0 1.3
CR12-CR14 11.2 0.1 4.3 0.4
CR15-CR17 18.5 0.7 0.2
CR18-CR21 3.4
CR22+ 1.0
2012
Risk gradeCR01-CR07 6.6 2.4 37.7 0.4 0.4 8.4 CR08-CR11 4.7 10.5 0.8 5.3 0.6 CR12-CR14 5.6 0.2 3.3 0.1 CR15-CR17 9.0 1.5 0.2 CR18-CR21 1.7 CR22+ 0.6
Total medium- and high-risk country risk exposures and total low-risk country risk exposures for the year ended 31 December 2013 amounted to USD9 billion and USD7 billion, respectively (2012: USD12 billion and USD11 billion, respectively).
Africa Europe Middle East and North Africa
Asia Latin America
Medium� and high�risk country exposure by region (%)
20
15
10
5
CR22+CR18-CR21CR15-CR17CR12-CR14CR08-CR11
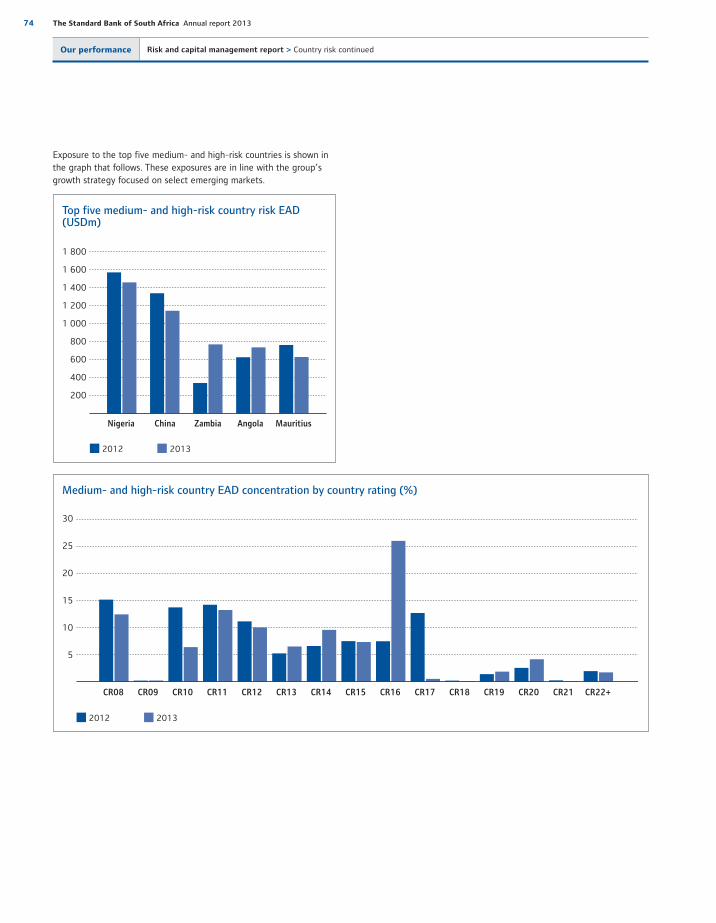
74 The Standard Bank of South Africa Annual report 2013
Exposure to the top five medium- and high-risk countries is shown in the graph that follows. These exposures are in line with the group’s growth strategy focused on select emerging markets.
2012 2013
Top five medium� and high�risk country risk EAD (USDm)
1 800
1 600
1 400
1 200
1 000
800
600
400
200
Nigeria China Zambia Angola Mauritius
2012 2013
Medium� and high�risk country EAD concentration by country rating (%)
30
25
20
15
10
5
CR08 CR22+CR09 CR10 CR11 CR12 CR13 CR14 CR15 CR16 CR17 CR18 CR19 CR20 CR21
Our performance Risk and capital management report > Country risk continued
Our business Our performance Governance andtransparency
Annual financialstatements
Additionalinformation
75
Definition
Liquidity risk is the risk that the groupcannot maintain or generate sufficientcash resources to meet its paymentobligations as they fall due.
Information relating to the year ended 31 December 2013 period is based on Basel III principles, including phasing-in requirements where applicable. In preparation for the implementation of Basel III, liquidity policies and calculations were reviewed and updated. The comparative financial information was subsequently restated.
Approach to managing liquidity risk
The nature of banking and trading gives rise to continuous exposure to liquidity risk. Liquidity risk arises when the group, despite being solvent, cannot maintain or generate sufficient cash resources tomeet its payment obligations as they fall due, or can only do so at materially disadvantageous terms. This type of event may arise where counterparties, who provide the group with short-term funding, withdraw or do not roll over that funding, or normally liquid assets become illiquid as a result of a generalised disruption in asset markets.
The group manages liquidity in accordance with applicable regulations and within the group’s risk appetite. The group’s liquidity risk management governance framework supports the measurement and management of liquidity across both the corporate and retail sectors to ensure that payment obligations can be met by the group’s legal entities, under both normal and stressed conditions. Liquidity risk management ensures that the group has the appropriate amount, diversification and tenor of funding and liquidity to support its asset base at all times.
The group’s liquidity risk management framework differentiates between:
Tactical (shorter-term) risk management: managing intraday liquidity positions and daily cash flow requirements, and monitoring adherence to prudential and internal requirements and setting deposit rates as informed by ALCO.
Structural (long-term) liquidity risk management: ensuring a structurally sound balance sheet, a diversified funding base and prudent term funding requirements.
Contingent liquidity risk management: monitoring and managing early warning liquidity indicators while establishing and maintaining contingency funding plans, undertaking regular liquidity stress testing and scenario analysis, and setting liquidity buffers in accordance with anticipated stress events.
Governance committees
The primary governance committee overseeing this risk is theSBSA ALCO. It is chaired by the group chief executive and is a subcommittee of SBG ALCO.
Approved regulatory capital approaches
There are no regulatory capital requirements for liquidity risk.
Definition 75
Approach to managing liquidity risk 75
Governance committees 75
Approved regulatory capital approaches 75
Liquidity characteristics and metrics 76
Structural liquidity mismatch 76
Contingency liquidity risk management 78
The group’s credit ratings 79
Conduits 79
Basel III liquidity requirements 80
Liquidity risk

76 The Standard Bank of South Africa Annual report 2013
Liquidity characteristics and metrics
Structural liquidity mismatch
Structural requirementsWith actual cash flows typically varying significantly from the contractual position, behavioural profiling is applied to assets, liabilities and off-balance sheet commitments with an indeterminable maturity or drawdown period, as well as to certain liquid assets. Behavioural profiling assigns probable maturities based on historical customer behaviour. This is used to identify significant additional sources of structural liquidity in the form of core deposits, such as current and savings accounts, which exhibit stable behaviour despite being repayable on demand or at short notice.
Structural liquidity mismatch analyses are performed regularly to anticipate the mismatch between payment profiles of balance sheet items, in order to highlight potential risks within the group’s defined liquidity risk thresholds.
The graph below indicates the group’s cumulative maturity mismatch between assets and liabilities for the 0 to 12 months bucket, after applying behavioural profiling. The cumulative maturity mismatch is expressed as a percentage of the group's total funding- related liabilities.
Expected aggregate cash outflows are subtracted from expected aggregate cash inflows. Limits are set internally to restrict the cumulative liquidity mismatch between expected inflows and outflows of funds in different time buckets. These mismatches are monitored on a regular basis with active management intervention if potential limit breaches are evidenced. The behaviourally adjusted cumulative liquidity mismatch remains within the group’s liquidity risk appetite.
2012 2013 Internal limit
Behaviourally adjusted cumulativeliquidity mismatch1,2 (%)
5
0
(5)
(10)
(15)
(20)
(25)0 – 7days
0 – 1month
0 – 3months
0 – 6months
0 – 12months
1 December 2012 numbers have been restated in accordance with SBSA’s updated profiling policy, effective 1 January 2013. Refer to page 93.
2 Positive (negative) represents net inflows (net outflows).
Maturity analysis of financial liabilities by
contractual maturityThe table that follows analyses cash flows on a contractual, undiscounted basis based on the earliest date on which the groupcan be required to pay (except for trading liabilities and derivative liabilities) and will, therefore, not agree directly to the balances disclosed in the consolidated statement of financial position.
Derivative liabilities are included in the maturity analysis on a contractual, undiscounted basis when contractual maturities are essential for an understanding of the derivatives’ future cash flows. Management considers contractual maturities to be essential for understanding the future cash flows of derivative liabilities that are designated as hedging instruments in effective hedge accounting relationships. All other derivative liabilities together with trading liabilities are treated as trading and are included at fair value in the redeemable on demand bucket since these positions are typically held for short periods of time.
The table also includes contractual cash flows with respect to off-balance sheet items which have not yet been recorded on-balance sheet. Where cash flows are exchanged simultaneously, the net amounts have been reflected.
A
Our performance Risk and capital management report > Liquidity risk continued

Our business Our performance Governance andtransparency
Annual financialstatements
Additionalinformation
77
Maturity analysis of financial liabilities by contractual maturity
Redeemable on demand
Rm
Maturing within 1
monthRm
Maturing between
1 – 6 months
Rm
Maturing between
6 – 12 months
Rm
Maturing after
12 monthsRm
TotalRm
2013
Financial liabilitiesDerivative financial instruments 65 813 301 (5) 91 56 66 256
Instruments settled on a net basis 45 728 301 87 62 46 178
Instruments settled on a gross basis 20 085 (5) 4 (6) 20 078
Trading liabilities 20 424 20 424
Deposits from customers and banks 422 174 56 226 110 273 37 407 121 072 747 152
Subordinated debt 2 483 18 458 20 941
Other 9 843 9 843
Total 508 411 66 370 112 751 37 498 139 586 864 616
Off-balance sheet liabilitiesLetters of credit 9 082 9 082
Guarantees 39 852 39 852
Irrevocable unutilised facilities 72 964 72 964
Commodities and securities borrowing transactions 5 635 5 635
Total 127 533 127 533
2012
Financial liabilitiesDerivative financial instruments 81 743 12 14 63 81 832
Instruments settled on a net basis 64 783 15 16 69 64 883 Instruments settled on a gross basis 16 960 (3) (2) (6) 16 949
Trading liabilities1 21 221 21 221 Deposits from customers and banks1 357 240 59 146 122 680 53 012 147 884 739 962 Subordinated debt 3 578 322 21 452 25 352 Other 13 552 13 552
Total 460 204 72 698 126 270 53 348 169 399 881 919
Off-balance sheet liabilitiesLetters of credit 7 843 7 843 Guarantees 37 347 37 347 Irrevocable unutilised facilities1 79 110 79 110 Commodities and securities borrowing transactions 5 849 5 849
Total 130 149 130 149
1 Restated, refer to page 93.
Refer to the annual financial statements for maturities of assets.
A
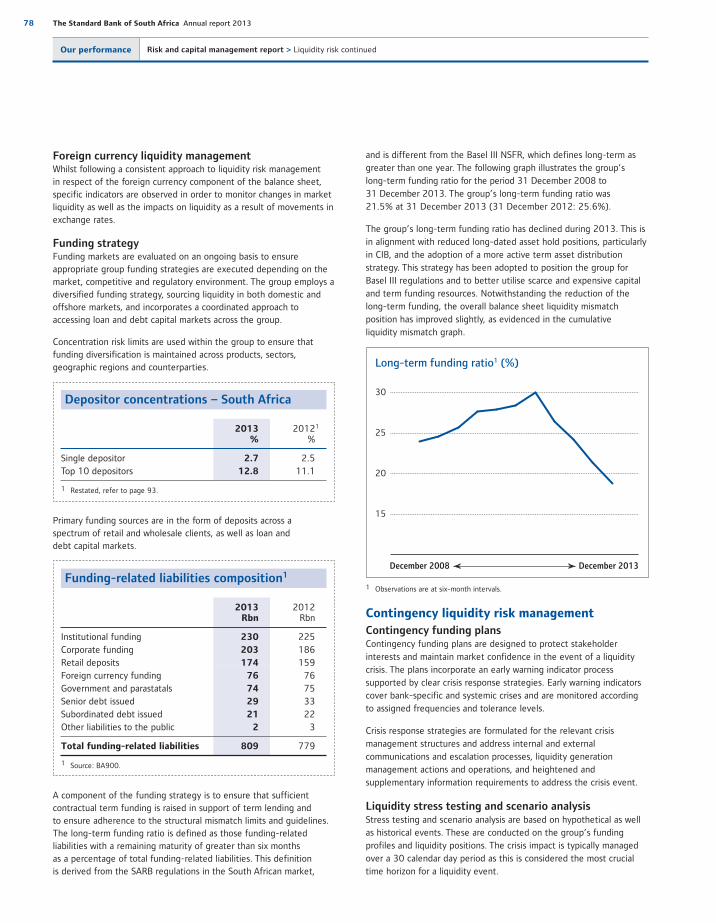
78 The Standard Bank of South Africa Annual report 2013
Foreign currency liquidity managementWhilst following a consistent approach to liquidity risk management in respect of the foreign currency component of the balance sheet, specific indicators are observed in order to monitor changes in market liquidity as well as the impacts on liquidity as a result of movements in exchange rates.
Funding strategyFunding markets are evaluated on an ongoing basis to ensure appropriate group funding strategies are executed depending on the market, competitive and regulatory environment. The group employs a diversified funding strategy, sourcing liquidity in both domestic and offshore markets, and incorporates a coordinated approach to accessing loan and debt capital markets across the group.
Concentration risk limits are used within the group to ensure that funding diversification is maintained across products, sectors, geographic regions and counterparties.
Depositor concentrations – South Africa
2013%
20121
%
Single depositor 2.7 2.5 Top 10 depositors 12.8 11.1
1 Restated, refer to page 93.
Primary funding sources are in the form of deposits across a spectrum of retail and wholesale clients, as well as loan and debt capital markets.
Funding-related liabilities composition1
2013Rbn
2012Rbn
Institutional funding 230 225 Corporate funding 203 186 Retail deposits 174 159Foreign currency funding 76 76 Government and parastatals 74 75Senior debt issued 29 33Subordinated debt issued 21 22Other liabilities to the public 2 3
Total funding-related liabilities 809 779
1 Source: BA900.
A component of the funding strategy is to ensure that sufficient contractual term funding is raised in support of term lending and to ensure adherence to the structural mismatch limits and guidelines. The long-term funding ratio is defined as those funding-related liabilities with a remaining maturity of greater than six months as a percentage of total funding-related liabilities. This definition is derived from the SARB regulations in the South African market,
and is different from the Basel III NSFR, which defines long-term as greater than one year. The following graph illustrates the group’s long-term funding ratio for the period 31 December 2008 to31 December 2013. The group’s long-term funding ratio was21.5% at 31 December 2013 (31 December 2012: 25.6%).
The group’s long-term funding ratio has declined during 2013. This is in alignment with reduced long-dated asset hold positions, particularly in CIB, and the adoption of a more active term asset distribution strategy. This strategy has been adopted to position the group for Basel III regulations and to better utilise scarce and expensive capital and term funding resources. Notwithstanding the reduction of the long-term funding, the overall balance sheet liquidity mismatch position has improved slightly, as evidenced in the cumulative liquidity mismatch graph.
Long�term funding ratio1 (%)
30
25
20
15
December 2008 December 2013
1 Observations are at six-month intervals.
Contingency liquidity risk management
Contingency funding plansContingency funding plans are designed to protect stakeholder interests and maintain market confidence in the event of a liquidity crisis. The plans incorporate an early warning indicator process supported by clear crisis response strategies. Early warning indicators cover bank-specific and systemic crises and are monitored according to assigned frequencies and tolerance levels.
Crisis response strategies are formulated for the relevant crisis management structures and address internal and external communications and escalation processes, liquidity generation management actions and operations, and heightened and supplementary information requirements to address the crisis event.
Liquidity stress testing and scenario analysis Stress testing and scenario analysis are based on hypothetical as well as historical events. These are conducted on the group’s funding profiles and liquidity positions. The crisis impact is typically managed over a 30 calendar day period as this is considered the most crucial time horizon for a liquidity event.
Our performance Risk and capital management report > Liquidity risk continued

Our business Our performance Governance andtransparency
Annual financialstatements
Additionalinformation
79
Anticipated on- and off-balance sheet cash flows are subjected to a variety of bank-specific and systemic stresses and scenarios to evaluate the impact of unlikely but plausible events on liquidity positions. The results are assessed against the liquidity buffer and contingency funding plans to provide assurance as to the group’s ability to maintain sufficient liquidity under adverse conditions.
Liquidity bufferPortfolios of highly marketable liquid securities over and above prudential and regulatory requirements are maintained as protection against unforeseen disruptions in cash flows. These portfolios are managed within ALCO-defined limits on the basis of diversificationand liquidity.
The table below provides a breakdown of the group’s liquidand marketable securities as at 31 December 2013 and 31 December 2012.
Total liquidity
2013Rbn
20121
Rbn
Contingent liquidity2 108,7 86,9Prudential and/or regulatory requirements3 42,8 42,5
Total liquidity 151,5 129,4
Contingent liquidity as a %
of funding-related liabilities 13% 11%
1 Restated, refer to page 93.2 Includes other readily accessible liquidity.3 Includes notes and coins qualifying as liquid assets.
Liquid assets held remain adequate to meet all internal stress testing, prudential and regulatory requirements.
The group’s credit ratings
The group’s ability to access funding at cost-effective levels is dependent on maintaining or improving the borrowing entity’scredit rating.
The detailed table representing the major credit
ratings for SBSA can be found on SBG’s website,
www.standardbank.com/reporting and page 280
of this report.
The following table provides a summary of the major credit ratings for SBSA.
Credit ratings
Fitch
Long termForeign currency issuer default rating BBB
RSA sovereign ratings: foreign currency BBB
Moody’s
Foreign currency deposit rating Baa1
RSA sovereign ratings: foreign currency A3
Credit ratings for the group are dependent on multiple factors, including the sovereign rating, capital adequacy levels, quality of earnings, credit exposure, the credit risk governance framework and funding diversification. These parameters and their possible impact on the borrowing entity’s credit rating are monitored closely and incorporated into the group’s liquidity risk management and contingency planning considerations.
A reduction in these ratings could have an adverse effect on the group’s access to liquidity sources and funding costs, may trigger collateral calls or lead to the activation of downgrade clauses and early termination associated with certain structured deposits.
Rating downgrades will reduce thresholds above which collateralmust be posted with counterparties to cover the group’s negative mark-to-market on derivative contracts.
Conduits
The group provides standby liquidity facilities to two conduits,namely Blue Titanium Conduit and Thekwini Warehouse Conduit. These facilities, which totalled R6,8 billion as at 31 December 2013 (2012: R7,6 billion), have not been drawn on.
The liquidity risk associated with these facilities is managed in accordance with the group’s overall liquidity position and represents less than 2% of SBSA’s total funding (2012: 2%). The liquidity facilities are included in both the group’s structural liquidity mismatch as well as in liquidity risk stress testing.
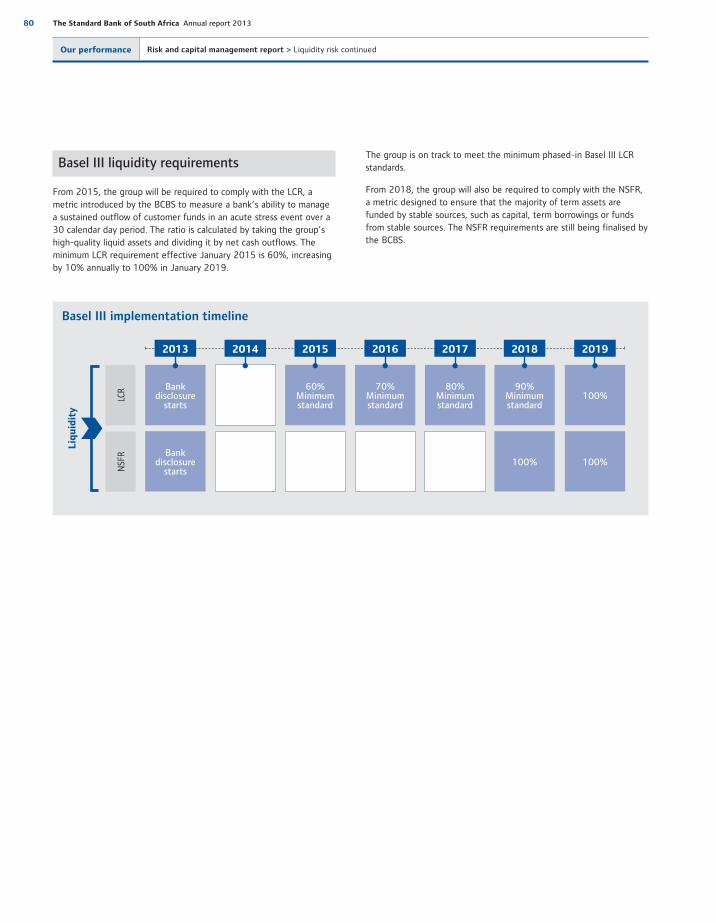
80 The Standard Bank of South Africa Annual report 2013
Basel III liquidity requirements
From 2015, the group will be required to comply with the LCR, a metric introduced by the BCBS to measure a bank’s ability to manage a sustained outflow of customer funds in an acute stress event over a 30 calendar day period. The ratio is calculated by taking the group’s high-quality liquid assets and dividing it by net cash outflows. The minimum LCR requirement effective January 2015 is 60%, increasing by 10% annually to 100% in January 2019.
The group is on track to meet the minimum phased-in Basel III LCR standards.
From 2018, the group will also be required to comply with the NSFR, a metric designed to ensure that the majority of term assets are funded by stable sources, such as capital, term borrowings or funds from stable sources. The NSFR requirements are still being finalised by the BCBS.
Basel III implementation timeline
NSF
RLC
R
Liq
uid
ity
100%
100%
60%Minimum standard
70%Minimum standard
80%Minimum standard
90%Minimum standard
100%
Bank disclosure
starts
Bank disclosure
starts
2013 2014 2015 2016 2017 2018 2019
Our performance Risk and capital management report > Liquidity risk continued
Our business Our performance Governance andtransparency
Annual financialstatements
Additionalinformation
81
Definition
Market risk is the risk of a change in the market value, actual or effective earnings, or future cashflows of a portfolio of financial instruments, including commodities, caused by adverse movements in market variables such as equity, bond and commodity prices, currency exchange and interest rates, credit spreads, recovery rates, correlations and implied volatilities in all of these variables.
The group’s key market risks are:
trading book market risk
IRRBB
equity risk in the banking book
foreign currency risk.
Governance committees
The governance committees overseeing market risk are group ALCO, which is chaired by the SBG chief financial officer, and the group equity risk committee, which is chaired by the CIB CRO. Both are subcommittees of GROC.
Approved regulatory capital approaches
The group has approval from the SARB to adopt the internal models approach for most asset classes and across most market variables.
The group has approval from the SARB to adopt the market-based approach for certain equity portfolios.
There are no regulatory capital requirements for IRRBB or on structural foreign exchange exposures. However, the translation effect on the group’s structural foreign exchange exposure may give rise to capital impairments.
Definition 81
Governance committees 81
Approved regulatory capital approaches 81
Trading book market risk 82
Description and context 82
Approach to managing market risk in the trading book 82
Measurement 82
Trading book portfolio characteristics 83
Interest rate risk in the banking book 84
Description and context 84
Approach to managing IRRBB 85
Measurement 85
Banking book interest rate exposure characteristics 85
Equity risk in the banking book 86
Description and context 86
Approach to managing equity risk in the banking book 86
Equity banking book price risk sensitivity analysis 86
Foreign currency risk 86
Definition 86
Approach to managing foreign currency risk 86
Foreign currency risk sensitivity analysis 86
Market risk
82 The Standard Bank of South Africa Annual report 2013
Trading book market risk
Description and contextTrading book market risk is represented by financial instruments held on the trading book arising out of the group’s normal global markets’ trading activities.
Approach to managing market risk in the
trading book The group’s policy is that all trading activities are undertaken within the group’s trading operations.
The market risk functions are independent of trading operations and accountable to group ALCO.
All VaR and stressed VaR (SVaR) limits require prior approval from group ALCO. The market risk functions have the authority to set limits at a lower level.
Market risk teams are responsible for identifying, measuring, managing, monitoring and reporting market risk as outlined in the market risk governance standard.
Exposures and excesses are monitored and reported daily. Where breaches in limits and triggers occur, actions are taken by market risk functions to move exposures back in line with approved market risk appetite, with such breaches being reported to management and group ALCO.
MeasurementThe techniques used to measure and control trading book market risk and trading volatility include VaR and SVaR, stop-loss triggers, stress tests, backtesting and specific business unit and product controls.
VaR and SVaRThe group uses the historical VaR and SVaR approach to quantify market risk under normal conditions and under stressed conditions.
For risk management VaR is based on 251 days of unweighted recent historical data, a holding period of one day and a confidence level of 95%. The historical VaR results are calculated in four steps:
Calculate 250 daily market price movements based on 251 days’ historical data.
Calculate hypothetical daily profit or loss for each day using these daily market price movements.
Aggregate all hypothetical profits or losses for day one across all positions, giving daily hypothetical profit or loss, and then repeat for all other days.
VaR is the 95th percentile selected from the 250 days of daily hypothetical total profit or loss.
Daily losses exceeding the VaR are likely to occur, on average, 13 times in every 250 days.
SVaR uses a similar methodology to VaR, but is based on a periodof financial stress and assumes a 10 day holding period and 99% confidence interval.
Where the group has received internal model approval, the market risk regulatory capital requirement is based on VaR and SVaR, both of which use a confidence level of 99% and a 10-day holding period.
Limitations of historical VaR are acknowledged globally and include:
The use of historical data as a proxy for estimating future events may not encompass all potential events, particularly those which are extreme in nature.
The use of a one-day holding period assumes that all positions can be liquidated or the risk offset in one day. This may not fully reflect the market risk arising at times of severe illiquidity, when a one-day holding period may be insufficient to liquidate or hedge all positions fully.
The use of a 95% confidence level, by definition, does not take into account losses that might occur beyond this level of confidence.
VaR is calculated on the basis of exposures outstanding at the close of business and, therefore, does not necessarily reflect intraday exposures.
VaR is unlikely to reflect loss potential on exposures that only arise under significant market moves.
Stop-loss triggersStop-loss triggers are used to protect the profitability of the trading desks and are monitored by market risk on a daily basis. The triggers constrain cumulative or daily trading losses through acting as a prompt to a review or close-out positions.
Stress testsStress testing provides an indication of the potential losses that could occur under extreme but plausible market conditions, including where longer holding periods may be required to exit positions. Stress tests comprise individual market risk factor testing, combinations of market factors per trading desk and combinations of trading desks using a range of historical, hypothetical and Monte Carlo simulations. Daily losses experienced during the year ended 31 December 2013 did not exceed the maximum tolerable losses as represented by the group’s stress scenario limits.
BacktestingThe group backtests its VaR models to verify the predictive ability of the VaR calculations and ensure the appropriateness of the models within the inherent limitations of VaR. Backtesting compares the daily hypothetical profit and losses under the one-day buy and hold assumption to the prior day’s calculated VaR.
Refer to the graph on the next page for the results of the group’s backtesting during 2013. The increased volatility of VaR in June reflects market volatility following the announcement by the US Federal Reserve of an earlier than expected end to the fiscal stimulus.
Regulators categorise a VaR model as green, amber or red and assign regulatory capital multipliers based on this categorisation. A green model is consistent with a satisfactory VaR model and is achieved for models that have four or less backtesting exceptions in a 12-month period. All the group’s approved models were assigned green status for the year ended 31 December 2013 (31 December 2012: green).
A
A
Our performance Risk and capital management report > Market risk continued
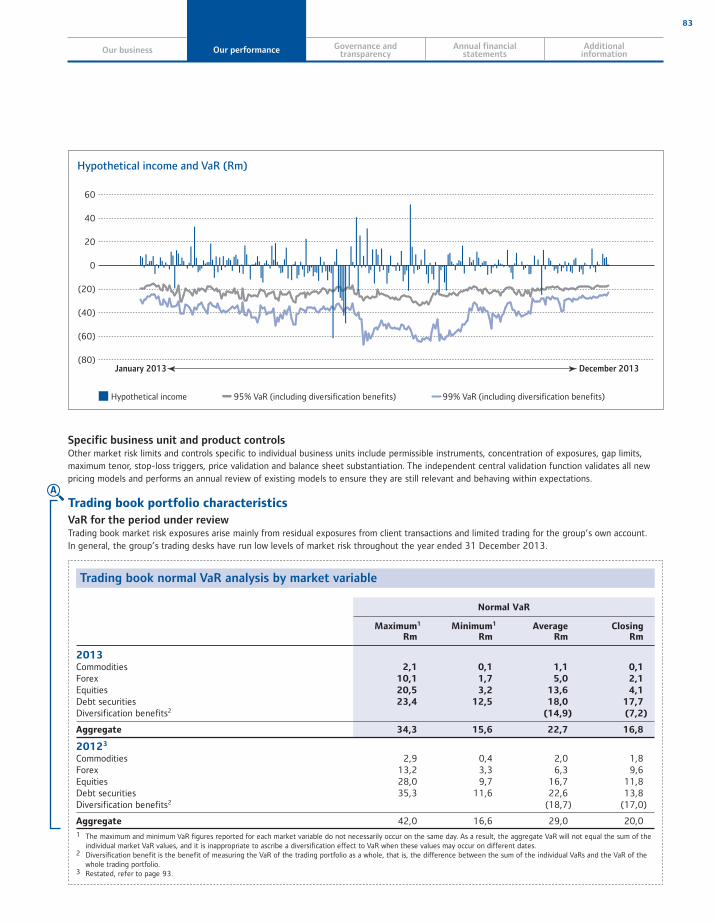
Our business Our performance Governance andtransparency
Annual financialstatements
Additionalinformation
83
Hypothetical income 95% VaR (including diversification benefits) 99% VaR (including diversification benefits)
Hypothetical income and VaR (Rm)
60
40
20
0
(20)
(40)
(60)
(80)January 2013 December 2013
Specific business unit and product controlsOther market risk limits and controls specific to individual business units include permissible instruments, concentration of exposures, gap limits, maximum tenor, stop-loss triggers, price validation and balance sheet substantiation. The independent central validation function validates all new pricing models and performs an annual review of existing models to ensure they are still relevant and behaving within expectations.
Trading book portfolio characteristics
VaR for the period under reviewTrading book market risk exposures arise mainly from residual exposures from client transactions and limited trading for the group’s own account. In general, the group’s trading desks have run low levels of market risk throughout the year ended 31 December 2013.
Trading book normal VaR analysis by market variable
Normal VaR
Maximum1
RmMinimum1
RmAverage
RmClosing
Rm
2013Commodities 2,1 0,1 1,1 0,1 Forex 10,1 1,7 5,0 2,1 Equities 20,5 3,2 13,6 4,1 Debt securities 23,4 12,5 18,0 17,7 Diversification benefits2 (14,9) (7,2)
Aggregate 34,3 15,6 22,7 16,8
20123 Commodities 2,9 0,4 2,0 1,8 Forex 13,2 3,3 6,3 9,6 Equities 28,0 9,7 16,7 11,8 Debt securities 35,3 11,6 22,6 13,8 Diversification benefits2 (18,7) (17,0)
Aggregate 42,0 16,6 29,0 20,0 1 The maximum and minimum VaR figures reported for each market variable do not necessarily occur on the same day. As a result, the aggregate VaR will not equal the sum of the
individual market VaR values, and it is inappropriate to ascribe a diversification effect to VaR when these values may occur on different dates.2 Diversification benefit is the benefit of measuring the VaR of the trading portfolio as a whole, that is, the difference between the sum of the individual VaRs and the VaR of the
whole trading portfolio.3 Restated, refer to page 93.
A
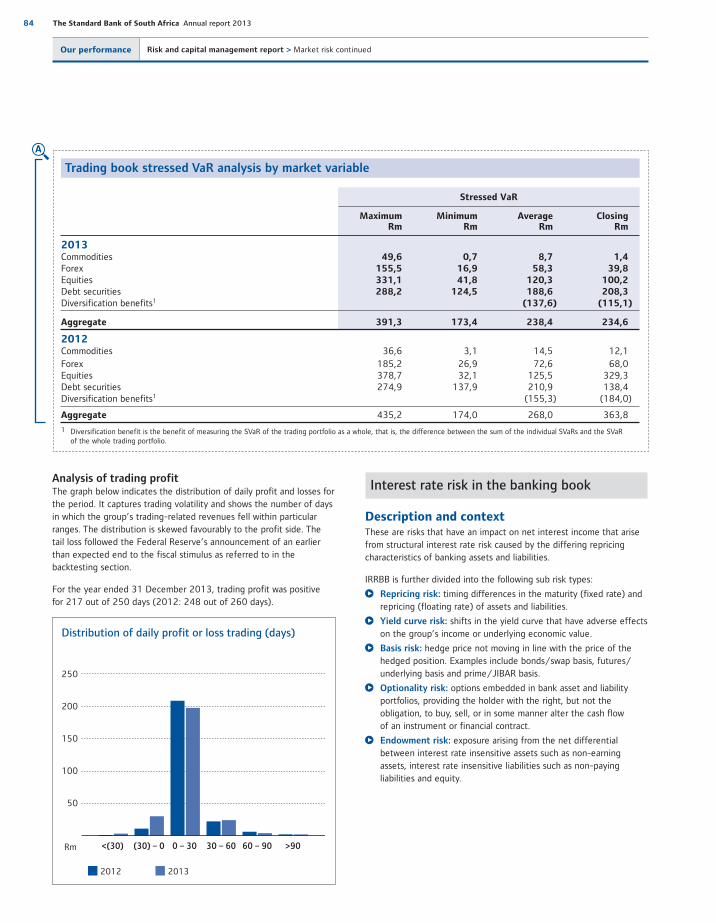
84 The Standard Bank of South Africa Annual report 2013
Analysis of trading profitThe graph below indicates the distribution of daily profit and losses for the period. It captures trading volatility and shows the number of days in which the group’s trading-related revenues fell within particular ranges. The distribution is skewed favourably to the profit side. The tail loss followed the Federal Reserve’s announcement of an earlier than expected end to the fiscal stimulus as referred to in the backtesting section.
For the year ended 31 December 2013, trading profit was positive for 217 out of 250 days (2012: 248 out of 260 days).
2012 2013
Distribution of daily profit or loss trading (days)
250
200
150
100
50
<(30) (30) – 0 0 – 30 30 – 60 60 – 90 >90Rm
Interest rate risk in the banking book
Description and contextThese are risks that have an impact on net interest income that arise from structural interest rate risk caused by the differing repricing characteristics of banking assets and liabilities.
IRRBB is further divided into the following sub risk types:
Repricing risk: timing differences in the maturity (fixed rate) and repricing (floating rate) of assets and liabilities.
Yield curve risk: shifts in the yield curve that have adverse effects on the group’s income or underlying economic value.
Basis risk: hedge price not moving in line with the price of the hedged position. Examples include bonds/swap basis, futures/underlying basis and prime/JIBAR basis.
Optionality risk: options embedded in bank asset and liability portfolios, providing the holder with the right, but not the obligation, to buy, sell, or in some manner alter the cash flow of an instrument or financial contract.
Endowment risk: exposure arising from the net differential between interest rate insensitive assets such as non-earning assets, interest rate insensitive liabilities such as non-paying liabilities and equity.
Trading book stressed VaR analysis by market variable
Stressed VaR
MaximumRm
MinimumRm
AverageRm
ClosingRm
2013 Commodities 49,6 0,7 8,7 1,4 Forex 155,5 16,9 58,3 39,8 Equities 331,1 41,8 120,3 100,2Debt securities 288,2 124,5 188,6 208,3 Diversification benefits1 (137,6) (115,1)
Aggregate 391,3 173,4 238,4 234,6
2012 Commodities 36,6 3,1 14,5 12,1 Forex 185,2 26,9 72,6 68,0 Equities 378,7 32,1 125,5 329,3 Debt securities 274,9 137,9 210,9 138,4 Diversification benefits1 (155,3) (184,0)
Aggregate 435,2 174,0 268,0 363,8
1 Diversification benefit is the benefit of measuring the SVaR of the trading portfolio as a whole, that is, the difference between the sum of the individual SVaRs and the SVaRof the whole trading portfolio.
A
Our performance Risk and capital management report > Market risk continued
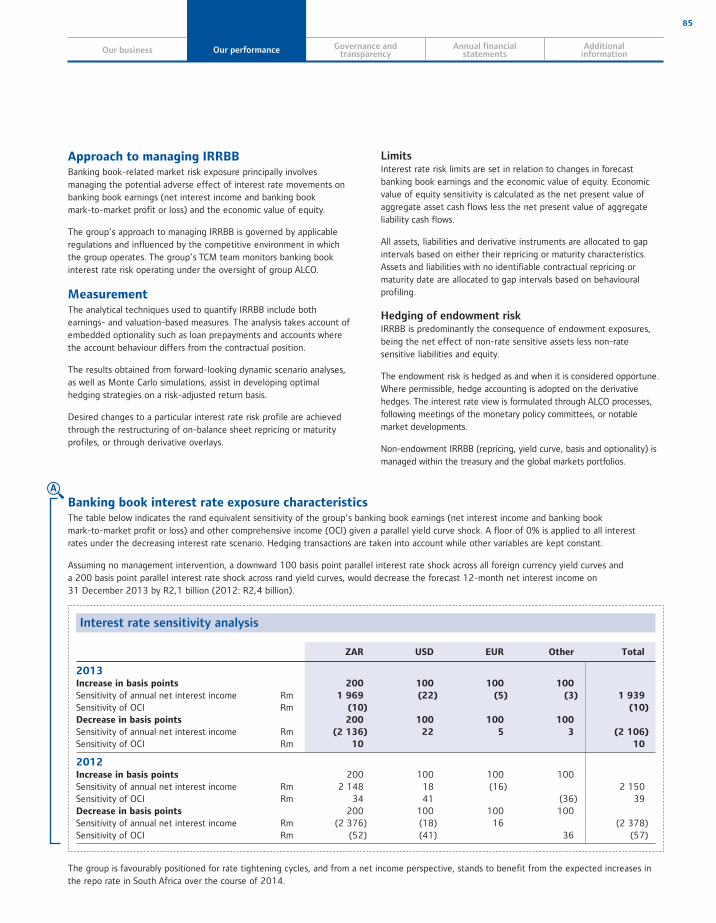
Our business Our performance Governance andtransparency
Annual financialstatements
Additionalinformation
85
Approach to managing IRRBBBanking book-related market risk exposure principally involves managing the potential adverse effect of interest rate movements on banking book earnings (net interest income and banking book mark-to-market profit or loss) and the economic value of equity.
The group’s approach to managing IRRBB is governed by applicable regulations and influenced by the competitive environment in which the group operates. The group’s TCM team monitors banking book interest rate risk operating under the oversight of group ALCO.
MeasurementThe analytical techniques used to quantify IRRBB include both earnings- and valuation-based measures. The analysis takes account of embedded optionality such as loan prepayments and accounts where the account behaviour differs from the contractual position.
The results obtained from forward-looking dynamic scenario analyses, as well as Monte Carlo simulations, assist in developing optimal hedging strategies on a risk-adjusted return basis.
Desired changes to a particular interest rate risk profile are achieved through the restructuring of on-balance sheet repricing or maturity profiles, or through derivative overlays.
LimitsInterest rate risk limits are set in relation to changes in forecast banking book earnings and the economic value of equity. Economic value of equity sensitivity is calculated as the net present value of aggregate asset cash flows less the net present value of aggregate liability cash flows.
All assets, liabilities and derivative instruments are allocated to gap intervals based on either their repricing or maturity characteristics. Assets and liabilities with no identifiable contractual repricing or maturity date are allocated to gap intervals based on behavioural profiling.
Hedging of endowment riskIRRBB is predominantly the consequence of endowment exposures, being the net effect of non-rate sensitive assets less non-rate sensitive liabilities and equity.
The endowment risk is hedged as and when it is considered opportune. Where permissible, hedge accounting is adopted on the derivative hedges. The interest rate view is formulated through ALCO processes, following meetings of the monetary policy committees, or notable market developments.
Non-endowment IRRBB (repricing, yield curve, basis and optionality) is managed within the treasury and the global markets portfolios.
Banking book interest rate exposure characteristicsThe table below indicates the rand equivalent sensitivity of the group’s banking book earnings (net interest income and banking book mark-to-market profit or loss) and other comprehensive income (OCI) given a parallel yield curve shock. A floor of 0% is applied to all interest rates under the decreasing interest rate scenario. Hedging transactions are taken into account while other variables are kept constant.
Assuming no management intervention, a downward 100 basis point parallel interest rate shock across all foreign currency yield curves and a 200 basis point parallel interest rate shock across rand yield curves, would decrease the forecast 12-month net interest income on 31 December 2013 by R2,1 billion (2012: R2,4 billion).
Interest rate sensitivity analysis
ZAR USD EUR Other Total
2013Increase in basis points 200 100 100 100
Sensitivity of annual net interest income Rm 1 969 (22) (5) (3) 1 939
Sensitivity of OCI Rm (10) (10)
Decrease in basis points 200 100 100 100
Sensitivity of annual net interest income Rm (2 136) 22 5 3 (2 106)
Sensitivity of OCI Rm 10 10
2012Increase in basis points 200 100 100 100 Sensitivity of annual net interest income Rm 2 148 18 (16) 2 150 Sensitivity of OCI Rm 34 41 (36) 39 Decrease in basis points 200 100 100 100 Sensitivity of annual net interest income Rm (2 376) (18) 16 (2 378)Sensitivity of OCI Rm (52) (41) 36 (57)
The group is favourably positioned for rate tightening cycles, and from a net income perspective, stands to benefit from the expected increases in the repo rate in South Africa over the course of 2014.
A
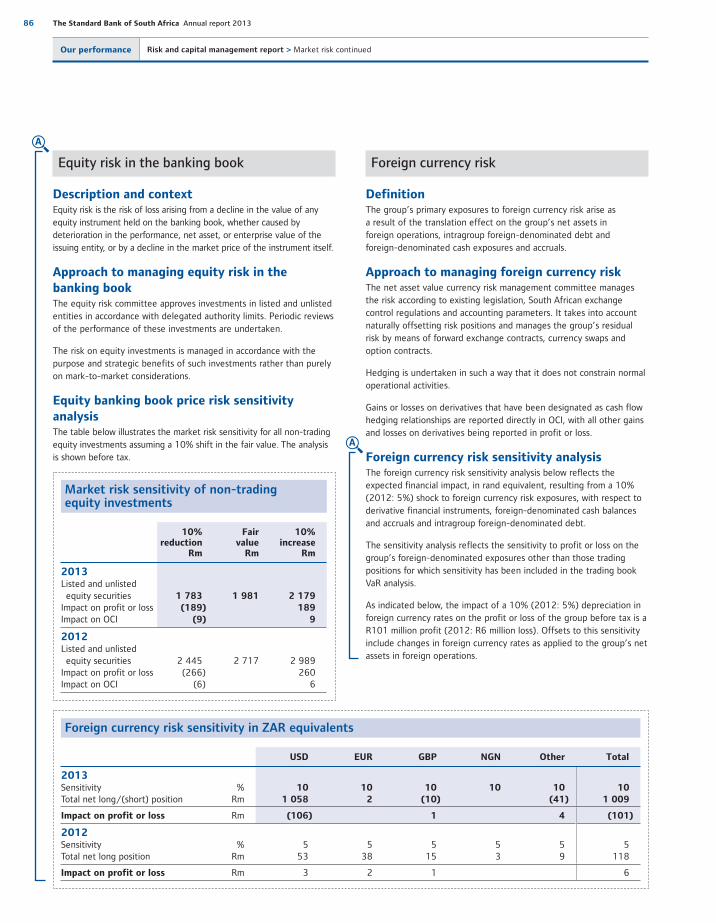
86 The Standard Bank of South Africa Annual report 2013
Equity risk in the banking book
Description and contextEquity risk is the risk of loss arising from a decline in the value of any equity instrument held on the banking book, whether caused by deterioration in the performance, net asset, or enterprise value of the issuing entity, or by a decline in the market price of the instrument itself.
Approach to managing equity risk in the
banking bookThe equity risk committee approves investments in listed and unlisted entities in accordance with delegated authority limits. Periodic reviews of the performance of these investments are undertaken.
The risk on equity investments is managed in accordance with the purpose and strategic benefits of such investments rather than purely on mark-to-market considerations.
Equity banking book price risk sensitivity
analysisThe table below illustrates the market risk sensitivity for all non-trading equity investments assuming a 10% shift in the fair value. The analysis is shown before tax.
Market risk sensitivity of non-trading equity investments
10% reduction
Rm
Fair value
Rm
10% increase
Rm
2013 Listed and unlisted equity securities 1 783 1 981 2 179Impact on profit or loss (189) 189Impact on OCI (9) 9
2012 Listed and unlisted equity securities 2 445 2 717 2 989 Impact on profit or loss (266) 260 Impact on OCI (6) 6
Foreign currency risk
DefinitionThe group’s primary exposures to foreign currency risk arise as a result of the translation effect on the group’s net assets in foreign operations, intragroup foreign-denominated debt and foreign-denominated cash exposures and accruals.
Approach to managing foreign currency riskThe net asset value currency risk management committee manages the risk according to existing legislation, South African exchange control regulations and accounting parameters. It takes into account naturally offsetting risk positions and manages the group’s residual risk by means of forward exchange contracts, currency swaps and option contracts.
Hedging is undertaken in such a way that it does not constrain normal operational activities.
Gains or losses on derivatives that have been designated as cash flow hedging relationships are reported directly in OCI, with all other gains and losses on derivatives being reported in profit or loss.
Foreign currency risk sensitivity analysisThe foreign currency risk sensitivity analysis below reflects the expected financial impact, in rand equivalent, resulting from a 10% (2012: 5%) shock to foreign currency risk exposures, with respect to derivative financial instruments, foreign-denominated cash balances and accruals and intragroup foreign-denominated debt.
The sensitivity analysis reflects the sensitivity to profit or loss on the group’s foreign-denominated exposures other than those trading positions for which sensitivity has been included in the trading book VaR analysis.
As indicated below, the impact of a 10% (2012: 5%) depreciation in foreign currency rates on the profit or loss of the group before tax is a R101 million profit (2012: R6 million loss). Offsets to this sensitivity include changes in foreign currency rates as applied to the group’s net assets in foreign operations.
A
A
Foreign currency risk sensitivity in ZAR equivalents
USD EUR GBP NGN Other Total
2013Sensitivity % 10 10 10 10 10 10Total net long/(short) position Rm 1 058 2 (10) (41) 1 009
Impact on profit or loss Rm (106) 1 4 (101)
2012Sensitivity % 5 5 5 5 5 5 Total net long position Rm 53 38 15 3 9 118
Impact on profit or loss Rm 3 2 1 6
Our performance Risk and capital management report > Market risk continued
Our business Our performance Governance andtransparency
Annual financialstatements
Additionalinformation
87
Definition
Operational risk is the risk of loss resulting from inadequate or failed internal processes, people and systems or from external events.
Operational risk subtypes are managed and overseen by specialist functions. These subtypes include:
model risk tax risk legal risk compliance risk environmental and social risk business continuity management (BCM) technology risk management information risk management financial crime control occupational health and safety.
Approach to managing operational risk
Operational risk exists in the natural course of business activity. It is not an objective to eliminate all exposure to operational risk as this would be neither commercially viable nor possible. The group’s approach to managing operational risk is to adopt fit-for-purpose operational risk practices that assist business line management in understanding their inherent risk and reducing their risk profile while maximising their operational performance and efficiency.
The operational risk management function is independent from business line management and is part of the second line of defence. It is responsible for the development and maintenance of the operational risk governance framework, facilitating business’ adoption of the framework, oversight and reporting, as well as for challenging the risk profile. The team proactively analyses root causes, trends and emerging threats, advises on the remediation of potential control weaknesses and recommends best practice solutions.
Individual teams are dedicated to each business line and enabling functions such as finance, IT and human capital. These teams work alongside their business areas and facilitate adoption of the operational risk governance framework. As part of the second line of defence, they also monitor and challenge the business units’ and enabling functions’ management of their operational risk profile. A central function, based at a group level, provides groupwide oversight and reporting. It is also responsible for developing and maintaining the operational risk governance framework.
Insurance coverThe group buys insurance cover to mitigate operational risk. This cover is reviewed on an annual basis. The group insurance committee oversees a substantial insurance programme.
The primary insurance policies in place are the group crime, professional indemnity, and group directors’ and officers’ liability insurance policies.
The group does not include insurance as a mitigant in the calculation of regulatory capital.
Operational risk subtype: Business continuity management 89
Operational risk subtype: Technology risk management 89
Operational risk subtype: Information risk management 90
Operational risk subtype: Financial crime control 90
Operational risk subtype: Occupational health and safety 90
Physical commodities 90
Areas of special focus 90
Definition 87
Approach to managing operational risk 87
Insurance cover 87
Governance committees 88
Approved regulatory capital approach 88
Operational risk subtypes 88
Operational risk subtype: Model risk 88
Operational risk subtype: Tax risk 88
Operational risk subtype: Legal risk 88
Operational risk subtype: Compliance risk 88
Operational risk subtype: Environmental and social risk 89
Operational risk
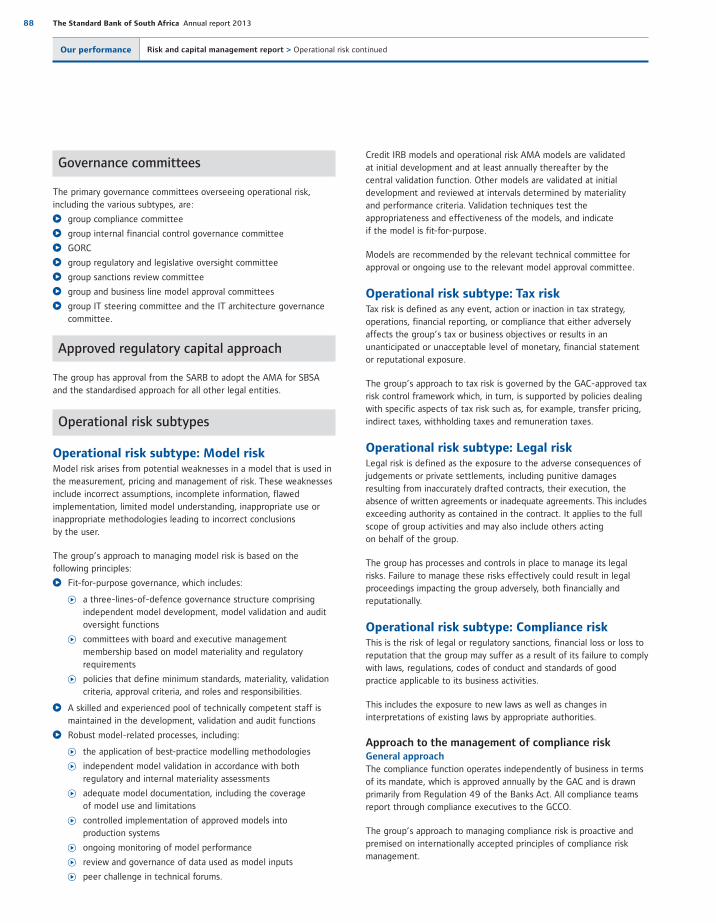
88 The Standard Bank of South Africa Annual report 2013
Governance committees
The primary governance committees overseeing operational risk, including the various subtypes, are:
group compliance committee
group internal financial control governance committee
GORC
group regulatory and legislative oversight committee
group sanctions review committee
group and business line model approval committees
group IT steering committee and the IT architecture governance committee.
Approved regulatory capital approach
The group has approval from the SARB to adopt the AMA for SBSA and the standardised approach for all other legal entities.
Operational risk subtypes
Operational risk subtype: Model riskModel risk arises from potential weaknesses in a model that is used in the measurement, pricing and management of risk. These weaknesses include incorrect assumptions, incomplete information, flawed implementation, limited model understanding, inappropriate use or inappropriate methodologies leading to incorrect conclusions by the user.
The group’s approach to managing model risk is based on the following principles:
Fit-for-purpose governance, which includes:
a three-lines-of-defence governance structure comprising independent model development, model validation and audit oversight functions
committees with board and executive management membership based on model materiality and regulatory requirements
policies that define minimum standards, materiality, validation criteria, approval criteria, and roles and responsibilities.
A skilled and experienced pool of technically competent staff is maintained in the development, validation and audit functions
Robust model-related processes, including:
the application of best-practice modelling methodologies
independent model validation in accordance with both regulatory and internal materiality assessments
adequate model documentation, including the coverage of model use and limitations
controlled implementation of approved models into production systems
ongoing monitoring of model performance
review and governance of data used as model inputs
peer challenge in technical forums.
Credit IRB models and operational risk AMA models are validated at initial development and at least annually thereafter by the central validation function. Other models are validated at initial development and reviewed at intervals determined by materiality and performance criteria. Validation techniques test the appropriateness and effectiveness of the models, and indicate if the model is fit-for-purpose.
Models are recommended by the relevant technical committee for approval or ongoing use to the relevant model approval committee.
Operational risk subtype: Tax riskTax risk is defined as any event, action or inaction in tax strategy, operations, financial reporting, or compliance that either adversely affects the group’s tax or business objectives or results in an unanticipated or unacceptable level of monetary, financial statement or reputational exposure.
The group’s approach to tax risk is governed by the GAC-approved tax risk control framework which, in turn, is supported by policies dealing with specific aspects of tax risk such as, for example, transfer pricing, indirect taxes, withholding taxes and remuneration taxes.
Operational risk subtype: Legal riskLegal risk is defined as the exposure to the adverse consequences of judgements or private settlements, including punitive damages resulting from inaccurately drafted contracts, their execution, the absence of written agreements or inadequate agreements. This includes exceeding authority as contained in the contract. It applies to the full scope of group activities and may also include others acting on behalf of the group.
The group has processes and controls in place to manage its legal risks. Failure to manage these risks effectively could result in legal proceedings impacting the group adversely, both financially and reputationally.
Operational risk subtype: Compliance riskThis is the risk of legal or regulatory sanctions, financial loss or loss to reputation that the group may suffer as a result of its failure to comply with laws, regulations, codes of conduct and standards of good practice applicable to its business activities.
This includes the exposure to new laws as well as changes in interpretations of existing laws by appropriate authorities.
Approach to the management of compliance riskGeneral approachThe compliance function operates independently of business in terms of its mandate, which is approved annually by the GAC and is drawn primarily from Regulation 49 of the Banks Act. All compliance teams report through compliance executives to the GCCO.
The group’s approach to managing compliance risk is proactive and premised on internationally accepted principles of compliance risk management.
Our performance Risk and capital management report > Operational risk continued
Our business Our performance Governance andtransparency
Annual financialstatements
Additionalinformation
89
Compliance risk management is a core risk management activity overseen by the GCCO. The GCCO has unrestricted access to the joint group chief executives and to the chairman of the GAC, thereby ensuring the function’s independence.
A robust risk management reporting and escalation procedure requires business unit and functional area compliance heads to report on the status of compliance risk management in the group. There is a key focus on treating customers fairly as the South African regulatory framework moves towards a twin peaks model of supervision.
Employees, including their senior management, are made aware of their statutory compliance responsibilities through ongoing training and awareness initiatives.
Approach to managing money laundering and terrorist
financingLegislation pertaining to money laundering and terrorist financing control imposes significant requirements in terms of customer due diligence, record keeping, staff training and the obligation to detect, prevent and report suspected money laundering and terrorist financing. The group subscribes to the principles of the Financial Action Task Force, an intergovernmental body that develops and promotes policies to combat money laundering and terrorist financing.
Group minimum standards are implemented throughout the group, taking into account local jurisdictional requirements where these may be more stringent.
Approach to sanctions managementThe group actively manages the legal, regulatory, reputational and operational risks associated with doing business in jurisdictions or with clients that are subject to embargoes or sanctions imposed by competent authorities. The group sanctions review committee, supported by a sanctions desk, is responsible for providing advice on all sanctions-related matters in a fluid sanctions environment.
Approach to managing regulatory changeThe group operates in a highly regulated industry across multiple jurisdictions and is increasingly subject to international legislation with extra-territorial reach.
The group aims to embed regulatory best practice in our operations in a way that balances the interests of various stakeholders, while supporting the long-term stability and growth in the markets where we have a presence.
The group’s regulatory advocacy unit assesses the impact that emerging policy and regulation will have on the business. The group’s approach to regulatory advocacy is to engage with government policymakers, legislators and regulators in a constructive manner.
The group regulatory and legislative oversight committee enhances regulatory risk management by proactively considering the impacts of regulatory developments on the group.
Operational risk subtype: Environmental
and social riskEnvironmental risk is described as a measure of the potential threats to the environment. It combines the probability that events will cause or lead to the degradation of the environment and the magnitude of such degradation. Environmental risk includes risks related to or resulting from climate change, human activities or from natural processes that are disturbed by changes in natural cycles.
Social risk is described as risks to people, their livelihoods, health and welfare, socioeconomic development, social cohesion and the ability to adapt to changing circumstances.
Environmental and social risk assessment and management deals with two aspects:
Risks over which the group does not have control but which have potential to impact on our operations and those of the group’s clients.
Risks over which the group has direct control. These include our immediate direct impact, such as our waste management and the use of energy and water; as well as our broader impact, including risks that occur as a result of our lending or financial services activities.
The group sustainability management unit develops the strategy, policy and management frameworks that enable the identification, management, monitoring and reporting of both aspects.
The group has an environmental and social risk management policy and subscribes to a number of international norms and codes, such as those of the United Nations Environment Programme Finance Initiative, the Equator Principles and BASA. In support of these policy commitments, it has developed guidance to bankers, screening tools to assist in categorising environmental and social risk and various training programmes to assist credit evaluators, deal makers and other key individuals.
Operational risk subtype: Business continuity
management BCM is a process that identifies potential operational disruptions and provides a basis for planning for the mitigation of the negative impact from such disruptions. In addition, it promotes operational resilience and ensures an effective response that safeguards the interests of the group and its stakeholders. The group BCM framework encompasses emergency response preparedness and crisis management capabilities to manage the business through a crisis to full recovery. The group’s business continuity capabilities are evaluated by testing business continuity plans and conducting crisis simulations.
Operational risk subtype: Technology
risk managementTechnology risk encompasses both IT risk and IT change risk. IT Risk refers to the risk associated with the use, ownership, operation, involvement, influence and adoption of IT within the group. It consists of IT-related events and conditions that could potentially impact the business. IT change risk arises from changes, updates or alterations made to the IT infrastructure, systems or applications that could affect service reliability and availability.
90 The Standard Bank of South Africa Annual report 2013
The group relies heavily on technology to support complex business processes and handle large volumes of critical information. As a result, a technology failure can have a crippling impact on the group’s brand and reputation.
The operational risk IT risk function oversees compliance with the IT risk and IT change risk governance standard.
Operational risk subtype: Information
risk management Information risk encompasses all the challenges that result fromthe need to control and protect the group’s information. These risks may arise from accidental or intentional unauthorised use, modification, disclosure or destruction of information resources, which would compromise the confidentiality, integrity or availability of information.
The group has adopted a risk-based approach to managing information risks. The integrated operational risk (IOR) management function oversees the information security management system, policies and practices across the group.
The execution of these policies and practices is driven through a network of information security officers embedded within the business lines. The group chief information security officer functionally oversees this network.
The Promotion of Access to Information Act 2 of 2000 gives effectto the constitutional right of access to information that is held by a private or public body. The following information is disclosed in terms of applicable regulations:
From January 2013 to December 2013, the group processed16 (2012: 24) requests for access to information, of whichfour were granted, six were denied, two were partly granted,and four were withdrawn.
The reasons for the denial of access were that the owners of the personal information declined to give consent for access to be given to the requestor and some requests did not comply withthe requirements of the abovementioned act.
Operational risk subtype: Financial
crime controlThe group defines financial crime control at the prevention, detection and response to all financial crime to mitigate economic loss, reputational risk and regulatory sanction. Financial crime includes fraud, bribery and corruption and misconduct by staff, customers, suppliers, business partners and stakeholders.
The financial crime risk control function forms part of the IOR function, which reports to the group CRO. As is in the case with the other functions within IOR, financial crime risk management maintains close working relationships with other risk functions, specifically compliance, legal risk and credit risk, and with other group functions such as IT, human resources, and finance.
Operational risk subtype: Occupational
health and safetyAny risks to the health and safety of employees resulting from hazards in the workplace or potential exposure to occupational illness is managed by the occupational health and safety team. Training of health and safety officers and employee awareness is an ongoing endeavour and the results are evident in a declining trend in reportable incidents and declining cost to company for workmen’s compensation coverage.
Physical commodities
A physical commodities specialist function based in Johannesburg, London and Singapore manages physical commodities transactions executed within the group. The role of the team is to focus on the risks embedded in each trade, on a pre- and post-trade basis, and to ensure they are understood, tracked, controlled and escalated if appropriate. The team works with approved third parties who play a key role in the process and the provision of related control functions such as shipbrokers, insurers, warehouse providers and security companies.
Areas of special focus
In addition to the specialist operational subtypes above, the group also has areas of special focus based on the organisation’s evolving needs. These focus areas are:
supporting increased innovation and the use of new technology in the banking industry to provide solutions to customers
compliance with increased scope of monitoring and reporting required by regulators
ensuring robust control over balance sheet substantiation and other key financial controls.
Our performance Risk and capital management report > Operational risk continued

Our business Our performance Governance andtransparency
Annual financialstatements
Additionalinformation
91
Business risk is the risk of loss due to operating revenues not covering operating costs.Business risk is usually caused by the following:
inflexible cost structures
market-driven pressures, such as decreased demand, increased competition or cost increases
group-specific causes, such as a poor choice of strategy, reputational damage or the decision to absorb costs or losses to preserve reputation.
The group mitigates business risk in a number of ways, including:
extensive due diligence during the investment appraisal process is performed, in particular for new acquisitions and joint ventures
detailed analysis of the business case for, and financial, operational and reputational risks associated with, disposals
the application of new product processes per business line through which the risks and mitigating controls for new and amended products and services are evaluated
stakeholder management to ensure favourable outcomes from external factors beyond the group’s control
monitoring the profitability of product lines and customer segments
maintaining tight control over the group’s cost base, including the management of its cost-to-income ratio, which allows for early intervention and management action to reduce costs
being alert and responsive to changes in market forces
a strong focus in the budgeting process on achieving headline earnings growth while containing cost growth; contingency plans are built into the budget that allow for costs to be significantly reduced in the event that expected revenue generation does not materialise
increasing the ratio of variable costs to fixed costs which creates flexibility to reduce costs during an economic downturn.
Strategic risk
Strategic risk is the risk that the group’s future business plans and strategies may be inadequate to prevent financial loss or protect the group’s competitive position and shareholder returns.
The group's business plans and strategies are discussed and approved by executive management and the board and, where appropriate, subjected to stress tests.
Post�retirement obligation risk
Post-retirement obligation risk is the risk to the group’s comprehensive income that arises from the requirement to contribute as an employer to an under-funded defined benefit plan. The group operates both defined contribution plans and defined benefit plans, with the majority of its employees participatingin defined contribution plans. The defined benefit pension and healthcare schemes for past and certain current employees, create post-retirement obligations.
The group mitigates these risks through independent asset managers and independent asset and liability management advisors for material funds. Potential residual risks which may impact the group are managed within the group asset and liability management process.
The primary governance committee for overseeing this risk is the group ALCO which is chaired by the SBG chief financial officer.
As post-retirement obligation risk is accounted for under International Accounting Standards (IAS) 19 Employee Benefits (revised 2011)(IAS 19R), the consequence of this risk is already recognised in the group’s equity for accounting purposes. However, any surplus recognised under IAS 19 relating to defined benefit funds is excluded from core equity for the purposes of capital adequacy.
Strategic risk 91
Post-retirement obligation risk 91
Business risk

92 The Standard Bank of South Africa Annual report 2013
Reputational risk results from damage to the group’s image which may impair its ability to retain and generate business through the loss of trust and confidence or a breakdown in business relationships.
Safeguarding the group’s reputation is of paramount importance. There is growing emphasis on reputational risks arising from compliance breaches, as well as from ethical considerations linked to countries, clients and sectors, and environmental considerations.
The group’s crisis management processes are designed to minimise the reputational impact of the event. Crisis management teams are in place both at executive and business line level to ensure the effective management of any such events. This includes ensuring that the group’s perspective is fairly represented in the media.
The group’s code of ethics (the code) is an important reference point for all staff. The group ethics officer and the chief executive are the formal custodians of the code of ethics.
For more information on the group’s code of ethics,
please go to www.standardbank.com
Reputational risk
Our performance Risk and capital management report continued
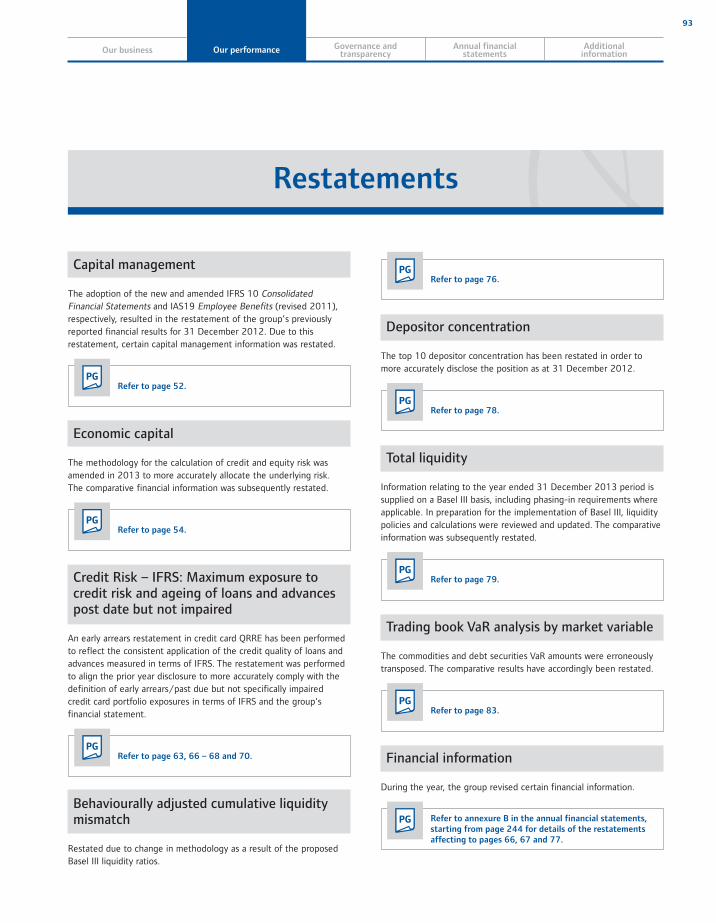
Our business Our performance Governance andtransparency
Annual financialstatements
Additionalinformation
93
Capital management
The adoption of the new and amended IFRS 10 ConsolidatedFinancial Statements and IAS19 Employee Benefits (revised 2011), respectively, resulted in the restatement of the group’s previously reported financial results for 31 December 2012. Due to this restatement, certain capital management information was restated.
PGRefer to page 52.
Economic capital
The methodology for the calculation of credit and equity risk was amended in 2013 to more accurately allocate the underlying risk. The comparative financial information was subsequently restated.
PGRefer to page 54.
Credit Risk – IFRS: Maximum exposure to credit risk and ageing of loans and advances post date but not impaired
An early arrears restatement in credit card QRRE has been performed to reflect the consistent application of the credit quality of loans and advances measured in terms of IFRS. The restatement was performed to align the prior year disclosure to more accurately comply with the definition of early arrears/past due but not specifically impairedcredit card portfolio exposures in terms of IFRS and the group's financial statement.
PGRefer to page 63, 66 – 68 and 70.
Behaviourally adjusted cumulative liquidity mismatch
Restated due to change in methodology as a result of the proposed Basel III liquidity ratios.
PGRefer to page 76.
Depositor concentration
The top 10 depositor concentration has been restated in order to more accurately disclose the position as at 31 December 2012.
PGRefer to page 78.
Total liquidity
Information relating to the year ended 31 December 2013 period is supplied on a Basel III basis, including phasing-in requirements where applicable. In preparation for the implementation of Basel III, liquidity policies and calculations were reviewed and updated. The comparative information was subsequently restated.
PGRefer to page 79.
Trading book VaR analysis by market variable
The commodities and debt securities VaR amounts were erroneously transposed. The comparative results have accordingly been restated.
PGRefer to page 83.
Financial information
During the year, the group revised certain financial information.
PG Refer to annexure B in the annual financial statements, starting from page 244 for details of the restatements affecting to pages 66, 67 and 77.
Restatements

94 The Standard Bank of South Africa Annual report 2013
Composition of capital1
Basel IIIRm
Amountssubject to
pre-Basel IItreatment
Rm Reference2
2013CET I capital 57 297
Instruments and reservesCET I capital before regulatory adjustments 74 119
Directly issued qualifying common share capital plus related stock surplus 36 356 (c)
Retained earnings 37 221 (d)
Accumulated other comprehensive income (and other reserves) 542 (d)
Directly issued capital subject to phase out from CET I (only applicable to non-joint stock companies)Public sector capital injections grandfathered until 1 January 2018Common share capital issued by subsidiaries and held by third parties (amount allowed in group CET I)
Regulatory adjustmentsLess: total regulatory adjustments to CET I (16 822)
Prudential valuation adjustmentsGoodwill (net of related tax liability) (40) (b)
Other intangibles other than mortgage-servicing rights (net of related tax liability) (12 815) (b)
Deferred tax assets that rely on future profitability excluding those arising from temporary differences (net of related tax liability) (35) (a)
Cash-flow hedge reserve (26)
Shortfall of provisions to expected losses (2 714)
Securitisation gain on saleGains and losses due to changes in own credit risk on fair valued liabilities (523)
Defined benefit pension fund net assets (669)
Investments in own shares (if not already netted of paid-in capital on reported balance sheet)Reciprocal cross-holdings in common equityInvestments in the capital of banking, financial and insurance entities that are outside the scope of regulatory consolidation, net of eligible short positions, where the bank does not own more than 10% of the issued share capital (amount above 10% threshold)
Significant investments in the common stock of banking, financial and insurance entities that are outside the scope of regulatory consolidation, net of eligible short positions (amount above 10% threshold)
Mortgage servicing rights (amount above 10% threshold)Deferred tax assets arising from temporary differences (amount above 10% threshold, net of related tax liability)Amount exceeding the 15% threshold, relating to:
Significant investments in the common stock of financialsMortgage servicing rightsDeferred tax assets arising from temporary differences
National specific regulatory adjustmentsRegulatory adjustments applied to CET I in respect of amounts subject to pre-Basel III treatment
Regulatory adjustments applied to CET I due to insufficient additional tier I and tier II to cover deductions
1 Disclosure based on prescribed SARB template. All blank line items are not applicable as at 31 December 2013.2 Reference to annexure C on page 100.
Annexure A
Our performance Risk and capital management report continued

Our business Our performance Governance andtransparency
Annual financialstatements
Additionalinformation
95
Composition of capital1
Basel IIIRm
Amountssubject to
pre-Basel IItreatment
Rm Reference
2013Additional tier I capital
InstrumentsAdditional tier I capital before regulatory adjustmentsDirectly issued qualifying additional tier I instruments plus related stock surplus, classified as:
Equity under applicable accounting standardsLiabilities under applicable accounting standards
Directly issued capital instruments subject to phase out from additional tier I
Additional tier I instruments (and CET I instruments not included in common share capital) issued by subsidiaries and held by third parties (amount allowed in group additional tier I), including:
Instruments issued by subsidiaries subject to phase out
Regulatory adjustmentsTotal regulatory adjustments to additional tier I capitalInvestments in own additional tier I instrumentsReciprocal cross-holdings in additional tier I instrumentsInvestments in the capital of banking, financial and insurance entities that are outside the scope of regulatory consolidation, net of eligible short positions, where the bank does not own more than 10% of the issued share capital (amount above 10% threshold)
Significant investments in the common stock of banking, financial and insurance entities that are outside the scope of regulatory consolidation, net of eligible short positions (amount above 10% threshold)
National specific regulatory adjustments:
Regulatory adjustments applied to CET I in respect of amounts subject to pre-Basel III treatment
Regulatory adjustments applied to additional tier I due to insufficient additional tier I due to insufficient tier II to cover deductions
Tier I capital 57 297
1 Disclosure based on prescribed SARB template. All blank line items are not applicable as at 31 December 2013.

96 The Standard Bank of South Africa Annual report 2013
Composition of capital1
Basel IIIRm
Amountssubject to
pre-Basel IItreatment
Rm Reference2
2013
Capital and provisionsTier II capital before regulatory adjustments 19 581
Directly issued qualifying tier II instruments plus related stock surplus 19 395 (e)
Directly issued capital instruments subject to phase out from tier II 20 050
Tier II instruments (and CET I and additional tier I instruments not included in common share capital and additional tier I instruments) issued by subsidiaries and held by third parties (amount allowed in group tier II), including:
Instruments issued by subsidiaries subject to phase outProvisions 186
Regulatory adjustmentsTotal regulatory adjustments to tier II capital (1 280)
Investments in own tier II instrumentsReciprocal cross-holdings in tier II instrumentsInvestments in the capital of banking, financial and insurance entities that are outside the scope of regulatory consolidation, net of eligible short positions, where the bank does not own more than 10% of the issued share capital (amount above 10% threshold)Significant investments in the capital of banking, financial and insurance entities that are outside the scope of regulatory consolidation (net of eligible short positions) (1 280)
National specific regulatory adjustments
Regulatory adjustments applied to tier II in respect of amounts subject to pre-Basel III treatment
Tier II capital 18 301
Total capital 75 598
Total risk-weighted assets 489 045
Risk-weighted assets in respect of amounts subject to pre-Basel III treatment
1 Disclosure based on prescribed SARB template. All blank line items are not applicable as at 31 December 2013.2 Reference to annexure C on page 100.
Our performance Risk and capital management report > Annexure A – composition of capital continued
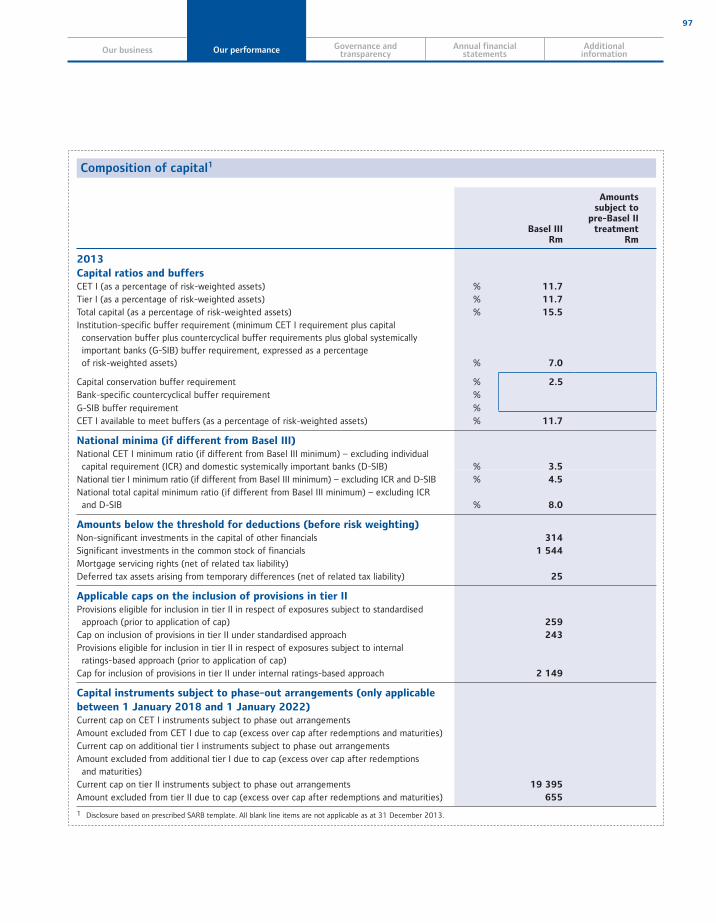
Our business Our performance Governance andtransparency
Annual financialstatements
Additionalinformation
97
Composition of capital1
Basel IIIRm
Amountssubject to
pre-Basel IItreatment
Rm
2013
Capital ratios and buffersCET I (as a percentage of risk-weighted assets) % 11.7
Tier I (as a percentage of risk-weighted assets) % 11.7
Total capital (as a percentage of risk-weighted assets) % 15.5
Institution-specific buffer requirement (minimum CET I requirement plus capital conservation buffer plus countercyclical buffer requirements plus global systemically important banks (G-SIB) buffer requirement, expressed as a percentage of risk-weighted assets) % 7.0
Capital conservation buffer requirement % 2.5
Bank-specific countercyclical buffer requirement %
G-SIB buffer requirement %CET I available to meet buffers (as a percentage of risk-weighted assets) % 11.7
National minima (if different from Basel III)National CET I minimum ratio (if different from Basel III minimum) – excluding individual capital requirement (ICR) and domestic systemically important banks (D-SIB) % 3.5
National tier I minimum ratio (if different from Basel III minimum) – excluding ICR and D-SIB % 4.5
National total capital minimum ratio (if different from Basel III minimum) – excluding ICR and D-SIB % 8.0
Amounts below the threshold for deductions (before risk weighting)Non-significant investments in the capital of other financials 314
Significant investments in the common stock of financials 1 544
Mortgage servicing rights (net of related tax liability)Deferred tax assets arising from temporary differences (net of related tax liability) 25
Applicable caps on the inclusion of provisions in tier IIProvisions eligible for inclusion in tier II in respect of exposures subject to standardised approach (prior to application of cap) 259
Cap on inclusion of provisions in tier II under standardised approach 243
Provisions eligible for inclusion in tier II in respect of exposures subject to internal ratings-based approach (prior to application of cap)Cap for inclusion of provisions in tier II under internal ratings-based approach 2 149
Capital instruments subject to phase-out arrangements (only applicable
between 1 January 2018 and 1 January 2022)Current cap on CET I instruments subject to phase out arrangementsAmount excluded from CET I due to cap (excess over cap after redemptions and maturities)Current cap on additional tier I instruments subject to phase out arrangementsAmount excluded from additional tier I due to cap (excess over cap after redemptions and maturities)Current cap on tier II instruments subject to phase out arrangements 19 395
Amount excluded from tier II due to cap (excess over cap after redemptions and maturities) 655
1 Disclosure based on prescribed SARB template. All blank line items are not applicable as at 31 December 2013.

98 The Standard Bank of South Africa Annual report 2013
Annexure B
Capital instruments: main features disclosure template1
Ordinary
share capital
(including
share premium)
Subordinated
bond – SBK7
Subordinated
bond – SBK9
Subordinated
bond – SBKi11
Subordinated
bond – SBK12
2013Issuer SBSA SBSA SBSA SBSA SBSA
Unique identifier (for example, CUSIP, ISIN or Bloomberg identifier for private placement)
ZAG000024894 ZAG000029687 ZAG000066382 ZAG000073388
Governing law(s) of the instrument SA SA SA SA SA
Regulatory treatmentTransitional Basel III rules N/A Tier II Tier II Tier II Tier II
Post-transitional Basel III rules CET I Tier II Tier II Tier II Tier II
Eligible at solo/group/group & solo Solo Group & solo Group & solo Group & solo Group & solo
Instrument type (types to be specified by each jurisdiction)
Ordinary share
capital and
premium
Subordinated debt Subordinated debt Subordinated debt Subordinated debt
Amount recognised in regulatory capital (currency in Rm, as of most recent reporting date)
ZAR36 356 ZAR3 000 ZAR1 500 ZAR1 800 ZAR1 600
Par value of instrument ZAR1 ZAR3 000 ZAR1 500 ZAR1 800 ZAR1 600
Accounting classification Equity attributable
to the ordinary
shareholder
Subordinated
debt
Subordinated
debt
Subordinated
debt
Subordinated
debt
Original date of issuance Ongoing 2005/05/24 2006/04/10 2009/04/09 2009/11/24
Perpetual or dated Perpetual Dated Dated Dated Dated
Original maturity date N/A 2020/05/24 2023/04/10 2019/04/09 2021/11/24
Issuer call subject to prior supervisory approval No Yes Yes Yes Yes
Optional call date, contingent call dates and redemption amount (currency in Rm)
N/A 2015/05/24
ZAR3 000
2018/04/10
ZAR1 500
2014/04/10
ZAR1 800
2016/11/24
ZAR1 600
Subsequent call dates, if applicable N/A 2015/05/24
or any
subsequent
interest
payment date
2018/04/10
or any
subsequent
interest
payment date
2014/04/10
or any
subsequent
interest
payment date
N/A
Coupons/dividendsFixed or floating dividend/coupon N/A Fixed Fixed Floating Fixed
Coupon rate and any related index N/A 9.63%
semi-annual
8.40%
semi-annual
CPI indexed2 10.82%
semi-annual
Existence of a dividend stopper No No No No No
Fully discretionary, partially discretionary or mandatory
Fully
discretionary
Mandatory Mandatory Mandatory Mandatory
Existence of step up or other incentive to redeem No Yes Yes Yes Yes
Non-cumulative or cumulative Non-cumulative Non-cumulative Non-cumulative Non-cumulative Non-cumulative
Convertible or non-convertible Non-convertible Non-convertible Non-convertible Non-convertible Non-convertible
Write-down feature N/A N/A N/A N/A N/A
Position in subordination hierarchy in liquidation (specify instrument type immediately senior to instrument)
Most
subordinated
Senior
unsecured
Senior
unsecured
Senior
unsecured
Senior
unsecured
Non-compliant transitioned features No Yes Yes Yes Yes
If yes, specify non-compliant features N/A Regulation 38(14)
(a)(i)
Regulation 38(14)
(a)(iv)(D)
Regulation 38(14)
(a)(iv)(H)(ii)
Regulation 38(14)
(a)(i)
Regulation 38(14)
(a)(iv)(D)
Regulation 38(14)
(a)(iv)(H)(ii)
Regulation 38(14)
(a)(i)
Regulation 38(14)
(a)(iv)(D)
Regulation 38(14)
(a)(iv)(H)(ii)
Regulation 38(14)
(a)(i)
Regulation 38(14)
(a)(iv)(D)
Regulation 38(14)
(a)(iv)(H)(ii)
1 For related carrying values of subordinated debt, refer to note 21 in the annual financial statements on page 182.2 The amount will be inflation adjusted after call date.
Our performance Risk and capital management report continued
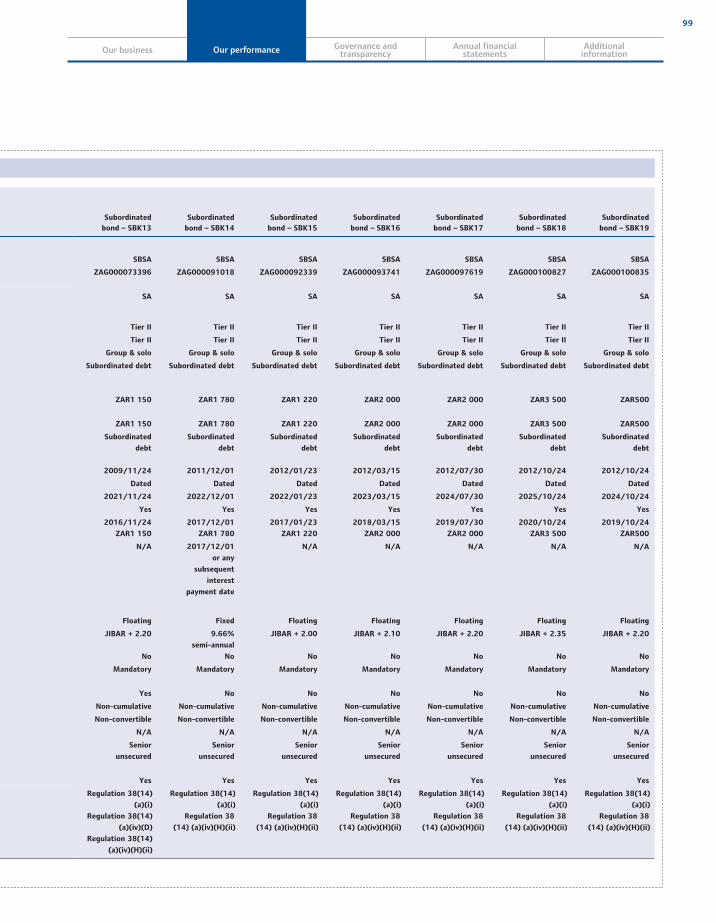
Our business Our performance Governance andtransparency
Annual financialstatements
Additionalinformation
99
Subordinated
bond – SBK13
Subordinated
bond – SBK14
Subordinated
bond – SBK15
Subordinated
bond – SBK16
Subordinated
bond – SBK17
Subordinated
bond – SBK18
Subordinated
bond – SBK19
SBSA SBSA SBSA SBSA SBSA SBSA SBSA
ZAG000073396 ZAG000091018 ZAG000092339 ZAG000093741 ZAG000097619 ZAG000100827 ZAG000100835
SA SA SA SA SA SA SA
Tier II Tier II Tier II Tier II Tier II Tier II Tier II
Tier II Tier II Tier II Tier II Tier II Tier II Tier II
Group & solo Group & solo Group & solo Group & solo Group & solo Group & solo Group & solo
Subordinated debt Subordinated debt Subordinated debt Subordinated debt Subordinated debt Subordinated debt Subordinated debt
ZAR1 150 ZAR1 780 ZAR1 220 ZAR2 000 ZAR2 000 ZAR3 500 ZAR500
ZAR1 150 ZAR1 780 ZAR1 220 ZAR2 000 ZAR2 000 ZAR3 500 ZAR500
Subordinated
debt
Subordinated
debt
Subordinated
debt
Subordinated
debt
Subordinated
debt
Subordinated
debt
Subordinated
debt
2009/11/24 2011/12/01 2012/01/23 2012/03/15 2012/07/30 2012/10/24 2012/10/24
Dated Dated Dated Dated Dated Dated Dated
2021/11/24 2022/12/01 2022/01/23 2023/03/15 2024/07/30 2025/10/24 2024/10/24
Yes Yes Yes Yes Yes Yes Yes
2016/11/24
ZAR1 150
2017/12/01
ZAR1 780
2017/01/23
ZAR1 220
2018/03/15
ZAR2 000
2019/07/30
ZAR2 000
2020/10/24
ZAR3 500
2019/10/24
ZAR500
N/A 2017/12/01
or any
subsequent
interest
payment date
N/A N/A N/A N/A N/A
Floating Fixed Floating Floating Floating Floating Floating
JIBAR + 2.20 9.66%
semi-annual
JIBAR + 2.00 JIBAR + 2.10 JIBAR + 2.20 JIBAR + 2.35 JIBAR + 2.20
No No No No No No No
Mandatory Mandatory Mandatory Mandatory Mandatory Mandatory Mandatory
Yes No No No No No No
Non-cumulative Non-cumulative Non-cumulative Non-cumulative Non-cumulative Non-cumulative Non-cumulative
Non-convertible Non-convertible Non-convertible Non-convertible Non-convertible Non-convertible Non-convertible
N/A N/A N/A N/A N/A N/A N/A
Senior
unsecured
Senior
unsecured
Senior
unsecured
Senior
unsecured
Senior
unsecured
Senior
unsecured
Senior
unsecured
Yes Yes Yes Yes Yes Yes Yes
Regulation 38(14)
(a)(i)
Regulation 38(14)
(a)(iv)(D)
Regulation 38(14)
(a)(iv)(H)(ii)
Regulation 38(14)
(a)(i)
Regulation 38
(14) (a)(iv)(H)(ii)
Regulation 38(14)
(a)(i)
Regulation 38
(14) (a)(iv)(H)(ii)
Regulation 38(14)
(a)(i)
Regulation 38
(14) (a)(iv)(H)(ii)
Regulation 38(14)
(a)(i)
Regulation 38
(14) (a)(iv)(H)(ii)
Regulation 38(14)
(a)(i)
Regulation 38
(14) (a)(iv)(H)(ii)
Regulation 38(14)
(a)(i)
Regulation 38
(14) (a)(iv)(H)(ii)

100 The Standard Bank of South Africa Annual report 2013
Annexure C
Reconciliation of audited statement of financial position and regulatory capital and reserves
Statementof financial
positionRm
Underregulatory
scope ofconsolidation
Rm Reference1
2013
AssetsCash and balances with central banks 29 934
Derivative assets and other assets 71 597
Trading assets 35 574
Pledged assets 4 394
Financial investments 73 604
Loans and advances 704 919
Current tax assets 286
Deferred tax assets 38 35 (a)
Interest in group companies, associates and joint ventures 72 757
Goodwill and other intangible assets 13 785 12 855 (b)
Property and equipment 8 989
Total assets 1 015 877
Equity and liabilitiesEquity 79 204 74 119
Equity attributable to the ordinary shareholder 79 201 74 119
Ordinary share capital 60 60 (c)
Ordinary share premium 36 296 36 296 (c)
Reserves 42 845 37 763 (d)
Non-controlling interest 3
Liabilities 936 673 19 395
Derivative liabilities 65 813
Trading liabilities 20 424
Deposit and current accounts 721 350
Other liabilities and taxation 17 583
Liabilities to group companies 90 688
Subordinated debt 20 815 19 395 (e)
Total equity and liabilities 1 015 877
1 Reference to annexure A on pages 94 to 97.
Our performance Risk and capital management report continued
101
Our business Our performance Governance andtransparency
Annual financialstatements
Additionalinformation
Corporate governance report
This statement sets out the governance framework adopted by the board of directors (the board) which is derived from the governance framework adopted by SBG. Good corporate governance remains integral to the way we operate. We are committed to operate in a correct, principled and yet commercially astute manner and staying accountable to our stakeholders. We hold the view that transparency and accountability are essential for our group to thrive and succeed in the short, medium and long term.
This report includes:
An overview of our governance framework
The role and composition of the board of directors
Director independence
Roles of the chairman and chief executive
Board appointment process
Induction and ongoing education of directors
Board evaluation
Key terms of reference and focus areas for the board
and its committees
Attendance record at board and committee meetings
Prescribed officers of the company
Application of the King Code
Connecting with our stakeholders
Ethics and organisational integrity
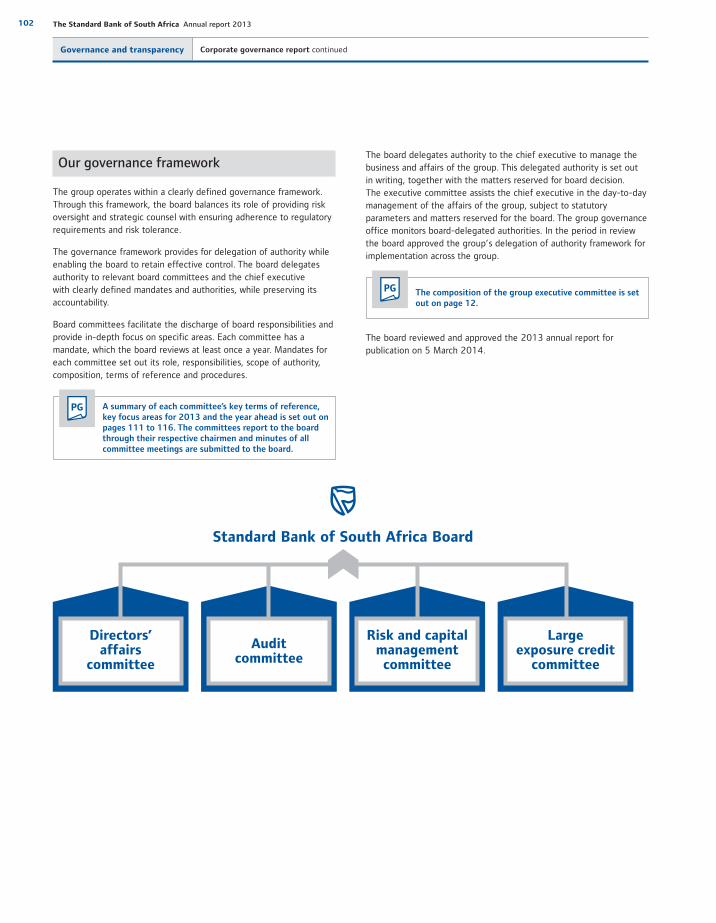
102 The Standard Bank of South Africa Annual report 2013
Governance and transparency Corporate governance report continued
Our governance framework
The group operates within a clearly defined governance framework. Through this framework, the board balances its role of providing risk oversight and strategic counsel with ensuring adherence to regulatory requirements and risk tolerance.
The governance framework provides for delegation of authority while enabling the board to retain effective control. The board delegates authority to relevant board committees and the chief executivewith clearly defined mandates and authorities, while preserving its accountability.
Board committees facilitate the discharge of board responsibilities and provide in-depth focus on specific areas. Each committee has a mandate, which the board reviews at least once a year. Mandates for each committee set out its role, responsibilities, scope of authority, composition, terms of reference and procedures.
PG A summary of each committee’s key terms of reference, key focus areas for 2013 and the year ahead is set out on pages 111 to 116. The committees report to the board through their respective chairmen and minutes of all committee meetings are submitted to the board.
The board delegates authority to the chief executive to manage the business and affairs of the group. This delegated authority is set outin writing, together with the matters reserved for board decision. The executive committee assists the chief executive in the day-to-day management of the affairs of the group, subject to statutory parameters and matters reserved for the board. The group governance office monitors board-delegated authorities. In the period in review the board approved the group’s delegation of authority framework for implementation across the group.
PG The composition of the group executive committee is set out on page 12.
The board reviewed and approved the 2013 annual report for publication on 5 March 2014.
Directors’ affairs
committee
Standard Bank of South Africa Board
Large exposure credit
committee
Audit committee
Risk and capital management committee
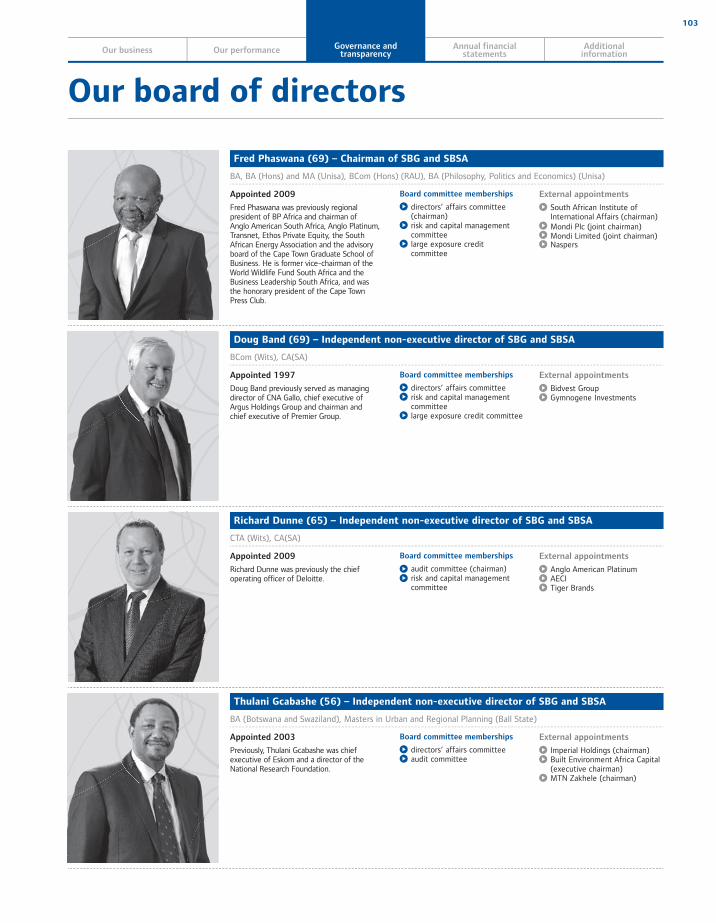
103
Our business Our performance Governance andtransparency
Annual financialstatements
Additionalinformation
Fred Phaswana (69) – Chairman of SBG and SBSA
BA, BA (Hons) and MA (Unisa), BCom (Hons) (RAU), BA (Philosophy, Politics and Economics) (Unisa)
Appointed 2009
Fred Phaswana was previously regional president of BP Africa and chairman ofAnglo American South Africa, Anglo Platinum, Transnet, Ethos Private Equity, the South African Energy Association and the advisory board of the Cape Town Graduate School of Business. He is former vice-chairman of the World Wildlife Fund South Africa and the Business Leadership South Africa, and wasthe honorary president of the Cape TownPress Club.
Board committee memberships
directors’ affairs committee (chairman)
risk and capital management committee
large exposure credit committee
External appointments
South African Institute of International Affairs (chairman)
Mondi Plc (joint chairman) Mondi Limited (joint chairman) Naspers
Doug Band (69) – Independent non-executive director of SBG and SBSA
BCom (Wits), CA(SA)
Appointed 1997
Doug Band previously served as managing director of CNA Gallo, chief executive ofArgus Holdings Group and chairman andchief executive of Premier Group.
Board committee memberships
directors’ affairs committee risk and capital management committee
large exposure credit committee
External appointments
Bidvest Group Gymnogene Investments
Richard Dunne (65) – Independent non-executive director of SBG and SBSA
CTA (Wits), CA(SA)
Appointed 2009
Richard Dunne was previously the chief operating officer of Deloitte.
Board committee memberships
audit committee (chairman) risk and capital management committee
External appointments
Anglo American Platinum AECI Tiger Brands
Thulani Gcabashe (56) – Independent non-executive director of SBG and SBSA
BA (Botswana and Swaziland), Masters in Urban and Regional Planning (Ball State)
Appointed 2003
Previously, Thulani Gcabashe was chief executive of Eskom and a director of the National Research Foundation.
Board committee memberships
directors’ affairs committee audit committee
External appointments
Imperial Holdings (chairman) Built Environment Africa Capital (executive chairman)
MTN Zakhele (chairman)
Our board of directors

104 The Standard Bank of South Africa Annual report 2013
Koosum Kalyan (58) – Independent non-executive director of SBG and SBSA
BCom (Hons) (Durban-Westville)
Appointed 2007Resigned 3 March 2014
Koosum Kalyan was a non-executive director until her resignation on 3 March 2014.She was previously senior business development manager at Shell International Exploration and Production in London, general manager for Shell Southern Africa, senior economist at the Chamber of Mines and economist at the Electricity Commission of Victoria, Melbourne Australia.
External appointments
Edgo Merap (chairman) AOS Orwell (Nigeria) Aker Solutions Oil and Gas (Nigeria) MTN Group Omega Risk Solutions Hayleys Energy Services Petmin Mining South Africa Note Company, a subsidiary of SARB
Ben Kruger (54) – Group chief executive of SBG, and an executive director of SBSA
BCom (Hons) (Pretoria), CA(SA), AMP (Harvard)
Appointed 2013
Ben is the chief executive of SBG, and an executive director of SBSA. He is chairman of SB Plc, and a director of Stanbic Africa Holdings.
Board committee memberships
large exposure credit committee
Other appointments
Standard Bank Plc (chairman) Stanbic Africa Holdings
Saki Macozoma (56) – Joint deputy chairman of SBG and non-executive director of SBSA
BA (Unisa)
Appointed 1998
Saki Macozoma is a member of the board of governors of Rhodes University. He is chairman of the KwaZulu-Natal Philharmonic Orchestra.In 1997, he was appointed as managing director of Transnet, until his resignation in early 2001.
Board committee memberships
directors’ affairscommittee
risk and capital management committee
External appointments
Liberty Holdings (chairman) Stanlib (chairman) Tshipi é Ntle Manganese Mining (chairman)
Ntsimbintle Mining (chairman) Safika Holdings (chairman) VW South Africa Business LeadershipSouth Africa (president)
Kgomotso Moroka (59) – Independent non-executive director of SBG and SBSA
BProc (University of the North), LLB (Wits)
Appointed 2003
Kgomotso Moroka is a senior advocate whohas acted as a judge in the Witwatersrand Local Division and was past chairperson of Advocates for Transformation (Johannesburg branch).She is currently a trustee of the Nelson Mandela Children’s Fund, Project Literacy and the Apartheid Museum.
Board committee memberships
directors’ affairscommittee
External appointments
Gobodo Forensic and Investigative Accounting (chairman)
Royal Bafokeng Platinum (chairman) South African Breweries Multichoice South Africa Holdings Netcare
Governance and transparency Corporate governance report > Our board of directors continued

105
Our business Our performance Governance andtransparency
Annual financialstatements
Additionalinformation
Chris Nissen (55) – Independent non-executive director of SBG and SBSA
BA (Hons), MA Humanities (Cape Town), Diploma in Theology
Appointed 2003
Chris Nissen was previously the chiefexecutive officer of Umoya Fishing Limited. He also served as chairman of Boschendal Limited and the South African Maritime Safety Authority.
External appointments
Cape Empowerment (chairman) Ascension Properties (chairman) Woolworths
Simon Ridley (58) – SBG’s chief financial officer and executive director of SBG and SBSA
BCom (Natal), CA(SA), AMP (Oxford)
Appointed 2009
Simon, SBG’s chief financial officer, is an executive director of SBG and SBSA. He serves as a director of Standard International Holdings, Stanbic Africa Holdings and SBIC Investments, as well as Tutuwa Staff Holdings and Tutuwa Community Holdings. In 2014, he was appointed director, Standard Bank London Holdings Limited.
Board committee memberships
large exposurecredit committee
Other appointments
Standard International Holdings Stanbic Africa Holdings SBIC Investments Standard Bank London Holdings Tutuwa Staff Holdings Tutuwa Community Holdings
Myles Ruck (58) – Independent non-executive director of SBG and SBSA
BBusSC (Cape Town), PMD (Harvard)
Appointed 2002
Myles Ruck was previously chief executiveof SCMB, deputy chief executive of SBGand chief executive of Liberty Holdings Limited and its subsidiaries (Liberty Group).
Board committee memberships
risk and capital management committee (chairman)
large exposure credit committee (chairman)
External appointments
ICBC (Argentina)(vice chairman)
Mr Price Group Thesele Group
Lord Smith of Kelvin, KT (69) – Independent non-executive director of SBG and SBSA
CA, Fellow of the Institute of Bankers (Scotland), Honorary Degrees (Edinburgh, Glasgow, Paisley)
Appointed 2003
Lord Smith was formerly chairman of the Weir Group Plc, chairman and chief executive of Morgan Grenfell Private Equity, chief executive of Morgan Grenfell Asset Management, and vice chairman of Deutsche Asset Management. He has also held a number of positions in the financial services industry and is past president of the Institute of Chartered Accountantsof Scotland.
Board committee memberships
audit committee
External appointments
Scottish and Southern Energy (chairman) Glasgow 2014 Commonwealth Games Organising Committee (chairman)
UK Green Investment Bank (chairman)
106 The Standard Bank of South Africa Annual report 2013
Changes to board compositionKoosum Kalyan resigned from the boards of SBG and SBSA effective 3 March 2014.
Peter Sullivan (65) – Independent non-executive director of SBG and SBSA
BSc (Physical Education) (University of NSW)
Appointed 2013
Peter Sullivan was previously chief executiveof Standard Chartered Bank, Africa and an executive director and chief executive of Standard Chartered Bank, Hong Kong.
Board committee memberships
audit committee risk and capital management committee
External appointments
Healthcare Locums Plc (chairman)
Winton Capital ManagementLimited (chairman)
Techtronic Industries AXA China Region AXA Asia Standard Bank Plc
Sim Tshabalala (46) – Group chief executive director of SBG and chief executive of SBSA
BA LLB (Rhodes), LLM (University of Notre Dame USA), HDip Tax (Wits), AMP (Harvard)
Appointed 2013
Sim is the chief executive of SBG, chief executive of SBSA, a director of Tutuwa Community Holdings and the chairman of BASA.
Board committee memberships
large exposure credit committee
Other appointments
Liberty Holdings Liberty Group Stanbic IBTC Bank Stanbic Africa Holdings (chairman)
Tutuwa Community Holdings BASA (chairman)
Ted Woods (67) – Independent non-executive director of SBG and SBSA
BCom (Wits), CA(SA), MBA (Cape Town), CFA
Appointed 2007
Ted Woods was previously chairman of Deutsche Securities, South Africa.
Board committee memberships
audit committee risk and capital management committee
Governance and transparency Corporate governance report > Our board of directors continued
107
Our business Our performance Governance andtransparency
Annual financialstatements
Additionalinformation
Board of directors
The role of the board
The board provides effective leadership based on an ethical foundation. It strives to balance the interests of the company and those of its various stakeholders.
The board is constituted in terms of SBSA’s memorandum of incorporation (MOI). It is the highest decision-making body in the company and is responsible for the group’s strategic direction. It ensures that strategy is aligned with the group’s values and monitors strategy implementation and performance targets in relation to the group’s risk profile. It is collectively responsible for the long-term success of the company and is accountable to the shareholder for financial and operational performance.
In line with banking regulations, the board decides on the group’s corporate governance and risk management objectives for the year ahead. The directors’ affairs committee and the relevant risk committees monitor performance against governance and risk objectives, respectively, and reports are submitted to the board. Self-assessment is conducted annually to establish whether the group has achieved these objectives.
The board’s terms of reference are set out in a written charter– the board mandate. The mandate is reviewed at least annuallyand complies with the provisions of the South African CompaniesAct 71 of 2008 (Companies Act) and Banks Act, as well as the company’s MOI. It sets out processes for the:
composition of the board
term of office, including the requirement for at least one third of directors to retire at each annual general meeting
reporting responsibilities
rules of engagement
matters reserved for board decision.
PG The board’s key terms of reference are set out onpage 111.
Board meetings allow sufficient time for consideration of all items.
PG Board meetings are normally scheduled for a full day with attendance by directors set out on page 117.
Care is taken to ensure that the board attends to matters critical to the group’s success, with sufficient attention to compliance and administrative matters. In line with the provisions of the board mandate, board papers are circulated a week before a board meeting.
Composition of the boardThe group has a unitary board structure with executive and non-executive directors.
The board functions effectively and efficiently and is consideredto be of an appropriate size for the group, taking into account,among other considerations, the need to have sufficient directorsto structure board committees appropriately, regulatory requirements as well as the need to adequately address the board’s succession plans. Non-executive directors bring diverse perspectives to board deliberations, and constructive challenging of the views of executive directors and management is encouraged.
The board understands that sound governance practices are fundamental to earning the trust of stakeholders, which is critical to sustaining performance and preserving shareholder value. The board members’ collective experience and expertise provide a balanced mix of attributes for it to fulfil its duties and responsibilities.
There were three directors appointed to the board in 2013, namelyPeter Sullivan (independent non-executive director), Ben Kruger(SBG chief executive), and Peter Wharton-Hood (SBG chief operating officer). Peter Wharton-Hood subsequently resigned from SBG,the group and the board in August 2013.
A further two directors retired from the board in the reporting period; Cyril Ramaphosa (non-executive director) who retired at the company’s AGM and Jacko Maree (executive director) who retired from the board with effect from 7 March 2013. The chairman and the board extend their appreciation to these directors for their immensely valuable contribution over the years.
Following the appointment of Peter Sullivan to the board in January 2013, Cyril Ramaphosa retiring at the company’s AGM in May 2013, and the implementation of executive succession plans in March 2013, the group’s unitary board structure comprised 15 directors, 11 (73%) of whom are independent non-executive directors, one (7%) non-executive director and three (20%) of whom are executive directors (SBG chief executive, the SBSA chief executive and the SBG chief financial officer).
11 Independent non-executive directors (2012: 72) 1 Non-executive directors (2012: 6) 3 Executive directors (2012: 22)
108 The Standard Bank of South Africa Annual report 2013
Independent non-executive directorsThe directors’ affairs committee evaluates the independence of board
members for board approval. Independence is determined against the
criteria set out in the King Code. It defines an independent director as
one who, among others, is not a representative of a shareholder who
has the ability to control or significantly influence management or the
board; does not have a direct or indirect interest in the company
which is less than 5% of the group’s total number of shares in issue,
but is material to his personal wealth; is free from any business or
other relationship which could be seen by an objective outsider to
interfere materially with an individual’s capacity to act in an
independent manner or does not receive remuneration contingent
upon the performance of the company. An independent director
should be independent in character and judgement and there should
be no relationship or circumstances which are likely to affect, or could
appear to affect, their independence.
Saki Macozoma is not considered independent due to his interest in
the group’s strategic empowerment partner, Safika.
The King Code further provides that any term beyond nine years
for an independent non-executive director should be subject to a
particularly rigorous review by the board, of not only their performance,
but also the factors that may impair their independence. The
assessment should show that the independent director’s independence
of character and judgement is not in any way affected or impaired by
the length of service. Accordingly, an annual review is conducted of all
directors who have served for longer than nine years, with the director
being assessed recusing themselves from the meeting.
In this respect, the board assessed and has concluded that Doug Band,
Thulani Gcabashe, Kgomotso Moroka, Chris Nissen, Lord Smith and
Myles Ruck continue to be independent both in character and
judgement, notwithstanding tenure. The chairman and all other
non-executive directors are independent.
Length of tenure of non�executive directors (years)as at 31 December 2013
1 0 – 3 (2012: 2)4 3 – 6 (2012: 3)7 greater than 9 (2012: 2)
The board considers diversity of views and experience to be
an essential part of ensuring that all aspects of strategy and plans
are fully considered. The board continues to work towards increasing
its gender diversity.
Mix of non�executive directors’ nationalitiesas at 31 December 2013
9 South African (2012: 10)2 British (2012: 2)1 Australian (2012: 0)
Separation of the roles of chairman and
chief executiveThe roles of chairman and chief executive continue to be substantively different and separated. The chairman, Fred Phaswana, is an independent non-executive director charged with leading the board, ensuring its effective functioning and setting its agenda, in consultation with the group secretary, the chief executive and the directors.His duties include facilitating dialogue at board meetings; setting the board’s annual work plan; conveying feedback in a balanced and accurate manner between the board and chief executive; and assessing the individual performance of directors.
The board has delegated authority to the chief executive forthe day-to-day operations of the company. The chief executive,Sim Tshabalala, is responsible for fostering a corporate culture that promotes sustainable ethical practices, encourages individual integrity and fulfils social responsibility objectives and imperatives, whilst ensuring all employees maintain a commercial mindset. The chairman leads the process of assessment of the chief executive’s performance.
Closed sessionsAfter every board meeting, non-executive directors meet without the executive directors present in closed sessions led by the chairman. The sessions commence with the chief executive present but without other executive directors and prescribed officers, to answer questions or raise any matters necessary.
The primary objective is to provide non-executive directors with an opportunity to test thoughts and insights among peers. The chairman, as the primary link between the board and executive management, provides feedback from the closed sessions to the chief executive.
Board appointment processDirectors are nominated by the directors’ affairs committee, which is composed of a majority of independent non-executive directors. A human resources placement agency supports the committee in identifying a broad pool of relevant candidates. Apart from a candidate’s experience, availability and fit, the committee also considers other directorships and commitments of the individual to ensure that they will have sufficient capacity to discharge their role
Governance and transparency Corporate governance report > board of directors continued
109
Our business Our performance Governance andtransparency
Annual financialstatements
Additionalinformation
properly. Candidates must also satisfactorily meet the fit and proper test, as required by the Banks Act. The committee also considers appropriate demographic and gender diversity in its assessment.
Suitable candidates are submitted to the board for consideration and appointment in terms of the company’s MOI. A director appointed by the board holds office until the next AGM where they must retire and stand for election by the shareholder.
Shareholders are provided with information on directors’ qualifications, experience and other key directorships.
In terms of the nominations and appointments policy, management requires permission to accept external board appointments, which is only granted in exceptional circumstances. This reduces potential conflicts of interest and helps ensure that management devotes sufficient time and focus to group business.
Conflicts of interest and other commitments In terms of the Companies Act, if a director has a personal financial interest in respect of a matter to be considered at a meeting of the board or knows that a related person has a personal financial interest, the director is obliged to disclose the interest and its general nature, recuse themselves and not take part in the consideration of the matter.
The board is aware of the other commitments of its directors and is satisfied that all directors allocate sufficient time to enable them to discharge their responsibilities effectively. The group secretary maintains a register of directors’ interests, which is tabled to the board annually and any changes are submitted to the board as they occur.
The group complies with the provisions of the Companies Act.
Induction and ongoing educationInduction of new directors and ongoing education of directors is the responsibility of the group secretary. The directors’ affairs committee is responsible for monitoring the implementation of director induction and training plans.
On appointment, directors are provided with the group’s governance manual containing all relevant governance information, including the company founding documents, mandates, governance structures, significant reports, relevant legislation and policies. One-on-one meetings and site visits are scheduled with management to introduce new directors to the company and its operations. The remainder of the induction programme is tailored to the new director’s specific requirements.
To ensure maximum participation in ongoing director training, dates for training are scheduled in advance and form part of the board- approved annual calendar. The directors are kept abreast of applicable legislation and regulations, changes to rules, standards and codes, as well as relevant sector developments that could affect the group and its operations. Ongoing director training topics covered in 2013 included an in-depth review of IT governance; JSE accounting and auditing issues and risk appetite.
Board access to information and resourcesThere is ongoing engagement between executive management and the board. In addition to the executive directors, the company’s prescribed officers, as defined in the Companies Act, attend all board meetings. External auditors are invited to attend GAC and GRCMC meetings. Directors have unrestricted access to group management and company information, as well as the resources to carry out their duties and responsibilities. This includes access to external specialist advice at the group’s expense, in terms of the board-approved policy on independent professional advice.
Succession planningCarefully managing the board succession process is vital to the successful evolution of the board. As the body with primary responsibility for board succession plans, the directors’ affairs committee has taken the view that it must ensure that as directors retire, candidates with sufficient skills and experience have been identified to ensure that the board’s competence and balance is either maintained or enhanced, taking into account the group’s current and future needs.
Given that new non-executive directors need time to acquaint themselves with the business of the group and its strategy, the committee takes the view that it is preferable to appoint replacement independent non-executive directors before the directors being replaced vacate office. While this temporarily increases the number of directors on the board, this is rebalanced as the retiring directors reach the end of their term. At this point, the appointed directors are inducted in the business of the group and are able to ensure seamless continuation of the business of the board.
In line with the provisions of the company’s MOI, directors appointed to the board since the previous AGM are required to retire at the AGM following their appointment and offer themselves for re-election. Koosum Kalyan resigned from the board on 3 March 2014.
Doug Band reaches the mandatory retirement age set in the group’s MOI in April 2014, and will accordingly retire from the board.Chris Nissen will retire from office at the company’s AGM to beheld on 28 May 2014 and will not stand for re-election.
In addition to managing non-executive director succession, the board considers the strength and development of the senior leadership team. The directors’ affairs committee ensures that the group has adequate executive succession plans. The board is satisfied with the depth of the senior leadership team of the group.
Board evaluationThe chairman is responsible for ensuring that the company has an effective board. Supported by the directors’ affairs committee and group secretary, he ensures that the board’s effectiveness and execution of its mandate is reviewed annually.
The board and its committees’ performance is assessed in a numberof ways. A detailed assessment of each committee and the board’s compliance with all the provisions of the respective mandates isdone annually, with the findings reported to the directors’ affairs
110 The Standard Bank of South Africa Annual report 2013
committee. The group’s external auditors conduct a limited assurance assessment on the review and express an opinion in this regard. During 2013, the board and its committees complied withtheir mandates.
In addition to this review, external consultants conduct an annual board and committee evaluation focusing on matters that would not necessarily be apparent from an assessment of compliance with mandates. The board engaged Korn/Ferry International to assist with the board evaluation for the third year. The objective of appointing the same facilitator in succession was for the board to measure the extent of its evolution over a three-year cycle, which is one term in the life of a board.
Therefore, the 2013 review addressed all areas that were identified as opportunities for improvement and change in previous reports, as well as emerging topics and issues for the board to consider.
The scope of the review encompassed:
evaluation of board and board committees
review of specific recommendations arising from the previous board and committee evaluations in 2011 and 2012
investigating the extent to which board and committees had addressed recommendations
highlighting areas where the board had developed and become more effective
identifying topics and issues that the board should now address to continue to improve
identifying new, emerging topics and issues for the board to consider.
In aggregate, the directors had a positive view of the overall performance of the board. Directors who had participated in the 2011 and 2012 evaluations agreed that the outcome of the reviews and actions taken by the board had been beneficial. A positive theme arising from the current year’s review was the board’s rapid evolution and progress on its journey of continuous improvement.
The recommendations from the 2013 board evaluation exercise include that the board should:
continue to review its composition, taking into account identified skill gaps such as IT
focus on accessing external advice in areas where it would improve the understanding and level of debate
continue focused training on relevant issues so that the general level of understanding of banking, regulatory, compliance and risk issues are improved, with the chairman reinforcing the importance of attendance and making it mandatory
consider holding board meetings in different locations, affording the board an opportunity to meet local management and better understand critical risks and issues in each geography.
Finally, the chairman led the individual director peer review process for all directors on the board. A confidential questionnaire was completed by each director and discussed with the chairman in one-on-one sessions. The objective was to provide constructive feedback to directors on their contribution to the board.
IT governanceThe board is responsible for ensuring that prudent and reasonable steps have been taken with respect to IT governance, including aligning the IT strategy to the group’s strategic objectives. The GRCMC has been delegated the authority to ensure the implementation of the IT governance framework, with its design, implementation and execution assigned to the group chief technology officer (CTO) as appointed by the chief executive. The IT steering committee, a subcommittee of the group management committee, is chaired by the SBG chief executive with the primary responsibility for IT, Ben Kruger. The steering committee is tasked with IT governance oversight and is supported by the IT risk and compliance committee, the IT architecture governance committee and several management committees that focus on specific aspects of IT governance.
The CTO provides regular updates to the GRCMC and boardon the status of material IT projects, as well as othergovernance-related matters.
The GRCMC ensures that risks are adequately addressed throughrisk monitoring and assurance processes, and the audit committee considers the impact of IT on financial controls in the annual audit plan. Material findings are reported to the audit committee which monitors remedial actions implemented by management.
Taking into account how IT has evolved in the group and feedback from the 2013 board evaluation process, the board has decided to constitute a new committee, the group IT committee, comprising independent non-executive and executive directors. This committee will be responsible for overseeing IT governance at board level and will report to the board through its chairman.
Governance and transparency Corporate governance report > board of directors continued

111
Our business Our performance Governance andtransparency
Annual financialstatements
Additionalinformation
Board and committees as at 31 December 2013
Summary of key terms of reference, focus areas and the year ahead
Board1 Independent non-executive
director.2 Resigned from the board
on 3 March 2014.3 Executive director.4 Non-executive director.
Chairman
Fred Phaswana1
Members
Doug Band1
Richard Dunne1
Thulani Gcabashe1
Koosum Kalyan1,2
Ben Kruger3
Saki Macozoma4
Kgomotso Moroka1
Chris Nissen1
Simon Ridley3
Myles Ruck1
Lord Smith of Kelvin, KT1
Peter Sullivan1
Sim Tshabalala2
Ted Woods1
Summary of key terms of reference
provides effective leadership based on an ethical foundation
approves the strategy and ensures that the group’s objectives take into account the need to align its strategy and risk profile, together with the performance levels and sustainability concerns of the stakeholders
reviews the corporate governance and risk and capital management processes and ensures that there is an effective risk management process throughout the group
delegates relevant authority to the chief executive and monitors his performance
determines the terms of reference and procedures of all board committees, reviews the board’s and committees’ performance annually, and reviews their reports and minutes
ensures that the audit committee is effective and independent
ensures consideration is given to succession planning for the board, chief executive and executive management
ensures that an adequate budget and planning process exists, measures performance against budgets and plans, and approves annual budgets for the group
considers and approves the annual financial statements and the annual report, results and dividend announcements
monitors stakeholder relations
approves significant acquisitions, mergers, takeovers, divestments of operating companies, equity investments and new strategic alliances
assumes ultimate responsibility for financial and IT governance, operational and internal systems of control, and ensures adequate reporting on these by respective committees.
Summary of key focus areas in 2013
implementation of executive succession plans
IT governance and strategic priorities
financial performance against approved plans and budgets to ensure sustainable profitability
board succession plans also taking into account diversity and appropriate balance between executive and non-executive directors
changes to the group’s governance framework and alignment in the chief executive structure.
The year ahead
continue to implement board succession plans
continue to support the executive team as it embeds the operating model
consider the impact of regulatory changes, including the imminent implementation of the Twin Peaks model of financial regulation
continue to monitor the implementation of the approved IT governance framework
measure progress against strategic objectives
continue to monitor the group’s operational and financial performance
continue to monitor the implementation of the TCF framework.
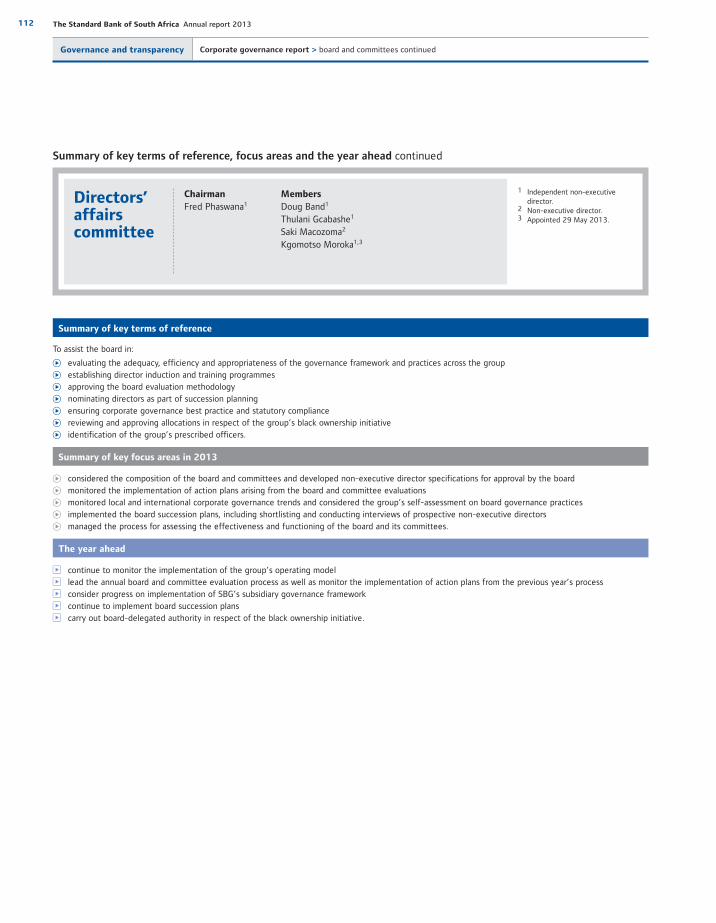
112 The Standard Bank of South Africa Annual report 2013
Governance and transparency Corporate governance report > board and committees continued
Directors’ affairs committee
1 Independent non-executive director.
2 Non-executive director.3 Appointed 29 May 2013.
Chairman
Fred Phaswana1 Members
Doug Band1
Thulani Gcabashe1
Saki Macozoma2
Kgomotso Moroka1,3
Summary of key terms of reference
To assist the board in:
evaluating the adequacy, efficiency and appropriateness of the governance framework and practices across the group
establishing director induction and training programmes
approving the board evaluation methodology
nominating directors as part of succession planning
ensuring corporate governance best practice and statutory compliance
reviewing and approving allocations in respect of the group’s black ownership initiative
identification of the group’s prescribed officers.
Summary of key focus areas in 2013
considered the composition of the board and committees and developed non-executive director specifications for approval by the board
monitored the implementation of action plans arising from the board and committee evaluations
monitored local and international corporate governance trends and considered the group’s self-assessment on board governance practices
implemented the board succession plans, including shortlisting and conducting interviews of prospective non-executive directors
managed the process for assessing the effectiveness and functioning of the board and its committees.
The year ahead
continue to monitor the implementation of the group’s operating model
lead the annual board and committee evaluation process as well as monitor the implementation of action plans from the previous year’s process
consider progress on implementation of SBG’s subsidiary governance framework
continue to implement board succession plans
carry out board-delegated authority in respect of the black ownership initiative.
Summary of key terms of reference, focus areas and the year ahead continued

113
Our business Our performance Governance andtransparency
Annual financialstatements
Additionalinformation
Audit committee
1 Independent non-executive director.
2 Appointed 3 December 2009.3 Appointed 1 May 2008.4 Appointed 1 January 2009.5 Appointed 6 March 2013.6 Appointed 22 May 2008.
Chairman
Richard Dunne1,2
Summary of key terms of reference
Combined assurance model ensures that the group applies a combined assurance model to provide a coordinated approach to all assurance activities.
Financial reporting and financial control reviews the group’s annual financial statements, summarised financial information, dividend announcements and all financial information in the
annual report and recommends to the board for approval evaluates the adequacy and effectiveness of the group’s accounting policies and all proposed changes in accounting policies and practices satisfies itself of the expertise, resources and experience of the group’s finance function and the expertise of the SBG chief financial officer reviews the basis for determination as a going concern reviews the effectiveness of financial management, including the management of financial risks, the quality of internal accounting control systems and
reports produced, including financial reporting risks and internal financial controls reviews the impact of new financial systems, tax and litigation matters on financial reporting.
External audit reviews and approves the group’s external audit plan
assesses the independence and effectiveness of the external auditors on an annual basis
oversees the appointment of external auditors, their terms of engagement and fees
reviews significant differences of opinion between external auditors and management
reviews the external auditors’ management reports concerning deviations from and weaknesses in accounting and operational controls, and ensures that management takes appropriate action to satisfactorily resolve issues
annually reviews and pre-approves the policy setting out the nature and extent for using external auditors for non-audit work.
Internal audit and financial crime reviews, approves and monitors the internal audit plan
reviews and approves the internal audit charter, as per the board’s delegated authority
considers and reviews the internal auditors’ significant findings and management’s response
evaluates annually the role, independence and effectiveness of the internal audit function in the overall context of the group’s risk management system
monitors the maintenance of proper and adequate accounting records and the overall financial and operational environment reviews reports and activities of the financial crime control unit to ensure the mitigation and control of fraud and related risks.
Compliance reviews, approves and monitors the group compliance plan monitors compliance with the Companies Act, Banks Act, the JSE Rules and Listings Requirements, and all other applicable legislations and
governance codes.
Members
Thulani Gcabashe1,3
Lord Smith of Kelvin, KT1,4
Peter Sullivan1,5
Ted Woods1,6
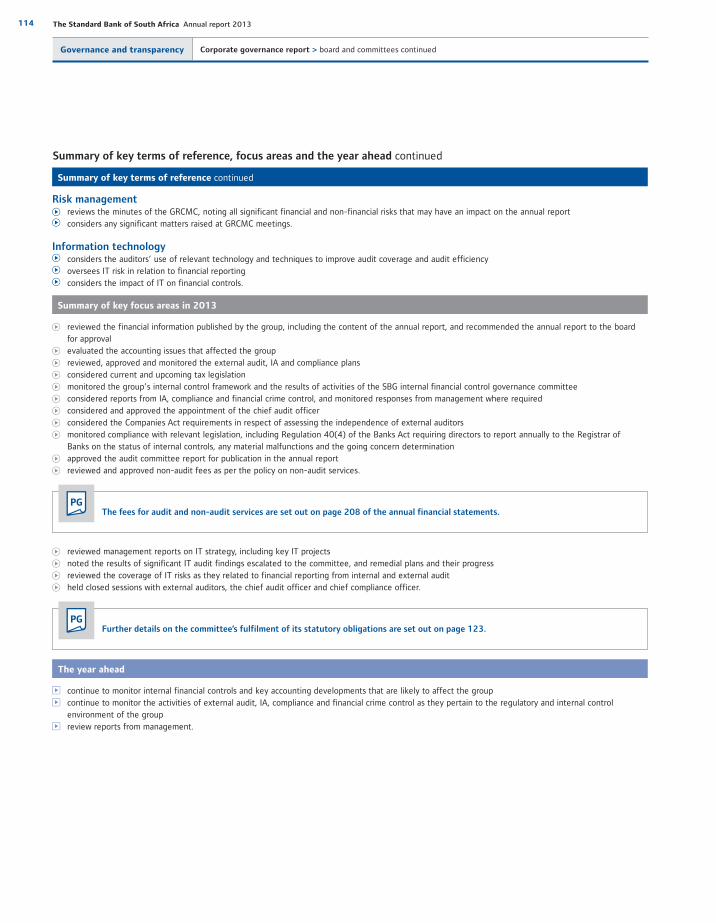
114 The Standard Bank of South Africa Annual report 2013
Summary of key terms of reference continued
Risk management reviews the minutes of the GRCMC, noting all significant financial and non-financial risks that may have an impact on the annual report considers any significant matters raised at GRCMC meetings.
Information technology considers the auditors’ use of relevant technology and techniques to improve audit coverage and audit efficiency oversees IT risk in relation to financial reporting considers the impact of IT on financial controls.
Summary of key focus areas in 2013
reviewed the financial information published by the group, including the content of the annual report, and recommended the annual report to the board for approval
evaluated the accounting issues that affected the group
reviewed, approved and monitored the external audit, IA and compliance plans
considered current and upcoming tax legislation
monitored the group’s internal control framework and the results of activities of the SBG internal financial control governance committee
considered reports from IA, compliance and financial crime control, and monitored responses from management where required
considered and approved the appointment of the chief audit officer
considered the Companies Act requirements in respect of assessing the independence of external auditors
monitored compliance with relevant legislation, including Regulation 40(4) of the Banks Act requiring directors to report annually to the Registrar of Banks on the status of internal controls, any material malfunctions and the going concern determination
approved the audit committee report for publication in the annual report
reviewed and approved non-audit fees as per the policy on non-audit services.
PGThe fees for audit and non-audit services are set out on page 208 of the annual financial statements.
reviewed management reports on IT strategy, including key IT projects
noted the results of significant IT audit findings escalated to the committee, and remedial plans and their progress
reviewed the coverage of IT risks as they related to financial reporting from internal and external audit
held closed sessions with external auditors, the chief audit officer and chief compliance officer.
PGFurther details on the committee’s fulfilment of its statutory obligations are set out on page 123.
The year ahead
continue to monitor internal financial controls and key accounting developments that are likely to affect the group
continue to monitor the activities of external audit, IA, compliance and financial crime control as they pertain to the regulatory and internal control environment of the group
review reports from management.
Summary of key terms of reference, focus areas and the year ahead continued
Governance and transparency Corporate governance report > board and committees continued
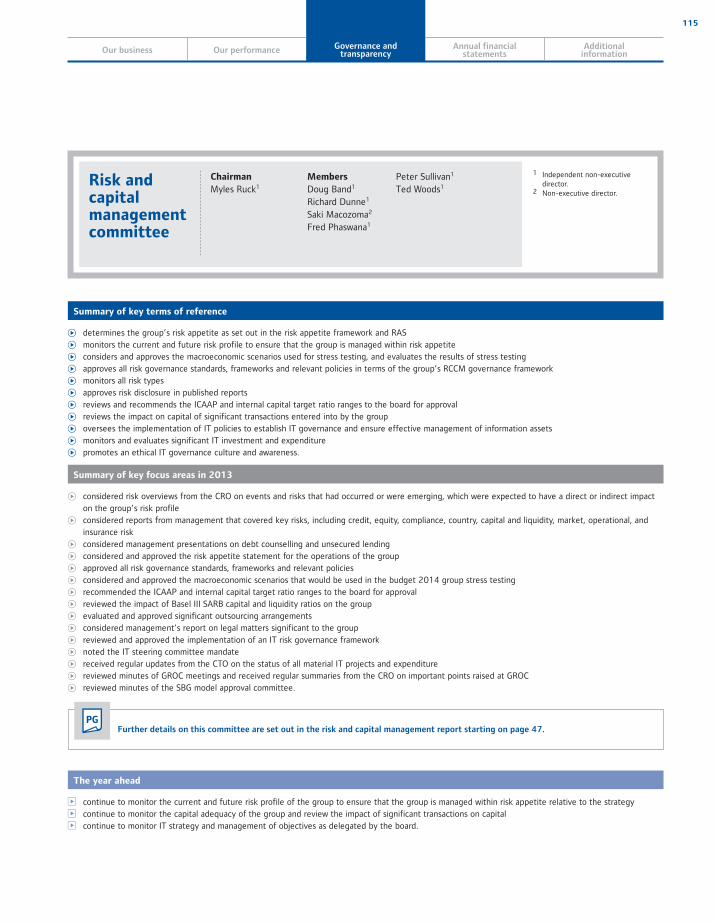
115
Our business Our performance Governance andtransparency
Annual financialstatements
Additionalinformation
Risk and capital management committee
1 Independent non-executive director.
2 Non-executive director.
Chairman
Myles Ruck1
Members
Doug Band1
Richard Dunne1
Saki Macozoma2
Fred Phaswana1
Peter Sullivan1
Ted Woods1
Summary of key terms of reference
determines the group’s risk appetite as set out in the risk appetite framework and RAS
monitors the current and future risk profile to ensure that the group is managed within risk appetite
considers and approves the macroeconomic scenarios used for stress testing, and evaluates the results of stress testing
approves all risk governance standards, frameworks and relevant policies in terms of the group’s RCCM governance framework
monitors all risk types
approves risk disclosure in published reports
reviews and recommends the ICAAP and internal capital target ratio ranges to the board for approval
reviews the impact on capital of significant transactions entered into by the group
oversees the implementation of IT policies to establish IT governance and ensure effective management of information assets
monitors and evaluates significant IT investment and expenditure
promotes an ethical IT governance culture and awareness.
Summary of key focus areas in 2013
considered risk overviews from the CRO on events and risks that had occurred or were emerging, which were expected to have a direct or indirect impact on the group’s risk profile
considered reports from management that covered key risks, including credit, equity, compliance, country, capital and liquidity, market, operational, and insurance risk
considered management presentations on debt counselling and unsecured lending
considered and approved the risk appetite statement for the operations of the group
approved all risk governance standards, frameworks and relevant policies
considered and approved the macroeconomic scenarios that would be used in the budget 2014 group stress testing
recommended the ICAAP and internal capital target ratio ranges to the board for approval
reviewed the impact of Basel III SARB capital and liquidity ratios on the group
evaluated and approved significant outsourcing arrangements
considered management’s report on legal matters significant to the group
reviewed and approved the implementation of an IT risk governance framework
noted the IT steering committee mandate
received regular updates from the CTO on the status of all material IT projects and expenditure
reviewed minutes of GROC meetings and received regular summaries from the CRO on important points raised at GROC
reviewed minutes of the SBG model approval committee.
Further details on this committee are set out in the risk and capital management report starting on page 47.PG
The year ahead
continue to monitor the current and future risk profile of the group to ensure that the group is managed within risk appetite relative to the strategy
continue to monitor the capital adequacy of the group and review the impact of significant transactions on capital
continue to monitor IT strategy and management of objectives as delegated by the board.
116 The Standard Bank of South Africa Annual report 2013
Summary of key terms of reference, focus areas and the year ahead continued
Large exposure credit committee
1 Independent non-executive director.
2 Executive director.
Chairman
Myles Ruck1
Members
Doug Band1
Suné BrugmanCarel BuitendagLibby KingBen Kruger2
David Munro
Fred Phaswana1 Simon Ridley2
Paul SmithSim Tshabalala2
Jeremy Walker
Summary of key terms of reference
ensures compliance with the requirements of the Banks Act Regulations (Regulations) in respect of large exposures as defined to the extent and on the basis as set out in its mandate
approves the counterparty and portfolio definitions of large exposures for the purpose of the committee and the methodology for the determination thereof
approves all counterparty and non-bank large exposures as required in terms of the SARB’s requirements which are subsequently ratified by the board at the next board meeting.
Summary of key focus areas in 2013
considered management reports recommending the approval and annual renewals of large exposures as defined in the Regulations
approved the committee’s mandate.
The year ahead
continue to discharge the board’s responsibility in respect of large exposures
continue to monitor and ensure compliance with the Regulations.
Governance and transparency Corporate governance report > board and committees continued

117
Our business Our performance Governance andtransparency
Annual financialstatements
Additionalinformation
Board and committee meetingsFive board meetings were held during 2013, with one meeting dedicated to reviewing the bank’s strategy.
Board of directors – meeting attendance
Board (including
strategy)Audit
committee
Risk and capital
management committee
Directors’ affairs
committee
Large exposure
credit committee
Number of meetings held 5 6 4 5 5
Attendance
Chairman
Fred Phaswana 5 4 5 3
Deputy chairman
Saki Macozoma¹ 5 4 5
Independent non-executive
directors
Doug Band 5 4 5 5
Richard Dunne 5 6 4
Thulani Gcabashe 5 6 5
Koosum Kalyan 5
Kgomotso Moroka2 5 2
Chris Nissen 5
Cyril Ramaphosa3 1 2
Myles Ruck4 5 4 4
Lord Smith of Kelvin, KT 5 6
Peter Sullivan5 5 4 4
Ted Woods 5 6 4
Executive directors
Ben Kruger6 4 3
Jacko Maree7 1
Simon Ridley 5 5
Sim Tshabalala8 5 4
Peter Wharton-Hood9 2
1 Non-executive director.2 Kgomotso Moroka appointed to directors’ affairs committee on 29 May 2013.3 Cyril Ramaphosa resigned from SBSA on 29 May 2013.4 Recused from SBSA large exposure credit committee meeting in July 2013. 5 Peter Sullivan was appointed to the audit committee and the risk and capital management committee on 6 March 2013.6 Ben Kruger was appointed as director on 7 March 2013.7 Jacko Maree retired as director on 7 March 2013.8 Chief executive.9 Peter Wharton-Hood was appointed as director on 7 March 2013 and resigned as director on 14 August 2013.
Prescribed officersAs set out in the Regulations, a person is a prescribed officer if such person exercises general executive control over and management of the whole, or a significant portion of, the business and activities of the company or regularly participates to a material degree in the exercise of general executive control over and management of the whole, or significant portion, of the activities of the company. Accordingly, the group directors’ affairs committee confirmed the classification of the company’s prescribed officers as envisaged in the Companies Act. Besides the executive directors, namely Ben Kruger, Sim Tshabalala, Simon Ridley, the company’s prescribed officers are:
David Munro, the chief executive for CIB; and
Peter Schlebusch, the chief executive for PBB.
PGDisclosure of remuneration for the prescribed officers is contained in annexure F starting on page 266.

118 The Standard Bank of South Africa Annual report 2013
Group secretary
The board is satisfied that an arm’s length relationship exists between it and the group secretary, Zola Stephen, who is not a member of the board or a prescribed officer of the group.
In addition to guiding the board on discharging its duties and responsibilities, the group secretary keeps the board abreast of relevant changes in legislation and governance best practice.
To enable the board to function effectively, all directors have full and timely access to information that may be relevant in the proper discharge of their duties. This includes information such as corporate announcements, investor communications and other developments that may affect the group and its operations. All directors have access to the services of the group secretary.
The board has assessed the competence, qualifications and experience of the group secretary and concluded that she is competent to carry out her duties.
The board remains responsible for the appointment and the removal of the group secretary.
Ensuring the highest levels of compliance
Complying with all applicable legislation, regulations, standards and codes is integral to the group’s culture and imperative to achieving its strategy. The board delegates responsibility for compliance to management, and monitors this through the compliance function. The regulatory and legislative oversight committee assesses the impact of proposed legislation and regulation, and any material regulatory issues are escalated to GROC and the RCMC.
Oversight of compliance risk management is delegated to the audit committee, which reviews and approves the mandate of the chief compliance officer. The chief compliance officer provides a quarterly report on the status of compliance risk management in the group and significant areas of non-compliance, as well as providing feedbackon interaction with regulators. Internal audit reviews and auditsthe compliance function as well as the compliance policy and governance standards.
Code of banking practiceStandard Bank is a member of BASA. Endorsed by the members of BASA, the codes of banking practice safeguards the interests of consumers. It is based on four key principles: fairness, transparency, accountability and reliability. These principles resonate with the group’s values and will ensure that the FSB’s TCF framework is met when it becomes effective. TCF seeks to create a more meaningful focus on the fair treatment of customers.
An update on the work performed by the group toachieve TCF compliance can be found in the SBG sustainability report.
AIR
Codes of conductStandard Bank is regulated by various codes of conduct in terms of the Financial Advisory and Intermediary Services Act 37 of 2002. This act regulates financial service providers who render advice and/or provide intermediary services to clients in relation to certain financial products.
Standard Bank has also adopted BASA’s code for the selling of unsecured credit, which governs the relationship between banks and customers in respect of credit extension. Regular risk reviews are embedded in the credit function and provide the means to regulate credit risk appetite.
King CodeThe group continues to apply the principles of the King Codewhich adopts an ‘apply or explain’ approach whereby a reasonable explanation for not applying a principle is required. Exceptionsand differences to the application of the King Code are monitoredand reviewed annually, and the board is satisfied with the group’s compliance in this regard. Instances of non-compliance have been considered and explained below.
Exceptions to the application of the King Code
principles Principle 2.19 (paragraph 88.7): King III requires disclosure of
actual or potential political connections or exposure for directors. The group does not discourage directors from being affiliated to political parties and the board believes this contributes to strengthening South Africa’s democracy. Some of the group’s directors are involved in political parties but are not office bearers of any political party in South Africa.
Principle 2.25 (paragraph 153): The board has considered the King Code requirement that non-executive remuneration should comprise a base fee and an attendance fee per meeting, and has agreed that the current fee structure of a single comprehensive annual fee is more appropriate for the group board and committees. It is the group’s view that the contribution of directors cannot only be judged by attendance at board and committee meetings.
Principle 2.25 (paragraph 173): The King Code requires that options or other conditional share awards should not vest or be exercisable within three years from the date of grant. However, the deferred bonus scheme (DBS), which is settled in Standard Bank equity shares, has an initial vesting period shorter than three years. The average vesting period for deferred bonuses is approximately three years.
PG Further information on the DBS can be found inannexure E starting on page 261.
Statement of differences to the King Code Principle 7.1 (paragraph 5): The King Code recommends that the
board approve the internal audit charter. The board has delegated this responsibility to the audit committee.
Governance and transparency Corporate governance report continued

119
Our business Our performance Governance andtransparency
Annual financialstatements
Additionalinformation
Connecting with our stakeholders
The group’s relevance to the markets and societies in which it operates depends on continued and meaningful engagement withall stakeholders. Building and maintaining good stakeholder relationships help us to manage and respond to expectations,minimise reputational risk and form strong partnerships, all of which support commercial sustainability.
Individual business units undertake stakeholder engagement activities appropriate to their particular areas. At group level, the stakeholder relations unit engages with key stakeholders in the public and private sectors. The stakeholder relations forum, comprising business unit managers and executives, meet every second month. It is responsible for facilitating a coordinated approach to stakeholder engagement activities across the group, and ensuring that the group communicates a consistent message based on our code of ethics, values and strategy.
Board meetings include oversight of stakeholder engagement activities as a standing item. The board receives a quarterly stakeholder engagement report that collates input from the group’s business units and provides an overview of activities across the group.
The investor relations department facilitates regular and pertinent communication with the shareholder.
Political party contributions
As part of its commitment to supporting South Africa’s democratic processes, the group makes financial contributions to political parties represented in the National Assembly. In terms of the policy agreed by the board in 2005, fund distributions are based on the Independent Electoral Commission’s funding formula. Parties are required to submit a written report to the group outlining how they have used the
previous year’s donation and the funding policy is reviewed after every general election. In 2010, the board confirmed its commitment to political party funding for the 2010 to 2014 election cycle. The total allocation to political parties for this cycle is R13,5 million, with R2,1 million donated in 2013.
Ethics and organisational integrity
The board aims to provide effective and ethical leadership, and ensure that its conduct and that of management is aligned to the group’s values and code of ethics. The board subscribes to the group’s values and the code. The code is designed to empower employees and enable effective decision-making at all levels of the business according to defined ethical principles and values.
The code of ethics is available on the group’s website at
www.standardbank.com/ethics.aspx
In ensuring that the group operates ethically, the board uses the inclusive stakeholder model of governance that considers and promotes the interests of all the group’s stakeholders.
PG Refer to the section on stakeholder engagement on page 30 for further details.
The group is a member of the Ethics Institute of South Africa, which advances the practice of ethics in South Africa and a number of other countries in Africa. The Ethics Institute has certified that the group’s code meets the highest standards of international best practice. The code is aligned with and supported by other group policies and procedures, and supports compliance with the relevant industry regulations and laws.
Management has set up an ethics management framework in which:
the chief executive and ethics officer are the formal custodians of the code and are ultimately responsible for entrenching it throughoutthe group
each business unit has an ethics officer who is responsible for building awareness of the code and providing guidance on individual ethical concerns that employees may raise
the ethics officers take responsibility for the internal reporting of ethics-related incidents to management and the SBG board of directors through the group social and ethics committee and audit committee
ethical incidents are reported through the ethics and fraud hotline, the group financial crime control unit, the human capital department, the ethics mailbox, business unit ethics officers and line managers
an independent service provider operates a confidential and anonymous hotline on behalf of the group – awareness building and training is provided throughout the organisation to ensure that employees are aware of the ethics reporting options available to them
the group’s values and code are included in leadership and management training, employee orientation programmes and the employee handbook
values and ethics are incorporated in the group’s performance management approach, where team members hold themselves and each other accountable for following the required values-based behaviours.

120 The Standard Bank of South Africa Annual report 2013
Governance and transparency Corporate governance report continued
The group is in the process of developing an e-learning training programme on ethics to be rolled out across the group.
Information on accessibility, anonymity, processes and the policy relating to the whistle-blowing service was published in all business units and geographical publications during the year. Overall, the group’s financial crime control unit held over 1 162 awareness sessions and 856 disclosures were made to the hotline, representing a decrease of 15% compared to 2012.
The ethics line contact details are:
0800 113 443Hotline SA only:
0800 200 796Hotfax SA only:
+27 12 543 1547Hotfax international:
[email protected] international:
The Protection of Personal Information Act 4 of 2013 (PoPI) was signed into law in 2013. While a commencement date for PoPI is yet to be decided, organisations will need to be compliant with the Act within one year of commencement. A groupwide regulatory change management programme to implement PoPI is currently underway within Standard Bank. The group is focused on bringing positive change to the markets in which we operate. As a result, we have a supportive governance framework to enable the highest standardsof responsible business practice in our interactions with allour stakeholders.
Going concern
The board considers and assesses the group’s status as a going concern in the preparation of the annual financial statements at year end. During the interim reporting period, a similar process is followed to enable the board to consider whether or not there is sufficient reason for this conclusion to be affirmed. In addition, the board considers the solvency and liquidity requirements in line with the provisions of the Companies Act.
PG The board’s conclusion regarding the going concern status of the group can be found in the directors’ responsibility for financial reporting on page 122.
Sustainability
The sustainability report sets out a detailed analysis of the sustainability performance for the year and can be found at www.standardbank.com/sustainability
Details on the group’s commitment to transformationcan be found in our sustainability report.
SR

121
Directors’ responsibility for financial reporting 122
Group secretary’s certification 122
Report of the audit committee 123
Directors’ report 125
Independent auditors’ report 127
Statements of financial position 128
Income statements 129
Statements of other comprehensive income 130
Statements of cash flows 131
Statements of changes in equity 132
Accounting policy elections 136
Notes to the annual financial statements 137
Annexure A – detailed accounting policies 229
Annexure B – reclassifications and restatements 244
Annexure C – subsidiaries, consolidated and
unconsolidated structured entities 248
Annexure D – associates and joint ventures 258
Annexure E – equity-linked transactions 261
Annexure F – emoluments and share incentives
of directors and prescribed officers 266
Annexure G – segmental statement of financial position 278
ContentsThe consolidated and separateannual financial statements were audited in terms of the CompaniesAct 71 of 2008.
The preparation of the group’s consolidated and separate annual financial statements was supervised by the chief financial officer, Libby King, BAcc (Wits), BCom (Wits), CA(SA).
A summary of these results were made publicly available on 6 March 2014.
Annual financial statements
122 The Standard Bank of South Africa Annual report 2013
Annual financial statements
Directors’ responsibility forfinancial reporting
Group secretary’s certification
In accordance with the Companies Act, the directors are responsible for the preparation of the annual financial statements. The annual financial statements conform to International Financial Reporting Standards (IFRS) and fairly present the affairs of the company and the group as at 31 December 2013, and the net income and cash flows for the year then ended.
It is the responsibility of the independent auditors to report on the fair presentation of the financial statements.
The directors are ultimately responsible for the internal controls of the company and the group. Management enables the directors to meet these responsibilities. Standards and systems of internal controls are designed and implemented by management to provide reasonable assurance of the integrity and reliability of the financial statements and to adequately safeguard, verify and maintain accountability for shareholder investments, and company and group assets.
Accounting policies supported by judgements, estimates and assumptions in compliance with IFRS, are applied on the basis thatthe company and the group shall continue as a going concern.
Systems and controls include the proper delegation of responsibilities within a clearly defined framework, effective accounting procedures and adequate segregation of duties. Systems and controls are monitored throughout the company and the group. Greater detail of these systems and controls, including the operation of the group’s
Compliance with the Companies Act 71 of 2008In terms of the Companies Act and for the year ended 31 December 2013, I certify that The Standard Bank of South Africa Limited has filed all returns and notices required by the Companies Act with the Companies and Intellectual Property Commission and that all such returns and notices are true, correct and up to date.
Zola StephenGroup secretary
5 March 2014
internal audit function, is provided in the corporate governance and the risk and capital management sections of this annual report.
Based on the information and explanations given by management and the internal auditors, the directors are of the opinion that the internal financial controls are adequate and that the financial records may be relied upon for preparing the financial statements in accordance with IFRS and to maintain accountability for the company and the group’s assets and liabilities. Nothing has come to the attention of the directors to indicate that a breakdown in the functioning of these controls, resulting in material loss to the company and the group,has occurred during the year and up to the date of this report.
The directors have a reasonable expectation that the companyand the group will have adequate resources to continue in operational existence and as a going concern in the financial year ahead.
The 2013 annual financial statements and specified sections of the risk and capital management report were approved by the board of directors on 5 March 2014 and signed on its behalf by:
Fred Phaswana Sim Tshabalala
Chairman Chief executive
5 March 2014 5 March 2014
123
Our business Our performance Governance andtransparency
Annual financialstatements
Additionalinformation
Report of the audit committee
This report is provided by the audit committee, in respect of the 2013 financial year of The Standard Bank of South Africa Limited, in compliance with section 94 of the Companies Act, as amended from time to time, and in terms of the JSE Limited Listings Requirements. The committee’s operation is guided by a detailed mandate that is informed by the Companies Act, the Banks Act 94 of 1990 (Banks Act) and the Code of Corporate Practices and Conduct set out in the King Report on Corporate Governance for South Africa 2009 (King Code) and is approved by the board.
The committee is appointed by the board annually. Information on the membership and composition of the audit committee, its terms of reference and its activities is provided in greater detail in the corporate governance statement.
Execution of functionsThe audit committee has executed its duties and responsibilities during the financial year in accordance with its mandate as it relates to the group’s accounting, internal auditing, internal control and financial reporting practices.
During the year under review the committee, amongst other matters, considered the following:
In respect of the external auditors and the external audit:
approved the reappointment of KPMG Inc. and PricewaterhouseCoopers Inc. as joint external auditors for the financial year ended 31 December 2013, in accordance with all applicable legal requirements
approved the external auditors’ terms of engagement, the audit plan and budgeted audit fees payable
reviewed the audit process and evaluated the effectiveness of the audit
obtained assurance from the external auditors that their independence was not impaired
considered the nature and extent of all non-audit services provided by the external auditors
through the chairman, approved proposed contracts with the external auditors for the provision of non-audit services and pre-approved proposed contracts with the external auditors for the provision of non-audit services above an agreed threshold amount
confirmed that no reportable irregularities were identified and reported by the external auditors in terms of the Auditing Profession Act 26 of 2005
considered reports from subsidiary audit committees and from management through the group’s governance structures on the activities of subsidiary entities.
In respect of the financial statements:
confirmed the going concern principle as the basis of preparation of the interim and annual financial statements
examined and reviewed the interim and annual financial statements prior to submission and approval by the board
reviewed reports on the adequacy of the provisions for performing and non-performing loans and impairment of other assets, and the formulae applied by the group in determining charges for and levels of impairment of performing loans
ensured that the annual financial statements fairly present the financial position of the group and of the company as at the end of the financial year and the results of operations and cash flows for the financial year and considered the basis on which the group and the company was determined to be a going concern
ensured that the annual financial statements conform with IFRS
considered accounting treatments, significant unusual transactions and accounting judgements
considered the appropriateness of the accounting policies adopted and changes thereto
reviewed and discussed the external auditors’ audit report
considered and made recommendations to the board on the interim and final dividend payments to the shareholder
noted that there were no material reports or complaints received concerning accounting practices, internal audit, internal financial controls, content of annual financial statements, internal controls and related matters.
In respect of internal control, internal audit and financial crime control:
reviewed and approved the annual internal audit charterand audit plan and evaluated the independence, effectiveness and performance of the internal audit department and compliance with its charter
considered reports of the internal and external auditors on the group’s systems of internal control, including internal financial controls and maintenance of effective internal control systems
reviewed significant issues raised by the internal audit processes and the adequacy of corrective action in responseto such findings
noted that there were no significant differences of opinion between the internal audit function and management
assessed the adequacy of the performance of the internal audit function and adequacy of the available internal audit resources and found them to be satisfactory
received assurance that proper and adequate accounting records were maintained and that the systems safeguardedthe assets against unauthorised use or disposal thereof
based on the above, the committee formed the opinion that, at the date of this report, there were no material breakdowns in internal control, including internal financial controls, resulting in any material loss to the group
reviewed and approved the mandate of financial crime as an independent risk function
discussed significant financial crime matters and control weaknesses identified
124 The Standard Bank of South Africa Annual report 2013
Annual financial statements Report of the audit committee continued
over the course of the year, met with the chief audit officer, group chief compliance officer, the group chief risk officer, the head of financial crime control, management and the external auditors
reviewed any significant legal and tax matters that could have a material impact on the financial statements.
In respect of legal, regulatory and compliance requirements:
reviewed, with management, matters that could have a material impact on the group
monitored compliance with the Companies Act, the Banks Act, all other applicable legislation and governance codes and reviewed reports from internal audit, external auditors and compliance detailing the extent of this
noted that no complaints were received through the group’s ethics and fraud hotline concerning accounting matters, internal audit, internal financial controls, contents of financial statements, potential violations of the law and questionable accounting or auditing matters
reviewed and approved the annual compliance mandate and compliance plan.
In respect of risk management and IT:
considered and reviewed reports from management on risk management, including fraud and IT risks as they pertain to financial reporting and the going concern assessment
the chairman is a member of and attended the risk and capital management committee meetings held during the year under review.
In respect of the coordination of assurance activities, the committee:
reviewed the plans and work outputs of the external and internal auditors as well as compliance and financial crime control, and concluded that these were adequate to address all significant financial risks facing the business
considered the expertise, resources and experience of the finance function and the senior members of management responsible for this function and concluded that these were appropriate
considered the appropriateness of the experience and expertise of SBG’s chief financial officer and concluded that these were appropriate.
Independence of the external auditorsThe audit committee is satisfied that KPMG Inc. and PricewaterhouseCoopers Inc. are independent of the group. This conclusion was arrived at, inter alia, after taking into account the following factors:
the representations made by KPMG Inc. and PricewaterhouseCoopers Inc. to the audit committee
the auditors do not, except as external auditors or in rendering permitted non-audit services, receive any remuneration or other benefits from the group
the auditors’ independence was not impaired by any consultancy, advisory or other work undertaken by the auditors
the auditors’ independence was not prejudiced as a result of any previous appointment as auditor
the criteria specified for independence by the Independent Regulatory Board for Auditors and international regulatory bodies were met.
The audit committee has reviewed the annual report and recommended it to the board for approval.
In conclusion, the audit committee has complied with its legal, regulatory and governance responsibilities as set out in its mandate.
On behalf of the audit committee
Richard DunneChairman, audit committee
5 March 2014

125
Our business Our performance Governance andtransparency
Annual financialstatements
Additionalinformation
Directors’ reportfor the year ended 31 December 2013
Nature of businessThe Standard Bank of South Africa Limited (SBSA) is a wholly-owned subsidiary of Standard Bank Group Limited, an African banking group with South African roots. SBSA is the single largest operating entity within the Standard Bank Group (SBG).
SBSA results
PG A general review of the business and its operationsis provided in the chief executive’s review starting on page 8.
PG A financial review of the results of SBSA for the year is provided on pages 14 to 23.
Property and equipmentThere was no change in the nature of the fixed assets of SBSA or in the policy regarding their use during the year.
Share capital
Ordinary sharesDuring 2013, one ordinary share (2012: three) was issued at a total premium of R1,1 billion (2012: R7 966 million).
Directors’ and prescribed officers’ interest
in sharesAt the date of this report, no directors and prescribed officers held, directly and indirectly, interests in the company’s ordinary issued share capital and preference share capital of SBSA.
Equity compensation plans
PG Information on options or rights granted to executive directors under the equity compensation plans is given in annexure E starting on page 261.
Directors’ and prescribed officers’ emoluments
and share incentives
PG Directors’ and prescribed officers’ emoluments are disclosed in annexure F starting on page 266.
PG Information relating to the determination of directors’ and prescribed officers’ share incentive allocations and related matters is contained in annexure F starting on page 270.
Shareholder analysisThe company is a wholly-owned subsidiary of Standard Bank Group Limited.
Dividends to the shareholder
Ordinary sharesOn 6 March 2013, a dividend of R1,0 billion was declared to the shareholder recorded at the close of business on 2 April 2013, and paid on 2 April 2013.
On 14 August 2013, a dividend of R2,1 billion was declared to the shareholder recorded at the close of business on 2 September 2013, and paid on 2 September 2013.
On 5 March 2014, a dividend of R4,3 billion was declared to the shareholder recorded at the close of business on 6 March 2014, and payable on 31 March 2014.
Board of directors
PG The directorate is listed in this annual report on pages 103 to 106.
The following changes in directorate have taken place during the financial year ended 31 December 2013:
The Standard Bank of South Africa Limited
Appointments
PD Sullivan as director 15 January 2013BJ Kruger as director 7 March 2013PG Wharton-Hood as director 7 March 2013
Retirements
JH Maree as director 7 March 2013MC Ramaphosa as director 30 May 2013
Resignation
PG Wharton-Hood as director 14 August 2013
Group secretary and registered officeThe group secretary is Zola Stephen. The address of the group secretary is that of the registered office, 9th floor, Standard Bank Centre, 5 Simmonds Street, Johannesburg, 2001.
126 The Standard Bank of South Africa Annual report 2013
Annual financial statements Directors’ report continued
Management by third partiesNone of the businesses of the company or its subsidiaries had, during the financial year, been managed by a third party or a company in which a director had an interest.
A company in which Doug Band, a director of the group, has a beneficial interest, provided consulting and certain management services to the capital division of SBSA for a five-year period until 31 December 2004. In terms of the agreement, in future years, he will receive a percentage of the proceeds from the sale of equity-related investments undertaken during the term of the above management services agreement.
PG Further details can be found in the directors’ emoluments disclosure in annexure F staring on page 266.
Subsidiaries, associates and joint ventures
PG The interests in subsidiary, associated and joint venture companies, where considered material in the light ofthe group’s financial position and results, are set out in annexure C on page 248 and annexure D starting onpage 258 respectively.
ContractsSaki Macozoma, a director and deputy chairman of the company, has an effective shareholding of 28.40% (2012: 26.62%) in Safika which is a member of three different consortia that were party to the Andisa Capital and the Tutuwa transactions. Safika holds effective interests of 2.39% (2012: 2.39%) in Liberty Holdings Limited and 1.34% (2012: 1.34%) in Standard Bank Group Limited. SBG has an effective interest of 26.67% (2012: 25.00%) in Safika.
InsuranceThe group protects itself against loss by maintaining banker’s comprehensive crime and professional indemnity cover. The insurance terms and conditions are reviewed by the group insurance committee annually to ensure they are ’fit for purpose’ against the group’s risk exposures.
Events subsequent to balance sheet date
Director resignationOn 3 March 2014, Koosum Kalyan resigned as a non-executive director of Standard Bank Group Limited and The Standard Bankof South Africa Limited.
127
Our business Our performance Governance andtransparency
Annual financialstatements
Additionalinformation
Independent auditors’ report
To the shareholder of The Standard Bank
of South Africa LimitedWe have audited the consolidated group and separate company financial statements of The Standard Bank of South Africa Limited which comprise the statements of financial position as at 31 December 2013, and the income statements and statements of comprehensive income, changes in equity and cash flows for the year then ended and a summary of significant accounting policies and notes to the financial statements, as set out on pages 128 to 277, and specified sections marked as ’audited’ in the risk and capital management report contained within pages 46 to 100.
Directors’ responsibility for the financial statementsThe company’s directors are responsible for the preparation andfair presentation of these financial statements in accordance with International Financial Reporting Standards, and the requirementsof the Companies Act of South Africa, and for such internal controlas the directors determine is necessary to enable the preparationof financial statements that are free from material misstatement, whether due to fraud or error.
Auditors’ responsibilityOur responsibility is to express an opinion on these financial statements based on our audit. We conducted our audit in accordance with International Standards on Auditing. Those standards require that we comply with ethical requirements and plan and perform the audit to obtain reasonable assurance about whether the financial statements are free from material misstatements.
An audit involves performing procedures to obtain audit evidence about the amounts and disclosures in the financial statements. The procedures selected depend on the auditors’ judgement, including the assessment of the risks of material misstatement of the financial statements, whether due to fraud or error. In making those risk assessments, the auditors consider internal control relevant to the entity’s preparation and fair presentation of the financial statements in order to design audit procedures that are appropriate in the circumstances, but not for the purpose of expressing an opinion on the effectiveness of the entity’s internal control. An audit also includes evaluating the appropriateness of accounting policies used and the reasonableness of accounting estimates made by management, as well as evaluating the overall presentation of the financial statements.
We believe that the audit evidence we have obtained is sufficient and appropriate to provide a basis for our audit opinion.
OpinionIn our opinion, the consolidated and separate financial statements present fairly, in all material respects, the consolidated and separate financial position of The Standard Bank of South Africa Limited as at 31 December 2013, its consolidated and separate financial performance, and its consolidated and separate cash flows for theyear then ended in accordance with International Financial Reporting Standards, and the requirements of the Companies Act ofSouth Africa.
Other reports required by the Companies ActAs part of our audit of the financial statements for the year ended 31 December 2013, we have read the directors’ report, the report of the group audit committee and the group secretary’s certificate for the purpose of identifying whether there are material inconsistencies between these reports and the audited financial statements. These reports are the responsibility of the respective preparers. Based on reading these reports we have not identified material inconsistencies between these reports and the audited financial statements. However, we have not audited these reports and accordingly do not express an opinion on these reports.
KPMG Inc. PricewaterhouseCoopers Inc.
Registered Auditor Registered Auditor
Per Peter MacDonald Per Johannes GrosskopfChartered Accountant (SA) Chartered Accountant (SA)Registered Auditor Registered AuditorDirector Director5 March 2014 5 March 2014
85 Empire Road 2 Eglin RoadParktown Sunninghill2193 2157
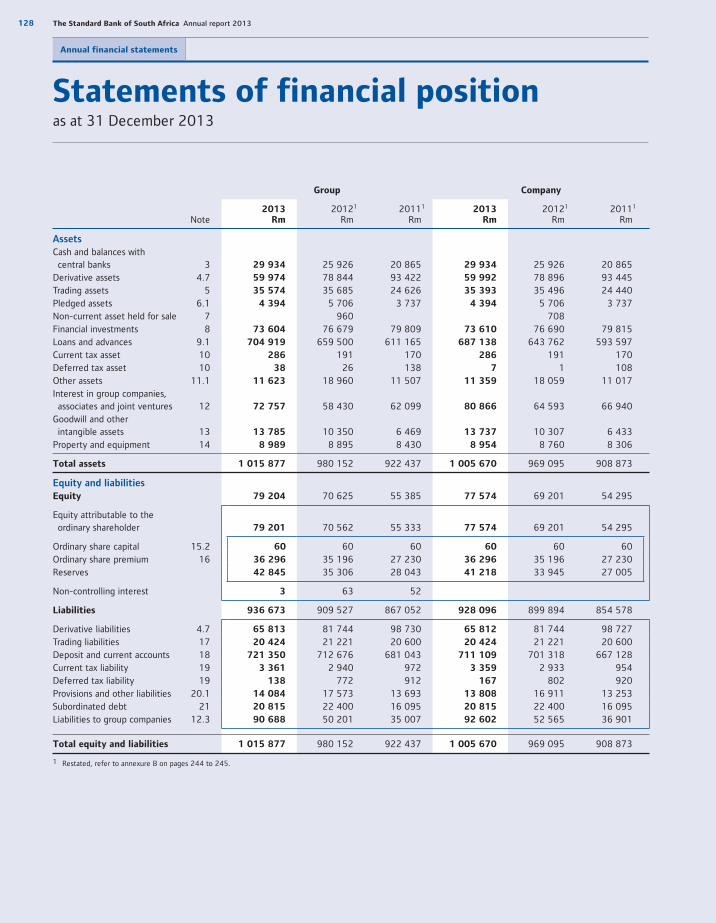
128 The Standard Bank of South Africa Annual report 2013
Annual financial statements
Statements of financial positionas at 31 December 2013
Group Company
Note2013
Rm20121
Rm20111
Rm2013
Rm20121
Rm20111
Rm
Assets
Cash and balances with central banks 3 29 934 25 926 20 865 29 934 25 926 20 865Derivative assets 4.7 59 974 78 844 93 422 59 992 78 896 93 445Trading assets 5 35 574 35 685 24 626 35 393 35 496 24 440Pledged assets 6.1 4 394 5 706 3 737 4 394 5 706 3 737Non-current asset held for sale 7 960 708Financial investments 8 73 604 76 679 79 809 73 610 76 690 79 815Loans and advances 9.1 704 919 659 500 611 165 687 138 643 762 593 597Current tax asset 10 286 191 170 286 191 170Deferred tax asset 10 38 26 138 7 1 108Other assets 11.1 11 623 18 960 11 507 11 359 18 059 11 017Interest in group companies, associates and joint ventures 12 72 757 58 430 62 099 80 866 64 593 66 940Goodwill and other intangible assets 13 13 785 10 350 6 469 13 737 10 307 6 433Property and equipment 14 8 989 8 895 8 430 8 954 8 760 8 306
Total assets 1 015 877 980 152 922 437 1 005 670 969 095 908 873
Equity and liabilities
Equity 79 204 70 625 55 385 77 574 69 201 54 295
Equity attributable to the ordinary shareholder 79 201 70 562 55 333 77 574 69 201 54 295
Ordinary share capital 15.2 60 60 60 60 60 60Ordinary share premium 16 36 296 35 196 27 230 36 296 35 196 27 230Reserves 42 845 35 306 28 043 41 218 33 945 27 005
Non-controlling interest 3 63 52
Liabilities 936 673 909 527 867 052 928 096 899 894 854 578
Derivative liabilities 4.7 65 813 81 744 98 730 65 812 81 744 98 727Trading liabilities 17 20 424 21 221 20 600 20 424 21 221 20 600Deposit and current accounts 18 721 350 712 676 681 043 711 109 701 318 667 128Current tax liability 19 3 361 2 940 972 3 359 2 933 954Deferred tax liability 19 138 772 912 167 802 920Provisions and other liabilities 20.1 14 084 17 573 13 693 13 808 16 911 13 253Subordinated debt 21 20 815 22 400 16 095 20 815 22 400 16 095Liabilities to group companies 12.3 90 688 50 201 35 007 92 602 52 565 36 901
Total equity and liabilities 1 015 877 980 152 922 437 1 005 670 969 095 908 873
1 Restated, refer to annexure B on pages 244 to 245.
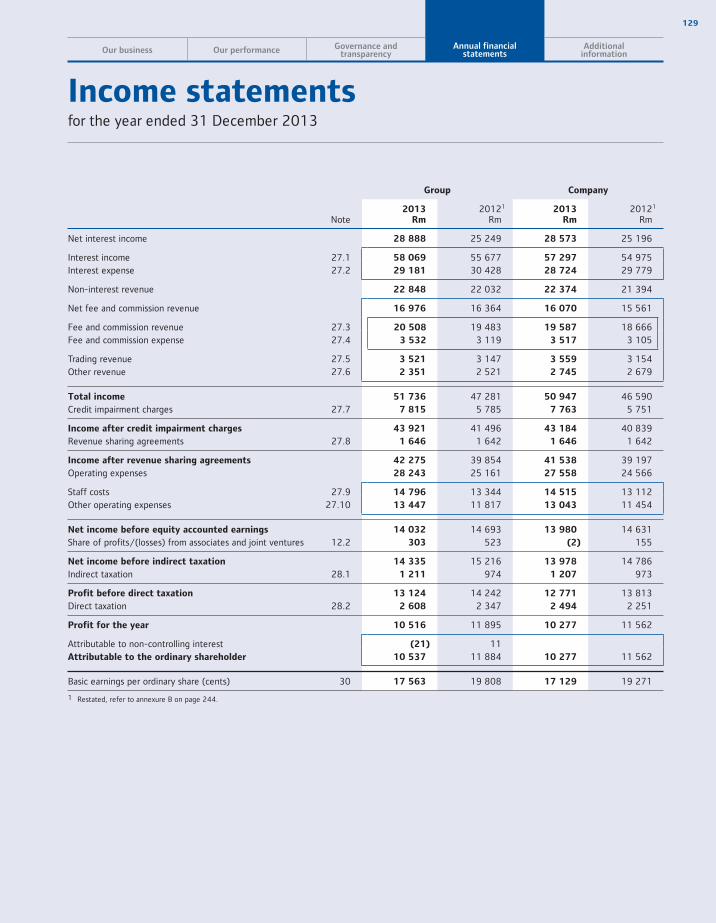
129
Our business Our performance Governance andtransparency
Annual financialstatements
Additionalinformation
Income statementsfor the year ended 31 December 2013
Group Company
Note2013
Rm20121
Rm2013
Rm20121
Rm
Net interest income 28 888 25 249 28 573 25 196
Interest income 27.1 58 069 55 677 57 297 54 975Interest expense 27.2 29 181 30 428 28 724 29 779
Non-interest revenue 22 848 22 032 22 374 21 394
Net fee and commission revenue 16 976 16 364 16 070 15 561
Fee and commission revenue 27.3 20 508 19 483 19 587 18 666Fee and commission expense 27.4 3 532 3 119 3 517 3 105
Trading revenue 27.5 3 521 3 147 3 559 3 154Other revenue 27.6 2 351 2 521 2 745 2 679
Total income 51 736 47 281 50 947 46 590Credit impairment charges 27.7 7 815 5 785 7 763 5 751
Income after credit impairment charges 43 921 41 496 43 184 40 839Revenue sharing agreements 27.8 1 646 1 642 1 646 1 642
Income after revenue sharing agreements 42 275 39 854 41 538 39 197Operating expenses 28 243 25 161 27 558 24 566
Staff costs 27.9 14 796 13 344 14 515 13 112Other operating expenses 27.10 13 447 11 817 13 043 11 454
Net income before equity accounted earnings 14 032 14 693 13 980 14 631Share of profits/(losses) from associates and joint ventures 12.2 303 523 (2) 155
Net income before indirect taxation 14 335 15 216 13 978 14 786Indirect taxation 28.1 1 211 974 1 207 973
Profit before direct taxation 13 124 14 242 12 771 13 813Direct taxation 28.2 2 608 2 347 2 494 2 251
Profit for the year 10 516 11 895 10 277 11 562
Attributable to non-controlling interest (21) 11Attributable to the ordinary shareholder 10 537 11 884 10 277 11 562
Basic earnings per ordinary share (cents) 30 17 563 19 808 17 129 19 271
1 Restated, refer to annexure B on page 244.
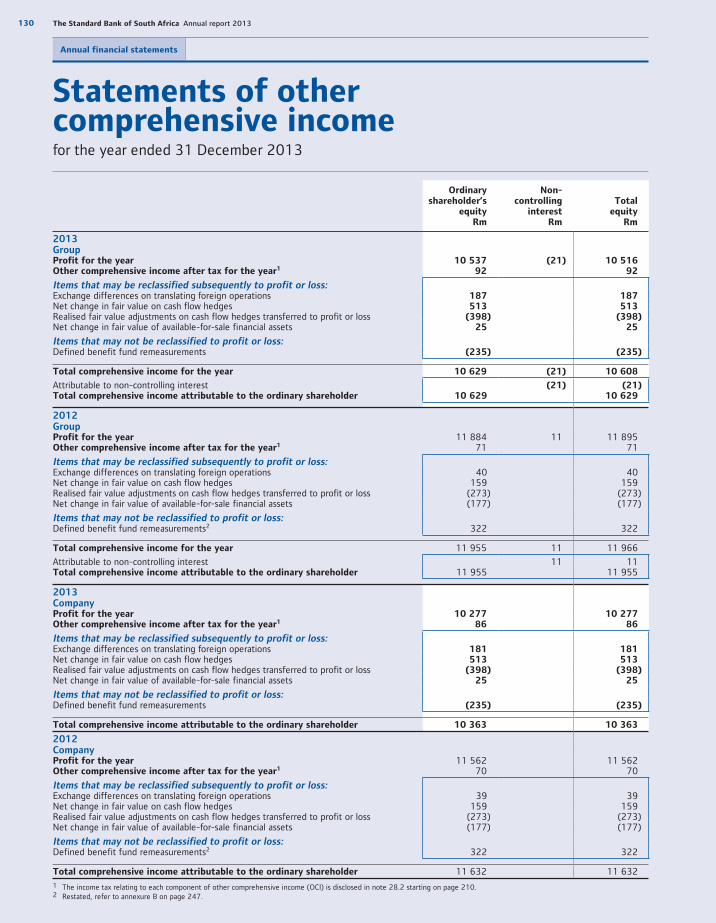
130 The Standard Bank of South Africa Annual report 2013
Annual financial statements
Statements of othercomprehensive incomefor the year ended 31 December 2013
Ordinaryshareholder’s
equityRm
Non-controlling
interestRm
Total equity
Rm
2013GroupProfit for the year 10 537 (21) 10 516Other comprehensive income after tax for the year1 92 92
Items that may be reclassified subsequently to profit or loss:Exchange differences on translating foreign operations 187 187Net change in fair value on cash flow hedges 513 513Realised fair value adjustments on cash flow hedges transferred to profit or loss (398) (398)Net change in fair value of available-for-sale financial assets 25 25
Items that may not be reclassified to profit or loss:Defined benefit fund remeasurements (235) (235)
Total comprehensive income for the year 10 629 (21) 10 608
Attributable to non-controlling interest (21) (21)Total comprehensive income attributable to the ordinary shareholder 10 629 10 629
2012GroupProfit for the year 11 884 11 11 895Other comprehensive income after tax for the year1 71 71
Items that may be reclassified subsequently to profit or loss:Exchange differences on translating foreign operations 40 40Net change in fair value on cash flow hedges 159 159Realised fair value adjustments on cash flow hedges transferred to profit or loss (273) (273)Net change in fair value of available-for-sale financial assets (177) (177)
Items that may not be reclassified to profit or loss:Defined benefit fund remeasurements2 322 322
Total comprehensive income for the year 11 955 11 11 966
Attributable to non-controlling interest 11 11Total comprehensive income attributable to the ordinary shareholder 11 955 11 955
2013CompanyProfit for the year 10 277 10 277Other comprehensive income after tax for the year1 86 86
Items that may be reclassified subsequently to profit or loss:Exchange differences on translating foreign operations 181 181Net change in fair value on cash flow hedges 513 513Realised fair value adjustments on cash flow hedges transferred to profit or loss (398) (398)Net change in fair value of available-for-sale financial assets 25 25
Items that may not be reclassified to profit or loss:Defined benefit fund remeasurements (235) (235)
Total comprehensive income attributable to the ordinary shareholder 10 363 10 363
2012CompanyProfit for the year 11 562 11 562Other comprehensive income after tax for the year1 70 70
Items that may be reclassified subsequently to profit or loss:Exchange differences on translating foreign operations 39 39Net change in fair value on cash flow hedges 159 159Realised fair value adjustments on cash flow hedges transferred to profit or loss (273) (273)Net change in fair value of available-for-sale financial assets (177) (177)
Items that may not be reclassified to profit or loss:Defined benefit fund remeasurements2 322 322
Total comprehensive income attributable to the ordinary shareholder 11 632 11 632
1 The income tax relating to each component of other comprehensive income (OCI) is disclosed in note 28.2 starting on page 210.2 Restated, refer to annexure B on page 247.
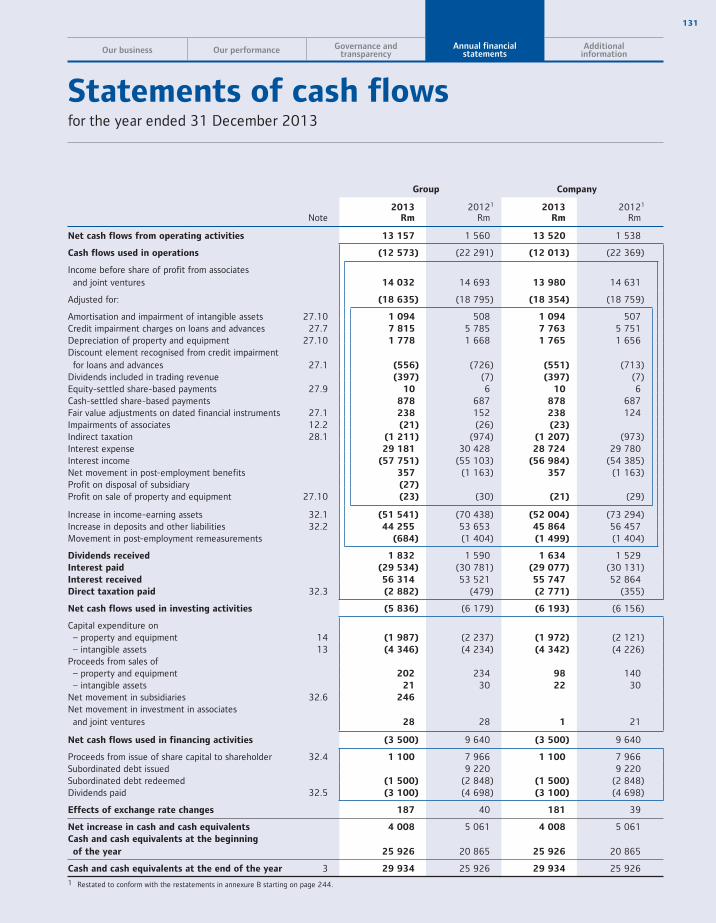
131
Our business Our performance Governance andtransparency
Annual financialstatements
Additionalinformation
Statements of cash flowsfor the year ended 31 December 2013
Group Company
Note2013
Rm20121
Rm2013
Rm20121
Rm
Net cash flows from operating activities 13 157 1 560 13 520 1 538
Cash flows used in operations (12 573) (22 291) (12 013) (22 369)
Income before share of profit from associates and joint ventures 14 032 14 693 13 980 14 631
Adjusted for: (18 635) (18 795) (18 354) (18 759)
Amortisation and impairment of intangible assets 27.10 1 094 508 1 094 507Credit impairment charges on loans and advances 27.7 7 815 5 785 7 763 5 751Depreciation of property and equipment 27.10 1 778 1 668 1 765 1 656Discount element recognised from credit impairment for loans and advances 27.1 (556) (726) (551) (713)Dividends included in trading revenue (397) (7) (397) (7)Equity-settled share-based payments 27.9 10 6 10 6Cash-settled share-based payments 878 687 878 687Fair value adjustments on dated financial instruments 27.1 238 152 238 124Impairments of associates 12.2 (21) (26) (23)
Indirect taxation 28.1 (1 211) (974) (1 207) (973)Interest expense 29 181 30 428 28 724 29 780Interest income (57 751) (55 103) (56 984) (54 385)Net movement in post-employment benefits 357 (1 163) 357 (1 163)Profit on disposal of subsidiary (27)
Profit on sale of property and equipment 27.10 (23) (30) (21) (29)
Increase in income-earning assets 32.1 (51 541) (70 438) (52 004) (73 294)Increase in deposits and other liabilities 32.2 44 255 53 653 45 864 56 457Movement in post-employment remeasurements (684) (1 404) (1 499) (1 404)
Dividends received 1 832 1 590 1 634 1 529Interest paid (29 534) (30 781) (29 077) (30 131)Interest received 56 314 53 521 55 747 52 864Direct taxation paid 32.3 (2 882) (479) (2 771) (355)
Net cash flows used in investing activities (5 836) (6 179) (6 193) (6 156)
Capital expenditure on – property and equipment 14 (1 987) (2 237) (1 972) (2 121) – intangible assets 13 (4 346) (4 234) (4 342) (4 226)Proceeds from sales of – property and equipment 202 234 98 140 – intangible assets 21 30 22 30Net movement in subsidiaries 32.6 246
Net movement in investment in associates and joint ventures 28 28 1 21
Net cash flows used in financing activities (3 500) 9 640 (3 500) 9 640
Proceeds from issue of share capital to shareholder 32.4 1 100 7 966 1 100 7 966Subordinated debt issued 9 220 9 220Subordinated debt redeemed (1 500) (2 848) (1 500) (2 848)Dividends paid 32.5 (3 100) (4 698) (3 100) (4 698)
Effects of exchange rate changes 187 40 181 39
Net increase in cash and cash equivalents 4 008 5 061 4 008 5 061Cash and cash equivalents at the beginning
of the year 25 926 20 865 25 926 20 865
Cash and cash equivalents at the end of the year 3 29 934 25 926 29 934 25 926
1 Restated to conform with the restatements in annexure B starting on page 244.

132 The Standard Bank of South Africa Annual report 2013
Annual financial statements
Statement of changes in equityfor the year ended 31 December 2013
Note
Ordinaryshare capitaland premium
Rm
Foreigncurrency
translationreserve1
Rm
Group
Balance at 1 January 2012 as previously reported 27 290 143Restatement of opening equity balances5
Balance at 1 January 2012 – restated 27 290 143Total comprehensive income/(loss) for the year 40
Profit for the yearOther comprehensive income/(loss) after tax for the year 40
Transactions with the shareholder, recorded directly in equity 7 966
Equity-settled share-based payment transactionsIssue of share capital and share premium 15.2 7 966Dividends paid 31
Balance at 31 December 2012 35 256 183
Balance at 1 January 2013 35 256 183
Total comprehensive income for the year 187
Profit for the yearOther comprehensive income/(loss) after tax for the year 187
Transactions with the shareholder, recorded directly in equity 1 100
Equity-settled share-based payment transactionsTransfer of vested equity optionsIssue of share capital and share premium 15.2 1 100
Disposal of subsidiaryDividends paid 31
Balance at 31 December 2013 36 356 370
Details relating to each reserve are provided in the accounting policy and notes described below:1 Refer to accounting policy 2 – Foreign currency translations starting on page 230.2 Refer to the cash flow hedges section in accounting policy 4 – Financial instruments on page 231.3 Refer to the available-for-sale financial assets section in accounting policy 4 – Financial instruments on page 231.4 Refer to accounting policy 18 – Equity-linked transactions starting on page 241.5 Restated to conform with the restatements in annexure B starting on page 244.
All balances are stated net of applicable tax.
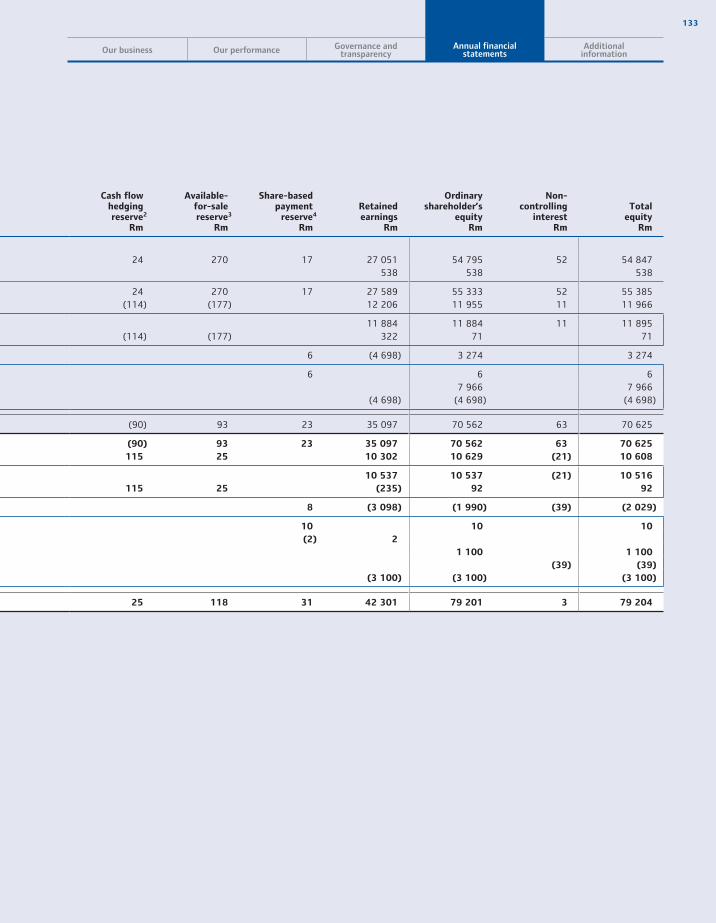
133
Our business Our performance Governance andtransparency
Annual financialstatements
Additionalinformation
Cash flowhedgingreserve2
Rm
Available-for-salereserve3
Rm
Share-based payment
reserve4
Rm
Retainedearnings
Rm
Ordinaryshareholder’s
equityRm
Non-controlling
interestRm
Total equity
Rm
24 270 17 27 051 54 795 52 54 847538 538 538
24 270 17 27 589 55 333 52 55 385(114) (177) 12 206 11 955 11 11 966
11 884 11 884 11 11 895(114) (177) 322 71 71
6 (4 698) 3 274 3 274
6 6 67 966 7 966
(4 698) (4 698) (4 698)
(90) 93 23 35 097 70 562 63 70 625
(90) 93 23 35 097 70 562 63 70 625
115 25 10 302 10 629 (21) 10 608
10 537 10 537 (21) 10 516
115 25 (235) 92 92
8 (3 098) (1 990) (39) (2 029)
10 10 10
(2) 2
1 100 1 100
(39) (39)
(3 100) (3 100) (3 100)
25 118 31 42 301 79 201 3 79 204

134 The Standard Bank of South Africa Annual report 2013
Annual financial statements
Statement of changes in equityfor the year ended 31 December 2013
Note
Ordinaryshare capitaland premium
Rm
Company
Balance at 1 January 2012 as previously reported 27 290Restatement of opening equity balances5
Balance at 1 January 2012 – restated 27 290Total comprehensive income/(loss) for the year
Profit for the yearOther comprehensive income/(loss) after tax for the year
Transactions with the shareholder, recorded directly in equity 7 966
Equity-settled share-based payment transactionsIssue of share capital and share premium 15.2 7 966Dividends paid 31
Balance at 31 December 2012 35 256
Balance at 1 January 2013 35 256
Total comprehensive income for the year
Profit for the yearOther comprehensive income/(loss) after tax for the year
Transactions with the shareholder, recorded directly in equity 1 100
Equity-settled share-based payment transactionsTransfer of vested equity optionsIssue of share capital and share premium 15.2 1 100
Dividends paid 31
Balance at 31 December 2013 36 356
Details relating to each reserve are provided in the accounting policy and notes described below:1 Refer to accounting policy 2 – Foreign currency translations starting on page 230.2 Refer to the cash flow hedges section in accounting policy 4 – Financial instruments on page 231.3 Refer to the available-for-sale financial assets section in accounting policy 4 – Financial instruments on page 231.4 Refer to accounting policy 18 – Equity-linked transactions starting on page 241.5 Restated to conform with restatements in annexure B starting on page 244.
All balances are stated net of applicable tax.
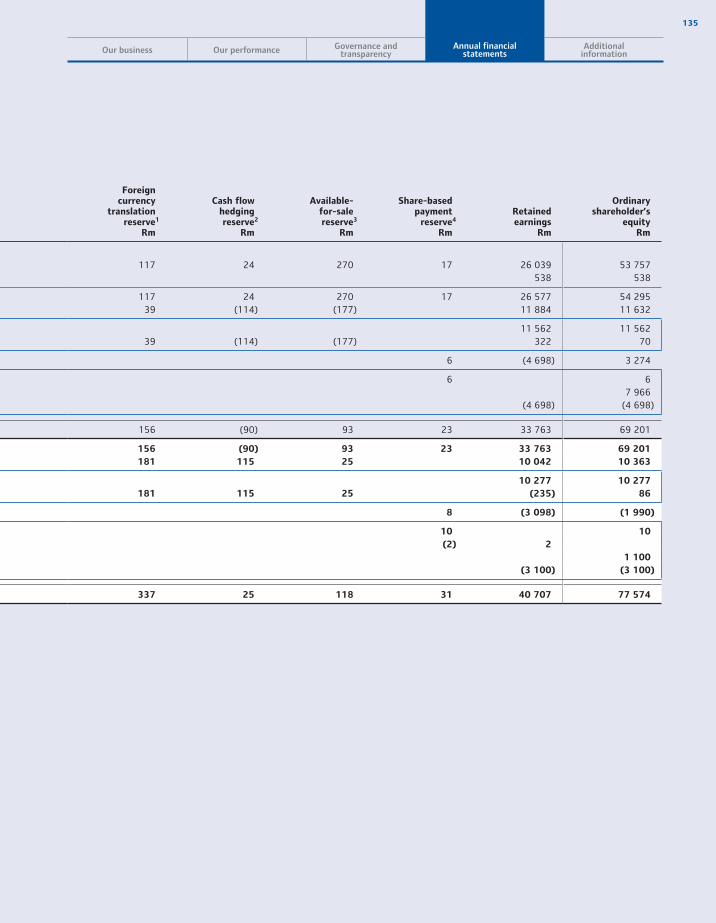
135
Our business Our performance Governance andtransparency
Annual financialstatements
Additionalinformation
Foreigncurrency
translationreserve1
Rm
Cash flowhedgingreserve2
Rm
Available-for-salereserve3
Rm
Share-basedpayment
reserve4
Rm
Retainedearnings
Rm
Ordinaryshareholder’s
equityRm
117 24 270 17 26 039 53 757538 538
117 24 270 17 26 577 54 29539 (114) (177) 11 884 11 632
11 562 11 56239 (114) (177) 322 70
6 (4 698) 3 274
6 67 966
(4 698) (4 698)
156 (90) 93 23 33 763 69 201
156 (90) 93 23 33 763 69 201
181 115 25 10 042 10 363
10 277 10 277
181 115 25 (235) 86
8 (3 098) (1 990)
10 10
(2) 2
1 100
(3 100) (3 100)
337 25 118 31 40 707 77 574
136 The Standard Bank of South Africa Annual report 2013
Annual financial statements
Accounting policy elections
The principal accounting policies applied in the presentation of the group and company’s annual financial statements are set out below.
Basis of preparationThe consolidated and separate annual financial statements are prepared in accordance with IFRS as issued by the International Accounting Standards Board (IASB), its interpretations adopted by the IASB, the South African Institute of Chartered Accountants (SAICA) Financial Reporting Guides as issued by the Accounting Practices Committee, Listings Requirements of the JSE, and the South African Companies Act. The annual financial statements have been prepared on the historical cost basis except for the following material items in the statement of financial position:
available-for-sale financial assets, financial assets and liabilities at fair value through profit or loss and liabilities for cash-settled share-based payment arrangements
post-employment benefit obligations that are measured in terms of the projected unit credit method.
The following principal accounting policy elections in terms of IFRS have been made, with reference to the detailed accounting policies shown in brackets:
purchases and sales of financial assets under a contract whose terms require delivery of the asset within the time frame established generally by regulation or convention in the marketplace concerned, are recognised and derecognised using trade date accounting (accounting policy 4)
cumulative gains and losses recognised in OCI in terms of a cash flow hedge relationship are transferred from OCI and included in the initial measurement of the non-financial asset or liability (accounting policy 4)
commodities acquired principally for the purpose of selling in the near future or generating a profit from fluctuation in price or broker-traders’ margin are measured at fair value less cost to sell (accounting policy 4)
intangible assets and property and equipment are accounted for using the cost model (accounting policy 6 and 7)
the portfolio exception to measure the fair value of certaingroups of financial assets and financial liabilities on a net basis (accounting policy 16).
Functional and presentation currencyThe annual financial statements are presented in South African rand, which is the functional and presentation currency of the company. All amounts are stated in millions of rand (Rm), unless indicated otherwise.
Changes in accounting policiesThe accounting policies are consistent with those reported in the previous year except as required in terms of the adoption of the following:
Adoption of new and amended standards effective
for the current financial period IFRS 7 Disclosures – Offsetting Financial Assets and Financial
Liabilities (IFRS 7R)
IFRS 10 Consolidated Financial Statements (IFRS 10)
IFRS 11 Joint Arrangements (IFRS 11)
IFRS 12 Disclosure of Interests in Other Entities (IFRS 12)
IFRS 13 Fair Value Measurement (IFRS 13)
IAS 19 Employee Benefits (2011 revised) (IAS 19R)
IAS 27 Separate Financial Statements (2011 revised) (IAS 27R)
IAS 28 Investments in Associates and Joint Ventures (2011 revised) (IAS 28R).
Early adoption of revised standards IAS 36 Impairment of Assets – Recoverable Amount Disclosures for
Non-Financial Assets (2013 revised) (IAS 36)
IAS 39 Financial Instruments: Recognition and Measurement – Novation of Derivatives and Continuation of Hedge Accounting (2013 revised) (IAS 39)
Of the above-mentioned IFRS adopted on 1 January 2013, IAS 19R resulted in the restatement of the group and the company’s previously reported financial results. The other revised IFRS didnot have any effect on the group and company’s reported earningsor financial statement position but have affected the group and company’s disclosures.
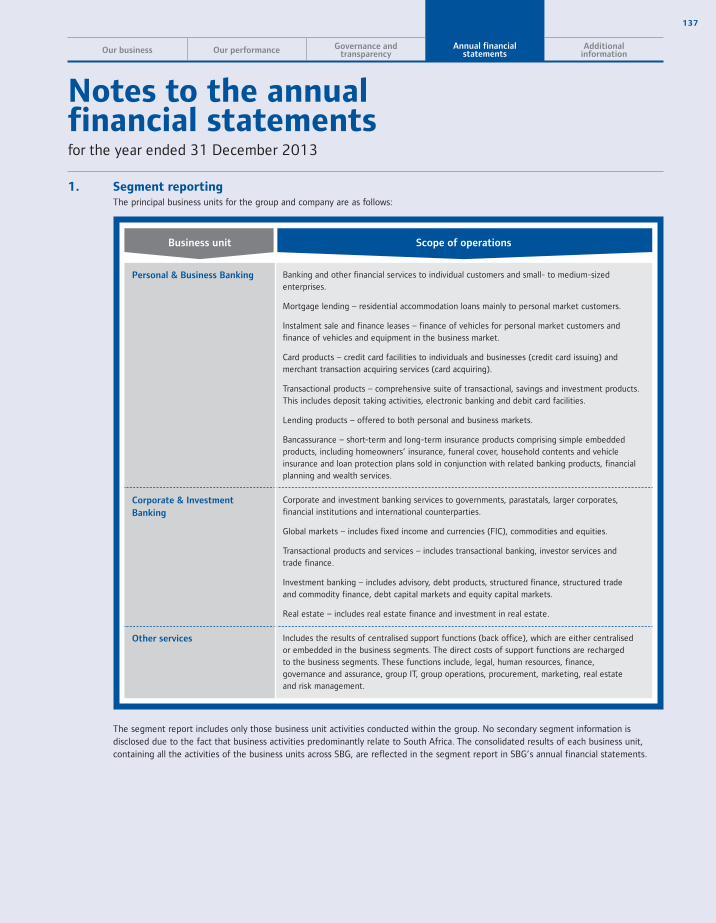
137
Our business Our performance Governance andtransparency
Annual financialstatements
Additionalinformation
Notes to the annualfinancial statementsfor the year ended 31 December 2013
1. Segment reporting The principal business units for the group and company are as follows:
Personal & Business Banking Banking and other financial services to individual customers and small- to medium-sized enterprises.
Mortgage lending – residential accommodation loans mainly to personal market customers.
Instalment sale and finance leases – finance of vehicles for personal market customers and finance of vehicles and equipment in the business market.
Card products – credit card facilities to individuals and businesses (credit card issuing) and merchant transaction acquiring services (card acquiring).
Transactional products – comprehensive suite of transactional, savings and investment products. This includes deposit taking activities, electronic banking and debit card facilities.
Lending products – offered to both personal and business markets.
Bancassurance – short-term and long-term insurance products comprising simple embedded products, including homeowners’ insurance, funeral cover, household contents and vehicle insurance and loan protection plans sold in conjunction with related banking products, financial planning and wealth services.
Corporate & Investment
Banking
Corporate and investment banking services to governments, parastatals, larger corporates, financial institutions and international counterparties.
Global markets – includes fixed income and currencies (FIC), commodities and equities.
Transactional products and services – includes transactional banking, investor services and trade finance.
Investment banking – includes advisory, debt products, structured finance, structured trade and commodity finance, debt capital markets and equity capital markets.
Real estate – includes real estate finance and investment in real estate.
Other services Includes the results of centralised support functions (back office), which are either centralised or embedded in the business segments. The direct costs of support functions are recharged to the business segments. These functions include, legal, human resources, finance, governance and assurance, group IT, group operations, procurement, marketing, real estate and risk management.
Business unit Scope of operations
The segment report includes only those business unit activities conducted within the group. No secondary segment information is disclosed due to the fact that business activities predominantly relate to South Africa. The consolidated results of each business unit, containing all the activities of the business units across SBG, are reflected in the segment report in SBG’s annual financial statements.

138 The Standard Bank of South Africa Annual report 2013
Annual financial statements Notes to the annual financial statements continued
1. Segment reporting continuedPersonal & Business Banking
2013Rm
20121,2
Rm
Group
Net interest income 21 933 18 752
Interest income 41 089 37 878Interest expense 19 156 19 126
Non-interest revenue 15 812 14 805
Net fee and commission revenue 14 797 13 976Trading revenue (1) (1)Other revenue 1 016 830
Total income 37 745 33 557Credit impairment charges/(reversals) 6 553 5 540
Income after credit impairment charges 31 192 28 017Revenue sharing agreements
Income after revenue sharing agreements 31 192 28 017Operating expenses 20 514 18 773
Staff costs 4 930 4 513Other operating expenses/(recoveries) 15 584 14 260
Net income before equity accounted earnings 10 678 9 244Share of profits from associates and joint ventures 211 417
Net income before indirect taxation 10 889 9 661Indirect taxation 247 249
Profit/(loss) before direct taxation 10 642 9 412Direct taxation 2 701 2 475
Profit/(loss) for the year 7 941 6 937Attributable to non-controlling interest 2 1
Attributable to the ordinary shareholder 7 939 6 936
Headline earnings 8 024 6 793
Operating information
Total assets 461 564 435 456Total liabilities 424 390 400 783
Other information
Interest in associates and joint ventures 1 441 274Depreciation and amortisation 1 080 885Impairments of intangible assets
1 Where reporting responsibility for individual cost centres and divisions within business units changes, the segmental analysis comparative figures are reclassified accordingly.2 Restated to conform with the restatements in annexure B starting on page 244.

139
Our business Our performance Governance andtransparency
Annual financialstatements
Additionalinformation
Corporate & Investment Banking Other services Total
2013Rm
20121,2
Rm2013
Rm20121,2
Rm2013
Rm20121,2
Rm
6 879 5 911 76 586 28 888 25 249
11 276 21 875 5 704 (4 076) 58 069 55 6774 397 15 964 5 628 (4 662) 29 181 30 428
6 742 7 103 294 124 22 848 22 032
2 735 3 144 (556) (756) 16 976 16 3643 432 3 167 90 (19) 3 521 3 147
575 792 760 899 2 351 2 521
13 621 13 014 370 710 51 736 47 2811 262 435 (190) 7 815 5 785
12 359 12 579 370 900 43 921 41 4961 637 1 642 9 1 646 1 642
10 722 10 937 361 900 42 275 39 8546 857 6 158 872 230 28 243 25 161
1 664 1 446 8 202 7 385 14 796 13 3445 193 4 712 (7 330) (7 155) 13 447 11 817
3 865 4 779 (511) 670 14 032 14 69392 91 15 303 523
3 957 4 870 (511) 685 14 335 15 21695 45 869 680 1 211 974
3 862 4 825 (1 380) 5 13 124 14 242210 (304) (303) 176 2 608 2 347
3 652 5 129 (1 077) (171) 10 516 11 895(24) 11 1 (1) (21) 11
3 676 5 118 (1 078) (170) 10 537 11 884
3 751 5 117 (1 066) (449) 10 709 11 461
521 377 515 289 32 936 29 407 1 015 877 980 152496 868 489 979 15 415 18 765 936 673 909 527
624 537 2 065 8119 8 1 475 1 283 2 564 2 176
308 308
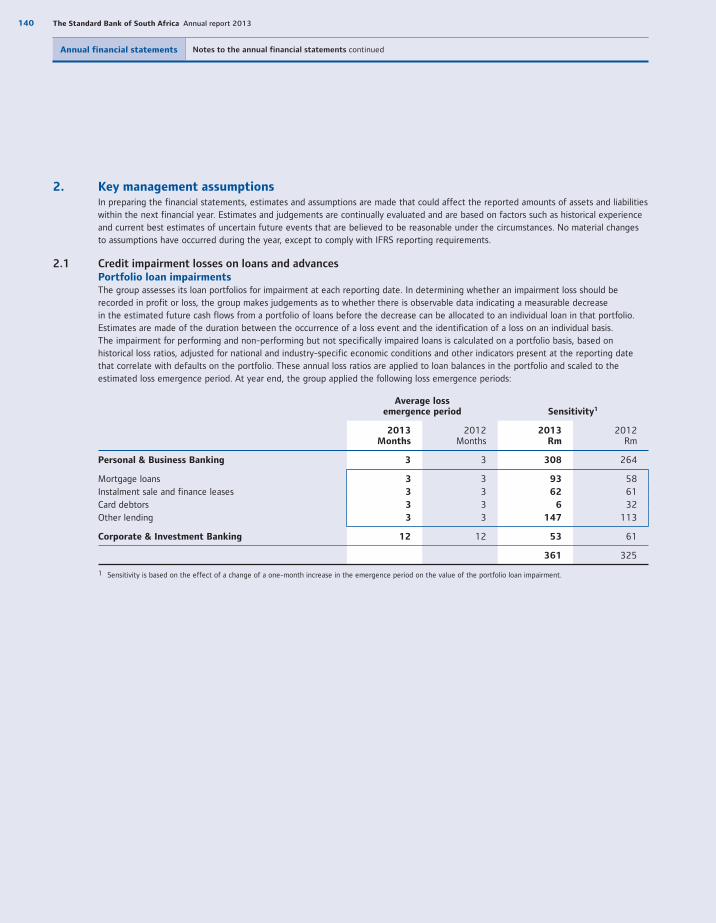
140 The Standard Bank of South Africa Annual report 2013
Annual financial statements Notes to the annual financial statements continued
2. Key management assumptions In preparing the financial statements, estimates and assumptions are made that could affect the reported amounts of assets and liabilities
within the next financial year. Estimates and judgements are continually evaluated and are based on factors such as historical experience and current best estimates of uncertain future events that are believed to be reasonable under the circumstances. No material changes to assumptions have occurred during the year, except to comply with IFRS reporting requirements.
2.1 Credit impairment losses on loans and advances Portfolio loan impairments The group assesses its loan portfolios for impairment at each reporting date. In determining whether an impairment loss should be
recorded in profit or loss, the group makes judgements as to whether there is observable data indicating a measurable decreasein the estimated future cash flows from a portfolio of loans before the decrease can be allocated to an individual loan in that portfolio. Estimates are made of the duration between the occurrence of a loss event and the identification of a loss on an individual basis.The impairment for performing and non-performing but not specifically impaired loans is calculated on a portfolio basis, based on historical loss ratios, adjusted for national and industry-specific economic conditions and other indicators present at the reporting date that correlate with defaults on the portfolio. These annual loss ratios are applied to loan balances in the portfolio and scaled to the estimated loss emergence period. At year end, the group applied the following loss emergence periods:
Average lossemergence period Sensitivity1
2013Months
2012Months
2013Rm
2012Rm
Personal & Business Banking 3 3 308 264
Mortgage loans 3 3 93 58Instalment sale and finance leases 3 3 62 61Card debtors 3 3 6 32Other lending 3 3 147 113
Corporate & Investment Banking 12 12 53 61
361 325
1 Sensitivity is based on the effect of a change of a one-month increase in the emergence period on the value of the portfolio loan impairment.
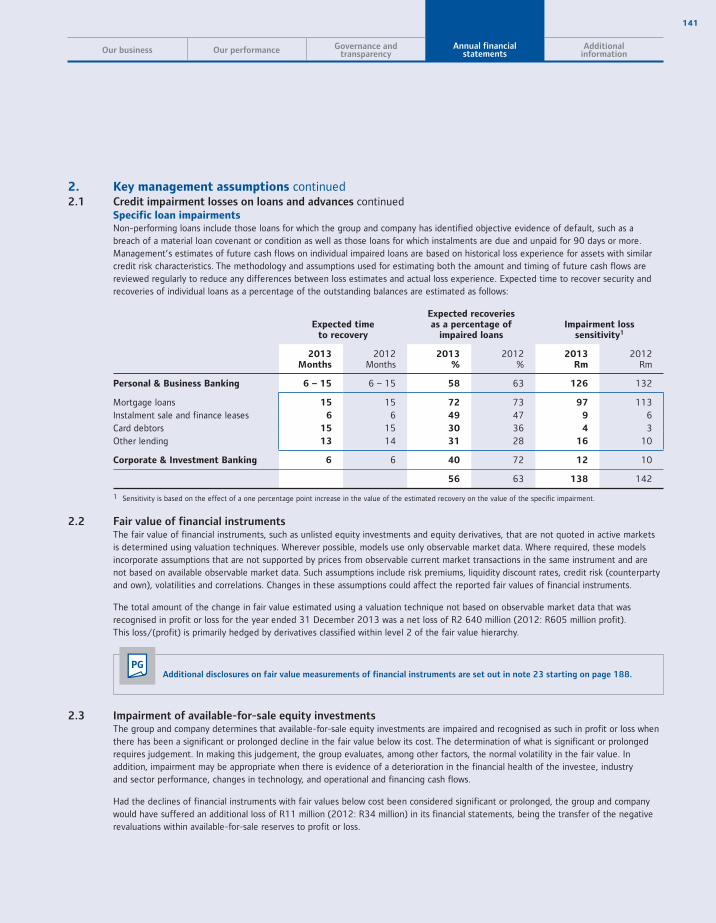
141
Our business Our performance Governance andtransparency
Annual financialstatements
Additionalinformation
2. Key management assumptions continued2.1 Credit impairment losses on loans and advances continued Specific loan impairments Non-performing loans include those loans for which the group and company has identified objective evidence of default, such as a
breach of a material loan covenant or condition as well as those loans for which instalments are due and unpaid for 90 days or more. Management’s estimates of future cash flows on individual impaired loans are based on historical loss experience for assets with similar credit risk characteristics. The methodology and assumptions used for estimating both the amount and timing of future cash flows are reviewed regularly to reduce any differences between loss estimates and actual loss experience. Expected time to recover security and recoveries of individual loans as a percentage of the outstanding balances are estimated as follows:
Expected timeto recovery
Expected recoveriesas a percentage of
impaired loansImpairment loss
sensitivity1
2013Months
2012Months
2013%
2012%
2013Rm
2012Rm
Personal & Business Banking 6 – 15 6 – 15 58 63 126 132
Mortgage loans 15 15 72 73 97 113Instalment sale and finance leases 6 6 49 47 9 6Card debtors 15 15 30 36 4 3Other lending 13 14 31 28 16 10
Corporate & Investment Banking 6 6 40 72 12 10
56 63 138 142
1 Sensitivity is based on the effect of a one percentage point increase in the value of the estimated recovery on the value of the specific impairment.
2.2 Fair value of financial instruments The fair value of financial instruments, such as unlisted equity investments and equity derivatives, that are not quoted in active markets
is determined using valuation techniques. Wherever possible, models use only observable market data. Where required, these models incorporate assumptions that are not supported by prices from observable current market transactions in the same instrument and are not based on available observable market data. Such assumptions include risk premiums, liquidity discount rates, credit risk (counterparty and own), volatilities and correlations. Changes in these assumptions could affect the reported fair values of financial instruments.
The total amount of the change in fair value estimated using a valuation technique not based on observable market data that was recognised in profit or loss for the year ended 31 December 2013 was a net loss of R2 640 million (2012: R605 million profit). This loss/(profit) is primarily hedged by derivatives classified within level 2 of the fair value hierarchy.
PGAdditional disclosures on fair value measurements of financial instruments are set out in note 23 starting on page 188.
2.3 Impairment of available-for-sale equity investments The group and company determines that available-for-sale equity investments are impaired and recognised as such in profit or loss when
there has been a significant or prolonged decline in the fair value below its cost. The determination of what is significant or prolonged requires judgement. In making this judgement, the group evaluates, among other factors, the normal volatility in the fair value. In addition, impairment may be appropriate when there is evidence of a deterioration in the financial health of the investee, industry and sector performance, changes in technology, and operational and financing cash flows.
Had the declines of financial instruments with fair values below cost been considered significant or prolonged, the group and company would have suffered an additional loss of R11 million (2012: R34 million) in its financial statements, being the transfer of the negative revaluations within available-for-sale reserves to profit or loss.
142 The Standard Bank of South Africa Annual report 2013
Annual financial statements Notes to the annual financial statements continued
2. Key management assumptions continued2.4 Goodwill impairment The group is required to annually test its recognised goodwill for impairment in terms of IAS 36 Impairment of Assets
(IAS 36). The impairment tests are performed annually by comparing the cash-generating units’ (CGU) recoverable amounts to the carrying amounts. The recoverable amount is defined as the higher of the entity’s fair value less costs to sell and its value in use and is determined on an entity by entity basis. IAS 36 requires goodwill acquired in a business combination to be allocated to each of the acquirer’s CGUs, or groups of CGUs that are expected to benefit from the synergies of the business combination, irrespective of whether other assets or liabilities of the acquiree are assigned to those units or groups of units.
PG Further details regarding the group and company’s accounting policy for goodwill can be found in annexure A, accounting policy 6 on page 236.
The total goodwill of the group at 31 December 2013 amounted to R40 million (2012: R40 million).
PGNote 13 on page 172 lists the composition of the goodwill by legal entity.
The review and testing of goodwill for impairment inherently requires significant management judgement as it requires management to derive the best estimates of the identified CGUs’ future cash flows. The principal assumptions considered in determining an entity’s value in use include:
Future cash flows – the forecast periods adopted reflect a set of cash flows that, based on management judgment and expected market conditions, could be sustainably generated over such a period. A forecast period of greater than five years has been used in order to take into account the level of development in these markets. The cash flows from the final discrete cash flow period were extrapolated into perpetuity to reflect the long-term plans for the entity. It is common valuation methodology to avoid placing too high a proportion of the total value in the perpetuity value.
Discount rates – the cost of equity percentages were derived from an equity pricing model deemed appropriate based on the entities under review. The risk free rate used to determine the cost of equity has been derived from the respective local 10-year government bonds. The future cash flows are discounted using the cost of equity assigned to the appropriate CGUs and by nature can have a significant effect on their valuations.
2.5 Securitisations and structured entities (SE) An SE is an entity that has been designed so that voting or similar rights are not the dominant factor in deciding who controls the entity,
such as when voting rights relate to administrative tasks only and the relevant activities are directed by means of contractual arrangements. The group is required to determine whether it has any interests in unconsolidated SEs as well as whether it sponsors any unconsolidated SEs and to disclosure various information for such relationships.
Interests that are not considered to be a typical customer-supplier relationship are required to be identified and disclosed. An interest would be a typical customer-supplier relationship where the level of risk inherent in that interest in the SE exposes the group to a similar risk profile to that found in customary market-related transactions.
The group sponsors an SE where it provides financial support to the SE when not contractually required to do so. Financial support may be provided by the group for events such as litigation, tax and operational difficulties. Refer to accounting policies – annexure A.
2.6 Consolidation of entities IFRS requires the group to consolidate an entity where the group has power; is exposed to variable returns from its involvement with the
investee; and has the power to affect the returns through its power over the entity, including SEs. Determining whether the group controls another entity requires judgement by identifying an entity’s relevant activities, being those activities that significantly affect the investee’s returns, and whether the group controls those relevant activities by considering the rights attached to both current and potential voting rights, de facto control and other contractual rights, including whether such rights are substantive. Refer to annexure C for a list of the material subsidiaries that are controlled by the group.
The group consolidated SEs with assets of R13 610 million (2012: R14 760 million) and net losses of R10 million (2012: R47 million loss).
PGFurther details regarding these SEs can be found in annexure C starting on page 248.
143
Our business Our performance Governance andtransparency
Annual financialstatements
Additionalinformation
2. Key management assumptions continued2.7 Held-to-maturity investments The group and company follows the guidance of IAS 39 – Financial Instruments: Recognition and Measurement (IAS 39) on classifying
non-derivative financial assets with fixed or determinable payments and fixed maturity as held-to-maturity. This classificationrequires judgement of the group and company’s ability to hold such investments to maturity. If the group and company fail to holdthese investments to maturity other than for specific defined circumstances, it will be required to classify the entire category as available-for-sale. The investments would be measured at fair value and not amortised cost. If the entire category of held-to-maturity investments were tainted in this way, the carrying value would increase by R888 million (2012: R1 527 million) for the group andR888 million (2012: R1 523 million) for the company, with a corresponding entry in OCI.
2.8 Computer software intangible assets Direct computer software development costs that are clearly associated with an identifiable and unique system, which will be controlled
by the group and company and have a probable future economic benefit beyond one year, are capitalised and disclosed as computer software intangible assets. Computer software intangible assets are carried at cost less accumulated amortisation and accumulated impairment losses. The assets are reviewed for impairment at each reporting date and tested for impairment whenever events or changes in circumstances indicate that the carrying amount may not be recoverable. The determination of the recoverable amount of each asset requires judgement. The recoverable amount is based on the value in use and is calculated by estimating future cash benefits that will result from each asset and discounting these cash benefits at an appropriate pre-tax discount rate. The carrying value of computer software intangible assets capitalised at 31 December 2013 amounted to R13 737 million (2012: R10 307 million) for the company and R13 745 million (2012: R10 310) for the group.
2.9 Provisions The accounting policy for provisions is set out in annexure A, accounting policy 12. The principal assumptions taken into account in
determining the value at which provisions are recorded at in the group and company’s results include determining whether there is an obligation as well as assumptions about the probability of the outflow of resources occurring and the estimate of the amount and timing for the settlement of the obligation.
The probability of an event of a significant nature occurring will be assessed by management and where applicable, consultation with the group’s legal counsel. In determining the amount and timing of the obligation once it has been assessed to exist, management exercises its judgement by taking into account all available information, including that arising after the balance sheet date up to the date of the approval of the financial statements.
2.10 Income taxes The group and company is subject to direct and indirect taxation in a number of jurisdictions. There are many transactions and
calculations for which the ultimate tax determination has an element of uncertainty during the ordinary course of business. The group and company recognises liabilities based on objective estimates of the quantum of taxes that may be due. Where the final tax determination is different from the amounts that were initially recorded, such differences will impact the income tax and deferred tax expense in the period in which such determination is made.
2.11 Deferred tax assets Deferred tax assets are recognised to the extent that it is probable that future taxable income will be available against which the unused
tax losses can be utilised. Deferred tax assets are reviewed at each reporting date and are reduced to the extent that it is no longer probable that the related tax benefit will be realised.
Management’s judgement surrounding the probability and sufficiency of future taxable profits, future reversals of existing taxable differences and ongoing developments will determine the recognition of deferred tax. The most significant management assumption is the forecasts used to support the probability assessment that sufficient taxable profits will be generated by the entities in the group in order to utilise the deferred tax assets.
PG Refer to note 10 on page 166 for details of the carrying amount of the deferred tax assets and annexure A, accounting policy 14 on page 239 for further details regarding the group and company’s deferred tax accounting policy.
144 The Standard Bank of South Africa Annual report 2013
Annual financial statements Notes to the annual financial statements continued
2. Key management assumptions continued2.12 Share-based payments The group and company has both cash- and equity-settled share incentive schemes which are issued to qualifying employees based on
the rules of the schemes. The group uses the Black-Scholes option pricing model to determine the fair value of awards on grant date for its equity-settled share incentive schemes. The valuation of the group’s obligations with respect to its cash-settled share incentive scheme obligations is determined with reference to the group’s share price, which is an observable market input. In determining the expense to be recognised for both the cash- and equity-settled share schemes, the group estimates the expected future vesting of the awards by considering staff attrition levels. The group also makes estimates of the future vesting of awards that are subject to non-market vesting conditions by taking into account the probability of such conditions being met.
Refer to annexure E for further details regarding the carrying amount of the liabilities arising from the group’s cash-settled share incentive schemes and the expenses recognised in the income statement.
2.13 Post-retirement benefits The group’s post-retirement benefits consist of both post-employment retirement funds and healthcare benefits. The group’s obligations
to fund these benefits are derived from actuarial valuations performed by the appointed actuaries taking into account various assumptions. The funds are subject to a statutory financial review by the group’s independent actuaries at intervals of not more than three years. The principle assumptions used in the determination of the group’s obligations include the following:
Retirement fund1 Post-employment medical aid
2013
Discount rate Nominal governmentbond yield curve
Nominal government bond yield curve
Return on investments 8.52% – discounted rate of termequal to the discounted mean term
of the liabilities
Salary/benefit inflation Inflation rates plus 1%
CPI inflation Difference between nominal and index-linked bond yield curves
Difference between nominal and index-linked bond yield curves
Medical inflation Difference between nominal and index-linked bond yield curves
plus 1.5%
Provider benefit escalation Inflation rates plus 2%
Pension increase in allowance Inflation rates
Remaining service life of employees (years) 12.70
2012
Discount rate Nominal government bond yield curve 7.99%
Return on investments 8.20% – discounted rate of termequal to the discounted mean term
of the liabilities
Salary/benefit inflation Inflation rates plus 1%
CPI inflation Difference between nominal and index-linked bond yield curves
Medical inflation 6.66%
Provider benefit escalation Inflation rates plus 2%
Pension increase in allowance Inflation rates
Remaining service life of employees (years) 12.21
1 Refer to note 34 starting on page 221, for further details regarding the group’s post-retirement benefits.
145
Our business Our performance Governance andtransparency
Annual financialstatements
Additionalinformation
3. Cash and balances with central banks
Group Company
2013Rm
2012Rm
2013Rm
2012Rm
Coins and bank notes 9 036 10 450 9 036 10 450Balances with central banks 20 898 15 476 20 898 15 476
29 934 25 926 29 934 25 926
Cash and balances with the central bank include R16 691 million (2012: R15 476 million) that is not available for use by the group and company. These balances primarily comprise of reserving requirements held with the central bank.
4. Derivative instruments All derivatives are classified as either derivatives held-for-trading or derivatives held-for-hedging.
4.1 Use and measurement of derivative instruments In the normal course of business, the group and company enters into a variety of derivative transactions for both trading and hedging
purposes. Derivative financial instruments are entered into for trading purposes and for hedging foreign exchange, credit, interest rate, inflation, commodity and equity exposures. Derivative instruments used by the group and company in both trading and hedging activities include swaps, options, forwards, futures and other similar types of instruments based on foreign exchange rates, credit risk, interest rates, inflation risk and the prices of commodities and equities.
The risks associated with derivative instruments are monitored in the same manner as for the underlying instruments. Risks are also measured across the product range in order to take into account possible correlations.
The fair value of all derivatives is recognised in the statement of financial position and is only netted to the extent that there is both a legal right of set off and an intention to settle on a net basis, or the intention to realise the derivative asset and settle the derivative liability simultaneously.
Swaps are transactions in which two parties exchange cash flows on a specified notional amount for a predetermined period. The major types of swap transactions undertaken by the group and company are as follows:
interest rate swap contracts which generally entail the contractual exchange of fixed and floating interest payments in a single currency, based on a notional amount and an interest reference rate
currency swaps which involve the exchange of interest payments based on two different currency-denominated principal balances and interest reference rates and generally also entail exchange of principal amounts at the start and end of the contract
credit default swaps which are the most common form of credit derivatives, under which the party buying protection makes one or more payments to the party selling protection during the life of the swap in exchange for an undertaking by the seller to make a payment to the buyer following a credit event, as defined in the contract, with respect to a third party reference asset
total return swaps which are contracts in which one party (the total return payer) transfers the economic risks and rewards associated with an underlying asset to another counterparty (the total return receiver). The transfer of risk and reward is affected by way of an exchange of cash flows that mirror changes in the value of the underlying asset and any income derived therefrom.
146 The Standard Bank of South Africa Annual report 2013
Annual financial statements Notes to the annual financial statements continued
4. Derivative instruments continued4.1 Use and measurement of derivative instruments continued Options are contractual agreements under which the seller grants the purchaser the right, but not the obligation, either to buy
(call option) or to sell (put option) by or at a set date, a specified amount of a financial instrument or commodity at a predetermined price. The seller receives a premium from the purchaser for this right. Options may be traded OTC or on a regulated exchange.
Forwards and futures are contractual obligations to buy or sell financial instruments or commodities on a future date at a specified price. Forward contracts are tailor-made agreements that are transacted between counterparties in the OTC market, whereas futures are standardised contracts transacted on regulated exchanges.
4.2 Derivatives held-for-trading The group and company trades derivative instruments on behalf of its clients and for its own positions. The group and company transacts
derivative contracts to address client demand, both as a market maker in the wholesale markets and in structuring tailored derivatives for clients. The group and company also takes proprietary positions for its own account. Trading derivative products include the following derivative instruments:
4.2.1 Foreign exchange derivatives Foreign exchange derivatives are used to economically hedge foreign currency risks on behalf of clients and for the group and company’s
own positions. Foreign exchange derivatives primarily consist of foreign exchange forwards and swaps, foreign exchange futures and foreign exchange options.
4.2.2 Interest rate derivatives Interest rate derivatives are used to modify the volatility and interest rate characteristics of interest-earning assets and interest-bearing
liabilities on behalf of clients and for the group’s own positions. Interest rate derivatives primarily consist of bond options, caps and floors, forward rate agreements, options, swaps and swaptions.
4.2.3 Commodity derivatives Commodity derivatives are used to address client commodity demands and to take proprietary positions for the group and company’s
own account. Commodity derivatives primarily consist of commodity forwards, commodity futures and commodity options.
4.2.4 Credit derivatives Credit derivatives are used to hedge the credit risk of a reference asset or liability on behalf of clients and for the group and company’s
own positions. Credit derivatives primarily consist of credit default swaps.
4.2.5 Equity derivatives Equity derivatives are used to address client equity demands and to take proprietary positions for the group and company’s own
account. Equity derivatives primarily consist of forwards, futures, index options, options, swaps and other equity-related financial derivative instruments.
147
Our business Our performance Governance andtransparency
Annual financialstatements
Additionalinformation
4. Derivative instruments continued4.3 Derivatives held-for-hedging The group and company enters into derivative transactions, which are designated and qualify as either fair value or cash flow hedges
for recognised assets or liabilities or highly probable forecast transactions. Derivatives designated as hedging instruments consist of:
4.3.1 Derivatives designated in fair value hedge relationship The group and company’s fair value hedges principally consist of interest rate swaps that are used to mitigate the risk of changes in
market interest rates.
PGRefer to accounting policy 4 – Financial instruments in annexure A starting on page 231.
4.3.2 Derivatives designated in cash flow hedge relationship The group and company use currency forwards and swaps and options to mitigate against the risk of changes in future cash flows on its
foreign-denominated exposures. The company and group primarily use interest rate swaps to hedge, by major currency, its variable rate financial assets and liabilities with the objective to mitigate against changes in future interest cash flows resulting from the impact of changes in market interest rates, and reinvestment or reborrowing of current balances.
4.4 Day one profit or loss Where the fair value of an instrument differs from the transaction price and the fair value of the instrument is evidenced by comparison
with other observable current market transactions in the same instrument, or based on a valuation model whose variables include only data from observable markets, the difference – commonly referred to as day one profit or loss, is recognised in profit or loss immediately. If the fair value of the financial instrument is not able to be evidenced by comparison with other observable current market transactions in the same instrument or non-observable market data is used as part of the inputs to the valuation models, any resulting difference between the transaction price and the valuation model is deferred and subsequently recognised in accordance with the group and company’s accounting policies.
PGRefer to accounting policy 4 – Financial instruments in annexure A starting on page 231.
4.5 Fair values The fair value of a derivative financial instrument represents, for a quoted instrument, the quoted market price and for an unquoted
instrument, the present value of the positive and/or negative cash flows, which would have occurred if the rights and obligations arising from that instrument were closed out in an orderly marketplace transaction at the reporting date.
4.6 Notional amount The contract/notional amount is the sum of the absolute value of all bought and sold contracts. The notional amounts have been
translated at the closing rate at the reporting date where cash flows are receivable in foreign currency. The amount cannot be used to assess the market risk associated with the position and should be used only as a means of assessing the group and company’s participation in derivative contracts.
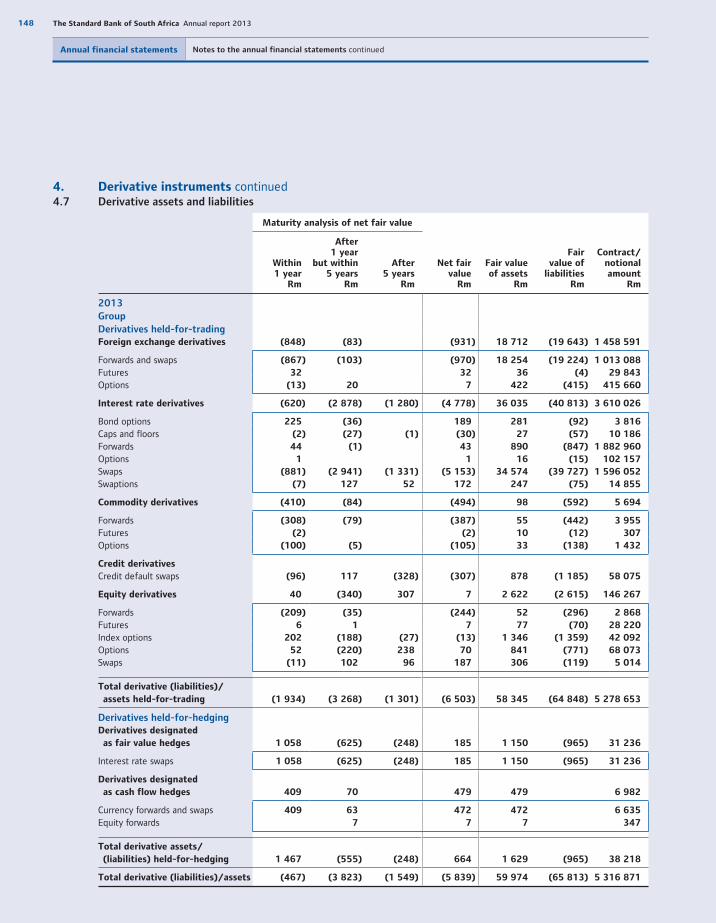
148 The Standard Bank of South Africa Annual report 2013
Annual financial statements Notes to the annual financial statements continued
4. Derivative instruments continued4.7 Derivative assets and liabilities
Maturity analysis of net fair value
Net fair value
Rm
Fair valueof assets
Rm
Fairvalue of
liabilitiesRm
Contract/notionalamount
Rm
Within1 year
Rm
After1 year
but within5 years
Rm
After5 years
Rm
2013
Group
Derivatives held-for-tradingForeign exchange derivatives (848) (83) (931) 18 712 (19 643) 1 458 591
Forwards and swaps (867) (103) (970) 18 254 (19 224) 1 013 088
Futures 32 32 36 (4) 29 843
Options (13) 20 7 422 (415) 415 660
Interest rate derivatives (620) (2 878) (1 280) (4 778) 36 035 (40 813) 3 610 026
Bond options 225 (36) 189 281 (92) 3 816
Caps and floors (2) (27) (1) (30) 27 (57) 10 186
Forwards 44 (1) 43 890 (847) 1 882 960
Options 1 1 16 (15) 102 157
Swaps (881) (2 941) (1 331) (5 153) 34 574 (39 727) 1 596 052
Swaptions (7) 127 52 172 247 (75) 14 855
Commodity derivatives (410) (84) (494) 98 (592) 5 694
Forwards (308) (79) (387) 55 (442) 3 955
Futures (2) (2) 10 (12) 307
Options (100) (5) (105) 33 (138) 1 432
Credit derivatives
Credit default swaps (96) 117 (328) (307) 878 (1 185) 58 075
Equity derivatives 40 (340) 307 7 2 622 (2 615) 146 267
Forwards (209) (35) (244) 52 (296) 2 868
Futures 6 1 7 77 (70) 28 220
Index options 202 (188) (27) (13) 1 346 (1 359) 42 092
Options 52 (220) 238 70 841 (771) 68 073
Swaps (11) 102 96 187 306 (119) 5 014
Total derivative (liabilities)/
assets held-for-trading (1 934) (3 268) (1 301) (6 503) 58 345 (64 848) 5 278 653
Derivatives held-for-hedgingDerivatives designated
as fair value hedges 1 058 (625) (248) 185 1 150 (965) 31 236
Interest rate swaps 1 058 (625) (248) 185 1 150 (965) 31 236
Derivatives designated
as cash flow hedges 409 70 479 479 6 982
Currency forwards and swaps 409 63 472 472 6 635
Equity forwards 7 7 7 347
Total derivative assets/
(liabilities) held-for-hedging 1 467 (555) (248) 664 1 629 (965) 38 218
Total derivative (liabilities)/assets (467) (3 823) (1 549) (5 839) 59 974 (65 813) 5 316 871

149
Our business Our performance Governance andtransparency
Annual financialstatements
Additionalinformation
4. Derivative instruments continued4.7 Derivative assets and liabilities continued
Maturity analysis of net fair value
Net fairvalue
Rm
Fair valueof assets
Rm
Fairvalue of
liabilitiesRm
Contract/notional amount
Rm
Within1 year
Rm
After1 year
but within5 years
Rm
After5 years
Rm
2012GroupDerivatives held-for-tradingForeign exchange derivatives (1 364) (668) (7) (2 039) 13 573 (15 612) 1 253 812
Forwards and swaps (520) (693) (7) (1 220) 8 909 (10 129) 1 213 518Futures (1) 2 1 5 (4) 7 935Options (843) 23 (820) 4 659 (5 479) 32 359
Interest rate derivatives (227) 409 (179) 3 60 366 (60 363) 3 199 967
Bond options (579) (82) (661) 1 876 (2 537) 115 174Caps and floors (27) 4 17 (6) 39 (45) 18 944Forwards (44) 53 9 913 (904) 1 036 280Options 5 5 20 (15) 67 819Swaps 524 411 (277) 658 57 264 (56 606) 1 940 240Swaptions (106) 23 81 (2) 254 (256) 21 510
Commodity derivatives 195 (338) (143) 1 534 (1 677) 35 000
Forwards 254 (268) (14) 1 406 (1 420) 29 720Futures (8) (8) 18 (26) 950Options (51) (70) (121) 110 (231) 4 330
Credit derivativesCredit default swaps (465) 547 (306) (224) 1 217 (1 441) 70 180
Equity derivatives (765) (181) (946) 1 609 (2 555) 146 156
Forwards (262) (19) (281) 109 (390) 3 269Futures (2) (1) (3) 39 (42) 12 494Index options (83) (166) (249) 1 016 (1 265) 121 427Options (113) (92) (205) 295 (500) 4 850Swaps (308) 97 (211) 139 (350) 1 705Other 3 3 11 (8) 2 411
Total derivative (liabilities)/
assets held-for-trading (2 626) (231) (492) (3 349) 78 299 (81 648) 4 705 115
Derivatives held-for-hedgingDerivatives designated
as fair value hedges 189 146 335 375 (40) 83 165
Currency forwards and swaps 162 162 162 838Interest rate swaps 189 (16) 173 213 (40) 82 327
Derivatives designated
as cash flow hedges 167 (53) 114 170 (56) 7 652
Currency swaps 170 170 170 6 199Equity forwards (3) (6) (9) (9) 303Interest rate swaps (47) (47) (47) 1 150
Total derivative assets/
(liabilities) held-for-hedging 356 93 449 545 (96) 90 817
Total derivative (liabilities)/assets (2 270) (138) (492) (2 900) 78 844 (81 744) 4 795 932
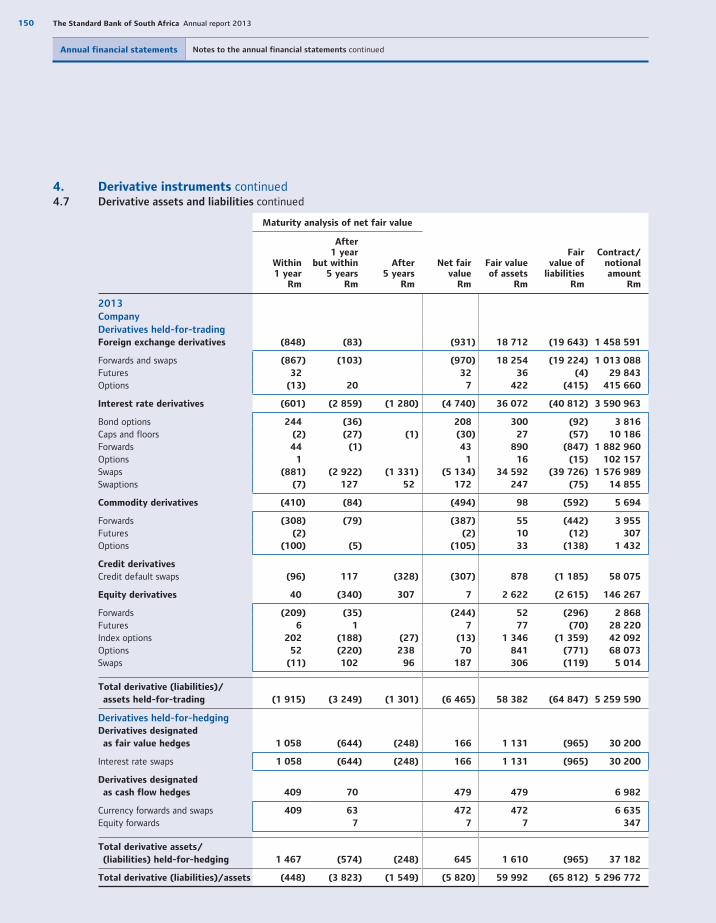
150 The Standard Bank of South Africa Annual report 2013
Annual financial statements Notes to the annual financial statements continued
4. Derivative instruments continued4.7 Derivative assets and liabilities continued
Maturity analysis of net fair value
Net fair value
Rm
Fair valueof assets
Rm
Fairvalue of
liabilitiesRm
Contract/notionalamount
Rm
Within1 year
Rm
After1 year
but within5 years
Rm
After5 years
Rm
2013
Company
Derivatives held-for-tradingForeign exchange derivatives (848) (83) (931) 18 712 (19 643) 1 458 591
Forwards and swaps (867) (103) (970) 18 254 (19 224) 1 013 088
Futures 32 32 36 (4) 29 843
Options (13) 20 7 422 (415) 415 660
Interest rate derivatives (601) (2 859) (1 280) (4 740) 36 072 (40 812) 3 590 963
Bond options 244 (36) 208 300 (92) 3 816
Caps and floors (2) (27) (1) (30) 27 (57) 10 186
Forwards 44 (1) 43 890 (847) 1 882 960
Options 1 1 16 (15) 102 157
Swaps (881) (2 922) (1 331) (5 134) 34 592 (39 726) 1 576 989
Swaptions (7) 127 52 172 247 (75) 14 855
Commodity derivatives (410) (84) (494) 98 (592) 5 694
Forwards (308) (79) (387) 55 (442) 3 955
Futures (2) (2) 10 (12) 307
Options (100) (5) (105) 33 (138) 1 432
Credit derivatives
Credit default swaps (96) 117 (328) (307) 878 (1 185) 58 075
Equity derivatives 40 (340) 307 7 2 622 (2 615) 146 267
Forwards (209) (35) (244) 52 (296) 2 868
Futures 6 1 7 77 (70) 28 220
Index options 202 (188) (27) (13) 1 346 (1 359) 42 092
Options 52 (220) 238 70 841 (771) 68 073
Swaps (11) 102 96 187 306 (119) 5 014
Total derivative (liabilities)/
assets held-for-trading (1 915) (3 249) (1 301) (6 465) 58 382 (64 847) 5 259 590
Derivatives held-for-hedgingDerivatives designated
as fair value hedges 1 058 (644) (248) 166 1 131 (965) 30 200
Interest rate swaps 1 058 (644) (248) 166 1 131 (965) 30 200
Derivatives designated
as cash flow hedges 409 70 479 479 6 982
Currency forwards and swaps 409 63 472 472 6 635
Equity forwards 7 7 7 347
Total derivative assets/
(liabilities) held-for-hedging 1 467 (574) (248) 645 1 610 (965) 37 182
Total derivative (liabilities)/assets (448) (3 823) (1 549) (5 820) 59 992 (65 812) 5 296 772
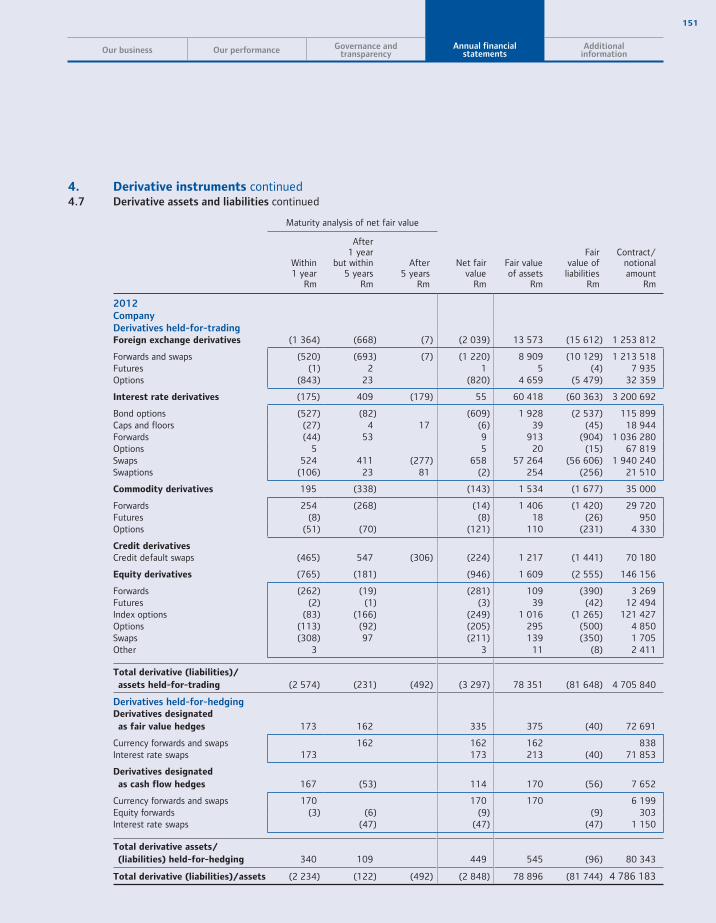
151
Our business Our performance Governance andtransparency
Annual financialstatements
Additionalinformation
4. Derivative instruments continued4.7 Derivative assets and liabilities continued
Maturity analysis of net fair value
Net fairvalue
Rm
Fair valueof assets
Rm
Fairvalue of
liabilitiesRm
Contract/notional amount
Rm
Within1 year
Rm
After1 year
but within5 years
Rm
After5 years
Rm
2012CompanyDerivatives held-for-tradingForeign exchange derivatives (1 364) (668) (7) (2 039) 13 573 (15 612) 1 253 812
Forwards and swaps (520) (693) (7) (1 220) 8 909 (10 129) 1 213 518Futures (1) 2 1 5 (4) 7 935Options (843) 23 (820) 4 659 (5 479) 32 359
Interest rate derivatives (175) 409 (179) 55 60 418 (60 363) 3 200 692
Bond options (527) (82) (609) 1 928 (2 537) 115 899Caps and floors (27) 4 17 (6) 39 (45) 18 944Forwards (44) 53 9 913 (904) 1 036 280Options 5 5 20 (15) 67 819Swaps 524 411 (277) 658 57 264 (56 606) 1 940 240Swaptions (106) 23 81 (2) 254 (256) 21 510
Commodity derivatives 195 (338) (143) 1 534 (1 677) 35 000
Forwards 254 (268) (14) 1 406 (1 420) 29 720Futures (8) (8) 18 (26) 950Options (51) (70) (121) 110 (231) 4 330
Credit derivativesCredit default swaps (465) 547 (306) (224) 1 217 (1 441) 70 180
Equity derivatives (765) (181) (946) 1 609 (2 555) 146 156
Forwards (262) (19) (281) 109 (390) 3 269Futures (2) (1) (3) 39 (42) 12 494Index options (83) (166) (249) 1 016 (1 265) 121 427Options (113) (92) (205) 295 (500) 4 850Swaps (308) 97 (211) 139 (350) 1 705Other 3 3 11 (8) 2 411
Total derivative (liabilities)/
assets held-for-trading (2 574) (231) (492) (3 297) 78 351 (81 648) 4 705 840
Derivatives held-for-hedgingDerivatives designated
as fair value hedges 173 162 335 375 (40) 72 691
Currency forwards and swaps 162 162 162 838Interest rate swaps 173 173 213 (40) 71 853
Derivatives designated
as cash flow hedges 167 (53) 114 170 (56) 7 652
Currency forwards and swaps 170 170 170 6 199Equity forwards (3) (6) (9) (9) 303Interest rate swaps (47) (47) (47) 1 150
Total derivative assets/
(liabilities) held-for-hedging 340 109 449 545 (96) 80 343
Total derivative (liabilities)/assets (2 234) (122) (492) (2 848) 78 896 (81 744) 4 786 183
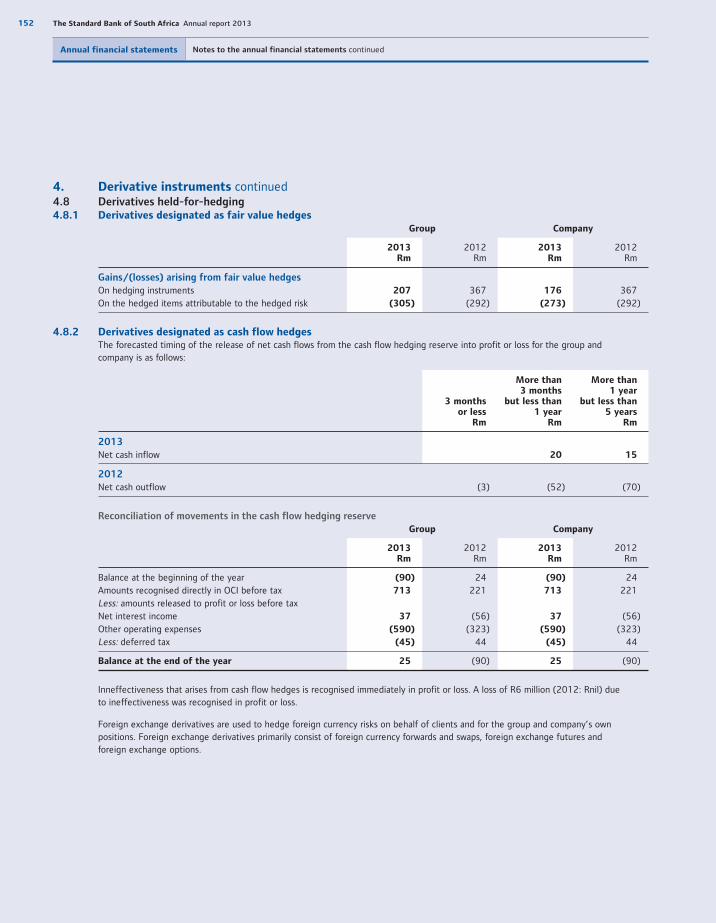
152 The Standard Bank of South Africa Annual report 2013
Annual financial statements Notes to the annual financial statements continued
4. Derivative instruments continued4.8 Derivatives held-for-hedging4.8.1 Derivatives designated as fair value hedges
Group Company
2013Rm
2012Rm
2013Rm
2012Rm
Gains/(losses) arising from fair value hedges
On hedging instruments 207 367 176 367On the hedged items attributable to the hedged risk (305) (292) (273) (292)
4.8.2 Derivatives designated as cash flow hedges The forecasted timing of the release of net cash flows from the cash flow hedging reserve into profit or loss for the group and
company is as follows:
3 monthsor less
Rm
More than3 months
but less than1 year
Rm
More than1 year
but less than5 years
Rm
2013
Net cash inflow 20 15
2012
Net cash outflow (3) (52) (70)
Reconciliation of movements in the cash flow hedging reserve
Group Company
2013Rm
2012Rm
2013Rm
2012Rm
Balance at the beginning of the year (90) 24 (90) 24Amounts recognised directly in OCI before tax 713 221 713 221Less: amounts released to profit or loss before taxNet interest income 37 (56) 37 (56)Other operating expenses (590) (323) (590) (323)Less: deferred tax (45) 44 (45) 44
Balance at the end of the year 25 (90) 25 (90)
Inneffectiveness that arises from cash flow hedges is recognised immediately in profit or loss. A loss of R6 million (2012: Rnil) due to ineffectiveness was recognised in profit or loss.
Foreign exchange derivatives are used to hedge foreign currency risks on behalf of clients and for the group and company’s own positions. Foreign exchange derivatives primarily consist of foreign currency forwards and swaps, foreign exchange futures andforeign exchange options.
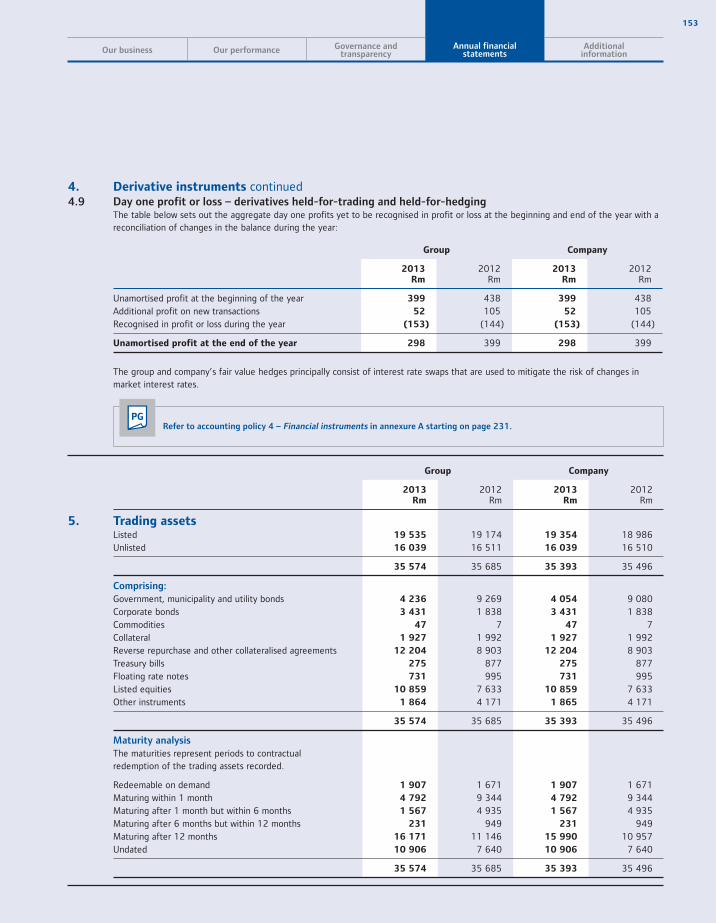
153
Our business Our performance Governance andtransparency
Annual financialstatements
Additionalinformation
4. Derivative instruments continued4.9 Day one profit or loss – derivatives held-for-trading and held-for-hedging The table below sets out the aggregate day one profits yet to be recognised in profit or loss at the beginning and end of the year with a
reconciliation of changes in the balance during the year:
Group Company
2013Rm
2012Rm
2013Rm
2012Rm
Unamortised profit at the beginning of the year 399 438 399 438Additional profit on new transactions 52 105 52 105Recognised in profit or loss during the year (153) (144) (153) (144)
Unamortised profit at the end of the year 298 399 298 399
The group and company’s fair value hedges principally consist of interest rate swaps that are used to mitigate the risk of changes in market interest rates.
PGRefer to accounting policy 4 – Financial instruments in annexure A starting on page 231.
Group Company
2013Rm
2012Rm
2013Rm
2012Rm
5. Trading assetsListed 19 535 19 174 19 354 18 986Unlisted 16 039 16 511 16 039 16 510
35 574 35 685 35 393 35 496
Comprising:
Government, municipality and utility bonds 4 236 9 269 4 054 9 080Corporate bonds 3 431 1 838 3 431 1 838Commodities 47 7 47 7Collateral 1 927 1 992 1 927 1 992Reverse repurchase and other collateralised agreements 12 204 8 903 12 204 8 903Treasury bills 275 877 275 877Floating rate notes 731 995 731 995Listed equities 10 859 7 633 10 859 7 633Other instruments 1 864 4 171 1 865 4 171
35 574 35 685 35 393 35 496
Maturity analysis
The maturities represent periods to contractualredemption of the trading assets recorded.
Redeemable on demand 1 907 1 671 1 907 1 671Maturing within 1 month 4 792 9 344 4 792 9 344Maturing after 1 month but within 6 months 1 567 4 935 1 567 4 935Maturing after 6 months but within 12 months 231 949 231 949Maturing after 12 months 16 171 11 146 15 990 10 957Undated 10 906 7 640 10 906 7 640
35 574 35 685 35 393 35 496
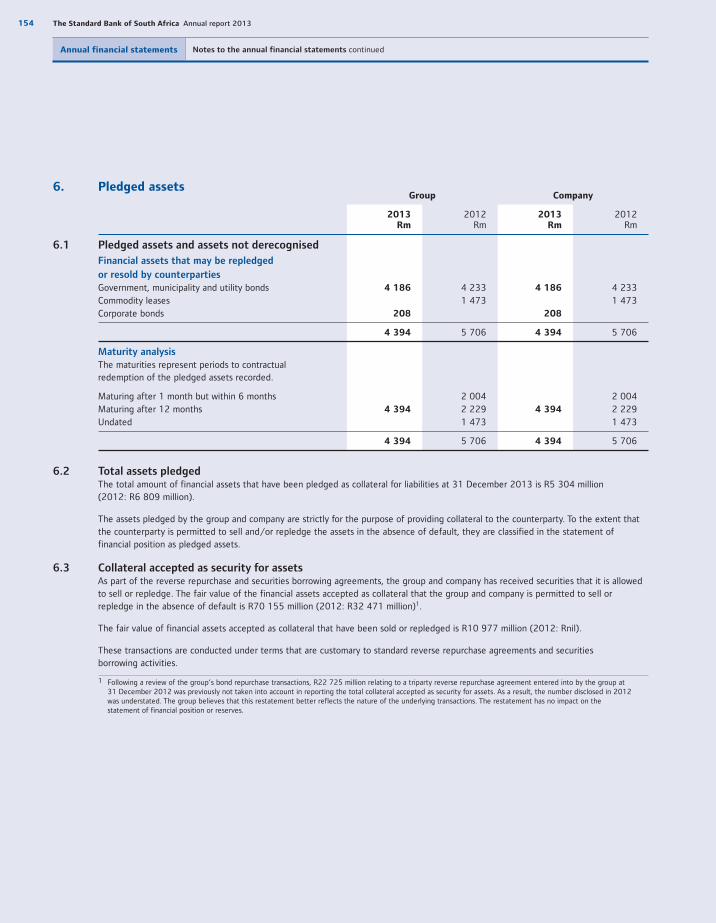
154 The Standard Bank of South Africa Annual report 2013
Annual financial statements Notes to the annual financial statements continued
6. Pledged assets Group Company
2013Rm
2012Rm
2013Rm
2012Rm
6.1 Pledged assets and assets not derecognised
Financial assets that may be repledged
or resold by counterparties
Government, municipality and utility bonds 4 186 4 233 4 186 4 233Commodity leases 1 473 1 473Corporate bonds 208 208
4 394 5 706 4 394 5 706
Maturity analysis
The maturities represent periods to contractualredemption of the pledged assets recorded.
Maturing after 1 month but within 6 months 2 004 2 004Maturing after 12 months 4 394 2 229 4 394 2 229Undated 1 473 1 473
4 394 5 706 4 394 5 706
6.2 Total assets pledged The total amount of financial assets that have been pledged as collateral for liabilities at 31 December 2013 is R5 304 million
(2012: R6 809 million).
The assets pledged by the group and company are strictly for the purpose of providing collateral to the counterparty. To the extent that the counterparty is permitted to sell and/or repledge the assets in the absence of default, they are classified in the statement of financial position as pledged assets.
6.3 Collateral accepted as security for assets As part of the reverse repurchase and securities borrowing agreements, the group and company has received securities that it is allowed
to sell or repledge. The fair value of the financial assets accepted as collateral that the group and company is permitted to sell or repledge in the absence of default is R70 155 million (2012: R32 471 million)1.
The fair value of financial assets accepted as collateral that have been sold or repledged is R10 977 million (2012: Rnil).
These transactions are conducted under terms that are customary to standard reverse repurchase agreements and securitiesborrowing activities.
1 Following a review of the group’s bond repurchase transactions, R22 725 million relating to a triparty reverse repurchase agreement entered into by the group at31 December 2012 was previously not taken into account in reporting the total collateral accepted as security for assets. As a result, the number disclosed in 2012was understated. The group believes that this restatement better reflects the nature of the underlying transactions. The restatement has no impact on thestatement of financial position or reserves.

155
Our business Our performance Governance andtransparency
Annual financialstatements
Additionalinformation
6. Pledged assets continued 6.4 Assets transferred not derecognised Securitisations The group enters into transactions in the normal course of business by which it transfers recognised financial assets directly
to third parties or SEs. These transfers may give rise to full derecognition or partial derecognition of the financial assets concerned.
Full derecognition occurs when the group and company transfers its contractual right to receive cash flows from the financial assets and substantially all the risks and rewards of ownership. The risks transferred include interest rate, currency, prepayment and other price risks.
However, where the group and company has retained substantially all of the credit risk associated with the transferred assets, it continues to recognise these assets.
The following table analyses the carrying amount of securitised financial assets that did not qualify for derecognition during the year, and their associated liabilities:
Group
Carryingamount of
transferredassets
Rm
Carryingamount ofassociated
liabilitiesRm
Fairvalue of
transferredassets
Rm
Fairvalue of
associatedliabilities
Rm
Netfair value
Rm
2013
Mortgage loans 9 937 5 626 9 755 5 642 4 113
2012
Mortgage loans 11 113 7 193 10 985 7 193 3 792
The interests and rights to the mortgage advances have been ceded as security for the associated liabilities, which have recourse only to the transferred assets.
The following table analyses the carrying amount of the group’s continuing involvement within securitisations:
Company
Carryingvalue
Rm
Fairvalue
Rm
Maximumexposure
to riskRm
2013
Mortgage loans 210 210 210
2012
Mortgage loans 209 209 209
Other assets transferred not derecognised The majority of other financial assets that do not qualify for derecognition are debt securities held by counterparties as collateral under
repurchase agreements. Risks to which the group remains exposed include credit and interest rate risk.
The following table presents details of other financial assets which have been sold or otherwise transferred, but which have not been derecognised in their entirety or which were partially derecognised, and their associated liabilities.
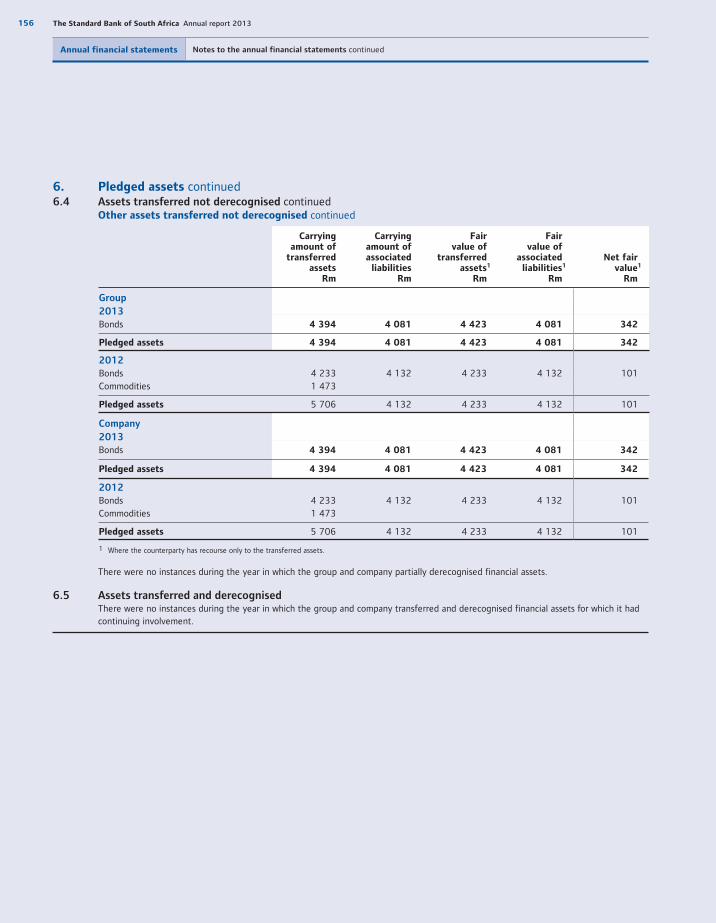
156 The Standard Bank of South Africa Annual report 2013
Annual financial statements Notes to the annual financial statements continued
6. Pledged assets continued 6.4 Assets transferred not derecognised continued Other assets transferred not derecognised continued
Carryingamount of
transferredassets
Rm
Carryingamount ofassociated
liabilitiesRm
Fairvalue of
transferredassets1
Rm
Fairvalue of
associatedliabilities1
Rm
Net fairvalue1
Rm
Group
2013
Bonds 4 394 4 081 4 423 4 081 342
Pledged assets 4 394 4 081 4 423 4 081 342
2012
Bonds 4 233 4 132 4 233 4 132 101Commodities 1 473
Pledged assets 5 706 4 132 4 233 4 132 101
Company
2013
Bonds 4 394 4 081 4 423 4 081 342
Pledged assets 4 394 4 081 4 423 4 081 342
2012
Bonds 4 233 4 132 4 233 4 132 101Commodities 1 473
Pledged assets 5 706 4 132 4 233 4 132 101
1 Where the counterparty has recourse only to the transferred assets.
There were no instances during the year in which the group and company partially derecognised financial assets.
6.5 Assets transferred and derecognised There were no instances during the year in which the group and company transferred and derecognised financial assets for which it had
continuing involvement.

157
Our business Our performance Governance andtransparency
Annual financialstatements
Additionalinformation
7. Non-current asset held for sale RCS Investment Holdings Proprietary Limited (RCS) The group has been a significant shareholder in RCS, alongside The Foschini Group (TFG) since 2005. The group’s current shareholding
in RCS is 45% with TFG holding 55%. During the latter part of 2012, the group and TFG jointly initiated a process to dispose of their investments in RCS. As at 31 December 2012, the group accordingly classified its investment in RCS of R960 million as a non-current asset held for sale in its statement of financial position.
In the first quarter of 2013, the group and TFG reconsidered its alternatives with respect to disposing of their interests in RCS. As a result of the deteriorating state of the consumer credit market and sentiment surrounding consumer lending businesses, the group and TFG were no longer committed to disposing of RCS and a sale was no longer expected to occur within the next year. The interest in RCS was accordingly reclassified to interests in associates.
Where an associate was previously classified as held for sale and no longer meets the criteria for classification as held for sale, the associate should be equity accounted for as from the date of classification as held for sale. The group’s interest in RCS was classified as held for sale as at 31 December 2012, but all 2012 equity accounted earnings for RCS were booked in the group’s 2012 financial year and therefore no income statement restatement is required for the 2012 reporting period.
Group Company
2013Rm
2012Rm
2013Rm
2012Rm
Assets held for saleInterest in associates and joint ventures 960 708
Total assets held for sale 960 708
Group Company
2013Rm
2012Rm
2013Rm
2012Rm
8. Financial investmentsShort-term negotiable securities 48 347 50 856 48 347 50 856
Unlisted1 48 347 50 856 48 347 50 856
Other financial investments 25 257 25 823 25 263 25 834
Listed 20 391 21 729 20 391 21 729Unlisted 4 866 4 094 4 872 4 105
73 604 76 679 73 610 76 690
1 Included in unlisted short-term negotiable securities are SARB debentures, treasury bills and negotiable certificates of deposit.
Comprising:Government, municipality and utility bonds 20 318 22 980 20 318 22 980Corporate bonds 14 459 13 064 14 459 13 064Listed equities 73 402 73 402Unlisted equities 1 901 1 533 1 901 1 539Interest in associates and joint ventures measured at fair value 766 766Mutual funds 1 556 368 1 556 368Treasury bills 33 384 36 138 33 384 36 138Other instruments 1 913 1 428 1 919 1 433
73 604 76 679 73 610 76 690
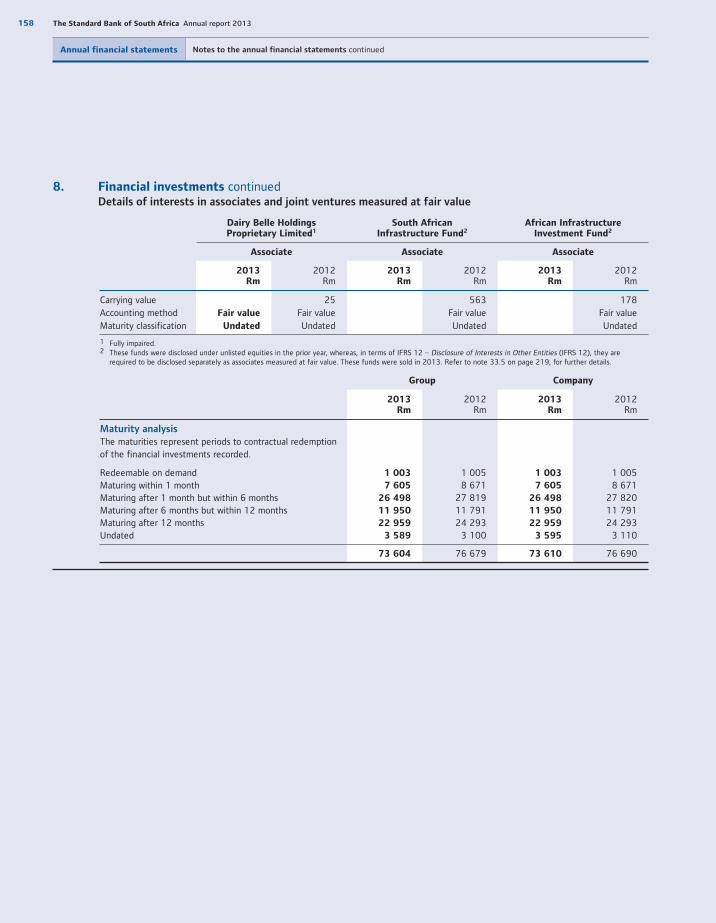
158 The Standard Bank of South Africa Annual report 2013
Annual financial statements Notes to the annual financial statements continued
8. Financial investments continued Details of interests in associates and joint ventures measured at fair value
Dairy Belle Holdings Proprietary Limited1
South AfricanInfrastructure Fund2
African InfrastructureInvestment Fund2
Associate Associate Associate
2013Rm
2012Rm
2013Rm
2012Rm
2013Rm
2012Rm
Carrying value 25 563 178Accounting method Fair value Fair value Fair value Fair valueMaturity classification Undated Undated Undated Undated
1 Fully impaired. 2 These funds were disclosed under unlisted equities in the prior year, whereas, in terms of IFRS 12 – Disclosure of Interests in Other Entities (IFRS 12), they are
required to be disclosed separately as associates measured at fair value. These funds were sold in 2013. Refer to note 33.5 on page 219, for further details.
Group Company
2013Rm
2012Rm
2013Rm
2012Rm
Maturity analysisThe maturities represent periods to contractual redemption of the financial investments recorded.
Redeemable on demand 1 003 1 005 1 003 1 005Maturing within 1 month 7 605 8 671 7 605 8 671Maturing after 1 month but within 6 months 26 498 27 819 26 498 27 820Maturing after 6 months but within 12 months 11 950 11 791 11 950 11 791Maturing after 12 months 22 959 24 293 22 959 24 293Undated 3 589 3 100 3 595 3 110
73 604 76 679 73 610 76 690
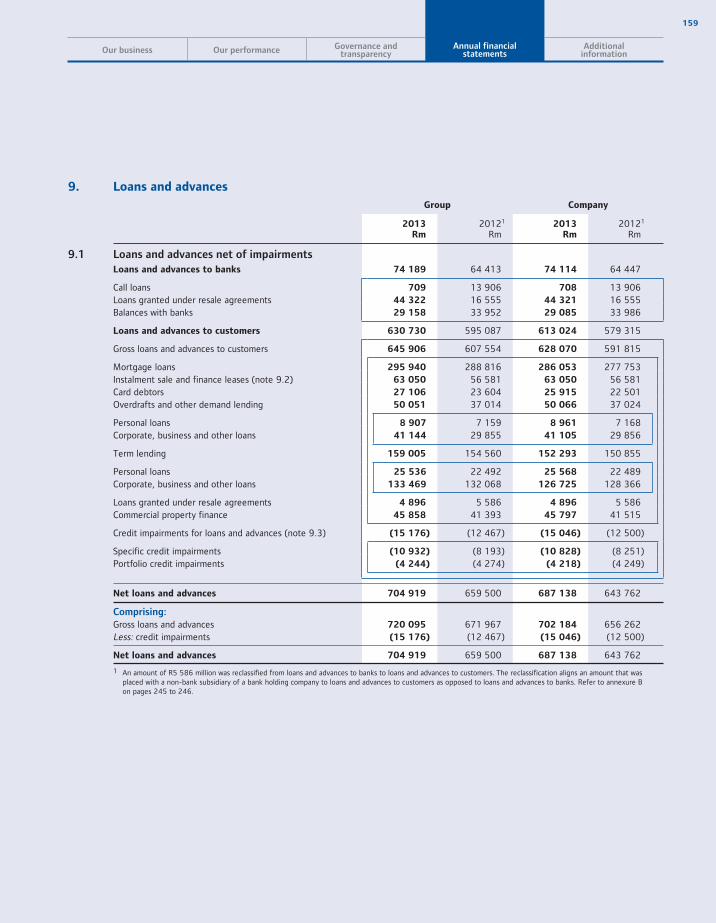
159
Our business Our performance Governance andtransparency
Annual financialstatements
Additionalinformation
9. Loans and advances
Group Company
2013Rm
20121
Rm2013
Rm20121
Rm
9.1 Loans and advances net of impairments
Loans and advances to banks 74 189 64 413 74 114 64 447
Call loans 709 13 906 708 13 906Loans granted under resale agreements 44 322 16 555 44 321 16 555Balances with banks 29 158 33 952 29 085 33 986
Loans and advances to customers 630 730 595 087 613 024 579 315
Gross loans and advances to customers 645 906 607 554 628 070 591 815
Mortgage loans 295 940 288 816 286 053 277 753Instalment sale and finance leases (note 9.2) 63 050 56 581 63 050 56 581Card debtors 27 106 23 604 25 915 22 501Overdrafts and other demand lending 50 051 37 014 50 066 37 024
Personal loans 8 907 7 159 8 961 7 168Corporate, business and other loans 41 144 29 855 41 105 29 856
Term lending 159 005 154 560 152 293 150 855
Personal loans 25 536 22 492 25 568 22 489Corporate, business and other loans 133 469 132 068 126 725 128 366
Loans granted under resale agreements 4 896 5 586 4 896 5 586Commercial property finance 45 858 41 393 45 797 41 515
Credit impairments for loans and advances (note 9.3) (15 176) (12 467) (15 046) (12 500)
Specific credit impairments (10 932) (8 193) (10 828) (8 251)Portfolio credit impairments (4 244) (4 274) (4 218) (4 249)
Net loans and advances 704 919 659 500 687 138 643 762
Comprising:Gross loans and advances 720 095 671 967 702 184 656 262Less: credit impairments (15 176) (12 467) (15 046) (12 500)
Net loans and advances 704 919 659 500 687 138 643 762
1 An amount of R5 586 million was reclassified from loans and advances to banks to loans and advances to customers. The reclassification aligns an amount that was placed with a non-bank subsidiary of a bank holding company to loans and advances to customers as opposed to loans and advances to banks. Refer to annexure B on pages 245 to 246.
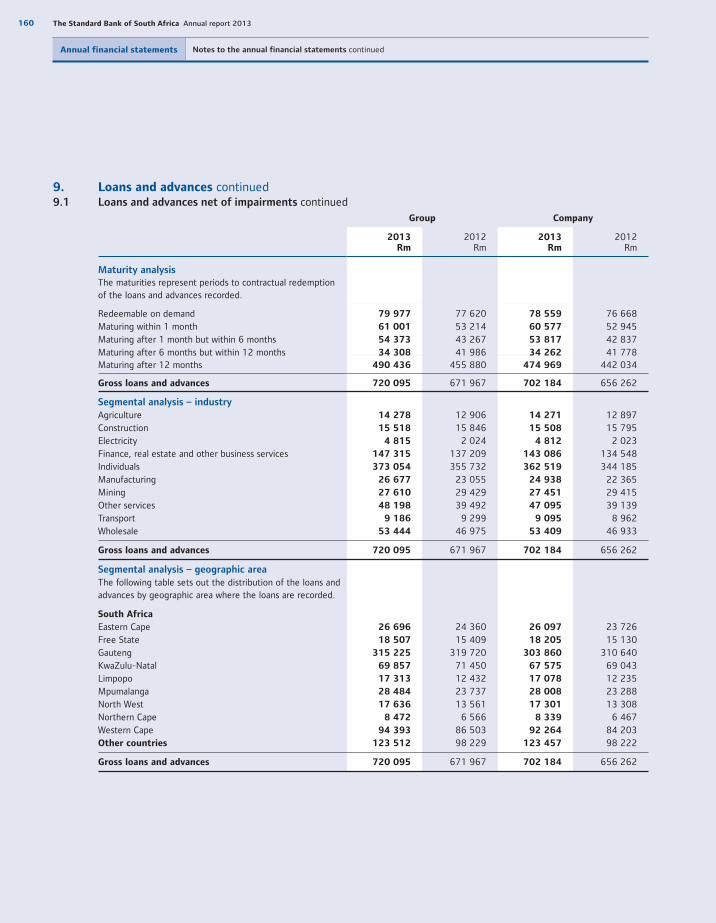
160 The Standard Bank of South Africa Annual report 2013
Annual financial statements Notes to the annual financial statements continued
9. Loans and advances continued9.1 Loans and advances net of impairments continued
Group Company
2013Rm
2012Rm
2013Rm
2012Rm
Maturity analysisThe maturities represent periods to contractual redemption of the loans and advances recorded.
Redeemable on demand 79 977 77 620 78 559 76 668Maturing within 1 month 61 001 53 214 60 577 52 945Maturing after 1 month but within 6 months 54 373 43 267 53 817 42 837Maturing after 6 months but within 12 months 34 308 41 986 34 262 41 778Maturing after 12 months 490 436 455 880 474 969 442 034
Gross loans and advances 720 095 671 967 702 184 656 262
Segmental analysis – industry
Agriculture 14 278 12 906 14 271 12 897Construction 15 518 15 846 15 508 15 795Electricity 4 815 2 024 4 812 2 023Finance, real estate and other business services 147 315 137 209 143 086 134 548Individuals 373 054 355 732 362 519 344 185Manufacturing 26 677 23 055 24 938 22 365Mining 27 610 29 429 27 451 29 415Other services 48 198 39 492 47 095 39 139Transport 9 186 9 299 9 095 8 962Wholesale 53 444 46 975 53 409 46 933
Gross loans and advances 720 095 671 967 702 184 656 262
Segmental analysis – geographic area
The following table sets out the distribution of the loans and advances by geographic area where the loans are recorded.
South Africa
Eastern Cape 26 696 24 360 26 097 23 726Free State 18 507 15 409 18 205 15 130Gauteng 315 225 319 720 303 860 310 640KwaZulu-Natal 69 857 71 450 67 575 69 043Limpopo 17 313 12 432 17 078 12 235Mpumalanga 28 484 23 737 28 008 23 288North West 17 636 13 561 17 301 13 308Northern Cape 8 472 6 566 8 339 6 467Western Cape 94 393 86 503 92 264 84 203Other countries 123 512 98 229 123 457 98 222
Gross loans and advances 720 095 671 967 702 184 656 262
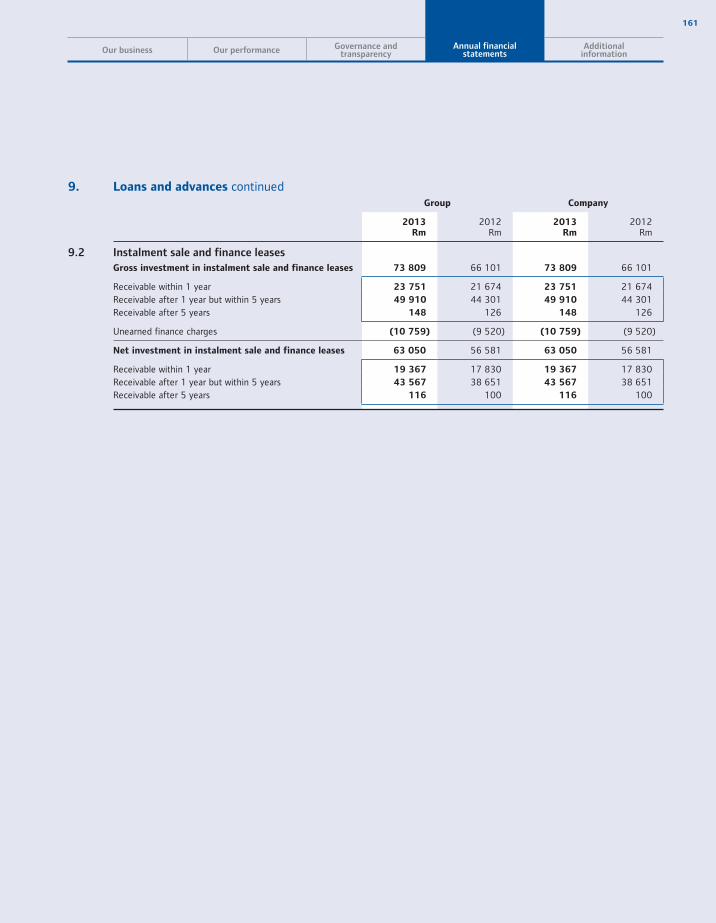
161
Our business Our performance Governance andtransparency
Annual financialstatements
Additionalinformation
9. Loans and advances continuedGroup Company
2013Rm
2012Rm
2013Rm
2012Rm
9.2 Instalment sale and finance leases
Gross investment in instalment sale and finance leases 73 809 66 101 73 809 66 101
Receivable within 1 year 23 751 21 674 23 751 21 674Receivable after 1 year but within 5 years 49 910 44 301 49 910 44 301Receivable after 5 years 148 126 148 126
Unearned finance charges (10 759) (9 520) (10 759) (9 520)
Net investment in instalment sale and finance leases 63 050 56 581 63 050 56 581
Receivable within 1 year 19 367 17 830 19 367 17 830Receivable after 1 year but within 5 years 43 567 38 651 43 567 38 651Receivable after 5 years 116 100 116 100

162 The Standard Bank of South Africa Annual report 2013
Annual financial statements Notes to the annual financial statements continued
9. Loans and advances continued9.3 Credit impairments for loans and advances A reconciliation of the allowance for impairment losses for loans and advances to customers, by class:
Mortgagelending
Rm
Instalmentsale andfinance
leasesRm
Carddebtors
Rm
2013
Group
Specific impairments
Balance at the beginning of the year 4 095 697 560
Impaired accounts written off (2 471) (663) (699)
Discount element recognised in interest income (303) (29) (51)
Net impairments raised1 2 531 890 1 063
Exchange and other movements
Balance at the end of the year 3 852 895 873
Portfolio impairments
Balance at the beginning of the year 689 465 489
Net impairments (released)/raised1 (5) (38) 91
Balance at the end of the year 684 427 580
Total 4 536 1 322 1 453
2012
Group
Specific impairments
Balance at the beginning of the year 3 651 915 808Impaired accounts written off (2 452) (834) (840)Discount element recognised in interest income (540) (39) (57)Net impairments raised1 3 436 642 649Exchange and other movements 13
Balance at the end of the year 4 095 697 560
Portfolio impairments
Balance at the beginning of the year 1 386 441 428 Net impairments (released)/raised1 (697) 24 61
Balance at the end of the year 689 465 489
Total 4 784 1 162 1 049
1 Net impairments raised/(released) less recoveries of amounts written off in previous years as well as credit recovery on off-balance sheet exposure, equals income statement impairment charges (note 27.7).
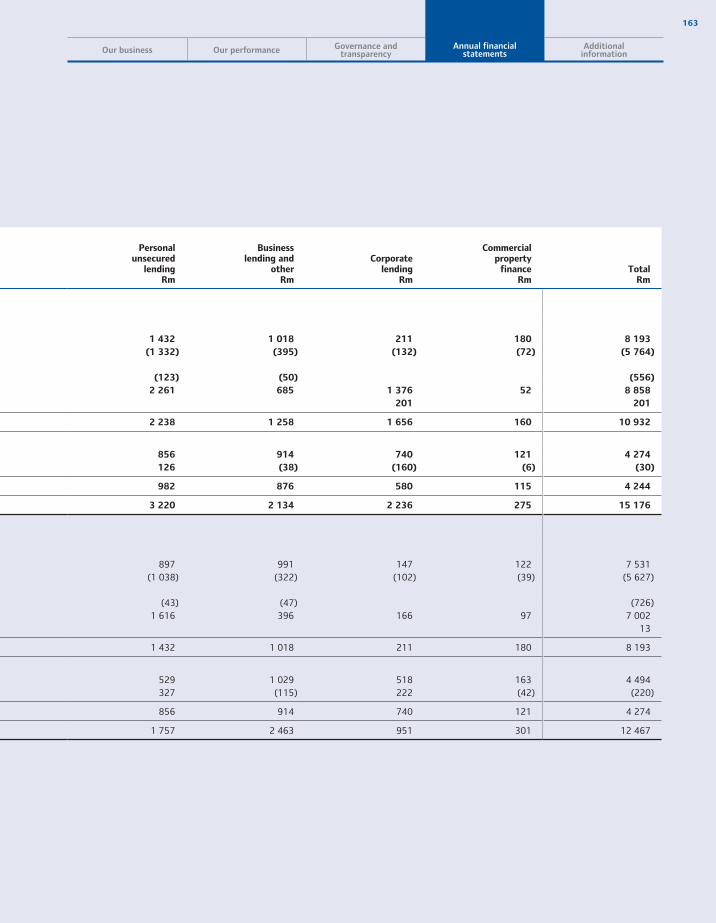
163
Our business Our performance Governance andtransparency
Annual financialstatements
Additionalinformation
Personalunsecured
lendingRm
Businesslending and
otherRm
Corporatelending
Rm
Commercialproperty
financeRm
TotalRm
1 432 1 018 211 180 8 193
(1 332) (395) (132) (72) (5 764)
(123) (50) (556)
2 261 685 1 376 52 8 858
201 201
2 238 1 258 1 656 160 10 932
856 914 740 121 4 274
126 (38) (160) (6) (30)
982 876 580 115 4 244
3 220 2 134 2 236 275 15 176
897 991 147 122 7 531(1 038) (322) (102) (39) (5 627)
(43) (47) (726)1 616 396 166 97 7 002
13
1 432 1 018 211 180 8 193
529 1 029 518 163 4 494 327 (115) 222 (42) (220)
856 914 740 121 4 274
1 757 2 463 951 301 12 467
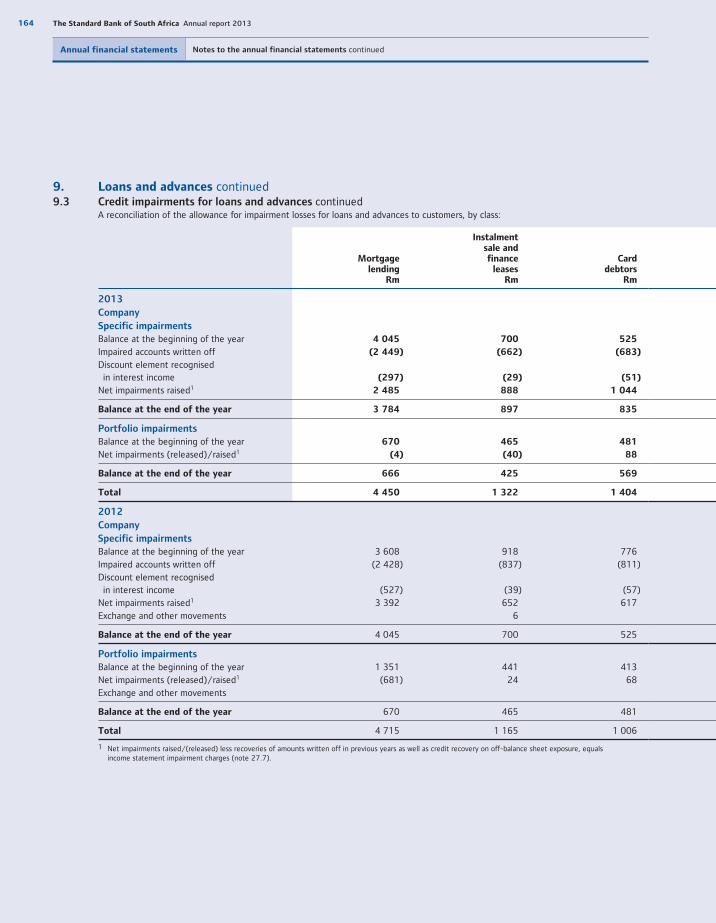
164 The Standard Bank of South Africa Annual report 2013
Annual financial statements Notes to the annual financial statements continued
9. Loans and advances continued9.3 Credit impairments for loans and advances continued A reconciliation of the allowance for impairment losses for loans and advances to customers, by class:
Mortgagelending
Rm
Instalmentsale andfinance
leasesRm
Carddebtors
Rm
2013
Company
Specific impairments
Balance at the beginning of the year 4 045 700 525
Impaired accounts written off (2 449) (662) (683)
Discount element recognised in interest income (297) (29) (51)
Net impairments raised1 2 485 888 1 044
Balance at the end of the year 3 784 897 835
Portfolio impairments
Balance at the beginning of the year 670 465 481
Net impairments (released)/raised1 (4) (40) 88
Balance at the end of the year 666 425 569
Total 4 450 1 322 1 404
2012
Company
Specific impairments
Balance at the beginning of the year 3 608 918 776Impaired accounts written off (2 428) (837) (811)Discount element recognised in interest income (527) (39) (57)Net impairments raised1 3 392 652 617Exchange and other movements 6
Balance at the end of the year 4 045 700 525
Portfolio impairments
Balance at the beginning of the year 1 351 441 413Net impairments (released)/raised1 (681) 24 68Exchange and other movements
Balance at the end of the year 670 465 481
Total 4 715 1 165 1 006
1 Net impairments raised/(released) less recoveries of amounts written off in previous years as well as credit recovery on off-balance sheet exposure, equalsincome statement impairment charges (note 27.7).
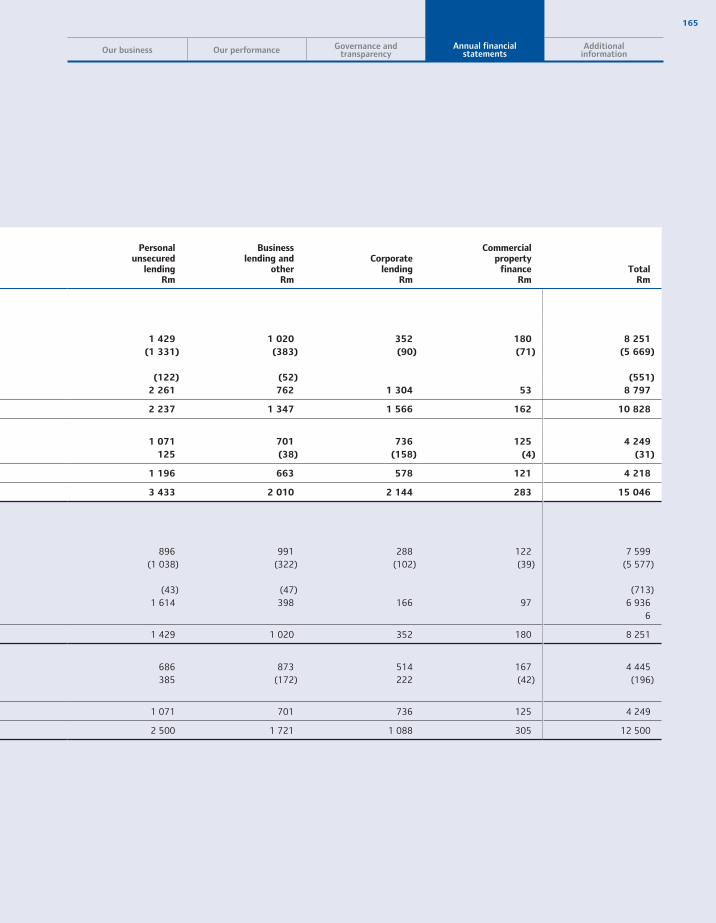
165
Our business Our performance Governance andtransparency
Annual financialstatements
Additionalinformation
Personalunsecured
lendingRm
Businesslending and
otherRm
Corporatelending
Rm
Commercialproperty
financeRm
TotalRm
1 429 1 020 352 180 8 251
(1 331) (383) (90) (71) (5 669)
(122) (52) (551)
2 261 762 1 304 53 8 797
2 237 1 347 1 566 162 10 828
1 071 701 736 125 4 249
125 (38) (158) (4) (31)
1 196 663 578 121 4 218
3 433 2 010 2 144 283 15 046
896 991 288 122 7 599(1 038) (322) (102) (39) (5 577)
(43) (47) (713)1 614 398 166 97 6 936
6
1 429 1 020 352 180 8 251
686 873 514 167 4 445 385 (172) 222 (42) (196)
1 071 701 736 125 4 249
2 500 1 721 1 088 305 12 500

166 The Standard Bank of South Africa Annual report 2013
Annual financial statements Notes to the annual financial statements continued
9. Loans and advances continued9.3 Credit impairments for loans and advances continued The segmental analysis of specific impairments by industry:
Group Company
2013Rm
2012Rm
2013Rm
2012Rm
Agriculture 281 197 281 197Construction 357 419 356 418Electricity 3 3 3 2Finance, real estate and other business services 671 447 670 446Individuals 7 157 6 053 7 071 5 984Manufacturing 196 225 194 223Mining 325 13 324 13Transport 183 62 183 62Wholesale 348 344 348 343Other services 1 411 430 1 398 563
10 932 8 193 10 828 8 251
2013Rm
20121
Rm 2013
Rm20121
Rm
10. Current and deferred tax assetsCurrent tax asset 286 191 286 191Deferred tax asset 38 26 7 1
324 217 293 192
10.1 Deferred tax analysisAccrued interest receivable 4Assessed losses 35 23Assets on lease (286) (344) (286) (345)Depreciation (948) (425) (947) (424)Derivatives (846) (2 427) (846) (2 442)Fair value adjustments on financial instruments 34 (99) 31 (98)Impairment charges on loans and advances 492 636 475 622Deferred income 398 1 019 398 1 019Share-based payments 482 384 482 384Other differences2 539 483 533 483
Deferred tax closing balance (100) (746) (160) (801)
Deferred taxation asset 38 26 7 1Deferred taxation liability (138) (772) (167) (802)
1 Restated, refer to annexure B on page 244.2 The 2012 temporary differences relating to other differences have been restated.
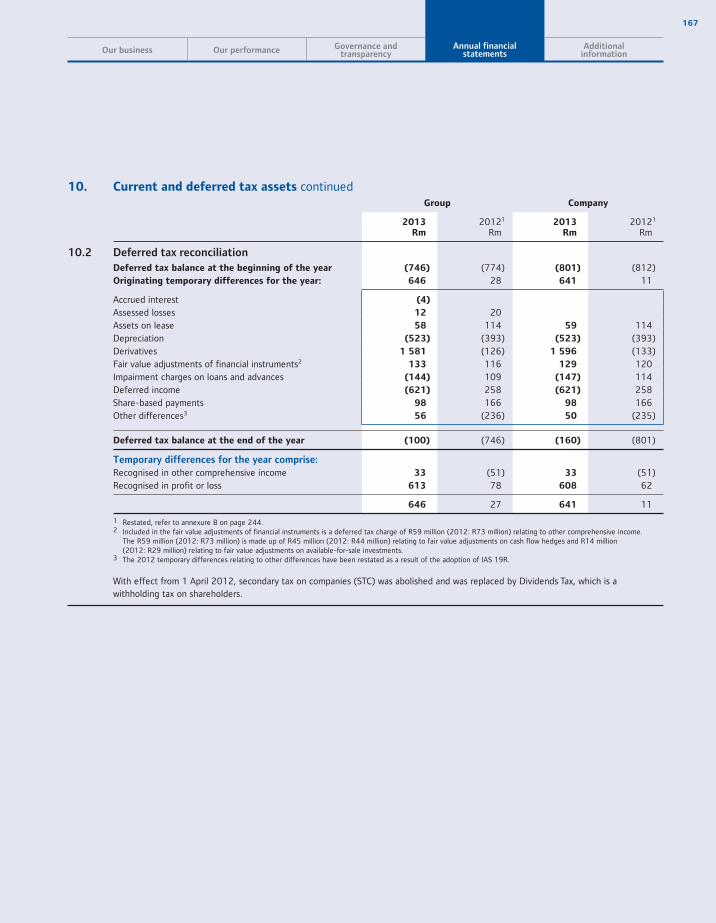
167
Our business Our performance Governance andtransparency
Annual financialstatements
Additionalinformation
10. Current and deferred tax assets continuedGroup Company
2013Rm
20121
Rm 2013
Rm20121
Rm
10.2 Deferred tax reconciliation
Deferred tax balance at the beginning of the year (746) (774) (801) (812)Originating temporary differences for the year: 646 28 641 11
Accrued interest (4)
Assessed losses 12 20Assets on lease 58 114 59 114Depreciation (523) (393) (523) (393)Derivatives 1 581 (126) 1 596 (133)Fair value adjustments of financial instruments2 133 116 129 120Impairment charges on loans and advances (144) 109 (147) 114Deferred income (621) 258 (621) 258Share-based payments 98 166 98 166Other differences3 56 (236) 50 (235)
Deferred tax balance at the end of the year (100) (746) (160) (801)
Temporary differences for the year comprise:
Recognised in other comprehensive income 33 (51) 33 (51)Recognised in profit or loss 613 78 608 62
646 27 641 11
1 Restated, refer to annexure B on page 244.2 Included in the fair value adjustments of financial instruments is a deferred tax charge of R59 million (2012: R73 million) relating to other comprehensive income.
The R59 million (2012: R73 million) is made up of R45 million (2012: R44 million) relating to fair value adjustments on cash flow hedges and R14 million (2012: R29 million) relating to fair value adjustments on available-for-sale investments.
3 The 2012 temporary differences relating to other differences have been restated as a result of the adoption of IAS 19R.
With effect from 1 April 2012, secondary tax on companies (STC) was abolished and was replaced by Dividends Tax, which is a withholding tax on shareholders.
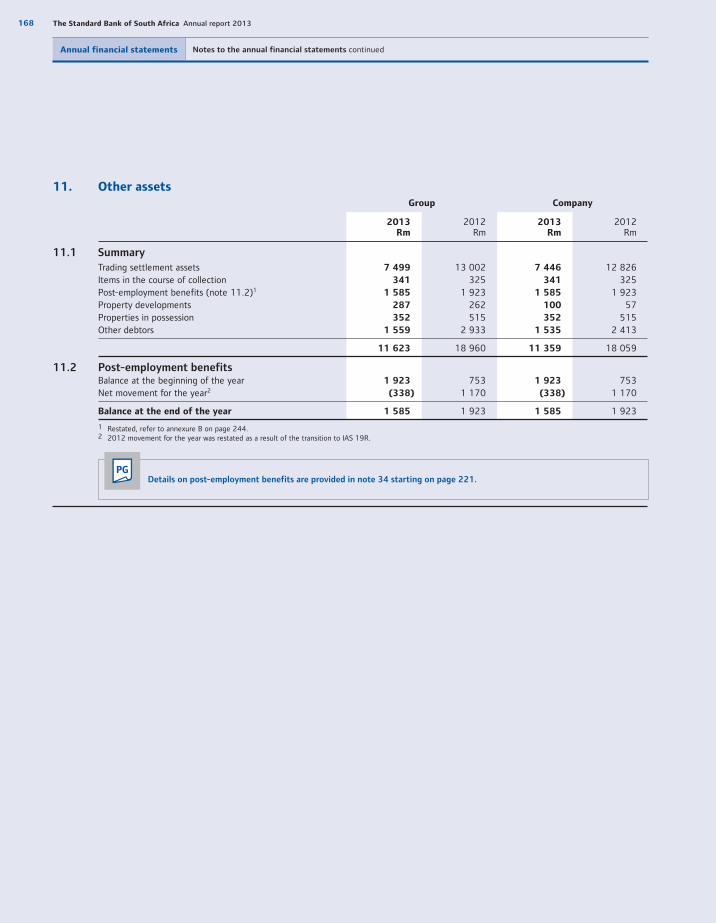
168 The Standard Bank of South Africa Annual report 2013
Annual financial statements Notes to the annual financial statements continued
11. Other assetsGroup Company
2013Rm
2012Rm
2013Rm
2012Rm
11.1 Summary
Trading settlement assets 7 499 13 002 7 446 12 826Items in the course of collection 341 325 341 325Post-employment benefits (note 11.2)1 1 585 1 923 1 585 1 923Property developments 287 262 100 57Properties in possession 352 515 352 515Other debtors 1 559 2 933 1 535 2 413
11 623 18 960 11 359 18 059
11.2 Post-employment benefitsBalance at the beginning of the year 1 923 753 1 923 753Net movement for the year2 (338) 1 170 (338) 1 170
Balance at the end of the year 1 585 1 923 1 585 1 923
1 Restated, refer to annexure B on page 244.2 2012 movement for the year was restated as a result of the transition to IAS 19R.
PGDetails on post-employment benefits are provided in note 34 starting on page 221.
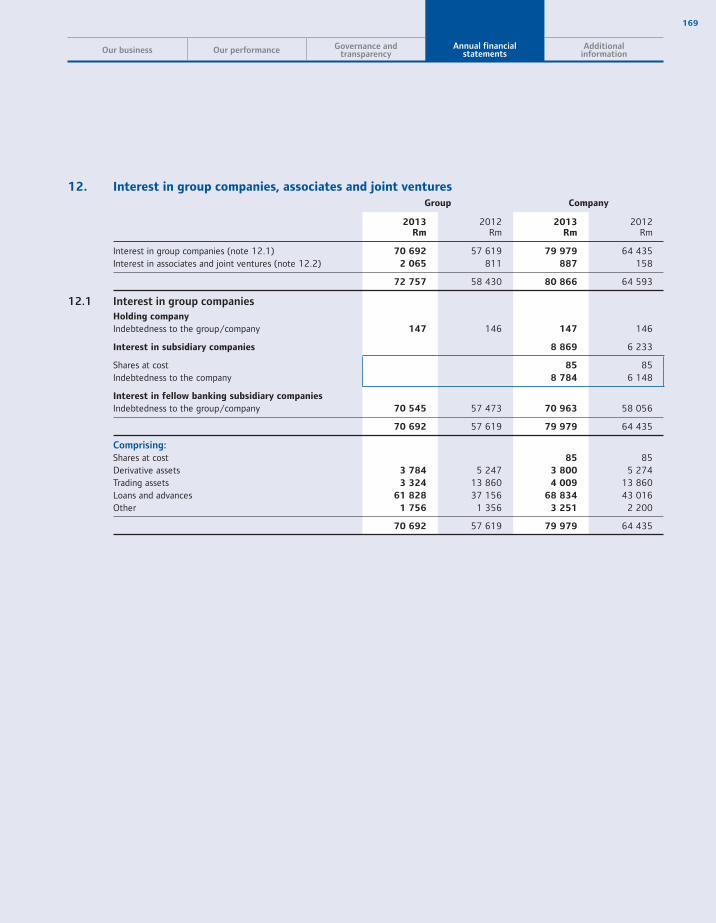
169
Our business Our performance Governance andtransparency
Annual financialstatements
Additionalinformation
12. Interest in group companies, associates and joint venturesGroup Company
2013Rm
2012Rm
2013Rm
2012Rm
Interest in group companies (note 12.1) 70 692 57 619 79 979 64 435Interest in associates and joint ventures (note 12.2) 2 065 811 887 158
72 757 58 430 80 866 64 593
12.1 Interest in group companies
Holding company
Indebtedness to the group/company 147 146 147 146
Interest in subsidiary companies 8 869 6 233
Shares at cost 85 85Indebtedness to the company 8 784 6 148
Interest in fellow banking subsidiary companies
Indebtedness to the group/company 70 545 57 473 70 963 58 056
70 692 57 619 79 979 64 435
Comprising:Shares at cost 85 85Derivative assets 3 784 5 247 3 800 5 274Trading assets 3 324 13 860 4 009 13 860Loans and advances 61 828 37 156 68 834 43 016Other 1 756 1 356 3 251 2 200
70 692 57 619 79 979 64 435

170 The Standard Bank of South Africa Annual report 2013
Annual financial statements Notes to the annual financial statements continued
12. Interest in group companies, associates and joint ventures continuedGroup Company
2013Rm
2012Rm
2013Rm
2012Rm
12.2 Interest in associates and joint ventures
Carrying value at the beginning of the year 811 1 248 158 731Share of profits 303 385Reversal of impairments/(impairments) of associates1 138 (2) 155Reversal of impairments of equity accounted private equity associates included in non-interest revenue 21 26 23
Disposal of associate – carrying value (2) (37) (55)
Loss on disposal of associate (15) (15)Disposal of associate – fair value (2) (22) (40)
Acquisitions 36 35Distribution of profit (28) (25)Reclassified from/(to) held for sale 960 (960) 708 (708)
Carrying value at the end of the year 2 065 811 887 158
Comprising:
Cost of investments 1 224 234 774 206Share of reserves 1 096 803(Impairments)/reversal of impairments (255) (226) 113 (48)
Carrying value at the end of the year 2 065 811 887 158
Share of profits 303 385Reversal of impairments/(impairments) of associates1 138 (2) 155
Share of profits/(losses) from associates
and joint ventures 303 523 (2) 155
1 The recoverable amounts utilised to calculate the impairments were based on price-earnings valuations. The average price-earnings ratios of comparable entities were utilised with adjustments made for the liquidity of the entities’ shares.
There are no significant restrictions on the ability of associates and joint ventures to transfer funds to the group in the form of cash dividends or repayments of loans or advances.
PGAssociates and joint ventures are listed in annexure D on pages 258 to 260.

171
Our business Our performance Governance andtransparency
Annual financialstatements
Additionalinformation
12. Interest in group companies, associates and joint ventures continuedGroup Company
2013Rm
2012Rm
2013Rm
2012Rm
12.3 Liabilities to group companies
Indebtedness by the group/company to:
Ultimate holding company 594 56 594 56Subsidiaries 1 958 2 421Fellow banking subsidiaries 90 094 50 145 90 050 50 088
90 688 50 201 92 602 52 565
Comprising:
Derivative liabilities 5 841 3 062 5 861 3 114Deposit and current accounts 84 476 46 544 86 414 48 914Other 371 595 327 537
90 688 50 201 92 602 52 565
13. Goodwill and other intangible assetsGoodwill (note 13.1) 40 40Other intangible assets (note 13.2) 13 745 10 310 13 737 10 307
13 785 10 350 13 737 10 307
13.1 GoodwillGoodwill on subsidiaries
Cost at the beginning of the year 86 82 39 39(Disposals)/acquisitions1 (7) 4
Cost at the end of the year 79 86 39 39
Accumulated impairment at the beginning of the year (46) (46) (39) (39)Disposals1 7
Accumulated impairment at the end of the year (39) (46) (39) (39)
Carrying amount 40 40
1 Halberg Guss South Africa was sold during 2013.
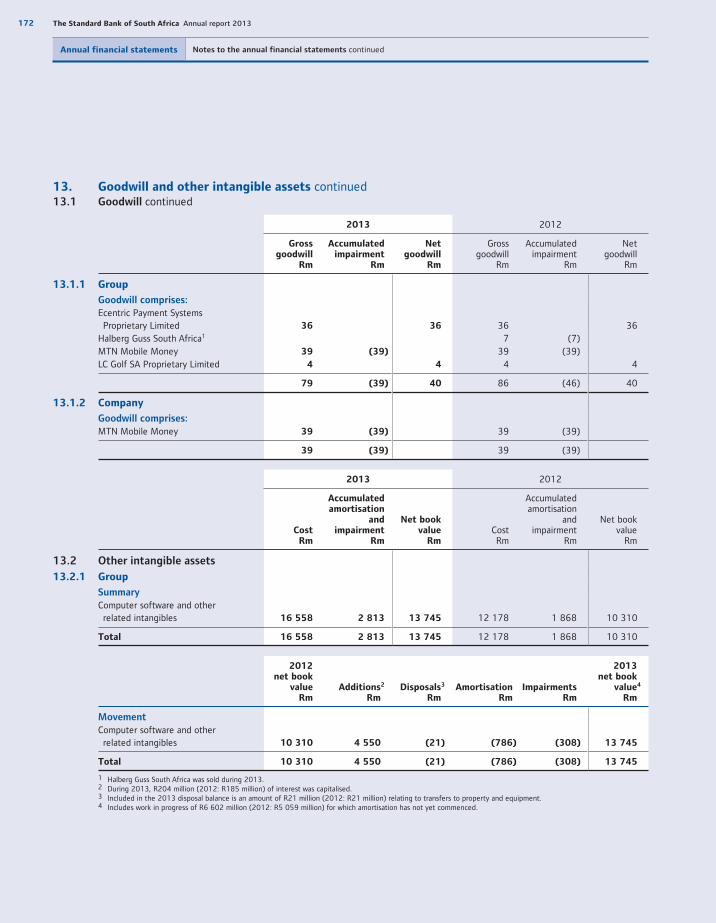
172 The Standard Bank of South Africa Annual report 2013
Annual financial statements Notes to the annual financial statements continued
13. Goodwill and other intangible assets continued13.1 Goodwill continued
2013 2012
Grossgoodwill
Rm
Accumulated impairment
Rm
Netgoodwill
Rm
Grossgoodwill
Rm
Accumulated impairment
Rm
Netgoodwill
Rm
13.1.1 Group
Goodwill comprises:
Ecentric Payment Systems Proprietary Limited 36 36 36 36Halberg Guss South Africa1 7 (7)MTN Mobile Money 39 (39) 39 (39)LC Golf SA Proprietary Limited 4 4 4 4
79 (39) 40 86 (46) 40
13.1.2 Company
Goodwill comprises:
MTN Mobile Money 39 (39) 39 (39)
39 (39) 39 (39)
2013 2012
CostRm
Accumulated amortisation
andimpairment
Rm
Net book value
RmCostRm
Accumulatedamortisation
and impairment
Rm
Net bookvalue
Rm
13.2 Other intangible assets
13.2.1 Group
Summary
Computer software and other related intangibles 16 558 2 813 13 745 12 178 1 868 10 310
Total 16 558 2 813 13 745 12 178 1 868 10 310
2012net book
valueRm
Additions2
RmDisposals3
RmAmortisation
RmImpairments
Rm
2013net book
value4
Rm
Movement
Computer software and other related intangibles 10 310 4 550 (21) (786) (308) 13 745
Total 10 310 4 550 (21) (786) (308) 13 745
1 Halberg Guss South Africa was sold during 2013.2 During 2013, R204 million (2012: R185 million) of interest was capitalised.3 Included in the 2013 disposal balance is an amount of R21 million (2012: R21 million) relating to transfers to property and equipment.4 Includes work in progress of R6 602 million (2012: R5 059 million) for which amortisation has not yet commenced.
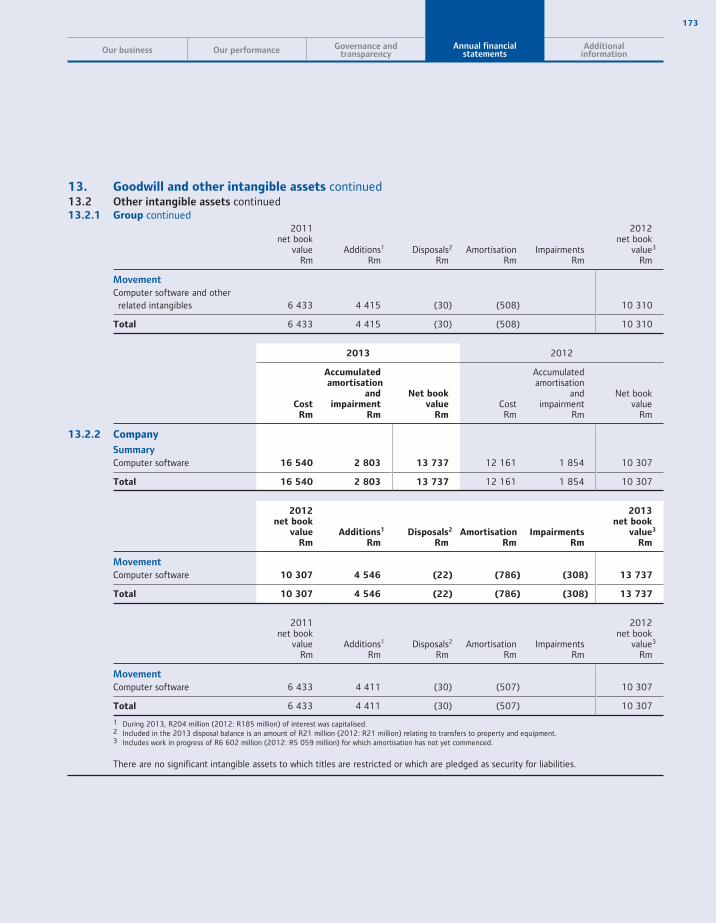
173
Our business Our performance Governance andtransparency
Annual financialstatements
Additionalinformation
13. Goodwill and other intangible assets continued13.2 Other intangible assets continued13.2.1 Group continued
2011net book
valueRm
Additions1
RmDisposals2
RmAmortisation
RmImpairments
Rm
2012net book
value3
Rm
Movement
Computer software and other related intangibles 6 433 4 415 (30) (508) 10 310
Total 6 433 4 415 (30) (508) 10 310
2013 2012
CostRm
Accumulated amortisation
andimpairment
Rm
Net book value
RmCostRm
Accumulatedamortisation
and impairment
Rm
Net bookvalue
Rm
13.2.2 Company
Summary
Computer software 16 540 2 803 13 737 12 161 1 854 10 307
Total 16 540 2 803 13 737 12 161 1 854 10 307
2012net book
valueRm
Additions1
RmDisposals2
RmAmortisation
RmImpairments
Rm
2013net book
value3
Rm
Movement
Computer software 10 307 4 546 (22) (786) (308) 13 737
Total 10 307 4 546 (22) (786) (308) 13 737
2011net book
valueRm
Additions1
RmDisposals2
RmAmortisation
RmImpairments
Rm
2012net book
value3
Rm
Movement
Computer software 6 433 4 411 (30) (507) 10 307
Total 6 433 4 411 (30) (507) 10 307
1 During 2013, R204 million (2012: R185 million) of interest was capitalised.2 Included in the 2013 disposal balance is an amount of R21 million (2012: R21 million) relating to transfers to property and equipment.3 Includes work in progress of R6 602 million (2012: R5 059 million) for which amortisation has not yet commenced.
There are no significant intangible assets to which titles are restricted or which are pledged as security for liabilities.
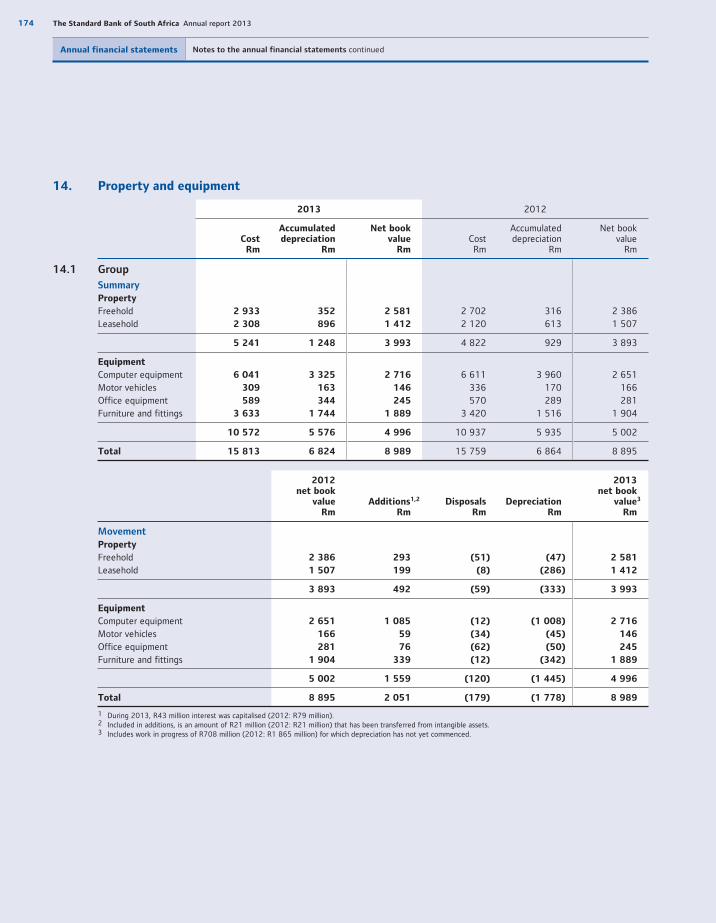
174 The Standard Bank of South Africa Annual report 2013
Annual financial statements Notes to the annual financial statements continued
14. Property and equipment
2013 2012
CostRm
Accumulated depreciation
Rm
Net bookvalue
RmCostRm
Accumulateddepreciation
Rm
Net bookvalue
Rm
14.1 Group
Summary
Property
Freehold 2 933 352 2 581 2 702 316 2 386Leasehold 2 308 896 1 412 2 120 613 1 507
5 241 1 248 3 993 4 822 929 3 893
Equipment
Computer equipment 6 041 3 325 2 716 6 611 3 960 2 651Motor vehicles 309 163 146 336 170 166Office equipment 589 344 245 570 289 281Furniture and fittings 3 633 1 744 1 889 3 420 1 516 1 904
10 572 5 576 4 996 10 937 5 935 5 002
Total 15 813 6 824 8 989 15 759 6 864 8 895
2012net book
valueRm
Additions1,2
RmDisposals
RmDepreciation
Rm
2013net book
value3
Rm
Movement
Property
Freehold 2 386 293 (51) (47) 2 581
Leasehold 1 507 199 (8) (286) 1 412
3 893 492 (59) (333) 3 993
Equipment
Computer equipment 2 651 1 085 (12) (1 008) 2 716
Motor vehicles 166 59 (34) (45) 146
Office equipment 281 76 (62) (50) 245
Furniture and fittings 1 904 339 (12) (342) 1 889
5 002 1 559 (120) (1 445) 4 996
Total 8 895 2 051 (179) (1 778) 8 989
1 During 2013, R43 million interest was capitalised (2012: R79 million).2 Included in additions, is an amount of R21 million (2012: R21 million) that has been transferred from intangible assets.3 Includes work in progress of R708 million (2012: R1 865 million) for which depreciation has not yet commenced.
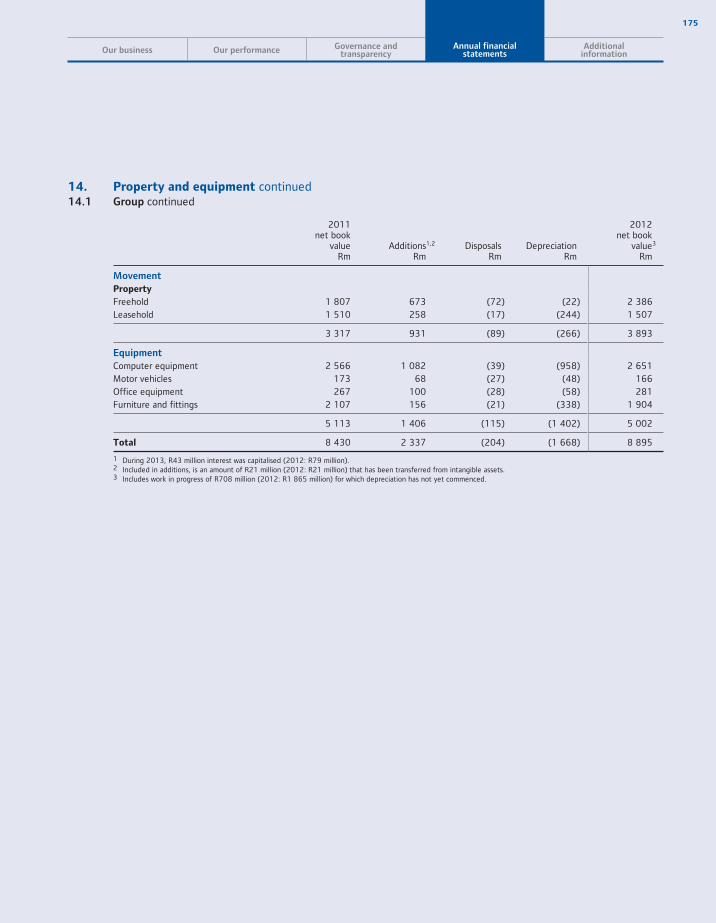
175
Our business Our performance Governance andtransparency
Annual financialstatements
Additionalinformation
14. Property and equipment continued14.1 Group continued
2011net book
valueRm
Additions1,2
RmDisposals
RmDepreciation
Rm
2012net book
value3
Rm
Movement Property
Freehold 1 807 673 (72) (22) 2 386Leasehold 1 510 258 (17) (244) 1 507
3 317 931 (89) (266) 3 893
Equipment
Computer equipment 2 566 1 082 (39) (958) 2 651Motor vehicles 173 68 (27) (48) 166Office equipment 267 100 (28) (58) 281Furniture and fittings 2 107 156 (21) (338) 1 904
5 113 1 406 (115) (1 402) 5 002
Total 8 430 2 337 (204) (1 668) 8 895
1 During 2013, R43 million interest was capitalised (2012: R79 million).2 Included in additions, is an amount of R21 million (2012: R21 million) that has been transferred from intangible assets.3 Includes work in progress of R708 million (2012: R1 865 million) for which depreciation has not yet commenced.
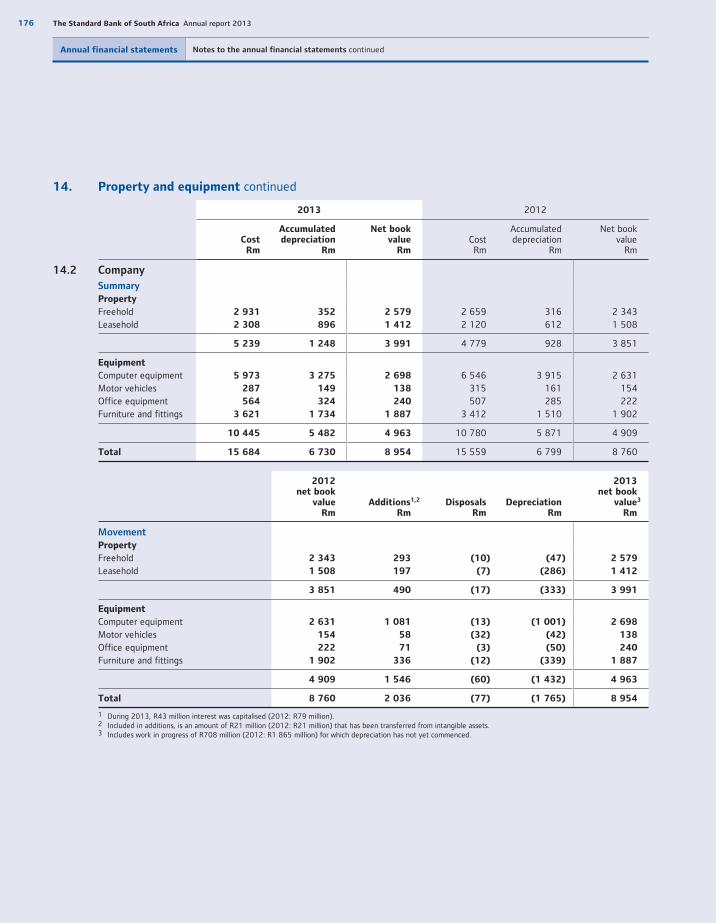
176 The Standard Bank of South Africa Annual report 2013
Annual financial statements Notes to the annual financial statements continued
14. Property and equipment continued
2013 2012
CostRm
Accumulated depreciation
Rm
Net bookvalue
RmCostRm
Accumulateddepreciation
Rm
Net bookvalue
Rm
14.2 Company
Summary
Property
Freehold 2 931 352 2 579 2 659 316 2 343Leasehold 2 308 896 1 412 2 120 612 1 508
5 239 1 248 3 991 4 779 928 3 851
Equipment
Computer equipment 5 973 3 275 2 698 6 546 3 915 2 631Motor vehicles 287 149 138 315 161 154Office equipment 564 324 240 507 285 222Furniture and fittings 3 621 1 734 1 887 3 412 1 510 1 902
10 445 5 482 4 963 10 780 5 871 4 909
Total 15 684 6 730 8 954 15 559 6 799 8 760
2012net book
valueRm
Additions1,2
RmDisposals
RmDepreciation
Rm
2013net book
value3
Rm
Movement
Property
Freehold 2 343 293 (10) (47) 2 579
Leasehold 1 508 197 (7) (286) 1 412
3 851 490 (17) (333) 3 991
Equipment
Computer equipment 2 631 1 081 (13) (1 001) 2 698
Motor vehicles 154 58 (32) (42) 138
Office equipment 222 71 (3) (50) 240
Furniture and fittings 1 902 336 (12) (339) 1 887
4 909 1 546 (60) (1 432) 4 963
Total 8 760 2 036 (77) (1 765) 8 954
1 During 2013, R43 million interest was capitalised (2012: R79 million).2 Included in additions, is an amount of R21 million (2012: R21 million) that has been transferred from intangible assets.3 Includes work in progress of R708 million (2012: R1 865 million) for which depreciation has not yet commenced.
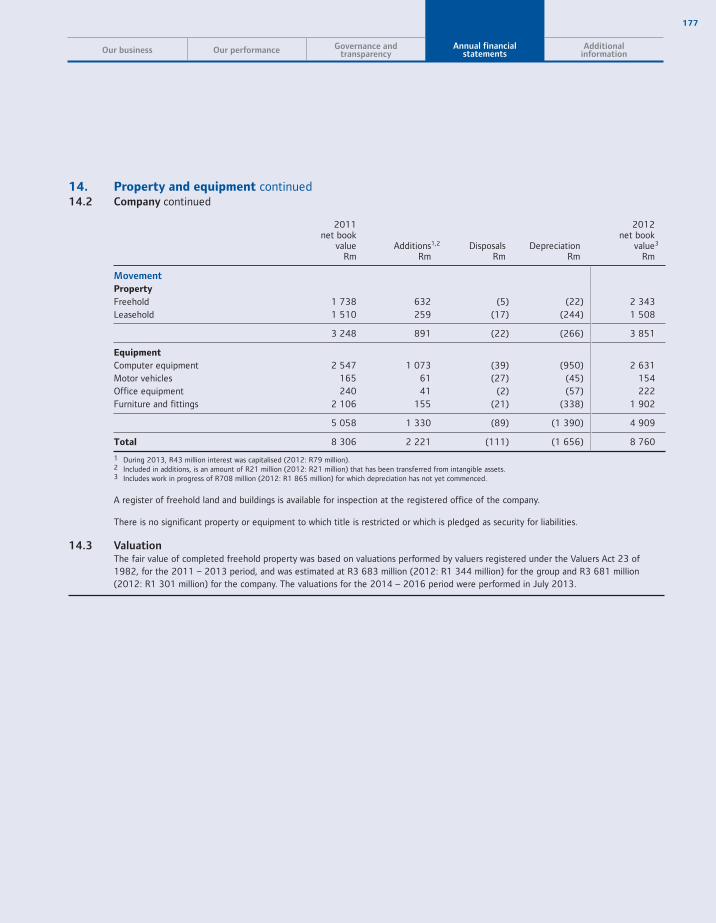
177
Our business Our performance Governance andtransparency
Annual financialstatements
Additionalinformation
14. Property and equipment continued14.2 Company continued
2011net book
valueRm
Additions1,2
RmDisposals
RmDepreciation
Rm
2012net book
value3
Rm
Movement
Property
Freehold 1 738 632 (5) (22) 2 343Leasehold 1 510 259 (17) (244) 1 508
3 248 891 (22) (266) 3 851
Equipment
Computer equipment 2 547 1 073 (39) (950) 2 631Motor vehicles 165 61 (27) (45) 154Office equipment 240 41 (2) (57) 222Furniture and fittings 2 106 155 (21) (338) 1 902
5 058 1 330 (89) (1 390) 4 909
Total 8 306 2 221 (111) (1 656) 8 760
1 During 2013, R43 million interest was capitalised (2012: R79 million).2 Included in additions, is an amount of R21 million (2012: R21 million) that has been transferred from intangible assets.3 Includes work in progress of R708 million (2012: R1 865 million) for which depreciation has not yet commenced.
A register of freehold land and buildings is available for inspection at the registered office of the company.
There is no significant property or equipment to which title is restricted or which is pledged as security for liabilities.
14.3 Valuation The fair value of completed freehold property was based on valuations performed by valuers registered under the Valuers Act 23 of
1982, for the 2011 – 2013 period, and was estimated at R3 683 million (2012: R1 344 million) for the group and R3 681 million(2012: R1 301 million) for the company. The valuations for the 2014 – 2016 period were performed in July 2013.
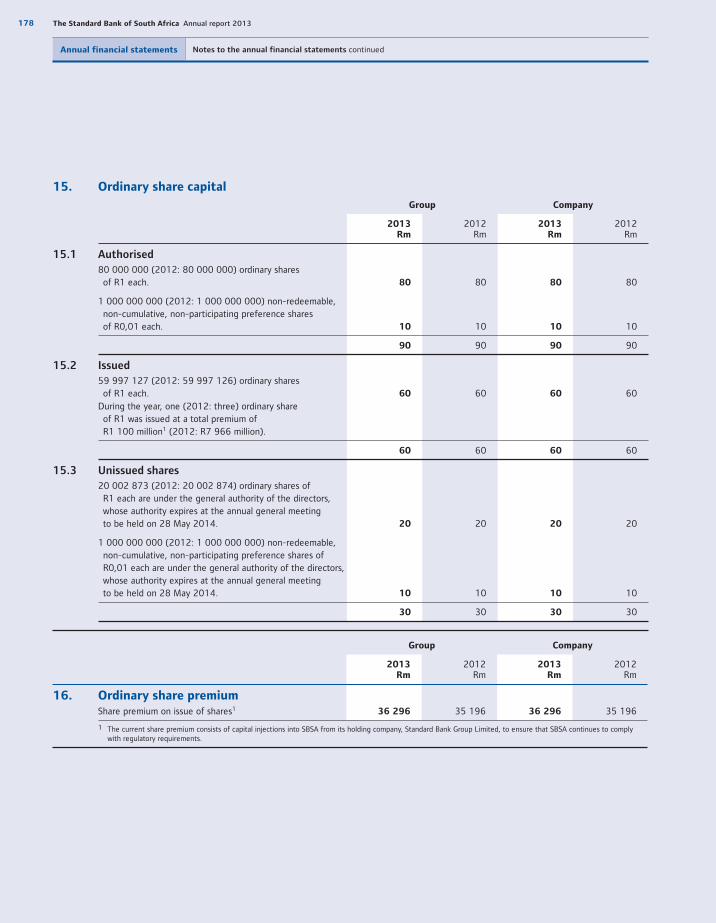
178 The Standard Bank of South Africa Annual report 2013
Annual financial statements Notes to the annual financial statements continued
15. Ordinary share capital
Group Company
2013Rm
2012Rm
2013Rm
2012Rm
15.1 Authorised
80 000 000 (2012: 80 000 000) ordinary shares of R1 each. 80 80 80 80
1 000 000 000 (2012: 1 000 000 000) non-redeemable, non-cumulative, non-participating preference sharesof R0,01 each. 10 10 10 10
90 90 90 90
15.2 Issued
59 997 127 (2012: 59 997 126) ordinary shares of R1 each. 60 60 60 60During the year, one (2012: three) ordinary share of R1 was issued at a total premium ofR1 100 million1 (2012: R7 966 million).
60 60 60 60
15.3 Unissued shares
20 002 873 (2012: 20 002 874) ordinary shares of R1 each are under the general authority of the directors, whose authority expires at the annual general meetingto be held on 28 May 2014. 20 20 20 20
1 000 000 000 (2012: 1 000 000 000) non-redeemable, non-cumulative, non-participating preference shares of R0,01 each are under the general authority of the directors, whose authority expires at the annual general meetingto be held on 28 May 2014. 10 10 10 10
30 30 30 30
Group Company
2013Rm
2012Rm
2013Rm
2012Rm
16. Ordinary share premium Share premium on issue of shares1 36 296 35 196 36 296 35 196
1 The current share premium consists of capital injections into SBSA from its holding company, Standard Bank Group Limited, to ensure that SBSA continues to comply with regulatory requirements.

179
Our business Our performance Governance andtransparency
Annual financialstatements
Additionalinformation
17. Trading liabilities
Group Company
2013Rm
20121
Rm2013
Rm20121
Rm
Listed 3 215 3 044 3 215 3 044Unlisted 17 209 18 177 17 209 18 177
20 424 21 221 20 424 21 221
Comprising:
Government, municipality and utility bonds 957 714 957 714Listed equities 94 94
Collateral 211 2 388 211 2 388Repurchase and other collateralised agreements 10 327 12 800 10 327 12 800Credit-linked notes 2 068 2 068
Commodities 1 386 1 386
Other instruments 5 381 5 319 5 381 5 319
20 424 21 221 20 424 21 221
Maturity analysis
The maturities represent periods to contractualredemption of the trading liabilities recorded.Repayable on demand 211 1 232 211 1 232Maturing within 1 month 10 608 12 886 10 608 12 886Maturing after 1 month but within 6 months 1 469 1 100 1 469 1 100Maturing after 6 months but within 12 months 1 068 1 985 1 068 1 985Maturing after 12 months 5 588 4 018 5 588 4 018Undated 1 480 1 480
20 424 21 221 20 424 21 221
1 Restated, refer to annexure B on page 244.

180 The Standard Bank of South Africa Annual report 2013
Annual financial statements Notes to the annual financial statements continued
18. Deposit and current accounts
Group Company
2013Rm
20121
Rm2013
Rm20121
Rm
Deposits from banks 60 380 78 453 60 535 78 453
Deposits from banks and central banks 59 852 77 047 60 007 77 047Deposits from banks under repurchase agreements 528 1 406 528 1 406
Deposits from customers 660 970 634 223 650 574 622 865
Current accounts 89 049 73 914 89 049 73 914Cash management deposits 120 962 103 899 120 962 103 899Card creditors 1 471 1 452 1 471 1 452Call deposits 147 602 131 518 147 603 131 519Savings accounts 13 574 19 700 13 574 19 699Term deposits 164 222 200 098 159 605 195 932Negotiable certificates of deposit 90 946 75 905 90 946 75 905Repurchase agreements 432 38 432 38Securitisation issuances 5 625 7 192Other funding 27 087 20 507 26 932 20 507
Deposit and current accounts 721 350 712 676 711 109 701 318
Maturity analysis
The maturities represent periods to contractual redemptionof the deposit and current accounts recorded.
Repayable on demand 422 174 362 508 422 173 362 509Maturing within 1 month 54 907 55 545 53 136 52 946Maturing after 1 month but within 6 months 98 176 113 441 96 017 109 756Maturing after 6 months but within 12 months 32 138 46 364 32 041 46 364Maturing after 12 months 113 955 134 818 107 742 129 743
721 350 712 676 711 109 701 318
1 Restated, refer to annexure B on page 244.

181
Our business Our performance Governance andtransparency
Annual financialstatements
Additionalinformation
19. Current and deferred tax liabilities
Group Company
2013Rm
2012Rm
2013Rm
2012Rm
Current tax liability 3 361 2 940 3 359 2 933Deferred tax liability1 138 772 167 802
3 499 3 712 3 526 3 735
1 Restated, refer to annexure B on page 244.
20. Provisions and other liabilities
20.1 Summary
Trading settlement liabilities 2 459 5 953 2 459 5 953Items in the course of transmission 444 802 484 828Provision for post-employment benefits (note 20.2) 663 644 663 644Cash-settled share-based payment liability (annexure E) 1 205 981 1 205 981DBS (annexure E) 130 175 130 175DBS post 2011 (annexure E) 408 185 408 185Staff-related accruals 2 996 2 551 2 983 2 542Other liabilities, accruals and provisions 5 779 6 282 5 476 5 603
14 084 17 573 13 808 16 911
20.2 Provision for post-employment benefits
Balance at the beginning of the year 644 637 644 637Net provision raised 19 7 19 7
Balance at the end of the year 663 644 663 644
PGDetails of post-employment benefits are provided in note 34 on page 221.

182 The Standard Bank of South Africa Annual report 2013
Annual financial statements Notes to the annual financial statements continued
21. Subordinated debt
Dateissued Rate %
Callabledate
Group and company
Unsecured, subordinated, redeemable bonds2
Redeemable in 2018 (SBK 8)3 2006/04/10 8.204 2013/04/105
Redeemable in 2019 (SBKi 11) 2009/04/09 CPI indexed7 2014/04/105
Redeemable in 2020 (SBK 7) 2005/05/24 9.634 2015/05/245
Redeemable in 2021 (SBK 12) 2009/11/24 10.824 2016/11/245
Redeemable in 2021 (SBK 13) 2009/11/24 JIBAR6 + 2.20 2016/11/245
Redeemable in 2022 (SBK 15) 2012/01/23 JIBAR6 + 2.00 2017/01/23Redeemable in 2022 (SBK 14) 2011/01/01 9.664 2017/12/015
Redeemable in 2023 (SBK 16) 2012/03/15 JIBAR6 + 2.10 2018/03/15Redeemable in 2023 (SBK 9) 2006/04/10 8.404 2018/04/105
Redeemable in 2024 (SBK 17) 2012/07/30 JIBAR6 + 2.20 2019/07/30Redeemable in 2024 (SBK 19) 2012/10/24 JIBAR6 + 2.20 2019/10/24Redeemable in 2025 (SBK 18) 2012/10/24 JIBAR6 + 2.35 2020/10/24
Total subordinated debt
1 The difference between the carrying and notional value represents transaction costs included in the initial carrying amounts, accrued interest and the unamortised fair value adjustments relating to bonds hedged for interest rate risk.
2 All bonds are at a tier II level.3 Redeemed during 2013.4 Fixed semi-annual coupon.5 The issuer may redeem on this date, or any subsequent interest payment date.6 JIBAR is the three-month floating Johannesburg interbank agreed rate.7 The interest rate is calculated in terms of the pricing supplement using the base rate as defined adjusted for changes in the CPI as published by Statistics South Africa.8 RY is the real yield, which is the return from an investment adjusted for the effects of inflation, compounded semi-annually.
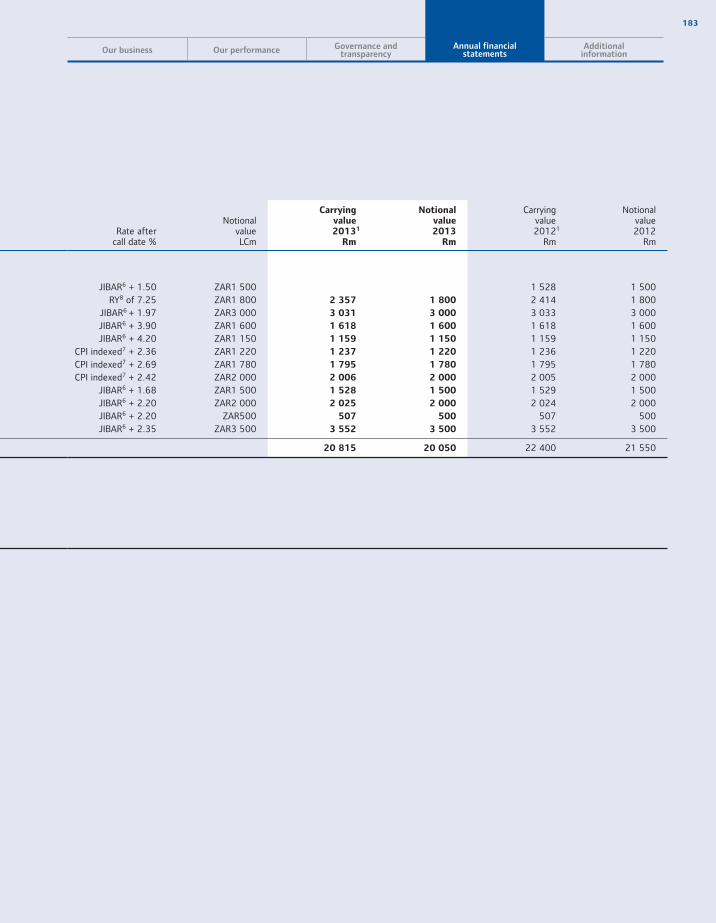
183
Our business Our performance Governance andtransparency
Annual financialstatements
Additionalinformation
Rate aftercall date %
NotionalvalueLCm
Carryingvalue20131
Rm
Notionalvalue2013
Rm
Carryingvalue20121
Rm
Notionalvalue2012
Rm
JIBAR6 + 1.50 ZAR1 500 1 528 1 500RY8 of 7.25 ZAR1 800 2 357 1 800 2 414 1 800
JIBAR6 + 1.97 ZAR3 000 3 031 3 000 3 033 3 000JIBAR6 + 3.90 ZAR1 600 1 618 1 600 1 618 1 600JIBAR6 + 4.20 ZAR1 150 1 159 1 150 1 159 1 150
CPI indexed7 + 2.36 ZAR1 220 1 237 1 220 1 236 1 220CPI indexed7 + 2.69 ZAR1 780 1 795 1 780 1 795 1 780CPI indexed7 + 2.42 ZAR2 000 2 006 2 000 2 005 2 000
JIBAR6 + 1.68 ZAR1 500 1 528 1 500 1 529 1 500JIBAR6 + 2.20 ZAR2 000 2 025 2 000 2 024 2 000JIBAR6 + 2.20 ZAR500 507 500 507 500JIBAR6 + 2.35 ZAR3 500 3 552 3 500 3 552 3 500
20 815 20 050 22 400 21 550

184 The Standard Bank of South Africa Annual report 2013
Annual financial statements Notes to the annual financial statements continued
22. Classification of assets and liabilities Accounting classifications and fair values The table below sets out the group’s classification of financial assets and liabilities, and their fair values.
Group Note
Held-for-trading1
Rm
Designatedat fair value
Rm
2013AssetsCash and balances with central banks 3Derivative assets 4.7 59 974Trading assets 5 35 574Pledged assets 6.1 4 186Financial investments 8 504 59 023Loans and advances to banks 9.1Loans and advances to customers 9.1 1 074 131Interest in group companies, associates and joint ventures 12 7 108 596Other financial assetsOther non-financial assets
108 420 59 750
LiabilitiesDerivative liabilities 4.7 65 813Trading liabilities 17 20 424Deposits from banks 18 932Deposits from customers 18 20 875Subordinated debt 21Liabilities to group companies 12.3 5 841 2 242Other financial liabilitiesOther non-financial liabilities
92 078 24 049
2012AssetsCash and balances with the central bank 3Derivative assets 4.7 78 844Trading assets 5 35 685Pledged assets 6.1 5 706Non-current asset held for sale 7Financial investments 8 62 521Loans and advances to banks5 9.1 2 044Loans and advances to customers5 9.1 362Interest in group companies, associates and joint ventures 12 19 107Other financial assetsOther non-financial assets6
139 342 64 927
LiabilitiesDerivative liabilities 4.7 81 744Trading liabilities6 17 21 221Deposits from banks 18 1 720Deposits from customers6 18 34 927Subordinated debt 21Liabilities to group companies 12.3 3 062Other financial liabilitiesOther non-financial liabilities6
106 027 36 647
1 Includes derivative assets or liabilities held-for-hedging. Refer to note 4.7 starting on page 148.2 Includes financial assets and liabilities for which the carrying value has been adjusted for changes in fair value due to designated hedged risks.3 Carrying value has been used where it closely approximates fair values, excluding non-financial instruments. Refer to the fair value section in
accounting policy 16 – Fair value on page 240 for a description on how fair values are determined.4 The fair value of other financial assets and liabilities approximates the carrying value due to their short-term nature.5 Reclassified, refer to annexure B on page 244.6 Restated, refer to annexure B on page 244.
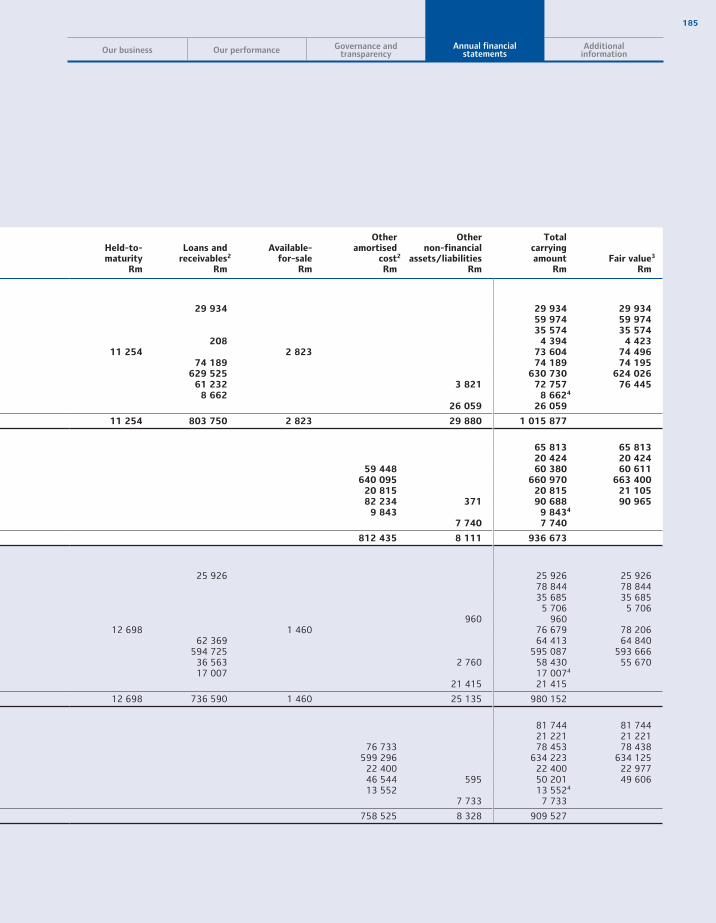
185
Our business Our performance Governance andtransparency
Annual financialstatements
Additionalinformation
Held-to-maturity
Rm
Loans and receivables2
Rm
Available-for-sale
Rm
Otheramortised
cost2
Rm
Othernon-financial
assets/liabilitiesRm
Totalcarryingamount
RmFair value3
Rm
29 934 29 934 29 93459 974 59 97435 574 35 574
208 4 394 4 42311 254 2 823 73 604 74 496
74 189 74 189 74 195629 525 630 730 624 026
61 232 3 821 72 757 76 4458 662 8 6624
26 059 26 059
11 254 803 750 2 823 29 880 1 015 877
65 813 65 81320 424 20 424
59 448 60 380 60 611640 095 660 970 663 400
20 815 20 815 21 10582 234 371 90 688 90 965
9 843 9 8434
7 740 7 740
812 435 8 111 936 673
25 926 25 926 25 92678 844 78 84435 685 35 685
5 706 5 706960 960
12 698 1 460 76 679 78 20662 369 64 413 64 840
594 725 595 087 593 66636 563 2 760 58 430 55 67017 007 17 0074
21 415 21 415
12 698 736 590 1 460 25 135 980 152
81 744 81 74421 221 21 221
76 733 78 453 78 438599 296 634 223 634 125
22 400 22 400 22 97746 544 595 50 201 49 60613 552 13 5524
7 733 7 733
758 525 8 328 909 527
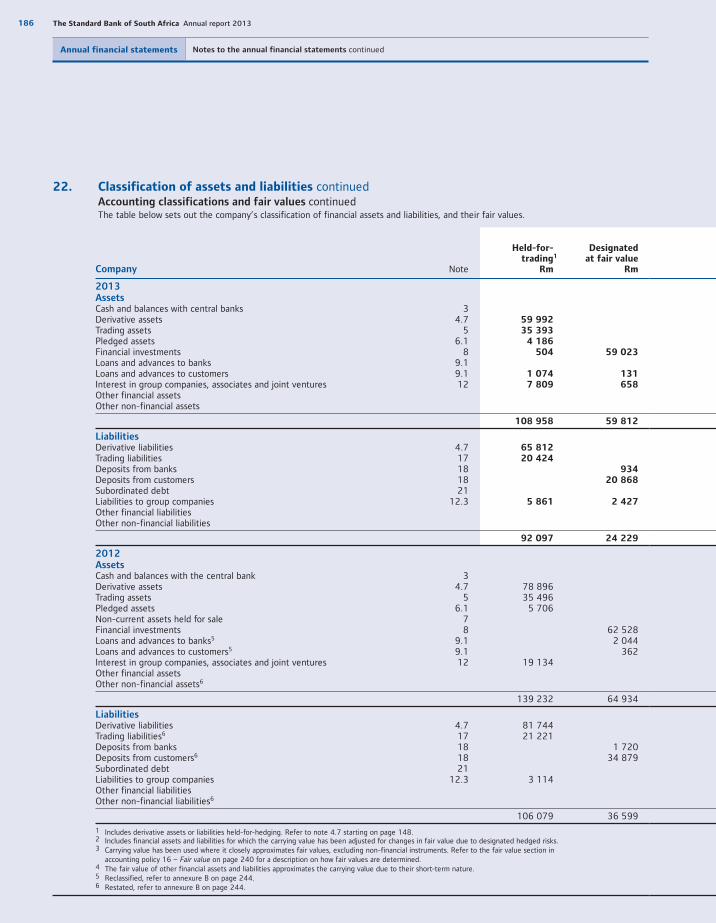
186 The Standard Bank of South Africa Annual report 2013
Annual financial statements Notes to the annual financial statements continued
22. Classification of assets and liabilities continued Accounting classifications and fair values continued The table below sets out the company’s classification of financial assets and liabilities, and their fair values.
Company Note
Held-for-trading1
Rm
Designatedat fair value
Rm
2013AssetsCash and balances with central banks 3Derivative assets 4.7 59 992Trading assets 5 35 393Pledged assets 6.1 4 186Financial investments 8 504 59 023Loans and advances to banks 9.1Loans and advances to customers 9.1 1 074 131Interest in group companies, associates and joint ventures 12 7 809 658Other financial assetsOther non-financial assets
108 958 59 812
LiabilitiesDerivative liabilities 4.7 65 812 Trading liabilities 17 20 424 Deposits from banks 18 934Deposits from customers 18 20 868Subordinated debt 21Liabilities to group companies 12.3 5 861 2 427Other financial liabilitiesOther non-financial liabilities
92 097 24 229
2012AssetsCash and balances with the central bank 3Derivative assets 4.7 78 896Trading assets 5 35 496Pledged assets 6.1 5 706Non-current assets held for sale 7Financial investments 8 62 528Loans and advances to banks5 9.1 2 044Loans and advances to customers5 9.1 362Interest in group companies, associates and joint ventures 12 19 134Other financial assetsOther non-financial assets6
139 232 64 934
LiabilitiesDerivative liabilities 4.7 81 744Trading liabilities6 17 21 221Deposits from banks 18 1 720Deposits from customers6 18 34 879Subordinated debt 21Liabilities to group companies 12.3 3 114Other financial liabilitiesOther non-financial liabilities6
106 079 36 599
1 Includes derivative assets or liabilities held-for-hedging. Refer to note 4.7 starting on page 148.2 Includes financial assets and liabilities for which the carrying value has been adjusted for changes in fair value due to designated hedged risks.3 Carrying value has been used where it closely approximates fair values, excluding non-financial instruments. Refer to the fair value section in
accounting policy 16 – Fair value on page 240 for a description on how fair values are determined.4 The fair value of other financial assets and liabilities approximates the carrying value due to their short-term nature.5 Reclassified, refer to annexure B on page 244.6 Restated, refer to annexure B on page 244.

187
Our business Our performance Governance andtransparency
Annual financialstatements
Additionalinformation
Held-to-maturity
Rm
Loans and receivables2
Rm
Available-for-sale
Rm
Otheramortised
cost2
Rm
Othernon-financial
assets/liabilitiesRm
Totalcarryingamount
RmFair value3
Rm
29 934 29 934 29 93459 992 59 99235 393 35 393
208 4 394 4 42311 260 2 823 73 610 74 496
74 114 74 114 74 169611 819 613 024 606 967
69 268 3 131 80 866 75 9468 584 8 5844
25 759 25 759
11 260 793 927 2 823 28 890 1 005 670
65 812 65 81220 424 20 424
59 601 60 535 60 764629 706 650 574 652 518
20 815 20 815 21 10583 987 327 92 602 91 991
9 573 9 5734
7 761 7 761
803 682 8 088 928 096
25 926 25 926 25 92678 896 78 89635 496 35 496
5 706 5 706708 708
12 702 1 460 76 690 78 21362 403 64 447 64 822
578 953 579 315 578 67843 225 2 234 64 593 62 35916 779 16 7794
20 539 20 539
12 702 727 286 1 460 23 481 969 095
81 744 81 74421 221 21 221
76 733 78 453 78 438587 986 622 865 622 767
22 400 22 400 22 97748 914 537 52 565 52 02812 931 12 9314
7 715 7 715
748 964 8 252 899 894

188 The Standard Bank of South Africa Annual report 2013
Annual financial statements Notes to the annual financial statements continued
23. Assets and liabilities at fair value23.1 Assets and liabilities measured at fair value – group23.1.1 Fair value hierarchy of instruments measured at fair value Valuation process All financial instruments carried at fair value for which there is no available quoted market price, regardless of classification, are marked
to market using models that have been validated independently by the group’s model validation unit and approved by the market risk methodologies committee. This control applies to both off-the-shelf models as well as those developed internally by the group and company. Further, all inputs into the valuation models are subject to independent price validation procedures carried out by the group’s market risk unit. Such price validation is performed on at least a monthly basis, and daily where possible given the liquidity of the underlying price inputs. Less liquid risk drivers, which are typically used to mark level 3 assets and liabilities to market, are carefully validated and tabled at the monthly price validation forum to ensure these are reasonable and used consistently across all entities in the group. Sensitivities arising from exposures to such drivers are similarly scrutinised, together with movements in level 3 fair values. They are also disclosed on a monthly basis to the market risk and asset and liability committees.
Level hierarchy The table on the following page analyses financial instruments carried at fair value, by level of fair value hierarchy. The different levels
are based on the extent that available market data is used in the calculation of the fair value of the financial instruments. The levels have been defined as follows:
Level 1 – fair value is based on quoted market prices (unadjusted) in active markets for identical instruments.
Level 2 – fair value is determined through valuation techniques based on observable inputs, either directly, such as quoted prices, or indirectly, such as derived from quoted prices. This category includes instruments valued using quoted market prices in active markets for similar instruments, quoted prices for identical or similar instruments in markets that are considered less than active or other valuation techniques where all significant inputs are directly or indirectly observable from market data.
Level 3 – fair value is determined through valuation techniques using significant unobservable inputs. This category includes all instruments where the valuation technique includes inputs not based on observable data and the unobservable inputs have a significant effect on the instrument’s valuation. This category includes instruments that are valued based on quoted prices for similar instruments where significant unobservable adjustments or assumptions are required to reflect differences between the assets and liabilities.
Significant unobservable inputs The fair value of level 3 assets and liabilities is determined using valuation techniques that include reference to recent arm’s length
transactions, discounted cash flow analyses, pricing models and other valuation techniques commonly used by market participants. However, such techniques typically have unobservable inputs that are subject to management judgement. These inputs include credit spreads on illiquid issuers, implied volatilities on thinly traded stocks, correlation between risk factors, prepayment rates and other illiquid risk drivers. Exposure to such illiquid risk drivers is typically managed by:
using bid-offer spreads that are reflective of the relatively low liquidity of the underlying risk driver
quantifying and reporting the sensitivity to each risk driver
raising day one profit provisions in accordance with IFRS
limiting exposure to such risk drivers and analysing this exposure on a regular basis.
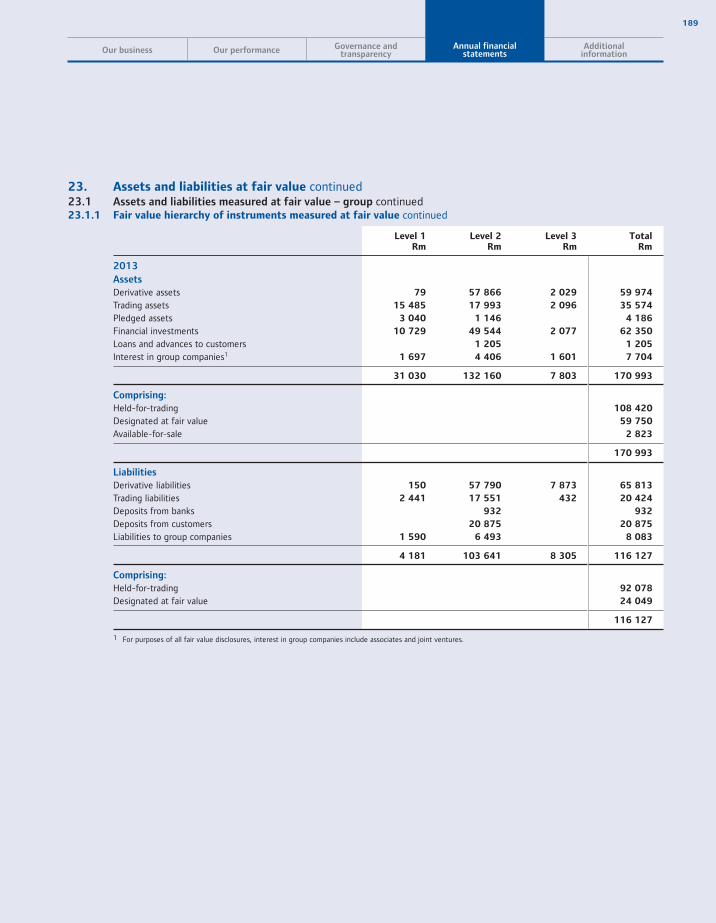
189
Our business Our performance Governance andtransparency
Annual financialstatements
Additionalinformation
23. Assets and liabilities at fair value continued23.1 Assets and liabilities measured at fair value – group continued23.1.1 Fair value hierarchy of instruments measured at fair value continued
Level 1Rm
Level 2Rm
Level 3Rm
TotalRm
2013
Assets
Derivative assets 79 57 866 2 029 59 974
Trading assets 15 485 17 993 2 096 35 574
Pledged assets 3 040 1 146 4 186
Financial investments 10 729 49 544 2 077 62 350
Loans and advances to customers 1 205 1 205
Interest in group companies1 1 697 4 406 1 601 7 704
31 030 132 160 7 803 170 993
Comprising:
Held-for-trading 108 420
Designated at fair value 59 750
Available-for-sale 2 823
170 993
Liabilities
Derivative liabilities 150 57 790 7 873 65 813
Trading liabilities 2 441 17 551 432 20 424
Deposits from banks 932 932
Deposits from customers 20 875 20 875
Liabilities to group companies 1 590 6 493 8 083
4 181 103 641 8 305 116 127
Comprising:
Held-for-trading 92 078
Designated at fair value 24 049
116 127
1 For purposes of all fair value disclosures, interest in group companies include associates and joint ventures.
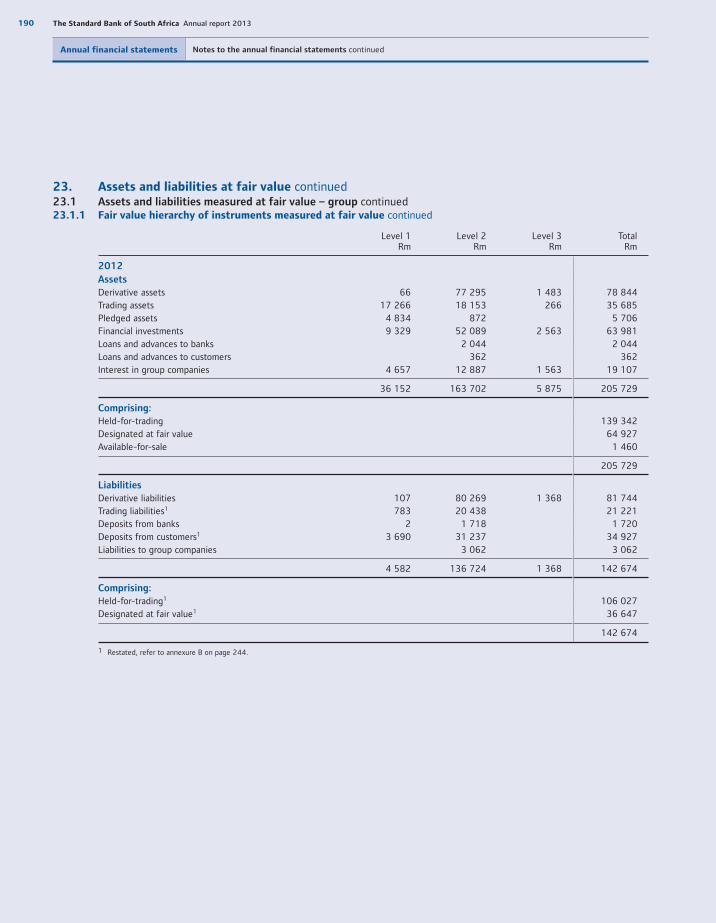
190 The Standard Bank of South Africa Annual report 2013
Annual financial statements Notes to the annual financial statements continued
23. Assets and liabilities at fair value continued23.1 Assets and liabilities measured at fair value – group continued23.1.1 Fair value hierarchy of instruments measured at fair value continued
Level 1Rm
Level 2Rm
Level 3Rm
TotalRm
2012
Assets
Derivative assets 66 77 295 1 483 78 844Trading assets 17 266 18 153 266 35 685Pledged assets 4 834 872 5 706Financial investments 9 329 52 089 2 563 63 981Loans and advances to banks 2 044 2 044Loans and advances to customers 362 362Interest in group companies 4 657 12 887 1 563 19 107
36 152 163 702 5 875 205 729
Comprising:
Held-for-trading 139 342Designated at fair value 64 927Available-for-sale 1 460
205 729
Liabilities
Derivative liabilities 107 80 269 1 368 81 744Trading liabilities1 783 20 438 21 221Deposits from banks 2 1 718 1 720Deposits from customers1 3 690 31 237 34 927Liabilities to group companies 3 062 3 062
4 582 136 724 1 368 142 674
Comprising:
Held-for-trading1 106 027Designated at fair value1 36 647
142 674
1 Restated, refer to annexure B on page 244.

191
Our business Our performance Governance andtransparency
Annual financialstatements
Additionalinformation
23. Assets and liabilities at fair value continued23.1 Assets and liabilities measured at fair value – group continued23.1.2 Reconciliation of level 3 financial assets The table below sets out the reconciliation of financial assets that are measured at fair value based on inputs that are not based on
observable market data (level 3):
Derivative assets
Rm
Tradingassets
Rm
Financial investments
Rm
Interest in group
companiesRm
TotalRm
Balance at 1 January 2012 1 986 206 2 448 4 640Total (losses)/gains included in profit or loss (1 120) 60 267 1 563 770
Trading revenue (1 120) 60 1 563 503Other revenue 267 267
Originations and purchases 21 337 358Sales (353) (353)Settlements1 596 (60) 536Transfers out of level 32 (76) (76)
Balance at 31 December 2012 1 483 266 2 563 1 563 5 875
Balance at 1 January 2013 1 483 266 2 563 1 563 5 875
Total gains/(losses) included in profit or loss 1 234 (37) 182 38 1 417
Trading revenue 1 234 (37) 38 1 235
Other revenue 182 182
Originations and purchases 499 3 088 185 3 772
Sales (1 068) (2 019) (931) (4 018)
Settlements1 (114) (5) (119)
Transfers into level 33 2 798 119 919
Transfers out of level 32 (7) (36) (43)
Balance at 31 December 2013 2 029 2 096 2 077 1 601 7 803
1 Derivative fair values represent the net present value of positive and/or negative future cash flows. Settlements may increase or decrease the carrying value of derivative assets.
2 During 2013 and 2012, the valuation inputs of certain level 3 financial assets became observable. The fair value of the investments was transferred into level 2.3 During 2013, the valuation inputs of certain level 3 financial assets became unobservable. The fair value of the investments was transferred into level 3.

192 The Standard Bank of South Africa Annual report 2013
Annual financial statements Notes to the annual financial statements continued
23. Assets and liabilities at fair value continued23.1 Assets and liabilities measured at fair value – group continued23.1.3 Gains/(losses) for the year included in profit or loss for level 3 financial assets held at the end of the year
Derivativeassets
Rm
Tradingassets
Rm
Financialinvestments
Rm
Interestin group
companiesRm
TotalRm
2013
Trading revenue 1 271 (14) 38 1 295
Other revenue 76 76
Total 1 271 (14) 76 38 1 371
2012
Trading revenue (1 120) 60 1 563 503Other revenue 267 267
Total (1 120) 60 267 1 563 770
23.1.4 Reconciliation of level 3 financial liabilities The table below sets out the reconciliation of financial liabilities that are measured at fair value based on inputs that are not based on
observable market data (level 3):
Tradingliabilities
Rm
Derivativeliabilities
RmTotal
Rm
Balance at 1 January 2012 1 755 1 755Total losses included in profit or loss – trading revenue 165 165Issuances and sales 56 56Settlements1 (608) (608)
Balance at 31 December 2012 1 368 1 368
Balance at 1 January 2013 1 368 1 368
Total (gains)/losses included in profit or loss – trading revenue (27) 4 084 4 057
Purchases 459 3 050 3 509
Sales (46) (46)
Settlements1 (633) (633)
Transfers into level 32 58 58
Transfers out of level 33 (8) (8)
Balance at 31 December 2013 432 7 873 8 305
23.1.5 (Gains)/losses for the year included in profit or loss for level 3 financial liabilities held at the end of the year2013
Trading revenue (32) 3 862 3 830
2012
Trading revenue 164 164
1 Derivative fair values represent the net present value of positive and/or negative future cash flows. Settlements may increase or decrease the carrying value of derivative liabilities.
2 During 2013, the valuation inputs of certain financial liabilities became unobservable. The fair values were transferred into level 3.3 During 2013, the valuation inputs of certain level 3 financial liabilities became observable. The fair values were transferred into level 2.
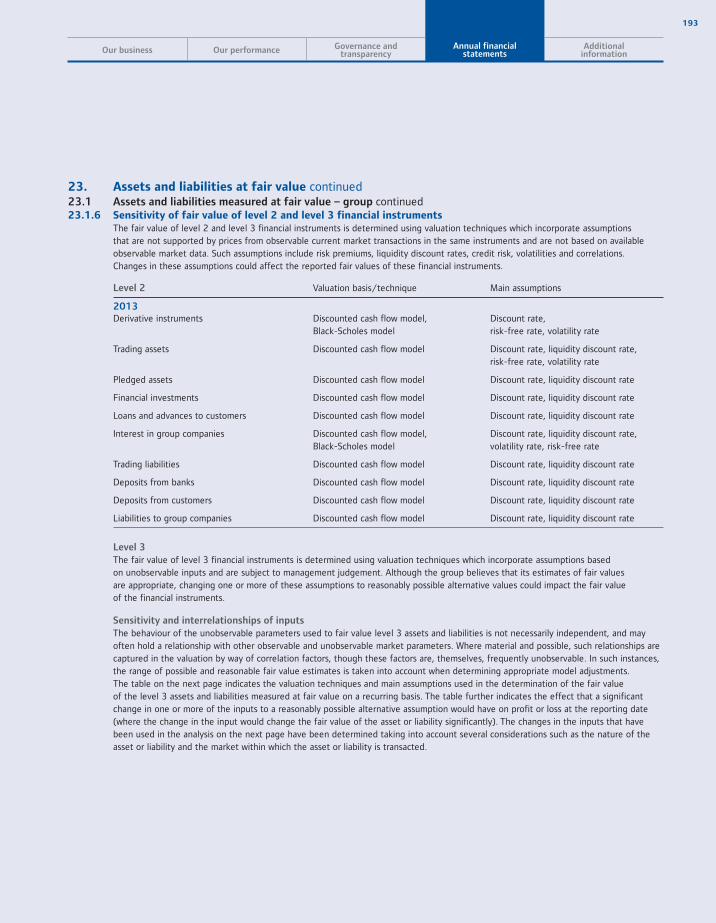
193
Our business Our performance Governance andtransparency
Annual financialstatements
Additionalinformation
23. Assets and liabilities at fair value continued23.1 Assets and liabilities measured at fair value – group continued23.1.6 Sensitivity of fair value of level 2 and level 3 financial instruments The fair value of level 2 and level 3 financial instruments is determined using valuation techniques which incorporate assumptions
that are not supported by prices from observable current market transactions in the same instruments and are not based on available observable market data. Such assumptions include risk premiums, liquidity discount rates, credit risk, volatilities and correlations. Changes in these assumptions could affect the reported fair values of these financial instruments.
Level 2 Valuation basis/technique Main assumptions
2013Derivative instruments Discounted cash flow model,
Black-Scholes modelDiscount rate,risk-free rate, volatility rate
Trading assets Discounted cash flow model Discount rate, liquidity discount rate, risk-free rate, volatility rate
Pledged assets Discounted cash flow model Discount rate, liquidity discount rate
Financial investments Discounted cash flow model Discount rate, liquidity discount rate
Loans and advances to customers Discounted cash flow model Discount rate, liquidity discount rate
Interest in group companies Discounted cash flow model, Black-Scholes model
Discount rate, liquidity discount rate, volatility rate, risk-free rate
Trading liabilities Discounted cash flow model Discount rate, liquidity discount rate
Deposits from banks Discounted cash flow model Discount rate, liquidity discount rate
Deposits from customers Discounted cash flow model Discount rate, liquidity discount rate
Liabilities to group companies Discounted cash flow model Discount rate, liquidity discount rate
Level 3 The fair value of level 3 financial instruments is determined using valuation techniques which incorporate assumptions based
on unobservable inputs and are subject to management judgement. Although the group believes that its estimates of fair values are appropriate, changing one or more of these assumptions to reasonably possible alternative values could impact the fair value of the financial instruments.
Sensitivity and interrelationships of inputs The behaviour of the unobservable parameters used to fair value level 3 assets and liabilities is not necessarily independent, and may
often hold a relationship with other observable and unobservable market parameters. Where material and possible, such relationships are captured in the valuation by way of correlation factors, though these factors are, themselves, frequently unobservable. In such instances, the range of possible and reasonable fair value estimates is taken into account when determining appropriate model adjustments. The table on the next page indicates the valuation techniques and main assumptions used in the determination of the fair value of the level 3 assets and liabilities measured at fair value on a recurring basis. The table further indicates the effect that a significant change in one or more of the inputs to a reasonably possible alternative assumption would have on profit or loss at the reporting date (where the change in the input would change the fair value of the asset or liability significantly). The changes in the inputs that have been used in the analysis on the next page have been determined taking into account several considerations such as the nature of the asset or liability and the market within which the asset or liability is transacted.
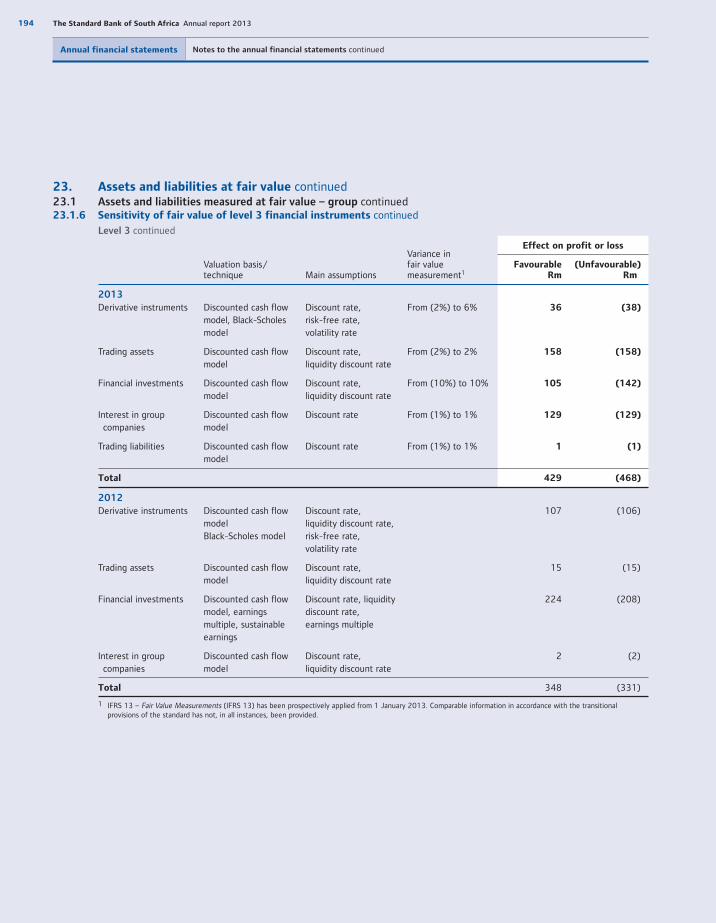
194 The Standard Bank of South Africa Annual report 2013
Annual financial statements Notes to the annual financial statements continued
23. Assets and liabilities at fair value continued23.1 Assets and liabilities measured at fair value – group continued23.1.6 Sensitivity of fair value of level 3 financial instruments continued
Level 3 continued
Valuation basis/technique Main assumptions
Variance infair valuemeasurement1
Effect on profit or loss
FavourableRm
(Unfavourable)Rm
2013
Derivative instruments Discounted cash flow model, Black-Scholes model
Discount rate, risk-free rate, volatility rate
From (2%) to 6% 36 (38)
Trading assets Discounted cash flow model
Discount rate, liquidity discount rate
From (2%) to 2% 158 (158)
Financial investments Discounted cash flow model
Discount rate, liquidity discount rate
From (10%) to 10% 105 (142)
Interest in group companies
Discounted cash flow model
Discount rate From (1%) to 1% 129 (129)
Trading liabilities Discounted cash flow model
Discount rate From (1%) to 1% 1 (1)
Total 429 (468)
2012
Derivative instruments Discounted cash flow model Black-Scholes model
Discount rate, liquidity discount rate, risk-free rate, volatility rate
107 (106)
Trading assets Discounted cash flow model
Discount rate, liquidity discount rate
15 (15)
Financial investments Discounted cash flow model, earningsmultiple, sustainable earnings
Discount rate, liquidity discount rate, earnings multiple
224 (208)
Interest in group companies
Discounted cash flow model
Discount rate, liquidity discount rate
2 (2)
Total 348 (331)
1 IFRS 13 – Fair Value Measurements (IFRS 13) has been prospectively applied from 1 January 2013. Comparable information in accordance with the transitional provisions of the standard has not, in all instances, been provided.

195
Our business Our performance Governance andtransparency
Annual financialstatements
Additionalinformation
23. Assets and liabilities at fair value continued23.2 Assets and liabilities measured at fair value – company23.2.1 Fair value hierarchy of instruments measured at fair value
Level 1Rm
Level 2Rm
Level 3Rm
TotalRm
2013
Assets
Derivative assets 78 57 885 2 029 59 992
Trading assets 15 304 17 993 2 096 35 393
Pledged assets 3 040 1 146 4 186
Financial investments 10 729 49 545 2 076 62 350
Loans and advances to customers 1 205 1 205
Interest in group companies 2 382 4 484 1 601 8 467
31 533 132 258 7 802 171 593
Comprising:
Held-for-trading 108 958
Designated at fair value 59 812
Available-for-sale 2 823
171 593
Liabilities
Derivative liabilities 150 57 790 7 872 65 812
Trading liabilities 2 441 17 551 432 20 424
Deposits from banks 934 934
Deposits from customers 20 868 20 868
Liabilities to group companies 1 710 6 578 8 288
4 301 103 721 8 304 116 326
Comprising:
Held-for-trading 92 097
Designated at fair value 24 229
116 326
2012
Assets
Derivative assets 66 77 347 1 483 78 896Trading assets 17 078 18 152 266 35 496Pledged assets 4 834 872 5 706Financial investments 9 329 52 090 2 569 63 988Loans and advances to banks 2 044 2 044Loans and advances to customers 362 362Interest in group companies 2 603 14 968 1 563 19 134
33 910 165 835 5 881 205 626
Comprising:
Held-for-trading 139 232Designated at fair value 64 934Available-for-sale 1 460
205 626
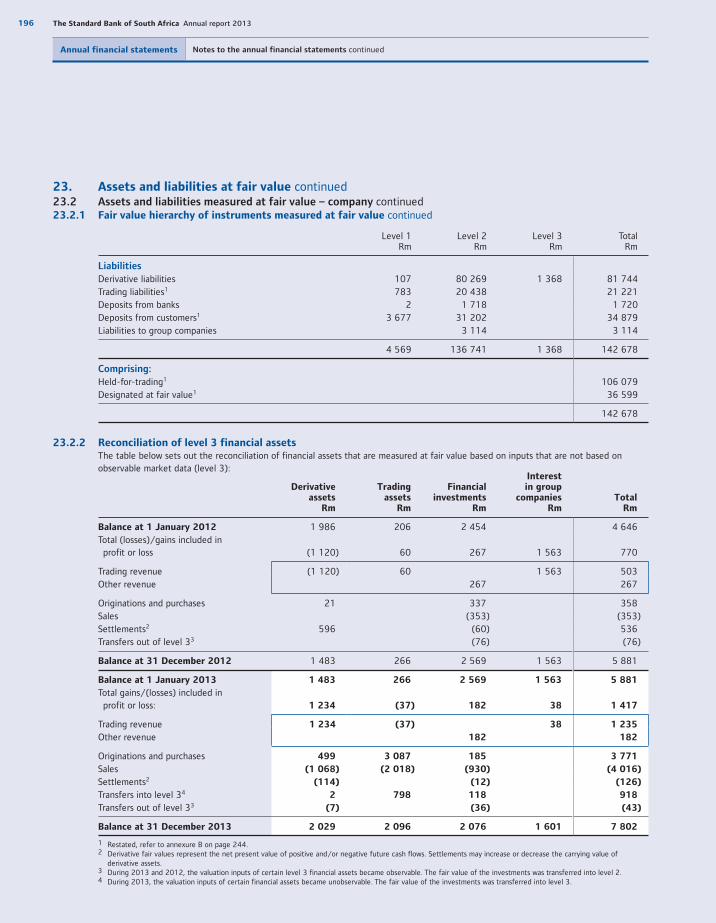
196 The Standard Bank of South Africa Annual report 2013
Annual financial statements Notes to the annual financial statements continued
23. Assets and liabilities at fair value continued23.2 Assets and liabilities measured at fair value – company continued23.2.1 Fair value hierarchy of instruments measured at fair value continued
Level 1Rm
Level 2Rm
Level 3Rm
TotalRm
Liabilities
Derivative liabilities 107 80 269 1 368 81 744Trading liabilities1 783 20 438 21 221Deposits from banks 2 1 718 1 720Deposits from customers1 3 677 31 202 34 879Liabilities to group companies 3 114 3 114
4 569 136 741 1 368 142 678
Comprising:
Held-for-trading1 106 079Designated at fair value1 36 599
142 678
23.2.2 Reconciliation of level 3 financial assets The table below sets out the reconciliation of financial assets that are measured at fair value based on inputs that are not based on
observable market data (level 3):
Derivativeassets
Rm
Tradingassets
Rm
Financialinvestments
Rm
Interestin group
companiesRm
TotalRm
Balance at 1 January 2012 1 986 206 2 454 4 646Total (losses)/gains included in profit or loss (1 120) 60 267 1 563 770
Trading revenue (1 120) 60 1 563 503Other revenue 267 267
Originations and purchases 21 337 358Sales (353) (353)Settlements2 596 (60) 536Transfers out of level 33 (76) (76)
Balance at 31 December 2012 1 483 266 2 569 1 563 5 881
Balance at 1 January 2013 1 483 266 2 569 1 563 5 881
Total gains/(losses) included in profit or loss: 1 234 (37) 182 38 1 417
Trading revenue 1 234 (37) 38 1 235
Other revenue 182 182
Originations and purchases 499 3 087 185 3 771
Sales (1 068) (2 018) (930) (4 016)
Settlements2 (114) (12) (126)
Transfers into level 34 2 798 118 918
Transfers out of level 33 (7) (36) (43)
Balance at 31 December 2013 2 029 2 096 2 076 1 601 7 802
1 Restated, refer to annexure B on page 244.2 Derivative fair values represent the net present value of positive and/or negative future cash flows. Settlements may increase or decrease the carrying value of
derivative assets.3 During 2013 and 2012, the valuation inputs of certain level 3 financial assets became observable. The fair value of the investments was transferred into level 2.4 During 2013, the valuation inputs of certain financial assets became unobservable. The fair value of the investments was transferred into level 3.
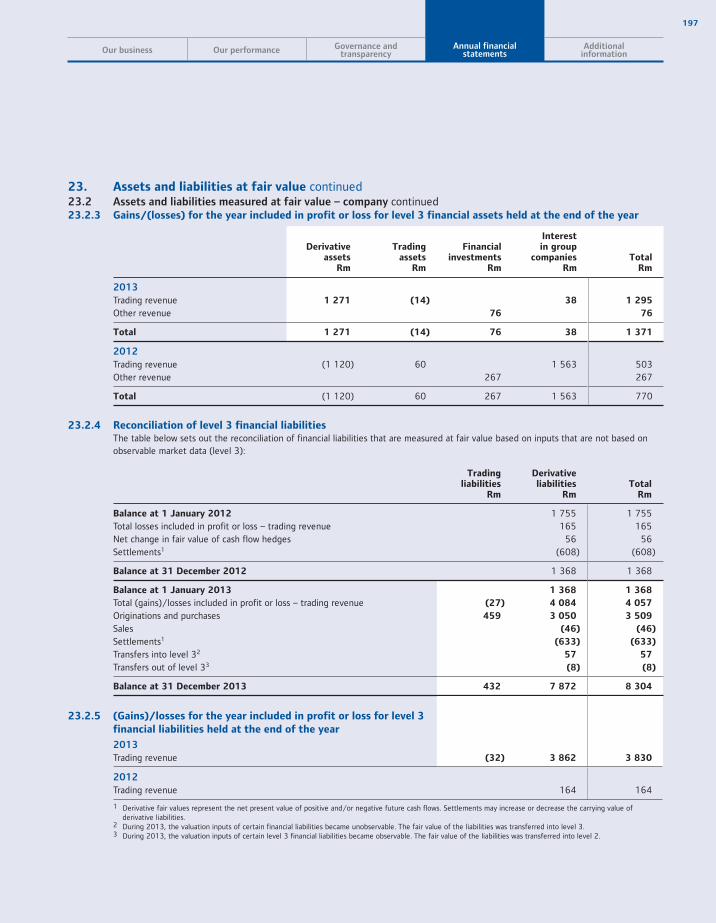
197
Our business Our performance Governance andtransparency
Annual financialstatements
Additionalinformation
23. Assets and liabilities at fair value continued23.2 Assets and liabilities measured at fair value – company continued23.2.3 Gains/(losses) for the year included in profit or loss for level 3 financial assets held at the end of the year
Derivativeassets
Rm
Tradingassets
Rm
Financialinvestments
Rm
Interestin group
companiesRm
TotalRm
2013
Trading revenue 1 271 (14) 38 1 295
Other revenue 76 76
Total 1 271 (14) 76 38 1 371
2012
Trading revenue (1 120) 60 1 563 503Other revenue 267 267
Total (1 120) 60 267 1 563 770
23.2.4 Reconciliation of level 3 financial liabilities The table below sets out the reconciliation of financial liabilities that are measured at fair value based on inputs that are not based on
observable market data (level 3):
Tradingliabilities
Rm
Derivativeliabilities
RmTotal
Rm
Balance at 1 January 2012 1 755 1 755Total losses included in profit or loss – trading revenue 165 165Net change in fair value of cash flow hedges 56 56Settlements1 (608) (608)
Balance at 31 December 2012 1 368 1 368
Balance at 1 January 2013 1 368 1 368
Total (gains)/losses included in profit or loss – trading revenue (27) 4 084 4 057
Originations and purchases 459 3 050 3 509
Sales (46) (46)
Settlements1 (633) (633)
Transfers into level 32 57 57
Transfers out of level 33 (8) (8)
Balance at 31 December 2013 432 7 872 8 304
23.2.5 (Gains)/losses for the year included in profit or loss for level 3financial liabilities held at the end of the year
2013
Trading revenue (32) 3 862 3 830
2012
Trading revenue 164 164
1 Derivative fair values represent the net present value of positive and/or negative future cash flows. Settlements may increase or decrease the carrying value of derivative liabilities.
2 During 2013, the valuation inputs of certain financial liabilities became unobservable. The fair value of the liabilities was transferred into level 3.3 During 2013, the valuation inputs of certain level 3 financial liabilities became observable. The fair value of the liabilities was transferred into level 2.
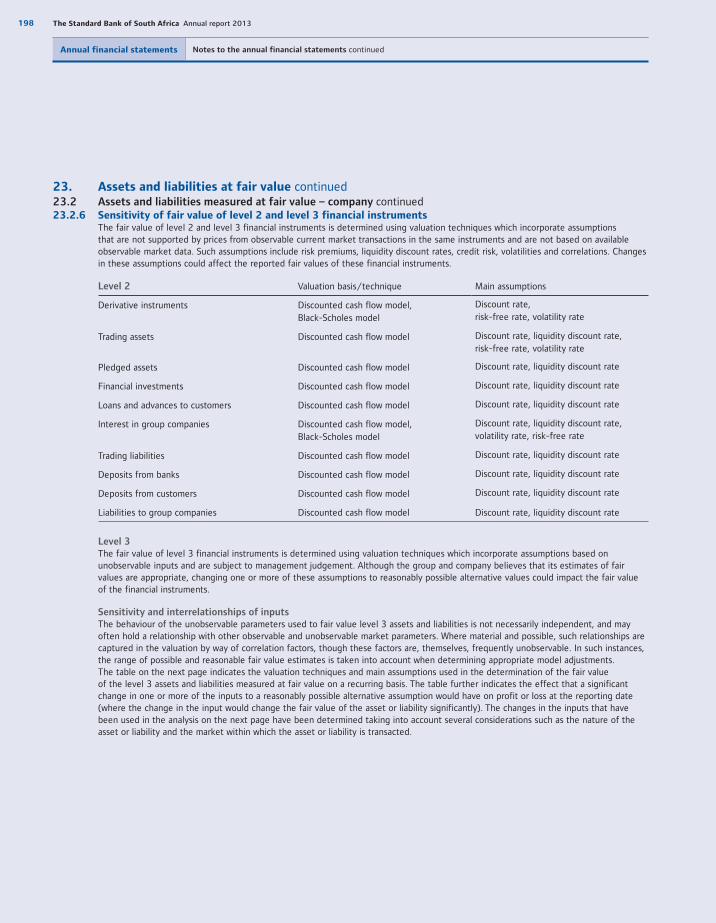
198 The Standard Bank of South Africa Annual report 2013
Annual financial statements Notes to the annual financial statements continued
23. Assets and liabilities at fair value continued23.2 Assets and liabilities measured at fair value – company continued23.2.6 Sensitivity of fair value of level 2 and level 3 financial instruments The fair value of level 2 and level 3 financial instruments is determined using valuation techniques which incorporate assumptions
that are not supported by prices from observable current market transactions in the same instruments and are not based on available observable market data. Such assumptions include risk premiums, liquidity discount rates, credit risk, volatilities and correlations. Changes in these assumptions could affect the reported fair values of these financial instruments.
Level 2 Valuation basis/technique Main assumptions
Derivative instruments Discounted cash flow model, Black-Scholes model
Discount rate, risk-free rate, volatility rate
Trading assets Discounted cash flow model Discount rate, liquidity discount rate, risk-free rate, volatility rate
Pledged assets Discounted cash flow model Discount rate, liquidity discount rate
Financial investments Discounted cash flow model Discount rate, liquidity discount rate
Loans and advances to customers Discounted cash flow model Discount rate, liquidity discount rate
Interest in group companies Discounted cash flow model, Black-Scholes model
Discount rate, liquidity discount rate, volatility rate, risk-free rate
Trading liabilities Discounted cash flow model Discount rate, liquidity discount rate
Deposits from banks Discounted cash flow model Discount rate, liquidity discount rate
Deposits from customers Discounted cash flow model Discount rate, liquidity discount rate
Liabilities to group companies Discounted cash flow model Discount rate, liquidity discount rate
Level 3 The fair value of level 3 financial instruments is determined using valuation techniques which incorporate assumptions based on
unobservable inputs and are subject to management judgement. Although the group and company believes that its estimates of fair values are appropriate, changing one or more of these assumptions to reasonably possible alternative values could impact the fair value of the financial instruments.
Sensitivity and interrelationships of inputs The behaviour of the unobservable parameters used to fair value level 3 assets and liabilities is not necessarily independent, and may
often hold a relationship with other observable and unobservable market parameters. Where material and possible, such relationships are captured in the valuation by way of correlation factors, though these factors are, themselves, frequently unobservable. In such instances, the range of possible and reasonable fair value estimates is taken into account when determining appropriate model adjustments. The table on the next page indicates the valuation techniques and main assumptions used in the determination of the fair value of the level 3 assets and liabilities measured at fair value on a recurring basis. The table further indicates the effect that a significant change in one or more of the inputs to a reasonably possible alternative assumption would have on profit or loss at the reporting date (where the change in the input would change the fair value of the asset or liability significantly). The changes in the inputs that have been used in the analysis on the next page have been determined taking into account several considerations such as the nature of the asset or liability and the market within which the asset or liability is transacted.

199
Our business Our performance Governance andtransparency
Annual financialstatements
Additionalinformation
23. Assets and liabilities at fair value continued23.2 Assets and liabilities measured at fair value – company continued23.2.6 Sensitivity of fair value of level 2 and level 3 financial instruments continued Level 3 continued
Effect on profit or loss
Valuation basis/technique Main assumptions
Variance in fair valuemeasurement1
FavourableRm
(Unfavourable)Rm
2013Derivative instruments Discounted cash flow model,
Black-Scholes model Discount rate, risk-free rate, volatility rate
From (2%) to 6%
36 (38)
Trading assets Discounted cash flow model Discount rate, risk-free rate, liquidity discount rate
From (2%) to 2%
158 (158)
Financial investments Discounted cash flow model Discount rate, liquidity discount rate
From (10%) to 10%
105 (142)
Interest in group companies
Discounted cash flow model Discount rate From (1%) to 1%
129 (129)
Trading liabilities Discounted cash flow model Discount rate From (1%) to 1%
1 (1)
Total 429 (468)
2012Derivative instruments Discounted cash flow model
Black-Scholes model
Discount rate, liquidity discount rate, risk-free rate, volatility rate
107 (106)
Trading assets Discounted cash flow model Discount rate, liquidity discount rate
15 (15)
Financial investments Discounted cash flow model, earnings multiple, sustainable earnings
Discount rate, liquidity discount rate,earnings multiple
224 (208)
Interest in group companies
Discounted cash flow model Discount rate, liquidity discount rate
2 (2)
Total 348 (331)1 IFRS 13 – Fair Value Measurements (IFRS 13) has been prospectively applied from 1 January 2013. Comparable information in accordance with the transitioned
provisions of the standard has not, in all instances, been provided.
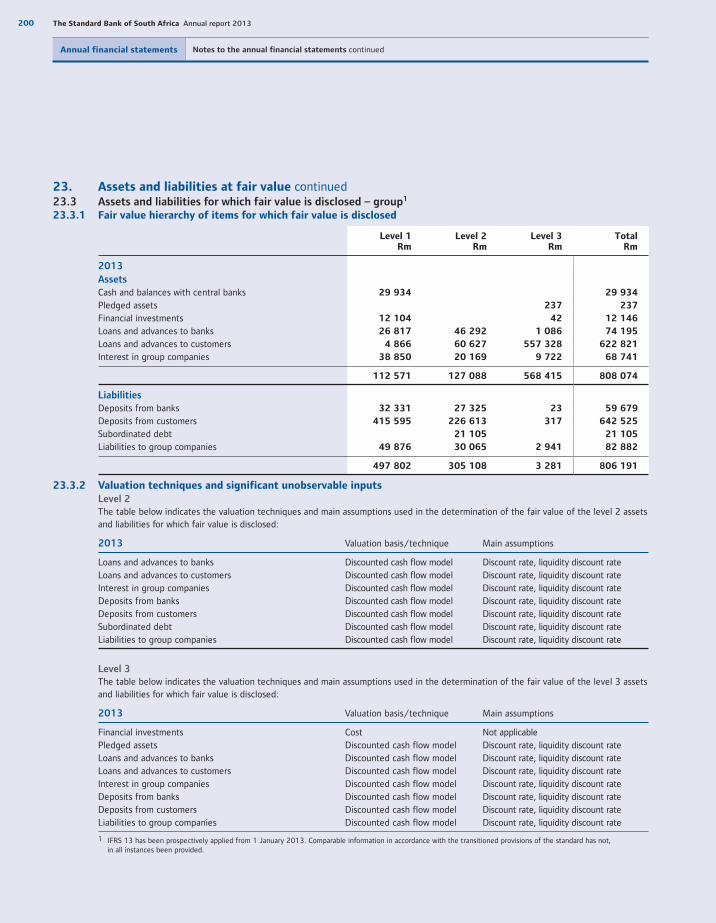
200 The Standard Bank of South Africa Annual report 2013
Annual financial statements Notes to the annual financial statements continued
23. Assets and liabilities at fair value continued23.3 Assets and liabilities for which fair value is disclosed – group1
23.3.1 Fair value hierarchy of items for which fair value is disclosed
Level 1Rm
Level 2Rm
Level 3Rm
TotalRm
2013
Assets
Cash and balances with central banks 29 934 29 934
Pledged assets 237 237
Financial investments 12 104 42 12 146
Loans and advances to banks 26 817 46 292 1 086 74 195
Loans and advances to customers 4 866 60 627 557 328 622 821
Interest in group companies 38 850 20 169 9 722 68 741
112 571 127 088 568 415 808 074
Liabilities
Deposits from banks 32 331 27 325 23 59 679
Deposits from customers 415 595 226 613 317 642 525
Subordinated debt 21 105 21 105
Liabilities to group companies 49 876 30 065 2 941 82 882
497 802 305 108 3 281 806 191
23.3.2 Valuation techniques and significant unobservable inputs Level 2 The table below indicates the valuation techniques and main assumptions used in the determination of the fair value of the level 2 assets
and liabilities for which fair value is disclosed:
2013 Valuation basis/technique Main assumptions
Loans and advances to banks Discounted cash flow model Discount rate, liquidity discount rateLoans and advances to customers Discounted cash flow model Discount rate, liquidity discount rateInterest in group companies Discounted cash flow model Discount rate, liquidity discount rateDeposits from banks Discounted cash flow model Discount rate, liquidity discount rateDeposits from customers Discounted cash flow model Discount rate, liquidity discount rateSubordinated debt Discounted cash flow model Discount rate, liquidity discount rateLiabilities to group companies Discounted cash flow model Discount rate, liquidity discount rate
Level 3 The table below indicates the valuation techniques and main assumptions used in the determination of the fair value of the level 3 assets
and liabilities for which fair value is disclosed:
2013 Valuation basis/technique Main assumptions
Financial investments Cost Not applicablePledged assets Discounted cash flow model Discount rate, liquidity discount rateLoans and advances to banks Discounted cash flow model Discount rate, liquidity discount rateLoans and advances to customers Discounted cash flow model Discount rate, liquidity discount rateInterest in group companies Discounted cash flow model Discount rate, liquidity discount rateDeposits from banks Discounted cash flow model Discount rate, liquidity discount rateDeposits from customers Discounted cash flow model Discount rate, liquidity discount rateLiabilities to group companies Discounted cash flow model Discount rate, liquidity discount rate
1 IFRS 13 has been prospectively applied from 1 January 2013. Comparable information in accordance with the transitioned provisions of the standard has not, in all instances been provided.

201
Our business Our performance Governance andtransparency
Annual financialstatements
Additionalinformation
23. Assets and liabilities at fair value continued23.4 Assets and liabilities for which fair value is disclosed – company1
23.4.1 Fair value hierarchy of items for which fair value is disclosed
Level 1Rm
Level 2Rm
Level 3Rm
TotalRm
2013
Assets
Cash and balances with central banks 29 934 29 934
Pledged assets 237 237
Financial investments 12 104 42 12 146
Loans and advances to banks 26 815 46 292 1 062 74 169
Loans and advances to customers 4 866 58 171 542 725 605 762
Interest in group companies 36 993 18 343 12 143 67 479
110 712 122 806 556 209 789 727
Liabilities
Deposits from banks 32 330 27 477 23 59 830
Deposits from customers 410 844 220 806 631 650
Subordinated debt 21 105 21 105
Liabilities to group companies 50 463 32 402 838 83 703
493 637 301 790 861 796 288
23.4.2 Valuation techniques and significant unobservable inputs Level 2 The table below indicates the valuation techniques and main assumptions used in the determination of the fair value of the level 2 assets
and liabilities for which fair value is disclosed:
2013 Valuation basis/technique Main assumptions
Loans and advances to banks Discounted cash flow model Discount rate, liquidity discount rateLoans and advances to customers Discounted cash flow model Discount rate, liquidity discount rateInterest in group companies Discounted cash flow model Discount rate, liquidity discount rateDeposits from banks Discounted cash flow model Discount rate, liquidity discount rateDeposits from customers Discounted cash flow model Discount rate, liquidity discount rateSubordinated debt Discounted cash flow model Discount rate, liquidity discount rateLiabilities to group companies Discounted cash flow model Discount rate, liquidity discount rate
Level 3 The table below indicates the valuation techniques and main assumptions used in the determination of the fair value of the level 3 assets
and liabilities for which fair value is disclosed:
2013 Valuation basis/technique Main assumptions
Financial investments Cost Not applicablePledged assets Discounted cash flow model Discount rate, liquidity discount rateLoans and advances to banks Discounted cash flow model Discount rate, liquidity discount rateLoans and advances to customers Discounted cash flow model Discount rate, liquidity discount rateInterest in group companies Discounted cash flow model Discount rate, liquidity discount rateDeposits from banks Discounted cash flow model Discount rate, liquidity discount rateDeposits from customers Discounted cash flow model Discount rate, liquidity discount rateLiabilities to group companies Discounted cash flow model Discount rate, liquidity discount rate
1 IFRS 13 has been prospectively applied from 1 January 2013. Comparable information in accordance with the transitioned provisions of the standard has not,in all instances, been provided.

202 The Standard Bank of South Africa Annual report 2013
Annual financial statements Notes to the annual financial statements continued
23. Assets and liabilities at fair value continued23.5 Third party credit announcements There were no significant liabilities measured at fair value that existed during the year which had been issued with inseparable
third party credit enhancements.
24. Financial assets and financial liabilities designated at fair value through profit or loss24.1 Loans and advances The maximum exposure to credit risk for loans and advances designated at fair value through profit or loss for the group and company is
R131 million (2012: R2 406 million).
The maximum exposure to credit risk is mitigated by R115 million (2012: R73 million) by using credit derivatives and similar instruments.
The cumulative losses due to changes in credit risk is R13 million (2012: negligible). The change in fair value of the designated loans and advances that is attributable to changes in credit risk is determined as the amount of change in fair value that is not attributable to changes in other market conditions.
24.2 Financial liabilities The fair value movement of financial liabilities attributable to changes in credit risk cumulative to date is R32 million gain
(2012: R113 million gain) for the group and company.
The change in fair value of the designated financial liabilities attributable to changes in credit risk has been calculated by reference to the change in credit risk implicit in the market value of the bank’s senior notes.
The amount that would contractually be required to pay at maturity for financial liabilities designated at fair value through profit or loss for the group is R31 047 million (2012: R38 777 million)1 and for the company is R31 227 million (2012: R38 729 million)1,R6 998 million higher (2012: R2 130 million higher) for the group and company than the carrying amount.
Group Company
2013Rm
2012Rm
2013Rm
2012Rm
25. Contingent liabilities and commitments25.1 Contingent liabilities
Letters of credit 9 082 7 843 9 082 8 075Guarantees 39 852 37 347 39 852 37 347
48 934 45 190 48 934 45 422
PG Loan commitments of R72 964 million(2012: R79 110 million)2 in the group that are irrevocable over the life of the facility or are revocable only in response to material adverse changes are included in the risk and capital management report starting on page 46.
25.2 Capital commitments
Contracted capital expenditure 880 1 315 880 1 315Capital expenditure authorised but not yet contracted 5 857 5 153 5 857 5 153
6 737 6 468 6 737 6 468
1 Restated, refer to annexure B on page 244.2 The December 2012 irrevocable loan commitments were restated with an amount of R12 556 due to the previous incorrect classification of certain loan commitments as irrevocable.
The expenditure will be funded from internal resources.
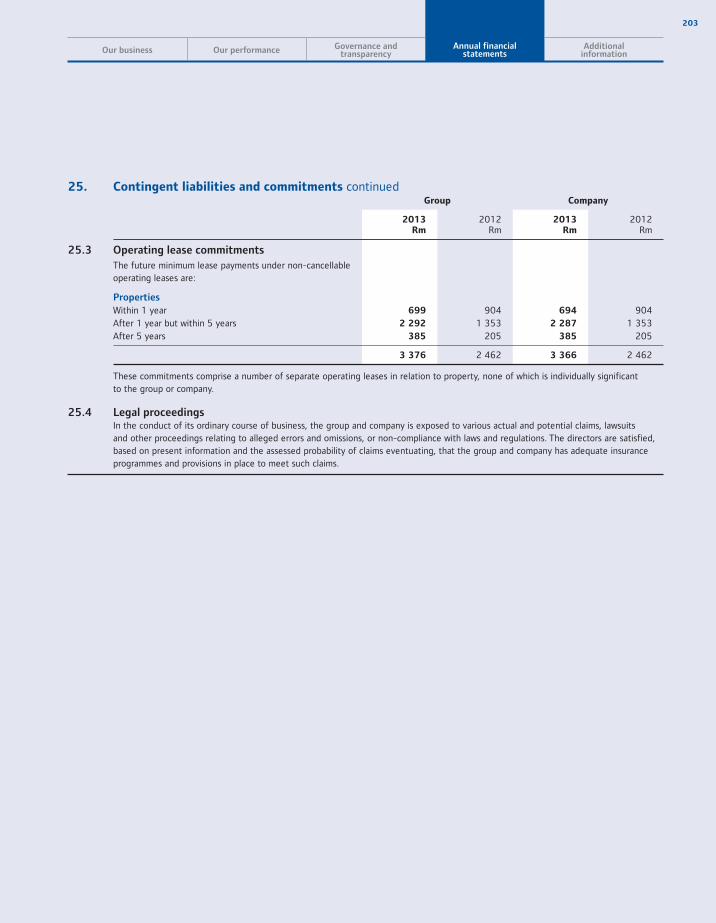
203
Our business Our performance Governance andtransparency
Annual financialstatements
Additionalinformation
25. Contingent liabilities and commitments continuedGroup Company
2013Rm
2012Rm
2013Rm
2012Rm
25.3 Operating lease commitments
The future minimum lease payments under non-cancellable operating leases are:
Properties
Within 1 year 699 904 694 904After 1 year but within 5 years 2 292 1 353 2 287 1 353After 5 years 385 205 385 205
3 376 2 462 3 366 2 462
These commitments comprise a number of separate operating leases in relation to property, none of which is individually significant to the group or company.
25.4 Legal proceedings
In the conduct of its ordinary course of business, the group and company is exposed to various actual and potential claims, lawsuits and other proceedings relating to alleged errors and omissions, or non-compliance with laws and regulations. The directors are satisfied, based on present information and the assessed probability of claims eventuating, that the group and company has adequate insurance programmes and provisions in place to meet such claims.

204 The Standard Bank of South Africa Annual report 2013
Annual financial statements Notes to the annual financial statements continued
26. Financial instruments subject to offsetting, enforceable master netting arrangements
or similar agreements IFRS requires financial assets and financial liabilities to be offset and the net amount presented in the statement of financial position
when, and only when, the group and company has a current legally enforceable right to set off recognised amounts, as well as the intention to settle on a net basis or to realise the asset and settle the liability simultaneously1.
Accordingly, the following table2 sets out the impact of offset, as well as financial assets and financial liabilities that are subject to an enforceable master netting arrangement or similar agreement, irrespective of whether they have been offset in accordance with IFRS.
It should be noted that the information below is not intended to represent the group and company’s actual credit exposure, nor will it agree to that presented in the statement of financial position.
Group and company
Gross amount of recognised
financial assets3
Rm
Gross amounts of recognised
financial liabilities
offset in the statement of
financial position4
Rm
Net amounts of financial
assets presented in
the statement of financial
positionRm
Financial instruments,
financial collateral and cash collateral5
RmNet amount
Rm
2013
Assets
Derivative assets 51 240 (98) 51 142 (44 827) 6 315
Trading assets 4 463 4 463 (4 463)
Loans and advances6 80 228 (33 743) 46 485 (43 503) 2 982
135 931 (33 841) 102 090 (92 793) 9 297
Gross amount of recognised
financial liabilities3
Rm
Gross amounts of recognised
financial assets offset in the statement of
financial position4
Rm
Net amounts of financial
liabilities presented in
the statement of financial
positionRm
Financial instruments,
financial collateral and cash collateral7
RmNet amount
Rm
Liabilities
Derivative liabilities 53 241 (98) 53 143 (44 173) 8 970
Trading liabilities 7 498 7 498 (7 498)
Deposit and current accounts6 43 980 (33 743) 10 237 (710) 9 527
104 719 (33 841) 70 878 (52 381) 18 497
1 There are no instances where the group and company has a current legally enforceable right to offset without the intention to settle on a net basis or to realise the asset and settle the liability simultaneously.
2 There are no items measured on different measurement bases within the line items presented in the tables.3 Gross amounts are disclosed for recognised assets and liabilities that are either offset in the statement of financial position or subject to a master netting arrangement
or a similar agreement, irrespective of whether the offsetting criteria is met. 4 The amounts that qualify for offset in accordance with the criteria per IFRS. 5 Related amounts not offset in the statement of financial position that are subject to a master netting arrangement or similar agreement, including financial collateral
(whether recognised or unrecognised) and cash collateral. In most instances, the group and company is allowed to sell/repledge collateral received.6 The most material amounts offset in the statement of financial position pertain to cash management accounts. The cash management accounts allow holding companies
(or central treasury functions) to manage the cash flows of its group by linking the current accounts of multiple group legal entities within a group. This allows for cash balances of the different legal entities to be offset against each other to arrive at a net balance for those groups. The cash management accounts are offset in the statement of financial position in terms of IFRS.
7 Related amounts not offset in the statement of financial position that are subject to a master netting arrangement or similar agreement, including financial (whether recognised or unrecognised) and cash collateral. In most instances, the counterparty may not sell or repledge collateral pledged by the group and company.

205
Our business Our performance Governance andtransparency
Annual financialstatements
Additionalinformation
26. Financial instruments subject to offsetting, enforceable master netting arrangements
or similar agreements continued
Group and company
Gross amounts of recognised
financial assets1
Rm
Gross amounts of recognised
financial liabilities
offset in the statement of
financial position2
Rm
Net amounts of financial
assets presented in
the statement of financial
positionRm
Financial instruments,
financial collateral and cash collateral3
RmNet amount
Rm
2012
Assets
Derivative assets 52 350 (331) 52 019 (46 086) 5 933Trading assets 2 136 2 136 (2 136)Loans and advances4 49 075 (27 943) 21 132 (19 419) 1 713
103 561 (28 274) 75 287 (67 641) 7 646
Gross amount of recognised
financial liabilities1
Rm
Gross amounts of recognised
financial assets offset in the statement of
financial position2
Rm
Net amounts of financial
liabilities presented in
the statement of financial
positionRm
Financial instruments,
financial collateral and cash collateral5
RmNet amount
Rm
Liabilities
Derivative liabilities 50 316 (331) 49 985 (47 524) 2 461Trading liabilities 8 079 8 079 (8 079)Deposit and current accounts4 37 880 (27 943) 9 937 (3 746) 6 191
96 275 (28 274) 68 001 (59 349) 8 652
1 Gross amounts are disclosed for recognised assets and liabilities that are either offset in the statement of financial position or subject to a master netting arrangement or a similar agreement, irrespective of whether the offsetting criteria is met.
2 The amounts that qualify for offset in accordance with the criteria per IFRS.3 Related amounts not offset in the statement of financial position that are subject to a master netting arrangement or similar agreement, including financial collateral
(whether recognised or unrecognised) and cash collateral. In most instances, the group and company is allowed to sell/repledge collateral received.4 The most material amounts offset in the statement of financial position pertain to cash management accounts. The cash management accounts allow holding companies
(or central treasury functions) to manage the cash flows of a group by linking the current accounts of multiple legal entities within a group. It allows for cash balances of the different legal entities to be offset against each other to arrive at a net balance for the group. The cash management accounts are offset in the statement of financial position in terms of IAS 32.
5 Related amounts not offset in the statement of financial position that are subject to a master netting arrangement or similar agreement, including financial(whether recognised or unrecognised) and cash collateral. In most instances, the counterparty may not sell or repledge collateral by the group and company.
The table below sets out the nature of agreement and the types of rights relating to items which do not qualify for offset but that are subject to a master netting arrangement or similar agreement.
Nature of agreement Related rights
Derivative assets and liabilities ISDAs The agreement allows for set off in the event of default
Trading assets and trading liabilities Global master repurchase agreements
The agreement allows for set off in the event of default
Loans and advances to banks Customer agreement and Banks Act
In the event of liquidation or bankruptcy, offset shall beenforceable subject to Banks Act requirements being met.
Deposit and current accounts Customer agreementand Banks Act
In the event of liquidation or bankruptcy, offset shall beenforceable subject to Banks Act requirements being met.

206 The Standard Bank of South Africa Annual report 2013
Annual financial statements Notes to the annual financial statements continued
27. Income statement information
Group Company
2013Rm
2012Rm
2013Rm
2012Rm
27.1 Interest income
Interest on loans and advances and investments 56 316 53 520 55 747 52 864Unwinding of discount element of credit impairments for loans and advances (note 9.3) 556 726 551 713Fair value adjustments on dated financial instruments (238) (152) (238) (124)Dividends on dated securities 1 435 1 583 1 237 1 522
58 069 55 677 57 297 54 975
All interest income reported above with the exceptionof R3 000 million (2012: R3 005 million) for the groupand R2 958 million (2012: R3 033 million) for the company relates to financial assets not carried at fair value through profit or loss.
27.2 Interest expense
Current accounts 111 122 111 122Savings and deposit accounts 7 315 9 883 7 340 9 905Foreign finance creditors 750 828 751 829Subordinated debt 1 624 1 841 1 624 1 841Other interest-bearing liabilities 19 381 17 754 18 898 17 082
29 181 30 428 28 724 29 779
All interest expense reported above with the exceptionof R1 555 million (2012: R577 million) for the group andR1 554 million (2012: R541 million) for the company,relates to financial liabilities not carried at fair valuethrough profit or loss.
27.3 Fee and commission revenue
Account transaction fees 7 926 8 114 7 926 8 114Card-based commission 4 478 3 911 4 075 3 516Knowledge-based fees and commission 491 741 491 740Electronic banking fees 2 085 1 838 2 085 1 838Bancassurance 1 828 1 536 710 561Foreign currency service fees 756 679 756 679Documentation and administration fees 1 059 841 1 051 829Other 1 885 1 823 2 493 2 389
20 508 19 483 19 587 18 666
All fee and commission revenue reported above relates to financial assets or liabilities not carried at fair value through profit or loss for the group and company.

207
Our business Our performance Governance andtransparency
Annual financialstatements
Additionalinformation
27. Income statement information continuedGroup Company
2013Rm
2012Rm
2013Rm
2012Rm
27.4 Fee and commission expense
Account transaction fees 836 878 836 878Card-based commission 1 395 1 117 1 380 1 103Electronic banking fees 565 528 565 528Bancassurance 434 361 434 361Documentation and administration fees 121 92 121 92Other 181 143 181 143
3 532 3 119 3 517 3 105
All fee and commission expenses reported above relateto financial assets or liabilities not carried at fair value through profit or loss for the group and company.
27.5 Trading revenue
Commodities 210 308 210 308Foreign exchange 1 805 1 765 1 805 1 765Credit 588 658 588 658Interest rates 20 491 58 533Equities 886 (182) 886 (217)Other 12 107 12 107
3 521 3 147 3 559 3 154
27.6 Other revenue
Banking and other1 1 390 1 727 1 785 1 884Property-related revenue 85 70 84 71 Insurance – bancassurance income 896 744 896 744Net losses on financial instruments designated at fair value through profit or loss (20) (20) (20) (20)
2 351 2 521 2 745 2 679
1 Included in banking and other income for the company is dividend income from subsidiaries of R313 million (2012: R235 million).
27.7 Credit impairment charges
Net credit impairments raised for loans and advances 8 828 6 782 8 766 6 740Recoveries on loans and advances previously written off (1 013) (997) (1 003) (989)
7 815 5 785 7 763 5 751
Comprising:
Net specific credit impairment charges 7 845 6 005 7 794 5 947
Specific credit impairment charges (note 9.3) 8 858 7 002 8 797 6 936Recoveries on loans and advances previously written off (1 013) (997) (1 003) (989)
Portfolio credit impairment reversals (note 9.3) (30) (220) (31) (196)
7 815 5 785 7 763 5 751
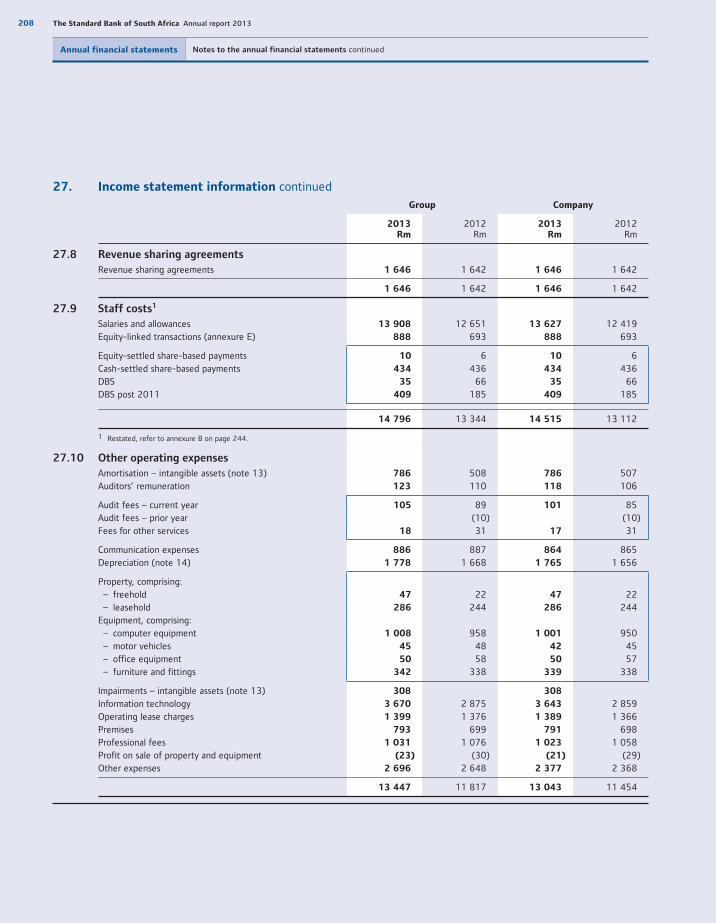
208 The Standard Bank of South Africa Annual report 2013
Annual financial statements Notes to the annual financial statements continued
27. Income statement information continuedGroup Company
2013Rm
2012Rm
2013Rm
2012Rm
27.8 Revenue sharing agreements
Revenue sharing agreements 1 646 1 642 1 646 1 642
1 646 1 642 1 646 1 642
27.9 Staff costs1
Salaries and allowances 13 908 12 651 13 627 12 419Equity-linked transactions (annexure E) 888 693 888 693
Equity-settled share-based payments 10 6 10 6Cash-settled share-based payments 434 436 434 436DBS 35 66 35 66DBS post 2011 409 185 409 185
14 796 13 344 14 515 13 112
1 Restated, refer to annexure B on page 244.
27.10 Other operating expenses
Amortisation – intangible assets (note 13) 786 508 786 507Auditors’ remuneration 123 110 118 106
Audit fees – current year 105 89 101 85Audit fees – prior year (10) (10)Fees for other services 18 31 17 31
Communication expenses 886 887 864 865Depreciation (note 14) 1 778 1 668 1 765 1 656
Property, comprising: – freehold 47 22 47 22 – leasehold 286 244 286 244Equipment, comprising: – computer equipment 1 008 958 1 001 950 – motor vehicles 45 48 42 45 – office equipment 50 58 50 57 – furniture and fittings 342 338 339 338
Impairments – intangible assets (note 13) 308 308
Information technology 3 670 2 875 3 643 2 859Operating lease charges 1 399 1 376 1 389 1 366Premises 793 699 791 698Professional fees 1 031 1 076 1 023 1 058Profit on sale of property and equipment (23) (30) (21) (29)Other expenses 2 696 2 648 2 377 2 368
13 447 11 817 13 043 11 454
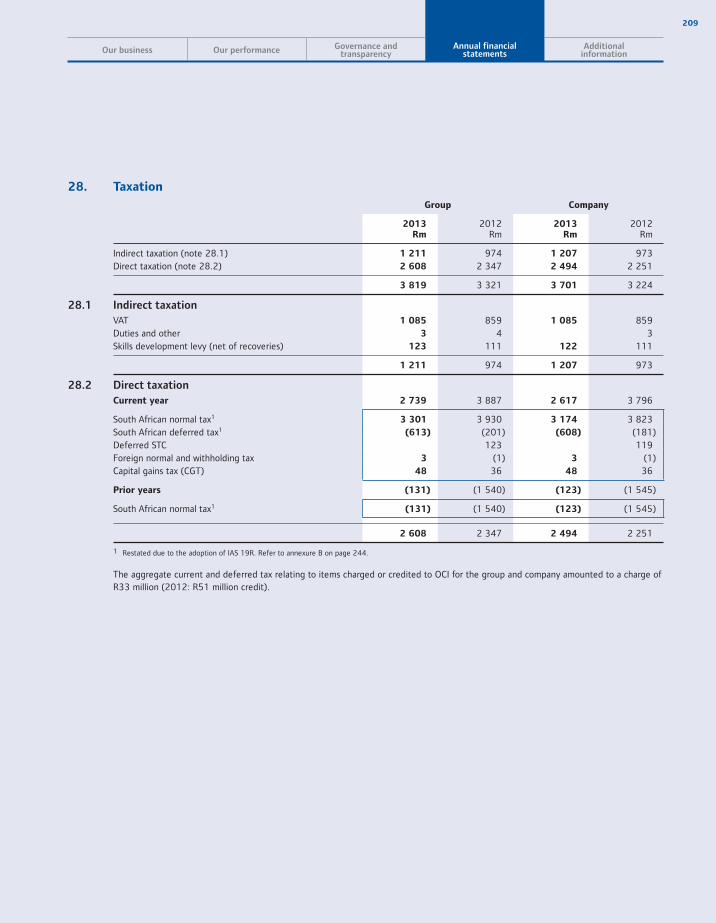
209
Our business Our performance Governance andtransparency
Annual financialstatements
Additionalinformation
28. Taxation
Group Company
2013Rm
2012Rm
2013Rm
2012Rm
Indirect taxation (note 28.1) 1 211 974 1 207 973Direct taxation (note 28.2) 2 608 2 347 2 494 2 251
3 819 3 321 3 701 3 224
28.1 Indirect taxation
VAT 1 085 859 1 085 859Duties and other 3 4 3Skills development levy (net of recoveries) 123 111 122 111
1 211 974 1 207 973
28.2 Direct taxation
Current year 2 739 3 887 2 617 3 796
South African normal tax1 3 301 3 930 3 174 3 823South African deferred tax1 (613) (201) (608) (181)Deferred STC 123 119Foreign normal and withholding tax 3 (1) 3 (1)Capital gains tax (CGT) 48 36 48 36
Prior years (131) (1 540) (123) (1 545)
South African normal tax1 (131) (1 540) (123) (1 545)
2 608 2 347 2 494 2 251
1 Restated due to the adoption of IAS 19R. Refer to annexure B on page 244.
The aggregate current and deferred tax relating to items charged or credited to OCI for the group and company amounted to a charge of R33 million (2012: R51 million credit).

210 The Standard Bank of South Africa Annual report 2013
Annual financial statements Notes to the annual financial statements continued
28. Taxation continued 28.2 Direct taxation continued Income tax recognised in OCI The table below sets out the amount of income tax relating to each component in OCI:
Group Company
BeforetaxRm
Tax(expense)/
benefitRm
Net oftaxRm
BeforetaxRm
Tax(expense)/
benefitRm
Net oftaxRm
2013
Exchange differences on translating foreign operations 187 187 181 181
Net change in fair value on cash flow hedges transferred to profit or loss 713 (200) 513 713 (200) 513
Realised fair value adjustments on cash flow hedges (553) 155 (398) (553) 155 (398)
Net change in fair value of available-for-sale financial assets 39 (14) 25 39 (14) 25
Defined benefit fund remeasurements (327) 92 (235) (327) 92 (235)
59 33 92 53 33 86
2012
Exchange differences on translating foreign operations 40 40 39 39Net change in fair value on cash flow hedges 221 (62) 159 221 (62) 159Realised fair value adjustments on cash flow hedges transferred to profit or loss (379) 106 (273) (379) 106 (273)Net change in fair value of available-for-sale financial assets (249) 12 (237) (249) 12 (237)Realised fair value adjustments of available-for-sale financial assets transferredto the income statement 43 17 60 43 17 60
Defined benefit fund remeasurements1 446 (124) 322 446 (124) 322
122 (51) 71 121 (51) 70
1 Introduced as a result of the adoption of IAS 19R. Refer to annexure B on page 247.
Future tax relief The group has estimated tax losses of R126 million (2012: R776 million) which are available for set off against future taxable income,
for which a deferred tax asset was recognised. These deferred tax asset balances were offset against deferred tax liabilities, refer to annexure A – accounting policy 14 – Tax.

211
Our business Our performance Governance andtransparency
Annual financialstatements
Additionalinformation
28. Taxation continued28.2 Direct taxation continued
Group Company
2013%
2012%
2013%
2012%
South African tax rate reconciliation
Total taxation charge for the year as a percentage of net income before indirect taxation 27 22 27 22VAT, duties and skills development levy (9) (6) (9) (7)STC (1) (1)
Corporate tax charge for the year as a percentage
of profit before indirect taxation 18 15 18 14The charge for the year has been reduced as a consequence of:Dividends received 6 5 6 6 Other non-taxable income 3 1 3 1 Other permanent differences (3) (3)Prior year tax adjustments 1 10 1 10
Standard rate of South African tax 28 28 28 28
2013 2012
GrossRm
TaxRm
Non-controlling
interestRm
Net
RmGross
RmTaxRm
Non-controlling
interestRm
NetRm
29. Headline earnings Group
Profit for the year1 13 124 (2 608) 21 10 537 14 242 (2 347) (11) 11 884Headline earnings
adjustable items
added/(reversed) 258 (86) 172 (433) 10 (423)
Impairment of intangible assets – IAS 38 308 (86) 222
Disposals of businesses and divisions – IAS 27 (27) (27)
Profit on sale of property and equipment – IAS 16 (23) (23) (30) (2) (32)Transactions with associates – IAS 28 and IAS 36 (153) (153)Realisation of availiable-for-saleassets – IAS 39 (250) 12 (238)
Headline earnings 13 382 (2 694) 21 10 709 13 809 (2 337) (11) 11 461
1 Restated, refer to annexure B on page 244.
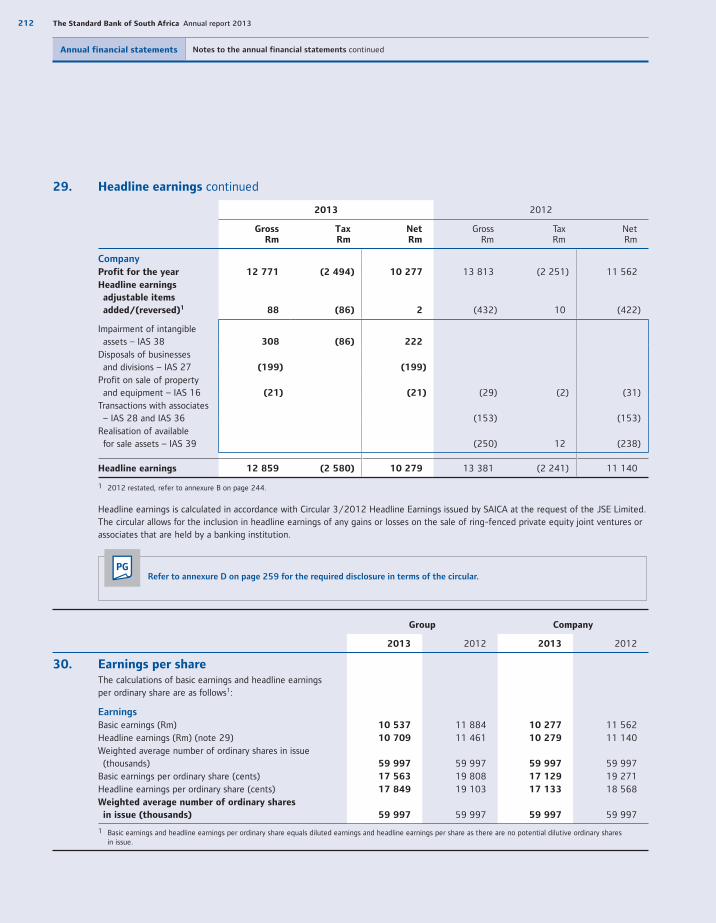
212 The Standard Bank of South Africa Annual report 2013
Annual financial statements Notes to the annual financial statements continued
29. Headline earnings continued
2013 2012
GrossRm
TaxRm
NetRm
GrossRm
TaxRm
NetRm
Company
Profit for the year 12 771 (2 494) 10 277 13 813 (2 251) 11 562Headline earnings
adjustable items
added/(reversed)1 88 (86) 2 (432) 10 (422)
Impairment of intangible assets – IAS 38 308 (86) 222
Disposals of businesses and divisions – IAS 27 (199) (199)
Profit on sale of property and equipment – IAS 16 (21) (21) (29) (2) (31)Transactions with associates – IAS 28 and IAS 36 (153) (153)Realisation of available for sale assets – IAS 39 (250) 12 (238)
Headline earnings 12 859 (2 580) 10 279 13 381 (2 241) 11 140
1 2012 restated, refer to annexure B on page 244.
Headline earnings is calculated in accordance with Circular 3/2012 Headline Earnings issued by SAICA at the request of the JSE Limited. The circular allows for the inclusion in headline earnings of any gains or losses on the sale of ring-fenced private equity joint ventures or associates that are held by a banking institution.
PGRefer to annexure D on page 259 for the required disclosure in terms of the circular.
Group Company
2013 2012 2013 2012
30. Earnings per share The calculations of basic earnings and headline earningsper ordinary share are as follows1:
Earnings
Basic earnings (Rm) 10 537 11 884 10 277 11 562Headline earnings (Rm) (note 29) 10 709 11 461 10 279 11 140Weighted average number of ordinary shares in issue (thousands) 59 997 59 997 59 997 59 997Basic earnings per ordinary share (cents) 17 563 19 808 17 129 19 271Headline earnings per ordinary share (cents) 17 849 19 103 17 133 18 568Weighted average number of ordinary shares
in issue (thousands) 59 997 59 997 59 997 59 997
1 Basic earnings and headline earnings per ordinary share equals diluted earnings and headline earnings per share as there are no potential dilutive ordinary sharesin issue.
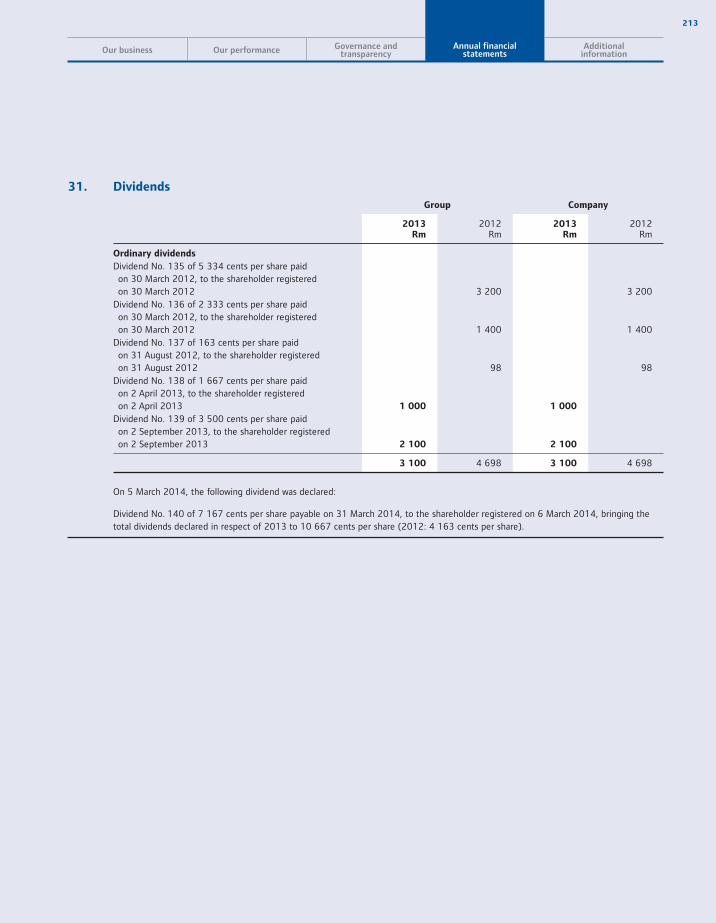
213
Our business Our performance Governance andtransparency
Annual financialstatements
Additionalinformation
31. Dividends
Group Company
2013Rm
2012Rm
2013Rm
2012Rm
Ordinary dividends
Dividend No. 135 of 5 334 cents per share paid on 30 March 2012, to the shareholder registeredon 30 March 2012 3 200 3 200
Dividend No. 136 of 2 333 cents per share paid on 30 March 2012, to the shareholder registeredon 30 March 2012 1 400 1 400
Dividend No. 137 of 163 cents per share paid on 31 August 2012, to the shareholder registeredon 31 August 2012 98 98
Dividend No. 138 of 1 667 cents per share paid on 2 April 2013, to the shareholder registeredon 2 April 2013 1 000 1 000
Dividend No. 139 of 3 500 cents per share paid on 2 September 2013, to the shareholder registeredon 2 September 2013 2 100 2 100
3 100 4 698 3 100 4 698
On 5 March 2014, the following dividend was declared:
Dividend No. 140 of 7 167 cents per share payable on 31 March 2014, to the shareholder registered on 6 March 2014, bringing the total dividends declared in respect of 2013 to 10 667 cents per share (2012: 4 163 cents per share).
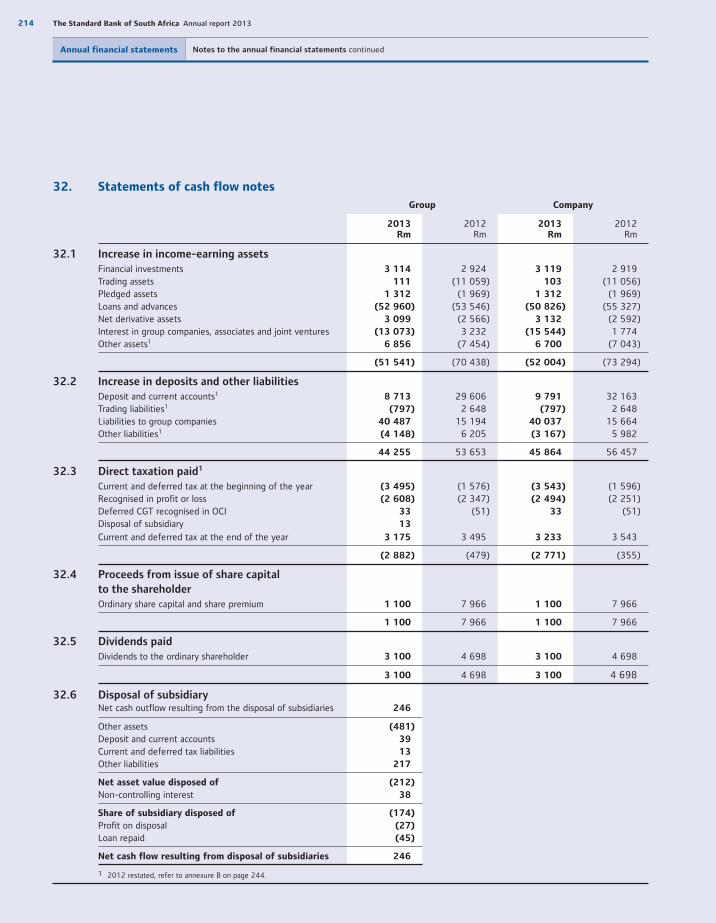
214 The Standard Bank of South Africa Annual report 2013
Annual financial statements Notes to the annual financial statements continued
32. Statements of cash flow notes
Group Company
2013Rm
2012Rm
2013Rm
2012Rm
32.1 Increase in income-earning assets
Financial investments 3 114 2 924 3 119 2 919 Trading assets 111 (11 059) 103 (11 056)Pledged assets 1 312 (1 969) 1 312 (1 969)Loans and advances (52 960) (53 546) (50 826) (55 327)Net derivative assets 3 099 (2 566) 3 132 (2 592)Interest in group companies, associates and joint ventures (13 073) 3 232 (15 544) 1 774Other assets1 6 856 (7 454) 6 700 (7 043)
(51 541) (70 438) (52 004) (73 294)
32.2 Increase in deposits and other liabilities
Deposit and current accounts1 8 713 29 606 9 791 32 163Trading liabilities1 (797) 2 648 (797) 2 648Liabilities to group companies 40 487 15 194 40 037 15 664Other liabilities1 (4 148) 6 205 (3 167) 5 982
44 255 53 653 45 864 56 457
32.3 Direct taxation paid1
Current and deferred tax at the beginning of the year (3 495) (1 576) (3 543) (1 596)Recognised in profit or loss (2 608) (2 347) (2 494) (2 251)Deferred CGT recognised in OCI 33 (51) 33 (51)Disposal of subsidiary 13
Current and deferred tax at the end of the year 3 175 3 495 3 233 3 543
(2 882) (479) (2 771) (355)
32.4 Proceeds from issue of share capital
to the shareholder
Ordinary share capital and share premium 1 100 7 966 1 100 7 966
1 100 7 966 1 100 7 966
32.5 Dividends paid
Dividends to the ordinary shareholder 3 100 4 698 3 100 4 698
3 100 4 698 3 100 4 698
32.6 Disposal of subsidiaryNet cash outflow resulting from the disposal of subsidiaries 246
Other assets (481)
Deposit and current accounts 39
Current and deferred tax liabilities 13
Other liabilities 217
Net asset value disposed of (212)
Non-controlling interest 38
Share of subsidiary disposed of (174)
Profit on disposal (27)
Loan repaid (45)
Net cash flow resulting from disposal of subsidiaries 246
1 2012 restated, refer to annexure B on page 244.
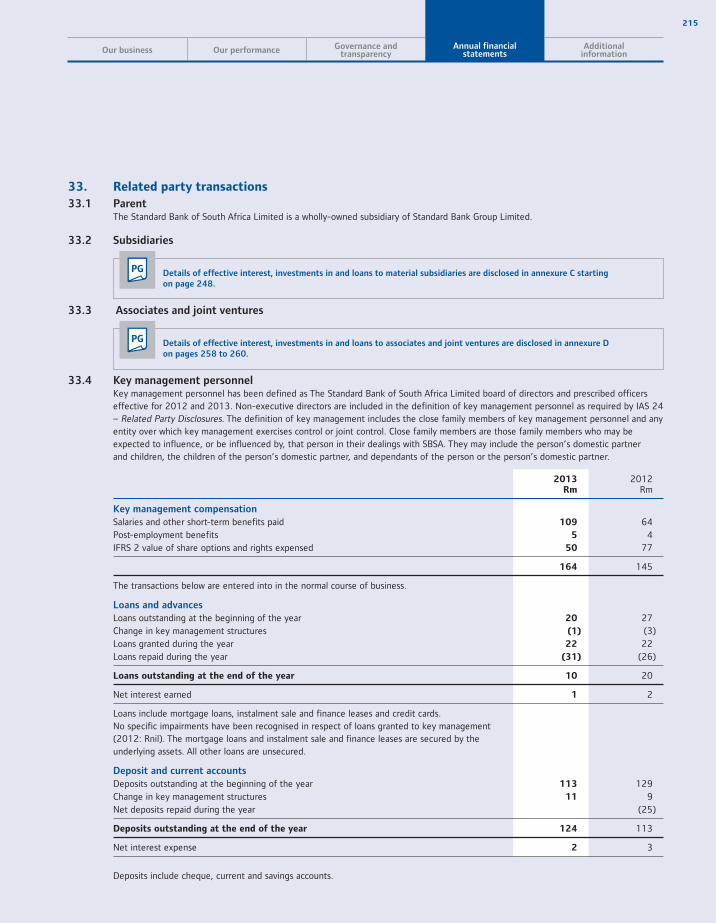
215
Our business Our performance Governance andtransparency
Annual financialstatements
Additionalinformation
33. Related party transactions
33.1 Parent The Standard Bank of South Africa Limited is a wholly-owned subsidiary of Standard Bank Group Limited.
33.2 Subsidiaries
PG Details of effective interest, investments in and loans to material subsidiaries are disclosed in annexure C startingon page 248.
33.3 Associates and joint ventures
PG Details of effective interest, investments in and loans to associates and joint ventures are disclosed in annexure D on pages 258 to 260.
33.4 Key management personnel Key management personnel has been defined as The Standard Bank of South Africa Limited board of directors and prescribed officers
effective for 2012 and 2013. Non-executive directors are included in the definition of key management personnel as required by IAS 24 – Related Party Disclosures. The definition of key management includes the close family members of key management personnel and any entity over which key management exercises control or joint control. Close family members are those family members who may be expected to influence, or be influenced by, that person in their dealings with SBSA. They may include the person’s domestic partner and children, the children of the person’s domestic partner, and dependants of the person or the person’s domestic partner.
2013Rm
2012Rm
Key management compensation
Salaries and other short-term benefits paid 109 64Post-employment benefits 5 4IFRS 2 value of share options and rights expensed 50 77
164 145
The transactions below are entered into in the normal course of business.
Loans and advances
Loans outstanding at the beginning of the year 20 27Change in key management structures (1) (3)Loans granted during the year 22 22Loans repaid during the year (31) (26)
Loans outstanding at the end of the year 10 20
Net interest earned 1 2
Loans include mortgage loans, instalment sale and finance leases and credit cards. No specific impairments have been recognised in respect of loans granted to key management (2012: Rnil). The mortgage loans and instalment sale and finance leases are secured by the underlying assets. All other loans are unsecured.
Deposit and current accounts
Deposits outstanding at the beginning of the year 113 129Change in key management structures 11 9 Net deposits repaid during the year (25)
Deposits outstanding at the end of the year 124 113
Net interest expense 2 3
Deposits include cheque, current and savings accounts.
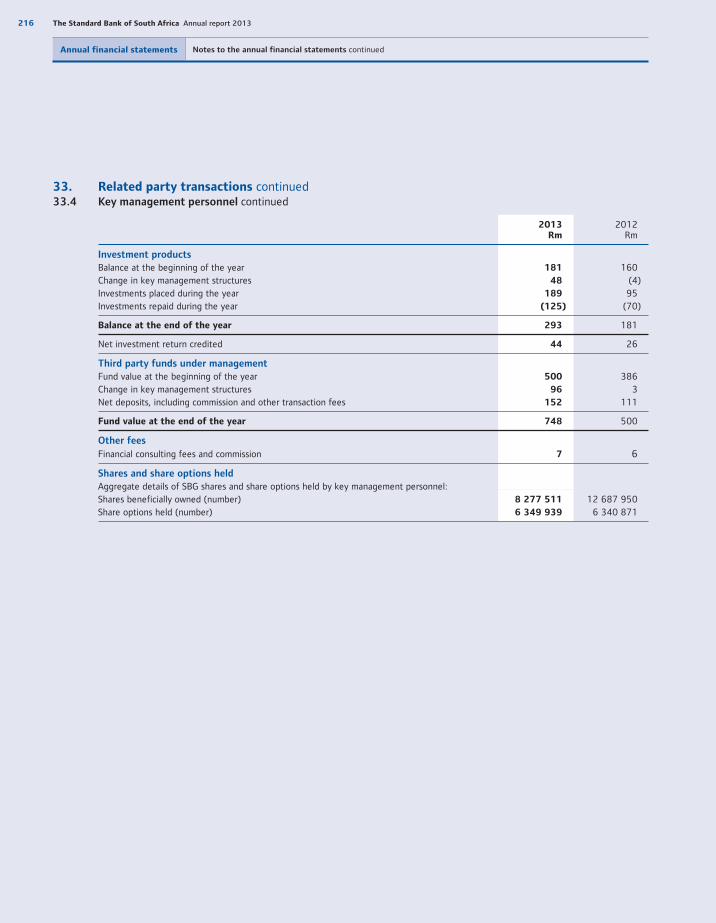
216 The Standard Bank of South Africa Annual report 2013
Annual financial statements Notes to the annual financial statements continued
33. Related party transactions continued33.4 Key management personnel continued
2013Rm
2012Rm
Investment products
Balance at the beginning of the year 181 160Change in key management structures 48 (4)Investments placed during the year 189 95Investments repaid during the year (125) (70)
Balance at the end of the year 293 181
Net investment return credited 44 26
Third party funds under management
Fund value at the beginning of the year 500 386Change in key management structures 96 3Net deposits, including commission and other transaction fees 152 111
Fund value at the end of the year 748 500
Other fees
Financial consulting fees and commission 7 6
Shares and share options held
Aggregate details of SBG shares and share options held by key management personnel:Shares beneficially owned (number) 8 277 511 12 687 950Share options held (number) 6 349 939 6 340 871
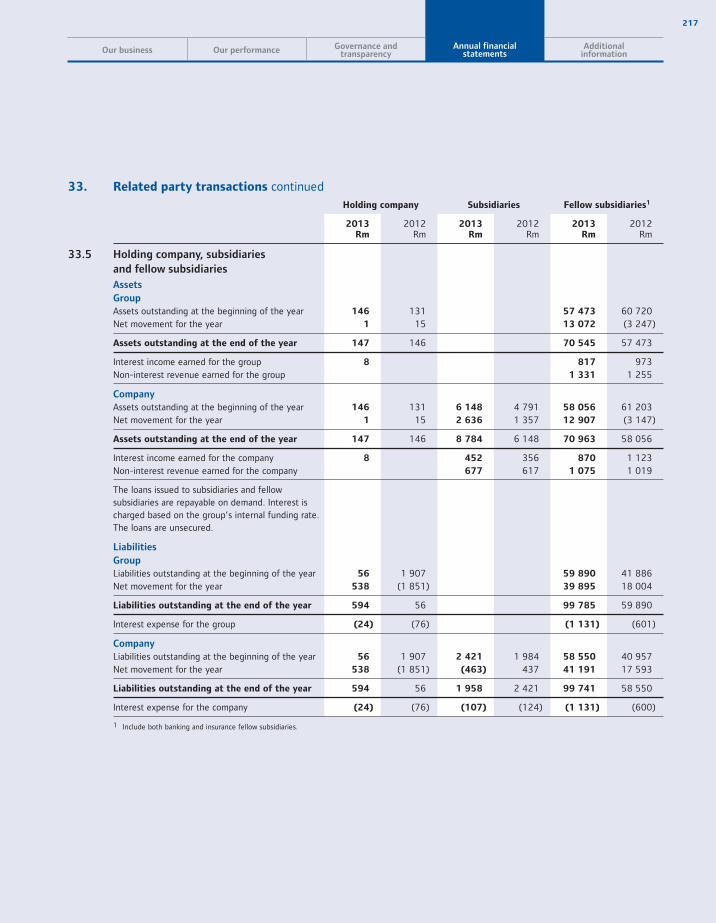
217
Our business Our performance Governance andtransparency
Annual financialstatements
Additionalinformation
33. Related party transactions continuedHolding company Subsidiaries Fellow subsidiaries1
2013Rm
2012Rm
2013Rm
2012Rm
2013Rm
2012Rm
33.5 Holding company, subsidiaries
and fellow subsidiaries
Assets
Group
Assets outstanding at the beginning of the year 146 131 57 473 60 720Net movement for the year 1 15 13 072 (3 247)
Assets outstanding at the end of the year 147 146 70 545 57 473
Interest income earned for the group 8 817 973Non-interest revenue earned for the group 1 331 1 255
Company
Assets outstanding at the beginning of the year 146 131 6 148 4 791 58 056 61 203Net movement for the year 1 15 2 636 1 357 12 907 (3 147)
Assets outstanding at the end of the year 147 146 8 784 6 148 70 963 58 056
Interest income earned for the company 8 452 356 870 1 123Non-interest revenue earned for the company 677 617 1 075 1 019
The loans issued to subsidiaries and fellow subsidiaries are repayable on demand. Interest is charged based on the group’s internal funding rate. The loans are unsecured.
Liabilities
Group
Liabilities outstanding at the beginning of the year 56 1 907 59 890 41 886Net movement for the year 538 (1 851) 39 895 18 004
Liabilities outstanding at the end of the year 594 56 99 785 59 890
Interest expense for the group (24) (76) (1 131) (601)
Company
Liabilities outstanding at the beginning of the year 56 1 907 2 421 1 984 58 550 40 957Net movement for the year 538 (1 851) (463) 437 41 191 17 593
Liabilities outstanding at the end of the year 594 56 1 958 2 421 99 741 58 550
Interest expense for the company (24) (76) (107) (124) (1 131) (600)
1 Include both banking and insurance fellow subsidiaries.

218 The Standard Bank of South Africa Annual report 2013
Annual financial statements Notes to the annual financial statements continued
33. Related party transactions continued33.5 Holding company, subsidiaries and fellow subsidiaries continued
Deposit and current accounts Fees received Net interest paid
2013Rm
2012Rm
2013Rm
2012Rm
2013Rm
2012Rm
Banking arrangements
Liberty and its subsidiaries make use of banking facilities provided by the company.Deposit and current accounts
Liberty 7 37 44 37Liberty subsidiaries 3 382 3 066 41 37 71 48
3 389 3 103 41 37 115 85
Information technology outsourcing arrangement Liberty partially outsources its IT services to the company in terms of various agreements until 30 April 2021. Fees charged for 2013
amounted to R22 million (2012: R19 million).
Software development Liberty developed a number of distribution systems on behalf of the company in prior years. The 2013 annual maintenance fees paid
are R8 million (2012: R6 million).
Operating leases Lease income Liberty leases a Pretoria property from the company in terms of a lease entered on 22 December 1999 for a period of 13,5 years
which terminated on 31 May 2013. Lease escalations were fixed at 12% per annum. Total lease receipts for 2013 amounted to R50 million (2012: R112 million).
Lease expense The company leases several properties from Liberty, including 50% of its head office at 5 Simmonds Street, Johannesburg, and various
retail branches in shopping centres. These leases are governed by numerous separate lease agreements. Total lease payments for2013 amounted to R80 million (2012: R74 million).
Bancassurance The Liberty group has extended the bancassurance agreements with the company for the manufacture, sale and promotion of insurance,
investment and health products through the company’s African distribution capability. New business premium income in respect of this business in 2013 amounted to R7 624 million (2012: R5 984 million). In terms of the agreements, Liberty’s group subsidiaries pay profit shares to various operations of the company. The amounts to be paid are in most cases dependent on source and type of business and are paid along geographical lines. The total combined net profit share amounts receivable for the year ended 31 December 2013 is R868 million (2012: R775 million).
The bancassurance agreements are evergreen agreements with a 24-month notice period for termination, but neither party could give notice of termination until February 2014. As at the date of the approval of this annual report, neither party had given notice.
A binder agreement has been entered into with Liberty effective from 31 December 2012. The binder agreement is associated with the administration of policies sold under the bancassurance agreement, and shall remain in force for an indefinite period with a 90 day notice period for termination. Fees receivable for the year ended 31 December 2013 are R94 million.
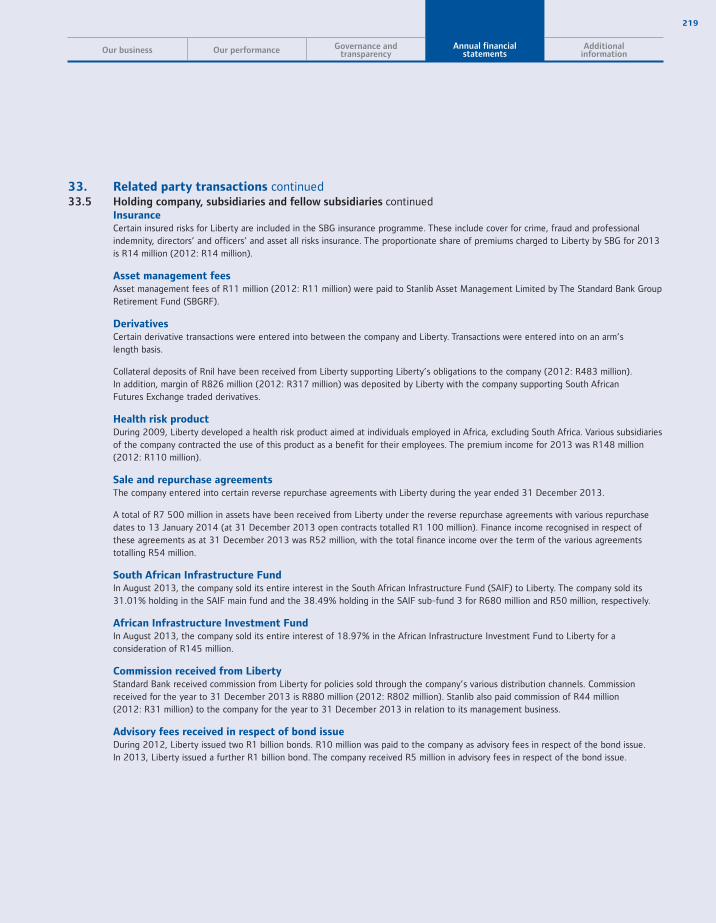
219
Our business Our performance Governance andtransparency
Annual financialstatements
Additionalinformation
33. Related party transactions continued33.5 Holding company, subsidiaries and fellow subsidiaries continued Insurance Certain insured risks for Liberty are included in the SBG insurance programme. These include cover for crime, fraud and professional
indemnity, directors’ and officers’ and asset all risks insurance. The proportionate share of premiums charged to Liberty by SBG for 2013 is R14 million (2012: R14 million).
Asset management fees Asset management fees of R11 million (2012: R11 million) were paid to Stanlib Asset Management Limited by The Standard Bank Group
Retirement Fund (SBGRF).
Derivatives Certain derivative transactions were entered into between the company and Liberty. Transactions were entered into on an arm’s
length basis.
Collateral deposits of Rnil have been received from Liberty supporting Liberty’s obligations to the company (2012: R483 million). In addition, margin of R826 million (2012: R317 million) was deposited by Liberty with the company supporting South African Futures Exchange traded derivatives.
Health risk product During 2009, Liberty developed a health risk product aimed at individuals employed in Africa, excluding South Africa. Various subsidiaries
of the company contracted the use of this product as a benefit for their employees. The premium income for 2013 was R148 million (2012: R110 million).
Sale and repurchase agreements The company entered into certain reverse repurchase agreements with Liberty during the year ended 31 December 2013.
A total of R7 500 million in assets have been received from Liberty under the reverse repurchase agreements with various repurchase dates to 13 January 2014 (at 31 December 2013 open contracts totalled R1 100 million). Finance income recognised in respect of these agreements as at 31 December 2013 was R52 million, with the total finance income over the term of the various agreements totalling R54 million.
South African Infrastructure Fund In August 2013, the company sold its entire interest in the South African Infrastructure Fund (SAIF) to Liberty. The company sold its
31.01% holding in the SAIF main fund and the 38.49% holding in the SAIF sub-fund 3 for R680 million and R50 million, respectively.
African Infrastructure Investment Fund In August 2013, the company sold its entire interest of 18.97% in the African Infrastructure Investment Fund to Liberty for a
consideration of R145 million.
Commission received from Liberty Standard Bank received commission from Liberty for policies sold through the company’s various distribution channels. Commission
received for the year to 31 December 2013 is R880 million (2012: R802 million). Stanlib also paid commission of R44 million (2012: R31 million) to the company for the year to 31 December 2013 in relation to its management business.
Advisory fees received in respect of bond issue During 2012, Liberty issued two R1 billion bonds. R10 million was paid to the company as advisory fees in respect of the bond issue.
In 2013, Liberty issued a further R1 billion bond. The company received R5 million in advisory fees in respect of the bond issue.
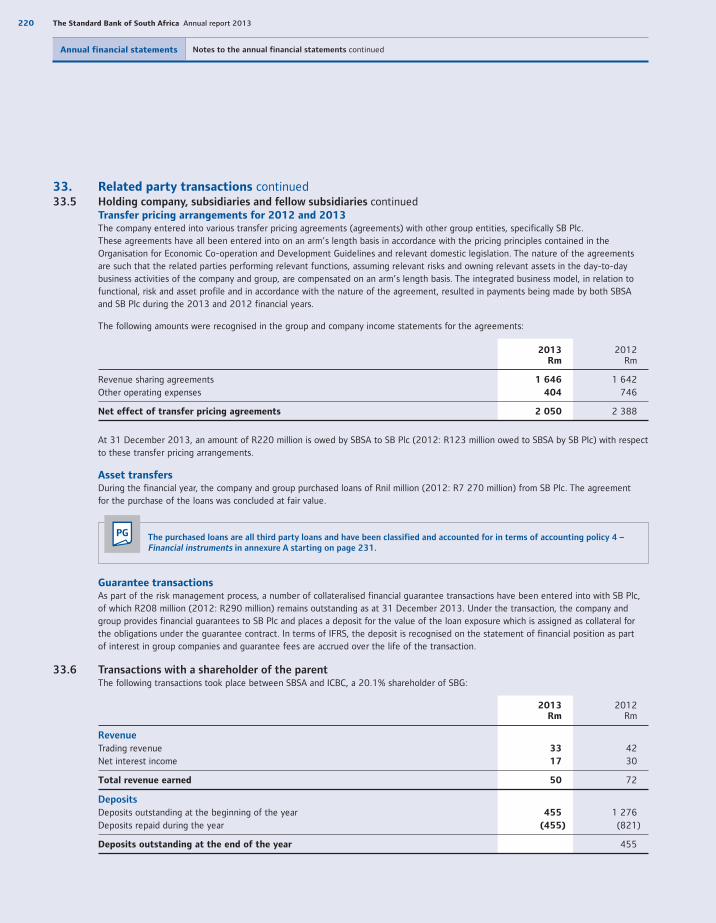
220 The Standard Bank of South Africa Annual report 2013
Annual financial statements Notes to the annual financial statements continued
33. Related party transactions continued33.5 Holding company, subsidiaries and fellow subsidiaries continued Transfer pricing arrangements for 2012 and 2013 The company entered into various transfer pricing agreements (agreements) with other group entities, specifically SB Plc.
These agreements have all been entered into on an arm’s length basis in accordance with the pricing principles contained in the Organisation for Economic Co-operation and Development Guidelines and relevant domestic legislation. The nature of the agreements are such that the related parties performing relevant functions, assuming relevant risks and owning relevant assets in the day-to-day business activities of the company and group, are compensated on an arm’s length basis. The integrated business model, in relation to functional, risk and asset profile and in accordance with the nature of the agreement, resulted in payments being made by both SBSA and SB Plc during the 2013 and 2012 financial years.
The following amounts were recognised in the group and company income statements for the agreements:
2013Rm
2012Rm
Revenue sharing agreements 1 646 1 642Other operating expenses 404 746
Net effect of transfer pricing agreements 2 050 2 388
At 31 December 2013, an amount of R220 million is owed by SBSA to SB Plc (2012: R123 million owed to SBSA by SB Plc) with respect to these transfer pricing arrangements.
Asset transfers During the financial year, the company and group purchased loans of Rnil million (2012: R7 270 million) from SB Plc. The agreement
for the purchase of the loans was concluded at fair value.
PG The purchased loans are all third party loans and have been classified and accounted for in terms of accounting policy 4 – Financial instruments in annexure A starting on page 231.
Guarantee transactions As part of the risk management process, a number of collateralised financial guarantee transactions have been entered into with SB Plc,
of which R208 million (2012: R290 million) remains outstanding as at 31 December 2013. Under the transaction, the company and group provides financial guarantees to SB Plc and places a deposit for the value of the loan exposure which is assigned as collateral for the obligations under the guarantee contract. In terms of IFRS, the deposit is recognised on the statement of financial position as part of interest in group companies and guarantee fees are accrued over the life of the transaction.
33.6 Transactions with a shareholder of the parent The following transactions took place between SBSA and ICBC, a 20.1% shareholder of SBG:
2013Rm
2012Rm
Revenue
Trading revenue 33 42Net interest income 17 30
Total revenue earned 50 72
Deposits
Deposits outstanding at the beginning of the year 455 1 276Deposits repaid during the year (455) (821)
Deposits outstanding at the end of the year 455
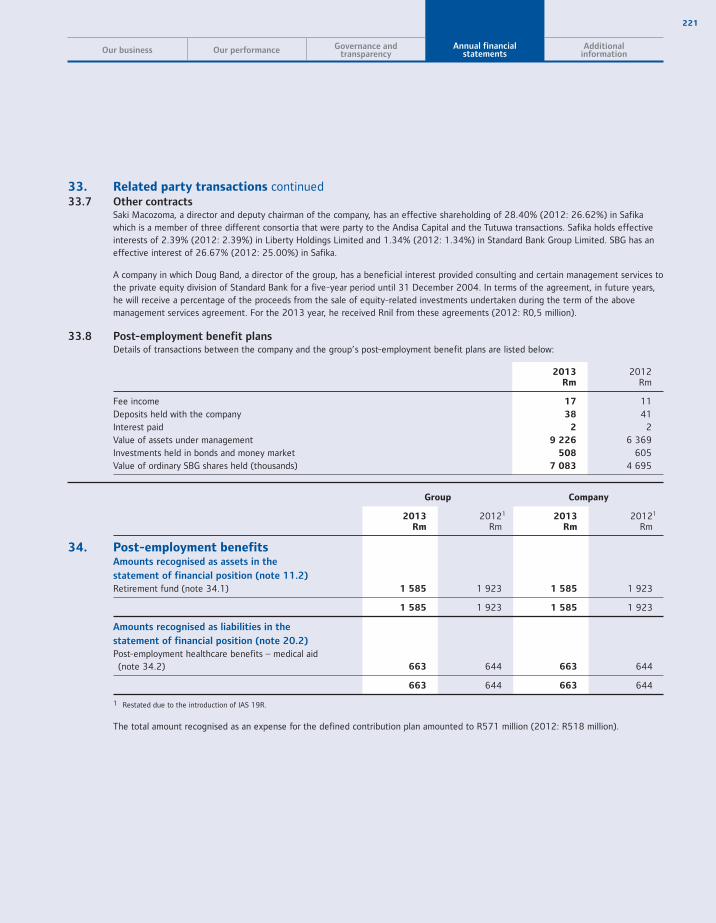
221
Our business Our performance Governance andtransparency
Annual financialstatements
Additionalinformation
33. Related party transactions continued33.7 Other contracts Saki Macozoma, a director and deputy chairman of the company, has an effective shareholding of 28.40% (2012: 26.62%) in Safika
which is a member of three different consortia that were party to the Andisa Capital and the Tutuwa transactions. Safika holds effective interests of 2.39% (2012: 2.39%) in Liberty Holdings Limited and 1.34% (2012: 1.34%) in Standard Bank Group Limited. SBG has an effective interest of 26.67% (2012: 25.00%) in Safika.
A company in which Doug Band, a director of the group, has a beneficial interest provided consulting and certain management services to the private equity division of Standard Bank for a five-year period until 31 December 2004. In terms of the agreement, in future years, he will receive a percentage of the proceeds from the sale of equity-related investments undertaken during the term of the above management services agreement. For the 2013 year, he received Rnil from these agreements (2012: R0,5 million).
33.8 Post-employment benefit plans Details of transactions between the company and the group’s post-employment benefit plans are listed below:
2013Rm
2012Rm
Fee income 17 11Deposits held with the company 38 41Interest paid 2 2Value of assets under management 9 226 6 369Investments held in bonds and money market 508 605Value of ordinary SBG shares held (thousands) 7 083 4 695
Group Company
2013Rm
20121
Rm2013
Rm20121
Rm
34. Post-employment benefitsAmounts recognised as assets in the
statement of financial position (note 11.2)
Retirement fund (note 34.1) 1 585 1 923 1 585 1 923
1 585 1 923 1 585 1 923
Amounts recognised as liabilities in the
statement of financial position (note 20.2)
Post-employment healthcare benefits – medical aid (note 34.2) 663 644 663 644
663 644 663 644
1 Restated due to the introduction of IAS 19R.
The total amount recognised as an expense for the defined contribution plan amounted to R571 million (2012: R518 million).

222 The Standard Bank of South Africa Annual report 2013
Annual financial statements Notes to the annual financial statements continued
34. Post-employment benefits continued34.1 Retirement fund Membership of the principal fund, SBGRF, exceeds 95% of SBSA’s permanent staff. The fund, one of the 10 largest in South Africa,
is a defined contribution fund governed by the Pension Funds Act 24 of 1956. Member-elected trustees represent 50% of the trustee board. The assets of the fund are held independently.
The fund is subject to statutory financial review by actuaries at an interval of not more than three years. The latest full actuarial valuation was performed on 31 December 2012 and, in the opinion of the actuary, the fund is considered to be financially sound. The next actuarial valuation is to be performed on 31 December 2014.
SBGRF is regulated by the Pension Funds Act as well as the FSB.
From 1 January 1995, new employees became entitled to defined contribution benefits only. Employees who were members of the fund on 31 December 1994, were entitled to guaranteed benefits under the old rules of the defined benefit fund. Given the defined benefit nature of the guaranteed benefits, the entire plan is classified as a defined benefit plan and accounted for as such. A specific liability was recognised within the fund to provide for the guaranteed defined benefits.
On 1 November 2009, the fund introduced individual member investment choice for defined contribution members and the pre-1995 members could choose to give up their guaranteed defined benefits and instead accept an offer of a 10% enhancement to their actuarial reserve values. Over 90% of the pre-1995 defined benefit members accepted the offer and converted to defined contribution plans. The assets and liabilities of the Provider Fund were transferred by way of a section 14 transfer in terms of the Pension Funds Act, as amended, into SBGRF and are no longer disclosed separately.
Description of risks Post-retirement obligation risk is the risk to the group’s comprehensive income that arises from the requirement to contribute as an
employer to an under-funded defined benefit plan. The group operates both defined contribution plans and defined benefit plans, with the majority of its employees participating in defined contribution plans. The defined benefit pension and healthcare schemes for past and certain current employees, create post-retirement obligations. The group mitigates these risks through independent asset managers and independent asset and liability management advisors for material funds. Potential residual risks which may impact the group are managed within the group asset and liability management process.
Group Company
2013Rm
2012Rm
2013Rm
2012Rm
The determination of the amounts recognised
in the statement of financial position in respect
of the retirement fund are as follows:
Present value of funded obligations 27 009 23 762 27 009 23 762Fair value of plan assets (28 594) (25 685) (28 594) (25 685)
Surplus (1 585) (1 923) (1 585) (1 923)
Included in other assets in the statement
of financial position (1 585) (1 923) (1 585) (1 923)

223
Our business Our performance Governance andtransparency
Annual financialstatements
Additionalinformation
34. Post-employment benefits continued34.1 Retirement fund continued
Group Company
2013Rm
2012Rm
2013Rm
2012Rm
Movement in the present value of funded obligations
Balance at the beginning of the year 23 762 20 791 23 762 20 791Current service cost 751 619 751 619Interest cost 1 926 1 907 1 926 1 907Contributions paid by employees 565 510 565 510Actuarial losses 2 031 1 042 2 031 1 042Benefits paid (2 026) (1 968) (2 026) (1 968)Transfer of provider fund liability1 861 861
Balance at the end of the year 27 009 23 762 27 009 23 762
Movement in the fair value of plan assets
Balance at the beginning of the year 25 685 21 889 25 685 21 889Expected return on plan assets 2 070 1 984 2 070 1 984Contributions received 1 136 1 028 1 136 1 028Actuarial gains 1 729 1 488 1 729 1 488Benefits paid (2 026) (1 968) (2 026) (1 968)Transfer of provider fund assets1 1 264 1 264
Balance at the end of the year 28 594 25 685 28 594 25 685
1 The assets and liabilities of the Provider Fund were transferred in 2012by way of a section 14 transfer in terms of the Pension Funds Act,as amended, into SBGRF.
Plan assets consist of the following:
Cash 772 1 027 772 1 027Equities 12 753 12 329 12 753 12 329Bonds 8 492 7 962 8 492 7 962Property and other 6 577 4 367 6 577 4 367
28 594 25 685 28 594 25 685
The group expects to pay R594 million in contributionsto SBGRF in 2014 (2013: R571 million).
The amounts recognised in profit or loss are
determined as follows:
Current service cost 751 619 751 619Net interest cost (144) (77) (144) (77)
Included in staff costs 607 542 607 542
The expected long-term rate of return is based on the expected long-term returns on equities, cash, bonds and properties(where applicable). The split between the individual asset categories is considered in setting these assumptions. Adjustments aremade to reflect the effect of expenses.
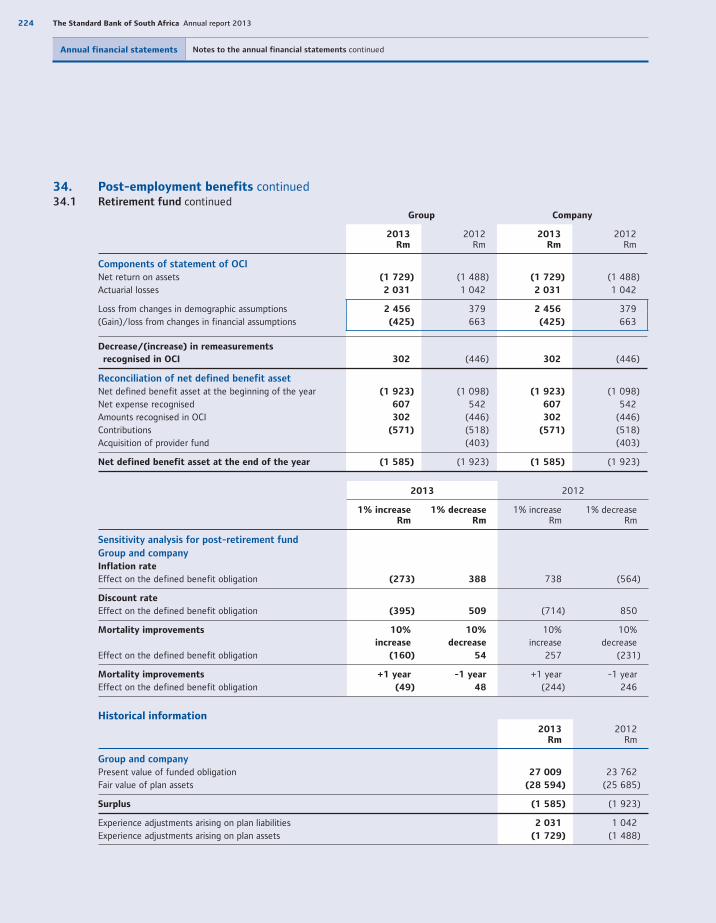
224 The Standard Bank of South Africa Annual report 2013
Annual financial statements Notes to the annual financial statements continued
34. Post-employment benefits continued34.1 Retirement fund continued
Group Company
2013Rm
2012Rm
2013Rm
2012Rm
Components of statement of OCI
Net return on assets (1 729) (1 488) (1 729) (1 488)Actuarial losses 2 031 1 042 2 031 1 042
Loss from changes in demographic assumptions 2 456 379 2 456 379(Gain)/loss from changes in financial assumptions (425) 663 (425) 663
Decrease/(increase) in remeasurements
recognised in OCI 302 (446) 302 (446)
Reconciliation of net defined benefit asset
Net defined benefit asset at the beginning of the year (1 923) (1 098) (1 923) (1 098)Net expense recognised 607 542 607 542Amounts recognised in OCI 302 (446) 302 (446)Contributions (571) (518) (571) (518)Acquisition of provider fund (403) (403)
Net defined benefit asset at the end of the year (1 585) (1 923) (1 585) (1 923)
2013 2012
1% increaseRm
1% decreaseRm
1% increaseRm
1% decreaseRm
Sensitivity analysis for post-retirement fund
Group and company
Inflation rate
Effect on the defined benefit obligation (273) 388 738 (564)
Discount rate
Effect on the defined benefit obligation (395) 509 (714) 850
Mortality improvements 10%
increase
10%
decrease
10%increase
10%decrease
Effect on the defined benefit obligation (160) 54 257 (231)
Mortality improvements +1 year -1 year +1 year -1 yearEffect on the defined benefit obligation (49) 48 (244) 246
Historical information2013
Rm2012
Rm
Group and company
Present value of funded obligation 27 009 23 762Fair value of plan assets (28 594) (25 685)
Surplus (1 585) (1 923)
Experience adjustments arising on plan liabilities 2 031 1 042Experience adjustments arising on plan assets (1 729) (1 488)
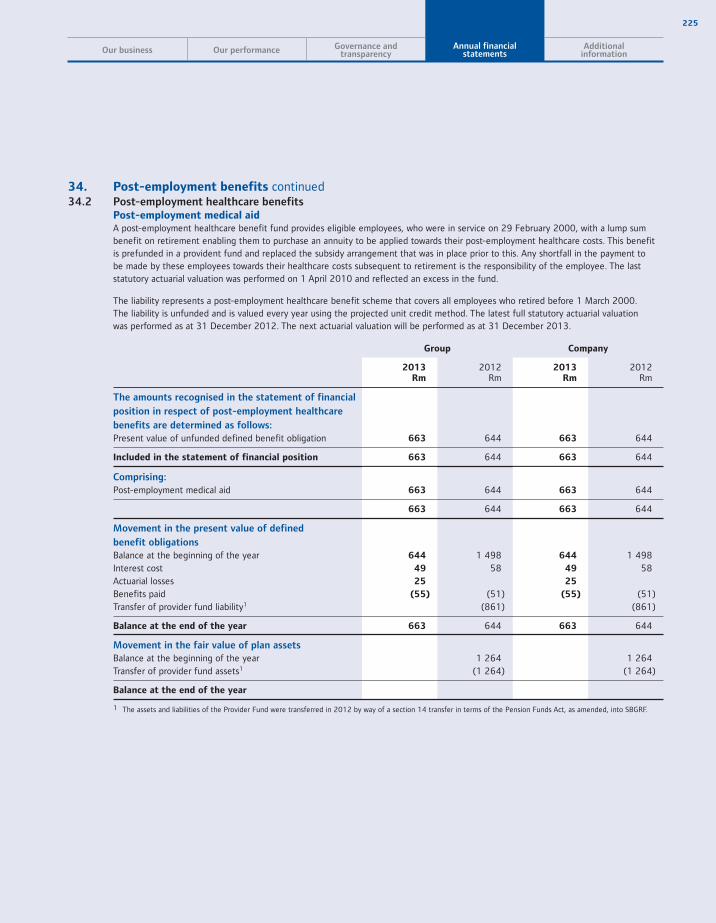
225
Our business Our performance Governance andtransparency
Annual financialstatements
Additionalinformation
34. Post-employment benefits continued 34.2 Post-employment healthcare benefits Post-employment medical aid A post-employment healthcare benefit fund provides eligible employees, who were in service on 29 February 2000, with a lump sum
benefit on retirement enabling them to purchase an annuity to be applied towards their post-employment healthcare costs. This benefit is prefunded in a provident fund and replaced the subsidy arrangement that was in place prior to this. Any shortfall in the payment to be made by these employees towards their healthcare costs subsequent to retirement is the responsibility of the employee. The last statutory actuarial valuation was performed on 1 April 2010 and reflected an excess in the fund.
The liability represents a post-employment healthcare benefit scheme that covers all employees who retired before 1 March 2000.The liability is unfunded and is valued every year using the projected unit credit method. The latest full statutory actuarial valuationwas performed as at 31 December 2012. The next actuarial valuation will be performed as at 31 December 2013.
Group Company
2013Rm
2012Rm
2013Rm
2012Rm
The amounts recognised in the statement of financial
position in respect of post-employment healthcare
benefits are determined as follows:
Present value of unfunded defined benefit obligation 663 644 663 644
Included in the statement of financial position 663 644 663 644
Comprising:
Post-employment medical aid 663 644 663 644
663 644 663 644
Movement in the present value of defined
benefit obligations
Balance at the beginning of the year 644 1 498 644 1 498Interest cost 49 58 49 58Actuarial losses 25 25
Benefits paid (55) (51) (55) (51)Transfer of provider fund liability1 (861) (861)
Balance at the end of the year 663 644 663 644
Movement in the fair value of plan assets
Balance at the beginning of the year 1 264 1 264Transfer of provider fund assets1 (1 264) (1 264)
Balance at the end of the year
1 The assets and liabilities of the Provider Fund were transferred in 2012 by way of a section 14 transfer in terms of the Pension Funds Act, as amended, into SBGRF.
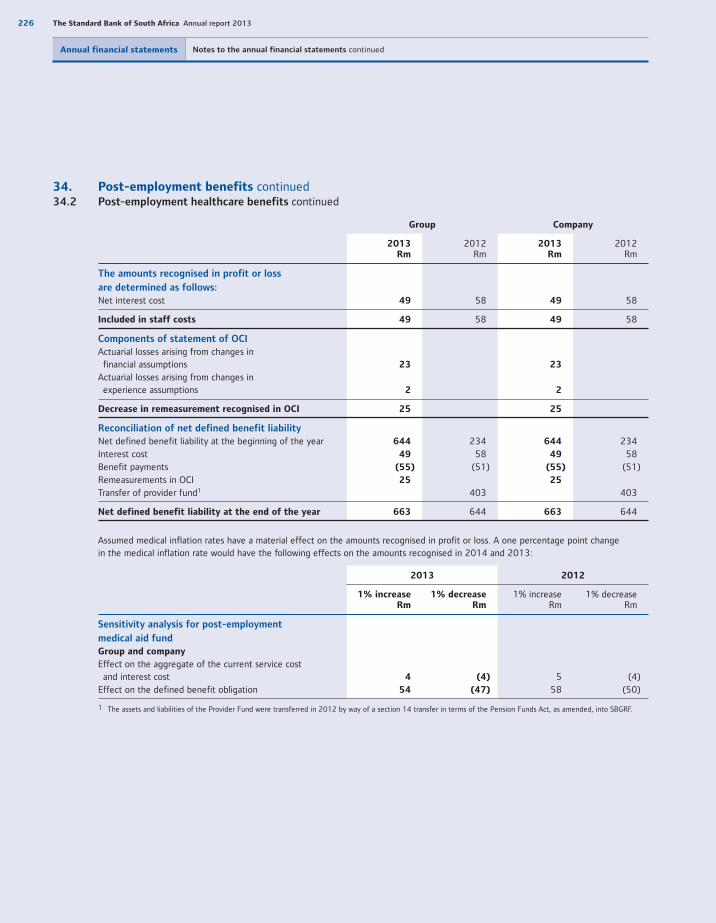
226 The Standard Bank of South Africa Annual report 2013
Annual financial statements Notes to the annual financial statements continued
34. Post-employment benefits continued34.2 Post-employment healthcare benefits continued
Group Company
2013Rm
2012Rm
2013Rm
2012Rm
The amounts recognised in profit or loss
are determined as follows:
Net interest cost 49 58 49 58
Included in staff costs 49 58 49 58
Components of statement of OCI
Actuarial losses arising from changes in financial assumptions 23 23
Actuarial losses arising from changes in experience assumptions 2 2
Decrease in remeasurement recognised in OCI 25 25
Reconciliation of net defined benefit liability
Net defined benefit liability at the beginning of the year 644 234 644 234Interest cost 49 58 49 58Benefit payments (55) (51) (55) (51)Remeasurements in OCI 25 25
Transfer of provider fund1 403 403
Net defined benefit liability at the end of the year 663 644 663 644
Assumed medical inflation rates have a material effect on the amounts recognised in profit or loss. A one percentage point change in the medical inflation rate would have the following effects on the amounts recognised in 2014 and 2013:
2013 2012
1% increaseRm
1% decreaseRm
1% increaseRm
1% decreaseRm
Sensitivity analysis for post-employment
medical aid fund
Group and company
Effect on the aggregate of the current service cost and interest cost 4 (4) 5 (4)Effect on the defined benefit obligation 54 (47) 58 (50)
1 The assets and liabilities of the Provider Fund were transferred in 2012 by way of a section 14 transfer in terms of the Pension Funds Act, as amended, into SBGRF.
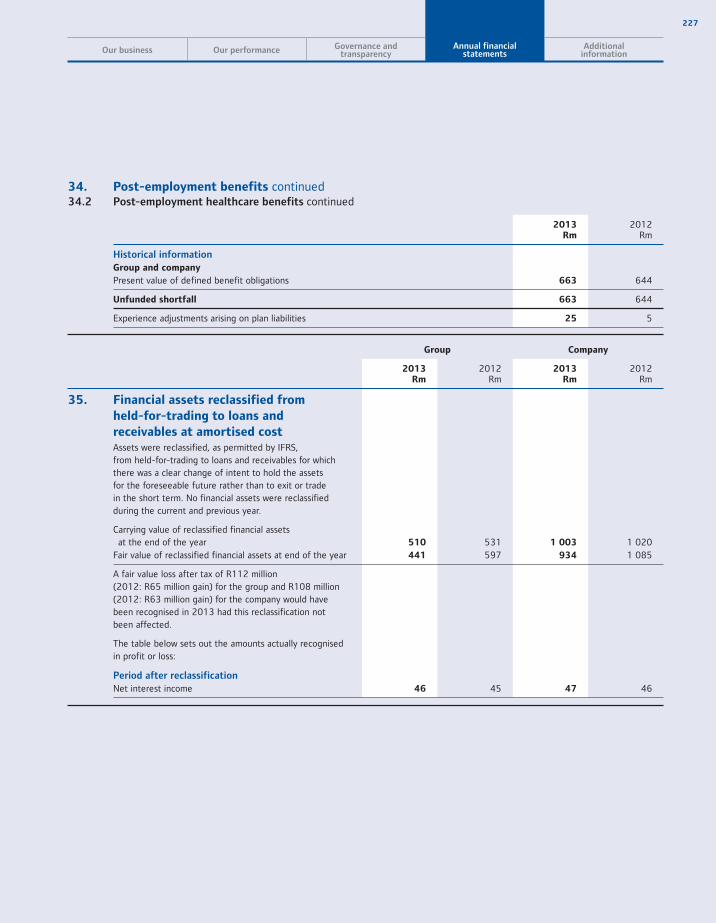
227
Our business Our performance Governance andtransparency
Annual financialstatements
Additionalinformation
34. Post-employment benefits continued 34.2 Post-employment healthcare benefits continued
2013Rm
2012Rm
Historical information
Group and company
Present value of defined benefit obligations 663 644
Unfunded shortfall 663 644
Experience adjustments arising on plan liabilities 25 5
Group Company
2013Rm
2012Rm
2013Rm
2012Rm
35. Financial assets reclassified from
held-for-trading to loans and
receivables at amortised costAssets were reclassified, as permitted by IFRS,from held-for-trading to loans and receivables for which there was a clear change of intent to hold the assets for the foreseeable future rather than to exit or trade in the short term. No financial assets were reclassified during the current and previous year.
Carrying value of reclassified financial assets at the end of the year 510 531 1 003 1 020Fair value of reclassified financial assets at end of the year 441 597 934 1 085
A fair value loss after tax of R112 million(2012: R65 million gain) for the group and R108 million (2012: R63 million gain) for the company would havebeen recognised in 2013 had this reclassification notbeen affected.
The table below sets out the amounts actually recognisedin profit or loss:
Period after reclassification
Net interest income 46 45 47 46
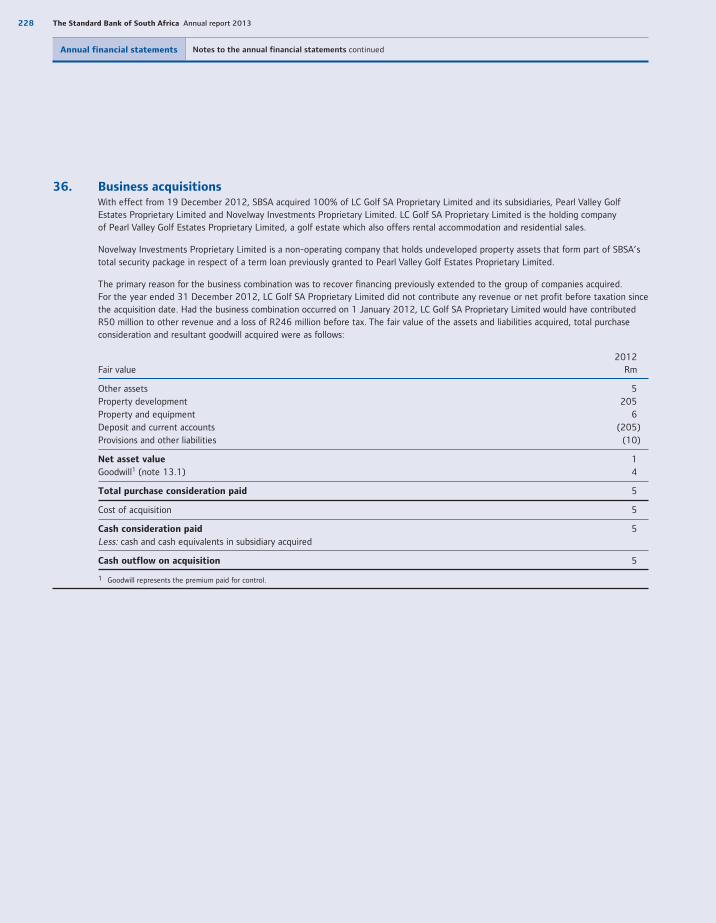
228 The Standard Bank of South Africa Annual report 2013
Annual financial statements Notes to the annual financial statements continued
36. Business acquisitions With effect from 19 December 2012, SBSA acquired 100% of LC Golf SA Proprietary Limited and its subsidiaries, Pearl Valley Golf
Estates Proprietary Limited and Novelway Investments Proprietary Limited. LC Golf SA Proprietary Limited is the holding company of Pearl Valley Golf Estates Proprietary Limited, a golf estate which also offers rental accommodation and residential sales.
Novelway Investments Proprietary Limited is a non-operating company that holds undeveloped property assets that form part of SBSA’s total security package in respect of a term loan previously granted to Pearl Valley Golf Estates Proprietary Limited.
The primary reason for the business combination was to recover financing previously extended to the group of companies acquired.For the year ended 31 December 2012, LC Golf SA Proprietary Limited did not contribute any revenue or net profit before taxation since the acquisition date. Had the business combination occurred on 1 January 2012, LC Golf SA Proprietary Limited would have contributed R50 million to other revenue and a loss of R246 million before tax. The fair value of the assets and liabilities acquired, total purchase consideration and resultant goodwill acquired were as follows:
Fair value2012
Rm
Other assets 5Property development 205Property and equipment 6Deposit and current accounts (205)Provisions and other liabilities (10)
Net asset value 1Goodwill1 (note 13.1) 4
Total purchase consideration paid 5
Cost of acquisition 5
Cash consideration paid 5Less: cash and cash equivalents in subsidiary acquired
Cash outflow on acquisition 5
1 Goodwill represents the premium paid for control.
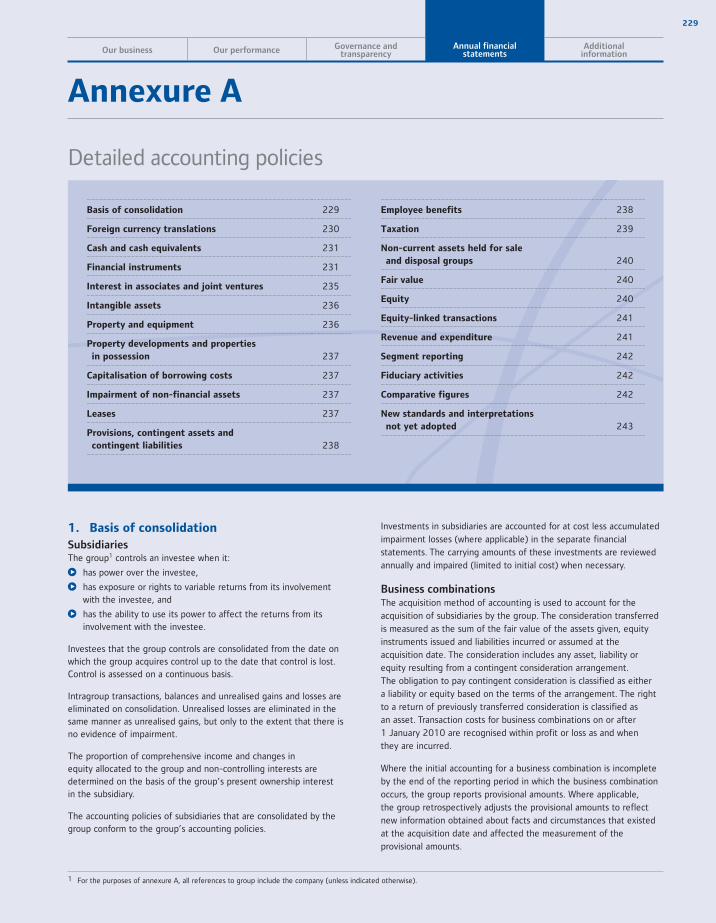
229
Our business Our performance Governance andtransparency
Annual financialstatements
Additionalinformation
1. Basis of consolidation
SubsidiariesThe group1 controls an investee when it:
has power over the investee,
has exposure or rights to variable returns from its involvement with the investee, and
has the ability to use its power to affect the returns from its involvement with the investee.
Investees that the group controls are consolidated from the date on which the group acquires control up to the date that control is lost. Control is assessed on a continuous basis.
Intragroup transactions, balances and unrealised gains and losses are eliminated on consolidation. Unrealised losses are eliminated in the same manner as unrealised gains, but only to the extent that there is no evidence of impairment.
The proportion of comprehensive income and changes in equity allocated to the group and non-controlling interests are determined on the basis of the group’s present ownership interest in the subsidiary.
The accounting policies of subsidiaries that are consolidated by the group conform to the group’s accounting policies.
Investments in subsidiaries are accounted for at cost less accumulated impairment losses (where applicable) in the separate financial statements. The carrying amounts of these investments are reviewed annually and impaired (limited to initial cost) when necessary.
Business combinationsThe acquisition method of accounting is used to account for the acquisition of subsidiaries by the group. The consideration transferred is measured as the sum of the fair value of the assets given, equity instruments issued and liabilities incurred or assumed at the acquisition date. The consideration includes any asset, liability or equity resulting from a contingent consideration arrangement. The obligation to pay contingent consideration is classified as either a liability or equity based on the terms of the arrangement. The right to a return of previously transferred consideration is classified as an asset. Transaction costs for business combinations on or after 1 January 2010 are recognised within profit or loss as and when they are incurred.
Where the initial accounting for a business combination is incomplete by the end of the reporting period in which the business combination occurs, the group reports provisional amounts. Where applicable, the group retrospectively adjusts the provisional amounts to reflect new information obtained about facts and circumstances that existed at the acquisition date and affected the measurement of the provisional amounts.
Basis of consolidation 229
Foreign currency translations 230
Cash and cash equivalents 231
Financial instruments 231
Interest in associates and joint ventures 235
Intangible assets 236
Property and equipment 236
Property developments and properties
in possession 237
Capitalisation of borrowing costs 237
Impairment of non-financial assets 237
Leases 237
Provisions, contingent assets and
contingent liabilities 238
Employee benefits 238
Taxation 239
Non-current assets held for sale
and disposal groups 240
Fair value 240
Equity 240
Equity-linked transactions 241
Revenue and expenditure 241
Segment reporting 242
Fiduciary activities 242
Comparative figures 242
New standards and interpretations
not yet adopted 243
Annexure A
Detailed accounting policies
1 For the purposes of annexure A, all references to group include the company (unless indicated otherwise).
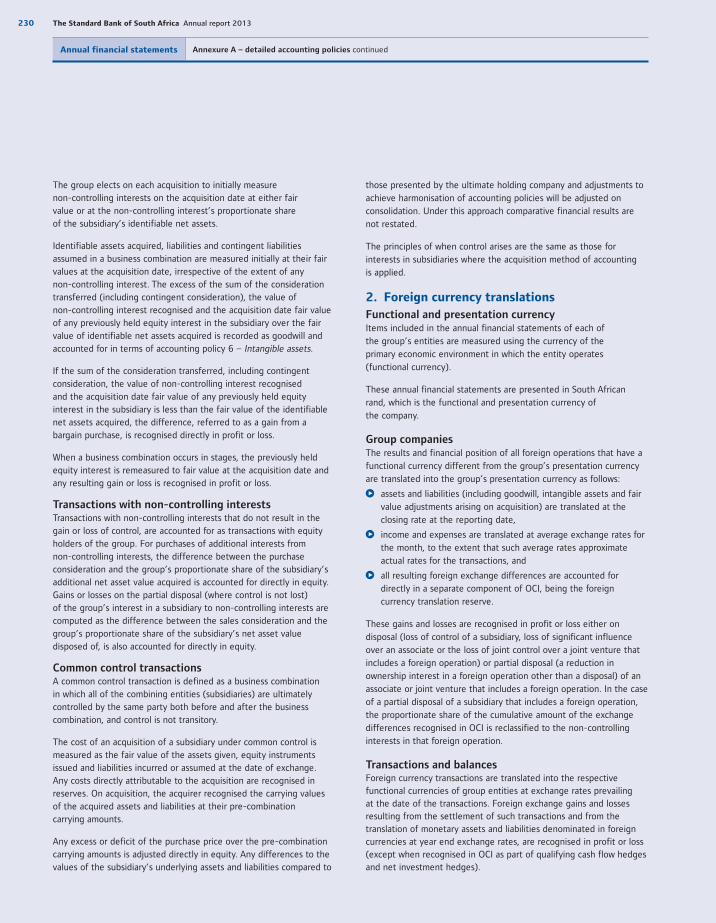
230 The Standard Bank of South Africa Annual report 2013
Annual financial statements Annexure A – detailed accounting policies continued
The group elects on each acquisition to initially measurenon-controlling interests on the acquisition date at either fairvalue or at the non-controlling interest’s proportionate shareof the subsidiary’s identifiable net assets.
Identifiable assets acquired, liabilities and contingent liabilities assumed in a business combination are measured initially at their fair values at the acquisition date, irrespective of the extent of any non-controlling interest. The excess of the sum of the consideration transferred (including contingent consideration), the value of non-controlling interest recognised and the acquisition date fair value of any previously held equity interest in the subsidiary over the fair value of identifiable net assets acquired is recorded as goodwill and accounted for in terms of accounting policy 6 – Intangible assets.
If the sum of the consideration transferred, including contingent consideration, the value of non-controlling interest recognised and the acquisition date fair value of any previously held equity interest in the subsidiary is less than the fair value of the identifiable net assets acquired, the difference, referred to as a gain from a bargain purchase, is recognised directly in profit or loss.
When a business combination occurs in stages, the previously held equity interest is remeasured to fair value at the acquisition date and any resulting gain or loss is recognised in profit or loss.
Transactions with non-controlling interests Transactions with non-controlling interests that do not result in the gain or loss of control, are accounted for as transactions with equity holders of the group. For purchases of additional interests from non-controlling interests, the difference between the purchase consideration and the group’s proportionate share of the subsidiary’s additional net asset value acquired is accounted for directly in equity. Gains or losses on the partial disposal (where control is not lost)of the group’s interest in a subsidiary to non-controlling interests are computed as the difference between the sales consideration and the group’s proportionate share of the subsidiary’s net asset value disposed of, is also accounted for directly in equity.
Common control transactionsA common control transaction is defined as a business combinationin which all of the combining entities (subsidiaries) are ultimately controlled by the same party both before and after the business combination, and control is not transitory.
The cost of an acquisition of a subsidiary under common control is measured as the fair value of the assets given, equity instruments issued and liabilities incurred or assumed at the date of exchange.Any costs directly attributable to the acquisition are recognised in reserves. On acquisition, the acquirer recognised the carrying valuesof the acquired assets and liabilities at their pre-combinationcarrying amounts.
Any excess or deficit of the purchase price over the pre-combination carrying amounts is adjusted directly in equity. Any differences to the values of the subsidiary’s underlying assets and liabilities compared to
those presented by the ultimate holding company and adjustments to achieve harmonisation of accounting policies will be adjusted on consolidation. Under this approach comparative financial results are not restated.
The principles of when control arises are the same as those for interests in subsidiaries where the acquisition method of accountingis applied.
2. Foreign currency translations
Functional and presentation currencyItems included in the annual financial statements of each ofthe group’s entities are measured using the currency of theprimary economic environment in which the entity operates (functional currency).
These annual financial statements are presented in South Africanrand, which is the functional and presentation currency ofthe company.
Group companiesThe results and financial position of all foreign operations that have a functional currency different from the group’s presentation currency are translated into the group’s presentation currency as follows:
assets and liabilities (including goodwill, intangible assets and fair value adjustments arising on acquisition) are translated at the closing rate at the reporting date,
income and expenses are translated at average exchange rates for the month, to the extent that such average rates approximate actual rates for the transactions, and
all resulting foreign exchange differences are accounted for directly in a separate component of OCI, being the foreign currency translation reserve.
These gains and losses are recognised in profit or loss either on disposal (loss of control of a subsidiary, loss of significant influence over an associate or the loss of joint control over a joint venture that includes a foreign operation) or partial disposal (a reduction in ownership interest in a foreign operation other than a disposal) of an associate or joint venture that includes a foreign operation. In the case of a partial disposal of a subsidiary that includes a foreign operation, the proportionate share of the cumulative amount of the exchange differences recognised in OCI is reclassified to the non-controlling interests in that foreign operation.
Transactions and balancesForeign currency transactions are translated into the respective functional currencies of group entities at exchange rates prevailing at the date of the transactions. Foreign exchange gains and losses resulting from the settlement of such transactions and from the translation of monetary assets and liabilities denominated in foreign currencies at year end exchange rates, are recognised in profit or loss (except when recognised in OCI as part of qualifying cash flow hedges and net investment hedges).
231
Our business Our performance Governance andtransparency
Annual financialstatements
Additionalinformation
Non-monetary assets and liabilities denominated in foreign currencies that are measured at historical cost are translated using the exchange rate at the transaction date, and those measured at fair value are translated at the exchange rate at the date that the fair value was determined. Exchange rate differences on non-monetary items are accounted for based on the classification of the underlying items. Foreign exchange gains and losses on equities (debt) classified as available-for-sale financial assets are recognised in the available-for-sale reserve in OCI (profit or loss) whereas the exchange differences on equities and debt that are classified as held at fair value through profit or loss are reported as part of the fair value gain or loss in profit or loss.
Foreign currency gains and losses on intragroup loans are recognised in profit or loss except where the settlement of the loan is neither planned nor likely to occur in the foreseeable future. In these cases the foreign currency gains and losses are recognised in the group’s foreign currency translation reserve. These gains and losses are accounted for similarly to the exchange gains and losses as described in this accounting policy for group companies.
3. Cash and cash equivalentsCash and cash equivalents presented in the statement of cash flows consist of cash and balances with central banks.
Cash and balances with central banks comprise coins and bank notes, and balances with central banks.
4. Financial instruments
Initial recognition and measurementFinancial instruments include all financial assets and liabilities. These instruments are typically held for liquidity, investment, trading or hedging purposes. All financial instruments are initially recognised at fair value plus directly attributable transaction costs, except those carried at fair value through profit or loss where transaction costs are recognised immediately in profit or loss. Financial instruments are recognised (derecognised) on the date the group commits to purchase (sell) the instruments (trade date accounting).
Subsequent measurementSubsequent to initial measurement, financial instruments are measured either at fair value or amortised cost, depending on their classification as follows:
Held-to-maturityHeld-to-maturity investments are non-derivative financial assets with fixed or determinable payments and fixed maturities that management has both the positive intent and ability to hold to maturity. If the group were to sell more than an insignificant amount of held-to-maturity investments, the entire category would be tainted and reclassified as available-for-sale assets with the difference between amortised cost and fair value being accounted for in OCI.
Held-to-maturity investments are carried at amortised cost, using the effective interest rate method, less any impairment losses.
Held-for-trading assets and liabilitiesHeld-for-trading assets and liabilities include those financial assets and liabilities acquired or incurred principally for the purpose of selling or repurchasing in the near term, those forming part of a portfolio of identified financial instruments that are managed together and for which there is evidence of a recent actual pattern of short-term profit-taking, and commodities that are acquired principally by the group for the purpose of selling in the near future and generating a profit from fluctuations in price or broker-traders’ margin. Derivatives are always categorised as held-for-trading.
Subsequent to initial recognition, the financial instruments’ fair values are remeasured at each reporting date. All gains and losses, including interest and dividends arising from changes in fair value are recognised in profit or loss as trading revenue within non-interest revenue with the exception of derivatives that are designated, and effective as hedging instruments (refer to ’Derivative financial instruments and hedge accounting’ within this accounting policy for further details).
Financial assets and liabilities designated at fair value
through profit or lossThe group designates certain financial assets and liabilities, other than those classified as held-for-trading, as at fair value through profit or loss when:
This designation eliminates or significantly reduces an accounting mismatch that would otherwise arise. Under this criterion, the main classes of financial instruments designated by the group are loans and advances to banks and customers and financial investments. The designation significantly reduces measurement inconsistencies that would have otherwise arisen. For example, where the related derivatives were treated as held-for-trading and the underlying financial instruments were carried at amortised cost. This category also includes financial assets used to match investment contracts or insurance contract liabilities.
Groups of financial assets, financial liabilities or both are managed, and their performance evaluated, on a fair value basis in accordance with a documented risk management or investment strategy, and reported to the group’s key management personnel on a fair-value basis. Under this criterion, certain private equity, short-term insurance and other investment portfolios have been designated at fair value through profit or loss.
Financial instruments containing one or more embedded derivatives that significantly modify the instruments’ cash flows.
The fair value designation is made on initial recognition and is irrevocable. Subsequent to initial recognition, the fair values are remeasured at each reporting date. Gains and losses arising from changes in fair value are recognised in interest income (interest expense) for all debt financial assets (financial liabilities) and in other revenue within non-interest revenue for all equity instruments.
Private equity and property equity investments designated at fair value through profit or loss in terms of IAS 28 – Investments in Associates and Joint Ventures (IAS 28), are accounted for in the designated at fair value through profit or loss category.
232 The Standard Bank of South Africa Annual report 2013
Annual financial statements Annexure A – detailed accounting policies continued
Available-for-saleFinancial assets classified by the group as available-for-sale are generally strategic capital investments held for an indefinite period of time, which may be sold in response to needs for liquidity or changes in interest rates, exchange rates or equity prices, or non-derivative financial assets that are not classified within another category of financial assets.
Available-for-sale financial assets are subsequently measured at fair value. Unrealised gains or losses are recognised directly in the available-for-sale reserve until the financial asset is derecognised or impaired. When debt (equity) available-for-sale financial assets are disposed of, the cumulative fair value adjustments in OCI are reclassified to interest income (other revenue).
Interest income, calculated using the effective interest rate method, is recognised in profit or loss. Dividends received on debt (equity) available-for-sale instruments are recognised in interest income (other revenue) within profit or loss when the group’s right to receive payment has been established.
Loans and receivablesLoans and receivables are non-derivative financial assets with fixed or determinable payments that are not quoted in an active market, other than those classified by the group as at fair value through profit or loss or available-for-sale.
Loans and receivables are measured at amortised cost using the effective interest rate method, less any impairment losses. Origination transaction costs and origination fees received that are integral to the effective rate are capitalised to the value of the loan and amortised through interest income as part of the effective interest rate. The majority of the group’s loans and advances are included in the loans and receivables category.
Financial liabilities at amortised costFinancial liabilities that are neither held for trading nor designated at fair value are measured at amortised cost.
Reclassification of financial assetsThe group may choose to reclassify non-derivative trading assets out of the held-for-trading category if the financial asset is no longer held for the purpose of selling it in the near term. Financial assets that would not otherwise have met the definition of loans and receivables are permitted to be reclassified out of the held-for-trading category only in rare circumstances. In addition, the group may choose to reclassify financial assets that would meet the definition of loans and receivables out of the held-for-trading or available-for-sale categories if the group, at the date of reclassification, has the intention and ability to hold these financial assets for the foreseeable future or until maturity.
Derivatives or any financial instrument designated at fair value through profit or loss shall not be reclassified out of their respective categories.
Reclassifications are made at fair value as of the reclassification date. Effective interest rates for financial assets reclassified to loans and receivables, held-to-maturity and available-for-sale categories are determined at the reclassification date. Subsequent increases in estimates of cash flows adjust the financial asset’s effective interest rates prospectively.
On reclassification of a trading asset, all embedded derivatives are reassessed and, if necessary, accounted for separately.
Impairment of financial assetsAssets carried at amortised costThe group assesses at each reporting date whether there is objective evidence that a loan, or group of loans, is impaired. A loan or group of loans is impaired if objective evidence indicates that a loss event has occurred after initial recognition which has a negative effect on the estimated future cash flows of the loan or group of loans that can be estimated reliably.
Criteria that are used by the group in determining whether there is objective evidence of impairment include:
known cash flow difficulties experienced by the borrower
a breach of contract, such as default or delinquency in interest and/or principal payments
breaches of loan covenants or conditions
it becoming probable that the borrower will enter bankruptcyor other financial reorganisation
where the group, for economic or legal reasons relating to the borrower’s financial difficulty, grants the borrower a concession that the group would not otherwise consider.
The group first assesses whether there is objective evidence of impairment individually for loans that are individually significant, and individually or collectively for loans that are not individually significant. Non-performing loans include those loans for which the group has identified objective evidence of default, such as a breach of a material loan covenant or condition as well as those loans for which instalments are due and unpaid for 90 days or more. The impairment of non-performing loans takes into account past loss experience adjusted for changes in economic conditions and the nature and level of risk exposure since the recording of the historic losses.
When a loan carried at amortised cost has been identified as specifically impaired, the carrying amount of the loan is reduced to an amount equal to the present value of its estimated future cash flows, including the recoverable amount of any collateral, discounted at the financial asset’s original effective interest rate. The carrying amount of the loan is reduced through the use of a specific credit impairment account and the loss is recognised as a credit impairment charge in profit or loss.
The calculation of the present value of the estimated future cash flows of collateralised financial assets recognised on an amortised cost basis, includes cash flows that may result from foreclosure less costs of obtaining and selling the collateral, whether or not foreclosure is probable.
233
Our business Our performance Governance andtransparency
Annual financialstatements
Additionalinformation
If the group determines that no objective evidence of impairment exists for an individually assessed loan, whether significant or not, it includes the loan in a group of financial loans with similar credit risk characteristics and collectively assesses for impairment. Loans that are individually assessed for impairment and for which an impairment loss is recognised are not included in a collective assessment for impairment.
Impairment of groups of loans that are assessed collectively is recognised where there is objective evidence that a loss event has occurred after the initial recognition of the group of loans but before the reporting date. In order to provide for latent losses in a group of loans that have not yet been identified as specifically impaired, a credit impairment for incurred but not reported losses is recognised based on historic loss patterns and estimated emergence periods (time period between the loss trigger events and the date on which the group identifies the losses). Groups of loans are also impaired when adverse economic conditions develop after initial recognition, which may impact future cash flows. The carrying amount of groups of loans is reduced through the use of a portfolio credit impairment account and the loss is recognised as a credit impairment charge in profit or loss.
Increases in loan impairments and any subsequent reversals thereof, or recoveries of amounts previously impaired (including loans that have been written off), are reflected within credit impairment charges in profit or loss. Previously impaired loans are written off once all reasonable attempts at collection have been made and there is no realistic prospect of recovering outstanding amounts. Any subsequent reductions in amounts previously impaired are reversed by adjusting the allowance account with the amount of the reversal recognised as a reduction in impairment for credit losses in profit or loss.
Subsequent to impairment, the effects of discounting unwind over time as interest income.
Renegotiated loansLoans that would otherwise be past due or impaired and whose terms have been renegotiated and exhibit the characteristics of a performing loan are reset to performing loan status. Loans whose terms have been renegotiated are subject to ongoing review to determine whether they are considered to be impaired or past due.
The effective interest rate of renegotiated loans that have not been derecognised (described under the heading ’Derecognition of financial instruments’), is redetermined based on the loan’s renegotiated terms.
Available-for-sale financial assetsAvailable-for-sale financial assets are impaired if there is objective evidence of impairment, resulting from one or more loss events that occurred after initial recognition but before the reporting date, that have a negative impact on the future cash flows of the asset. In addition, an available-for-sale equity instrument is considered to be impaired if a significant or prolonged decline in the fair value of the instrument below its cost has occurred. In that instance, the cumulative loss, measured as the difference between the acquisition
price and the current fair value, less any previously recognised impairment losses on that financial asset, is reclassified from OCI to profit or loss.
If, in a subsequent period, the amount relating to an impairmentloss decreases and the decrease can be linked objectively toan event occurring after the impairment loss was recognised inprofit or loss, the impairment loss is reversed through profit or lossfor available-for-sale debt instruments. Any reversal of an impairment loss in respect of an available-for-sale equity instrument isrecognised directly in OCI.
Offsetting financial instrumentsFinancial assets and liabilities are offset and the net amount reported in the statement of financial position when there is a legally enforceable right to set off the recognised amounts and thereis an intention to settle the asset and the liability on a net basis, or to realise the asset and settle the liability simultaneously.
Income and expenses are presented on a net basis only when permitted by the accounting standards, or for gains and losses arising from a group of similar transactions.
Derivative financial instruments and hedge accountingA derivative is a financial instrument whose fair value changes in response to an underlying variable, requires no initial net investment or an initial net investment that is smaller than would be required for other types of contracts that would be expected to have a similar response to changes in market factors and is settled at a future date. Derivatives are initially recognised at fair value on the date on which the derivatives are entered into and subsequently remeasured at fair value as described under accounting policy 16 – Fair value.
All derivative instruments are carried as financial assets when the fair value is positive and as financial liabilities when the fair value is negative, subject to offsetting principles as described under the heading ’Offsetting financial instruments’.
Embedded derivatives included in hybrid instruments are treated and disclosed as separate derivatives when their economic characteristics and risks are not closely related to those of the host contract, the terms of the embedded derivative are the same as those of a stand-alone derivative and the combined contract is not measured at fair value through profit or loss. The financial host contracts are accounted for and measured applying the rules of the relevant financial instrument category.
The method of recognising fair value gains and losses depends on whether the derivatives are designated as hedging instruments, and if so, the nature of the hedge relationship, or if they are classified
as held-for-trading.
234 The Standard Bank of South Africa Annual report 2013
Annual financial statements Annexure A – detailed accounting policies continued
Derivatives that qualify for hedge accounting When derivatives are designated in a hedge relationship, the group designates them as either:
hedges of the fair value of recognised financial assets or liabilities or firm commitments (fair value hedges), or
hedges of highly probable future cash flows attributable to a recognised asset or liability, a forecast transaction, or a highly probable forecast intragroup transaction in the consolidatedannual financial statements (cash flow hedges).
Hedge accounting is applied to derivatives designated in this way provided certain criteria are met. The group documents, at the inception of the hedge relationship, the relationship between hedged items and hedging instruments, as well as its risk management objective and strategy for undertaking various hedging relationships. The group also documents its assessment, both at the inception of the hedge and on an ongoing basis, of whether the hedging instruments are highly effective in offsetting changes in fair values or cash flows of hedged items.
Fair value hedgesWhere a hedging relationship is designated as a fair value hedge, the hedged item is adjusted for the change in fair value in respect of the risk being hedged. Gains or losses on the remeasurement of both the derivative and the hedged item are recognised in profit or loss. Fair value adjustments relating to the hedging instrument are allocated to the same line item in profit or loss as the related hedged item. Any hedge ineffectiveness is recognised in profit or loss as trading revenue.
If the derivative expires, is sold, terminated, exercised, no longer meets the criteria for fair value hedge accounting, or the designation is revoked, then hedge accounting is discontinued. The adjustment to the carrying amount of a hedged item measured at amortised cost, for which the effective interest rate method is used, is amortised to profit or loss as part of the hedged item’s recalculated effective interest rate over the period to maturity.
Cash flow hedgesThe effective portion of changes in the fair value of derivatives that are designated and qualify as cash flow hedges is recognised in the cash flow hedging reserve. The ineffective part of any changes in fair value is recognised immediately in profit or loss as trading revenue.
Amounts recognised in OCI are transferred to profit or loss in the periods in which the hedged forecast cash flows affect profit or loss. However, when the forecast transaction that is hedged results in the recognition of a non-financial asset or a non-financial liability, the cumulative gains or losses recognised previously in OCI are transferred and included in the initial measurement of the cost of the asset or liability.
If the derivative expires, is sold, terminated, exercised, no longer meets the criteria for cash flow hedge accounting, or the designation is revoked, then hedge accounting is discontinued. The cumulative gains or losses recognised in OCI remain in OCI until the forecast
transaction is recognised in the case of a non-financial asset or a non-financial liability, or until the forecast transaction affects profit or loss in the case of a financial asset or a financial liability. If the forecast transaction is no longer expected to occur, the cumulative gains and losses recognised in OCI are immediately reclassified to profit or loss and classified as trading revenue.
Derivatives that do not qualify for hedge accountingAll gains and losses from changes in the fair values of derivatives that do not qualify for hedge accounting are recognised immediately in profit or loss as trading revenue.
BorrowingsBorrowings are recognised initially at fair value, generally being their issued proceeds, net of directly attributable transaction costs incurred. Borrowings are subsequently measured at amortised cost and interest is recognised using the effective interest rate method.
Preference shares, which carry a mandatory coupon and/or redemption, or are redeemable on a specific date, at the occurrence of a contingent future event, or at the option of the shareholder are classified as financial liabilities or compound financial instruments (instruments with debt and equity components). All other preference shares are classified as equity instruments. Dividends on preference shares classified as financial liabilities are accounted for as interest on an amortised cost basis using the effective interest rate method. Dividends on preference shares classified as equity instruments are recognised within equity as a dividend payment when dividends are declared.
Financial guarantee contractsA financial guarantee contract is a contract that requires the group (issuer) to make specified payments to reimburse the holder for a loss it incurs because a specified debtor fails to make payment when due in accordance with the original or modified terms of a debt instrument.
Financial guarantee contracts are initially recognised at fair value, which is generally equal to the premium received, and then amortised over the life of the financial guarantee. Subsequent to initial recognition, the financial guarantee liability is measured at the higher of the present value of any expected payment, when a payment under the guarantee has become probable, and the unamortised premium.
Derecognition of financial instrumentsFinancial assets are derecognised when the contractual rights to receive cash flows from the financial assets have expired, or where the group has transferred its contractual rights to receive cash flows on the financial asset such that it has transferred substantially all the risks and rewards of ownership of the financial asset. Any interest in transferred financial assets that is created or retained by the group is recognised as a separate asset or liability.
The group enters into transactions whereby it transfers assets recognised in its statement of financial position, but retains either all or a portion of the risks or rewards of the transferred assets. If all or substantially all risks and rewards are retained, then the transferred

235
Our business Our performance Governance andtransparency
Annual financialstatements
Additionalinformation
assets are not derecognised. Transfers of assets with the retention of all or substantially all risks and rewards include securities lending and repurchase agreements.
When assets are sold to a third party with a concurrent total rate of return swap on the transferred assets, the transaction is accounted for as a secured financing transaction, similar to repurchase transactions. In transactions where the group neither retains nor transfers substantially all the risks and rewards of ownership of a financial asset, the asset is derecognised if control over the asset is lost. The rights and obligations retained in the transfer are recognised separately as assets and liabilities as appropriate.
In transfers where control over the asset is retained, the group continues to recognise the asset to the extent of its continuing involvement, determined by the extent to which it is exposed to changes in the value of the transferred asset.
Financial liabilities are derecognised when they are extinguished, that is, when the obligation is discharged, cancelled or expires.
Where an existing financial asset or liability is replaced by another with the same counterparty on substantially different terms, or the terms of an existing financial asset or liability are substantially modified, such an exchange or modification is treated as a derecognition of the original asset or liability and the recognition of a new asset or liability, with the difference in the respective carrying amounts being recognised in profit or loss.
In all other instances, the renegotiated asset or liability’s effective interest rate is redetermined taking into account the renegotiated terms.
Sale and repurchase agreements and lending of
securities (including commodities)Securities sold subject to linked repurchase agreements (repurchase agreements) are reclassified in the statement of financial position as pledged assets when the transferee has the right by contract or custom to sell or repledge the collateral. The liability to the counterparty is included under deposit and current accounts or trading liabilities, as appropriate.
Securities purchased under agreements to resell (reverse repurchase agreements), at either a fixed price or the purchase price plus a lender’s rate of return, are recorded as loans and included under loans and advances or trading assets, as appropriate.
For repurchase and reverse repurchase agreements measured at amortised cost, the difference between the purchase and sales price is treated as interest and amortised over the expected life using the effective interest rate method.
Securities lent to counterparties are retained in the annual financial statements. Securities borrowed are not recognised in the annual financial statements unless sold to third parties. In these cases, the obligation to return the securities borrowed is recorded at fair value as a trading liability.
Income and expenses arising from the securities borrowing and lending business are recognised over the period of the transactions.
CommoditiesCommodities that are acquired principally by the group for the purpose of selling in the near future or generating a profit from fluctuations in price or broker-traders’ margin are measured at fair value less cost to sell and are reported as trading assets. All changes in fair value less cost to sell are recognised in trading revenue in the period of the change.
Forward contracts to purchase or sell commodities, where net settlement occurs or where physical delivery occurs and the commodities are held to settle another derivative contract, are recognised as derivative financial instruments and measured at fair value. All changes in fair value are recognised in trading revenue in the period of the change.
5. Interest in associates and joint ventures
Associates and joint venturesThose entities in which the group has significant influence, but not control or joint control, over the financial and operating policies are classified as associates.
A joint venture is a joint arrangement whereby the parties that have joint control of the arrangement have rights to the net assets of the arrangement. Joint control is the contractually agreed sharing of control of an arrangement which only exists when decisions about the relevant activities of the joint arrangement require unanimous consent of the parties sharing control.
Interests in associates and joint ventures are accounted for using the equity method and are measured in the consolidated statement of financial position at an amount that reflects the group’s share of the net assets of the associate or joint venture (including goodwill).
Equity accounting involves recognising the investment initially at fair value, including goodwill, and subsequently adjusting the carrying value for the group’s share of the associates and joint ventures income and expenses and OCI. Equity accounting of losses in associates and joint ventures is restricted to the interests in these entities, including unsecured receivables or other commitments, unless the group has an obligation or has made payments on behalf of the associate or joint venture. Unrealised profits from ’upstream’ and ’downstream’ transactions are eliminated in determining the group’s share of equity accounted profits. Unrealised losses are eliminated in the same way as unrealised gains, but only to the extent that there is no evidence of impairment.
Equity accounting is applied from the date on which the entity becomes an associate or joint venture up to the date on which it ceases to be an associate or joint venture. The accounting policies of associates and joint ventures have been changed where necessary to ensure consistency with the policies of the group.
236 The Standard Bank of South Africa Annual report 2013
Annual financial statements Annexure A – detailed accounting policies continued
Private equity and property equity investments, which are associates, are either designated on initial recognition at fair value through profit or loss, or equity accounted.
Investments in associates and joint ventures are accounted for at cost less impairment losses in the company’s annual financial statements.
Joint operationsA joint operation is a joint arrangement whereby the joint operators who have joint control have rights to the assets and obligations for the liabilities relating to the arrangement. The joint operator recognises:
assets it controls, including the assets jointly controlled,
liabilities, including its share of liabilities incurred jointly,
revenue from the sale of its share of output and from the sale of the output by a joint operation, and
expenses, including the share of expenses incurred jointly.
6. Intangible assets
GoodwillGoodwill represents the excess of the consideration transferred and the acquisition date fair value of any previously held equity interest (including transaction costs for acquisitions prior to 1 January 2010) over the group’s interest in the net fair value of the identifiable assets, liabilities and contingent liabilities of the acquired subsidiary, associate or joint venture at the date of the acquisition. The group’s interest in acquired subsidiaries takes into account any non-controlling interest (refer to accounting policy 1 – Basis of consolidation).
Goodwill arising on the acquisition of subsidiaries is reported in the statement of financial position as part of ’Goodwill and other intangible assets’. Goodwill arising on the acquisition of associates or joint ventures are included in ’Interest in associates and joint ventures’ in the statement of financial position (refer to accounting policy 5– Interest in associates and joint ventures). Goodwill is allocated to cash-generating units (CGUs) (not larger than operating segmentsof the group as defined) and is tested annually for impairment. An impairment loss is recognised whenever the carrying amount of an asset or its CGU exceeds its recoverable amount. Impairment losses are allocated first to reduce the carrying amount of any goodwill allocated to a CGU and then to reduce the carrying amount of other assets in the CGU on a pro rata basis. The carrying amount of these other assets may, however, not be reduced below the higher of the CGU’s fair value less costs to sell and its value in use.
Computer softwareCosts associated with developing or maintaining computer software programmes and the acquisition of software licences are generally recognised as an expense as incurred. However, direct computer software development costs that are clearly associated with an identifiable and unique system, which will be controlled by the group and have a probable future economic benefit beyond one year, are recognised as intangible assets. Capitalisation is further limited to development costs where the group is able to demonstrate its intention and ability to complete and use the software, the technical feasibility of the development, the availability of resources to
complete the development, how the development will generate probable future economic benefits and the ability to reliably measure costs relating to the development. Direct costs include software development employee costs and an appropriate portion of relevant overheads.
Expenditure subsequently incurred on computer software is capitalised only when it increases the future economic benefits embodied in the specific asset to which it relates.
Direct computer software development costs recognised as intangible assets are amortised on the straight-line basis at rates appropriate to the expected useful lives of the assets (two to 10 years) from the date that the assets are available for use, and are carried at cost less accumulated amortisation and accumulated impairment losses. The carrying amount of capitalised computer software is reviewed annually and is written down when impaired.
Amortisation methods, useful lives and residual values are reviewed at each financial year end and adjusted, if necessary.
There have been no significant changes in the estimated useful lives from those applied in the previous financial year.
Other intangible assetsThe group recognises the costs incurred on internally generated intangible assets such as brands, customer lists, customer contracts and similar rights and assets, in profit or loss as incurred.
The group capitalises brands, customer lists, customer contracts, distribution forces and similar rights acquired in business combinations.
Capitalised intangible assets are measured at cost less accumulated amortisation and accumulated impairment losses. Amortisation is recognised in profit or loss on a straight-line basis over the estimated useful lives of intangible assets, not exceeding 20 years, from the date that they are available for use.
Amortisation methods, useful lives and residual values are reviewed at each financial year end and adjusted, if necessary. There have been no changes in the estimated useful lives from those applied in the previous financial year.
7. Property and equipmentEquipment and owner-occupied properties, furniture, vehicles and other tangible assets are measured at cost less accumulated depreciation and accumulated impairment losses. Cost includes expenditure that is directly attributable to the acquisition of the asset. Where significant parts of an item of property or equipment have different useful lives, they are accounted for as separate items (major components) of property and equipment.
Costs that are subsequently incurred are included in the asset’s related carrying amount or are recognised as a separate asset,as appropriate, only when it is probable that future economicbenefits will flow to the group and the cost of the item can be measured reliably. Expenditure, which does not meet these criteria,is recognised in profit or loss as incurred. Depreciation, impairment
237
Our business Our performance Governance andtransparency
Annual financialstatements
Additionalinformation
losses and gains and losses on disposal of assets are included inprofit or loss.
Owner-occupied properties are held for use in the supply of services or for administrative purposes.
Property and equipment are depreciated on the straight-line basis over the estimated useful lives of the assets to their residual values. Land is not depreciated. Leasehold buildings are depreciated over the period of the lease or over a lesser period, as is considered appropriate.
The assets’ residual values, useful lives and the depreciation method applied are reviewed, and adjusted if appropriate, at each financial year end.
The estimated useful lives of tangible assets are typically as follows:
Buildings 40 years
Computer equipment 3 to 5 years
Motor vehicles 4 to 5 years
Office equipment 5 to 10 years
Furniture and fittings 5 to 13 years
Capitalised leased assets over the shorter of the lease term or its useful life
There have been no significant changes to the estimated useful lives and depreciation methods from those applied in the previous financial year.
Items of property and equipment are derecognised on disposal or when no future economic benefits are expected from their use or disposal. The gain or loss on derecognition is recognised in profit or loss and is determined as the difference between the net disposal proceeds and the carrying amount of the item.
8. Property developments and properties
in possessionProperty developments are stated at the lower of cost or net realisable value. Cost is assigned by specific identification and includes the cost of acquisition and where applicable, development and borrowing costs during development. When development is completed borrowing costs and other charges are expensed as incurred.
Properties in possession are properties acquired by the group which were previously held as collateral for underlying lending arrangements that, subsequent to origination, have defaulted. The property is recognised at the time at which the risks and rewards of the properties are transferred to the group. The properties are initially recognised at cost and are subsequently measured at the lower of
cost and its net realisable value. Any subsequent write-down in the value of the acquired properties is recognised as an operating expense. Any subsequent increase in the net realisable value, to the extent that it does not exceed its original cost, is also recognised within operating expenses.
9. Capitalisation of borrowing costsBorrowing costs that relate to qualifying assets, that is, assetsthat necessarily take a substantial period of time to get ready fortheir intended use or sale and which are not measured at fair value, are capitalised. All other borrowing costs are recognised in profitor loss.
10. Impairment of non-financial assets
Intangible assets that have an indefinite useful life and goodwill are tested annually for impairment and additionally when an indicator of impairment exists. Intangible assets that are subject to amortisation and other non-financial assets are reviewed for impairment at each reporting date and tested for impairment whenever events or changes in circumstances indicate that the carrying amount may not be recoverable.
An impairment loss is recognised in profit or loss for the amount by which the asset’s carrying amount exceeds its recoverable amount. The recoverable amount is the higher of an asset’s fair value less costs to sell and value in use. Fair value less costs to sell is determined by ascertaining the current market value of an asset and deducting any costs related to the realisation of the asset. In assessing value in use, the estimated future cash flows are discounted to their present value using a pre-tax discount rate that reflects current market assessments of the time value of money and the risks specific to the asset. For the purposes of assessing impairment, assets that cannot be tested individually are grouped at the lowest levels for which there are separately identifiable cash inflows from continuing use (CGUs). Impairment losses recognised in respect of CGUs are allocated first to reduce the carrying amount of any goodwill allocated to the units, and then to reduce the carrying amounts of the other assets in the unit on a pro-rata basis.
An impairment loss in respect of goodwill is not reversed. In respect of other non-financial assets, impairment losses recognised in prior periods are assessed at each reporting date for any indications that the loss has decreased or no longer exists. An impairment loss is reversed if there has been a change in the estimates used to determine the recoverable amount. An impairment loss is reversed through profit or loss only to the extent that the asset’s carrying amount does not exceed the carrying amount that would have been determined, net of depreciation or amortisation, if no impairment loss had been recognised.
11. LeasesA lease is an agreement whereby the lessor conveys to the lessee in return for a payment or series of payments the right to use an asset for an agreed period of time. A lease of assets is either classified as a finance lease or operating lease.
238 The Standard Bank of South Africa Annual report 2013
Annual financial statements Annexure A – detailed accounting policies continued
Group as lesseeLeases, where the group assumes substantially all the risks and
rewards incidental to ownership, are classified as finance leases.
All other leases are classified as operating leases.
Finance leases are capitalised at the inception of the lease at the
lower of the fair value of the leased asset and the present value of
the minimum lease payments. Lease payments are calculated using
the interest rate implicit in the lease, or the group’s incremental
borrowing rate to identify the finance cost, which is recognised in
profit or loss over the lease period, and the capital repayment,
which reduces the liability to the lessor.
Payments made under operating leases, net of any incentives
received from the lessor, are recognised in profit or loss on a
straight-line basis over the term of the lease. Contingent rentals
are expensed as they are incurred. When an operating lease is
terminated before the lease period has expired, any payment required
to be made to the lessor by way of penalty is recognised as an
expense in the period in which termination takes place.
Group as lessorLeases, where the group transfers substantially all the risks and
rewards incidental to ownership, are classified as finance leases.
All other leases are classified as operating leases.
Lease and instalment sale contracts are primarily financing transactions
in banking activities, with rentals and instalments receivable, less
unearned finance charges, being included in loans and advances in
the statement of financial position.
Finance charges earned are computed using the effective interest
rate method, which reflects a constant periodic rate of return on
the investment in the finance lease. Initial direct costs and fees are
capitalised to the value of the lease receivable and accounted for
over the lease term as an adjustment to the effective rate of return.
The tax benefits arising from investment allowances on assets leased
to clients are accounted for in the direct taxation line.
12. Provisions, contingent assets and
contingent liabilitiesProvisions are recognised when the group has a present legal or
constructive obligation as a result of past events, it is probable that
an outflow of resources embodying economic benefits will be required
to settle the obligation and a reliable estimate of the amount of the
obligation can be made. Provisions are determined by discounting the
expected future cash flows using a pre-tax discount rate that reflects
current market assessments of the time value of money and the risks
specific to the liability.
A provision for restructuring is recognised when the group has
approved a detailed formal plan, and the restructuring either has
commenced or has been announced publicly. Future operating costs or
losses are not provided for.
A provision for onerous contracts is recognised when the expected benefits to be derived by the group from a contract are lower than the unavoidable cost of meeting its obligations under the contract. The provision is measured at the present value of the lower of the expected cost of terminating the contract and the expected net cost of continuing with the contract. Before a provision is established, the group recognises any impairment loss on the assets associated with that contract.
Contingent assets are not recognised in the annual financial statements but are disclosed when, as a result of past events, it is probable that economic benefits will flow to the group, but this will only be confirmed by the occurrence or non-occurrence of one or more uncertain future events which are not wholly within the group’s control.
Contingent liabilities include certain guarantees, other than financial guarantees, and letters of credit. Contingent liabilities are not recognised in the annual financial statements but are disclosed in the notes to the annual financial statements unless they are remote.
13. Employee benefits
Post-employment benefits Defined contribution plansThe group operates a number of defined contribution plans, based on a percentage of pensionable earnings funded by both employer companies and employees, the assets of which are generally held in separate trustee-administered funds.
Contributions to these plans are recognised as an expense inprofit or loss in the periods during which services are renderedby employees.
Defined benefit plansThe group also operates a number of defined benefit plans, with membership generally limited to employees who were in the employment of the various companies at specified dates. Employer companies contribute to the cost of benefits taking account of the recommendations of the actuaries. Statutory actuarial valuations are required every three years using the projected unit credit method. Interim valuations are also performed annually at the financial year end. Within the defined benefit plans, the group operates a number of funded and unfunded post-employment medical aid schemes, with membership limited to employees who were retired or in the employment of the various companies at specified dates and complying with specific criteria.
The assets or liabilities recognised in the statement of financial position in respect of defined benefit plans are measured at the present value of the estimated future cash outflows, using interest rates of government bonds with maturity dates that approximate the expected maturity of the obligations, less the fair value of plan assets. A defined benefit asset is only recognised to the extent that economic benefits are available to the group from reductions in future contributions or future refunds from the plan.
239
Our business Our performance Governance andtransparency
Annual financialstatements
Additionalinformation
Net interest income/(expense) is determined on the defined benefit asset/(liability) by applying the discount rate used to measure the defined benefit obligation at the beginning of the annual period to the net defined benefit asset/(liability). The net interest income/(expense) is recognised in profit or loss. Other expenses related to the defined benefit plans are also recognised in profit or loss.
Remeasurements of the net defined benefit obligation, including actuarial gains and losses, the return on plan assets (excluding interest calculated) and the effect of any asset ceiling are recognised within OCI.
When the benefits of a plan are changed or when a plan is curtailed, the resulting change in benefit that relates to past service or the gain or loss on curtailment is recognised immediately in profit or loss. The group recognises gains and losses on the settlement of a defined benefit plan when the settlement occurs.
Termination benefitsTermination benefits are recognised as an expense when the group is committed, without realistic possibility of withdrawal, to a formal detailed plan to terminate employment before the normal retirement date, or to provide termination benefits as a result of an offer made to encourage voluntary redundancy. Termination benefits for voluntary redundancies are recognised as an expense if the group has made an offer encouraging voluntary redundancy, it is probable that the offer will be accepted, and the number of acceptances can be estimated reliably.
Short-term benefitsShort-term benefits consist of salaries, accumulated leave payments, profit share, bonuses and any non-monetary benefits such as medical aid contributions.
Short-term employee benefit obligations are measured on an undiscounted basis and are expensed as the related service is provided.
A liability is recognised for the amount expected to be paid under short-term cash bonus plans or accumulated leave if the group has a present legal or constructive obligation to pay this amount as a result of past service provided by the employee and the obligation can be estimated reliably.
14. Taxation
Direct taxationDirect taxation includes all domestic and foreign taxes based on taxable profits and CGT. Current tax is determined for current period transactions and events and deferred tax is determined for future tax consequences. Current and deferred tax are recognised in profit or loss except to the extent that it relates to a business combination (relating to a measurement period adjustment where the carrying amount of the goodwill is greater than zero), or items recognised directly in equity or in OCI.
Current tax represents the expected tax payable on taxable income
for the year, using tax rates enacted or substantively enacted at the
reporting date, and any adjustments to tax payable in respect of
previous years.
Deferred tax is recognised in respect of temporary differences arising
between the tax bases of assets and liabilities and their carrying values
for financial reporting purposes. Deferred tax is measured at the tax
rates that are expected to be applied to the temporary differences
when they reverse, based on the laws that have been enacted or
substantively enacted at the reporting date. Deferred tax is not
recognised for the following temporary differences:
the initial recognition of goodwill,
the initial recognition of assets and liabilities in a transaction that
is not a business combination, which affects neither accounting
nor taxable profits or losses, and
investments in subsidiaries, associates and jointly controlled
arrangements where the group controls the timing of the reversal
of temporary differences and it is probable that these differences
will not reverse in the foreseeable future.
The amount of deferred tax provided is based on the expected
manner of realisation or settlement of the carrying amount of the
asset or liability and is not discounted.
Deferred tax assets are recognised to the extent that it is probable
that future taxable income will be available against which the unused
tax losses can be utilised. Deferred tax assets are reviewed at each
reporting date and are reduced to the extent that it is no longer
probable that the related tax benefit will be realised.
Current and deferred tax assets and liabilities are offset if there is a
legally enforceable right to offset current tax liabilities and assets, and
they relate to income taxes levied by the same tax authority on the
same taxable entity, or on different tax entities, but they intend to
settle current tax liabilities and assets on a net basis or their tax assets
and liabilities will be realised simultaneously.
Dividends taxTaxes on dividends declared by the group are recognised as part
of the dividends paid within equity as dividend tax represents a tax
on the shareholder and not the group.
Dividends tax withheld by the group on dividends paid to its
shareholders and payable at the reporting date to the South African
Revenue Service (where applicable) is included in trade and other
payables in the statement of financial position.
Indirect taxationIndirect taxes, including non-recoverable VAT, skills development
levies and other duties for banking activities, are recognised in profit
or loss and disclosed separately in the income statement.
240 The Standard Bank of South Africa Annual report 2013
Annual financial statements Annexure A – detailed accounting policies continued
15. Non-current assets held for sale
and disposal groupsNon-current assets, or disposal groups comprising assets and liabilities that are expected to be recovered primarily through sale rather than continuing use, are classified as held for sale.
Immediately before classification as held for sale, the assets (or components of a disposal group) are remeasured in accordance with the group’s accounting policies and tested for impairment(refer to accounting policy 10 – Impairment of non-financial assets). Thereafter, the assets are measured at the lower of their carrying amount and fair value less costs to sell. Impairment losses on initial classification as held for sale and subsequent gains and losses on remeasurement are recognised in profit or loss.
Assets (or components of a disposal group) are presented separately in the statement of financial position.
Property and equipment and intangible assets once classified as held for sale, are not depreciated or amortised.
Once an interest in an associate or joint venture is classified as held for sale, equity accounting is suspended.
16. Fair valueFair value is the price that would be received to sell an asset or paid to transfer a liability in an orderly transaction in the principal (or most advantageous) market between market participants at the measurement date under current market conditions.
When a price for an identical asset or liability is not observable, fair value is measured using another valuation technique that maximises the use of relevant observable inputs and minimises the use of unobservable inputs.
In estimating the fair value of an asset or a liability, the group takes into account the characteristics of the asset or liability that market participants would take into account when pricing the asset or liability at the measurement date.
For financial instruments, where the fair value of the financial instrument differs from the transaction price, the difference is commonly referred to as day one profit or loss. Day one profit or loss is recognised in profit or loss immediately where the fair value of the financial instrument is either evidenced by comparison with other observable current market transactions in the same instrument, or is determined using valuation models with only observable market data as inputs.
Day one profit or loss is deferred where the fair value of the financial instrument is not able to be evidenced by comparison with other observable current market transactions in the same instrument, or determined using valuation models that utilise non-observable market data as inputs.
The timing of the recognition of deferred day one profit or loss is determined individually depending on the nature of the instrument and availability of market observable inputs. It is either amortised over
the life of the transaction, deferred until the instrument’s fair value can be determined using market observable inputs, or realised through settlement.
Subsequent to initial recognition, fair value is measured basedon quoted market prices or dealer price quotations for theassets and liabilities that are traded in active markets and wherethose quoted prices represent fair value at the measurement date.If the market for an asset or liability is not active or the instrument is unlisted, the fair value is determined using other applicable valuation techniques. These include the use of recent arm’s length transactions, discounted cash flow analyses, pricing models and other valuation techniques commonly used by market participants.
Where discounted cash flow analyses are used, estimated future cash flows are based on management’s best estimates and a market related discount rate at the reporting date for an asset or liability with similar terms and conditions.
If an asset or a liability measured at fair value has both a bid and an ask price, the price within the bid-ask spread that is most representative of fair value is used to measure fair value.
The group has elected the portfolio exception to measure the fair value of certain groups of financial assets and financial liabilities.This exception permits the group of financial assets and financial liabilities to be measured at fair value on a net basis. This electionis applied where the group:
manages the group of financial assets and financial liabilities on the basis of the group’s net exposure to a particular market risk (or risks) or to the credit risk of a particular counterparty in accordance with the group’s documented risk management or investment strategy,
provides information on that basis about the group of financial assets and financial liabilities to the group’s key management personnel, and
is required to or has elected to measure those financial assetsand financial liabilities at fair value at the end of eachreporting period.
Where the fair value of investments in equity instruments or identical instruments do not have a quoted price in an active market, and derivatives that are linked to and must be settled by delivery of such equity instruments, are unable to be reliably determined, those instruments are measured at cost less impairment losses. Impairment losses on these financial assets are not reversed.
Fair value measurements are categorised into level 1, 2 or 3 based on the degree to which the inputs to the fair value measurements are observable and the significance of the inputs to the fair value measurement.
17. Equity
Share issue costsIncremental external costs directly attributable to a transaction that increases or decreases equity are deducted from equity, net of related tax. All other share issue costs are expensed.
241
Our business Our performance Governance andtransparency
Annual financialstatements
Additionalinformation
Distributions on ordinary sharesDistributions are recognised in equity in the period in which they are declared. Distributions declared after the reporting date are disclosed in the distributions note.
18. Equity-linked transactions
Equity compensation plansThe group operates both equity-settled and cash-settled share-based compensation plans.
The fair value of equity-settled share options is determined on the grant date and accounted for as staff costs over the vesting period of the share options, with a corresponding increase in the share-based payment reserve. Non-market vesting conditions, such as the resignation of employees and retrenchment of staff, are not considered in the valuation but are included in the estimate of the number of options expected to vest. At each reporting date, the estimate of the number of options expected to vest is reassessed and adjusted against profit or loss and equity over the remaining vesting period.
On vesting of share options, amounts previously credited to the share-based payment reserve are transferred to retained earnings through an equity transfer. On exercise of equity-settled share options, proceeds received are credited to share capital and premium.
Share-based payments settled in cash are accounted for as liabilities at fair value until settled. The liability is recognised over the vesting period and is revalued at every reporting date and on settlement. Any changes in the liability are recognised in profit or loss.
19. Revenue and expenditureRevenue is derived substantially from the business of banking and related activities and comprises interest income, fee and commission revenue, trading revenue and other non-interest revenue.
Net interest incomeInterest income and expense (with the exception of those borrowing costs that are capitalised, refer to accounting policy 9 – Capitalisation of borrowing costs) are recognised in profit or loss on an accrual basis using the effective interest rate method for all interest-bearing financial instruments, except for those classified at fair value through profit or loss. In terms of the effective interest rate method, interest is recognised at a rate that exactly discounts estimated future cash payments or receipts through the expected life of the financial instrument or, where appropriate, a shorter period, to the net carrying amount of the financial asset or financial liability. Direct incremental transaction costs incurred and origination fees received, including loan commitment fees, as a result of bringing margin-yielding assets or liabilities into the statement of financial position, are capitalised to the carrying amount of financial instruments that are not at fair value through profit or loss and amortised as interest income or expense over the life of the asset or liability as part of the effective interest rate.
Where the estimates of payments or receipts on financial assets (except those that have been reclassified, refer to accounting policy 4
– Financial instruments) or financial liabilities are subsequently revised, the carrying amount of the financial asset or financial liability is adjusted to reflect actual and revised estimated cash flows. The carrying amount is calculated by computing the present value of the estimated cash flows at the financial asset or financial liability’s original effective interest rate. Any adjustment to the carrying value is recognised in net interest income.
Where financial assets have been impaired, interest income continues to be recognised on the impaired value based on the original effective interest rate.
Fair value gains and losses on realised debt financial instruments, including amounts reclassified from OCI in respect of available-for-sale debt financial assets, and excluding those classified as held-for-trading, are included in net interest income.
Dividends received on preference share investments classified as debt form part of the group’s lending activities and are included in interest income.
Non-interest revenueNet fee and commission revenueFee and commission revenue, including transactional fees, account servicing fees, investment management fees, sales commissions and placement fees are recognised as the related services are performed. Loan commitment fees for loans that are not expected to be drawn down are recognised on a straight-line basis over the commitment period. Loan syndication fees, where the group does not participate in the syndication or participates at the same effective interest rate for comparable risk as other participants, are recognised as revenue when the syndication has been completed. Syndication fees that do not meet these criteria are capitalised as origination fees and amortised as interest income.
The fair value of issued financial guarantee contracts on initial recognition is amortised as income over the term of the contract.
Fee and commission expense included in net fee and commission revenue are mainly transaction and service fees relating to financial instruments, which are expensed as the services are received. Expenditure is recognised as fee and commission expenses where the expenditure is linked to the production of fee and commission revenue.
Trading revenueTrading revenue comprises all gains and losses from changes in the fair value of trading assets and liabilities, together with related interest income, expense and dividends.
Other revenueOther revenue includes gains and losses on equity instruments designated at fair value through profit or loss, dividends relating to those financial instruments, underwriting profit from the group’s short-term insurance operations and related insurance activities and remeasurement gains and losses from contingent consideration on disposals and purchases.
242 The Standard Bank of South Africa Annual report 2013
Annual financial statements Annexure A – detailed accounting policies continued
Gains and losses on equity available-for-sale financial assets are reclassified from OCI to profit or loss on derecognition or impairment of the investments. Dividends on these instruments are recognised in profit or loss.
Dividend incomeDividends are recognised in profit or loss when the right to receipt is established. Scrip dividends are recognised as dividends received where the dividend declaration allows for a cash alternative.
Short-term insurance incomeShort-term insurance income includes premium income, commission and policy fees earned as well as net incurred claim losses and broker commission paid. Annual business income is accounted for on the accrual basis and comprises the cash value of commission and fees earned when premiums or fees are payable directly to the group. Direct commission income is accounted for as and when cash is received and comprises the cash value of commission earned when premiums are payable directly to the underwriters.
Revenue sharing agreements with group companiesRevenue sharing agreements with group companies include the allocation of revenue from transfer pricing agreements between the group’s legal entities. The service payer makes payment to service sellers for services rendered. All agreements of a revenue sharing nature are presented in the income statement as follows:
The service payer of the agreement recognises, to the extent the charge is less than revenue from the agreement, the charge to the service sellers within the income statement line item revenue sharing agreements with group companies. To the extent that the revenue allocation to service sellers within the group is greater than the available revenue from the agreement, the charge above the available revenue is recognised within other operating expenses.
The service seller of the agreements recognises, to the extent the allocation is made out of available revenue of the service payer, the revenue from the service payer within the income statement line item revenue sharing agreements with group companies. To the extent that the revenue is not received from the service payer’s available revenue, such revenue is recognised as a fee and commission revenue.
Customer loyalty programmesThe group’s banking operations operate a customer loyalty programme in terms of which it undertakes to provide goods and services to certain customers. The reward credits are accounted for as a separately identifiable component of the fee and commission income transactions of which they form a part. The consideration allocated to the reward credits is measured at the fair value of the reward credit and recognised over the period in which the customer utilises the reward credits.
Expenses relating to the provision of the reward credits are recognised as an expense as and when they are incurred.
20. Segment reportingAn operating segment is a component of the group engaged in business activities, whose operating results are reviewed regularly by management in order to make decisions about resources to be allocated to segments and assessing segment performance. The group’s identification of segments and the measurement of segment results is based on the group’s internal reporting to the chief operating decision maker.
Transactions between segments are priced at market-related rates.
21. Fiduciary activitiesThe group commonly engages in trust or other fiduciary activities that result in the holding or placing of assets on behalf of individuals, trusts, post-employment benefit plans and other institutions. These assets and the income arising directly thereon are excluded from these annual financial statements as they are not assets of the group. However, fee income earned and fee expenses incurred by the group relating to the group’s responsibilities from fiduciary activities are recognised in profit or loss.
22. Comparative figuresWhere necessary, comparative figures within notes have been restated to either conform to changes in presentation in the current year or for the adoption of new IFRS requirements.
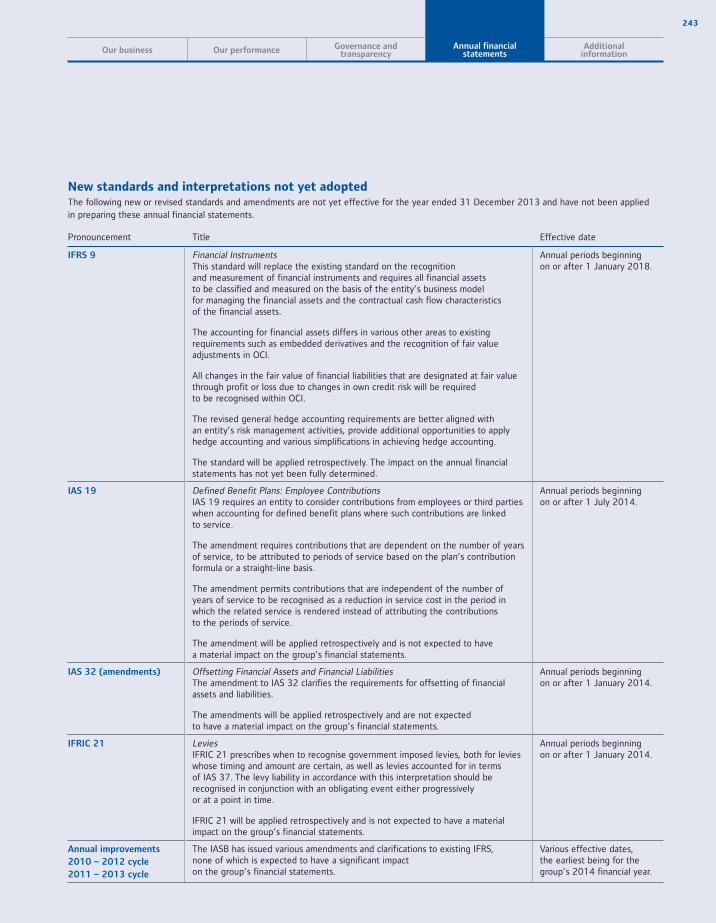
243
Our business Our performance Governance andtransparency
Annual financialstatements
Additionalinformation
New standards and interpretations not yet adopted The following new or revised standards and amendments are not yet effective for the year ended 31 December 2013 and have not been applied in preparing these annual financial statements.
Pronouncement Title Effective date
IFRS 9 Financial Instruments This standard will replace the existing standard on the recognition and measurement of financial instruments and requires all financial assets to be classified and measured on the basis of the entity’s business model for managing the financial assets and the contractual cash flow characteristics of the financial assets.
The accounting for financial assets differs in various other areas to existing requirements such as embedded derivatives and the recognition of fair value adjustments in OCI.
All changes in the fair value of financial liabilities that are designated at fair value through profit or loss due to changes in own credit risk will be required to be recognised within OCI.
The revised general hedge accounting requirements are better aligned with an entity’s risk management activities, provide additional opportunities to apply hedge accounting and various simplifications in achieving hedge accounting.
The standard will be applied retrospectively. The impact on the annual financial statements has not yet been fully determined.
Annual periods beginning on or after 1 January 2018.
IAS 19 Defined Benefit Plans: Employee ContributionsIAS 19 requires an entity to consider contributions from employees or third parties when accounting for defined benefit plans where such contributions are linked to service.
The amendment requires contributions that are dependent on the number of years of service, to be attributed to periods of service based on the plan’s contribution formula or a straight-line basis.
The amendment permits contributions that are independent of the number of years of service to be recognised as a reduction in service cost in the period in which the related service is rendered instead of attributing the contributions to the periods of service.
The amendment will be applied retrospectively and is not expected to have a material impact on the group’s financial statements.
Annual periods beginning on or after 1 July 2014.
IAS 32 (amendments) Offsetting Financial Assets and Financial LiabilitiesThe amendment to IAS 32 clarifies the requirements for offsetting of financial assets and liabilities.
The amendments will be applied retrospectively and are not expected to have a material impact on the group’s financial statements.
Annual periods beginning on or after 1 January 2014.
IFRIC 21 Levies IFRIC 21 prescribes when to recognise government imposed levies, both for levies whose timing and amount are certain, as well as levies accounted for in terms of IAS 37. The levy liability in accordance with this interpretation should be recognised in conjunction with an obligating event either progressively or at a point in time.
IFRIC 21 will be applied retrospectively and is not expected to have a material impact on the group’s financial statements.
Annual periods beginning on or after 1 January 2014.
Annual improvements
2010 – 2012 cycle
2011 – 2013 cycle
The IASB has issued various amendments and clarifications to existing IFRS, none of which is expected to have a significant impact on the group’s financial statements.
Various effective dates, the earliest being for the group’s 2014 financial year.

244 The Standard Bank of South Africa Annual report 2013
Annual financial statements
Annexure B
Income statement restatements of prior year’s disclosures
Groupfor the year ended 31 December 2012
Companyfor the year ended 31 December 2012
As previously reported
RmRestatement1
RmRestated
Rm
As previously reported
RmRestatement1
RmRestated
Rm
Net interest income 25 249 25 249 25 196 25 196
Interest income 55 677 55 677 54 975 54 975Interest expense 30 428 30 428 29 779 29 779
Non-interest revenue 22 032 22 032 21 394 21 394
Net fee and commission revenue 16 364 16 364 15 561 15 561
Fee and commission revenue 19 483 19 483 18 666 18 666Fee and commission expense 3 119 3 119 3 105 3 105
Trading revenue 3 147 3 147 3 154 3 154Other revenue 2 521 2 521 2 679 2 679
Total income 47 281 47 281 46 590 46 590Credit impairment charges 5 785 5 785 5 751 5 751
Income after credit impairment charges 41 496 41 496 40 839 40 839Revenue sharing agreements with group companies 1 642 1 642 1 642 1 642
Income after revenue sharing agreements 39 854 39 854 39 197 39 197Operating expenses 25 106 55 25 161 24 511 55 24 566
Staff costs 13 289 55 13 344 13 057 55 13 112Other operating expenses 11 817 11 817 11 454 11 454
Net income before equity
accounted earnings 14 748 (55) 14 693 14 686 (55) 14 631Share of profits from associates and joint ventures 523 523 155 155
Net income before indirect taxation 15 271 (55) 15 216 14 841 (55) 14 786Indirect taxation 974 974 973 973
Profit before direct taxation 14 297 (55) 14 242 13 868 (55) 13 813Direct taxation 2 362 (15) 2 347 2 266 (15) 2 251
Profit for the year 11 935 (40) 11 895 11 602 (40) 11 562
Attributable to non-controlling interest 11 11Attributable to the ordinary shareholder 11 924 (40) 11 884 11 602 (40) 11 562
1 On 1 January 2013, the group and company adopted IAS 19R. The most significant change as a result of the adoption of IAS 19R was the elimination of the ’corridor’ method under which the recognition of actuarial gains and losses was previously deferred and amortised to the income statement as part of staff costs. In terms of IAS 19R all unrecognised actuarial gains have been recognised in OCI on transition to the new requirements. The adoption of IAS 19R accordingly resulted in the group and company restating its previously reported financial results.
Reclassifications and restatements

245
Our business Our performance Governance andtransparency
Annual financialstatements
Additionalinformation
Balance sheet reclassification and restatements of prior year’s disclosures
Groupas at 31 December 2012
Groupas at 31 December 2011
As previously reported
RmAdjustments
RmRestated
Rm
As previously reported
RmAdjustments
RmRestated
Rm
Assets Cash and balances with central banks 25 926 25 926 20 865 20 865Derivative assets 78 844 78 844 93 422 93 422Trading assets 35 685 35 685 24 626 24 626Pledged assets 5 706 5 706 3 737 3 737Non-current asset held for sale 960 960Financial investments 76 679 76 679 79 809 79 809Loans and advances 659 500 659 500 611 165 611 165
Loans and advances to banks 69 999 (5 586)1 64 413 60 740 (6 809)1 53 931Loans and advances to customers 589 501 5 5861 595 087 550 425 6 8091 557 234
Current tax 191 191 170 170Deferred tax 26 26 138 138Other assets 17 821 1 1392 18 960 10 759 7482 11 507Interest in group companies, associates and joint ventures 58 430 58 430 62 099 62 099Goodwill and other intangible assets 10 350 10 350 6 469 6 469Property and equipment 8 895 8 895 8 430 8 430
Total assets 979 013 1 139 980 152 921 689 748 922 437
Equity and liabilitiesEquity 69 805 820 70 625 54 847 538 55 385
Equity attributable to the ordinary shareholder 69 742 820 70 562 54 795 538 55 333
Ordinary share capital 60 60 60 60Ordinary share premium 35 196 35 196 27 230 27 230Reserves 34 486 8202 35 306 27 505 5382 28 043
Non-controlling interest 63 63 52 52
Liabilities 909 208 319 909 527 866 842 210 867 052
Derivative liabilities 81 744 81 744 98 730 98 730Trading liabilities 15 953 5 2683 21 221 13 581 7 0193 20 600Deposit and current accounts 717 944 (5 268) 712 676 688 062 (7 019) 681 043
Deposits from banks 78 453 78 453 78 812 78 812Deposits from customers 639 491 (5 268)3 634 223 609 250 (7 019)3 602 231
Current tax liability 2 940 2 940 972 972Deferred tax liability 453 3192 772 702 2102 912Provisions and other liabilities 17 573 17 573 13 693 13 693Subordinated debt 22 400 22 400 16 095 16 095Liabilities to group companies 50 201 50 201 35 007 35 007
Total equity and liabilities 979 013 1 139 980 152 921 689 748 922 437
1 An amount of R5 586 million (2011: R6 809 million) was reclassified from loans and advances to banks to loans and advances to customers. The reclassification aligns an amount that was placed with a non-bank subsidiary of a bank holding company to loans and advances to customers as opposed to loans and advances to banks.
2 On 1 January 2013, the group adopted IAS 19R. The most significant change as a result of the adoption of IAS 19R was the elimination of the ’corridor’ method under which the recognition of actuarial gains and losses was previously deferred and amortised to the income statement as part of staff costs. In terms of IAS 19R all unrecognised actuarial gains have been recognised in OCI on transition to the new requirements. The adoption of IAS 19R accordingly resulted in the group and company restating its previously reported financial results.
3 Liabilities of R5 268 million (2011: R7 019 million) were previously incorrectly classified as designated at fair value through profit or loss within deposits from customers. In accordance with IFRS and the group’s accounting policies, these liabilities have been restated to trading liabilities from deposits from customers to reflect the group’s intention.The restatement had no impact on the group’s reserves or profit and loss.
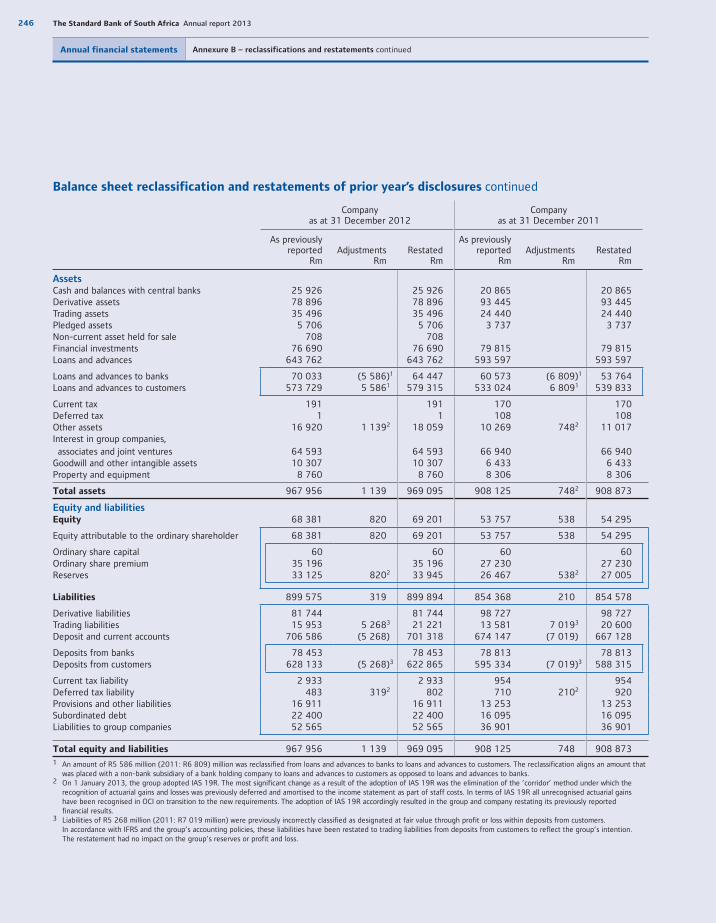
246 The Standard Bank of South Africa Annual report 2013
Annual financial statements Annexure B – reclassifications and restatements continued
Balance sheet reclassification and restatements of prior year’s disclosures continued
Companyas at 31 December 2012
Companyas at 31 December 2011
As previously reported
RmAdjustments
RmRestated
Rm
As previously reported
RmAdjustments
RmRestated
Rm
AssetsCash and balances with central banks 25 926 25 926 20 865 20 865Derivative assets 78 896 78 896 93 445 93 445Trading assets 35 496 35 496 24 440 24 440Pledged assets 5 706 5 706 3 737 3 737Non-current asset held for sale 708 708Financial investments 76 690 76 690 79 815 79 815Loans and advances 643 762 643 762 593 597 593 597
Loans and advances to banks 70 033 (5 586)1 64 447 60 573 (6 809)1 53 764Loans and advances to customers 573 729 5 5861 579 315 533 024 6 8091 539 833
Current tax 191 191 170 170Deferred tax 1 1 108 108Other assets 16 920 1 1392 18 059 10 269 7482 11 017Interest in group companies, associates and joint ventures 64 593 64 593 66 940 66 940Goodwill and other intangible assets 10 307 10 307 6 433 6 433Property and equipment 8 760 8 760 8 306 8 306
Total assets 967 956 1 139 969 095 908 125 7482 908 873
Equity and liabilitiesEquity 68 381 820 69 201 53 757 538 54 295
Equity attributable to the ordinary shareholder 68 381 820 69 201 53 757 538 54 295
Ordinary share capital 60 60 60 60Ordinary share premium 35 196 35 196 27 230 27 230Reserves 33 125 8202 33 945 26 467 5382 27 005
Liabilities 899 575 319 899 894 854 368 210 854 578
Derivative liabilities 81 744 81 744 98 727 98 727Trading liabilities 15 953 5 2683 21 221 13 581 7 0193 20 600Deposit and current accounts 706 586 (5 268) 701 318 674 147 (7 019) 667 128
Deposits from banks 78 453 78 453 78 813 78 813Deposits from customers 628 133 (5 268)3 622 865 595 334 (7 019)3 588 315
Current tax liability 2 933 2 933 954 954Deferred tax liability 483 3192 802 710 2102 920Provisions and other liabilities 16 911 16 911 13 253 13 253Subordinated debt 22 400 22 400 16 095 16 095Liabilities to group companies 52 565 52 565 36 901 36 901
Total equity and liabilities 967 956 1 139 969 095 908 125 748 908 8731 An amount of R5 586 million (2011: R6 809) million was reclassified from loans and advances to banks to loans and advances to customers. The reclassification aligns an amount that
was placed with a non-bank subsidiary of a bank holding company to loans and advances to customers as opposed to loans and advances to banks. 2 On 1 January 2013, the group adopted IAS 19R. The most significant change as a result of the adoption of IAS 19R was the elimination of the ’corridor’ method under which the
recognition of actuarial gains and losses was previously deferred and amortised to the income statement as part of staff costs. In terms of IAS 19R all unrecognised actuarial gains have been recognised in OCI on transition to the new requirements. The adoption of IAS 19R accordingly resulted in the group and company restating its previously reported financial results.
3 Liabilities of R5 268 million (2011: R7 019 million) were previously incorrectly classified as designated at fair value through profit or loss within deposits from customers. In accordance with IFRS and the group’s accounting policies, these liabilities have been restated to trading liabilities from deposits from customers to reflect the group’s intention. The restatement had no impact on the group’s reserves or profit and loss.

247
Our business Our performance Governance andtransparency
Annual financialstatements
Additionalinformation
Statement of other comprehensive income restatements of prior year’s disclosures
Groupfor the year ended 31 December 2012
Companyfor the year ended 31 December 2012
As previously reported
Rm
Re-statement
RmRestated
Rm
As previously reported
Rm
Re-statement
RmRestated
Rm
Profit for the year 11 935 (40) 11 895 11 602 (40) 11 562Other comprehensive (loss)/income after
tax for the year1 (251) 322 71 (252) 322 70
Items that may be reclassified subsequently
to profit or loss:Exchange differences on translating foreign operations 40 40 39 39Net change in fair value on cash flow hedges 159 159 159 159Realised fair value adjustments on cash flow hedges transferred to profit or loss (273) (273) (273) (273)Net change in fair value of available-for-sale financial assets (177) (177) (177) (177)
Items that may not be reclassified
to profit or loss:Defined benefit fund remeasurements 322 322 322 322
Total comprehensive income for the year 11 684 282 11 966 11 350 282 11 632
Attributable to non-controlling interest 11 11Total comprehensive income attributable
to the ordinary shareholder 11 673 282 11 955 11 350 282 11 632
1 On 1 January 2013 the company adopted IAS 19R. The most significant change as a result of the adoption of IAS 19R was the elimination of the ’corridor’ method under which the recognition of actuarial gains and losses was previously deferred and amortised to the income statement as part of staff costs. In terms of IAS 19R all unrecognised actuarial gains have been recognised in OCI on transition to the new requirements. The adoption of IAS 19R accordingly resulted in the group and company restating its previously reportedfinancial results.

248 The Standard Bank of South Africa Annual report 2013
Annual financial statements
Subsidiaries
Nature of operation
Issued share capital
Rm
Effective holding
2013%
2012%
Blue Bond Investments Limited Participation mortgage bond finance * 100 100
Blue Granite Investments No 1 (RF) Limited1 Securitisation vehicleBlue Granite Investments No 2 (RF) Limited1 Securitisation vehicleBlue Granite Investments No 3 (RF) Limited1 Securitisation vehicleBlue Granite Investments No 4 (RF) Limited1 Securitisation vehicleBlue Titanium Conduit Limited1 Asset-backed commercial
paper conduitDiners Club (SA) Proprietary Limited Travel and entertainment card * 100 100Out of the Blue Originator (RF) Proprietary Limited1 Securitisation vehicleSiyakha Fund (RF) Limited1 Securitisation vehicleStandard Bank Insurance Brokers Proprietary Limited Insurance broking * 100 100Rapvest Investments Proprietary Limited Financing company *Miscellaneous Finance companies **** ****
Total investment in subsidiaries
1 SE, no shareholding.* Issued share capital less than R1 million.** Book value less than R1 million.*** Held indirectly.**** Various holdings.
The detailed information is only given in respect of subsidiaries which are material to the financial position of the group.
All subsidiaries are incorporated within South Africa.
Consolidation of securitisation vehiclesThe securitisation vehicles are dependent on the group for financing and for the provision of critical services. Should the group terminate fundingand suspend the provision of these services these vehicles would not be able to continue in operation. The group also has residual risk as thefinancing provided by the group is subordinate to all other loans provided by the securitisation vehicles. The group also makes decisions regardingadvances to be included in the securitisation portfolio and hence directs the vehicles’ relevant activities. Accordingly, the group is considered,for IFRS purposes, to control these securitisation vehicles and hence the securitisation vehicles’ results are consolidated into the group’s results.
Annexure C
Subsidiaries, consolidated and unconsolidated structured entities

249
Our business Our performance Governance andtransparency
Annual financialstatements
Additionalinformation
Non-controlling interest Book value of shares Net indebtedness to SBSA company
2013Rm
2012Rm
2013Rm
2012Rm
2013Rm
2012Rm
** ** 65 81505 588336 330607 675395 516
263 288** ** 756 643
651 (354)
*** *** (184) (309)3 409 1 233
3 63 85 85 23 36
3 63 85 85 6 826 3 727

250 The Standard Bank of South Africa Annual report 2013
Annual financial statements Annexure C – subsidiaries, consolidated and unconsolidated structured entities continued
Consolidated structured entities
The following table discloses the consolidated SEs to which the group provides financial support1:
Name of entity Nature of operations
Amount of support provided as at2
Type of support3
2013Rm
2012 Rm
2013 2012
Blue Granite Investments No 1
(RF) Limited
Facilitates mortgage-backed securitisations. SBSA is the primary liquidity facility provider to Blue Granite Investments No 1 (RF) Limited (BG 1).
1 1 Subordinated loan4
Subordinated loan4
1 065 1 242 Mortgage-backed
notes4
Mortgage-backed notes4
Blue Granite Investments No 2
(RF) Limited
Facilitates mortgage-backed securitisations. SBSA is the primary liquidity facility provider to Blue Granite Investments No 2 (RF) Limited (BG 2).
1 135 1 135 Mortgage-backed
notes4
Mortgage-backed
notes4
Blue Granite Investments No 3
(RF) Limited
Facilitates mortgage-backed securitisations. SBSA is the primary liquidity facility provider to Blue Granite Investments No 3 (RF) Limited (BG 3).
58 58 Subordinated loan4
Subordinated loan4
1 076 1 178 Mortgage-backed
notes4
Mortgage-backed
notes4
1 During the reporting period, SBSA did not provide any financial or other support to any SE without having a contractual obligation to do so. 2 The amount of support provided includes loans and advances and undrawn credit facilities provided to the structured entities.3 In addition to the financial support provided to the SEs, the group enters into other transactions with SEs in the ordinary course of business which include loans and advances, deposits
and current accounts and derivatives.4 This is the amount as reported on the balance sheet as at 31 December 2013 and 2012, respectively. For credit facilities, the amount shown is the undrawn balance
as at the reporting date.
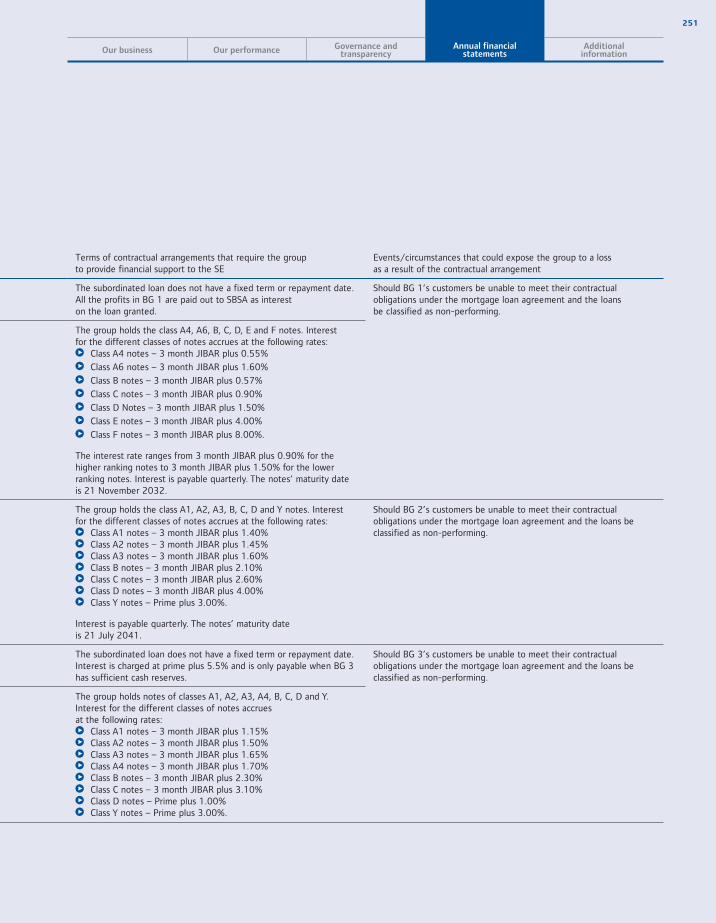
251
Our business Our performance Governance andtransparency
Annual financialstatements
Additionalinformation
Terms of contractual arrangements that require the group to provide financial support to the SE
Events/circumstances that could expose the group to a loss as a result of the contractual arrangement
The subordinated loan does not have a fixed term or repayment date. All the profits in BG 1 are paid out to SBSA as interest on the loan granted.
Should BG 1’s customers be unable to meet their contractual obligations under the mortgage loan agreement and the loans be classified as non-performing.
The group holds the class A4, A6, B, C, D, E and F notes. Interest for the different classes of notes accrues at the following rates:
Class A4 notes – 3 month JIBAR plus 0.55%
Class A6 notes – 3 month JIBAR plus 1.60%
Class B notes – 3 month JIBAR plus 0.57%
Class C notes – 3 month JIBAR plus 0.90%
Class D Notes – 3 month JIBAR plus 1.50%
Class E notes – 3 month JIBAR plus 4.00%
Class F notes – 3 month JIBAR plus 8.00%.
The interest rate ranges from 3 month JIBAR plus 0.90% for the higher ranking notes to 3 month JIBAR plus 1.50% for the lower ranking notes. Interest is payable quarterly. The notes’ maturity date is 21 November 2032.
The group holds the class A1, A2, A3, B, C, D and Y notes. Interest for the different classes of notes accrues at the following rates:
Class A1 notes – 3 month JIBAR plus 1.40% Class A2 notes – 3 month JIBAR plus 1.45% Class A3 notes – 3 month JIBAR plus 1.60% Class B notes – 3 month JIBAR plus 2.10% Class C notes – 3 month JIBAR plus 2.60% Class D notes – 3 month JIBAR plus 4.00% Class Y notes – Prime plus 3.00%.
Interest is payable quarterly. The notes’ maturity date is 21 July 2041.
Should BG 2’s customers be unable to meet their contractual obligations under the mortgage loan agreement and the loans be classified as non-performing.
The subordinated loan does not have a fixed term or repayment date. Interest is charged at prime plus 5.5% and is only payable when BG 3 has sufficient cash reserves.
Should BG 3’s customers be unable to meet their contractual obligations under the mortgage loan agreement and the loans be classified as non-performing.
The group holds notes of classes A1, A2, A3, A4, B, C, D and Y. Interest for the different classes of notes accrues at the following rates:
Class A1 notes – 3 month JIBAR plus 1.15% Class A2 notes – 3 month JIBAR plus 1.50% Class A3 notes – 3 month JIBAR plus 1.65% Class A4 notes – 3 month JIBAR plus 1.70% Class B notes – 3 month JIBAR plus 2.30% Class C notes – 3 month JIBAR plus 3.10% Class D notes – Prime plus 1.00% Class Y notes – Prime plus 3.00%.

252 The Standard Bank of South Africa Annual report 2013
Annual financial statements Annexure C – subsidiaries, consolidated and unconsolidated structured entities continued
Consolidated structured entities continued
Name of entity Nature of operations
Amount of support provided as at1
Type of support2
2013Rm
2012 Rm
2013 2012
Blue Granite Investments No 4
(RF) Limited
Facilitates mortgage-backed securitisations. SBSA is the primary liquidity facility provider toBlue Granite Investments No 4(RF) Limited (BG 4).
108 98 Subordinated loan3
Subordinated loan3
1 198 1 376 Mortgage- backed
notes3
Mortgage- backed
notes3
Siyakha Fund (RF) Limited Facilitates mortgage-backed securitisations. SBSA is the primary liquidity facility provider to Siyakha Fund (RF) Limited (Siyakha).
43 51 Subordinated loan3
Subordinated loan3
835 Mortgage- backed
notes3
Mortgage- backed
notes3
Blue Banner Securitisation
Vehicle RC1 Proprietary
Limited
Originates mortgage loans on behalf of SBSA. SBSA provides the funding for these mortgage loans to Blue Banner Securitisation Vehicle RC1 Proprietary Limited (Blue Banner).
238 272 Bridging finance3
Bridging finance3
Out of the Blue Originator
(RF) Proprietary Limited
Out of the Blue Originator (RF) (Prop) Limited (OTB) originates loans on behalf of Blue Titanium Conduit Limited (BTC). BTC is consolidated by the group.
Overdraft facility3
Overdraft facility3
1 The amount of support provided includes loans and advances and undrawn credit facilities provided to the structured entities.2 In addition to the financial support provided to the SEs, the group enters into other transactions with SEs in the ordinary course of business. The transactions entered into include
loans and advances, deposits and current accounts and derivatives.3 This is the amount as reported on the balance sheet as at 31 December 2013 and 2012 respectively. For credit facilities, the amount shown is the undrawn balance
as at the reporting date.

253
Our business Our performance Governance andtransparency
Annual financialstatements
Additionalinformation
Terms of contractual arrangements that require the group to provide financial support to the SE
Events/circumstances that could expose the group to a loss as a result of the contractual arrangement
The subordinated loan does not have a fixed term or repayment date. Interest is charged at prime plus 5.5% and is only payable when BG 4 has sufficient cash reserves.
Should BG 4 customers be unable to meet their contractual obligations under the mortgage loan agreement and the loans be classified as non-performing.
The group holds class A1, A3, A4, B, C, D and Y notes. Interest for the different classes of notes accrues at the following rates:
Class A1 – 3 month JIBAR plus 1.15% Class A3 – 3 month JIBAR plus 1.85% Class A4 – 3 month JIBAR plus 1.85% Class B notes – 3 month JIBAR plus 2.30% Class C notes – 3 month JIBAR plus 3.10% Class D notes – Prime plus 1.00% Class Y notes – Prime plus 3.00%.
Interest is payable quarterly. The notes’ maturity date is15 June 2037.
The loan does not have a fixed term or repayment date. Interest is charged at prime plus 5.5% and is only payable when Siyakha has sufficient cash reserves.
Should Siyakha’s customers be unable to meet their contractual obligations under the mortgage loan agreement and the loans be classified as non-performing.
The group holds class A1, A2, B, C, and D notes. Interest for the different classes of notes accrues at the following rates:
Class A1 notes – 3 month JIBAR plus 1.10% Class A2 notes – Prime less 2.10% Class B notes – Prime less 1.00% Class C notes – Prime plus 1.00% Class D notes – Prime plus 2.00%.
Interest is payable quarterly. The notes’ maturity date is 11 February 2045.
The loan does not have a fixed term or repayment date. Any profitsin Blue Banner are paid out as interest to SBSA.
Should Blue Banner’s customers be unable to meet their contractual obligations under the mortgage loan agreement and the loans be classified as non-performing.
OTB applies for the necessary overdraft facility as and when it originates loans. The amount drawn down is settled on the same day of the draw down. The terms are negotiated and agreed upon at the time of the grant of the overdraft facility. OTB applied for and was granted an overdraft facility of R250 million in 2013 and R1 100 million in 2012, OTB drew down on the overdraft facility in both 2012 and 2013. The facility had been repaid by 31 December of 2012 and 2013, respectively.
OTB does not expose the group to a risk of loss as it acts as a conduit between SBSA and BTC. OTB draws down on the overdraft facility as and when loans are originated and the facility is repaid on the same day of the draw down.
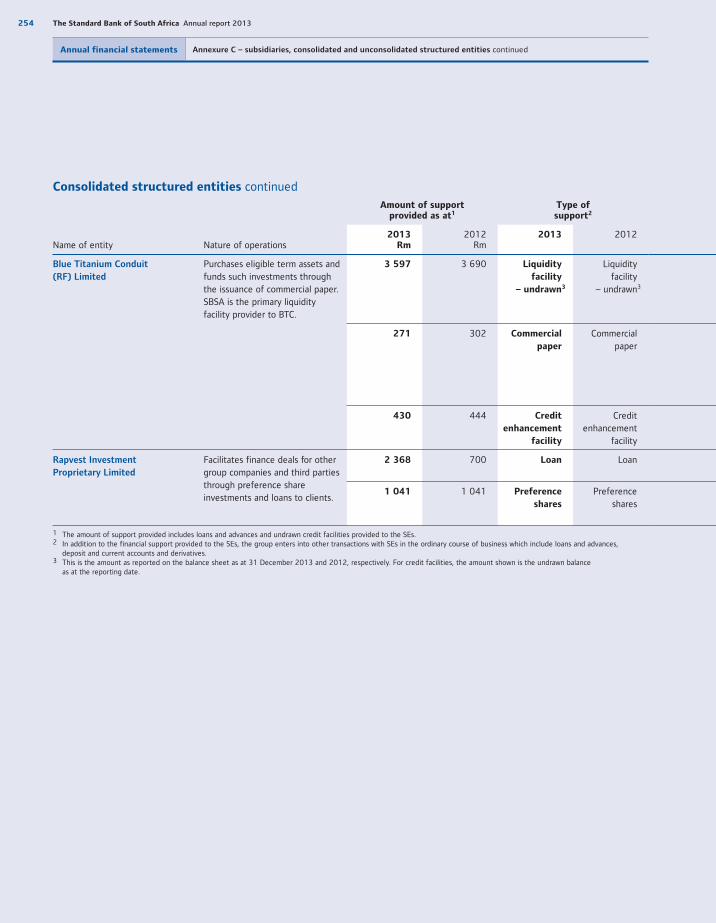
254 The Standard Bank of South Africa Annual report 2013
Annual financial statements Annexure C – subsidiaries, consolidated and unconsolidated structured entities continued
Consolidated structured entities continued
Name of entity Nature of operations
Amount of support provided as at1
Type of support2
2013Rm
2012 Rm
2013 2012
Blue Titanium Conduit
(RF) Limited
Purchases eligible term assets and funds such investments through the issuance of commercial paper. SBSA is the primary liquidity facility provider to BTC.
3 597 3 690 Liquidity
facility
– undrawn3
Liquidity facility
– undrawn3
271 302 Commercial
paper
Commercial paper
430 444 Credit
enhancement
facility
Credit enhancement
facility
Rapvest Investment
Proprietary Limited
Facilitates finance deals for other group companies and third parties through preference share investments and loans to clients.
2 368 700 Loan Loan
1 041 1 041 Preference
shares
Preference shares
1 The amount of support provided includes loans and advances and undrawn credit facilities provided to the SEs.2 In addition to the financial support provided to the SEs, the group enters into other transactions with SEs in the ordinary course of business which include loans and advances,
deposit and current accounts and derivatives.3 This is the amount as reported on the balance sheet as at 31 December 2013 and 2012, respectively. For credit facilities, the amount shown is the undrawn balance
as at the reporting date.
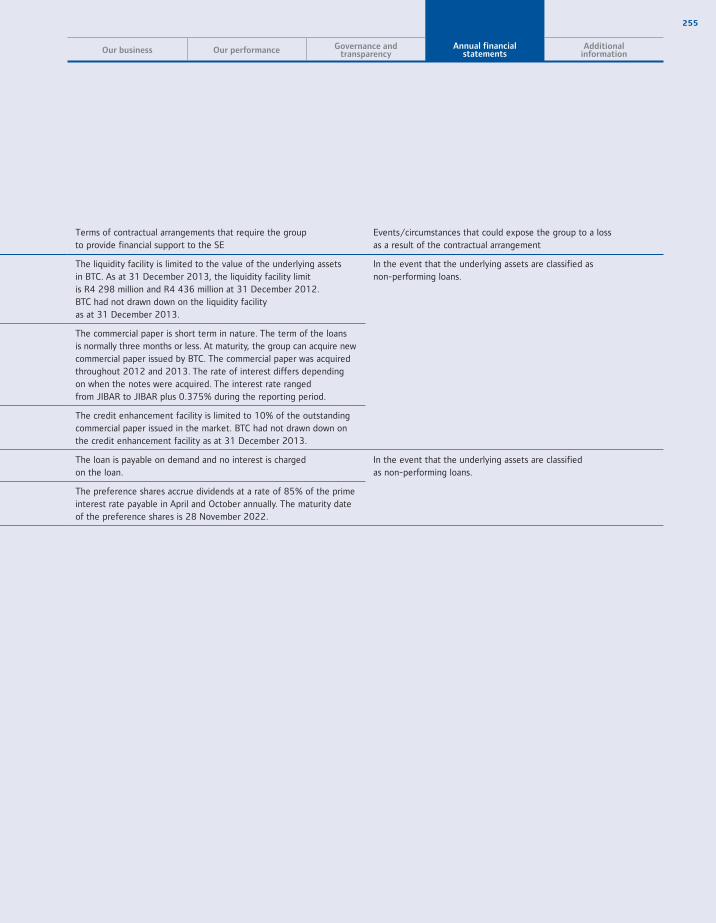
255
Our business Our performance Governance andtransparency
Annual financialstatements
Additionalinformation
Terms of contractual arrangements that require the group to provide financial support to the SE
Events/circumstances that could expose the group to a loss as a result of the contractual arrangement
The liquidity facility is limited to the value of the underlying assets in BTC. As at 31 December 2013, the liquidity facility limit is R4 298 million and R4 436 million at 31 December 2012. BTC had not drawn down on the liquidity facility as at 31 December 2013.
In the event that the underlying assets are classified as non-performing loans.
The commercial paper is short term in nature. The term of the loans is normally three months or less. At maturity, the group can acquire new commercial paper issued by BTC. The commercial paper was acquired throughout 2012 and 2013. The rate of interest differs depending on when the notes were acquired. The interest rate ranged from JIBAR to JIBAR plus 0.375% during the reporting period.
The credit enhancement facility is limited to 10% of the outstanding commercial paper issued in the market. BTC had not drawn down on the credit enhancement facility as at 31 December 2013.
The loan is payable on demand and no interest is charged on the loan.
In the event that the underlying assets are classified as non-performing loans.
The preference shares accrue dividends at a rate of 85% of the prime interest rate payable in April and October annually. The maturity date of the preference shares is 28 November 2022.
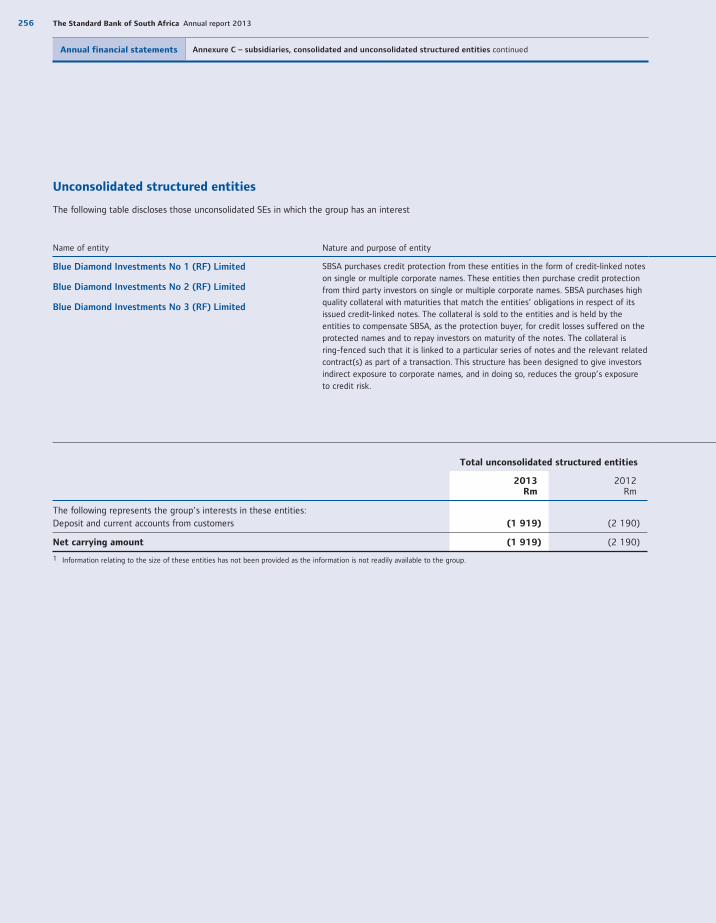
256 The Standard Bank of South Africa Annual report 2013
Annual financial statements Annexure C – subsidiaries, consolidated and unconsolidated structured entities continued
Unconsolidated structured entities
The following table discloses those unconsolidated SEs in which the group has an interest
Name of entity Nature and purpose of entity
Blue Diamond Investments No 1 (RF) Limited
Blue Diamond Investments No 2 (RF) Limited
Blue Diamond Investments No 3 (RF) Limited
SBSA purchases credit protection from these entities in the form of credit-linked notes on single or multiple corporate names. These entities then purchase credit protection from third party investors on single or multiple corporate names. SBSA purchases high quality collateral with maturities that match the entities’ obligations in respect of its issued credit-linked notes. The collateral is sold to the entities and is held by the entities to compensate SBSA, as the protection buyer, for credit losses suffered on the protected names and to repay investors on maturity of the notes. The collateral is ring-fenced such that it is linked to a particular series of notes and the relevant related contract(s) as part of a transaction. This structure has been designed to give investors indirect exposure to corporate names, and in doing so, reduces the group’s exposure to credit risk.
Total unconsolidated structured entities
2013Rm
2012Rm
The following represents the group’s interests in these entities:Deposit and current accounts from customers (1 919) (2 190)
Net carrying amount (1 919) (2 190)
1 Information relating to the size of these entities has not been provided as the information is not readily available to the group.
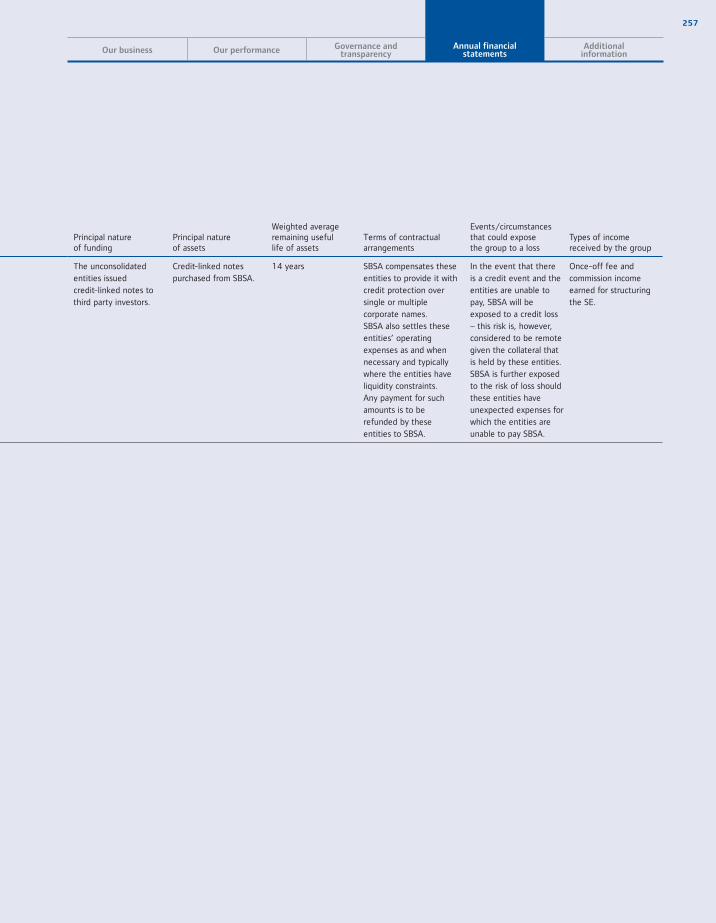
257
Our business Our performance Governance andtransparency
Annual financialstatements
Additionalinformation
Principal nature of funding
Principal nature of assets
Weighted average remaining useful life of assets
Terms of contractual arrangements
Events/circumstances that could expose the group to a loss
Types of income received by the group
The unconsolidated entities issued credit-linked notes to third party investors.
Credit-linked notes purchased from SBSA.
14 years SBSA compensates these entities to provide it with credit protection over single or multiple corporate names. SBSA also settles these entities’ operating expenses as and when necessary and typically where the entities have liquidity constraints. Any payment for such amounts is to be refunded by these entities to SBSA.
In the event that there is a credit event and the entities are unable to pay, SBSA will be exposed to a credit loss – this risk is, however, considered to be remote given the collateral that is held by these entities. SBSA is further exposed to the risk of loss should these entities have unexpected expenses for which the entities are unable to pay SBSA.
Once-off fee and commission income earned for structuring the SE.
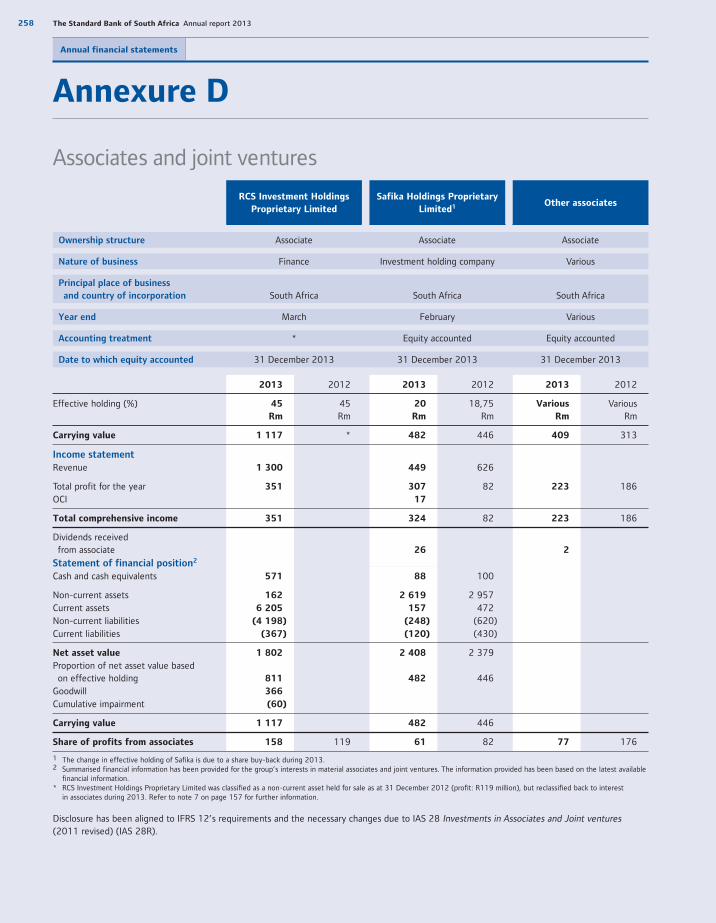
258 The Standard Bank of South Africa Annual report 2013
Annual financial statements
Annexure D
RCS Investment Holdings
Proprietary Limited
Safika Holdings Proprietary
Limited1 Other associates
Ownership structure Associate Associate Associate
Nature of business Finance Investment holding company Various
Principal place of business
and country of incorporation South Africa South Africa South Africa
Year end March February Various
Accounting treatment * Equity accounted Equity accounted
Date to which equity accounted 31 December 2013 31 December 2013 31 December 2013
2013 2012 2013 2012 2013 2012
Effective holding (%) 45
Rm
45 Rm
20
Rm
18,75 Rm
Various
Rm
VariousRm
Carrying value 1 117 * 482 446 409 313
Income statement
Revenue 1 300 449 626
Total profit for the year 351 307 82 223 186 OCI 17
Total comprehensive income 351 324 82 223 186
Dividends received from associate 26 2
Statement of financial position2
Cash and cash equivalents 571 88 100
Non-current assets 162 2 619 2 957Current assets 6 205 157 472Non-current liabilities (4 198) (248) (620)Current liabilities (367) (120) (430)
Net asset value 1 802 2 408 2 379Proportion of net asset value based on effective holding 811 482 446 Goodwill 366
Cumulative impairment (60)
Carrying value 1 117 482 446
Share of profits from associates 158 119 61 82 77 176
1 The change in effective holding of Safika is due to a share buy-back during 2013.2 Summarised financial information has been provided for the group’s interests in material associates and joint ventures. The information provided has been based on the latest available
financial information.* RCS Investment Holdings Proprietary Limited was classified as a non-current asset held for sale as at 31 December 2012 (profit: R119 million), but reclassified back to interest
in associates during 2013. Refer to note 7 on page 157 for further information.
Disclosure has been aligned to IFRS 12’s requirements and the necessary changes due to IAS 28 Investments in Associates and Joint ventures (2011 revised) (IAS 28R).
Associates and joint ventures

259
Our business Our performance Governance andtransparency
Annual financialstatements
Additionalinformation
Joint venturesTotal associates
and joint ventures
Private equity/
venture capital associates
and joint ventures1
Ownership structure Joint venture Various Various
Nature of business Various Various Various
Principal place of business and
country of incorporation South Africa South Africa South Africa
Year end Various Various Various
Accounting treatment Equity accounted Equity accounted Equity accounted
Date to which equity accounted 31 December 2013 31 December 2013 31 December 2013
2013 2012 2013 2012 2013 2012
Effective holding Various
Rm
VariousRm
Various
Rm
VariousRm
Various
Rm
VariousRm
Carrying value 57 52 2 065 811 624 537
Cost of private equity/venture
capital associates and joint ventures 148 159Other income 16
Total profit and comprehensive income for the year 14 14
Statement of financial position2
Non-current assets 3 980 4 039Current assets 935 549Non-current liabilities (866) (1 305)Current liabilities (1 058) (717)
Net asset value 2 991 2 566
Loans to group companies3 2 2Share of profits from associates/
joint ventures 7 8 303 385 92 91Fair value* 572 454
1 Included in total associates and joint ventures. These investments in associates and joint ventures were made by the group’s private equity operations and have been ring-fenced for headline earnings purposes. On the disposal of these associates and joint ventures held by the private equity division of the group, the profit or loss on the disposal will be included in headline earnings in terms of Circular 3/2012 Headline Earnings, issued by SAICA at the request of the JSE Limited.
2 Summarised financial information of the associates and joint ventures is provided based on the latest available financial information.3 These loans are provided on an arm’s length basis.* No quoted market prices are available with regards to any of the group’s interest in associates and joint ventures.
Disclosure has been aligned to IFRS 12’s requirements and the necessary changes due to IAS 28.
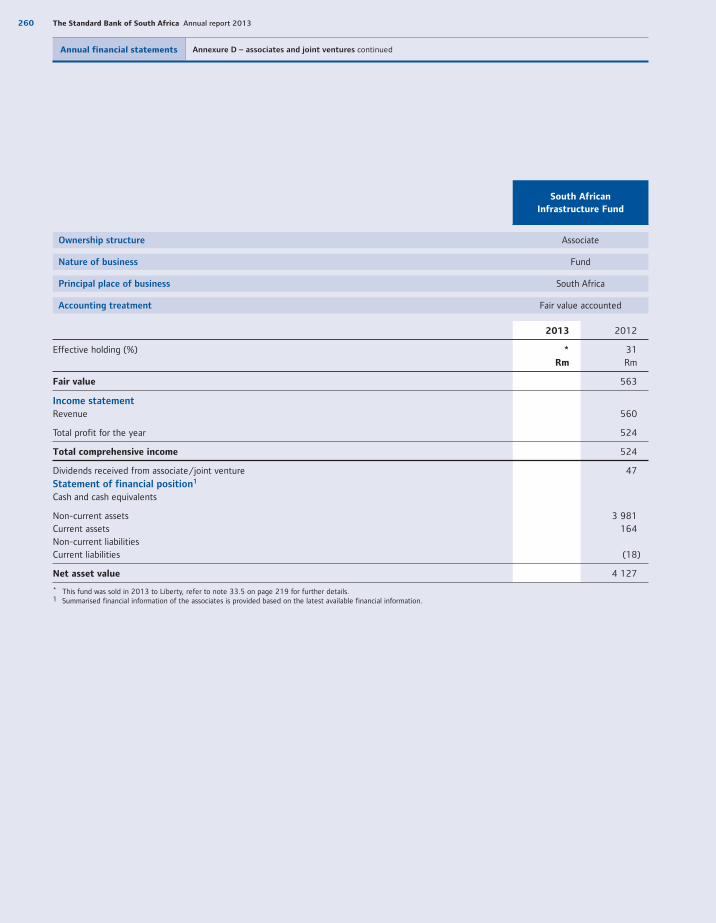
260 The Standard Bank of South Africa Annual report 2013
Annual financial statements Annexure D – associates and joint ventures continued
South African
Infrastructure Fund
Ownership structure Associate
Nature of business Fund
Principal place of business South Africa
Accounting treatment Fair value accounted
2013 2012
Effective holding (%) * 31Rm Rm
Fair value 563
Income statement
Revenue 560
Total profit for the year 524
Total comprehensive income 524
Dividends received from associate/joint venture 47
Statement of financial position1
Cash and cash equivalents
Non-current assets 3 981Current assets 164Non-current liabilitiesCurrent liabilities (18)
Net asset value 4 127
* This fund was sold in 2013 to Liberty, refer to note 33.5 on page 219 for further details.1 Summarised financial information of the associates is provided based on the latest available financial information.
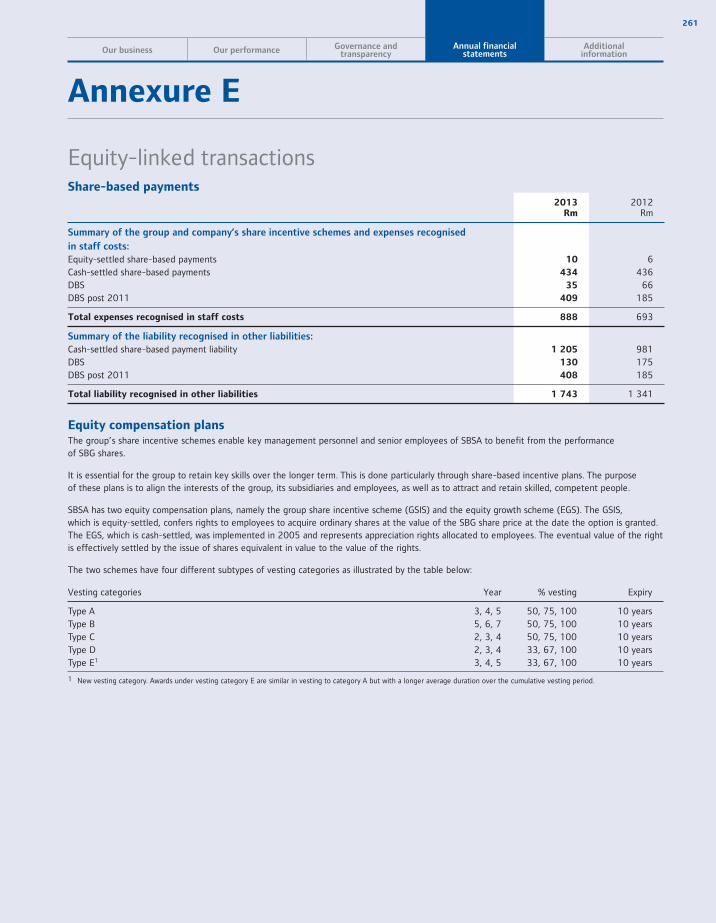
261
Our business Our performance Governance andtransparency
Annual financialstatements
Additionalinformation
Annexure E
Share-based payments2013
Rm2012
Rm
Summary of the group and company’s share incentive schemes and expenses recognised
in staff costs:
Equity-settled share-based payments 10 6Cash-settled share-based payments 434 436DBS 35 66DBS post 2011 409 185
Total expenses recognised in staff costs 888 693
Summary of the liability recognised in other liabilities:
Cash-settled share-based payment liability 1 205 981DBS 130 175DBS post 2011 408 185
Total liability recognised in other liabilities 1 743 1 341
Equity compensation plansThe group’s share incentive schemes enable key management personnel and senior employees of SBSA to benefit from the performance of SBG shares.
It is essential for the group to retain key skills over the longer term. This is done particularly through share-based incentive plans. The purposeof these plans is to align the interests of the group, its subsidiaries and employees, as well as to attract and retain skilled, competent people.
SBSA has two equity compensation plans, namely the group share incentive scheme (GSIS) and the equity growth scheme (EGS). The GSIS, which is equity-settled, confers rights to employees to acquire ordinary shares at the value of the SBG share price at the date the option is granted. The EGS, which is cash-settled, was implemented in 2005 and represents appreciation rights allocated to employees. The eventual value of the right is effectively settled by the issue of shares equivalent in value to the value of the rights.
The two schemes have four different subtypes of vesting categories as illustrated by the table below:
Vesting categories Year % vesting Expiry
Type A 3, 4, 5 50, 75, 100 10 yearsType B 5, 6, 7 50, 75, 100 10 yearsType C 2, 3, 4 50, 75, 100 10 yearsType D 2, 3, 4 33, 67, 100 10 yearsType E1 3, 4, 5 33, 67, 100 10 years
1 New vesting category. Awards under vesting category E are similar in vesting to category A but with a longer average duration over the cumulative vesting period.
Equity-linked transactions

262 The Standard Bank of South Africa Annual report 2013
Annual financial statements Annexure E – equity-linked transactions continued
Equity-settled share-based paymentsA reconciliation of the movement of share options is detailed below:
Option pricerange (rand)
Number of options
2013 2013 2012
GSIS
Options outstanding at beginning of the year 2 661 950 4 888 950 Transfers 40,65 – 111,94 (123 350) (91 100)Exercised 27,90 – 111,94 (958 857) (2 090 100)Lapsed 62,39 – 111,94 (67 813) (45 800)
Options outstanding at end of the year 1 511 930 2 661 950
Share options were exercised regularly throughout the year. The weighted average share price for the year was R115,39 (2012: R110,03).
The following options granted to employees, including executive directors, had not been exercised at 31 December 2013:
Number of ordinary shares
Option price range (rand)
Weighted average price (rand) Option expiry period
381 200 39,90 – 48,00 41,03 Year to 31 December 2014
10 000 65,60 65,60 Year to 31 December 2015
19 600 76,40 – 79,50 77,92 Year to 31 December 2016
47 100 98,00 98,00 Year to 31 December 2017
175 900 92,00 92,00 Year to 31 December 2018
181 430 62,39 62,39 Year to 31 December 2019
452 950 111,94 – 114,60 111,97 Year to 31 December 2020
243 750 98,80 98,80 Year to 31 December 2021
1 511 930
The following options granted to employees, including executive directors, had not been exercised at 31 December 2012:
Number of ordinary shares
Option price range(rand)
Weighted average price(rand) Option expiry period
137 000 27,90 – 32,19 28,21 Year to 31 December 20131 024 300 39,90 – 48,00 40,82 Year to 31 December 2014
33 800 64,27 – 65,60 65,01 Year to 31 December 2015 31 600 76,40 – 79,50 78,52 Year to 31 December 2016 70 400 98,00 98,00 Year to 31 December 2017
233 500 92,00 92,00 Year to 31 December 2018 220 100 62,39 62,39 Year to 31 December 2019 648 750 104,53 – 114,60 110,82 Year to 31 December 2020 262 500 98,80 98,80 Year to 31 December 2021
2 661 950
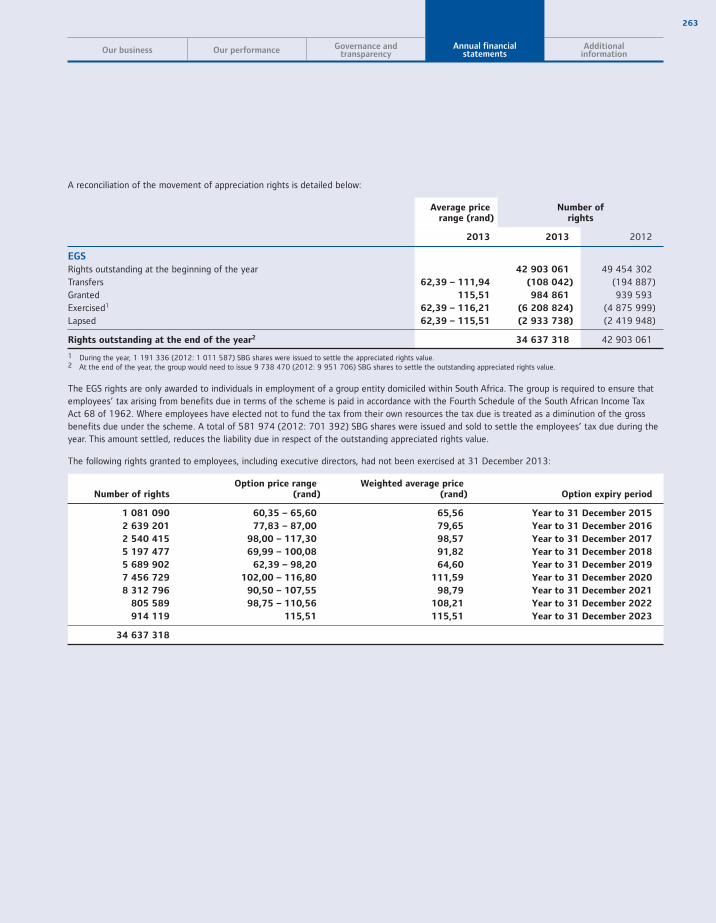
263
Our business Our performance Governance andtransparency
Annual financialstatements
Additionalinformation
A reconciliation of the movement of appreciation rights is detailed below:
Average pricerange (rand)
Number of rights
2013 2013 2012
EGS
Rights outstanding at the beginning of the year 42 903 061 49 454 302Transfers 62,39 – 111,94 (108 042) (194 887)Granted 115,51 984 861 939 593Exercised1 62,39 – 116,21 (6 208 824) (4 875 999)Lapsed 62,39 – 115,51 (2 933 738) (2 419 948)
Rights outstanding at the end of the year2 34 637 318 42 903 061
1 During the year, 1 191 336 (2012: 1 011 587) SBG shares were issued to settle the appreciated rights value.2 At the end of the year, the group would need to issue 9 738 470 (2012: 9 951 706) SBG shares to settle the outstanding appreciated rights value.
The EGS rights are only awarded to individuals in employment of a group entity domiciled within South Africa. The group is required to ensure that employees’ tax arising from benefits due in terms of the scheme is paid in accordance with the Fourth Schedule of the South African Income Tax Act 68 of 1962. Where employees have elected not to fund the tax from their own resources the tax due is treated as a diminution of the gross benefits due under the scheme. A total of 581 974 (2012: 701 392) SBG shares were issued and sold to settle the employees’ tax due during the year. This amount settled, reduces the liability due in respect of the outstanding appreciated rights value.
The following rights granted to employees, including executive directors, had not been exercised at 31 December 2013:
Number of rightsOption price range
(rand)Weighted average price
(rand) Option expiry period
1 081 090 60,35 – 65,60 65,56 Year to 31 December 2015
2 639 201 77,83 – 87,00 79,65 Year to 31 December 2016
2 540 415 98,00 – 117,30 98,57 Year to 31 December 2017
5 197 477 69,99 – 100,08 91,82 Year to 31 December 2018
5 689 902 62,39 – 98,20 64,60 Year to 31 December 2019
7 456 729 102,00 – 116,80 111,59 Year to 31 December 2020
8 312 796 90,50 – 107,55 98,79 Year to 31 December 2021
805 589 98,75 – 110,56 108,21 Year to 31 December 2022
914 119 115,51 115,51 Year to 31 December 2023
34 637 318
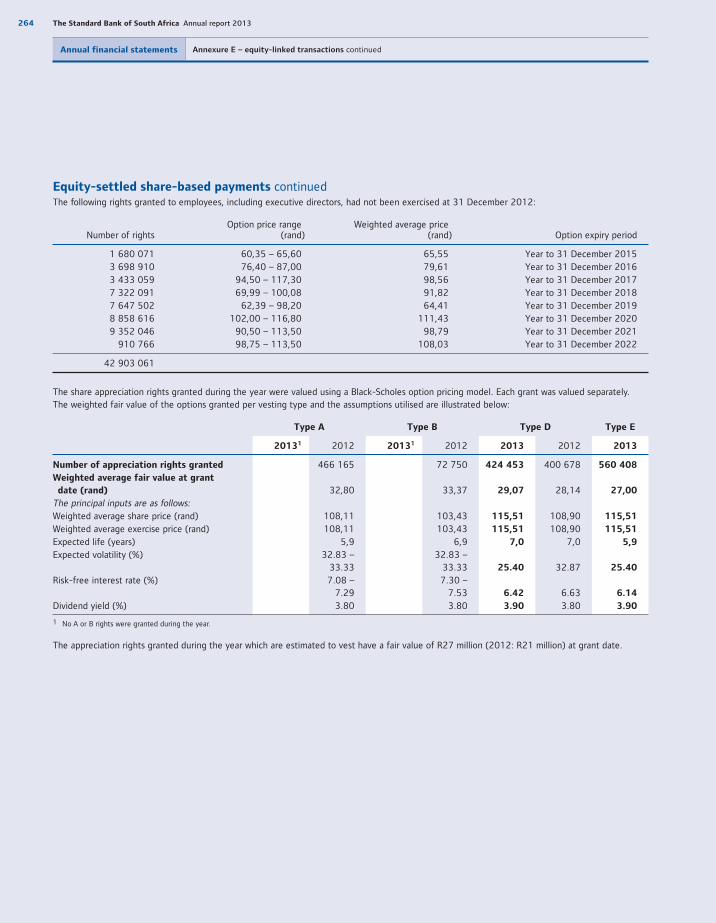
264 The Standard Bank of South Africa Annual report 2013
Annual financial statements Annexure E – equity-linked transactions continued
Equity-settled share-based payments continuedThe following rights granted to employees, including executive directors, had not been exercised at 31 December 2012:
Number of rightsOption price range
(rand)Weighted average price
(rand) Option expiry period
1 680 071 60,35 – 65,60 65,55 Year to 31 December 20153 698 910 76,40 – 87,00 79,61 Year to 31 December 20163 433 059 94,50 – 117,30 98,56 Year to 31 December 20177 322 091 69,99 – 100,08 91,82 Year to 31 December 20187 647 502 62,39 – 98,20 64,41 Year to 31 December 20198 858 616 102,00 – 116,80 111,43 Year to 31 December 20209 352 046 90,50 – 113,50 98,79 Year to 31 December 2021
910 766 98,75 – 113,50 108,03 Year to 31 December 2022
42 903 061
The share appreciation rights granted during the year were valued using a Black-Scholes option pricing model. Each grant was valued separately. The weighted fair value of the options granted per vesting type and the assumptions utilised are illustrated below:
Type A Type B Type D Type E
20131 2012 20131 2012 2013 2012 2013
Number of appreciation rights granted 466 165 72 750 424 453 400 678 560 408
Weighted average fair value at grant
date (rand) 32,80 33,37 29,07 28,14 27,00
The principal inputs are as follows:Weighted average share price (rand) 108,11 103,43 115,51 108,90 115,51
Weighted average exercise price (rand) 108,11 103,43 115,51 108,90 115,51
Expected life (years) 5,9 6,9 7,0 7,0 5,9
Expected volatility (%) 32.83 –33.33
32.83 – 33.33 25.40 32.87 25.40
Risk-free interest rate (%) 7.08 – 7.29
7.30 – 7.53 6.42 6.63 6.14
Dividend yield (%) 3.80 3.80 3.90 3.80 3.90
1 No A or B rights were granted during the year.
The appreciation rights granted during the year which are estimated to vest have a fair value of R27 million (2012: R21 million) at grant date.

265
Our business Our performance Governance andtransparency
Annual financialstatements
Additionalinformation
Deferred bonus schemeThe group has implemented a scheme to defer a portion of incentive bonuses over a minimum threshold for key management and executives. This improves the alignment of shareholder and management interests by creating a closer linkage between risk and reward, and also facilitates retention of key employees.
All employees who were awarded short-term incentives over a certain threshold, were subject to a mandatory deferral of a percentage of their cash incentive into the DBS. Vesting of the deferred bonus occurs after three years, conditional on continued employment at that time. The final payment of the deferred bonus is calculated with reference to the SBG share price at payment date. To enhance the retention component of the scheme, additional increments on the deferred bonus become payable at vesting and one year thereafter. The DBS was replaced in 2012 by the DBS post 2011 scheme.
The provision in respect of liabilities under the scheme amounts to R130 million at 31 December 2013 (2012: R175 million) and the amount charged for the year was R35 million (2012: R66 million charged). The change in liability due to the change in the group share price is hedged through the use of equity forwards designated as cash flow hedges.
Units
2013 2012
Reconciliation
Units outstanding at the beginning of the year 1 967 264 2 610 464 Exercised (741 992) (511 585)Lapsed (98 773) (131 615)
Units outstanding at the end of the year 1 126 499 1 967 264
DBS post 2011In 2012, changes were made to the existing DBS to provide for a single global incentive deferral scheme across SBG’s regions. The purpose of the DBS post 2011 is to encourage a longer-term outlook in business decision-making and closer alignment of performance with long-term value creation.
All employees granted an annual performance award over a threshold have part of their award deferred. The award is indexed to the group’s share price and accrues notional dividends during the vesting period, which are payable on vesting. The awards vest in three equal amounts at 18 months, 30 months and 42 months from the date of award. The final payout is determined with reference to SBG’s share price on vesting date.
The provision in respect of liabilities under the scheme amounts to R408 million as at 31 December 2013 (2012: R185 million) and the amount charged for the year was R409 million (2012: R185 million). The change in liability is due to the change in the group share price, and is also hedged through the use of equity forwards designated as cash flow hedges.
Units
2013 2012
Reconciliation
Units outstanding at the beginning of the year 5 080 306
Granted 4 818 053 5 269 318 Exercised (1 504 936)
Lapsed (571 282) (189 012)
Units outstanding at the end of the year 7 822 141 5 080 306
Weighted average fair value at grant date (rand) 115,51 109,02 Expected life (years) 2,51 2,51
Risk-free interest rate (%) 5.54 5.02

266 The Standard Bank of South Africa Annual report 2013
Annual financial statements
Annexure F
Fixed remuneration
Services as directors of
SBSAR’000
SBSA committee
feesR’000
Services asdirectors of
group subsidiaries
R’000
Other benefits
R’000
Otherwisein connection
with the affairs of
SBSA and its subsidiaries
R’000
Total compensation
for the yearR’000
Non-executive directorsDDB Band 2013 204 442 379 1 025
2012 189 410 315 4731 1 387
RMW Dunne 2013 204 806 204 1 214
2012 189 746 189 1 124
TS Gcabashe 2013 204 318 243 765
2012 189 280 225 694
KP Kalyan 2013 204 91 204 499
2012 189 84 189 462
SJ Macozoma 2013 204 626 2 462 3 292
2012 189 580 2 287 3 056
Adv KD Moroka 2013 204 52 204 460
2012 189 189 378
AC Nissen 2013 204 91 204 499
2012 189 84 189 462
TMF Phaswana 2013 4 750 3522 5 102
2012 4 400 4162 4 816
MJD Ruck 2013 204 576 1 401 2 181
2012 189 533 1 352 2 074
Lord Smith of Kelvin, KT 2013 669 230 669 1 568
2012 533 213 533 1 279
PD Sullivan 2013 643 378 662 1 683
2012
EM Woods 2013 204 775 282 1 261
2012 189 679 207 1 075
Total 2013 7 898 4 385 6 914 352 19 549
Total 2012 6 634 3 609 5 675 416 473 16 807
1 This amount was payable to DDB Band by Gymnogene Investments, a company in which he is a 33% shareholder and which had a contractual relationship with the group. The payment arises from a share of the profit on disposal of private equity investments in a portfolio sourced and arranged by Gymnogene Investments on behalf of the group. Although the contractual relationship expired on 31 December 2004, payments of this nature are likely to recur if and when the remaining investments in this portfolio are realised on a profitable basis to the group.
2 Use of motor vehicle and club subscriptions.
Emoluments and share incentives of directors andprescribed officers

267
Our business Our performance Governance andtransparency
Annual financialstatements
Additionalinformation
Fixed remuneration
Services as directors of
SBSAR’000
SBSA committee
feesR’000
Services as directors of
group subsidiaries
R’000Other benefits
R’000
Totalcompensation
for the yearR’000
Former non-executive directorsMC Ramaphosa1 2013 85 37 84 206
2012 189 82 189 460
SE Jonah KBE2 2013
2012 78 78 156
Sir PR Judge2 2013
2012 222 221 443
Total 2013 85 37 84 206
Total 2012 489 82 488 1 059
1 Retired on 30 May 2013.2 Retired on 31 May 2012.

268 The Standard Bank of South Africa Annual report 2013
Annual financial statements Annexure F – emoluments and share incentives of directors and prescribed officers continued
Fixed remuneration
Cash portion of package
R’000
Other benefits
R’000
Pension contributions
R’000
Total fixed
remunerationR’000 % change
Executive directors
BJ Kruger* 2013 6 559 315 1 088 7 962 12
2012 6 014 132 963 7 109
SK Tshabalala* 2013 6 384 274 990 7 648 31
2012 5 098 270 482 5 850
SP Ridley* 2013 4 900 286 624 5 810 7
2012 4 617 246 572 5 435
Former executive directors
JH Maree4# 2013 1 119 90 185 1 394
2012 6 345 470 997 7 812
PG Wharton-Hood5# 2013 4 558 225 767 5 550
2012 6 008 191 966 7 165
Prescribed officers
DC Munro 2013 4 596 200 641 5 437
PL Schlebusch 2013 4 476 199 595 5 270
1 In order to align incentive payments with the performance period to which they relate, the above variable remuneration relates to the year under review irrespective of when payment is made.
2 The DBS post 2011, described on page 265, is an equity-settled share scheme. The final value of the award is dependent on the performance of the group’s share price. The deferred award is issued in the following financial year.
3 Awards granted to key senior executives in March 2013 for the EGS are valued using the Black-Scholes methodology and are subject to a performance condition as set out on page 134 of the SBG AIR, over and above the duration of service.
4 Resigned as an executive director on 7 March 2013.5 Resigned as an executive director from the board on 14 August 2013.# JH Maree and PG Wharton-Hood were also prescribed officers of the group until the date of their resignation. * BJ Kruger, SK Tshabalala and SP Ridley were also prescribed officers of the group for 2012 and 2013.
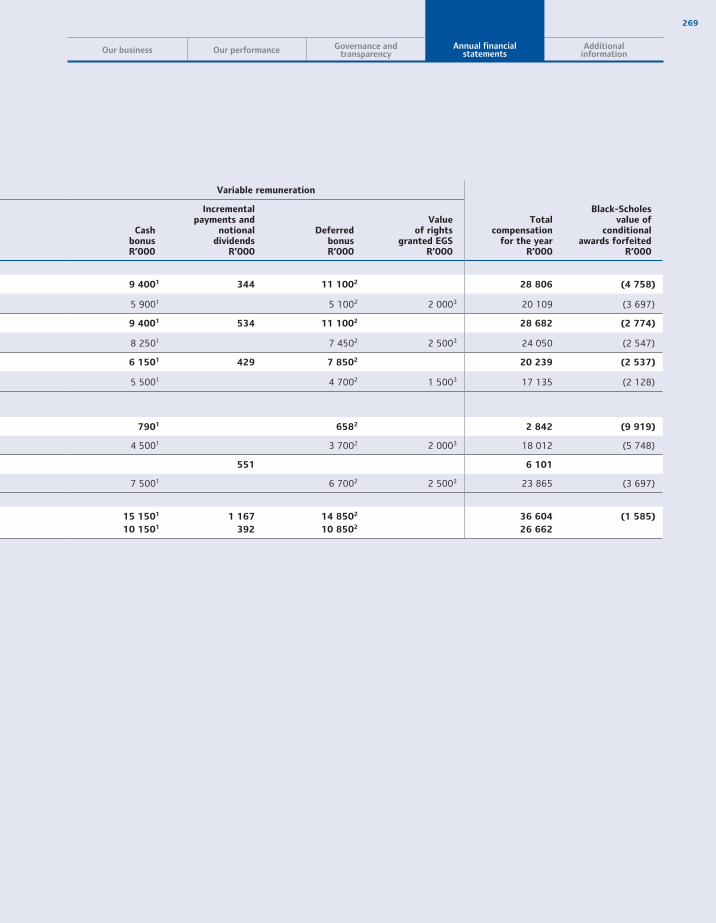
269
Our business Our performance Governance andtransparency
Annual financialstatements
Additionalinformation
Variable remuneration
Total compensation
for the yearR’000
Black-Scholes value of
conditional awards forfeited
R’000
Cash bonusR’000
Incremental payments and
notional dividends
R’000
Deferred bonusR’000
Value of rights
granted EGSR’000
9 4001 344 11 1002 28 806 (4 758)
5 9001 5 1002 2 0003 20 109 (3 697)
9 4001 534 11 1002 28 682 (2 774)
8 2501 7 4502 2 5003 24 050 (2 547)
6 1501 429 7 8502 20 239 (2 537)
5 5001 4 7002 1 5003 17 135 (2 128)
7901 6582 2 842 (9 919)
4 5001 3 7002 2 0003 18 012 (5 748)
551 6 101
7 5001 6 7002 2 5003 23 865 (3 697)
15 1501 1 167 14 8502 36 604 (1 585)
10 1501 392 10 8502 26 662
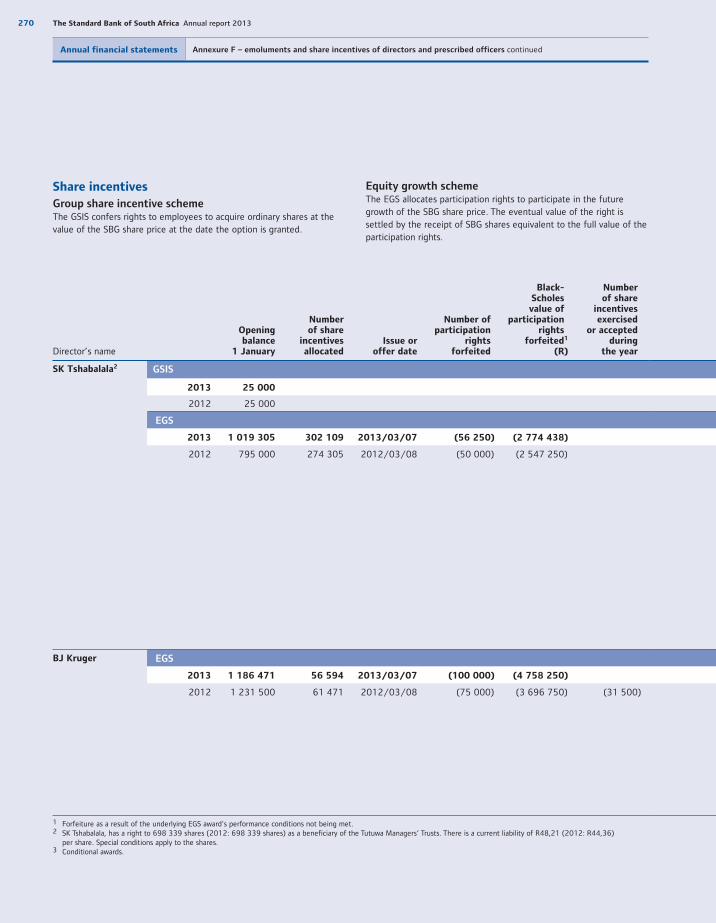
270 The Standard Bank of South Africa Annual report 2013
Annual financial statements Annexure F – emoluments and share incentives of directors and prescribed officers continued
Share incentives
Group share incentive schemeThe GSIS confers rights to employees to acquire ordinary shares at the value of the SBG share price at the date the option is granted.
Equity growth schemeThe EGS allocates participation rights to participate in the future growth of the SBG share price. The eventual value of the right is settled by the receipt of SBG shares equivalent to the full value of the participation rights.
Director’s name
Opening balance
1 January
Number of share
incentives allocated
Issue oroffer date
Number of participation
rightsforfeited
Black-Scholesvalue of
participationrights
forfeited1
(R)
Number of share
incentives exercised
or accepted during
the year
SK Tshabalala2 GSIS
2013 25 000
2012 25 000
EGS
2013 1 019 305 302 109 2013/03/07 (56 250) (2 774 438)
2012 795 000 274 305 2012/03/08 (50 000) (2 547 250)
BJ Kruger EGS
2013 1 186 471 56 594 2013/03/07 (100 000) (4 758 250)
2012 1 231 500 61 471 2012/03/08 (75 000) (3 696 750) (31 500)
1 Forfeiture as a result of the underlying EGS award's performance conditions not being met. 2 SK Tshabalala, has a right to 698 339 shares (2012: 698 339 shares) as a beneficiary of the Tutuwa Managers’ Trusts. There is a current liability of R48,21 (2012: R44,36)
per share. Special conditions apply to the shares. 3 Conditional awards.
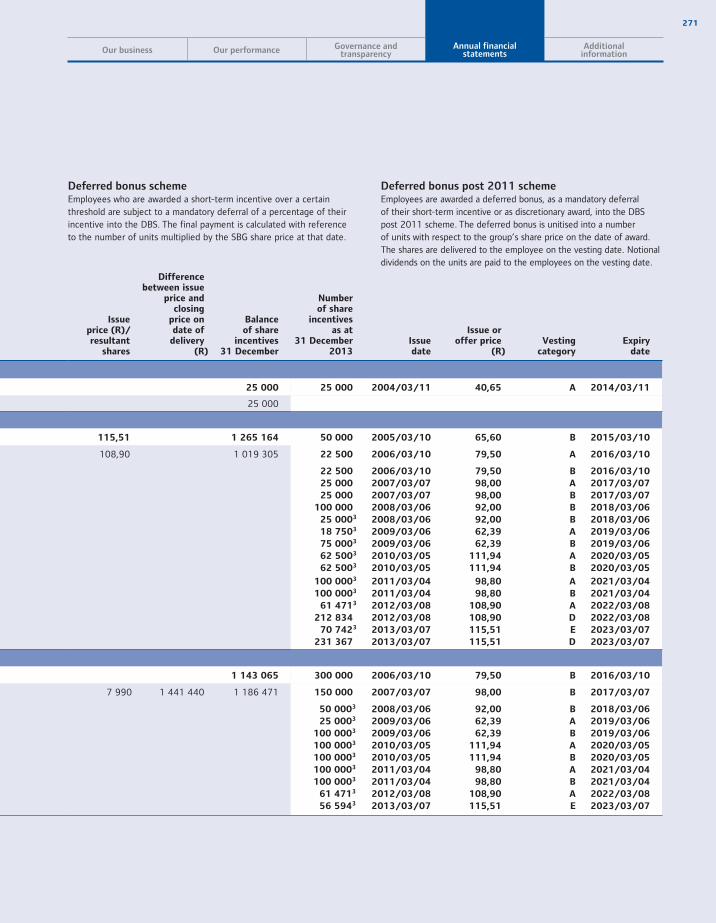
271
Our business Our performance Governance andtransparency
Annual financialstatements
Additionalinformation
Deferred bonus schemeEmployees who are awarded a short-term incentive over a certain threshold are subject to a mandatory deferral of a percentage of their incentive into the DBS. The final payment is calculated with reference to the number of units multiplied by the SBG share price at that date.
Deferred bonus post 2011 scheme Employees are awarded a deferred bonus, as a mandatory deferral of their short-term incentive or as discretionary award, into the DBS post 2011 scheme. The deferred bonus is unitised into a number of units with respect to the group’s share price on the date of award. The shares are delivered to the employee on the vesting date. Notional dividends on the units are paid to the employees on the vesting date.
Issue price (R)/resultant
shares
Difference between issue
price and closing
price on date of
delivery(R)
Balance of share
incentives 31 December
Number of share
incentives as at
31 December 2013
Issuedate
Issue oroffer price
(R)Vesting
categoryExpiry
date
25 000 25 000 2004/03/11 40,65 A 2014/03/11
25 000
115,51 1 265 164 50 000 2005/03/10 65,60 B 2015/03/10
108,90 1 019 305 22 500 2006/03/10 79,50 A 2016/03/10
22 500 2006/03/10 79,50 B 2016/03/10
25 000 2007/03/07 98,00 A 2017/03/07
25 000 2007/03/07 98,00 B 2017/03/07
100 000 2008/03/06 92,00 B 2018/03/06
25 0003 2008/03/06 92,00 B 2018/03/06
18 7503 2009/03/06 62,39 A 2019/03/06
75 0003 2009/03/06 62,39 B 2019/03/06
62 5003 2010/03/05 111,94 A 2020/03/05
62 5003 2010/03/05 111,94 B 2020/03/05
100 0003 2011/03/04 98,80 A 2021/03/04
100 0003 2011/03/04 98,80 B 2021/03/04
61 4713 2012/03/08 108,90 A 2022/03/08
212 834 2012/03/08 108,90 D 2022/03/08
70 7423 2013/03/07 115,51 E 2023/03/07
231 367 2013/03/07 115,51 D 2023/03/07
1 143 065 300 000 2006/03/10 79,50 B 2016/03/10
7 990 1 441 440 1 186 471 150 000 2007/03/07 98,00 B 2017/03/07
50 0003 2008/03/06 92,00 B 2018/03/06
25 0003 2009/03/06 62,39 A 2019/03/06
100 0003 2009/03/06 62,39 B 2019/03/06
100 0003 2010/03/05 111,94 A 2020/03/05
100 0003 2010/03/05 111,94 B 2020/03/05
100 0003 2011/03/04 98,80 A 2021/03/04
100 0003 2011/03/04 98,80 B 2021/03/04
61 4713 2012/03/08 108,90 A 2022/03/08
56 5943 2013/03/07 115,51 E 2023/03/07

272 The Standard Bank of South Africa Annual report 2013
Annual financial statements Annexure F – emoluments and share incentives of directors and prescribed officers continued
Share incentives continued
Director’s name
Opening balance
1 January
Number of share
incentives allocated
Issue oroffer date
Number of participation
rightsforfeited
Black-Scholesvalue of
participationrights
forfeited1
(R)
Number of share
incentives exercised
or accepted during
the year
SP Ridley EGS
2013 669 383 42 445 2013/03/07 (52 500) (2 537 250) (75 000)
2012 725 000 36 883 2012/03/08 (42 500) (2 127 925) (50 000)
DC Munro EGS
2013 765 221 131 690 2013/03/07 (31 250) (1 584 875)
1 Forfeiture as a result of the underlying EGS award's performance conditions not being met.2 Conditional awards.

273
Our business Our performance Governance andtransparency
Annual financialstatements
Additionalinformation
Issue price (R)/resultant
shares
Difference between issue
price and closing
price on date of
delivery(R)
Balance of share
incentives 31 December
Number of share
incentives as at
31 December 2013
Issuedate
Issue oroffer price
(R)Vesting
categoryExpiry
date
20 358 2 962 500 584 328 75 000 2006/03/10 79,50 B 2016/03/10
12 175 2 170 000 669 383 15 000 2007/03/07 98,00 A 2017/03/07
15 000 2007/03/07 98,00 B 2017/03/07
25 0002 2008/03/06 92,00 B 2018/03/06
15 0002 2009/03/06 62,39 A 2019/03/06
60 0002 2009/03/06 62,39 B 2019/03/06
100 0002 2010/03/05 111,94 A 2020/03/05
100 0002 2011/03/04 98,80 A 2021/03/04
100 0002 2011/03/04 98,80 B 2021/03/04
36 8832 2012/03/08 108,90 A 2022/03/08
42 4452 2013/03/07 115,51 E 2023/03/07
115,51 865 661 50 000 2005/03/10 65,60 B 2015/03/10
250 000 2006/03/10 79,50 B 2016/03/10
23 750 2007/03/07 98,00 A 2017/03/07
23 750 2007/03/07 98,00 B 2017/03/07
12 5002 2008/03/06 92,00 B 2018/03/06
50 000 2008/03/06 92,00 B 2018/03/06
12 5002 2009/03/06 62,39 A 2019/03/06
50 0002 2009/03/06 62,39 B 2019/03/06
50 000 2010/03/05 111,94 A 2020/03/05
50 000 2010/03/05 111,94 B 2020/03/05
50 0002 2011/03/04 98,80 A 2021/03/04
50 0002 2011/03/04 98,80 B 2021/03/04
61 4712 2012/03/08 108,90 A 2022/03/08
60 948 2013/03/07 115,51 D 2023/03/07
70 7422 2013/03/07 115,51 E 2023/03/07

274 The Standard Bank of South Africa Annual report 2013
Annual financial statements Annexure F – emoluments and share incentives of directors and prescribed officers continued
Share incentives continued
Director’s name
Opening balance
1 January
Number of share
incentives allocated
Issue oroffer date
Number of participation
rights forfeited
Black-Scholesvalue of
participationrights
forfeited1
(R)
Number of share
incentives exercised
or accepted during
the year
PL Schlebusch EGS
2013 411 258 56 594 2013/03/07
JH Maree EGS
2013 1 561 471 56 594 2013/03/07 (218 750) (9 919 063)
2012 1 625 000 61 471 2012/03/08 (125 000) (5 747 500)
PG Wharton-Hood GSIS
2013 125 000 (125 000)
2012 250 000 (125 000)
EGS
2013 1 236 471 70 742 2013/03/07 (738 463)3 (50 000)
(125 000)
(300 000)
(93 750)
2012 1 250 000 61 471 2012/03/08 (75 000) (3 696 750)
1 Forfeiture as a result of the underlying EGS award's performance conditions not being met. 2 Conditional awards.3 Forfeiture as a result of resignation from the group on 15 September 2013.

275
Our business Our performance Governance andtransparency
Annual financialstatements
Additionalinformation
Issue price (R)/
resultant shares
Difference between issue
price and closing
price on date of
delivery (R)
Balance of share
incentives 31 December
Number of share
incentives as at
31 December 2013
Issuedate
Issue oroffer price
(R)Vesting
categoryExpiry
date
115,51 467 852 20 000 2007/03/07 98,00 A 2017/03/07
20 000 2007/03/07 98,00 B 2017/03/07
9 375 2008/03/06 92,00 A 2018/03/06
37 500 2008/03/06 92,00 B 2018/03/06
25 000 2008/03/06 92,00 B 2018/03/06
12 500 2009/03/06 62,39 A 2019/03/06
50 000 2009/03/06 62,39 B 2019/03/06
50 000 2010/03/05 111,94 A 2020/03/05
50 000 2010/03/05 111,94 B 2020/03/05
50 0002 2011/03/04 98,80 A 2021/03/04
50 0002 2011/03/04 98,80 B 2021/03/04
36 8832 2012/03/08 108,90 A 2022/03/08
56 5942 2013/03/07 115,51 E 2023/03/07
115,51 1 399 315 375 000 2006/03/10 79,50 A 2016/03/10
108,90 1 561 471 125 000 2006/03/10 79,50 B 2016/03/10
125 0002 2008/03/06 92,00 B 2018/03/06
31 2502 2009/03/06 62,39 A 2019/03/06
125 0002 2009/03/06 62,39 B 2019/03/06
500 0002 2010/03/05 111,94 A 2020/03/05
61 4712 2012/03/08 108,90 A 2022/03/08
56 5942 2013/03/07 115,51 E 2023/03/08
40,65 9 322 500
27,90 10 641 250 125 000
242 100 500
34 544 6 043 750
63 270 10 335 000
8 966 1 495 312
108,90 1 236 471
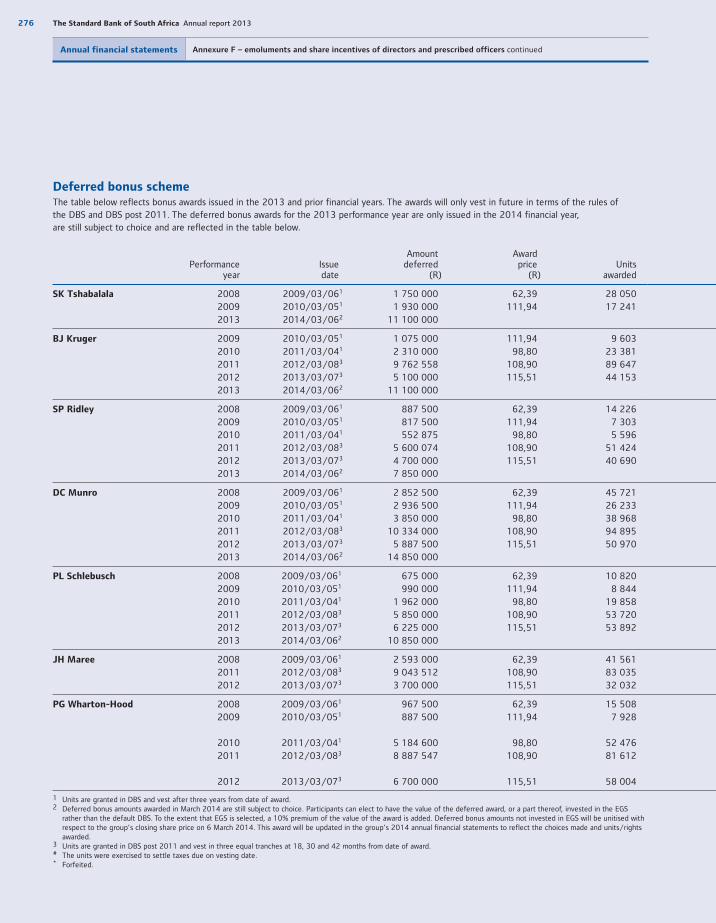
276 The Standard Bank of South Africa Annual report 2013
Annual financial statements Annexure F – emoluments and share incentives of directors and prescribed officers continued
Deferred bonus schemeThe table below reflects bonus awards issued in the 2013 and prior financial years. The awards will only vest in future in terms of the rules ofthe DBS and DBS post 2011. The deferred bonus awards for the 2013 performance year are only issued in the 2014 financial year, are still subject to choice and are reflected in the table below.
Performanceyear
Issuedate
Amountdeferred
(R)
Award price
(R)Units
awarded
SK Tshabalala 2008 2009/03/061 1 750 000 62,39 28 0502009 2010/03/051 1 930 000 111,94 17 2412013 2014/03/062 11 100 000
BJ Kruger 2009 2010/03/051 1 075 000 111,94 9 6032010 2011/03/041 2 310 000 98,80 23 3812011 2012/03/083 9 762 558 108,90 89 6472012 2013/03/073 5 100 000 115,51 44 1532013 2014/03/062 11 100 000
SP Ridley 2008 2009/03/061 887 500 62,39 14 2262009 2010/03/051 817 500 111,94 7 3032010 2011/03/041 552 875 98,80 5 5962011 2012/03/083 5 600 074 108,90 51 4242012 2013/03/073 4 700 000 115,51 40 6902013 2014/03/062 7 850 000
DC Munro 2008 2009/03/061 2 852 500 62,39 45 7212009 2010/03/051 2 936 500 111,94 26 2332010 2011/03/041 3 850 000 98,80 38 9682011 2012/03/083 10 334 000 108,90 94 8952012 2013/03/073 5 887 500 115,51 50 9702013 2014/03/062 14 850 000
PL Schlebusch 2008 2009/03/061 675 000 62,39 10 8202009 2010/03/051 990 000 111,94 8 8442010 2011/03/041 1 962 000 98,80 19 8582011 2012/03/083 5 850 000 108,90 53 7202012 2013/03/073 6 225 000 115,51 53 8922013 2014/03/062 10 850 000
JH Maree 2008 2009/03/061 2 593 000 62,39 41 5612011 2012/03/083 9 043 512 108,90 83 0352012 2013/03/073 3 700 000 115,51 32 032
PG Wharton-Hood 2008 2009/03/061 967 500 62,39 15 5082009 2010/03/051 887 500 111,94 7 928
2010 2011/03/041 5 184 600 98,80 52 4762011 2012/03/083 8 887 547 108,90 81 612
2012 2013/03/073 6 700 000 115,51 58 004
1 Units are granted in DBS and vest after three years from date of award. 2 Deferred bonus amounts awarded in March 2014 are still subject to choice. Participants can elect to have the value of the deferred award, or a part thereof, invested in the EGS
rather than the default DBS. To the extent that EGS is selected, a 10% premium of the value of the award is added. Deferred bonus amounts not invested in EGS will be unitised with respect to the group’s closing share price on 6 March 2014. This award will be updated in the group’s 2014 annual financial statements to reflect the choices made and units/rights awarded.
3 Units are granted in DBS post 2011 and vest in three equal tranches at 18, 30 and 42 months from date of award.# The units were exercised to settle taxes due on vesting date.* Forfeited.
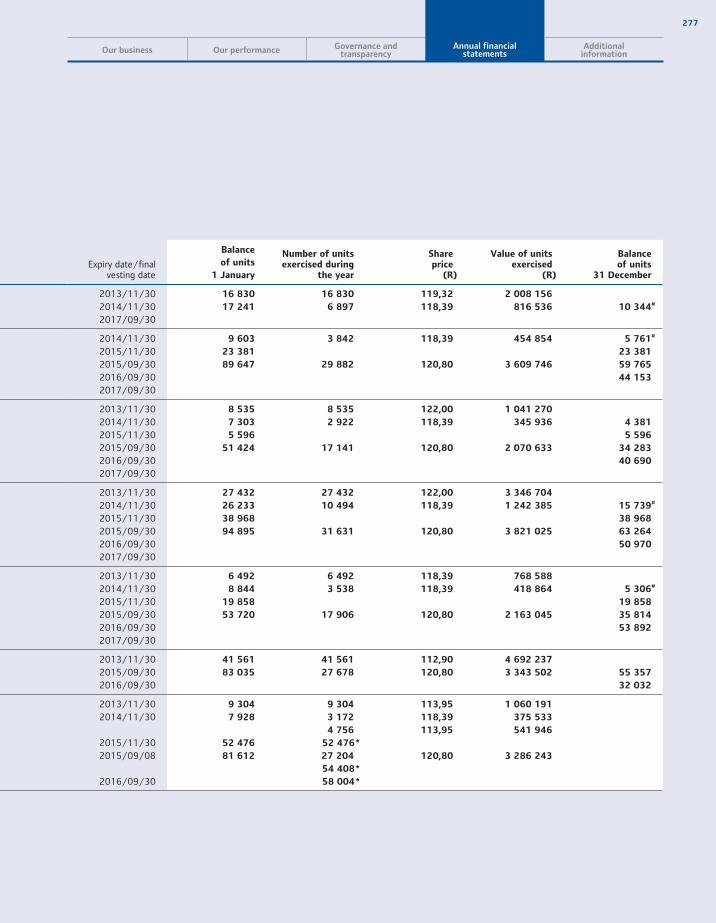
277
Our business Our performance Governance andtransparency
Annual financialstatements
Additionalinformation
Expiry date/finalvesting date
Balance
of units
1 January
Number of unitsexercised during
the year
Shareprice
(R)
Value of unitsexercised
(R)
Balanceof units
31 December
2013/11/30 16 830 16 830 119,32 2 008 156
2014/11/30 17 241 6 897 118,39 816 536 10 344#
2017/09/30
2014/11/30 9 603 3 842 118,39 454 854 5 761#
2015/11/30 23 381 23 381
2015/09/30 89 647 29 882 120,80 3 609 746 59 765
2016/09/30 44 153
2017/09/30
2013/11/30 8 535 8 535 122,00 1 041 270
2014/11/30 7 303 2 922 118,39 345 936 4 381
2015/11/30 5 596 5 596
2015/09/30 51 424 17 141 120,80 2 070 633 34 283
2016/09/30 40 690
2017/09/30
2013/11/30 27 432 27 432 122,00 3 346 704
2014/11/30 26 233 10 494 118,39 1 242 385 15 739#
2015/11/30 38 968 38 968
2015/09/30 94 895 31 631 120,80 3 821 025 63 264
2016/09/30 50 970
2017/09/30
2013/11/30 6 492 6 492 118,39 768 588
2014/11/30 8 844 3 538 118,39 418 864 5 306#
2015/11/30 19 858 19 858
2015/09/30 53 720 17 906 120,80 2 163 045 35 814
2016/09/30 53 892
2017/09/30
2013/11/30 41 561 41 561 112,90 4 692 237
2015/09/30 83 035 27 678 120,80 3 343 502 55 357
2016/09/30 32 032
2013/11/30 9 304 9 304 113,95 1 060 191
2014/11/30 7 928 3 172 118,39 375 533
4 756 113,95 541 946
2015/11/30 52 476 52 476*
2015/09/08 81 612 27 204 120,80 3 286 243
54 408*
2016/09/30 58 004*
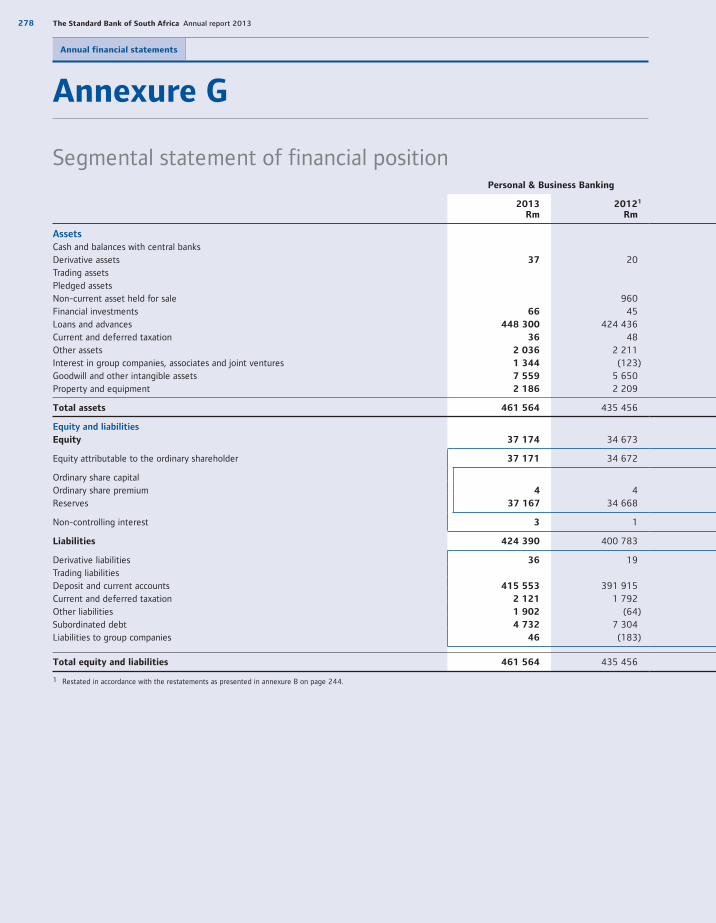
278 The Standard Bank of South Africa Annual report 2013
Annual financial statements
Annexure G
Personal & Business Banking
2013Rm
20121
Rm
Assets
Cash and balances with central banksDerivative assets 37 20Trading assetsPledged assetsNon-current asset held for sale 960Financial investments 66 45Loans and advances 448 300 424 436Current and deferred taxation 36 48Other assets 2 036 2 211Interest in group companies, associates and joint ventures 1 344 (123)Goodwill and other intangible assets 7 559 5 650Property and equipment 2 186 2 209
Total assets 461 564 435 456
Equity and liabilities
Equity 37 174 34 673
Equity attributable to the ordinary shareholder 37 171 34 672
Ordinary share capitalOrdinary share premium 4 4Reserves 37 167 34 668
Non-controlling interest 3 1
Liabilities 424 390 400 783
Derivative liabilities 36 19Trading liabilitiesDeposit and current accounts 415 553 391 915Current and deferred taxation 2 121 1 792Other liabilities 1 902 (64)Subordinated debt 4 732 7 304Liabilities to group companies 46 (183)
Total equity and liabilities 461 564 435 456
1 Restated in accordance with the restatements as presented in annexure B on page 244.
Segmental statement of financial position
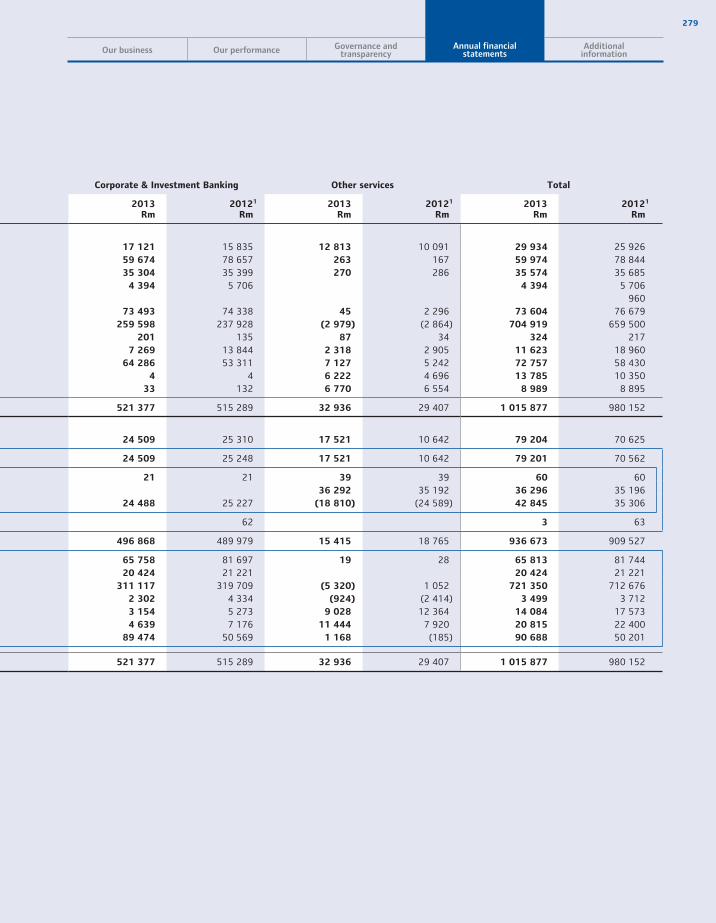
279
Our business Our performance Governance andtransparency
Annual financialstatements
Additionalinformation
Corporate & Investment Banking Other services Total
2013Rm
20121
Rm2013
Rm20121
Rm2013
Rm20121
Rm
17 121 15 835 12 813 10 091 29 934 25 926 59 674 78 657 263 167 59 974 78 844 35 304 35 399 270 286 35 574 35 685
4 394 5 706 4 394 5 706 960
73 493 74 338 45 2 296 73 604 76 679 259 598 237 928 (2 979) (2 864) 704 919 659 500
201 135 87 34 324 217 7 269 13 844 2 318 2 905 11 623 18 960
64 286 53 311 7 127 5 242 72 757 58 430 4 4 6 222 4 696 13 785 10 350
33 132 6 770 6 554 8 989 8 895
521 377 515 289 32 936 29 407 1 015 877 980 152
24 509 25 310 17 521 10 642 79 204 70 625
24 509 25 248 17 521 10 642 79 201 70 562
21 21 39 39 60 60 36 292 35 192 36 296 35 196
24 488 25 227 (18 810) (24 589) 42 845 35 306
62 3 63
496 868 489 979 15 415 18 765 936 673 909 527
65 758 81 697 19 28 65 813 81 744 20 424 21 221 20 424 21 221
311 117 319 709 (5 320) 1 052 721 350 712 676 2 302 4 334 (924) (2 414) 3 499 3 712 3 154 5 273 9 028 12 364 14 084 17 573 4 639 7 176 11 444 7 920 20 815 22 400
89 474 50 569 1 168 (185) 90 688 50 201
521 377 515 289 32 936 29 407 1 015 877 980 152
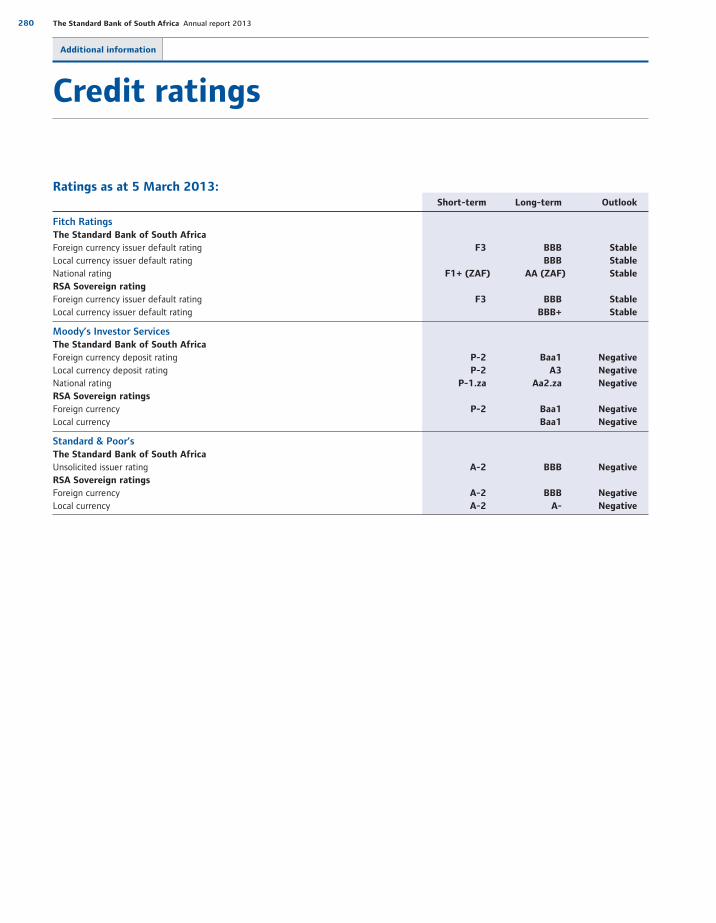
280 The Standard Bank of South Africa Annual report 2013
Additional information
Credit ratings
Ratings as at 5 March 2013: Short-term Long-term Outlook
Fitch Ratings
The Standard Bank of South Africa
Foreign currency issuer default rating F3 BBB Stable
Local currency issuer default rating BBB Stable
National rating F1+ (ZAF) AA (ZAF) Stable
RSA Sovereign rating
Foreign currency issuer default rating F3 BBB Stable
Local currency issuer default rating BBB+ Stable
Moody’s Investor Services
The Standard Bank of South Africa
Foreign currency deposit rating P-2 Baa1 Negative
Local currency deposit rating P-2 A3 Negative
National rating P-1.za Aa2.za Negative
RSA Sovereign ratings
Foreign currency P-2 Baa1 Negative
Local currency Baa1 Negative
Standard & Poor’s
The Standard Bank of South Africa
Unsolicited issuer rating A-2 BBB Negative
RSA Sovereign ratings
Foreign currency A-2 BBB Negative
Local currency A-2 A- Negative
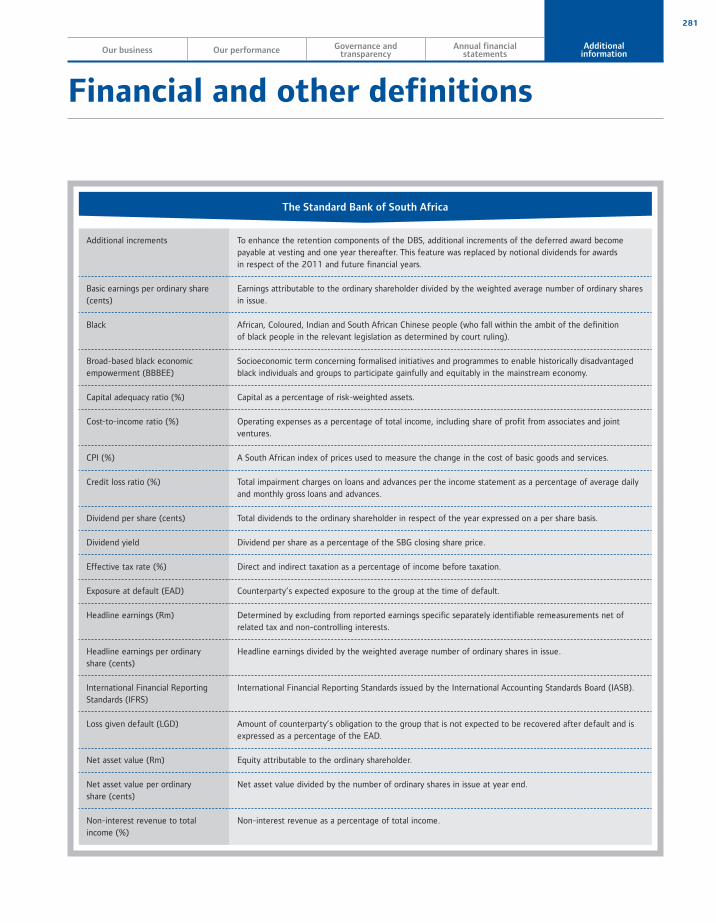
281
Our business Our performance Governance andtransparency
Annual financialstatements
Additionalinformation
Financial and other definitions
Additional increments To enhance the retention components of the DBS, additional increments of the deferred award become payable at vesting and one year thereafter. This feature was replaced by notional dividends for awards in respect of the 2011 and future financial years.
Basic earnings per ordinary share (cents)
Earnings attributable to the ordinary shareholder divided by the weighted average number of ordinary shares in issue.
Black African, Coloured, Indian and South African Chinese people (who fall within the ambit of the definition of black people in the relevant legislation as determined by court ruling).
Broad-based black economic empowerment (BBBEE)
Socioeconomic term concerning formalised initiatives and programmes to enable historically disadvantaged black individuals and groups to participate gainfully and equitably in the mainstream economy.
Capital adequacy ratio (%) Capital as a percentage of risk-weighted assets.
Cost-to-income ratio (%) Operating expenses as a percentage of total income, including share of profit from associates and joint ventures.
CPI (%) A South African index of prices used to measure the change in the cost of basic goods and services.
Credit loss ratio (%) Total impairment charges on loans and advances per the income statement as a percentage of average daily and monthly gross loans and advances.
Dividend per share (cents) Total dividends to the ordinary shareholder in respect of the year expressed on a per share basis.
Dividend yield Dividend per share as a percentage of the SBG closing share price.
Effective tax rate (%) Direct and indirect taxation as a percentage of income before taxation.
Exposure at default (EAD) Counterparty’s expected exposure to the group at the time of default.
Headline earnings (Rm) Determined by excluding from reported earnings specific separately identifiable remeasurements net of related tax and non-controlling interests.
Headline earnings per ordinary share (cents)
Headline earnings divided by the weighted average number of ordinary shares in issue.
International Financial Reporting Standards (IFRS)
International Financial Reporting Standards issued by the International Accounting Standards Board (IASB).
Loss given default (LGD) Amount of counterparty’s obligation to the group that is not expected to be recovered after default and is expressed as a percentage of the EAD.
Net asset value (Rm) Equity attributable to the ordinary shareholder.
Net asset value per ordinary share (cents)
Net asset value divided by the number of ordinary shares in issue at year end.
Non-interest revenue to total income (%)
Non-interest revenue as a percentage of total income.
The Standard Bank of South Africa
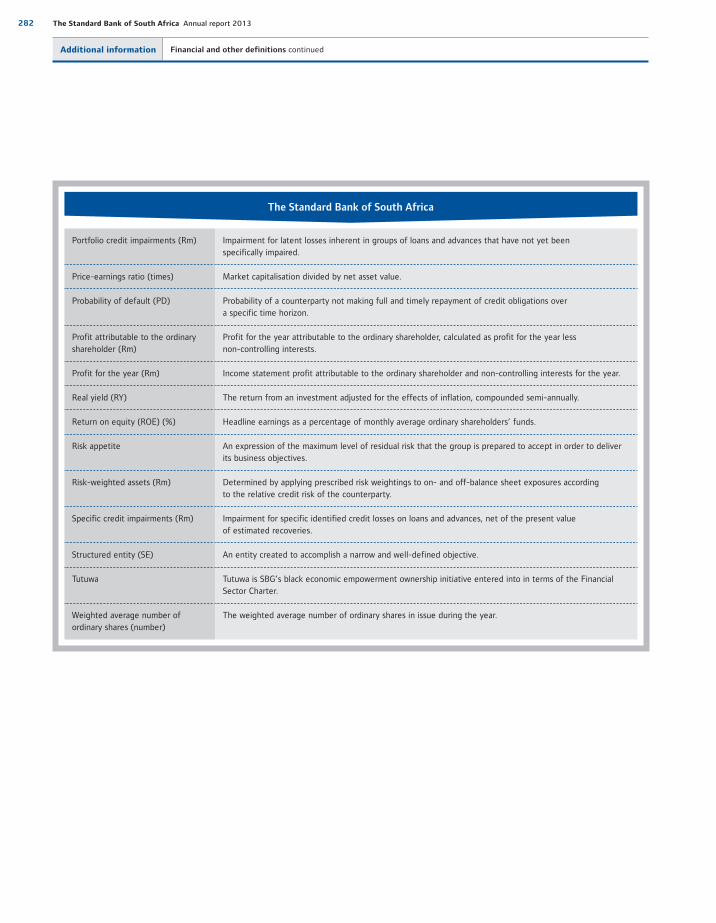
282 The Standard Bank of South Africa Annual report 2013
Portfolio credit impairments (Rm) Impairment for latent losses inherent in groups of loans and advances that have not yet been specifically impaired.
Price-earnings ratio (times) Market capitalisation divided by net asset value.
Probability of default (PD) Probability of a counterparty not making full and timely repayment of credit obligations over a specific time horizon.
Profit attributable to the ordinary shareholder (Rm)
Profit for the year attributable to the ordinary shareholder, calculated as profit for the year less non-controlling interests.
Profit for the year (Rm) Income statement profit attributable to the ordinary shareholder and non-controlling interests for the year.
Real yield (RY) The return from an investment adjusted for the effects of inflation, compounded semi-annually.
Return on equity (ROE) (%) Headline earnings as a percentage of monthly average ordinary shareholders’ funds.
Risk appetite An expression of the maximum level of residual risk that the group is prepared to accept in order to deliver its business objectives.
Risk-weighted assets (Rm) Determined by applying prescribed risk weightings to on- and off-balance sheet exposures according to the relative credit risk of the counterparty.
Specific credit impairments (Rm) Impairment for specific identified credit losses on loans and advances, net of the present value of estimated recoveries.
Structured entity (SE) An entity created to accomplish a narrow and well-defined objective.
Tutuwa Tutuwa is SBG’s black economic empowerment ownership initiative entered into in terms of the Financial Sector Charter.
Weighted average number ofordinary shares (number)
The weighted average number of ordinary shares in issue during the year.
The Standard Bank of South Africa
Additional information Financial and other definitions continued

283
Acronyms and abbreviations
A
AGM Annual general meeting
AIR SBG annual integrated report
AIRB Advanced internal ratings-based
ALCO Asset and liability committee
AMA Advanced measurement approach
ATM Automated teller machine
B
Banks Act South African Banks Act 94 of 1990
BASA Banking Association of South Africa
Basel Basel Capital Accord
BBBEE Broad-based black economic empowerment
BCBS Basel Committee on Banking Supervision
BCM Business continuity management
BEE Black economic empowerment
BIS Bank of International Settlements
Blue Banner Blue Banner Securitisation Vehicle RC1 Proprietary Limited
Board The Standard Bank of South Africa board of directors
BTC Blue Titanium Conduit Limited
BTV Balance-to-value
C
CAGR Compound annual growth rate
CET I Common equity tier I
CGT Capital gains tax
CGU Cash-generating unit
CIB Corporate & Investment Banking
The code The group’s code of ethics
Companies Act/the Act
South African Companies Act 71 of 2008
The company The Standard Bank of South Africa Limited
CPI Consumer price index
CR Country risk grade
CRO Chief risk officer
CSI Corporate social investment
CTO Chief technology officer
D
D – SIB Domestic systemically important bank
DBS Deferred bonus scheme
dti codes Department of Trade and Industry Codes of Good Practice for Broad-Based Black Economic Empowerment
E
EAD Exposure at default
EGS Equity growth scheme
EUR Euro
F
FCC Financial crime control
FS Codes Financial Services Sector Codes
FSB Financial Services Board
G
G –SIB Global systemically important bank
GAC Group audit committee
GBCSA Green Building Council of South Africa
GBP British pound sterling
GCCO Group chief compliance officer
GDP Gross domestic profit
GORC Group operational risk committee
GRCMC Group risk and capital management committee
GROC SBG risk oversight committee
The group The Standard Bank of South Africa Limited and its subsidiaries
GSIS Group share incentive scheme
H
HIV Human immunodeficiency virus
I
IA Internal audit
IAS International Accounting Standards
IASB International Accounting Standards Board
ICAAP Internal capital adequacy assessment process
ICAS Independent Counselling and Advisory Services
ICBC Industrial and Commercial Bank of China Limited
ICR Individual capital requirement
IFRS International Financial Reporting Standards
IOR Integrated operational risk
IRB Internal ratings-based
IRRBB Interest rate risk in the banking book
ISDA International Swaps and Derivatives Association
IT Information technology
J
JIBAR Johannesburg interbank agreed rate
JSE JSE Limited, the licensed securities exchange in Johannesburg
Our business Our performance Governance andtransparency
Annual financialstatements
Additionalinformation
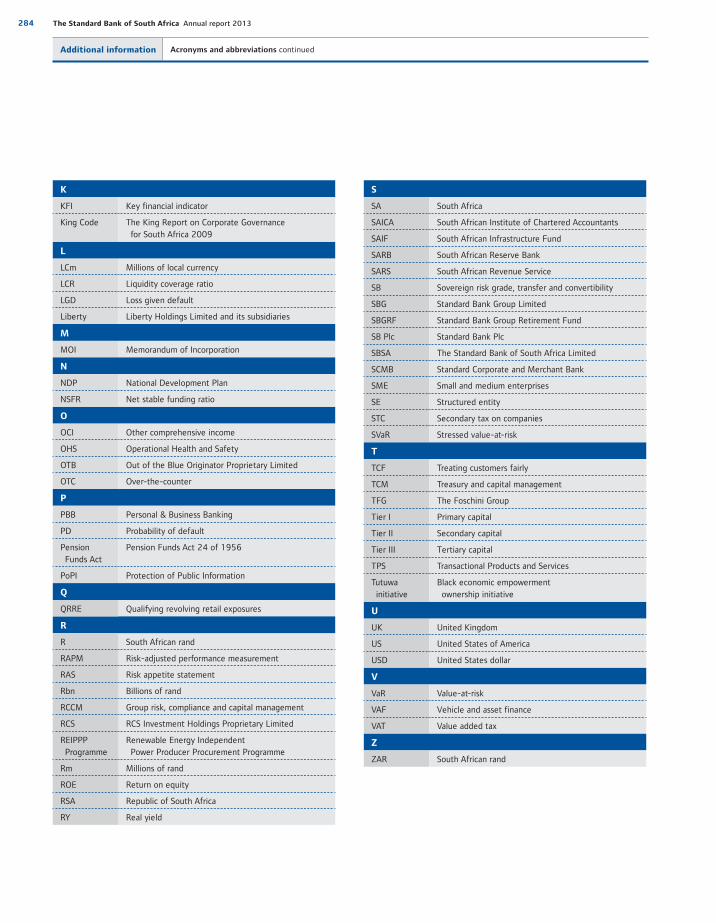
284 The Standard Bank of South Africa Annual report 2013
K
KFI Key financial indicator
King Code The King Report on Corporate Governance for South Africa 2009
L
LCm Millions of local currency
LCR Liquidity coverage ratio
LGD Loss given default
Liberty Liberty Holdings Limited and its subsidiaries
M
MOI Memorandum of Incorporation
N
NDP National Development Plan
NSFR Net stable funding ratio
O
OCI Other comprehensive income
OHS Operational Health and Safety
OTB Out of the Blue Originator Proprietary Limited
OTC Over-the-counter
P
PBB Personal & Business Banking
PD Probability of default
Pension Funds Act
Pension Funds Act 24 of 1956
PoPI Protection of Public Information
Q
QRRE Qualifying revolving retail exposures
R
R South African rand
RAPM Risk-adjusted performance measurement
RAS Risk appetite statement
Rbn Billions of rand
RCCM Group risk, compliance and capital management
RCS RCS Investment Holdings Proprietary Limited
REIPPP Programme
Renewable Energy Independent Power Producer Procurement Programme
Rm Millions of rand
ROE Return on equity
RSA Republic of South Africa
RY Real yield
S
SA South Africa
SAICA South African Institute of Chartered Accountants
SAIF South African Infrastructure Fund
SARB South African Reserve Bank
SARS South African Revenue Service
SB Sovereign risk grade, transfer and convertibility
SBG Standard Bank Group Limited
SBGRF Standard Bank Group Retirement Fund
SB Plc Standard Bank Plc
SBSA The Standard Bank of South Africa Limited
SCMB Standard Corporate and Merchant Bank
SME Small and medium enterprises
SE Structured entity
STC Secondary tax on companies
SVaR Stressed value-at-risk
T
TCF Treating customers fairly
TCM Treasury and capital management
TFG The Foschini Group
Tier I Primary capital
Tier II Secondary capital
Tier III Tertiary capital
TPS Transactional Products and Services
Tutuwa initiative
Black economic empowerment ownership initiative
U
UK United Kingdom
US United States of America
USD United States dollar
V
VaR Value-at-risk
VAF Vehicle and asset finance
VAT Value added tax
Z
ZAR South African rand
Additional information Acronyms and abbreviations continued
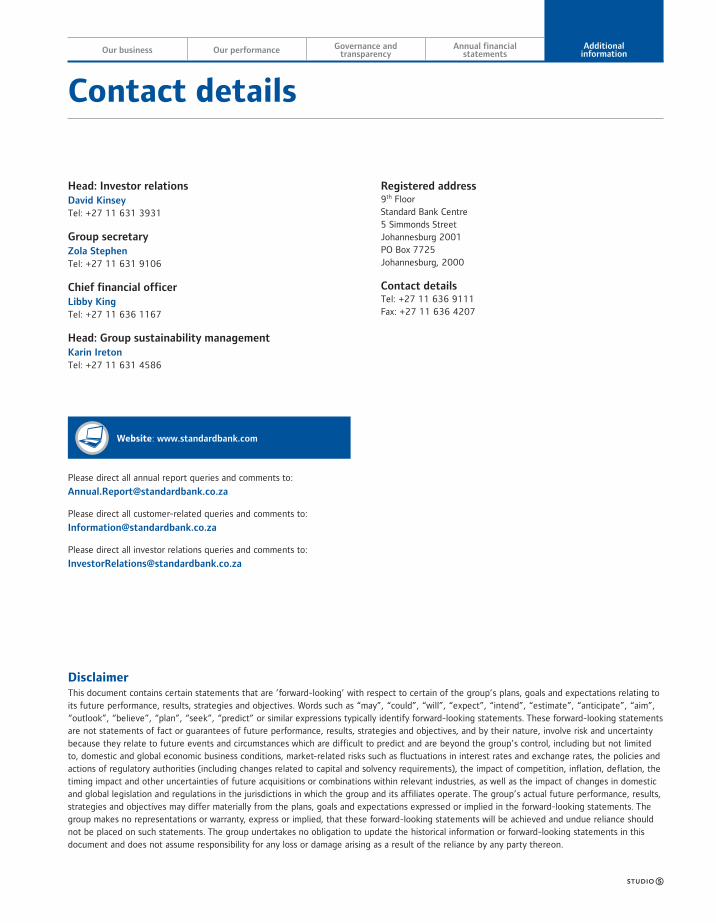
Contact details
DisclaimerThis document contains certain statements that are ’forward-looking’ with respect to certain of the group’s plans, goals and expectations relating to its future performance, results, strategies and objectives. Words such as “may”, “could”, “will”, “expect”, “intend”, “estimate”, “anticipate”, “aim”, “outlook”, “believe”, “plan”, “seek”, “predict” or similar expressions typically identify forward-looking statements. These forward-looking statements are not statements of fact or guarantees of future performance, results, strategies and objectives, and by their nature, involve risk and uncertainty because they relate to future events and circumstances which are difficult to predict and are beyond the group’s control, including but not limited to, domestic and global economic business conditions, market-related risks such as fluctuations in interest rates and exchange rates, the policies and actions of regulatory authorities (including changes related to capital and solvency requirements), the impact of competition, inflation, deflation, the timing impact and other uncertainties of future acquisitions or combinations within relevant industries, as well as the impact of changes in domestic and global legislation and regulations in the jurisdictions in which the group and its affiliates operate. The group’s actual future performance, results, strategies and objectives may differ materially from the plans, goals and expectations expressed or implied in the forward-looking statements. The group makes no representations or warranty, express or implied, that these forward-looking statements will be achieved and undue reliance should not be placed on such statements. The group undertakes no obligation to update the historical information or forward-looking statements in this document and does not assume responsibility for any loss or damage arising as a result of the reliance by any party thereon.
Head: Investor relationsDavid Kinsey Tel: +27 11 631 3931
Group secretaryZola StephenTel: +27 11 631 9106
Chief financial officerLibby KingTel: +27 11 636 1167
Head: Group sustainability managementKarin IretonTel: +27 11 631 4586
Registered address9th FloorStandard Bank Centre5 Simmonds StreetJohannesburg 2001PO Box 7725Johannesburg, 2000
Contact detailsTel: +27 11 636 9111Fax: +27 11 636 4207
Website: www.standardbank.com
Please direct all annual report queries and comments to:
Please direct all customer-related queries and comments to:
Please direct all investor relations queries and comments to:
Our business Our performance Governance andtransparency
Annual financialstatements
Additionalinformation

www.standardbank.com
Financing renewable energy is an opportunity for us to support real sustainable development
at scale, underpinned by a strong business case. With a number of projects we support coming
on stream, it is clear that renewable energy sources are fast taking their place as a substantial
contributor to South Africa’s energy mix.