the stardalur magnetic anomaly revisited—new...
TRANSCRIPT

A
cbcateosmtbTstoath©
K
H
0
Physics of the Earth and Planetary Interiors 164 (2007) 119–141
The Stardalur magnetic anomaly revisited—New insightsinto a complex cooling and alteration history
C. Vahle a,∗, A. Kontny a,1, H.P. Gunnlaugsson b, L. Kristjansson c
a Geologisch-Palaontologisches Institut, Ruprecht-Karls-University Heidelberg, INF 234, D-69120 Heidelberg, Germanyb Institute of Physics and Astronomy, Aarhus University, Ny Munkegade, DK-8000 Arhus C, Denmark
c Institute of Earth Sciences, University of Iceland, Sturlugata 7, Askja, IS-101 Reykjavık, Iceland
Received 21 December 2006; received in revised form 21 May 2007; accepted 14 June 2007
bstract
This study provides new rock magnetic and magneto-mineralogical data including Mossbauer spectroscopy of basaltic drillores from the Stardalur volcanic complex, Iceland, in order to better understand the strong magnetic anomaly, which is causedy an extraordinary high natural remanent magnetization (NRM). NRM and magnetic susceptibility (χ) display a positive linearorrelation (R2 = 0.81) and reach very high values up to 121 A/m and 148 × 10−3 SI. Although a Curie temperature of 580 ◦Cnd a Verwey transition at about −160 ◦C is indicative of magnetite, χ–T heating experiments in argon and air atmosphere andhermal demagnetization measurements of NRM revealed a slight cation-deficiency. According to induced remanent magnetizationxperiments the remanence is carried solely by this low coercive phase. Minor titanomaghemite with a TC at about 340 ◦C onlyccurs in samples with larger oxide grains (20–80 �m). High vesicle abundances and the exsolution texture of Fe–Ti oxides suggestubaerial extrusion of the lava. A high oxygen fugacity (probably above the NNO buffer) and a low Ti/(Ti + Fe) ratio of the basalticelt are suggested as a precondition for high concentration of magnetic minerals and therefore high primary TRM. During high
emperature oxidation, ilmenite exsolution-lamellae, developed in titanomagnetite, and symplectic magnetite (+ pyroxene) formedy the breakdown of olivine. This secondary magnetite, grown at temperatures above the Curie temperature, increases the primaryRM. Early stage hydrothermal alteration (below about 375 ◦C) led to maghemitization of (titano)magnetite, clearly indicated byhrinkage cracks and irreversible χ–T curves. During later stage hydrothermal alteration, NRM intensity increased slightly dueo the growth of secondary magnetite at lower temperatures (about 250–300 ◦C). This hydrothermally formed magnetite acquirednly a low CRM but increased magnetic susceptibility significantly. According to our results it is suggested, that hydrothermal
lteration does not necessarily lower remanent magnetization, but contributes to an increase in magnetization. The interplay of thehree factors melt composition, small grain sizes of secondary magnetite due to decomposition of silicates and new formation underydrothermal conditions caused the strong magnetic anomaly at the surface.2007 Elsevier B.V. All rights reserved.
eywords: Magnetic anomaly; Rock magnetism; NRM; Magnetite; Maghem
∗ Corresponding author.E-mail address: [email protected] (C. Vahle).
1 Present address: Geologisches Institut, Universitat Karlsruhe (TH),ertzstr. 16, D-76187 Karlsruhe, Germany.
031-9201/$ – see front matter © 2007 Elsevier B.V. All rights reserved.doi:10.1016/j.pepi.2007.06.004
ite; Basalt alteration
1. Introduction
Aeromagnetic surveys of Iceland have revealed dif-ferent types of magnetic anomalies. Mainly, they arealigned subparallel to currently active or extinct spread-ing zones. The resulting magnetic lineations are related

120 C. Vahle et al. / Physics of the Earth and Planetary Interiors 164 (2007) 119–141
Fig. 1. (a) Location of the Stardalur volcanic complex and present zones of volcanism and crustal spreading (shaded areas) in Iceland (additionally,the glacier (jokull) outlines are shown; modified from Jonsson et al., 1991); (b) geological map with location of the drill site (modified fromFridleifsson and Kristjansson, 1972, lines A–B and C–D refer to cross-sections described therein).

nd Pla
t(maiasKb
apKfaSbc6biioa
dSaamtnmrnmdF(msecfa9maf
at
C. Vahle et al. / Physics of the Earth a
o tilted blocks and/or changes in magnetic polarityJonsson et al., 1991). Additionally, several localizedagnetic anomalies of 5–10 km in size are associ-
ted with volcanic centers. Some have high magneticntensity (positive anomaly in a negatively polarizedrea), others show magnetic lows (negative anomalyurrounded by strong positive anomaly), like in therafla–Namafjall area (Fig. 1a). The latter type seems toe related to hydrothermal activity in geothermal fields.
The strongest of the localized positive magneticnomalies is observed at the Stardalur volcanic com-lex, 20 km NE of Reykjavik (Fig. 1, Fridleifsson andristjansson, 1972). According to unpublished data
rom Th. Sigurgeirsson from an aeromagnetic surveyt 100–200 m above ground, the maximum field of thetardalur magnetic anomaly is 59 �T, whereas the neigh-oring area gives only 51 �T. The Stardalur volcanicomplex is of Olduvai age (∼1.8 Ma) and consists of a.5 km caldera, cone-sheet swarm, sills and a laccolithicody. At the northern rim of the caldera, intensive fractur-ng enabled hydrothermal activity. The volcanic complexs embedded into thick successions of basaltic lava flowsf Quaternary age, intercalated with hyaloclastite ridgesnd glacial deposits (Fridleifsson, 1973).
In the years 1969–1970, a 200 m deep borehole wasrilled into the area of maximum field intensity of thetardalur magnetic anomaly. A first rock magnetic char-cterization of these drill cores was done by Fridleifssonnd Kristjansson (1972). The average natural remanentagnetization (NRM) was 61 A/m. This is about 10
imes higher than the average of other Icelandic Quater-ary basalts (Kristjansson, 1970). From thermomagneticeasurements done in air, the authors found magnetite
esulting from high temperature oxidized titanomag-etite, which is in some cases subsequently oxidized toaghemite. Due to stable NRM directions and no time
ependence they excluded a strong viscous overprint.urthermore, the small scattering of the NRM inclination81 ± 4◦) pointed to a short time interval of lava emplace-ent (∼2000 years). Based on saturation remanence and
usceptibility data, Fridleifsson and Kristjansson (1972)stimated the magnetite content to be 2.5 vol.%. Theyoncluded this high magnetite content to be one reasonor the unusually strong magnetic anomaly. Addition-lly, they assumed a high paleomagnetic field intensity of3 ± 6 �T at the time of NRM acquisition (actual Earthagnetic field at Stardalur is 52 �T, IGRF-10). It was
lso suggested, that rather small grain sizes resulting
rom rapid cooling or oxidation contribute to high NRM.Helgason et al. (1990) inferred similar conclusionsnd suggested an additional self-amplification effect ofhe magnetic field due to hydrothermal reheating from
netary Interiors 164 (2007) 119–141 121
below. The oxidized titanomagnetite (magnetite withCurie temperature of 580 ◦C) shows still ferromagneticbehavior despite elevated temperatures due to hydrother-mal heating and therefore increases the local magneticfield. According to Mossbauer spectra they found nei-ther maghemite nor Ti in the magnetic phase, only pureand homogeneous magnetite. But Helgason et al. (1990)stated already “that the key of the riddle lies in the alter-ation process”.
Using Mossbauer spectra and scanning electronmicroscopy (SEM) Gunnlaugsson et al. (2006) haveshown the influence of oxidized olivine on magneticproperties of olivine basalt. According to their study,submicroscopic single-domain magnetite, which formedby oxidation of olivine, increases NRM. Therefore, theNRM of basalts containing olivine could be an order ofmagnitude higher than that of olivine-free basalts. Fur-thermore, Stardalur samples have been found to have arather high Fe-content of ∼12 wt.% Fe (Steinthorssonand Sigvaldason, 1971), with an unusually large propor-tion of Fe situated in magnetite (about 30% of the area ofthe Mossbauer spectra, 5–10% is more usual; Helgasonet al., 1990; Gunnlaugsson et al., 2003).
According to these previous studies following factorsseem to account for the unusually high magnetizations ofthe Stardalur rocks: (1) small grain size, (2) high temper-ature oxidized titanomagnetite, resulting in almost puremagnetite, (3) magnetite oxidized from olivine and (4)higher (local) paleomagnetic field intensity. Althoughit seems that probably all of these factors contribute,the geological processes that led to the anomalouslyhigh magnetization of the Stardalur rocks are not fullyunderstood. Although Mossbauer studies revealed puremagnetite as carrier of the magnetic properties (Helgasonet al., 1990; Gunnlaugsson et al., 2003, 2006) it is notfully clear up to now how the magnetite has actuallyformed and how the textural relations are. Therefore,we combined rock magnetic and magneto-mineralogicalmethods, in addition to thermomagnetic experiments,to find further clues to this extraordinary high mag-netization. A better understanding of the Stardaluranomaly may be an analogue for extraterrestrial mag-netic anomalies, e.g. observed on Mars, where strongcrustal anomalies are attributed to a high crustal rema-nence (e.g. Acuna et al., 1999). Models suggest magneticrocks of tenths of km thickness with remanent magneti-zation up to ∼20 A/m (Purucker et al., 2000).
2. Sample material and methods
We investigated drill cores of the 200 m deepStardalur borehole (Fig. 1b) drilled in the years 1969–70

122 C. Vahle et al. / Physics of the Earth and Pla
2 3 2
Fig. 2. Susceptibility profile of the Stardalur core and location of sam-ples (b, brecciated zone). The lithological boundaries are picked fromthe lithological profile described in Fridleifsson and Tomasson (1972).
(see above). The drill core revealed about 45 m of fresholivine tholeiitic lava flows and tuffs with low magneticintensity. Below that depth until at least 140 m, stronglymagnetic early Quaternary lavas follow (Fridleifssonand Kristjansson, 1972). Between 35 and 143 m wemeasured magnetic susceptibility on full cores (Fig. 2)using a hand-held kappameter (KT-5) from Geofyzika(now AGICO company). The measurement sensitivity is1 × 10−5 SI based on frequency changes of the operat-ing coil (10 kHz). The average distance between singlemeasurements was ∼21 cm, whereas not the entire corewas measured because of missing sections. Based onthe susceptibility profile we selected representative sam-ples, which reflect the observed susceptibility variations.From these samples, standard cylindrical specimens(2.5 cm in diameter, 2.1 cm high) were prepared for dif-ferent rock magnetic investigations.
The magnetic susceptibility (χ) was measured in the
laboratory on these specimens using KLF-3 susceptome-ter of Geofyzika (now AGICO company) at 30 A/mand 2000 Hz. The reliability and significance of rou-tine susceptibility measurements on drill cores usingnetary Interiors 164 (2007) 119–141
a hand-held kappameter were compared with labora-tory measurements. This test gives a linear relationshipbetween both these methods with a high correlationcoefficient (R2 = 0.99, n = 11), whereas a general shifttowards lower values for the hand-held kappameter mea-surements can be observed (y = 0.551 × −0.497). Usinghand-held kappameter measurements to reveal the pat-tern of magnetic susceptibility one must be aware thatthe hand-held kappameter values are lower than thosemeasured on standard cylindrical specimens.
For the temperature dependence (−194 to 0 andfrom room temperature to 700 ◦C) of magnetic sus-ceptibility (χ–T) a KLY-4S kappabridge (working with300 A/m and 875 Hz) combined with a CS-L/CS-3 appa-ratus (AGICO company) was used. Heating/cooling ratesrange between 3–4 and 11–14 ◦/min for the low temper-ature and high temperature run, respectively. The hightemperature runs were performed in an argon atmospherein order to avoid mineral reactions with oxygen duringheating (flow rate of 110 ml/min). Some samples werealso measured in an air flow of the same rate. The rawdata were corrected for the empty cryostat/furnace andnormalized to the susceptibility magnitude at 0 ◦C. TheNeel or Curie temperature (TN or TC) was determinedgraphically using the reciprocal susceptibility accordingto the suggestions of Petrovsky and Kapicka (2005).
Measurements of remanent magnetization were donewith a JR5A spinner magnetometer (AGICO company).For stability tests, alternating field demagnetization (AFdemagnetization) was performed in peak fields up to160 mT with a MI AFD 1.1 from Magnon Interna-tional. Stepwise thermal demagnetization up to 700 ◦Cwas done with the Thermal Demagnetizer MMTD1(magnetic measurements). Isothermal acquisition ofremanence (IRM) was measured using a commercialpower supply unit connected with a coil for fields upto ca. 90 mT. For selected samples IRM was appliedat fields of 1.25 T with an ASC Scientific ImpulseMagnetizer (IM-10-30) and subsequent stepwise thermaldemagnetization was performed with an ASC ScientificThermal Demagnetizer (TD-48) at the Laboratory forNatural Magnetism, ETH-Zurich.
Oxide textures were characterized using reflectedlight and scanning electron microscopy in backscattermode (LEO 440). Mineral chemical data were obtainedby electron microprobe (CAMECA SX51) at the Insti-tute of Mineralogy in Heidelberg. Standards used werepericlase (Mg), Al O (Al), wollastonite (Si), TiO (Ti),
Cr2O3 (Cr), rhodonite (Mn), and hematite (Fe). The rawdata were corrected with the PAP algorithm of Pouchonand Pichoir (1984). An acceleration voltage of 15 kV anda sample current of 20 nA were used.
C. Vahle et al. / Physics of the Earth and Pla
F3c
ai1dr
3
fsbhmaN1atobeba
n8
ig. 3. Magnetic susceptibility (measured at field amplitude of0 A/m) vs. natural remanent magnetization (NRM) of all sampleylinders.
Mossbauer spectra (done at the Institute of Physicsnd Astronomy of Aarhus University) were recordedn transmission geometry at room temperature using0–25 mCi 57Co:Rh sources mounted on conventionalrive systems. Isomer shifts (δ) and velocity are givenelative to the center of the spectrum of �-Fe.
. Results and interpretation
Table 1 summarizes the rock magnetic parametersrom the basaltic samples marked in Fig. 2. The magneticusceptibility pattern agrees quite well with lithologicaloundaries indicating changes in cooling and alterationistory. Natural remanent magnetization (NRM) versusagnetic susceptibility (χ) of all specimens displayspositive linear correlation with R2 = 0.81 (Fig. 3).RM and χ reach very high values up to 121 A/m and48 × 10−3 SI, respectively. These high values suggesthigh content of opaque minerals. A positive correla-
ion between the NRM and the estimated volume percentf the opaque minerals of some polished sections (seeelow) confirms this assumption (R2 = 0.69; n = 7). Anven better correlation with R2 = 0.75 has been foundetween magnetic susceptibility and the volume percent-
ge of the opaque minerals.Average values calculated for the strongly mag-etic samples below 43 m are 62.6 ± 23.8 A/m and2.4 ± 24.4 × 10⁻³ SI, respectively. These values fit
netary Interiors 164 (2007) 119–141 123
quite well to the average NRM intensity of 61 A/m for theStardalur rocks given by Fridleifsson and Kristjansson(1972). A comparison with NRM intensities and sus-ceptibilities of other Quaternary Icelandic rocks (about10 times less magnetic, see Kristjansson, 1970) and ofown unpublished data from surface rocks of the Reyk-janes peninsula (13.8 ± 6.2 A/m and 10.2 ± 4.0 × 10⁻³
SI; recent lava flows from fissure eruptions, shield vol-canoes and pillow lava, all younger than 20,000 years)emphasizes the unusually high values for the Stardalurbasalts. The Konigsberger ratio, Q-factor (ratio betweenremanent and induced magnetization), ranges between7.5 and 30.4, clearly indicating the predominance ofremanent magnetization over induced magnetization.Component analyses revealed only one stable charac-teristic remanence direction contributing to the NRM.In the following sections, we give a rock magnetic andmagneto-mineralogical characterization to better under-stand the nature of this extraordinary magnetic behavior.
3.1. Microscopic observations
According to the lithological descriptions given inFridleifsson and Tomasson (1972) the units below about45 m are altered olivine tholeiitic basalt. In the lowerpart of this section at ∼140 m depth, zeolite, montmo-rillonite and chlorite are reported. Based on our ownmacroscopic observations the main part of the core from44 down to 144 m consists of differently strong alteredfine-grained basalts with local carbonate and quartz fill-ings along cracks and veins. Two breccia zones at 81 and93 m, respectively, intercalate these basalts (see Fig. 2).In the lowermost part (ST138.1) many vesicles (about15 vol.%) with a diameter of 1–5 mm point to subaerialextrusion of the lava. These vesicles are filled with whiteand green minerals, probably the above described zeo-lite, montmorillonite and chlorite.
According to microscopic observations, the mainsilicates are subhedral (200–500 �m) or columnarplagioclase laths (60–800 �m in size). No olivineis observed, but in some samples altered areas of60–300 �m in size are found consisting of phyllosili-cates (predominantly chlorite), which could have beenformer olivine. According to their brown and greenishcolor, some of these altered areas could be iddingsite(submicroscopic melange of goethite, chlorite and phyl-losilicates), a low to intermediate temperature alterationproduct of olivine (Baker and Haggerty, 1967). But
also symplectic magnetite has been observed at someplaces (Fig. 4a), which is assumed to be a high tem-perature oxidation product of olivine. Based on heatingexperiments of olivine basalt from different localities,
124 C. Vahle et al. / Physics of the Earth and Planetary Interiors 164 (2007) 119–141
Table 1Rock magnetic properties of the Stardalur samples (no average values, data of single cylinders)
Sample Depth [m] Lithology NRM [A/m] Q χ (30 A/m)[10−3 SI]
MDF [mT] SIRM [A/m] opaque mineralcontent [vol.%]
ST36.1 36.1 Tuff 0.6 7.5 2.1 27 – –ST41.30 41.3 Hyaloclastite 17.7 16.4 25.9 32 883 6ST47.00 47.0 Basalt 42.0 14.8 68.3 23 – –ST53.60 53.6 Basalt 52.6 10.7 118.0 14 1941 11ST62.90 62.9 Basalt 80.3 20.5 93.9 24 3077 10ST74.90 74.9 Basalt 62.2 19.2 78.0 22 – –ST101.00 101.0 Basalt 90.5 18.4 118.0 18 2489 15ST111.45 111.5 Basalt 25.6 7.5 81.5 13 – 8ST117.50 117.5 Basalt 48.3 24.8 46.8 25 – 7ST135.15 135.2 Basalt 63.0 26.0 58.3 34 2414 9ST138.10 138.1 Basalt 99.2 30.4 78.5 23 – –
ated wiisothe
NRM: natural remanent magnetization, Q: Konigsberger ratio (calculmeasured at 30 A/m, MDF: median destructive field, SIRM: saturation
Haggerty and Baker (1967) stated that olivine oxidizes tomagnetite + enstatite or hematite + forsterite dependingon temperature and oxygen fugacity.
Additionally to clinopyroxene and plagioclase,opaque minerals, carbonate, quartz and chlorite occurin the Stardalur drill cores. Following opaque mineralshave been identified:
• titanomagnetite: dendritic, cruciform, skeletal toeuhedral grains, <1 �m and up to 130 �m in size;
• ilmenohematite: elongated skeletal to subhedralgrains of 12–100 �m;
• titanite: as alteration product of ilmenohematite andtitanomagnetite;
• sulfide phases: pyrite and chalcopyrite, subhedralgrains up to 300 �m;
• magnetite: net-like replacement products and vein fill-ings.
The total abundance of the opaque minerals was esti-mated from thin section observations and ranges between6 and 15 vol.% (see Table 1). The opaque mineral assem-blage is strongly dominated by titanomagnetite, whichhas been proved by the application of a ferrofluid (see,e.g. Kletetschka and Kontny, 2005). Because the fer-rofluid covers only magnetic phases like titanomagnetiteand magnetite, the coating with ferrofluid enables thediscrimination of, e.g. ilmenite and magnetite. Ilmeno-hematite and especially titanomagnetite show differenttextures and grain size populations, indicating differ-
ent cooling and crystallization histories of the basalts.Almost all titanomagnetite shows ilmenite exsolution-lamellae, resulting from high temperature oxidation(Fig. 4b). Some ilmenohematite shows lenses of rutileth a field intensity of 41.6 A/m), χ (30 A/m): magnetic susceptibilityrmal remanence at 1.25 T.
and probably hematite spots. In some cases sandwich-types are present. These textures are in accordance withthe oxidation stages C3/4 and R2-4 given by Haggerty(1991). Additionally, shrinkage cracks and a mottledtexture of the grains point to some degree of maghemi-tization of titanomagnetite (Fig. 4c). The sulfide phasesare of secondary origin, because they are often foundalong cracks and veins and are associated with carbonateand quartz (Fig. 4d). Some pyrite grains are altered andreplaced by magnetite (Fig. 4d) suggesting a change influid chemistry or physico-chemical conditions. There-fore, magnetite is not only produced by oxyexsolutionof titanomagnetite or breakdown of olivine but alsoby secondary growth. This magnetite shows a net-likeporous texture and small, 8–20 �m sized euhedral cubes(Fig. 4d). Fig. 4e shows the growth of such secondarymagnetite along a ∼20 �m wide vein. The marked areain Fig. 4e is shown with higher magnification in Fig. 4f.On the left side of the photograph, areas possibly repre-senting ilmenite-lamellae can be observed. These areasseem to be relics of exsolved titanomagnetite, whereboth, titanomagnetite and ilmenohematite have been dis-solved. The alteration products consisting of dark greyareas with needle-like crystals are too small to be reli-ably analyzed, but the data are very similar to an ilmenitecomposition with up to 9.4 wt.% MnO. For comparison,the homogeneous ilmenohematites have MnO contentsof 1.62–2.32 wt.%. In some cases the ilmenite-lamellaein titanomagnetite are dissolved and partly replaced bytitanite leaving behind a “ghost” texture (Fig. 4b). Also
some titanomagnetite is dissolved, which probably sup-plied the material for the growth of secondary magnetite(Fig. 4d–f; see also Section 4). These microscopic obser-vations imply that the secondary magnetite must be
C. Vahle et al. / Physics of the Earth and Planetary Interiors 164 (2007) 119–141 125
Fig. 4. Oxide textures of the Stardalur basalts show the processes affecting the magnetic minerals ((a) reflected light, in oil immersion and coatedwith ferrofluid, (b–f) SEM images taken in backscatter mode): (a) symplectic magnetite around former olivine during high temperature oxidation;(b) ilmenite-lamellae in titanomagnetite host (partly with dissolved ilmenite) during high temperature oxidation; (c) maghemitized titanomagnetitewith shrinkage cracks working as pathways for hydrothermal fluids altering the Fe–Ti oxides; (d) secondary pyrite (py) and magnetite (mt),associated with carbonate (ca), quartz (qz) and chalcopyrite (Cu-py); (e) secondary magnetite crystallized along veins; (f) the area marked in (e)w surroui ed).
cs
pgbsT
ith higher magnification showing relics of oxidized titanomagnetitelhm: ilmenohematite, plg: plagioclase, cpx: clinopyroxene, ox: oxidiz
onsidered for the interpretation of the high NRM inten-ity and χ-values.
For the strongly magnetic lower part of the Stardalurrofile two groups of oxide textures can be distin-
uished. Group 1 (Fig. 5a and b) is characterizedy rather dendritic and cruciform titanomagnetite withmall grain sizes of 5–10 �m (max. 20 �m in length).hese grains show exsolution textures typical for highnded by net-like, porous secondary magnetite (tmt: titanomagnetite,
temperature oxidation and shrinkage cracks indicatingmaghemitization. The high opaque mineral content ofup to 15 vol.% is reflected in the highest values forNRM intensity and χ (see also Fig. 3). This texture is
characteristic for rapid cooling as observed in subma-rine basalts or marginal parts of subaerial lava flows(e.g. Kontny et al., 2003). Vesicles of up to 1 mmare filled with predominantly chlorite, associated with
126 C. Vahle et al. / Physics of the Earth and Planetary Interiors 164 (2007) 119–141
nd 2 (Sa bimo
matite,
Fig. 5. Different oxide textures of representative samples for group 1 ato dendritic Fe–Ti oxides of small grain size comparing to group 2 withfor ST135.15 (c) and ST62.9 (d; tmt: titanomagnetite, ilhm: ilmenohe
pyroxene + quartz ± magnetite and carbonate + titanite,respectively. Whereas no ilmenohematite was found inthis group, the second group clearly contains ilmenohe-matite (Fig. 5c). The ilmenohematite grain sizes rangebetween 12 and 80 �m with partly elongated skele-tal shapes. The titanomagnetite shows a dense networkof ilmenite-lamellae, and shrinkage cracks (Fig. 5cand d). This second group shows a distinct bimodalgrain size population ranging from dendritic, cruciformto xenomorphic grains in the groundmass with lessthan 10 �m size to subhedral and euhedral grains with20–80 �m in size (Fig. 5d).
In contrast to the strongly magnetic lower part of theprofile the upper part at the top (around ST36.1) withvery low magnetic susceptibilities (Fig. 2) consists of agreenish to pale-grey, soft, tuffaceous rock. Below thistuffaceous rock a zone (∼4 m thick) of dark greenishto grey rocks with clasts less than 4 mm in size fol-
lows with low to intermediate χ-values (4–20 × 10−3SI). Microscopic observations revealed altered, roundedglass shards (palagonite) of up to 1 mm in size sur-rounded by carbonate and quartz. The boundaries of the
EM images in backscatter mode): group 1 (a and b, ST101.0): skeletaldal grain size spectrum with skeletal to euhedral and dendritic crystalsplg: plagioclase, chl: chlorite, cpx: clinopyroxene, ox: oxidized).
glass shards are lined with abundant opaque phases ofup to 20–30 �m size, but mostly <10 �m, with irregularshape. With respect to the χ-values, these are most likelytitanomagnetite with very low to no Ti content. The fer-rofluid is attracted to almost all opaque phases in thisrock. Additionally some sulfide phases (up to 40 �m)occur, of which some are found in titanomagnetite andtherefore, could have crystallized first and acted as nucleifor the Fe–Ti oxide.
3.2. Alternating field and thermal demagnetization
Alternating field (AF) at room temperature and in airatmosphere and thermal demagnetization experiments inair atmosphere were done to get information about thestability of remanence and the kind of mineral(s) car-rying the remanence. Generally, the median destructivefield (MDF, the field that is necessary to remove half
of the NRM) of the Stardalur basalts ranges between 13and 34 mT (Table 1). In comparison with AF demagneti-zation experiments done on crushed annealed magnetite(with TRM, thermoremanent magnetization, of 0.1 mT,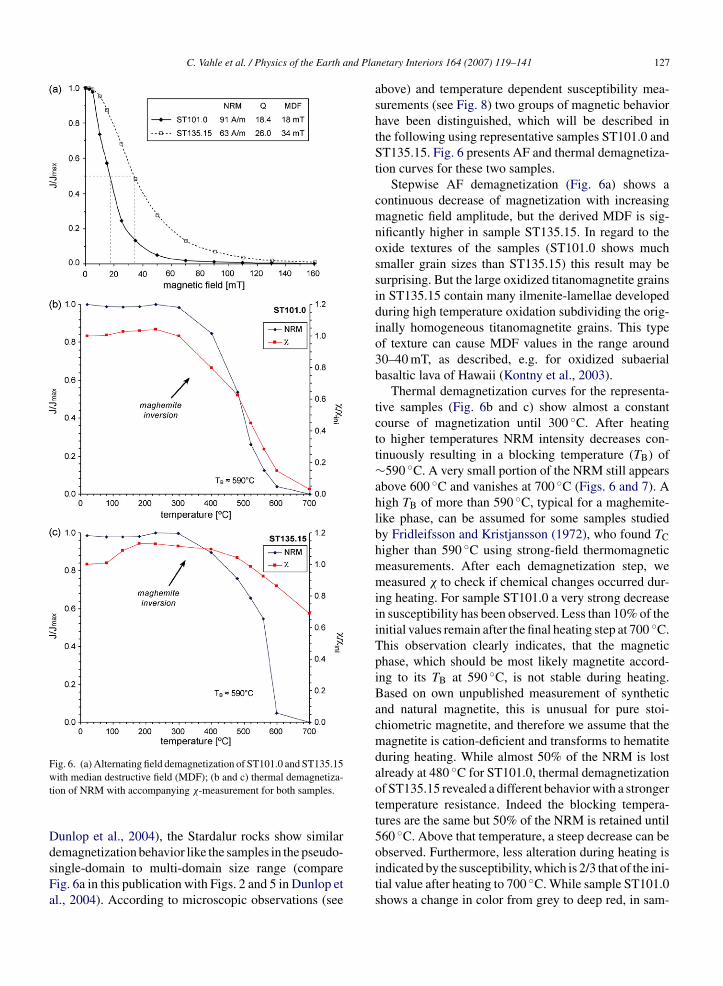
C. Vahle et al. / Physics of the Earth and Pla
Fig. 6. (a) Alternating field demagnetization of ST101.0 and ST135.15wt
DdsFa
ith median destructive field (MDF); (b and c) thermal demagnetiza-ion of NRM with accompanying χ-measurement for both samples.
unlop et al., 2004), the Stardalur rocks show similar
emagnetization behavior like the samples in the pseudo-ingle-domain to multi-domain size range (compareig. 6a in this publication with Figs. 2 and 5 in Dunlop etl., 2004). According to microscopic observations (seenetary Interiors 164 (2007) 119–141 127
above) and temperature dependent susceptibility mea-surements (see Fig. 8) two groups of magnetic behaviorhave been distinguished, which will be described inthe following using representative samples ST101.0 andST135.15. Fig. 6 presents AF and thermal demagnetiza-tion curves for these two samples.
Stepwise AF demagnetization (Fig. 6a) shows acontinuous decrease of magnetization with increasingmagnetic field amplitude, but the derived MDF is sig-nificantly higher in sample ST135.15. In regard to theoxide textures of the samples (ST101.0 shows muchsmaller grain sizes than ST135.15) this result may besurprising. But the large oxidized titanomagnetite grainsin ST135.15 contain many ilmenite-lamellae developedduring high temperature oxidation subdividing the orig-inally homogeneous titanomagnetite grains. This typeof texture can cause MDF values in the range around30–40 mT, as described, e.g. for oxidized subaerialbasaltic lava of Hawaii (Kontny et al., 2003).
Thermal demagnetization curves for the representa-tive samples (Fig. 6b and c) show almost a constantcourse of magnetization until 300 ◦C. After heatingto higher temperatures NRM intensity decreases con-tinuously resulting in a blocking temperature (TB) of∼590 ◦C. A very small portion of the NRM still appearsabove 600 ◦C and vanishes at 700 ◦C (Figs. 6 and 7). Ahigh TB of more than 590 ◦C, typical for a maghemite-like phase, can be assumed for some samples studiedby Fridleifsson and Kristjansson (1972), who found TChigher than 590 ◦C using strong-field thermomagneticmeasurements. After each demagnetization step, wemeasured χ to check if chemical changes occurred dur-ing heating. For sample ST101.0 a very strong decreasein susceptibility has been observed. Less than 10% of theinitial values remain after the final heating step at 700 ◦C.This observation clearly indicates, that the magneticphase, which should be most likely magnetite accord-ing to its TB at 590 ◦C, is not stable during heating.Based on own unpublished measurement of syntheticand natural magnetite, this is unusual for pure stoi-chiometric magnetite, and therefore we assume that themagnetite is cation-deficient and transforms to hematiteduring heating. While almost 50% of the NRM is lostalready at 480 ◦C for ST101.0, thermal demagnetizationof ST135.15 revealed a different behavior with a strongertemperature resistance. Indeed the blocking tempera-tures are the same but 50% of the NRM is retained until560 ◦C. Above that temperature, a steep decrease can be
observed. Furthermore, less alteration during heating isindicated by the susceptibility, which is 2/3 that of the ini-tial value after heating to 700 ◦C. While sample ST101.0shows a change in color from grey to deep red, in sam-
128 C. Vahle et al. / Physics of the Earth and Pla
Fig. 7. (a) Acquisition of isothermal remanent magnetization (IRM)for ST101.0 and ST135.15 (Jrs: saturation remanence); (b and c)thermal demagnetization of saturated IRM after the Lowrie method
(Lowrie, 1990): first 1.25 T are applied along the z-axis, then 500 mTparallel to the y-axis and finally 200 mT in direction of the x-axis toidentify contributions of minerals with different coercivity.ple ST135.15 only some areas have changed to red colorafter heating above 600 ◦C. These observations are cor-
roborated by the Mossbauer findings, which show lessalteration of the ST135.15 sample. At least three expla-nations are conceivable up to now for this difference: (1)ST101.0 exhibits a stronger degree of cation-deficiencynetary Interiors 164 (2007) 119–141
resulting in stronger thermal instability, (2) ST135.15is less sensitive to maghemitization because some partsof the oxidized titanomagnetite grains resist oxidationdue to the large grain size, and (3) ST101.0 containsmore magnetite derived from oxidation of olivine, thismagnetite has lower MDF and less thermal stability thanmagnetite derived from exsolution of titanomagnetite.Further experiments have been conducted to unravelthese questions.
3.3. IRM acquisition and thermal demagnetizationof three-component IRM
The acquisition of isothermal remanent magnetiza-tion (IRM) up to 1.25 T at ambient temperature gavesimilar results as the AF demagnetization curves. ForST135.15 higher field amplitudes are needed to impressa magnetization: ST101.0 is saturated already at 200 mT,while a magnetic field of at least 400 mT is needed forST135.15 (Fig. 7a). This is again a factor of two asalready observed for the MDF values. Despite the dif-ference in NRM intensity, the saturation remanence isnearly the same for both samples.
Thermal demagnetization of three-component IRMis used to identify the influence of different coerciveminerals on the magnetization (Lowrie, 1990). In thisexperiment, the maximum field of 1.25 T is applied par-allel to the z-axis of the sample cylinder, then 500 mTalong the y-axis and the lowest field of 200 mT in direc-tion of the x-axis. Subsequent thermal demagnetizationof IRM with respect to the axis of applied field is shownin Fig. 7b and c. For both samples a similar behav-ior can be observed. The initial decrease until 150 ◦Cis attributed to some kind of viscous remanent mag-netization, which would disappear after some time ofrelaxation (A. Hirt, personal communication, 2006). Athigher temperatures for both samples a more or lesscontinuous decrease in IRM intensity, typical for multi-domain magnetite, can be observed with TB of ∼510 and615 ◦C for ST101.0 and 580 and 615 ◦C for ST135.15,respectively. The IRM is almost entirely carried by thelow coercive phase (x-axis, 200 mT) suggesting thatthere is no contribution of an ilmenohematite phase oranother high coercive mineral like, e.g. goethite to theremanent magnetization of the Stardalur rocks. Only forST135.15 a small influence of a higher coercive phase isseen due to higher IRM intensity of y-axis. This obser-vation is in agreement with the IRM acquisition curve
(Fig. 7a) and is probably related to the intense exsolutiontexture of the titanomagnetite grains and/or the occur-rence of cation-deficient (titano)magnetite (Ozdemir etal., 1993).
nd Pla
3
ctrmo
p(i(mmtns
Ftm
C. Vahle et al. / Physics of the Earth a
.4. Temperature dependent magnetic susceptibility
Temperature dependent magnetic susceptibility (χ–Turves) is a quick and very sensitive method for the iden-ification of magnetic phases. Furthermore, the degree ofeversibility of the heating and cooling run allows an esti-ate of phase changes, which can be interpreted in terms
f the stability of the original magnetic phases.Representative χ–T curves for several selected sam-
les are shown in Fig. 8. For the hyaloclastite sampleST41.3) from the top of the profile a peak in susceptibil-ty at −159 ◦C is observed in a first low temperature runFig. 8a), which can be related to the Verwey transition ofagnetite. Usually, this crystallographic transition from
onoclinic to cubic symmetry occurs in the tempera-ure range −163 to −153 ◦C (Verwey, 1939). Due toon-stoichiometry or impurities this transition can beuccessively shifted towards lower temperatures or dis-
ig. 8. Examples of temperature dependent susceptibility measurements doneemperature intervals at which irreversibility occur (solid line: heating, dashed
easurement, respectively).
netary Interiors 164 (2007) 119–141 129
appears (Kakol and Honig, 1989; Ozdemir et al., 1993;Moskowitz et al., 1998). During heating in argon atmo-sphere, a drop in susceptibility at about 584 ◦C indicatesthe TC of magnetite, confirming the low temperatureinterpretation. In the cooling run only slight to mod-erate irreversibility is observed. The χ–T curves of allother samples in this study are relatively similar. Allsamples show a Verwey transition with peak temper-atures between −160 and −154 ◦C indicating smallvariations in the degree of oxidation of magnetite (interms of non-stoichiometry). The Curie temperatures arevery consistent and range from 580 to 584 ◦C. For somesamples a Hopkinson peak just below TC is observed,suggesting small grain sizes (Fig. 8a and c). During heat-
ing in argon atmosphere a more or less developed humpat about 120–380 ◦C is observed in these samples.According to χ–T curves, again the two groups ofmagnetic behavior can be distinguished (Fig. 8b and c).
in argon (a–c); (d) stepwise heating in argon of ST135.15 to display theline: cooling (also indicated by arrows) and repeated low temperature

and Pla
130 C. Vahle et al. / Physics of the EarthGroup 1 (ST101.0) is characterized by a peak at the Ver-wey transition, one Curie temperature at 583 ◦C and avery good reversibility of the heating and cooling branchduring measurement in an argon atmosphere. A secondlow temperature measurement shows a slightly higherVerwey transition temperature than the first low temper-ature measurement (Fig. 8b). Group 2 (ST135.15) alsodisplays the peak at the Verwey transition but the mea-surement between room temperature and 700 ◦C shows asecond magnetic phase in the heating run with a magnetictransition (or phase transition?) temperature at 340 ◦C.This phase is unstable during the heating experiment andin the cooling run a phase with a magnetic transitiontemperature at about 140 ◦C occurs instead. Instability
of some magnetic phases during heating is reported inseveral studies (e.g. Keefer and Shive, 1980; O’Reilly,1983) and the hump from our study can be most likelyinterpreted as a TC or inversion of (titano)maghemite.Fig. 9. Temperature dependent susceptibility for ST101.0 (a) and ST135.15 ((the inset shows the low temperature measurement with higher resolution); (cdecrease in susceptibility which results in poor reversibility; (d) stepwise heairreversibility starts (solid line: heating, dashed line: cooling (also indicated b
netary Interiors 164 (2007) 119–141
Another possible candidate to explain the unstable phasecould be ilmenohematite with intermediate composi-tion. But remanence experiments (see Fig. 7) excludethe presence of a higher coercive ferrimagnetic phase.Furthermore, electron microprobe analysis of ilmenohe-matite gave only Ti-rich compositions near ilmenite withTN well below room temperature.
In order to better define the onset of irreversibil-ity, stepwise heating experiments in argon atmosphere(Fig. 8d) were done. We first heated the sample to 100 ◦Cand cooled it, then we heated the same sample to 200 ◦Cand cooled it again. These heating–cooling cycles wererepeated up to 700 ◦C (for clarity only the measurementsup to 450 ◦C are displayed in Fig. 8d). According to this
experiment the phase with the magnetic transition tem-perature at 140 ◦C appears first when the sample is heatedup to 350 ◦C (measurement 4). This is clear evidence,that the breakdown of the phase with the TC of aboutb) done in air with subsequent re-measurement of the heated material) multiple heating in air to 700 ◦C of ST101.0 showing the successiveting in air of ST135.15 to display the temperature intervals at whichy arrows) and repeated low temperature measurement, respectively).

nd Pla
3wshf(astwimr
ailStaflwttoiTtioTtTisploiriAmoawii(c
t
C. Vahle et al. / Physics of the Earth a
40 ◦C is directly related to the formation of the phaseith the TC at 140 ◦C. Furthermore, our experiment has
hown, that this phase, once formed, is stable duringeating. Curie temperatures at about 140 ◦C are reportedor ferrihydroxides, e.g. goethite (�FeOOH) at 120 ◦CDunlop and Ozdemir, 1997) or ferroxyhite (�FeOOH)t 177 ◦C (Murad, 1996). But ferrihydroxides are nottable during heating to 700 ◦C, e.g. goethite convertso hematite (Dunlop and Ozdemir, 1997). Therefore,e assume that this hump is most likely related to an
nversion of titanomaghemite to titanomagnetite of inter-ediate composition due to annealing and reduction
eaction in argon atmosphere.Stoichiometric synthetic and natural magnetite shows
very good reversibility of the heating and cooling curven an argon atmosphere as well as in air flow (own unpub-ished data). Therefore, we measured our representativetardalur basalts additionally in air flow (Fig. 9a and b)
o better understand the irreversibility of our samplesnd its implication. During the measurement in an airow, both samples show a more or less developed humpith TC at about 400 ◦C, which is most likely attributed
o titanomaghemite, that has been observed already inhe argon measurement of ST135.15 (Fig. 8c). A sec-nd, very high TC/N at 632 and 648 ◦C, respectively,s probably related to an ilmenohematite with very lowi content. This ilmenohematite is partly produced by
he conversion of instable titanomaghemite during heat-ng. Additionally, for ST135.15 a further TC at 591 ◦Cccurs, which is not seen in the χ–T curve of ST101.0.his third transition temperature is related to relics of
he cation-deficient magnetite, which also converts toi-poor ilmenohematite due to oxidation during heat-
ng in air. This interpretation is in agreement with thetrong irreversibility of the cooling run for both sam-les, which shows much lower susceptibilities. Theseow susceptibilities are in accordance with the formationf a mineral with much lower χ-values as, e.g. Ti-poorlmenohematite. According to Hunt et al. (1995 andeferences therein) magnetic susceptibility of hematites 20 times smaller than that of magnetite/maghemite.
very small contribution of magnetite/cation-deficientagnetite to the cooling curve is still verified by the sec-
nd low temperature measurement, which displays onlyvery weakly developed Verwey transition (see insetith large magnification in Fig. 9a and b). These results
ndicate that Ti-poor ilmenohematite is produced dur-ng heating as a result of titanomaghemite conversion
see, e.g. Dunlop and Ozdemir, 1997) and oxidation ofation-deficient magnetite, respectively.Repeated heating to 700 ◦C in air atmosphere provedhe stability of the once formed Ti-poor ilmenohematite
netary Interiors 164 (2007) 119–141 131
(Fig. 9c). While the Neel temperature does not change,the amplitude of magnetic susceptibility decreases dueto progressive oxidation resulting in further irreversibil-ity. Fig. 9d shows stepwise multiple heating experimentsup to 700 ◦C (with increasing maximum temperature) tofind the temperature at which the formation of ilmeno-hematite starts. The first three heating steps up to 300 ◦Creveal increasing susceptibilities similar to the singlemeasurement up to 700 ◦C (Fig. 9b). This behavior isprobably related to stress relaxation and/or unpinning ofdomain walls of the titanomaghemite with a TC at about400 ◦C during heating (Ozdemir and Dunlop, 1997).Irreversibility with lower susceptibilities of the coolingbranch starts after heating to 350 ◦C suggesting succes-sive conversion of titanomaghemite to ilmenohematiteas well as instability of cation-deficient magnetite. Inthe 550 ◦C step, only a slight increase in susceptibilityduring heating occurs, indicating that the phase with theTC at about 400 ◦C is almost completely transformed.While increasing the maximum temperature, each stepresults in a similar degree of irreversibility. The occur-rence of three phases with TC/N between about 550 and640 ◦C appear first in the cooling run back from 650 ◦C.These phases are stable during further heating exper-iments. The third phase with TC/N of about 550 ◦C isonly observed for ST135.15, while the phase with TC/Nof about 590 ◦C is only weakly developed for ST101.0.
Our observations from χ–T curves suggest that themagnetic properties of the Stardalur basalts are mainlyrelated to slightly cation-deficient magnetite and dif-ferent amounts of titanomaghemite. This interpretationis corroborated from the heating and cooling behav-ior in argon atmosphere and air flow, and the lowerVerwey transition temperature compared to stoichio-metric magnetite during the first cooling run. In asecond cooling run, the peak at the Verwey transition isshifted 6–9 ◦C to higher temperatures after heating in anargon atmosphere. The maximum transition temperaturereported for pure stoichiometric single-crystal magnetiteis −149 ◦C, whereas cation-deficiency or impuritiesdepress the transition temperature down to −191 ◦C(e.g. Aragon et al., 1985a; Ozdemir and Dunlop, 1998;Muxworthy and McClelland, 2000). Considering thefindings of Aragon et al. (1985b) the shift of the Ver-wey transition before and after heating is equivalent toa lower degree in cation-deficiency (δ) by 0.002–0.003(Fe3(1−δ)O4). We assume that the annealing process dur-
ing heating in argon heals cation defects and producesa more stoichiometric magnetite. This conversion fromcation-deficient magnetite to more stoichiometric mag-netite during heating has not been described in earlierstudies.
132 C. Vahle et al. / Physics of the Earth and Planetary Interiors 164 (2007) 119–141
peratur
Fig. 10. Mossbauer spectra of fresh material and material used for temand ST135.15.3.5. Mossbauer spectroscopy
From the two representative samples ST101.0 andST135.15 Mossbauer spectroscopy was performed inorder to characterize the iron mineralogy and to resolvethe changes taking place during heating in argon and airatmosphere. Fig. 10 shows Mossbauer spectra for thefresh and heated materials. The spectra of each samplewere analyzed simultaneously, i.e. assuming the pres-ence of the same components in varying amounts. Thespectra were analyzed in terms of three sextets and foursymmetric quadrupole split doublets.
The sextets were assigned to A and B line of magnetiteconstrained to have the empirical area ratio B/A = 1.9and zero quadrupole shift (2ε = �EQ = 0.0 mm/s) anda ferric oxide. The internal area ratio of sextet lineswere 3:2:1:1:2:3. The lines were assumed pair-wisealike (i.e. lines 1 and 6, 2 and 5, 3 and 4 having thesame line-width (Γ ), respectively). Due to overlap ofthe inner lines (3 and 4) with paramagnetic compo-
nents, the constraint Γ 25 = (Γ 16 + Γ 34)/2 was applied.The doublets were assigned to ilmenite, Fe(II) in pyrox-ene, unspecific Fe(III) and a Fe(II) having relatively highquadrupole splitting (results are listed in Table 2). Thee dependent susceptibility measurements in argon and air of ST101.0
hyperfine parameters of magnetite are found to be ingood agreement with the assignment and the slightlyreduced field from table values suggesting small levelof impurities. The hyperfine field and the quadrupoleshift of the ferric oxide denote that this componentoriginates from hematite. The quadrupole splitting ofthe Fe(II) component is reduced in comparison witholivine, but is consistent with serpentine or a mixture ofboth. Small misfits in the spectra could suggest a smalllevel of non-stoichiometry of magnetite or the presenceof maghemite <3% of the spectral area of fresh sam-ples. These results agree largely with Helgason et al.(1990), who found pure and homogeneous magnetiteas the magnetically relevant mineral. But according tothe χ–T curves presented above (Fig. 8 and 9) it islikely, especially in respect to the shift in Verwey tran-sition temperature and the strong irreversibility, thatthe magnetite is slightly non-stoichiometric. Indeed, theMossbauer spectrum can be interpreted in terms of non-stoichiometry up to δ ≈ 0.01, which corresponds to a
shift of the Verwey transition by 30 ◦C, which is notthe case. The χ–T measurements therefore seem to bemore sensitive to non-stoichiometry than Mossbauerspectroscopy.
C. Vahle et al. / Physics of the Earth and Planetary Interiors 164 (2007) 119–141 133
Table 2Hyperfine parameters obtained from simultaneous analysis of the spectra of ST101.0 and ST135.15 samples
ST101.0 Magnetite A Magnetite B Ferric oxide Fe(II) Fe(II) pyroxene Fe(III) Ilmenite
Bhf (T) 48.93(5) 45.69(4) 51.45(4)δ (mm/s) 0.288(6) 0.666(4) 0.375(5) 1.146(6) 1.12(1) 0.37(2) 1.02(2)�EQ (mm/s) 0 0 −0.17(1) 2.66(2) 1.99(4) 1.14(2) 0.7(2)Γ 16 (mm/s) 0.36(2) 0.45(2) 0.36(2) 0.36(3) 0.51(4) 0.61(3) 0.3(3)Γ 34 (mm/s) 0.34(4) 0.30(2) 0.26(2)A fresh (%) 56(3) 1.6(9) 17(2) 10(2) 13(2) 0.8(9)A Ar (%) 58(2) 0.5(7) 11(2) 16(2) 12.5(9) 0.8(8)A air (%) 3(2) 55(3) 0.3(10) 3(2) 36(3) 0.3(10)
ST135.15 Magnetite A Magnetite B Ferric oxide Fe(II) Fe(II) pyroxene Fe(III) Ilmenite
Bhf (T) 48.8(1) 45.61(8) 51.7(2)δ (mm/s) 0.27(2) 0.67(1) 0.38(2) 1.13(1) 1.139(4) 0.44(1) 1.03(1)�EQ (mm/s) 0 0 −0.18(3) 2.66(1) 1.969(3) 0.93(3) 0.71(3)Γ 16 (mm/s) 0.37(3) 0.54(4) 0.47(2) 0.32(2) 0.451(5) 0.57(4) 0.32(4)Γ 34 (mm/s) 0.28(6) 0.30(3) 0.32(2)A fresh (%) 30(2) 0(2) 12.8(5) 38.0(9) 13(1) 5.1(3)A Ar (%) 31(2) 0(2) 8.1(3) 39.6(9) 15.2(4) 5.9(8)A
T adrupo
bfwve(MaNipcoSwfwitoTrFFarabt
air (%) 7(2) 25(2)
he numbers in the parentheses represent 1σ error in the last digit. Qu
Generally, the difference in Mossbauer spectraetween fresh ST101.0 and ST135.15 are at least two-old: (1) spectra of ST101.0 lack an ilmenite signal,hich is consistent with microscopic observations (onlyery fine-grained exsolved titanomagnetite, according tolectron microprobe analysis less than 0.54 wt.% TiO2),2) a significantly larger contribution of magnetite to the
ossbauer spectra of ST101.0 as reflected by the higherrea percentage (56 comparing to 30) resulting in higherRM intensity and χ. The spectra of material heated
n argon atmosphere show almost no change in com-arison to the fresh material, in agreement with the χ–Turves of Fig. 8b and c. But significant differences can bebserved for the samples heated in air atmosphere. ForT101.0 a large contribution of ferric oxide (hematiteith perhaps a small contribution of maghemite) is
ound, to which the magnetite has completely altered,hereas a small amount of magnetite (7%) is remain-
ng for ST135.15. But also for ST135.15, almost all ofhe (cation-deficient) magnetite is transformed to ferricxide (hematite) during measurement in air atmosphere.he Fe(II) component bonded to silicates like, e.g. chlo-
ite is higher for ST101.0. Furthermore, almost the entiree(II) is lost during heating in air, whereas for ST135.15e(II) is still present. This relation suggests a highermount of thermally unstable minerals like, e.g. chlo-
ite for ST101.0 and supports the hypothesis of strongerlteration affecting ST101.0. This excellent correlationetween χ–T curves and Mossbauer spectra corroborateshat the χ–T measurements can be used as a reliable6.0(8) 32(2) 22(2) 5.5(2)
le shift of sextet components is given as 2ε
method for the identification of ferromagnetic iron min-eralogy.
4. Discussion
The strong magnetic anomaly at the Stardalur vol-canic complex, situated about 20 km NE of Reykjavik,is caused by an extraordinary strong remanent magne-tization of up to 121 A/m related to a high magnetitecontent. According to different previous studies, fol-lowing factors seem to account for the unusually highmagnetization of these basalts: (1) small grain size,(2) high temperature oxidized titanomagnetite, result-ing in almost pure magnetite, (3) symplectic magnetitefrom oxidized olivine and (4) higher (local) paleomag-netic field intensity (Fridleifsson and Kristjansson, 1972;Helgason et al., 1990; Gunnlaugsson et al., 2003, 2006).However, these features are not unique for the Stardalurbasalts and therefore we will revisit different mecha-nisms controlling abundance, composition and grain sizein relation to geologic processes.
According to our rock magnetic and magneto-mineralogical investigations the magnetically relevantmineral in these rocks is mainly cation-deficientmagnetite. From microscopic observations and the com-parison with, e.g. Hawaiian basalts (Kontny et al., 2003;
Vahle, 2005) we can conclude that multiple processes,related to the geodynamic setting, the emplacement andthe cooling history of the basalts, affected the textureand composition of the originally homogeneous titano-
134 C. Vahle et al. / Physics of the Earth and Planetary Interiors 164 (2007) 119–141
enohec param
Fig. 11. Sketch showing the development of titanomagnetite and ilmalteration; additionally, the change in strength of the relevant magneti
magnetite (stage I in Fig. 11) resulting in extraordinarilyhigh NRM intensity and magnetic susceptibility. Theseprocesses are discussed in the following section.
4.1. Magma composition and cooling history
During initial cooling and quenching of the lava, therock acquires a TRM, which depends on the amountand grain size of titanomagnetite. Amount and grain
size in turn depend on the lava composition, degreeof undercooling and cooling rate (± oxygen fugac-ity) during lava emplacement. Gee and Kent (1997)derived a relationship between FeOtot as an indica-matite textures from initial cooling/quenching to the latest stage ofeters is given (further description see text).
tor of magma fractionation of submarine glass andNRM (NRM [A/m] = −25.8 + 4.44 × %FeOtot) for axiallavas from the southern East Pacific Rise. Taking arange of 8.5–14.3 wt.% FeOtot for Icelandic basalts fromthe Reykjanes peninsula (picritic to tholeiitic basaltsdescribed in Jakobsson et al., 1978) NRM intensitiesof 12–38 A/m could be acquired according to this rela-tionship. This NRM intensity range fits nicely to ownunpublished data of surface basaltic rocks from SW-
Reykjanes peninsula: 4–32 A/m (reduced to 90 % ofthe data set to exclude extreme values). On the otherside, a correlation of geochemical data (Rhodes andVollinger, 2004; Stolper et al., 2004) and NRM inten-
nd Pla
sfgtdbHf∼eatc
arTfdtsseTirtoguR(ii(saaatmniirta
taog
C. Vahle et al. / Physics of the Earth a
ities (Vahle, 2005) of subaerial and submarine basaltsrom the Hawaiian Scientific Drilling Project (HSDP-2)ave no reasonable results. In this geodynamic settinghe measured NRM intensities (<1–13 A/m, 90% of theata) are much lower than the calculated values on thease of Gee and Kent’s (1997) equation (18–32 A/m).owever, Steinthorsson and Sigvaldason (1971) have
ound for Stardalur basalts a rather high Fe-content of12 wt.%. Using this value in Gee and Kent’s (1997)
quation one gets 43 A/m, which is far below the aver-ge of 63 A/m. These observations indicate, that besidesotal Fe-content of the magma, other factors must alsoontrol the remanence intensity.
More important for the resulting magnetic mineralssemblage than the total Fe-content is the Ti/(Ti + Fe)atio and the oxygen fugacity of the melt. Highi/(Ti + Fe) ratios at the same oxygen fugacity favor theormation of Ti-rich phases like ilmenohematite, whileecreasing Ti/(Ti + Fe) ratios enable a higher amount ofitanomagnetite at a fixed oxygen fugacity. This relation-hip was shown in experimental studies in the Fe–Ti–Oystem (see, e.g. Fig. 2 in Lattard et al., 2006) and isspecially true for compositions above the NNO buffer.he generally high amount of magnetic titanomagnetite
n the Stardalur basalt seems to be in agreement withelatively oxidized conditions of the basalt melt (abovehe NNO buffer) and low Ti/(Ti + Fe) ratios. Except forne single analysis of a sample from 60 m depth, noeochemical data are available for the Stardalur basaltsp to now. But analyses from surface rocks of theeykjanes peninsula (SW-Iceland) by Jakobsson et al.
1978) revealed compositions lower in titanium (totalron is similar, resulting in lower Ti/(Ti + Fe) ratios)n comparison with data from, e.g. HSDP-2 basaltsRhodes and Vollinger, 2004; Stolper et al., 2004). Theingle Stardalur analysis has slightly higher total ironnd titanium resulting in Ti/(Ti + Fe) ratios intermedi-te between Reykjanes and Hawaii. Both, the Reykjanesnd Hawaiian basalts show in part similar concentra-ions of Fe-Ti oxides, but the Icelandic rocks exhibit
ostly significantly higher NRM intensity and mag-etic susceptibility. This feature is related to the lowerlmenohematite contents of the Icelandic basalts, reflect-ng a magma composition with low Ti/(Ti + Fe) ratio,esulting in higher titanomagnetite abundance relativeo ilmenohematite and therefore higher NRM intensitynd χ.
Investigations on the remanence properties of syn-
hetic Fe-rich basalts (18.9% FeOtot) from Brachfeldnd Hammer (2006) have shown that the acquisitionf thermoremanent magnetization is linked to the oxy-en fugacity of the melt and the resulting magneticnetary Interiors 164 (2007) 119–141 135
mineral assemblage. Samples synthesized at the iron-wustite (IW) buffer have a very low concentrationof remanence-carrying grains, samples synthesized atthe quartz-fayalite-magnetite (QFM) and nickel-nickeloxide (NNO) buffers contain a slightly higher amount,and samples synthesized at the manganese oxide (MNO)buffer show the highest concentration of magneticgrains, which are up to 100 �m in diameter. The QFM,NNO and MNO samples acquired TRMs up to 40 A/m ina 10 �T field and even 200 A/m in a 50 �T field, with lit-tle or no dependence on cooling rate. However, such highvalues have rarely been observed in terrestrial basaltsexcept zero-age pillow basalts from the East Pacific Rise(Carlut and Kent, 2002) and some basalt occurrenceson Iceland (e.g. Gunnlaugsson et al., 2006; this study).Moreover, Carlut and Kent (2002) found strong inter-nal NRM variations on a millimeter scale, whereas theremanence increases sharply in the first centimeter fromthe marginal part to the pillow interior. This pattern isdirectly related to a different cooling history in the spe-cific parts of the pillow. In the marginal parts almost nocrystals appear due to solidification in less than a few sec-onds (Griffiths and Fink, 1992), whereas the inner partcooled slower (∼250 ◦C/h) leading to rapid formationof magnetic minerals of up to ∼40 �m in size (Zhou etal., 2000). Therefore, both oxygen fugacity and coolingrate must be considered as major parameters affectingthe magnetic properties.
For the Stardalur basalts two groups have beendefined based on the rock magnetic and magneto-mineralogical properties. The texture and grain sizesof group 1 (ST101.0; dendritic to cruciform titano-magnetite, 5–20 �m in size) reflect faster cooling incomparison to the group 2 (ST135.15; bimodal spec-trum with dendritic to euhedral grains of <10–80 �msize). In samples of group 2 a dense network of ilmenite-lamellae points to high temperature deuteric oxidationduring slower cooling. The difference in NRM inten-sity and χ of these two groups is mainly related to theopaque mineral content and its texture, which dependsstrongly on cooling history as their primary composi-tion should be the same. After their emplacement theStardalur basalts suffered significant oxidation and alter-ation. Therefore, we discuss more closely the processesduring and after cooling as further possible mechanismsfor the enhancement of the already high magnetization.
4.2. High temperature deuteric oxidation
Oxide textures of the Stardalur samples imply hightemperature deuteric oxidation during cooling of thelava. This oxidation is typical for subaerial basalts

and Pla
136 C. Vahle et al. / Physics of the Earthand is responsible for a significant grain size reduc-tion due to multiple sets of Ti-rich ilmenohematiteexsolution-lamellae (e.g. Fig. 4b) within the originallyhomogeneous titanomagnetite (see stage II in Fig. 11).This oxyexsolution causes a distinct increase of coer-civity but not NRM intensity as our studies on basaltdrill cores from the HSDP-2 have shown (Kontny et al.,2003; Vahle, 2005). Basalts from the subaerial sectionof the HSDP-2 drill core with homogeneous titanomag-netite show a TC of 100 ◦C (Xusp ≈ 0.70), while forsamples with exsolved titanomagnetite a TC at 520 ◦C(Xusp ≈ 0.10) is observed. Both samples have compa-rable NRM intensities ranging between 5 and 6 A/m.Therefore, high temperature deuteric oxidation seemsnot to be a significant mechanism leading to an increasein NRM intensity but it enhances remanence stability(MDF of 14 mT and less for samples with homogeneoustitanomagnetite and up to 45 mT for exsolved ones).
Additionally to the oxidation of Fe–Ti oxides, silicateminerals are altered during this second stage (Fig. 11)forming magnetite, which acquires a stable (T)CRM.Symplectic magnetite (+ pyroxene) is produced by thebreakdown of olivine through high temperature deutericoxidation or reheating (Section 3.1 and Figs. 4a and11). This magnetite formation leads to an increase inNRM intensity and χ. The reheating could be inducedby later dike intrusions or burial by a new lava flow.Kristjansson (1985) studied the magnetic and thermaleffect of dike intrusions (average width of 4 m) into rel-atively fresh subaerial lava piles in Iceland. The affectedarea reached less than 0.5 m away from the contact intothe lava flows, whereas changes in remanence intensitycannot be clearly resolved due to primary variations.But a change in remanence direction points to a lateroverprint. On the contrary, Bleil et al. (1982) found abun-dant secondary magnetite in altered subaerial basaltsdrilled by the Iceland Research Drilling Project (IRDP)in E-Iceland. This secondary magnetite, which is inter-preted to increase NRM intensity and which changedmagnetic polarity, occurs in zones of dense dike intru-sions, providing heat for the remagnetization of the lavaflows. Furthermore, Hall (1985) reported on samplesfrom the same drilling an increase of χ and magnetiza-tion (induced and remanent) towards the dike contacts,which is related to the growth of secondary magnetiteleading to a partial to complete remagnetization of thelava flows. According to the lithological descriptionsof the Stardalur core, no intrusions have been found,
and the discharge of hydrothermal fluids provides notenough heat for the development of symplectic mag-netite (>810 ◦C, Haggerty and Baker, 1967), leavingreheating by burial beneath younger lava flows as thenetary Interiors 164 (2007) 119–141
only other option. Possible reheating is reflected in therecrystallized glass shards of the hyaloclastite sampleST41.3 and the growth of abundant magnetite lining theglass shards. This leads to unusually high NRM intensityand χ (Table 1) of hyaloclastite, which is usually charac-terized by low values due to strong quenching in water,where only few, small crystals can develop. Therefore, arather less magnetic behavior (lower magnetization andsusceptibility) is expected for those kinds of rocks (see,e.g. Kontny et al., 2003; Vahle, 2005).
Indeed, Gunnlaugsson et al. (2006) attribute the highmagnetization (40 A/m) of some of their Sudurdalursamples (E-Iceland) to the development of symplecticmagnetite (by alteration of olivine). Samples with rela-tively fresh olivine show only 4 A/m, pointing to a strongincrease of NRM intensity due to formation of symplec-tic magnetite. Although, in our Stardalur samples thismechanism seems to be of less importance comparingto the studies of Gunnlaugsson et al. (2006), we foundsome indications for symplectic magnetite, which locallyincreases NRM intensity to some extent, especially inregard to the high temperature of remanence acquisitionnear and above TC resulting in a TRM (see below forexplanation). Therefore, this mechanism seems to be oneimportant factor contributing to the high magnetizationvalues of the Stardalur basalts.
4.3. Hydrothermal alteration
A significant feature of titanomagnetite in theStardalur samples is the shrinkage cracks (e.g. Figs.4c, 5c and d), which are a microscopic sign formaghemitization (Petersen and Vali, 1987). Generally,maghemitization is described as a low temperature(<200–250 ◦C) process occurring mainly at the crystalsurface or along cracks promoted by an aqueous envi-ronment (e.g. Dunlop and Ozdemir, 1997). Dependingon subaerial or aqueous conditions, the mechanism isoxidation of Fe2+ to Fe3+ at a crystal surface and diffu-sion of Fe2+ from the crystal interior to a free surface,where the ion is removed and dissolved in water. Oxi-dation is therefore a slow process, partly controlled bydiffusion rates of Fe2+ and the distance to the surface.As a result, the oxidized titanomagnetite gets enrichedin Fe3+. Due to removal of Fe2+ charge balancing vacan-cies are created leading to the generation and increase ofinternal stresses in the crystal lattice until it breaks.
Curie temperatures of maghemite are reported
between 470 and 695 ◦C (Dunlop and Ozdemir, 1997,and references therein), but it can seldom be mea-sured because it usually inverts to magnetite or hematitebetween 250 and >750 ◦C. On the contrary, e.g. Helgason
nd Pla
efme2vcmtr(ddida
rGbmmflohttdata∼rtoHzgtdba
catt3osln
C. Vahle et al. / Physics of the Earth a
t al. (1992) found stable maghemite in olivine basaltsrom Iceland using Mossbauer spectroscopy. At 600 ◦Caghemite is stable in an oxidizing environment for sev-
ral hours, little maghemite is present after heating forh in an inactive atmosphere, while the maghemite con-erts to magnetite already after 30 min under reducingonditions (see also Gunnlaugsson et al., 2002). The χ–Teasurements in argon and air of all other samples point
o cation-deficient magnetite converting to (stoichiomet-ic) magnetite and Ti-poor ilmenohematite, respectivelyFigs. 8a–c and 9a and b). The irreversibility, observeduring our measurements, is probably related to cation-eficient magnetite, which is less stable during heating,n comparison to a rather stable behavior of fully oxi-ized maghemite found by, e.g. Helgason et al. (1992)nd Gunnlaugsson et al. (2002).
Maghemite or titanomaghemite has also beeneported, e.g. by Steinthorsson et al. (1992) andunnlaugsson et al. (2002) for different Icelandicasalts. The first group of authors suggests the onset ofaghemitization taking place subsequent to hydrother-al alteration during burial and reheating of the lavaows at wet conditions. Gunnlaugsson et al. (2002)bserved an increase in titanomaghemite content aftereating the samples (mixture of titanomagnetite anditanomaghemite) to 500–600 ◦C at oxidizing condi-ions. During this experiment, titanomagnetite getsepleted in Ti due to exsolution processes. Addition-lly, hematite forms when heated to ∼700 ◦C. In case ofhe Stardalur basalts the instability of titanomaghemitend cation-deficient magnetite starts at ∼350 and400 ◦C, when heated in argon and air atmosphere,
espectively (Figs. 8d and 9d). Therefore, their maghemi-ization must have occurred mainly below ∼375 ◦Cn a retrograde path during hydrothermal alteration.ydrothermal activity is indicated by the presence of
eolites, montmorillonite and chlorite occurring in theroundmass and in vesicles (stage IIIa in Fig. 11). Ourhermomagnetic measurements suggest, that no cation-eficient (titano)magnetite should have survived in theasalt, if the rocks would have been reheated to >400 ◦Cfter maghemitization.
Maghemitization of ocean basalts is suggested toause a decrease of NRM intensity (e.g. Matzka etl., 2003), which is explained by the lower satura-ion magnetization of titanomaghemite compared toitanomagnetite (e.g. magnetite: 480 kA/m, maghemite:80 kA/m, Dunlop and Ozdemir, 1997). But the devel-
pment of shrinkage cracks divides the grain intomaller pieces and possibly leads to an increase or ateast no change in NRM intensity as far as no mag-etostatic interactions occur. Studies of Helgason etnetary Interiors 164 (2007) 119–141 137
al. (1992) and Gunnlaugsson et al. (2002) suggestedtitanomaghemite as the stable carrier of NRM intensityin Icelandic basalts. Therefore, oxidation of titanomag-netite to titanomaghemite must not necessarily leadto a reduced NRM intensity. For samples from theHSDP-2 even a slight increase of NRM intensity withdepth (and age) is observed, despite the occurrenceof low temperature oxidized titanomagnetite (Vahle,2005). Comparing the different temperature stabilityof ST101.0 and ST135.15 (Figs. 6b and c, 9a and b)one may expect a stronger degree of maghemitization(and overall alteration) for ST101.0 due to stronger irre-versibility during heating in air (see also significantlylower χ after thermal demagnetization to 700 ◦C). Atleast three explanations are conceivable up to now forthis difference: (1) ST101.0 exhibits a stronger degreeof cation-deficiency resulting in stronger thermal insta-bility (due to small grain sizes diffusion has almosttotally affected the grains), (2) ST135.15 is less sen-sitive to maghemitization because some parts of theoxidized titanomagnetite grains resist maghemitizationdue to the large grain size (slower diffusion, oxidationnot uniform but varies with grain diameter), and (3)ST101.0 contains more magnetite derived from oxida-tion of olivine (this magnetite has less thermal stabilitythan magnetite derived from exsolution of titanomag-netite). If this is true, the stronger “maghemitized”(altered) sample (ST101.0) shows much higher NRMintensity and χ, which opposes studies of, e.g. Matzkaet al. (2003). Although these higher values are mostlyrelated to other factors like grain size and concentrationof magnetic minerals, this relation implies, that in caseof the Stardalur basalts maghemitization during stageIIIa hydrothermal alteration did not lead to a significantlowering of NRM intensity.
The maghemitization at stage IIIa and the associ-ated shrinkage cracks in the oxidized titanomagnetitecrystals served as pathways for hydrothermal fluids,which altered titanomagnetite as well as ilmenohe-matite along the cracks and at the margins (Fig. 4c)by dissolution. This alteration leads to the formationof titanite ± chlorite (stage IIIb in Fig. 11), whereasthe dissolution and replacement of ilmenite-lamellaein titanomagnetite created “ghost” textures (Fig. 4b).According to Ade-Hall et al. (1971) a minimum tem-perature of 250 ◦C is necessary for the replacementof ilmenite by titanite. Above 300 ◦C polycrystallineTi-hematite occurs pseudomorph after titanomagnetite.
As we have rarely observed hematite but titanitein various amounts, the temperature range of stageIIIb hydrothermal alteration was likely between 250and 300 ◦C.
and Pla
138 C. Vahle et al. / Physics of the EarthThe dissolution of ilmenohematite (and titano-magnetite) during stage IIIb hydrothermal alterationprobably supplied material for the growth of secondarymagnetite (Fig. 4d–f), which could also contribute tohigher NRM. Hall (1985) found an increasing amount ofsecondary magnetite partly produced during hydrother-mal alteration in the lower section of the IRDP especiallywhere primary magnetite has been dissolved. Thesecondary magnetite contributes to an increase of χ
(depending on the ratio of dissolved/newly grown mag-netite). Because of the good correlation between NRMand χ (Fig. 3) the formation of secondary magnetite isassumed to increase also NRM intensity, although thisincrease is presumably small. The intensity of a ther-mochemical remanence (CRM) acquired during crystalgrowth at temperatures well below TC by this secondarymagnetite is significantly lower than that of an initialTRM acquired during cooling from or just below TC (e.g.Haigh, 1958; Kobayashi, 1959). Draeger et al. (2006)found for samples from a Quaternary basaltic dike (S-France) with single-domain titanomagnetite only halfthe remanence intensity acquired at 400 ◦C comparedto a TRM. Remanence intensity could even be reduceddue to intensive replacement of primary titanomagnetitegrains. The different extent of increase in NRM intensityand χ is probably reflected in the relatively low valuesof Q-factor (5–32). In sight of the high NRM intensi-ties of 18–121 A/m one would expect also high valuesfor the Q-factor, especially when compared to ratherfresh, young (<20 ka) surface samples from the Reyk-janes peninsula with NRM intensity range between 4and 32 A/m and Q-factors between 20 and 105 (90% ofthe data set, unpublished data). Therefore, it is likelythat the growth of these secondary magnetite grains atintermediate to low temperatures (300–250 ◦C) leads toa significant increase in χ (and higher induced mag-netization) but only slightly higher NRM. Due to thepoor reversibility of χ–T curves in air (Fig. 9) it islikely, that this secondary magnetite also is slightly non-stoichiometric.
4.4. Paleomagnetic field intensity
Although paleointensity investigations are beyond thescope of our study, the intensity of the paleomagneticfield is one crucial factor for the intensity of NRM. There-fore, the influence of paleointensity on the NRM of theStardalur basalts is discussed below.
From paleointensity studies it is concluded that thestrength of the Earth magnetic field fluctuates overthe Earth history (e.g. Gee et al., 1996; Wang et al.,2005). Wang et al. (2005) found an increase of NRM
netary Interiors 164 (2007) 119–141
intensity of Cretaceous Atlantic and Pacific MORBwith increasing age following a depression at 10–30 Maaged rocks. While the decrease of NRM intensities ofmaghemitized ocean basalts (e.g. Matzka et al., 2003)is explained by the lower saturation magnetization oftitanomaghemite compared to titanomagnetite, Wang etal. (2005) excluded by a statistical approach compo-sitional, petrologic, rock magnetic, or paleomagneticpatterns for the Cretaceous increase in NRM intensity.They suggested that the geomagnetic field intensity musthave been significantly higher during the Cretaceousthan during the Oligocene and Miocene.
Fridleifsson and Kristjansson (1972) suggested ahigher field intensity of 93 ± 6 �T for the Stardalurrocks, which is almost twice the current value for SW-Iceland. This is partly supported by Carmichael (1970)and Ade-Hall et al. (1972) who derived 64–120 �T ondredged Quaternary ocean basalts from 45◦N, whereasSmith (1967) found only 34 ± 3 �T for the upper Ceno-zoic. The thermal instability of the magnetic relevantphases in the Stardalur rocks hampers reliable paleoin-tensity studies. TRM experiments in different laboratoryfields from 15 to 145 �T applied on pillow basalts of theEast Pacific Rise (Carlut and Kent, 2002) revealed analmost perfect linear relationship between TRM inten-sity and field amplitude. The NRM intensity of theStardalur basalts could therefore be twice as high if theyhad cooled in a paleomagnetic field that had an intensitythat was twice that of today.
In fact, Meynadier et al. (1995) suggested, that thegeomagnetic field occasionally becomes quite strong(1.5–2 times the average), for instance when recover-ing after a reversal. The Stardalur basalts are estimatedto be extruded during Olduvai Subchron based ontwo K–Ar datings of nearby rhyolites at the Stardalurcaldera (Kristjansson et al., 1980). The Olduvai Sub-chron (1.95–1.77 Ma, Cande and Kent, 1995) is a normalpolarity event during Matuyama Chron (negative polar-ity). Maybe, during this short time interval betweenpolarity transitions the Earth magnetic field has beenstronger. However, this increase in paleointensity duringOlduvai Subchron has not been confirmed so far. In con-trast, relative paleointensity studies on ODP-sedimentcores from different localities (equatorial Pacific and Ice-land basin 450 km south off Iceland) revealed almost nochange for the Olduvai Subchron compared with earlierand later times (Meynadier et al., 1995; Channell et al.,2002; Yamazaki and Oda, 2005). A reasonable cause of
higher field intensity is a local increase due to stronglymagnetic underlying rocks, as already suggested byFridleifsson and Kristjansson (1972). However, such anexplanation remains vague.
nd Pla
5
vdAnstwrtpoft
thllts(ou(iahnTta
(tnbndhfli(ant
hik
C. Vahle et al. / Physics of the Earth a
. Conclusions
The strong magnetic anomaly of the Stardalurolcanic complex in Iceland is caused by an extraor-inary high remanent magnetization of up to 121 A/m.lthough we still cannot present an unequivocal expla-ation for these extraordinary high values, our studyuggests that high NRM is due to a high primaryitanomagnetite content formed from a basaltic meltith high oxygen fugacity and low Ti/(Ti + Fe) ratio,
elated to the geodynamic setting on Iceland. Additionalo magma composition and cooling history, multiplerocesses affected the texture and composition of theriginally homogeneous titanomagnetite resulting in aurther increase in NRM intensity and magnetic suscep-ibility.
According to our results, originally homogeneousitanomagnetite and ilmenohematite suffered subsequentigh temperature deuteric oxidation and/or oxidation byater reheating from younger lava flows producing exso-ution textures and symplectic magnetite. Due to the highemperatures of ∼500–900 ◦C (stage II), especially theymplectic magnetite can acquire a high and stable TRMdue to the small grain sizes) increasing the NRM. Ourwn data and Gunnlaugsson et al. (2003) showed annusually large proportion of iron located in magnetiteup to 56% of the area of the Mossbauer spectra, 5–10%s more usual), which is in accordance with the alter-tion of Fe-bearing silicates (predominantly olivine) atigh temperatures with subsequent formation of mag-etite, leading to an increase in NRM intensity and χ.he NRM (17.7 A/m) of the hyaloclastite sample at the
op of the strongly magnetic basalt lava flows may given approximation of this contribution to NRM.
During the first stage of hydrothermal alterationstage IIIa, T < 375 ◦C) cation-deficient (titano)magne-ite is produced. This early hydrothermal stage seemsot to be crucial for the NRM intensity of the Stardalurasalts (it either seems to decrease nor increase NRM sig-ificantly), but during maghemitization shrinkage crackseveloped, which served as pathways for later stageydrothermal fluids (stage IIIb, T ≈ 250–300 ◦C). Theseuids partly dissolved the primary Fe–Ti oxides, lead-
ng to the formation of titanite and secondary magnetitewith further subsequent maghemitization), which isssumed to carry only a low remanence, whereas mag-etic susceptibility increases significantly contributingo the induced magnetization.
Although the newly formed magnetite during thisydrothermal stage is not very important for the NRMntensity, we assume that hydrothermal alteration is theey factor for the formation of cation-deficient magnetite
netary Interiors 164 (2007) 119–141 139
from the already existing magnetic minerals. Cation-deficient magnetite is found to be the main carrier of themagnetic properties of the Stardalur basalts and for thefirst time, it is suggested to be the magnetically relevantmineral, responsible for the strong magnetic anomaly atStardalur. Furthermore, for the first time the conversionfrom cation-deficient to more stoichiometric magnetiteduring laboratory heating has been observed. Duringthis maghemitization the NRM intensity seems to beunchanged. The results of this study can be helpful inexplaining other strong magnetic anomalies in basalticenvironment on Earth and Mars.
Acknowledgements
First we want to thank our Icelandic colleagues fromthe Iceland GeoSurvey ISOR (G.O. Fridleifsson, A.Gudmundsson, A. Blischke, B. Gautason, H. Franz-son) and from the Technical University of Iceland (H.Audunsson) for their excellent support and informa-tion exchange during our stay at Iceland in July 2005.Ann Hirt is acknowledged for her help and commentsconcerning the IRM and thermal demagnetization mea-surements at ETH, Zurich. Thanks to R. Harrison and R.Van der Voo for helpful reviews. The German ResearchFoundation is acknowledged for funding this work (No.KO1514/3).
References
Acuna, M.H., Connerney, J.E.P., Ness, N.F., Lin, R.P., Michell, D.,Carlson, C.W., McFadden, J., Anderson, K.A., Reme, H., Mazelle,C., Vignes, D., Wasilewski, P., Cloutier, P., 1999. Global distri-bution of crustal magnetization discovered by the Mars GlobalSurveyor MAG/ER experiment. Science 284, 5415–5427.
Ade-Hall, J.M., Palmer, H.C., Hubbard, T.P., 1971. The magnetic andopaque petrological response of basalts to regional hydrothermalalteration. Geophys. J. R. Astronom. Soc. 24, 137–174.
Ade-Hall, J.M., Ryall, P.J.C., Gerstein, R.E., 1972. Magnetic resultsfrom basalt drill cores from the M.A.R. median valley at 45◦N. EosTrans. 53, 955.
Aragon, R., Buttrey, D.J., Shepard, J.P., Honig, J.M., 1985a. Influenceof nonstoichiometry on the Verwey transition. Phys. Rev. B 31,430–436.
Aragon, R., Shepard, J.P., Koenitzer, J.W., Buttrey, D.J., Rasmussen,R.J., Honig, J.M., 1985b. Influence of nonstoichiometry on theVerwey transition in Fe3(1−δ)O4. J. Appl. Phys. 57, 3221–3222.
Baker, I., Haggerty, S.E., 1967. The alteration of olivine in basalticand associated lavas. Part II. Intermediate and low temperaturealteration. Contrib. Mineral. Petrol. 16, 258–273.
Bleil, U., Hall, J.M., Johnson, H.P., Levi, S., Schonharting, G., 1982.
The natural magnetization of a 3-kilometer section of Icelandiccrust. J. Geophys. Res. 87, 6569–6589.Brachfeld, S.A., Hammer, J., 2006. Rock magnetic and remanenceproperties of synthetic Fe-rich basalts: Implications for Marscrustal anomalies. Earth Planet. Sci. Lett. 248, 599–617.
and Pla
140 C. Vahle et al. / Physics of the EarthCande, S.C., Kent, D.V., 1995. Revised calibration of the geomag-netic polarity timescale for the late Cretaceous and Cenozoic. J.Geophys. Res. 100, 6093–6095.
Carlut, J., Kent, D.V., 2002. Grain-size-dependent paleointensityresults from very recent Mid-Ocean Ridge basalts. J. Geophys.Res. 107, 2049 (10.1029/2001JB000439).
Carmichael, C.M., 1970. The Mid-Atlantic ridge near 45◦N. VII. Mag-netic properties and mineralogy of dredged samples. Can. J. EarthSci. 7, 239–256.
Channell, J.E.T., Mazaud, A., Sullivan, P., Turner, S., Raymo,M.E., 2002. Geomagnetic excursions and paleointensities inthe Matuyama Chron at Ocean Drilling Program Sites 983and 984 (Iceland Basin). J. Geophys. Res. 107, 2114(2110.1029/2001JB000491).
Draeger, U., Prevot, M., Poidras, T., Riisager, J., 2006. Single-domainchemical, thermochemical and thermal remanences in a basalticrock. Geophys. J. Int. 166, 12–32.
Dunlop, D.J., Ozdemir, O., 1997. Rock Magnetism. Cambridge Uni-versity Press, p. 573.
Dunlop, D.J., Xu, S., Heider, F., 2004. Alternating field demagneti-zation, single-domain-like memory, and the Lowrie-Fuller test ofmultidomain magnetite grains (0.6–356 �m). J. Geophys. Res. 109,B07102 (doi:07110.01029/02004JB003006).
Fridleifsson, I.B., 1973. Petrology and structure of the Esja Quaternaryvolcanic region. D. Phil. University of Oxford, SW-Iceland, p. 208.
Fridleifsson, I.B., Kristjansson, L., 1972. The Stardalur MagneticAnomaly, vol. 22. Jokull, SW-Iceland, pp. 69–78.
Fridleifsson, I.B., Tomasson, J., 1972. Jardhitarannsoknir a Stardalss-vaedinu 1969–1971. Mimeographed Report. Orkustofnun, Reyk-javik, 14 pp.
Gee, J., Kent, D.V., 1997. Magnetization of axial lavas from thesouthern East Pacific Rise (14◦–23◦S): geochemical controls onmagnetic properties. J. Geophys. Res. 102, 24873–24886.
Gee, J., Schneider, D.A., Kent, D.V., 1996. Marine magnetic anomaliesas recorders of geomagnetic intensity variations. Earth Planet. Sci.Lett. 144, 327–335.
Griffiths, R.W., Fink, J.H., 1992. Solidification and morphology ofsubmarine lavas: a dependence on extrusion rate. J. Geophys. Res.97, 19729–19737.
Gunnlaugsson, H.P., Weyer, G., Helgason, O., 2002. Titanomaghemitein Icelandic basalt: possible clues for the strongly magneticphase in Martian soil and dust. Planet. Space Sci. 50, 157–161.
Gunnlaugsson, H.P., Bendtsen, L.S., Bertelsen, P., Binau, C.S., Gaars-mand, J., Goetz, W., Helgason, O., Kristjansson, L., Knudsen, J.M.,Leer, K., Madsen, M.B., Nørnberg, P., Steinborsson, S., Weyer, G.,2003. Magnetic Anomalies in Iceland: Implications for the Mag-netic Anomalies on Mars. Sixth International Conference on Mars,Pasadena (Abstract no. 3025).
Gunnlaugsson, H.P., Helgason, O., Kristjansson, L., Nørnberg, P.,Rasmussen, H., Steinthorsson, S., Weyer, G., 2006. Magnetic prop-erties of olivine basalt: application to Mars. Phys. Earth Planet.Interiors 154, 276–289.
Haggerty, S.E., 1991. Oxide textures—a mini-atlas. In: Lindsley, D.H.(Ed.), Oxide Minerals: Petrologic and Magnetic Significance, vol.25. Mineralogical Society of America, pp. 129–219 (Reviews inMineralogy).
Haggerty, S.E., Baker, I., 1967. The alteration of olivine in basalticand associated lavas. Part I. High temperature alteration. Contribut.Miner. Petrol. 16, 233–257.
Haigh, G., 1958. The process of magnetization by chemical change.Philos. Mag. 3, 267–286.
netary Interiors 164 (2007) 119–141
Hall, J.M., 1985. The Iceland Research Drilling Project crustal sec-tion: variation of magnetic properties with depth in Icelandic-typeoceanic crust. Can. J. Earth Sci. 22, 85–101.
Helgason, O., Steinthorsson, S., Madsen, M.B., Mørup, S., 1990. Onanomalously magnetic basalt lavas from Stardalur, Iceland. Hyper-fine Interact. 57, 2209–2214.
Helgason, O., Gunnlaugsson, H.P., Steinthorsson, S., Mørup, S., 1992.High temperature stability of maghemite in partially oxidizedbasalt lava. Hyperfine Interact. 70, 981–984.
Hunt, C.P., Moskowitz, B.M., Banerjee, S.K., 1995. Magnetic proper-ties of rocks and minerals. In: Ahrens, T.J. (Ed.), AGU ReferenceShelf 3—Rock Physics and Phase Relations. A Handbook of Phys-ical Constants, pp. 189–204.
Jakobsson, S.P., Jonsson, J., Shido, F., 1978. Petrology of the WesternReykjanes Peninsula, Iceland. J. Petrol. 19, 669–705.
Jonsson, G., Kristjansson, L., Sverrisson, M., 1991. Magnetic surveysof Iceland. Tectonophysics 189, 229–247.
Kakol, Z., Honig, J.M., 1989. The variation of Verwey transitiontemperature with oxygen stoichiometry in magnetite. Solid StateCommun. 70, 967–969.
Keefer, C.M., Shive, P.N., 1980. Titanomaghemites: conditions foroxidation, influence of rhombohedral phases, and temperature ofinversion. Earth Planet. Sci. Lett. 51, 199–205.
Kletetschka, G., Kontny, A., 2005. Identification of magnetic mineralsby scanning electron microscope and application of ferrofluid. StudGeophys. Geodaetica 49, 153–162.
Kobayashi, K., 1959. Chemical remanent magnetization of ferromag-netic minerals and its application to rock magnetism. J. Geomagn.Geoelectr. 10, 99–117.
Kontny, A., Vahle, C., de Wall, H., 2003. Characteristic magneticbehavior of subaerial and submarine lava units from the Hawai-ian Scientific Drilling Project (HSDP-2). Geochem. Geophys.Geosyst. 4, 8703 (doi:10.1029/2002GC000304).
Kristjansson, L., 1970. Palaeomagnetism and magnetic surveys in Ice-land. Earth Planet. Sci. Lett. 8, 101–108.
Kristjansson, L., 1985. Magnetic and thermal effects of dike intrusionsin Iceland. J. Geophys. Res. 90, 10129–10135.
Kristjansson, L., Fridleifsson, I.B., Watkins, N.D., 1980. Stratigraphyand paleomagnetism of the Esja, Eyrarfjall and Akrafjall Moun-tains, SW-Iceland. J. Geophys. 47, 31–42.
Lattard, D., Engelmann, R., Kontny, A., Sauerzapf, U., 2006. Curietemperatures of synthetic titanomagnetites in the Fe-Ti-O sys-tem: effects of composition, crystal chemistry and thermomagneticmethods. J. Geophys. Res. 111 (B12), doi:10.1029/2006JB004591.
Lowrie, W., 1990. Identification of ferromagnetic minerals in a rock bycoercivity and unblocking temperature properties. Geophys. Res.Lett. 17, 159–162.
Matzka, J., Krasa, D., Kunzmann, T., Schult, A., Petersen, N., 2003.Magnetic state of 10–40 Ma old ocean basalts and its implicationsfor natural remanent magnetization. Earth Planet. Sci. Lett. 206,541–553.
Meynadier, L., Valet, J.-P., Shackleton, N.J., 1995. Relative geomag-netic intensity during the last 4 m.y. from the equatorial Pacific.In: Proceedings of the Ocean Drilling Program, Scientific Results,vol. 138, pp. 779–795.
Moskowitz, B.M., Jackson, M., Kissel, C., 1998. Low-temperature
magnetic behavior of titanomagnetites. Earth Planet. Sci. Lett. 157,141–149.Murad, E., 1996. Magnetic properties of microcrystalline iron (III)oxides and related materials as reflected in their Mossbauer spectra.Phys. Chem. Miner. 23, 248–262.

nd Pla
M
O
O
O
O
P
P
P
P
R
C. Vahle et al. / Physics of the Earth a
uxworthy, A.R., McClelland, E., 2000. Review of the low-temperature magnetic properties of magnetite from a rock magneticperspective. Geophys. J. Int. 140, 101–114.
’Reilly, W., 1983. The identification of titanomaghemites: modelmechanisms for the maghemitization and inversion processes andtheir magnetic consequences. Phys. Earth Planet. Interiors 31,65–76.
¨ zdemir, O., Dunlop, D.J., 1997. Effect of crystal defects and inter-nal stresses on the domain structure and magnetic properties ofmagnetite. J. Geophys. Res. 102, 20211–20224.
¨ zdemir, O., Dunlop, D.J., 1998. Single-domain-like behavior in a 3-mm natural single crystal of magnetite. J. Geophys. Res. 103(B2),2549–2562.
¨ zdemir, O., Dunlop, D.J., Moskowitz, B.M., 1993. The effect of oxi-dation on the Verwey transition in magnetite. Geophys. Res. Lett.20, 1671–1674.
etersen, N., Vali, H., 1987. Observation of shrinkage cracks in oceanfloor titanomagnetites. Phys. Earth Planet. Interiors 46, 197–205.
etrovsky, E., Kapicka, A., 2005. Comments on “The use of fielddependence of magnetic susceptibility for monitoring variationsin titanomagnetite composition - a case study on basanites fromthe Vogelsberg 1996 drillhole, Germany” by de Wall and Nano.In: Stud. Geophys. Geodaetica. 48, 767–776. Stud. Geophys. Geo-daetica, 49, 255–258.
ouchon, J.L., Pichoir, F., 1984. A new model for quantitative X-raymicroanalysis. Part I. Application to the analysis of homogeneoussamples. La Recherche Aerospatiale 3, 167–192.
urucker, M., Ravat, D., Frey, H., Voorhies, C., Sabaka, T., Acuna,M.H., 2000. An altitude-normalized magnetic map of Mars and itsinterpretation. Geophys. Res. Lett. 27, 2449–2452.
hodes, J.M., Vollinger, M.J., 2004. Composition of basaltic lavassampled by phase-2 of the Hawaiian Scientific Drilling Project:
netary Interiors 164 (2007) 119–141 141
geochemical stratigraphy and magma types. Geochem. Geophys.Geosyst. 5, Q03G13, doi:10.1029/2002GC000434.
Smith, P.J., 1967. The intensity of the Tertiary geomagnetic field.Geophys. J. R. Astronom. Soc. 12, 239–258.
Steinthorsson, S., Sigvaldason, G.E., 1971. Skyrsla um bergfrædi-rannsoknir vid Stardal. Report. Science Institute, University ofIceland.
Steinthorsson, S., Helgason, O., Madsen, M.B., Koch, C.B., Bentzon,M.D., Morup, S., 1992. Maghemite in Icelandic basalts. Mineral.Mag. 56, 185–199.
Stolper, E.M., Sherman, S., Garcia, M., Baker, M., Seaman, C.,2004. Glass in the submarine section of the HSDP2 drillcore, Hilo, Hawaii. Geochem. Geophys. Geosyst. 5, Q07G15,doi:10.1029/2003GC000553.
Vahle, C., 2005. Aufbau und Entwicklung des Vulkans Mauna Keaanhand von gesteinsmagnetischen und magneto-mineralogischenUntersuchungen an Kernen des “Hawaii Scientific DrillingProject” (HSDP-2). Inaugural-Dissertation zur Erlangung der Dok-torwurde, Naturwissenschaftlich-Mathematische Gesamtfakultat.Ruprecht-Karls-Universitat Heidelberg, p. 285.
Verwey, E.J.W., 1939. Electronic conduction of magnetite (Fe3O4) andits transition point at low temperatures. Nature 144, 327–328.
Wang, D., Van der Voo, R., Peacor, D.R., 2005. Why is the remanentmagnetic intensity of Cretaceous MORB so much higher than thatof mid to late Cenozoic MORB? Geosphere 1, 138–146.
Yamazaki, T., Oda, H., 2005. A geomagnetic paleointensity stackbetween 0.8 and 3. 0 Ma from equatorial Pacific sediment
cores. Geochem. Geophys. Geosyst. 6, Q11H20, doi:10.1029/2005BC001001.Zhou, W., Van der Voo, R., Peacor, D.R., Zhang, Y., 2000. Variable Ti-content and grain size of titanomagnetite as a function of coolingrate in very young MORB. Earth Planet. Sci. Lett. 179, 9–20.